Article

Key Determinants of Municipal Waste Sorting in Slovakia

Faculty of Business Economics with Seat in Košice, University of Economics in Bratislava, 04130 Košice, Slovakia
*
Author to whom correspondence should be addressed.
Sustainability 2021, 13(24), 13723; https://doi.org/10.3390/su132413723
Submission received: 3 November 2021 / Revised: 4 December 2021 / Accepted: 4 December 2021 / Published: 13 December 2021
(This article belongs to the Special Issue Ecological Transition and Circular Economy)

Abstract

:
The Slovak Republic does not meet the targets of the waste economy in the long run. In order to meet these objectives, it is necessary to make changes to the current system of municipal waste management. Building on an empirical analysis, this paper focuses on the evaluation of the production of municipal waste and the factors that influence the level of municipal waste sorting as a prerequisite for the maximal re-use, recovery, or recycling of municipal waste. The type of fee for municipal waste was confirmed as the most significant factor for the higher rate of municipal waste sorting, and pertinent recommendations were suggested according to the needs of Slovak municipalities.

1. Introduction

The highest priority of the sophisticated waste economy is to prevent waste generation [1]. The binding waste management hierarchy is the cornerstone of European policies and waste legislation. It is key for the transition to the circular economy. The basic goal of the waste management hierarchy is to minimize the adverse effects on the environment and increase, as well as optimize, the efficiency of waste management resources [2,3].
The European Commission (EC) adopted a European Union (EU) action plan for the circular economy in 2015. The circular economy (CE) considers waste as a usable resource. The banning prohibition increases the waste recovery rate. Countries with limited municipal landfills, as well as recyclable and reusable waste, have a higher rate of utilization and packaging of municipal waste [4]. The circular economy does not arise as an isolated European project because, in particular, Asian countries have applied this concept for several years. The importance of these changes also recognizes North America and some South American countries. Adoption of a circuit concept in most countries, or optimally worldwide, is a basic condition for the success of its application [5].
Analysis of waste separating for recycling in households is crucial, particularly at a global scale [6]. According to Eurostat data, 221,610 thousand tons of municipal waste (MW) were produced in 2018 in 27 EU countries [7]—i.e., 496 kg per capita. Compared to other EU countries, the production of MW in Slovakia is relatively low. In fact, the production of MW per capita in Slovakia is lower than the EU’s average.
According to the Report on the State of the Environment of the Slovak Republic, over 13,478 million tons of waste was produced in Slovakia in 2018. Almost 2325 million tons of this amount was made up of municipal waste, which means 427 kg of MW per capita. The total amount of MW, as well as the MW per capita, has mainly, in the last several years, had the tendency to annually grow [8,9]—especially during the period from 2013–2018 where this amount increased at an annual average of 5.24%.
The Slovak Republic has set objectives in the area of waste management based on the objectives adopted by the EU [2]. One of these goals was to achieve a 50% recycling rate of municipal waste by 2020 [10]. In 2018, the EC sent a warning note, wherein the EC perceived a risk that in Slovakia in 2020 the re-use/recycling rate of MW would not increase to 50% [11]. However, we can already know that the given objective was not fulfilled since the rate of recycling in 2020 was 43.67% [9].
The actual objective of the Slovak Republic by 2025 is to increase the rate of separated MW to 60% and the rate of preparation for reuse and recycling of MW to 55%. To achieve this goal, it is necessary to increase the level of separation of recyclable parts of MW. Since collected and sorted MW constituents are not fully recyclable, targets for sorted MW collections exceed the recycling objective itself. The targets for the sorted collection rate were increasing gradually from 20% in 2016 to 65% in 2020, with 60% as the target for the recycling rate in 2025 [10,12].
The EU considers the area of MW management very important. The European Parliament approved ambitious objectives in April 2018, namely that by 2025 the rate of municipal waste recycling would increase to 55% and then to 65% by 2035. Another ambitious goal is to achieve that, by the year 2035, more than 10% of waste does not end up in landfills [13].
In order to meet these objectives, it is necessary to make changes to the current system of MW management in individual cities, boroughs, and villages in Slovakia (as there has, for a long time, been a high proportion of landfilled total waste). It is striking that, despite this fact, in 2017 more than 61% of MW in Slovakia was landfilled (5% year-to-year decrease). The EU average amount of landfilled waste is below 25%, and is gradually decreasing. The aim of the Slovak Republic is therefore to reduce the amount of waste disposal in such a way, and thus achieve a gradual transition to more appropriate forms of MW management. In 2017, 29% of the total processed MW, including composting, was recycled in Slovakia [14,15].
Waste recycling is largely affected by policy, recycling program and social norm variables as they influence incentives and intentions for recycling.
The level of waste recycling is largely influenced by the policy and objectives of recycling and social standards because these initiate incentives and recycling efforts [16,17]. Some of the important success factors in implementing preventive measures for municipal waste production and increasing municipal waste recycling rates are the attitudes of the residents on the issues of municipal waste management, the perception of the consequences of environmental contamination, and the legislative measures [18].
Waste segregation at the source (i.e., at the household level) plays a very important role in effectively managing municipal waste [19]. There are various research findings about the influence of incentives to increase the ratio of separated parts of MW. For example, the positive impact of motivation factors were documented by studies in the Czech Republic [20,21], as well as other countries [22]. Research in Italy has shown that the motivation of individuals does not correlate with an increase in behavior that affects the proportion of a recyclable part of MW, while the behavior responsible for minimizing the quantity of the MW depends only on the internal conviction [23,24]. The more knowledge citizens have about the impact of MW on the environment and, at the same time, believing in the meaning of the measures in increasing recycling rates, the more they are willing to cooperate and sort waste [25,26]. Of course, ultimately, for recycling and overall waste management, a multidimensional approach is decisive when in addition to the motivation of citizens, as well as when legislative, financial, and logistical aspects are considered [27,28]. The use of waste gases and waste within the circular economy can also contribute to the matter [29]. Several studies were concerned at the influence of the mean, and the size of the individual expenses, related to the MW production and its management (for example [17,30,31]). The study by [32] analyzed the choice of the method for calculating charges for waste disposal and discussed the consequences of the introduction of the different options—for example, according to the water consumption. The focus on finance, legislation, and information stems from traditional economic models based on rational choices, which assume that consumers make choices by calculating the costs and benefits to them in each situation, optimizing their own personal gains [33]. Study [34] proves the role of environmental awareness in waste sorting.
The linear economy must be changed to the functional CE. Successful initiatives in the field of CE reduce societal dependence on natural resources, and, at the same time, create a value for society. The portal of World Business Council for Sustainable Development estimates that worldwide there is a yet exploited potential for CE of $4.5 trillion [35].
In recent years, the EC adopted from member states several legislative proposals to support the transition from the linear model of production and consumption (“take-make-consume-throw away”) to a new model of CE—leading to the conclusion of the imaginary material flow. The aim is to prevent waste generation, emphasize eco-design, and reuse, amongst other similar measures. According to estimates, it could bring net savings of €600 billion, while reducing total year-old greenhouse gas emissions by 2–4%. The CE also has a positive impact in reducing unemployment in Europe—it is estimated to create 580,000 new waste processing jobs [36].
The EU Action Plan for CE was created by the EC as a tool to achieve the objectives of the Sustainable Development Agenda by 2020, and, in particular, focus on step no. 12 for “sustainable consumption and production”. It dealt with topics such as production, consumption, waste management (i.e., prevention, preparation for reuse, recycling, energy recovery, and disposal), market support with secondary raw materials, and others [37].
The above-mentioned aim was not fulfilled at last, but although recycling level in Slovakia is continuously low, and despite the growing volume of communal waste, a positive development was recorded in waste recycling [38]. Since the aims were known and measures for both the public and private sector, as well as the efforts of respective organizations for producer responsibility, were not fully successful, it is necessary to continuously try to improve the Slovak MW management system. In such, situation countries could strive to replicate “success stories” of high-income countries, but it must not be conducted without paying particular attention to the respective costs, required skills, education, and technical expertise [39], as well as without appropriate analyses and tests.

2. The Aim, Materials, and Methods

2.1. The Aim

Slovakia and its municipalities entering the route of purposefulness, efficiency, effectiveness, and sustainability in solid MW management are still relatively at the beginning, therefore different adequate analyses based on a sufficient amount of relevant data are necessary for the decision-making and determining of the assumptions and parameters for the MW management system. Scientific projects conducted by a university team aimed at the aspects of MW management in the Slovak Republic are the means for gaining useful systematic analytical information.
The aim of this article, as a partial output of the project started in 2018 in Slovakia, is to assess key determinants of MW management and to draft measures that would contribute to improvement in the area.

2.2. Specification of Research Areas and Research Methodology

Concerning the purposeful managing of waste management issues at rural and urban authorities, we expect that we obtained relevant information from the relevant respondents. In the analyses, we did not evaluate the data applicable in the population of Slovak citizens, only that within the population of municipal employees and municipal authorities competent in municipal waste, from which we obtained a sufficiently large representative sample of data. The representation of other citizens participating in our project is statistically unrepresentative, but within the project we were interested in more-or-less relatively significant differences in the compared groups. The results of the statistical tests, as well as conclusions of our experiences and the personal opinions of the professionals participating in the survey, were finally summarized as the recommendations in connection with the improvement of the situation in Slovak waste management.
Our main research hypothesis results from our experiences (for example [40,41,42,43,44]) in the studied area and from literature review (noted not only above in the introduction). We suppose that there exists one or more fac9tors influencing the ratio of the sorted MW in municipalities. The main research hypothesis was examined through the partial statistical hypotheses concerning particular examined areas using appropriate statistical tests. Statistically-confirmed results were fundamental for relevant suggestions for the legislative changes.
In the analysis of data from the questionnaire described below, we focused on a simplified illustrative classification of factors of the degree of sorting of municipal waste and its prediction of the level of sorting. For automatic determination of factors influencing the level of municipal waste sorting, or classification of data according to whether they belong to the particular level of MW classification, we used the method of classification (decision) tree. Then we used cluster analysis to assess the classification tendencies of the selected variables.
These targeted data analyses were preceded by a statistical verification of the properties of the questionnaire.

2.3. Source of Data

In order to assess key aspects of municipal waste management in the Slovak Republic, we conducted a systemic analysis from 2018–2019. For the analysis, we used the data collected through the questionnaire survey of citizens’ views for whom communal waste management issues are part of their responsibilities and labor powers. That is to say, we have systematically asked self-government staff or representatives of business waste management companies. These citizens were considered proper respondents given their knowledge of the relevant information from the area in question. At the same time, they should actively pay attention and consider the time of their workload in this matter. Their awareness should be largely based on knowledge, and not only on feelings, intuition, or random experiences. In the case of the creation decisions by these citizens, such decisions are verified in practice or at least tested, and the need for changes in the problem of these issues should be accompanied by previous experience, solutions, considerations, discussions, and team evaluations, and should be carried out by more responsible self-government officers.
Questions in the survey were focused on personal opinions, attitudes, the behavior of citizens, and, if the citizen was a representative of the municipal office (i.e., village/town/local in the city), the questionnaire was also extended with a part in which the respondent, no longer as a citizen but on behalf of the self-government, was asked for answers specifically regarding quantification issues on the state of municipal waste management.
In the first section, personal part respondents were asked to answer questions related to their place of residence (I.e., permanent or transient), where they pay municipal waste charges, and where they live during most of the year. If the respondent worked in a municipal office that was not the same municipality in which he lived, we gained information from one respondent about two different locations. If the respondent had an identical location of residence and workplace, we have gained a view of the citizen and officer, and we estimated that such citizens would show more frequent characteristics supporting waste management optimization as conventional citizens due to their conventional behavior with labor knowledge, responsibility, and purposefulness.
The general part of the survey form about the respondents and their residence data are used for stratifying responses and finding relevant relationships, and subsequently for finding improvement solutions—at least in the field of municipal waste sorting in Slovakia. In the questionnaire, above-mentioned factors of the condition and development of ecology and waste management were captured directly or indirectly. In the questionnaire, the questions made up several planes representing the environmental and waste management status, and whose responses could be evaluated alone, but they were also used as stratification variables—or as variables that assigned relevant weight to other variables—and they should have the roles of causality, effect, or bonds.
Due to the breadth of topics, we could not devote attention to each field extensively enough, so the accuracy and reliability of the questionnaire was measured particularly by a group of four questions—no. 9, 10, 11 and 12—adopted from a similar foreign survey [45]. These issues also confirmed the validity of the survey. Areas covered within the questions in the questionnaire are summarized in Table 1. In the article, we retain the questions with the numbering used in their original version. Not all questions from the survey have been used in this article.

2.4. Data File Characteristics

The questionnaire was distributed electronically using a form tool from Google. All towns/cities (in the case of Bratislava and Košice all urban parts) and villages in Slovakia (hereinafter referred to as the municipalities) with the available email addresses were addressed during several weeks—the total selection method was used. We requested municipalities to cooperate in acquiring information on the ways of MW management and sorting, and the further distribution of questionnaires.
Overall, in the first stage, following the pilot testing of the questionnaire, the 2927 unique e-mails on the mostly publicly available addresses of Slovak municipalities, cities, and urban parts (a few tens of addresses came from private sources of project team members) were used. The email addresses of two municipalities were not traceable.
We also distributed messages to the alternative email addresses of employees of the self-government who were called by phone when we found that the email was undeliverable to any known address, or when the email was deleted without reading and submitting responses about the municipality in the Google form table. In the second stage, we again sent emails to the addresses of the offices from which we did not receive the answers in an adequate time.
Thus, in the first May–June stage, we addressed all 2927 [46] offices (total number of municipalities without urban parts, including Bratislava and Košice as a whole: 2890, total number of urban parts: Bratislava (17), Košice (22), Total number of towns/cities: 140, total number of rural municipalities: 2750 (including 3 military circuits)) (Figure 1).
In the stage conducted during July, in which return rate was higher, we sent again 2438 requests to municipalities with functioning e-mail addresses (44 offices were not addressed due to non-working or unfindable e-mail address.
The specific Slovak population sample was a group of citizens and employees of the self-government, relevant by its quantity, who represented not only themselves but the office agenda of other citizens in the municipality, as well as executives of the municipality. This is why we can consider them as the indicator and the catalyzer for the municipal waste management, and particularly, the locality’s ecological state and development (Figure 2).
Another group of survey respondents consisted of randomly addressed citizens, although they were partly included from chain-addressing by other respondents. The randomly addressed citizens were used as a contrast to the target group since they were not professionally included in the MW issues. In this group, citizens were not working in the relevant positions, and given this, the group represented ordinary citizens without the responsibility for meeting the objectives and did not have the expected knowledge in the area of MW management. The intention of collecting data from this group of citizens was to obtain a control sample as well as awareness and feedback on the existing reality in the area of municipal waste management from the ordinary citizens’ circuit, given that they were not involved in the creation, securing, controlling, or recording of the municipal waste measures. In the analysis of this supplementary group of respondents, unlike the target group of municipal respondents, the conclusions must be presented prudently with regard to the possible shift of results due to the absence in randomness of selection of the respondents coming from the surroundings of the self-government staff, as well as readers of selected periodicals, general newspapers, and so on (Figure 3).
During the whole survey period, we had gained 1439 relevant responses from all respondents, but replays from the non-repeated localities of municipal representatives with the knowledge of municipal waste management were from 947 villages, towns/cities, which is a 32.23% proportion of all self-government offices of the municipalities. Two respondents from the self-government offices did not indicate the particular location of their office, along with some other demographic data.
Two cases were deleted from the database due to the identity of values with another two observations (except the observation time track that varied within several seconds). These dual observations could have been sent repeatedly and been double recorded in the result table due to an unstable internet connection of the respondents. From among the citizens, another response was further excluded since the respondent’s answers on open issues were empty or without meaning.
Respondents from the municipalities included in the survey multiple times were corrected by weights so in the analysis they were counted only once. If various answers for a respective municipality entered the analysis in different categories with the quantity expressed as a decimal number, this was rounded.

2.5. Characteristics of Data Set of Respondents Working at the Self-Government Office

Since we addressed all municipalities, we are not conducting a random sampling. Our municipalities samples are all authorities that expressed their willingness to participate in the questionnaire survey. Potential distortion we will verify by comparing some of the acquired information with known published statistical facts. By addressing all municipalities, we expected the representation of respondents to not be shifted with respect to the demographic data, which was confirmed by the comparison of the ratios of the counts of municipalities that participated in the survey with the actual distribution of the municipalities in the individual areas, regions, districts, and urban/rural locations (–4). The actual proportion of women versus men working in the relevant positions of self-government offices, as well as representations of other social characteristics, are not known, so we did not verify this detail.
In the case of an unbiased data sample, conclusions are estimated with the statistical error for estimating the proportion of the examined characteristics for the entire data file, which is maximally equal to 3.2% (Equation (2) according to the formula for determining the minimum size of the sample of respondents [47] (Equation (1), which we used when conducting the survey based on the random selection:
n = Z 2 p ( 1 p ) C 2
C = Z 2 p ( 1 p ) n = 1.96 2 0.5 ( 1 0.5 ) n   = ˙ 0.03185
where:
Z—statistical table value. For statistical significance equal to 95%, value Z equals to 1.96, for significance 99%, Z = 2.58;
n—sample size (population size is not taken into account);
p—proportion of the examined characteristic (if the proportion is not known then p is thus replaced with the value of the sample size without considering the population size 0.5, which leads to the highest sample size estimation;
C—acceptable error interval.
To ensure the basic representativeness of our sample, we verified the relative representation of the participating municipalities/districts/regions/counties/country, corresponding approximately to the actual proportional representation of all the municipalities in the relevant territorial units. In the case of comparing the relative proportions of municipalities in Western, Central and Eastern Slovakia, in reality and in our survey, the differences were +0.1, −1.9% and +1.8%, respectively (Table 2).
The representations of the municipalities in individual regions, in reality and in the survey, and the differences in representations are summarized in Table 3. The largest differences are lower in representation in the survey when compared to reality by −5.6% in the Prešov region and higher by 3.9% in the Košice region, which is negligible.
Verification of the representation of the urban or rural municipalities is summarized in Table 4. The differences in the representation of the urban and rural municipalities are maximally ±4.6%, whereby in the survey there is a slightly higher ratio of urban municipalities and a slightly lower representation of rural municipalities.
The representativeness of the sample of respondents among local self-government employees by gender, age, education, number of household members, and other characteristics has not been verified due to the unknown distribution in the population of local self-government employees, but we do not anticipate bias due to the availability of a sufficiently large research sample.

2.6. Survey Items (Questions)

The questionnaire consisted of a relatively large number of open, closed, and most often semi-closed questions, with the possibility of commenting or further specification of the answer. The questionnaire was branched and not all questions were displayed to each respondent. The answers to the questions on the questionnaire, and their analysis, should help in specifying the situation in the field of municipal waste management, the perception of environmental issues, waste sorting, and the proposals for optimizing waste management.
Although the sample of respondents among citizens not working at self-government offices is not representative, and we cannot apply all the conclusions of the survey automatically to all citizens, the sample size of the self-government staff and its representativeness, at least with respect to all self-government staff, allows us to apply the found results and statistically significant relationships, but also the individual opinions of the respondents, to expanding the knowledge base on which it will be possible to design a more efficient waste management system.
The items of the questionnaire cover 10 areas of interest, and studies and analyses are listed in Section 2.3. Most of the questions are for determining the attitudes, perceptions, and activities, which were conceived using a 6-point Likert scale. This allows us, if the sample size is sufficient, to more accurately determine the intensity of the perception, interest, severity, and relationships of the question. Questions with a Likert scale were also used to analyze the properties of the questionnaire. In case of an insufficient representation of answers at the individual levels of the scale, we can combine these into a smaller number of levels. In order to clarify the content of more complex questions, we left open the possibility of specifying the answer. The six-point scale remained in use. As such, additionally specified answers were attached to the basic scale with the possibility for additional consideration in the discussion on the analysis of the questionnaire.

2.7. Statistical Tools Used in Data Analyses

In the analyses of the questionnaire data, the statistical tools summarized below are used using the software MS Excel [48], IBM SPSS Statistics [49], or Gretl [50]. The analyses’ quantitative conclusions are based on statistically verified results using methods briefly characterized below.

2.8. Significance Level

The significance level is an estimated likelihood for rejection of a null hypothesis, assuming it was right (probability of error of the first type), and to determine it each time before calculating the test criterion (i.e., before the test). The p-value is the lowest possible level of significance, designed based on the test criterion, where we can also reject the null hypothesis. It is one of the options for which we decide whether the result is statistically significant. In our analyses, we consider it a statistically significant result when the p-value ≤ 0.05.

2.9. Factor Analysis in Assessing the Validity of the Questionnaire

Validity is an important indicator of the questionnaire’s quality as a measurement tool. The degree of validity indicates how the test/questionnaire measures the concept (i.e., phenomenon or construct) on which the questionnaire is focused. There are more types of validity and more methods of its destination. The statistical test of the questionnaire is a factor analysis that identifies those that are related to each other between multiple variables. Analyzing those that are closely linked to the so-called factors thereby reduces the number of variables to a smaller number of factors and confirms the eligibility of the measuring tool.

2.10. Questionnaire Reliability Analysis

The reliability index evaluates the accuracy of such measurements. If measuring tools are not valid and reliable, there is an incorrect interpretation of the phenomena and the application of incorrectly-related decisions. A reliable measuring tool provides the same results by repeating the evaluation.

2.11. Decision Trees

Decision trees are used for classification or prediction of categorical or continuous values. They are most commonly used as a non-parametric and non-linear alternative to a linear model. They are not affected by extreme or missing values. For analysis of relations between target and input variables, we used a method of a full chi-square automatic interactive detection, or so-called Exhaustive CHAID (Chi-Square Automatic Interaction Detector) that identifies the file’s explanatory variables to classify/predict the target variable.
A CHAID Classification tree divides a tree node only if the statistical significance criterion is met. CHAID tries to prevent this from the beginning of the so-called overfitting.
In our work, we will use the decision tree to specify (i.e., predict) the level of sorting of the municipal waste based on the relevant input variables.

2.12. Cluster Analysis

Cluster Analysis was used for searching in the empirical data and grouping similar objects–types [51]. We used it to find characters for generating object classification assumptions. In the paper, a two-step cluster was used by IBM SPSS software that automates and solves some problems of standard cluster techniques.
By means of the cluster method, we specify the characteristic clusters for the municipal waste sorting levels corresponding to the individual levels of the considered input variables.

3. Results

3.1. Verification of the Properties of the Questionnaire

One of the fundamental conditions for the questionnaire’s research is the use of valid and reliable research instruments. By determining the questionnaire’s validity, we verify whether the questionnaire measures what we intended to detect. The instrument validation is important when the respondents provide, in essence, inaccurate, subjective, or opinion-based characteristics. In addition to the confirmation of the construct validity (i.e., measurement of a certain feature of a man) questionnaire in its further processing, it is then possible to replace multiple variables by one factor representing the construct examined.
Several variables are substitutable by one latent variable, a factor, and arise if we determine the characteristics of the respondents, their attitudes, tendencies, and other features. It is not sufficient to ask the relevant specificity directly with a single question because the respondent may either unconsciously or consciously distort the reality of the assessment for that feature under investigation. For example, a respondent may state the subjectively or objectively desired state of affairs, while even to himself/herself may not admit the fact. Several more specifically focused questions related to the examined characteristics forming the so-called manifest variables can more reliably characterize the respondent, concerning the examined feature, than only his own answer could. The more the questions are aimed at identifying the investigated feature, the more objective the resulting findings are in terms of the concomitant treatment of the counterproductive redundancy of the number of questions. Statistical methods, and other ways of assessing the properties of the questionnaire as a measuring tool in its preliminary verification or its subsequent evaluation, help in deciding on the appropriateness of including the question in the structure of the measuring tool and form a picture of the extent to which the examined property manifests itself in the respondent.
In our research, the area for determining the respondents’ environmental orientation was more closely represented by the questions, which was also the subject of the assessment of validity and reliability, and for which we singled out four questions taken from similarly focused foreign research [45]. Our questionnaire was based on the objectives of a large project covering a wide area and mapping the issues of municipal waste management from the perspective of citizens and municipalities (see Section 2.3). Given this, it was not possible to include enough questions for each area to create a comprehensive, statistically valid, and reliable questionnaire without negatively influencing perceptions and some of the respondents not completing the questionnaire. Therefore, other areas were not confirmed by multiple inquiries, which could lead to incorrect categorization/evaluation of the respondent in individual cases. However, due to the purpose of the questionnaire, which was not to evaluate individual respondents or individual municipalities, the lower overall variability is sufficient. As a priority, we focused on obtaining answers to a greater number of questions, which enabled us to cover and analyze more areas with regard to the state of municipal waste management in the Slovak Republic.

3.1.1. Validity of the Research Instrument

In this article, we will not use the FA analysis results with any other examination or modeling, and only for the purpose of confirming the questionnaire’s validity.
The validity of the questionnaire and its reliability were analyzed in a pre-survey among students with the expected results being similar to the survey in the target group of respondents. There was agreement of a significant result in defining the factors for the questionnaire, which focused on the environmental self-perception of the respondent.
The application of a factor analysis (FA) is indicated by the Kaiser-Meyer-Olkin (KMO) test statistics, which express the extent to which each variable can be predicted without errors through other variables, the definition of the unambiguous and reliable factors in our case that represent the investigated areas (i.e., constructs and factors) of the environmental profile of respondents, and with a recommended minimum test statistic value of 0.6. The higher the value of the KMO statistics, the more reliable the individual factors that are defined. The significance of the Barlett sphericity test confirms the existence of interrelationships between variables, which also justifies the use of a factor analysis [52] (Table 5).
For the implementation of an FA, the minimum number of observations is 10 per variable, which in our survey of respondents included in the factor analysis is 1260. This far exceeds the minimum number, even after subtracting those who, in one of the analyzed variables in the open part of the answer, stated “I do not know”; “?”; or left an empty value or answer that could not be included in any of the offered categories.
For the FA, the principal components method was used to define the factors (Principal Component Analysis—PCA), and for better interpretability of factors Varimax orthogonal rotation for uncorrelated factors was used.
Initial communalities (i.e., the number of extracted factors) was defined by the number of eigenvalues from the analysis—the so-called eigenvalues were greater than 1. These values represent the extracted factors involved in explaining the variability of the original variables in order from the factor with the largest proportion of variability to the extracted factor with the lowest increment of the proportion of the explained variability (Table 6).
The cumulative proportion of the variability of the 15 questions examined by the part of the questionnaire (Table 6), which can be explained by the defined factors, adds up to only 50% due to the above-mentioned lack of room for the inclusion of additional variables representing individual factors and many original unrelated variables (Table 7).
The number of extracted factors was defined by the number of eigenvalues from the analysis, which were greater than 1. These values represent the extracted factors involved in explaining the variability of the original variables in order from the factor with the largest proportion of variability to the extracted factor with the lowest increment of the proportion of variability.
In (Table 7), there are the squares of multiple correlations for individual variables with all other variables. In the case of the PCA method, all are equal to 1, as the variables are standardized with a variance of 1. The extracted communities are parts of the variability (i.e., variance estimates) of the variables explained by all extracted factors. Small communality values mean that variables are not sufficiently explained by the extracted factors and should be excluded from the analysis if possible. The extracted communities in our case are acceptable, although values lower than 0.5 for two questions indicate that they do not correspond to the extracted factors as well as the other variables.
The cumulative proportion of the variability of the 15 items of the questionnaire, which can be explained by defined factors, adds up to only 50%, which is due to the above-mentioned insufficient space for inclusion of additional variables representing individual factors and many original unrelated (non-correlated) variables (Table 7). Graphically, this is the variance that is associated with each factor shown by a scree plot in Figure 4. Typically, the plot shows a distinct break between the steep slope of the large factors and the gradual trailing of the rest (the scree).
The extracted factors created dimensions/constructs, to which the individual variables after rotation were bound by the highest load, i.e., the so-called loadings, for the selected method of rotation. The values are both regression coefficients for the linear combination of the relevant factors explaining the manifest original variable, as well as correlations of the variables with the relevant factors. The factors form the highlighted row groups in the table with the highest numeric values in both the rows and the columns.
As can be seen, the variables from questions no. 9, 10, 11 and 12, representing the environmental self-perception of respondents included in the questionnaire based on other similar research to verify the validity and reliability of our questionnaire, as well as for comparison with the relevant research, [45] are bound by a high number indicating a high proportion of variability in the observed variable, which is explained by the extracted factor.
The best-covered latent variable (extracted factor) is a factor called “self-perception”, which correlates with questions 9 to 12 (the above-mentioned questions taken from the foreign survey [45]) and for which the proportion of variability explained by the extracted factors is calculated to be 0.682 to 0.857. In the rotated matrix of components (Table 8), these variables are correlated with a defined factor and a significant force of 0.721 to 0.857.
In the table of the rotated matrix of components, in the column of the factor of the environmental self-perception, we can see that the factor was linked to the variable in question number 7 from our questionnaire to determine the extent to which the respondent cares to minimize the amount of municipal waste produced. It is not related to any other factor and it is indeed a variable from the category of self-perception, and not from the category of proven behavior as originally defined. Given this, we left the question for analysis in a new group and can replace the five original variables from the questionnaire with a single new latent variable, called the respondent’s environmental “self-perception”.
The other second most important extracted factor also has a relatively high load with the four original variables (questions no. 4, 13, 14, 22). Three of the questions are from category F on the classification, and specifically, question 4 asks about the quality of the environment in the city/municipality concerned. By identifying the common features of the variables, we decided to name the factor “The preconditions for sorting”, because most of the variables are dedicated to the sorting of municipal waste, namely: “Is separate collection organized in your municipality?”, “Are you motivated enough to sort waste?”, and “Are you involved in the separate collection of municipal waste?”. The correlation of the perception of the quality of the environment with the conditions for sorting is caused by the lack of other relevant questions about the quality of the environment, but there is also a clear connection, or vice versa, if the quality of the environment is taken into account in the municipality—of which it is assumed that measures will be introduced to support sorting.
The other two questions in the group “The preconditions for separate collection” are also weakly linked to another factor for known reasons. At the same time, however, the connection with another factor is justified, because many respondents stated that they do not need external motivation and that they sort out their own belief that it is right. Even the question, “whether people are involved in the separate collection of waste?”, is justified in the group of preconditions for sorting since knowing the answers of the respondents that are not involved is important. This is because they may only have a mixed waste container at the house, or only a certain type of sorted waste is collected, or waste collection takes longer time intervals, between which the containers are filled in such a way that they no longer fit into them, and sorting is thus prevented.
The third factor to be extracted will be the matters of interest for the future, from Group A. Although the second question on purchasing energy-efficient appliances was theoretically categorized in group B (real demonstration of interest in environmental sustainability) when designing the questionnaire, the FA revealed that it has to do with a focus on the future when we know that input costs of more energy-intensive equipment are higher, and therefore, such products are uninteresting for people who do not calculate with the future in mind.
Question no. 21 in the group about the perception of the fee includes a variant of the answer that the fee could be higher in order to solve as many waste problems as possible, resp. that it is insufficient. These insufficient fee responses are on the opposite side of the scale, i.e., dissatisfaction with the high fee was in positions 1 and 2, and complete dissatisfaction with the amount, in the sense that it is insufficient, is at 5 and 6. The question, therefore, follows the factor with a negative coefficient, i.e., those who are interested in the future also advocate the need for a higher fee and at the same time have an overview of the fee (question no. 18). In this group, too, the questions are linked to other factors that are more or less interpretable.
The last extracted factor is related to the financial burden of the respondent, which can be avoided. The strong correlation of questions 3 and 26 with the financial burden factor explains the connection between the answers, and that when the respondent is aware that it is possible to obtain a fine for acting in violation of the municipality’s regulation, he prefers to avoid it, and similarly, repairs a repairable product not to save the environment, but because the FA suggests that it is to save money—since a repair, especially with one’s own hands, is more financially advantageous than buying a new product.
The last three factors, mainly due to the weak explanation of the percentage variability of the original variables and the multiple links of the questions to several factors, will not be applied to the analyses but will remain with the original assumption and proof that only the environmental self-perception factor is sufficiently valid and usable.
Next we also verify the reliability of the defined factor/construct/new latent variable.

3.1.2. Reliability of a Research Tool

A good research tool is not a mixture of different items; on the contrary, the items are designed to detect the same construct/property. In this case, the research tool then has a good internal consistency. Cronbach’s Alpha is used to detect it in polytomy items with a larger scoring range (in our case 1 to 6). It is this coefficient that is used in questionnaires where the items are scaled (all items in the questionnaire have scales of the same value and length) [53]. We used IBM SPSS Statistics software to calculate it.
We evaluated the reliability of the questionnaire with variables identical to those we applied in the factor analysis (see the list in Table 8). The expected result with lower reliability in the inclusion of all questions due to a larger number of inconsistent constructs is shown in Table 9. The value of Cronbach’s Alpha is greater than 0.7, which is in line with the recommendation for the value of Cronbach’s Alpha evaluated in the social and economic sciences [54]. In the pre-survey, the same questionnaire answered by students similarly showed the reliability of the 15 components of the several inconsistent constructs at the level of 0.779.
Due to further analysis, we can use a valid dimension named “Environmental self-perception”, which will also evaluate its internal consistency separately (Table 9). The five-component construct provides a quantified reliability greater than 0.831 (the student pre-survey had a higher reliability of 0.858). 119 respondents participated in the student survey, of which 96 fully completed answers were valid for the 15-component construct and 97 for the 5-component construct.
In conclusion, the analysis of the data representativeness, and the structure and reliability of the questionnaire confirms more than 30% representation and geographical representativeness of the target group of respondents—employees of the local authorities, the applicability of data from citizens outside the target group of respondents, and environmental self-perception verifying the non-randomness of the answers and, in turn, the entire questionnaire.

3.2. Data Analysis

The questionnaire represented a wide area of the municipal waste management issues related to the opinions, perceptions, declared behaviors, justifications, or recommendations that are accountable to all the respondents. The aim of the survey and its analysis was to evaluate the situation in Slovakia’s waste management through anonymous data from local government documents, but also through the attitudes and perceptions of the environmental and municipal waste issues by citizens with a focus on competent local government representatives as an influencing factor of the level of municipal waste management. Based on the part of the questionnaire survey conducted within local governments in Slovakia, using two classification methods, we present partial results and the recommendations that could contribute to the gradual reduction of waste disposal in landfills, allow more intensive sorting of waste, and their material recovery.

3.2.1. Classification of Explanatory Variables and Prediction of Classification Level

Based on the data of the questionnaire (with the verified validity and reliability on a selected part of the questions), the target dependent variable for the decision tree technique was set as the “Sorted municipal waste ratio to the total quantity per inhabitant”. For this variable, we would need to obtain the greatest possible value—the largest proportion of sorted waste. As the independent variables were used, all possible variables in the dataset were used as well. Missing values in this analysis were included in the tree-growing process as a floating category that was allowed to merge with other categories in the tree nodes. Together with the missing values, we processed 811 observations, which were randomly divided into test subgroups by the method of cross-validation [55] of the decision tree. The result of the cross-validation is an estimate of how well the tree generalizes the entire data population. The risk of our tree is, according to the cross-validation based on five subsets, calculating the average risk and the risk of resubstitution of 0.016 and 0.017, respectively, with a standard error of 0.001. For multiple comparisons, significance values for the merging and splitting of criteria are adjusted using the Bonferroni method.
The generated decision tree consists of seven nodes and five final leaves of the tree. It consists of three automatically created levels (Figure 5).
The root node consists of 100 % of all the values with the current value of the target variable at the level of 0.173 (17.3% level of sorting of municipal waste). The value should roughly correspond to the average proportion of the recyclable waste in Slovakia in 2017. The difference of 5.7% is caused by the aiming of the survey while conducting on and determining the factors for the higher rate of sorting that is not estimating the representative population’s parameter as it is stated at the end of the introduction part of the paper.
Several main classification/explanatory variables classifying/predicting the level of the ratio of the sorted waste in the total amount of municipal waste were identified and included in the decision tree model. In order to simplify and present more potential factors of the rate of sorting, we defined three intervals for maximally branching the continuous variables with a minimum node size of 70 observations, and on the level of the final nodes—the tree leaves—at least 35 observations.
The most important statistically significant factor of the MW sorting that was identified by the decision tree is the categorical variable: Type of paid fee for municipal waste. The decision tree technique thus split all the data into two branches, unbalanced by abundance (89% versus 11 %) but informatively relevant. This criterion distinguishes the data according to the type of paid fee for the data of the flat-rate fee and the data of the fee paid according to the MW amount. On the basis of the available data, the nodes are statistically significantly (p-value = 0.001; F = 10.234; df1 = 1, df2 = 809) characterizing or predicting the municipal waste sorting level of 16.8% in the case of a node with a flat-rate charging, and for the sorting joined with a fee for 1 L or 1 kg of waste at the higher sorting degree of 21.4%.
The first branch’s node in the current model is next broken down according to another binomial categorical variable, Character of residence locality, and again into another two branches (p-value = 0.006). The tree identified that the urban character of a municipality has less probability of a higher level of sorting than the smaller municipalities. Cities with the flat-rate fee, according to the model, are capable of sorting waste at the average level of 12.9% and rural villages at the average level of 17.3%.
The next significant factor that split node no. 3 into three automatically (set up to 10 intervals) created intervals. The most numerous group (530 respondents) for the production of MW per inhabitants was from 84.8 to 322.5 kg, who are not possible to be split to the next level, even with the manual settings. No other statistically significant subgroups can be created using selected factors. That big group remains similarly in the Cluster analysis the average group with the level of sorting 16.3%, which is slightly under the whole average level of sorting. However, there is a group (Node 5) with an annual municipal waste per inhabitant on a level under 84.8 kg, which consisted of rural municipalities with a population under 1000 where they can manage a higher rate of sorting compared with the average rate. At the opposite end, with the largest annual municipal waste per inhabitant (over 322.5 kg), we can conclude according to the additional data analysis that 81.7% of all respondents live in the economically strongest district of Slovakia, with the highest average charging for MW corresponding with the highest sorting level.
Other variables have not been specified as relevant by the decision tree with the given data set.

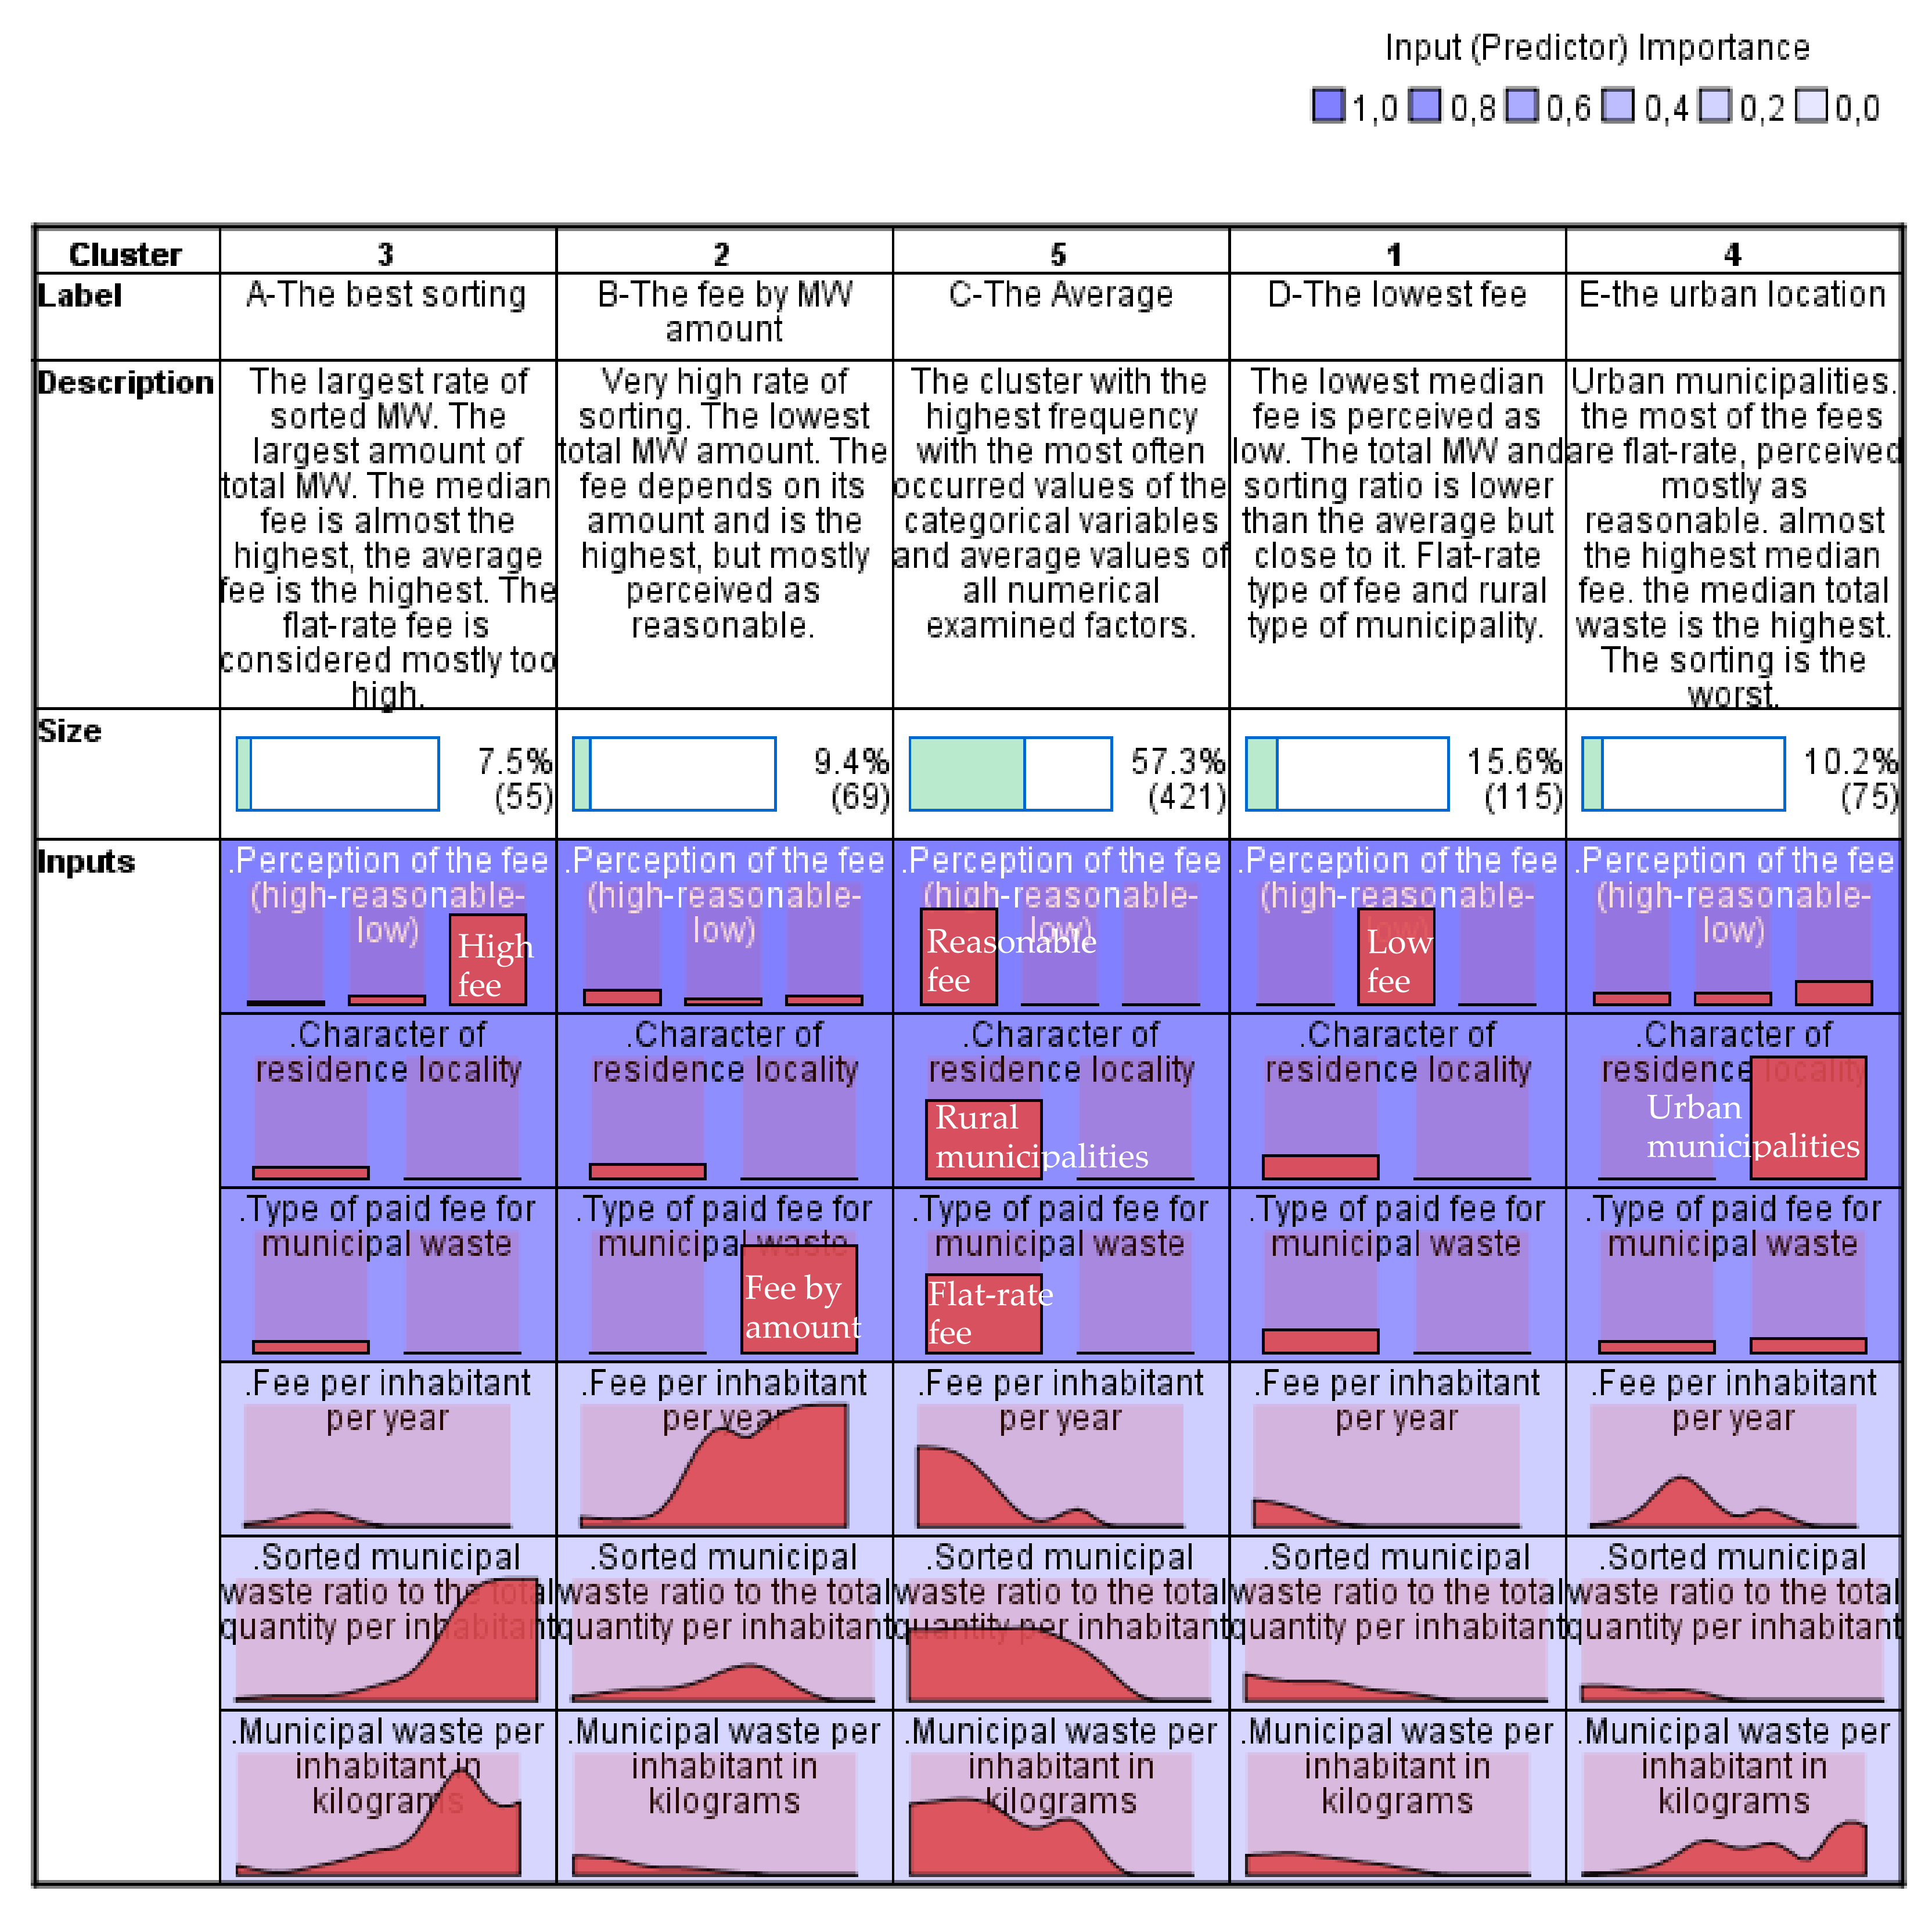
3.2.2. Clustering of Variables into Relatively Homogeneous Groups

The method by which we can identify the groups that are the most similar to each other within a cluster with the relevant properties, and at the same time differ from each other as much as possible, is through cluster analysis. The clusters thus identified (i.e., the municipalities with the relevant characteristics defined within them) can then be the object of the appropriately selected tools and procedures, in order to contribute to the optimization in the decision-making aimed at increasing the level of municipal waste sorting or minimizing the total amount of solid non-recyclable waste.
We used the IBM SPSS Statistics’ two-step clustering method to identify such groups, which combines the benefits of other clustering methods with both the categorical and continuous variables, and applies a hierarchical clustering algorithm to the larger amounts of data. We did not treat the missing data in the variables; respondents who did not provide data on the amounts of waste components produced were excluded from this analysis. About 5% of the extreme data were also excluded from the analysis so as not to affect the results in the clusters formed, or to form separate clusters. Thus, a total of 735 respondents from the local government representatives were included in the analysis who then provided the necessary data.
The results of the analysis are shown in Figure 6 with a good degree of consistency within the clusters versus a degree of difference between the clusters of 0.6. The result table in the fields graphically shows the relative distribution of data.
The clusters are arranged according to the waste sorting ratio from the highest sorting ratio to the lowest. Clusters are defined by three selected categorical variables and by three continuous variables of concern. Categorical variables with the highest degree of predictive importance in the classification of respondents into clusters from 77% to 100% are the Type of the fee, Character of residence locality, and Perception of the fee. The three continuous variables, and thus possess a lower predictor’s importance, are the Sorted municipal waste ratio to the total quantity per inhabitant, Annual municipal waste per inhabitant in kilograms, and the Fee per inhabitant per year for MW, which is paid by the respondents. Continuous variables were standardized as part of the application of the method.
The characteristics of the clusters are shown directly in the figure. We can state that the largest group is formed by cluster no. 5, called C. It is the third in the order according to the ratio of the sorted waste per citizen of the municipality. It groups 421 respondents from rural municipalities with the MW flat-rate fee. Compared to other respondents in other clusters, it has a low-to-average level of waste production and level of sorting, and a low-to-average fee (median of the annual fee for the MW per year per capita is €13.05), which is perceived by 100% of cluster’s respondents as appropriate. This is the most widespread example of smaller municipalities in particular, which are essentially minimally active. The minimum size of the fee (at the level of neighboring municipalities in the form of a flat-rate fee) does not irritate or motivate any to change either in the production of mixed municipal waste or a higher level of sorting. These are mainly municipalities with a lower standard of living, which is reflected in the lower waste production (median of total MW per capita—183.2 kg) as well as the lower level of waste sorting (median of sorted waste rate—15%).
The second-largest group of rural municipalities (115 respondents) with a flat-rate fee has a lower level of waste sorting, but also a lower level of MW production. This cluster is the one with the lowest fee. It is the cluster no. 1, called D. Even the respondents themselves (100% of the cluster) state that the fee is low. Objectively, the median of the MW fee is the lowest one—€11.94. The annual amount of the total MW per capita and the rate of sorted MW is lower than the average, but not the lowest. Precisely because of the perception of the low fee, the cluster is set aside separately, but to solve the optimization of waste management it is appropriate to assess and manage the situation in the same way as in cluster C.
Other clusters are relatively small (10.2%; 9.4%; 7.5% of the dataset). At the unfavorable end of the spectrum of the sorting level are cities (100% in cluster 5, named E) where the perception of the level of the flat fee is irrelevant, or in other words, there are all options represented, but numerically the fee is mostly perceived as reasonable (69.3% of cluster’s respondents). Cities are characterized by the lowest level of waste sorting (11 %) and the highest median level of total annual waste production per capita (276.54 kg/person/year), and by almost the highest median annual fee (€18.9) (arithmetical average €20.94, which is the highest among the clusters with the flat-rate fee).
A little smaller cluster, already with at least a higher proportion of sorted waste identified in cluster no. 4, is called B (17% of all respondents). Its characteristic feature is the type of fee being estimated by the amount of the produced unsorted MW applied in the rural municipalities. The median of the fee size is the highest one, as well as the unweighted informative arithmetic average. The high sorting rate is probably supported by that high fee. Controversially, most of the respondents don’t consider the fees as too high. About 84.1% of them marked their fee as reasonable. Finally, the highest fees led to the lowest amount in the median annual total waste per inhabitant (143.07 kg/person/year), which aimed at reducing the final paid fee through the higher degree of sorting. Sorted municipal waste (median of data is 17 % of the total MW) financially does not burden the waste producers, but rather the companies responsible for the collection, recovery, and recycling of municipal waste.
The highest proportion of the sorted MW out of all, even with a flat type fee (100%), has the smallest cluster, named A (Cluster 2—7.5% of all respondents). The annual flat-rate fee (€16.85) is higher than the overall median annual fee (€14.1), but not the highest one. More than half of respondents of the cluster (54.5%) deem that the fee is too high. Representatives of these rural municipalities in this cluster might constitute some of the richest municipalities because they possess the largest amount of total MW (median = 272.8 kg/person/year versus 191.4 kg/person/year of the whole dataset—similar to the amount in the urban municipalities). Fortunately, relatively tons of waste can be collected for the recycling—33% (still a low number, but the highest ratio among clusters). Thus, not the fee size alone can be responsible for the sorted MW ratio, but also the socio-economic situation of the inhabitants. This cluster is the only one with a mixed type of municipalities—given that 29.7% of them are from urban municipalities.

4. Discussion

As we can simplistically conclude, our decision tree analysis confirmed that the strongest determinant of the sorted MW rate is the financial factor represented by the variable, Type of paid fee for municipal waste (Type of fee). The type of paid fee determining its size, mainly the higher fee for MW paid for the weighted amount of the unsorted MW, is the way that can lead to minimizing the total waste and maximizing the ratio of the sorted recyclable or recoverable waste. Our results are in accordance with the statements of other studies, for example [56], where authors state that separation of solid waste is mostly done for a financial motive among households. Similarly to [57], we can also conclude that the urban and wealthier households, headed by older and more literate individuals, are more likely to use municipal waste collection arrangements.
We expected also that a motivation and positive attitude towards nature and the environment could increase the MW sorting level, but since we have not tested the individual measure of sorting, but rather the sorting level of a whole village/town, the pro-environmental status of the municipality representative was not recognized as relevant. Other studies, like [24,45], confirmed that, although the individuals have a positive attitude towards recycling, they have not been able to practice such positive behavior that could improve the quality of their natural environment and the MW sorting rate.
From 1 January 2010, Slovak towns and municipalities were obliged to introduce a sorted waste collection of four components of municipal waste: paper, plastics, glass, and metals [58]. Despite this measure regulated by the older Waste Act, the results of our survey point to the fact that 1.7% of respondents stated that separate municipal waste collection was not introduced in their municipality, even in 2018. This situation is also confirmed by the findings of the Slovak Statistical Office, according to which, in 2017, not all but only 99.48% of municipalities were participating in municipal waste recovering [15].
It is important to introduce the right motivation system in individual municipalities. Also, experience from the Czech Republic presents a large difference in the waste sorting between households and municipalities for which the PAYT (Pay-As-You-Throw) system is in place, as well as among those for which this system is not in place. In the municipalities and households that have the PAYT system in place, citizens sort more waste and produce less residual waste. Conversely, in municipalities and households where they do not have this system, citizens sort less, which confirms our survey analysis, as well as that of other publications—for example [17,30,31]. In Slovakia, by the Waste Act, collection of municipal waste by its amount has been introduced in many municipalities, as was allowed by § 81(10) of the Waste Act as amended [59,60]. They are also aware of the seriousness of municipal waste management in the Czech Republic, where the current Waste Act stipulates that from 2024 on, it is prohibited to landfill mixed municipal waste and recyclable and usable waste provided by implementing legislation, although the EU plans to ban landfilling in 2030.
It is important to respond to this promptly and to provide an efficient and capacity-friendly infrastructure for the treatment of landfill waste, which will attract potential investors and should be acceptable to both professionals and the public [4]. At the end of 2015, the Ministry of the Environment of the Slovak Republic warned that Slovakia would not meet the valid recycling target for 2020 i.e., 50% of municipal waste. In 2015, despite the Ministry’s efforts, only 14.9% of municipal waste was recycled. In the following years, we can observe only a slight improvement. On the basis of the assessment underlying the early warning, the Commission concludes that:
  • Separate collection of recyclable materials, including bio-waste, is not yet efficient;
  • There is a lack of economic incentives for households to sort waste;
  • Extended producer responsibility schemes in Slovakia do not fully cover the costs of separate collection, and;
  • More investment is needed in higher level waste hierarchy projects (such as recycling) that go beyond the treatment of residual waste.

Summary Recommendations Resulting from the Analysis of the Questionnaire Survey

Our analyses of the conclusions are based on the analyses performed, as well as the more-or-less subjective opinions of the local government representatives acquired during the the conducting of the survey. Based on the questionnaire survey and the results obtained, we propose the following recommendations, which, if applied, will help to increase interest in the sorting of municipal waste and reduce the production of mixed municipal waste:
  • To prefer the introduction of a collection by the amount of municipal waste and sorted components of municipal waste in municipalities and cities, or their parts;
  • Adjust the fee for the export of MW so that those who sort the municipal waste pay less or have other benefits from the sorting;
  • To improve the organization of waste management so that citizens have enough bags for the sorted components of municipal waste in family houses and enough containers next to the residential blocks. As well, ensure the regular collection of these sorted components to avoid overfilling of the collection containers;
  • To introduce municipal waste sorting in those cities and municipalities where this collection has not yet been introduced or has not been implemented effectively;
  • To apply restrictive measures following the valid regulations and legislation, in case of their violation by citizens not sorting their municipal waste (i.e., a warning, non-export of unsorted mixed municipal waste or contaminated sorted waste, as well as the application of fines if necessary);
  • To increase awareness and promotion among citizens about the importance of municipal waste sorting.

5. Conclusions

Based on the performed quantitative analyses, the following variables appear as significant factors of the level of municipal waste sorting in Slovak municipalities: 1. Type of paid fee (flat-rate charging versus charging by the amount of municipal waste), 2. Character of residence locality (urban or rural character of the seat of residence), and 3. Municipal waste per inhabitant. Together with the other analyzed variables (4. Perception of the fee, 5. Sorted municipal waste ratio, and 6. Fee per inhabitant), they confirm the municipality positions in MW sorting, and indicate the direction in which the municipalities should go. Since some of the factors are not influenceable by human decisions and actions, the others can be regulated directly or indirectly by governmental/municipal measures, as well as by motivational factors for human activities and their consequences.
Our research focused on the analysis and solutions supporting the fulfillment of the objectives of the EU and the Slovak Republic, regarding the reduction of landfill use for municipal waste and increasing the level of sorting and material recovery of municipal waste, which represents a variation of the current and still partial solution to global waste problems. However, for the sustainability of the state of the environment, it is necessary to ensure at the same time a reliable and stable solution for the sale and processing of sorted components.
The need to increase the ratio of sorting and recovery of municipal waste is indisputable. This can be achieved mainly by increased activity in the area of separate collection directly at the producers of the individual waste components. Despite clear environmental, economic, and social benefits, high-quality and efficient separate collection systems are still not widespread in Slovakia. For this reason, it is necessary to make changes that are in line with the objectives and legislation of the Slovak Republic and the European Union. The need for these changes, especially in the area of motivating citizens, also emerged from our survey.

Author Contributions

Both authors (M.S., M.Č.) has equally contributed to this publication. All authors have read and agreed to the published version of the manuscript.

Funding

The APC was funded by Lungo Mare, n. o., Slovakia.

Institutional Review Board Statement

Not applicable.

Informed Consent Statement

Not applicable. The research described in the article involved anonymous, confidential and protected records and data sets that exist in the public domains.

Data Availability Statement

Details of the data and how to request access are available from Michal Stričík at Department of Economics, Faculty of Business Economics with seat in Košice, University of Economics in Bratislava.

Acknowledgments

Authors would like to thank all survey participants that honestly contributed with their time, knowledge and willingness and to editors and reviewers for their valuable comments and suggestions, which significantly helped us to improve the paper.

Conflicts of Interest

The authors declare no conflict of interest.

References

  1. Hutner, P.; Thorenz, A.; Tuma, A. Waste prevention in communities: A comprehensive survey analyzing status quo, potentials, barriers and measures. J. Clean. Prod. 2017, 141, 837. [Google Scholar] [CrossRef]
  2. Iqbal, S.; Naz, T.; Abdul Sattar, M. Challenges and opportunities linked with waste management under global perspective: A mini review. J. Qual. Assur. Agric. Sci. 2021, 1, 9–13. Available online: https://doi.org/10.52862/jqaas.2021.1.1.2 (accessed on 15 November 2021).
  3. Circular Economy Package: Questions & Answers. 2015. Available online: https://ec.europa.eu/commission/presscorner/detail/en/MEMO_15_6204 (accessed on 2 September 2020).
  4. Kulhánková, P. Aktuální Otázky Oběhového Hospodářství se Zaměřením na Plasty. TVIP. 2018. Available online: http://www.odpadoveforum.cz/TVIP2018/prispevky/308.pdf (accessed on 9 December 2021).
  5. Horsák, Z. Oběhové Hospodářství v Praxi. TVIP. 2018. Available online: http://www.odpadoveforum.cz/TVIP2018/prispevky/301.pdf (accessed on 9 December 2021).
  6. Singh, N.; Lavina, A. Waste separation at household level. Indian J. Appl. Res. 2015, 1, 558. [Google Scholar]
  7. Municipal Waste by Waste Management Operations. Eurostat. Available online: https://appsso.eurostat.ec.europa.eu/nui/show.do?dataset=env_wasmun&lang=en (accessed on 2 December 2018).
  8. Ministerstvo životného prostredia Slovenskej republiky, Slovenská agentúra životného prostredia. Správa o Stave Životného Prostredia Slovenskej Republiky v Roku 2016; Ministerstvo životného prostredia Slovenskej republiky, Slovenská agentúra životného prostredia: Bratislava, Slovakia, 2018. [Google Scholar]
  9. Relative Indicators from the Area of Treatment with Municipal Waste. Available online: http://datacube.statistics.sk/#!/view/en/VBD_SK_WIN/zp3002rr/v_zp3002rr_00_00_00_en (accessed on 9 December 2021).
  10. Program Odpadového Hospodárstva SR na Roky 2016–2020. 2015. Available online: https://www.minzp.sk/files/sekcia-enviromentalneho-hodnotenia-riadenia/odpady-a-obaly/registre-a-zoznamy/poh-sr-2016-2020_vestnik.pdf (accessed on 9 December 2021).
  11. Európska Komisia. Správa Komisie o Vykonávaní Právnych Predpisov EÚ o Odpadoch. 2018. Available online: https://eur-lex.europa.eu/legal-content/SK/TXT/HTML/?uri=CELEX:52018DC0656&from=EN (accessed on 9 December 2021).
  12. Program Odpadového Hospodárstva SR na Roky 2021–2025. 2020. Available online: https://www.enviroportal.sk/sk/eia/detail/program-odpadoveho-hospodarstva-slovenskej-republiky-na-roky-2021-2025 (accessed on 9 December 2021).
  13. News European Parliament: Circular Economy: MEPs Back Plans to Boost Recycling and Cut Landfilling. 2015. Available online: https://www.europarl.europa.eu/news/en/press-room/20180227IPR98710/circular-economy-meps-back-plans-to-boost-recycling-and-cut-landfilling (accessed on 9 December 2021).
  14. Pobožná, M. Odpady v Slovenskej Republike, 2016; ŠÚ SR: Bratislava, Slovakia, 2017; ISBN 978-80-8121-581-0. [Google Scholar]
  15. Pobožná, M. Odpady v Slovenskej Republike, 2017; ŠÚ SR: Bratislava, Slovakia, 2018; ISBN 978-80-8121-648-0. [Google Scholar]
  16. Kannangara, M.; Dua, R.; Ahmadi, L.; Bensebaa, F. Modeling and prediction of regional municipal solid waste generation and diversion in Canada using machine learning approaches. Waste Manag. 2018, 74, 3. [Google Scholar] [CrossRef] [PubMed]
  17. Sidique, S.F.; Satish, V.J.; Lupi, F. Factors influencing the rate of recycling: An analysis of Minnesota counties. Resour. Conserv. Recycl. 2010, 54, 242–249. [Google Scholar] [CrossRef]
  18. Corsini, F.; Gusmerotti, N.M.; Tesla, F.; Iraldo, F. Exploring waste prevention behaviour through empirical research. Waste Manag. 2018, 79, 132. [Google Scholar] [CrossRef] [PubMed]
  19. Maskey, B. Determinants of Household Waste Segregation in Gorkha Municipality, Nepal. J. Sustain. Dev. 2018, 11. [Google Scholar] [CrossRef] [Green Version]
  20. Struk, M. Distance and incentives matter: The separation of recyclable municipal waste. Resour. Conserv. Recycl. 2017, 122, 155. [Google Scholar] [CrossRef]
  21. Slavik, J.; Pavel, J. Do the variable charges really increase the effectiveness and economy of waste management? A case study of the Czech Republic. Resour. Conserv. Recycl 2013, 70, 68. [Google Scholar] [CrossRef]
  22. Xiao, L.; Zhang, G.; Zhu, Y.; Lin, T. Promoting public participation in household waste management: A survey based method and case study in Xiamen city, China. J. Clean. Prod. 2017, 144, 313. [Google Scholar] [CrossRef]
  23. Gilli, M.; Nicolli, F.; Farinelli, P. Behavioural attitudes towards waste prevention and recycling. Ecol. Econ. 2018, 154, 294. [Google Scholar] [CrossRef]
  24. Cheng, K.W.; Osman, S.; Jusoh, Z.M.; Leby, J. The Determinants of Intention to Practise Solid Waste Segregation-at-Source among Selangor Households. Malays. J. Consum. Fam. Econ. 2020, 25, 67–90. Available online: https://www.researchgate.net/publication/346659098_The_Determinants_of_Intention_to_Practise_Solid_Waste_Segregation-at-Source_among_Selangor_Households (accessed on 9 December 2021).
  25. Junquera, B.; del Brío, J.Á.; Muñiz, M. Citizens’ attitude to reuse of municipal solid waste: A practical application. Resour. Conserv. Recycl. 2001, 33, 51–60. [Google Scholar] [CrossRef]
  26. Vidová, J. Households as an important part of the circular economy. Waste Forum 2019, 3, 178. [Google Scholar]
  27. Chang, N.B.; Pires, A.; Martinho, G. Empowering Systems Analysis for Solid Waste Management: Challenges, Trends, and Perspectives. Crit. Rev. Environ. Sci. Technol. 2011, 16, 1449. [Google Scholar] [CrossRef]
  28. Bing, X.; Bloemhof, J.M.; Ramos TR, P.; Barbosa-Povoa, A.P.; Wong, C.Y.; van der Vorst, J.G. Research challenges in municipal solid waste logistics management. Waste Manag. 2016, 48, 584. [Google Scholar] [CrossRef] [PubMed]
  29. El-Emam, R.S.; Ozcan, H.; Zamfirescu, C. Updates on promising thermochemical cycles for clean hydrogen production using nuclear energy. J. Clean. Prod. 2020, 262, 121424. [Google Scholar] [CrossRef]
  30. Šauer, P.; Pařízková, L.; Hadrabová, A. Charging systems for municipal solid waste: Experience from the Czech Republic. Waste Manag. 2008, 28, 2772–2777. Available online: https://doi.org/10.1016/j.wasman.2008.03.030 (accessed on 9 December 2021).
  31. Puig-Ventosa, I. Charging systems and PAYT experiences for waste management in Spain. Waste Manag. 2008, 28, 2767. [Google Scholar] [CrossRef]
  32. Ulfik, A.; Nowak, S. Determinants of Municipal Waste Management in Sustainable Development of Regions in Poland. Pol. J. Environ. Stud. 2014, 23, 1039–1044. Available online: http://www.pjoes.com/pdf-89280-23138?filename=Determinants%20of%20Municipal.pdf (accessed on 9 December 2021).
  33. Dai, Y.C.; Lin, Z.Y.; Li, C.J.; Xu, D.Y.; Huang, W.F.; Harder, M.K. Information strategy failure: Personal interaction success, in urban residential food waste segregation. J. Clean. Prod. 2016, 134, 298–309. Available online: https://doi.org/10.1016/j.jclepro.2015.12.104 (accessed on 9 December 2021).
  34. Cheng, K.W.; Osman, S.; Jusoh, Z.M.; Lau, J.L. Does Environmental Knowledge Moderate the Relationship between Household Determinants’ Intention to Practice Solid Waste Segregation-at-Source? A Conceptual Paper. In Proceedings of the International e-Conference on Green and Renewable Energy, Bintulu, Malaysia, 8–19 August 2020; pp. 93–104. Available online: http://psasir.upm.edu.my/id/eprint/83496/ (accessed on 9 December 2021).
  35. World Business Council for Sustainable Development. Circular Economy-Factor10; World Business Council for Sustainable Development: Geneva, Switzerland, 2020; Available online: https://www.wbcsd.org/Clusters/Circular-Economy-Factor10 (accessed on 15 May 2020).
  36. Dupáková, M. Obehové Hospodárstvo: Viac ako Recyklácia; Euractiv: Bratislava, Slovakia, 2016; Available online: https://euractiv.sk/section/veda-a-inovacie/linksdossier/obehove-hospodarstvo-viac-ako-recyklacia-000342/ (accessed on 9 December 2021).
  37. European Commision. Kruh sa Uzatvára–Akčný Plán EÚ pre Obehové Hospodárstvo. 2015. Available online: https://ec.europa.eu/transparency/regdoc/rep/1/2015/SK/1-2015-614-SKF1-1.PDF (accessed on 9 December 2021).
  38. Taušová, M.; Mihaliková, E.; Čulková, K.; Stehlíková, B.; Tauš, P.; Kudelas, D.; Štrba, Ľ. Recycling of Communal Waste: Current State and Future Potential for Sustainable Development in the EU. Sustainability 2019, 11, 2904. Available online: https://doi.org/10.3390/su11102904 (accessed on 9 December 2021).
  39. Zurbrügg, C.; Gfrerer, M.; Ashadi, H.; Brenner, W.; Küper, D. Determinants of sustainability in solid waste management–The Gianyar Waste Recovery Project in Indonesia. Waste Manag. 2012, 32, 2126. Available online: https://doi.org/10.1016/j.wasman.2012.01.011 (accessed on 9 December 2021).
  40. Čonková, M.; Stričík, M.; Bačová, M. Pohľad samospráv na vybrané otázky nakladania s komunálnym odpadom [Views of municipalities on selected municipal waste management issues]. Waste Forum 2018, 4, 544–559. Available online: http://www.wasteforum.cz/cisla/WF_4_2018.pdf#page=138 (accessed on 9 December 2021).
  41. Stričík, M.; Bačová, M.; Čonková, M. Large-volume collection of municipal waste. In Production Management and Business Development; CRC Press: London, UK, 2018; pp. 211–216. Available online: https://doi.org/10.1201/9780429468667 (accessed on 9 December 2021).
  42. Stričík, M.; Bačová, M.; Čonková, M.; Kršák, B. Udržateľné Nakladanie s Komunálnym Odpadom [Sustainable Municipal Waste Management]; Vysoká škola báňská-Technická Univerzita: Ostrava, Czech Republic, 2019; p. 304. [Google Scholar]
  43. Stričík, M.; Bačová, M.; Čonková, M. Motivation of citizens of the Slovak Republic to separate municipal waste. Waste Forum 2019, 4, 399–413. Available online: http://www.wasteforum.cz/cisla/WF_4_2019.pdf (accessed on 9 December 2021).
  44. Stričík, M.; Tkáčová, V. Dopad zo zavedenia žetónového systému nakladania s komunálnym odpadom vo vybraných obciach SR [Impact from introduction of a municipal waste management system in selected municipalities of the Slovak Republic]. In Odpady: Minimalizácia, Zhodnocovanie, a Zneškodňovanie; Wolters Kluwer SR: Bratislava, Slovakia, 2019; Volume 19, pp. 5–10. [Google Scholar]
  45. Moser, S.; Kleinhückelkotten, S. Good intents, but low impacts: Diverging importance of motivational and socioeconomic determinants explaining pro-environmental behavior, energy use, and carbon footprint. Environ. Behav. 2018, 50, 626–656. Available online: https://doi.org/10.1177/0013916517710685 (accessed on 9 December 2021).
  46. Obce, S.R. [Munincipalities of the Slovak Republic]. Available online: http://www.sodbtn.sk/obce/index_kraje.php/index_kraje.php (accessed on 15 May 2020).
  47. Trnka, A. Základné Štatistické Metódy Marketingového Výskumu; Trnava Fakulta Masmediálnej Komunikácie: Trnava, Slovakia, 2016; ISBN 978-80-8105-768-7. [Google Scholar]
  48. Microsoft Corporation. Microsoft Excel; Microsoft Corporation: Redmond, WA, USA, 2016. [Google Scholar]
  49. IBM SPSS Statistics for Windows, 20; IBM Corp.: Armonk, NY, USA, 2011.
  50. GRETL [Gnu Regression, Econometrics and Time-series Library]. Open-Source Software. 2018. Available online: http://gretl.sourceforge.net/#ack (accessed on 9 December 2021).
  51. What Is Cluster Analysis? Available online: https://www.displayr.com/what-is-cluster-analysis/ (accessed on 12 May 2020).
  52. KMO and Bartlett’s Test. Available online: https://www.ibm.com/support/knowledgecenter/SSLVMB_26.0.0/statistics_casestudies_project_ddita/spss/tutorials/fac_telco_kmo_01.html (accessed on 12 May 2020).
  53. Gavora, P.; Koldeová, L.; Dvorská, D.; Pekárová, J.; Moravčík, M. Elektronická Učebnica Pedagogického Výskumu; Univerzita Komenského: Bratislava, Slovakia, 2010; Available online: http://www.e-metodologia.fedu.uniba.sk/–80–223–2951–4 (accessed on 15 May 2020)ISBN 978–80–223–2951–4.
  54. Croasmun, J.T.; Ostrom, L. Using Likert-Type Scales in the Social Sciences. J. Adult Educ. 2011, 40, 19–22. [Google Scholar]
  55. Validation. Available online: https://www.ibm.com/support/knowledgecenter/SSLVMB_24.0.0/spss/tree/idh_idd_tree_validation.html#idh_idd_tree_validation (accessed on 15 May 2020).
  56. Banga, M. Household knowledge, attitudes and practices in solid waste segregation and recycling: The case of urban Kampala. Zamb. Soc. Sci. J. 2011, 2, 4. Available online: https://www.nswai.org/docs/Household%20Knowledge,%20Attitudes%20and%20Practices%20in%20Solid%20Waste%20Segregation%20and%20Recycling%20The%20Case%20of%20Urban%20Kampala.pdf (accessed on 9 December 2021).
  57. Kumara, A.S.; Pallegedara, A. Household waste disposal mechanisms in Sri Lanka: Nation-wide survey evidence for their trends and determinants. Waste Manag. 2020, 114, 62–71. Available online: https://doi.org/10.1016/j.wasman.2020.06.028 (accessed on 9 December 2021).
  58. Slovak Government. Act No. 409/2006 Amending the Waste Act No. 223/2001 Col. on Waste. Order of the Government of the Slovak Republic: Bratislava, Slovakia, 2006; Available online: https://www.slov-lex.sk/pravne-predpisy/SK/ZZ/2006/409/ (accessed on 19 October 2019).
  59. Slovak Government. Act No. 79/2015 Col. on Waste and on the Amendment of Certain Acts. Order of the Government of the Slovak Republic: Bratislava, Slovakia, 2015; Available online: https://www.slov-lex.sk/pravne-predpisy/SK/ZZ/2015/79/20211201 (accessed on 19 October 2019).
  60. Slovak Government. Act No. 329/2018 Col. on Waste Disposal Fees and on the Amendment of the Act no. 587/2004 on the Environmental Fund and on the Amendment of certain Acts. Order of the Government of the Slovak Republic: Bratislava, Slovakia, 2018; Available online: https://www.slov-lex.sk/pravne-predpisy/SK/ZZ/2018/329/20210315 (accessed on 19 October 2019).
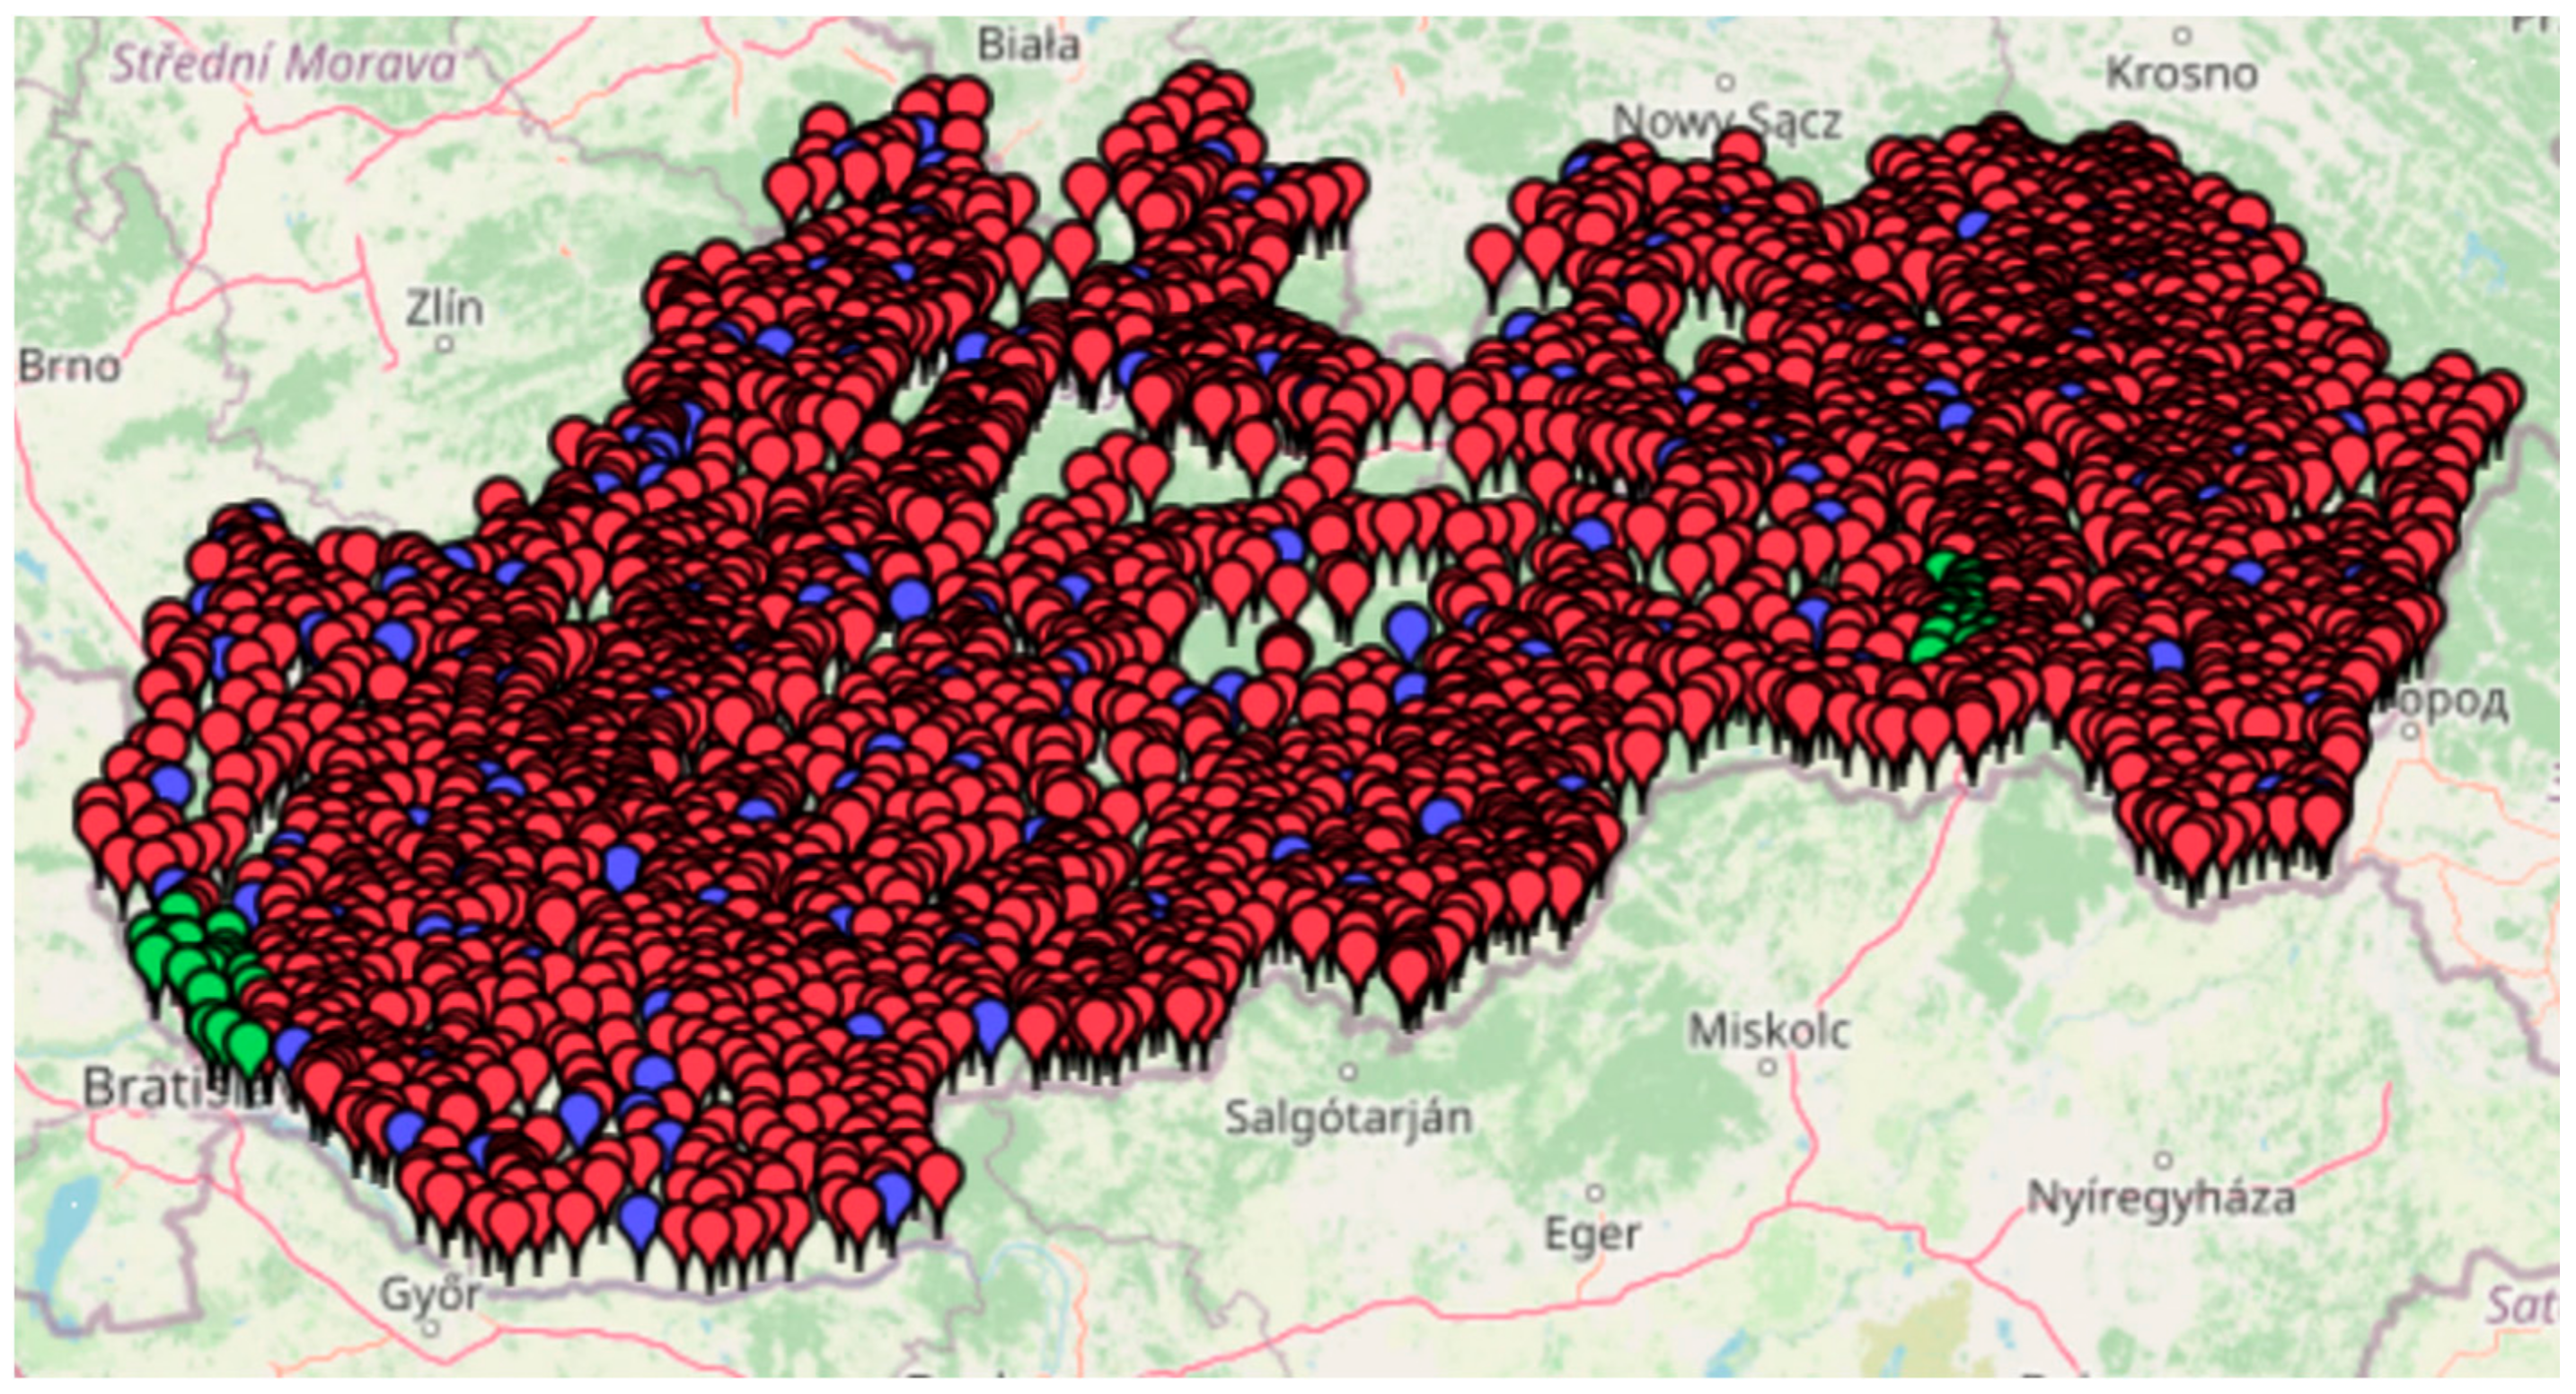
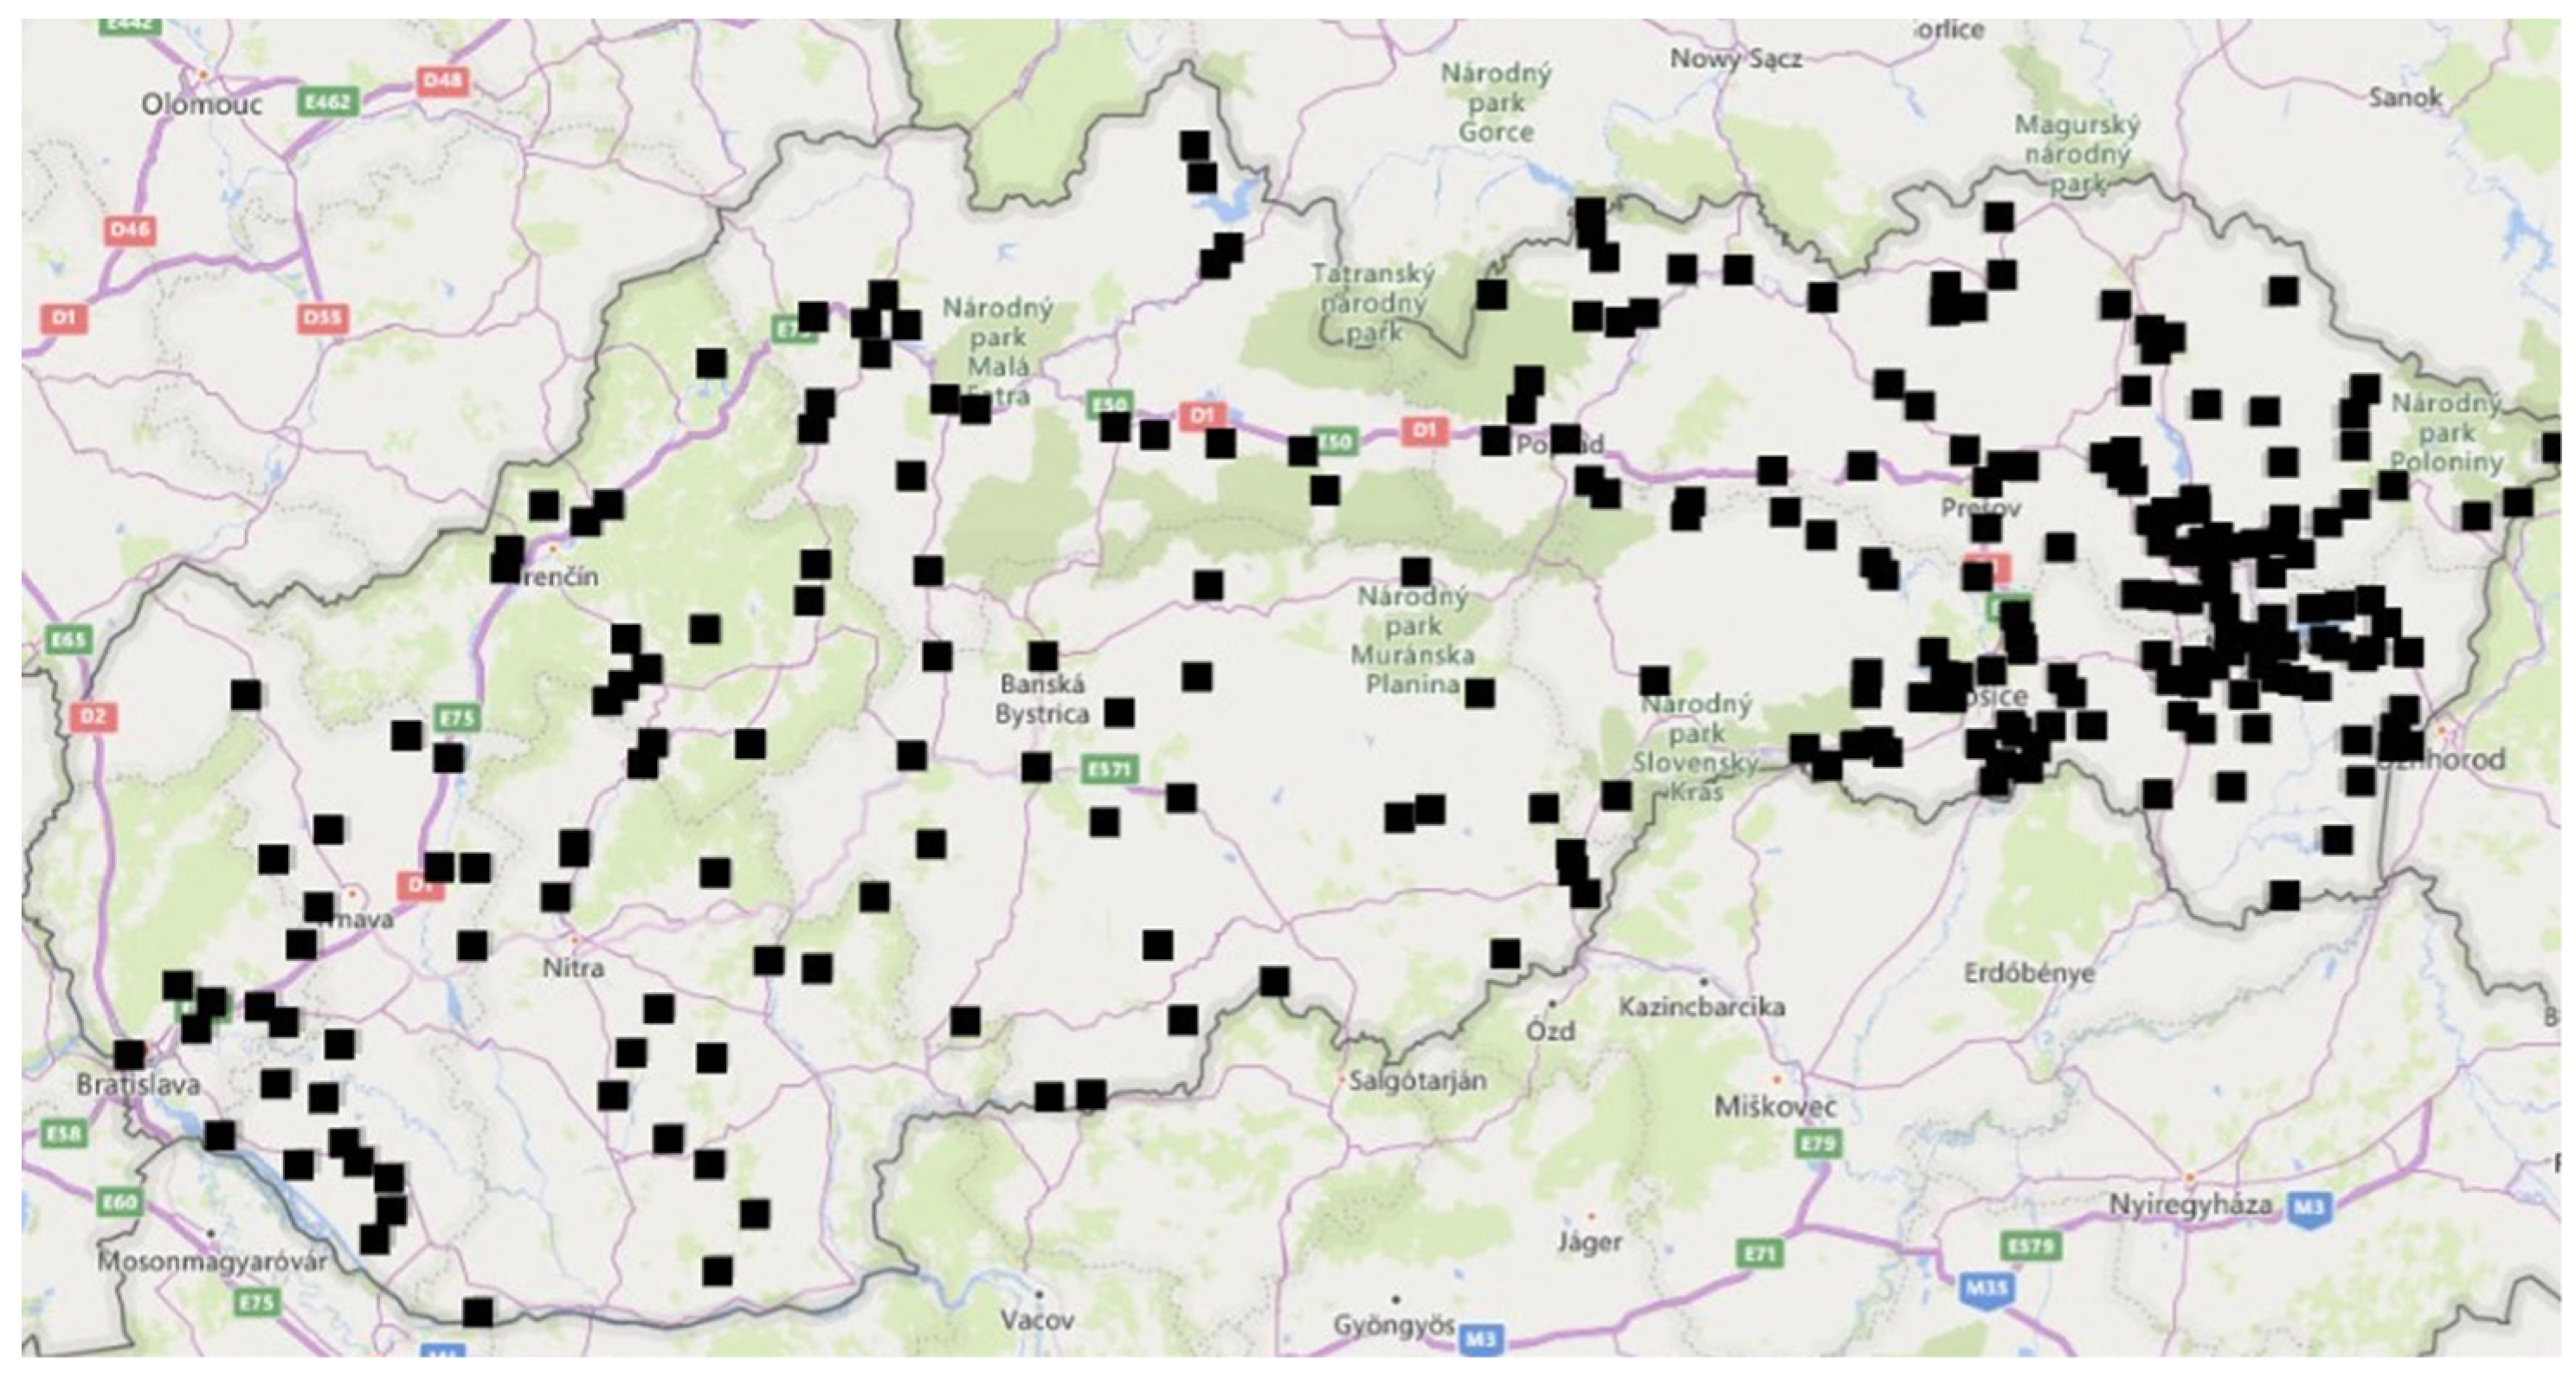
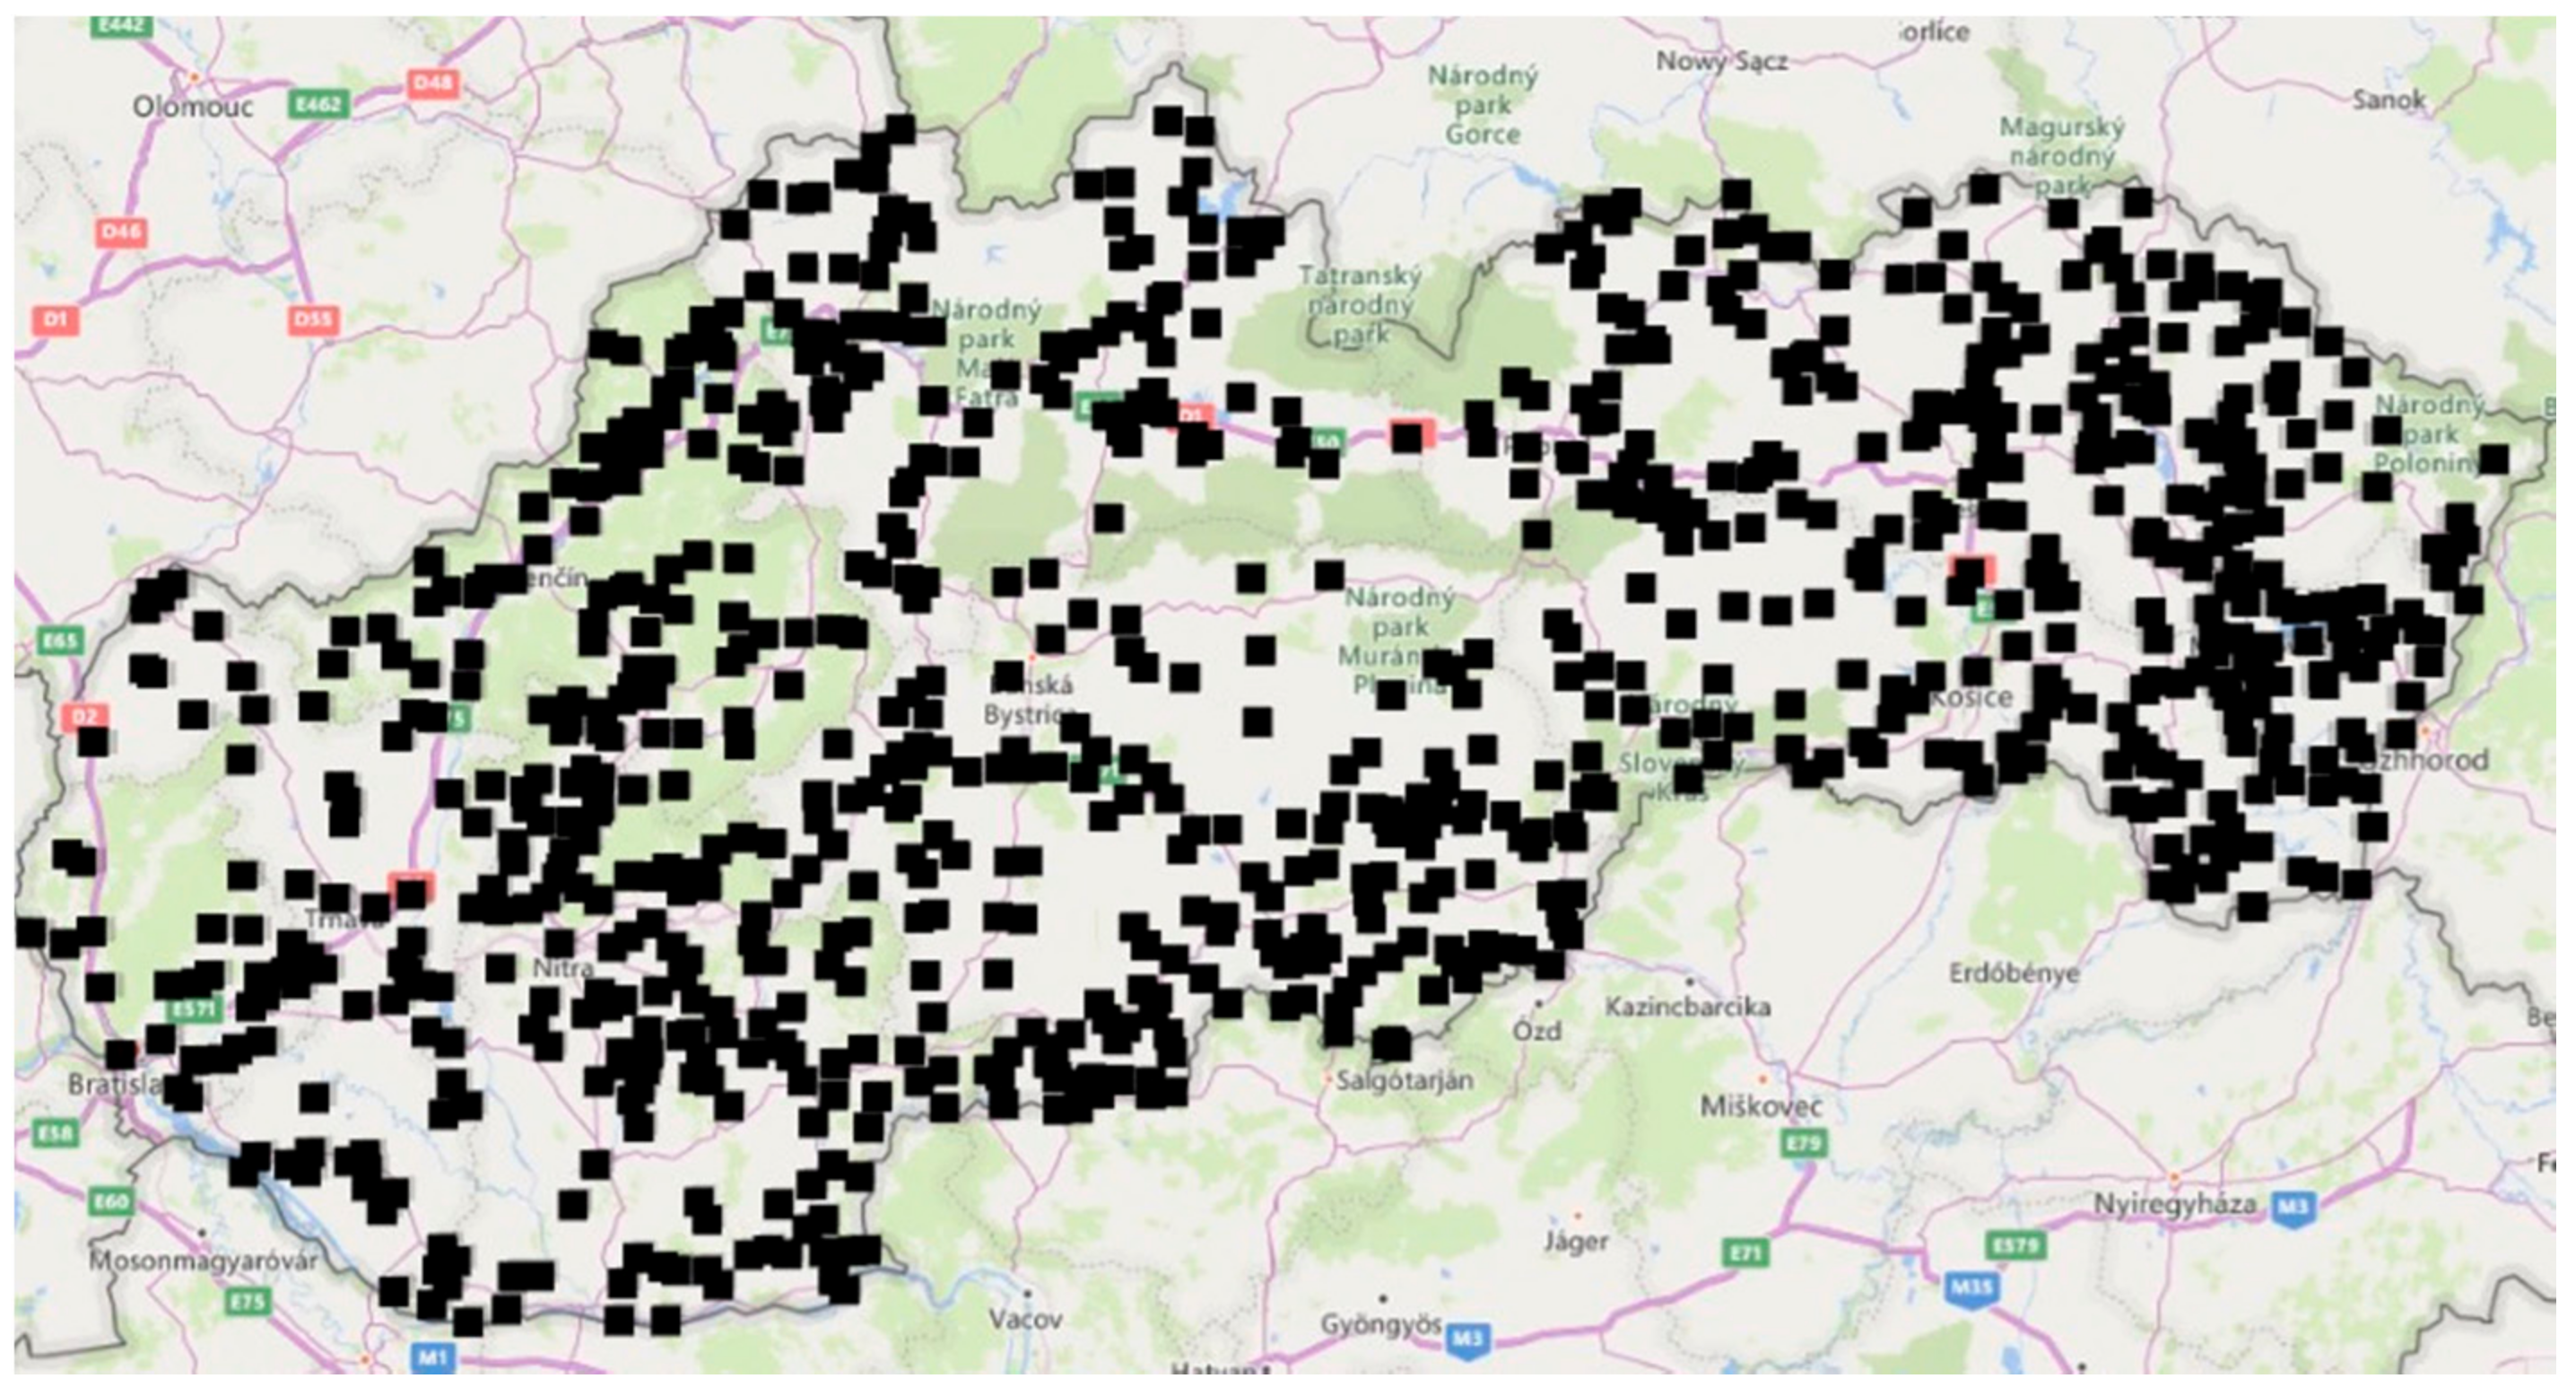
Figure 1. Dot map of the municipalities of the Slovak Republic (red-villages, blue-towns, green-urban parts). They were all addressed in the survey. Source: http://www.sodbtn.sk/obce/obce_body.php (accessed on 15 September 2020). Reprinted with permission from [46]. © Vladimír Bačík.
Sustainability 13 13723 g001
Figure 2. Municipalities involved in the survey with the response of one or more employees of the self-government office. Source: Map of the MS Excel, own data processing.
Sustainability 13 13723 g002
Figure 3. Residence places of the respondents that were not employed by the self-government that were involved in the survey, based on their response to the questionnaire. Source: Maps MS Excel, own data processing.
Sustainability 13 13723 g003
Figure 4. Scree Plot. Source: primary data, IBM SPSS Statistics analysis.
Sustainability 13 13723 g004
Figure 5. Decision tree for the rate of sorted waste in the total amount of MW produced in the municipality. Source: primary data, IBM SPSS Statistics analysis.
Sustainability 13 13723 g005
Figure 6. Clusters of respondents with externally different, internally similar properties for the purpose of defining the determinants of the ratio of sorted waste and the total amount of municipal waste (cells show relative distributions). Source: primary data, IBM SPSS Statistics analysis.
Sustainability 13 13723 g006
Table 1. Areas of the survey.
Survey Areas
A.
Perception and attitude towards environmental issues—expecting that pro-environmental orientation is a prerequisite for the spontaneous purposeful approach of citizens to minimize waste production. (Question 1)
B.
Involvement in environmental protection—like attitudes, actions in favor of environmental sustainability should be an even stronger argument in favor of the optimization of waste production. (Questions 2, 3)
C.
Perceptions, knowledge, their application, and declared behavior on municipal waste issues—are the basis for a purposeful conduct towards improving waste management. (Questions 4–12)
D.
Levels in the sorting of municipal waste components—as an objective indicator of the status and performance indicator of MW management targets. (Questions 13–21)
E.
Motivation, internal or external, in sorting or generally in municipal waste management—assuming that personal motivation of citizens is in addition to the legislative measures and influential factors on the level of MW management (Questions 22–27)
F.
Improvement proposals—suggestions for dealing with the MW management. (Question 28)
G.
Basic categorization of respondents to self-government workers and other citizens. (Question 29–33)
H.
For municipal representatives, questions related to MW management in their municipality, including specifications of quantity. (Questions 34–66)
I.
General demographic data designed for categorization of responses and voluntary insights, feedback. (Questions 67–80)
J.
Significant relationships and dependencies related to the perception of the environment, with the production, prevention, sorting, motivation, and other aspects of municipal waste management that will be determined by using statistical methods.
Source: primary data.
Table 2. Proportional representation of municipalities participating in the survey in comparison with the actual proportional representation of municipalities in individual areas of Slovakia.
Counties in SlovakiaMunicipalitiesMunicipalities ProportionMunicipalities in the SurveyMunicipalities Proportion in the SurveyDifference between the Proportions
Western Slovakia69423.7%22323.6%0.1%
Central Slovakia110737.8%37539.7%−1.9%
Eastern Slovakia112638.5%34736.7%1.8%
Unspecified location 2not considered
Total2927100%945(+2)100%0%
Source: www.sodbtn.sk (accessed on 15 September 2020) and own data processing. Reprinted with permission from [46]. © Vladimír Bačík.
Table 3. Proportional representation of municipalities in individual regions of Slovakia.
RegionNumber of Municipalities in RegionsProportion of Municipalities in RegionsNumber of Individual Municipalities in Regions Participating in the SurveyProportion of Individual Municipalities in Regions Participating in the SurveyDifference between Proportions of Individual Municipalities in Regions in Reality and in the Survey
Bratislava893.0%272.9%−0.1%
Trnava2518.6%535.6%−3.0%
Trenčín2769.4%909.5%0.1%
Nitria35412.1%14315.1%3.0%
Žilina31510.8%10811.4%0.6%
Banská Bystrica51617.6%17718.7%1.1%
Prešov66522.7%16217.1%−5.6%
Košice46115.7%18519.6%3.9%
Unspecified location--2not considered
Total2927100.0%945(+2)100.0%0%
Source: www.sodbtn.sk (accessed on 19 September 2020) and own data processing. Reprinted with permission from [46]. © Vladimír Bačík.
Table 4. Proportional representation of Slovak municipalities and their representation in the survey.
Type of MunicipalityNumber of MunicipalitiesProportion of Municipalities in SlovakiaNumber of Individual Municipalities in the SurveyProportion of Individual Municipalities in the SurveyDifference between Proportions
Towns/Cities1404.8%899.4%4.6%
Villages275095.2%85890.6%−4.6%
Total2890100.0%947100.0%
Source: www.sodbtn.sk (accessed on 15 September 2020) and own data processing. Reprinted with permission from [46]. © Vladimír Bačík.
Table 5. KMO a Bartlettov Test.
Kaiser-Meyer-Olkin Measure of Sampling Adequacy0.854
Bartlett’s Test of SphericityApprox. Chi-Square4173.901
df105
Sig.0
Source: primary data, IBM SPSS Statistics analysis.
Table 6. Communalities of factor analysis of questionnaire items.
Communalities (Questionnaire Issues)Initial Extracted
26. Can the municipality/city impose a fine for non-compliance with the basic principles of municipal waste management?1.0000.897
11. I consider myself a consumer who cares about the protection of natural resources.1.0000.773
12. Protecting the environment is part of my lifestyle.1.0000.761
2. Do you buy energy-efficient electrical appliances?1.0000.743
4. How do you see the quality of the environment in your city/town?1.0000.708
13. Is separate municipal waste collection organized in your city/municipality?1.0000.668
9. I organize my daily life so that I use as few natural resources as possible (I save water, heat, energy).1.0000.659
21. According to you, the fee for municipal waste is ...1.0000.602
3. In case of product failure (electrical appliances/clothing/toys/means of transport), if the product is repairable ...1.0000.584
18. Do you know what fee you pay for municipal waste per person in your town/village?1.0000.552
1. Are you interested in the current state and future of the environment?1.0000.549
10. I try to use as few natural resources as possible, even if it requires additional costs and effort (instead of a car I use a bus or bicycle or walk; I buy more expensive organic food and just enough to use everything without waste, I use reusable packaging).1.0000.538
7. To what extent do you care to minimize the amount of produced municipal waste?1.0000.504
14. Are you involved in the separate collection of municipal waste?1.0000.471
22. Are you motivated enough to sort waste?1.0000.449
Extraction Method: Principal Component Analysis.
Source: primary data, IBM SPSS Statistics analysis.
Table 7. Total explained variability in factor analysis.
Total Variance Explained
ComponentInitial EigenvaluesExtraction Sums of Squared LoadingsRotation Sums of Squared Loadings
Total% of VarianceCumulative %Total% of VarianceCumulative %Total% of VarianceCumulative %
13.95526.36726.3673.95526.36726.3673.37222.47822.478
21.56010.40336.7701.56010.40336.7701.55510.36432.842
31.0627.08043.8501.0627.08043.8501.4649.75842.600
41.0436.95250.8031.0436.95250.8031.2308.20250.803
50.9496.32457.126
60.8885.92363.049
70.8545.69368.742
80.8495.65874.400
90.7745.16379.563
100.7294.86284.425
110.6454.29888.722
120.6094.06292.784
130.4703.13095.914
140.4142.76298.676
150.1991.324100.000
Extraction Method: Principal Component Analysis.
Source: primary data, IBM SPSS Statistics analysis.
Table 8. Rotated a factor analysis matrix.
Components
(Factors, Dimensions, Constructs)
Self-PerceptionPrerequisites for SortingConfidence in
the Future
Financial Burden
Manifest Variables
(Observations)
11. I consider myself a consumer who cares about the protection of natural resources.0.857
12. Protecting the environment is part of my lifestyle.0.839
9. I organize my daily life so that I use as few natural resources as possible (I save water, heat, energy).0.784
10. I try to use as few natural resources as possible, even if it requires additional costs and effort (instead of a car I use a bus or bicycle or walk; I buy more expensive organic food and just enough to use everything without waste, I use reusable packaging).0.721
7. To what extent do you care to minimize the amount of produced municipal waste?0.682
13. Is separate municipal waste collection organized in your city/municipality? 0.650
4. How do you see the quality of the environment in your city/town? 0.577
22. You are motivated enough to sort waste?0.2020.538
14. Are you involved in separate municipal waste collection?0.2280.5120.311
21. According to you, the fee for municipal waste is ... −0.6690.350
1. Are you interested in the current state and future of the environment?0.389 0.5750.236
18. Do you know what fee you pay for municipal waste per person in your town/village? 0.3200.515
2. Do you buy energy-efficient electrical appliances? −0.2210.4780.385
3. In case of product failure (electrical appliances/clothing/toys/means of transport), if the product is repairable ... 0.698
26. Can the municipality/city impose a fine for non-compliance with the basic principles of municipal waste management? 0.523
Extraction Method: Principal Component Analysis.
Rotation Method: Varimax with Kaiser Normalization.
Source: primary data, IBM SPSS Statistics analysis. a. Rotation converged in 6 iterations.
Table 9. Analysis of the internal consistency of the questionnaire (reliability) with all 15 polyatomic questions and only with five questions representing the construct of environmental self-perception.
Reliability Statistics
Cronbach‘s AlphaItemsNumber of Respondents with Non-Empty Answers
0.707151260
0.83151426
Source: primary data, IBM SPSS Statistics analysis.
Publisher’s Note: MDPI stays neutral with regard to jurisdictional claims in published maps and institutional affiliations.

