Article

Heavy Metals in Soil and Sand from Playgrounds of Çanakkale City (Turkey), and Related Health Risks for Children

1
Lapseki Vocational School, Çanakkale Onsekiz Mart University, Çanakkale 17800, Turkey
2
Soil Fertilizer and Water Resources Central Research Institute, Ankara 35660, Turkey
3
Laboratory of Environmental Chemistry, Department of Chemistry, National and Kapodistrian, University of Athens, 15784 Athens, Greece
*
Author to whom correspondence should be addressed.
Sustainability 2022, 14(3), 1145; https://doi.org/10.3390/su14031145
Submission received: 20 December 2021 / Revised: 12 January 2022 / Accepted: 17 January 2022 / Published: 20 January 2022
(This article belongs to the Special Issue Trace Metals in the Urban Environment and Human Health Risks)

Abstract

:
Children spend most of their time in playgrounds and, in parallel, constitute the social group most sensitive to contaminants. Here, we present the results of a comparative study of heavy-metal contents between soils and sand from sandboxes obtained from playgrounds of Çanakkale city. Average contents of soils followed the order of iron (Fe) (12,901 mg kg−1) > manganese (Mn) (475 mg kg−1) > zinc (Zn) (58 mg kg−1) > copper (Cu) (28 mg kg−1) > nickel (Ni), chromium (Cr) (21 mg kg−1) > lead (Pb) (18 mg kg−1). Sand had lower contents, however, due to the reduction of particles size through prolonged use, and accumulation of Fe/Mn (oxyhydr)oxides on sand grains tended to diminish the differences between soils and sand. Through chemometric analysis, Cr and Ni were found to have a lithogenic origin, while the rest of metals were related to anthropogenic activities. Spatially, heavy-metal contents followed the pattern of the city’s sprawl. Risk estimates on children’s health showed that ingestion was the most important exposure route, followed by dermal contact and inhalation. Exposure of children to sand was of similar importance to that of soils. These findings are significant, as the contamination of sand has not yet received much attention compared to the soil of playgrounds.

1. Introduction

Urban soils become enriched with heavy metals, either by geological or anthropogenic factors. However, the contribution of anthropogenic factors is often reported to be dominant, due to rapid urbanization [1,2,3,4]. Common anthropogenic sources include traffic emissions, industrial activities, such as power generation and waste management practices, and domestic fuel combustions [5,6,7,8,9]. Heavy metals may have acute and chronic effects on human health, including gastrointestinal and kidney dysfunction, nervous system disorders, vascular and immune system damage, infertility and birth defects, and cancer [10,11,12]. Thus, contaminated urban soils are a cause of concern with respect to human health, upon exposure of city residents through ingestion, inhalation, and dermal contact.
Children’s playgrounds are open spaces where children spend their free time in a way that contributes to their physical and psychological development. Although the benefits of playing in open playgrounds and parks are many, children can be exposed to pollutants present in soil and sand from sandboxes. The soil in playgrounds could be natural and undisturbed, or a mixture of native soil and remnants of anthropogenic activity, such as demolition wastes. Sandbox sand is transported to playgrounds to be used as a filling material [13,14]. Exposure of children to pollutants may occur through ingestion, inhalation, and dermal contact, although the ingestion route has been recognized as the most important one [15,16,17]. Children can inadvertently ingest soil and sand. They pick up toys and food that fall on the ground. They bring their dirty hands to their mouths. They may even consume the soil deliberately [18,19,20,21,22]. Average daily soil ingestion rates within the range of 10 to 1000 mg d−1 have been reported, depending on geographic location, climate and season, the soil’s grain size, and socioeconomic factors [23]. Thus, in view of risk assessment, it is essential to know the heavy metal contents of both the soil and the sand of sandboxes in children’s playgrounds.
A great number of studies have dealt with the levels of heavy metals and related risks to children’s health when exposed to them through contact with the soil of playgrounds [5,6,7,15,18,19,22,24,25,26,27,28,29]. Contrarily, relevant studies on the sand of sandboxes are rather limited [8,17,27,28,29]; even fewer have compared the levels of heavy metals in soil and sand [9,14,30]. The primary reason for this discrepancy is that sand is considered rather an inert matrix for the accumulation of heavy metals. However, because of the frequent contact of children with both soil and sand in playgrounds, more studies are needed to elucidate the differences in the heavy metal contents of these two matrices, as well as the potential hazards posed to children upon contact with them.
In this study, we examine for the first time the heavy metal contents in children’s playgrounds in Çanakkale city (NW Turkey). The objectives of our research are: (1) to determine and compare the physicochemical properties and heavy metal contents of the soil and the sand from sandboxes in children’s playgrounds in the central district of the city, (2) to determine the sources and spatial distribution patterns of heavy metals, and (3) to assess the potential, non-carcinogenic hazards caused to children when exposed to contaminated soil and sand through ingestion, inhalation, and dermal contact.

2. Materials and Methods
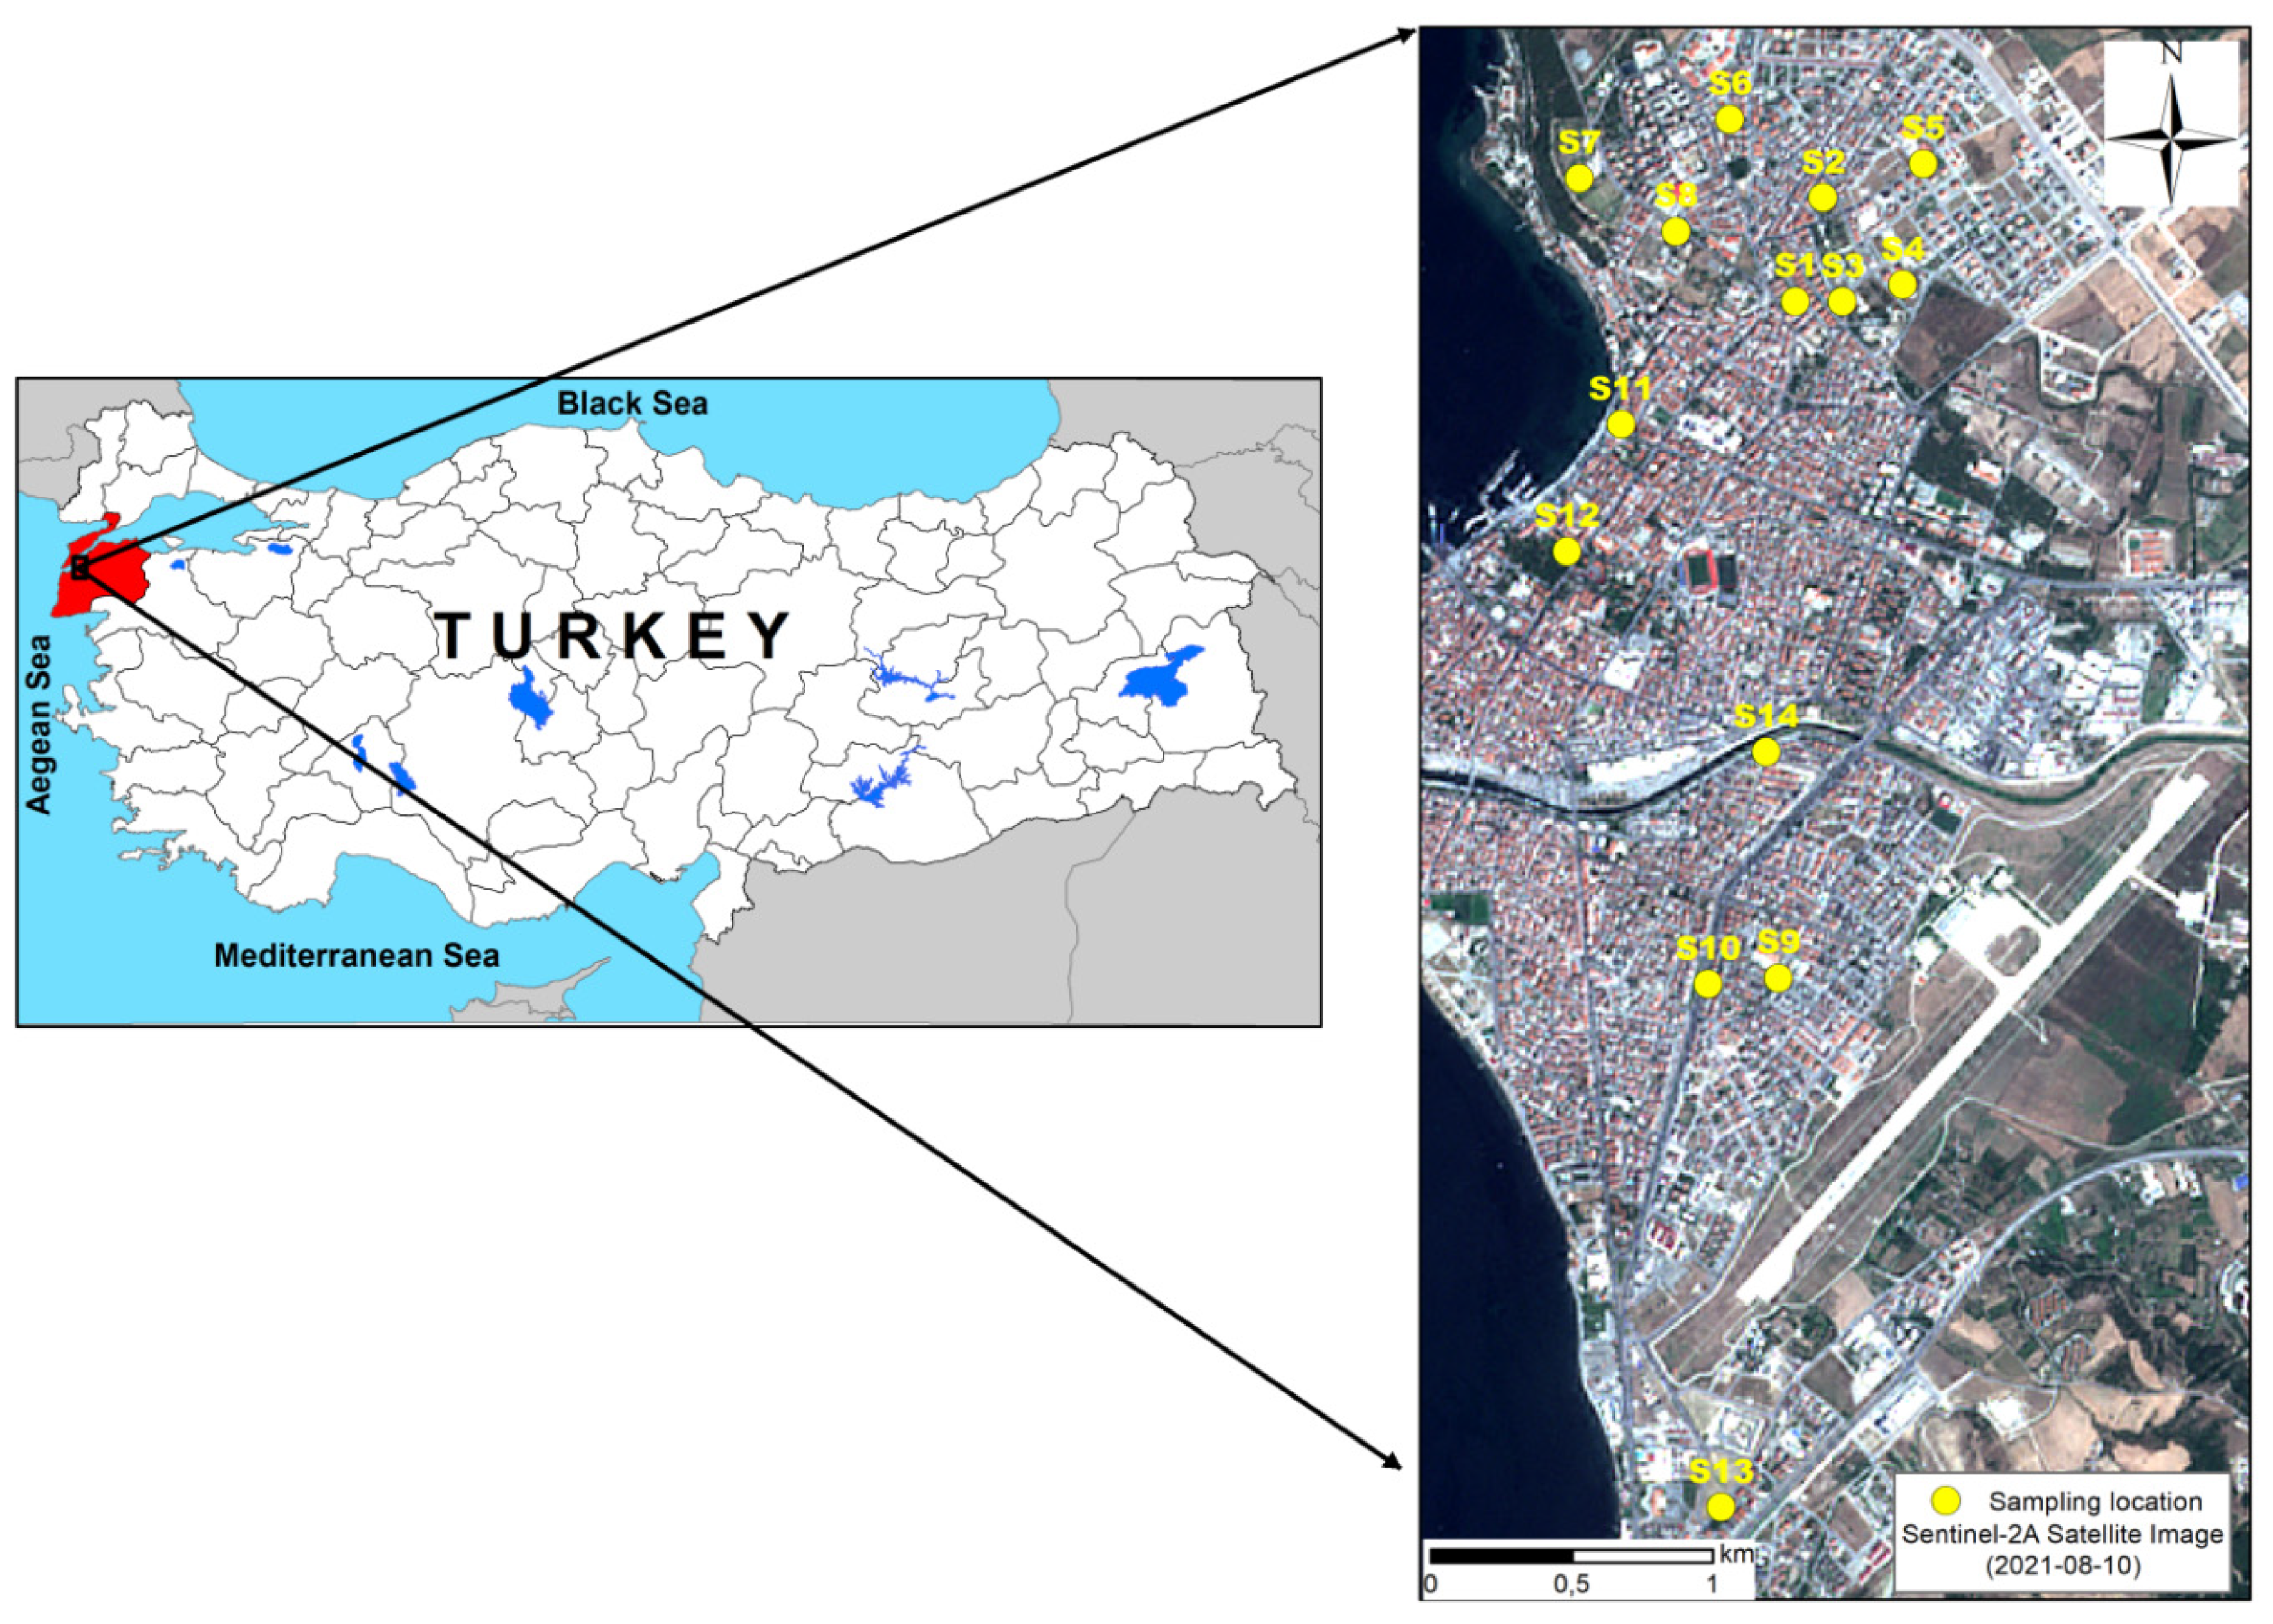
2.1. The Study Area

Çanakkale Province is located in NW Turkey and is surrounded by Balıkesir in the east and southeast, the Aegean Sea in the west, Edirne Province in the northwest, and Tekirdag Province and the Marmara Sea in the north. The homonymous city is located between 26°10′9038″–26°50′15,531″ E and 39°54′28,858″–40°14′15,771″ N. Playgrounds in the parks of the central district of Çanakkale were the focus of the study (Figure 1). According to the 2019 census, the population in the central district of Çanakkale is 184,631 [31]. Children in the central district number 20,595, of which 9993 are between the age of one and four years, and the rest of them (10,972) are between five and nine years [32]. The geology of the study area consists of Quaternary alluvium and the Çanakkale formation of the middle and upper Miocene age. The Çanakkale formation consists of conglomerate sandstone, mudstone, siltstone, marl, calcarenite, and oolitic limestones [33]. The basement is a complex rock assemblage of Cretaceous age, consisting of graywacke, phyllite, schist, serpentinite, spilitic basalt, radiolarite, limestone, and marbles, in the form of tectonic slices and olistolites. Serpentinite rocks include serpentinized harzburgite, dunite, and gabbro, diabase, and spilitic basalt [34,35].

2.2. Field and Laboratory Work

2.2.1. Sampling

Fourteen playgrounds were selected for this study from various areas in the city center (Table S1), including five playgrounds from the northeastern (S1, S2, S3, S4, S5), one from the northern (S6), two from the northwestern (S7 and S8), four from the southern (S9, S10, S13, S14), and two (S11, S12) from the southwestern parts of the city (Figure 1). Sampling took place in July 2020. From each playground, both soil and sand from sandboxes were sampled during a single sampling event from three different locations. In total, 42 samples of soil and 42 sand samples (equaling 84 samples) were collected. Each soil or sand sample was a composite of five surface (0–5 cm depth) sub-samples, obtained from an area of 4 m2. Approximately 1 kg of soil and sand was collected. The soil and sand samples were air dried in the laboratory and then sieved through a 2 mm sieve and kept in plastic bags for analyses.

2.2.2. Soil and Sand Characteristics

Grain-size analysis of the sand samples was conducted using, in sequence, five sieves of 63 µm, 125 µm, 250 µm, 500 µm, and 1000 µm sizes, representing silt, very fine sand, fine sand, medium sand, coarse sand, and very coarse sand, respectively, after the US standard. Soil texture analysis was conducted using the hydrometer method [36]. The pH and EC of soils were measured with a pH (Jenway 3510 model) and EC meter (Jenway 4520 model) in 1:2.5 solid to deionized water suspensions [37,38]. Soil organic matter (SOM) contents were determined by the modified wet oxidation method [39]. Carbonate contents were determined by measuring the CO2(g) released after the addition of HCl in soil samples in a Scheibler calcimeter [40].

2.2.3. Heavy Metal Contents

Soil and sand samples were digested with a mixture of nitric and perchloric acid [41]. The concentrations of Fe, Cu, Mn, Zn, Cr, Ni, and Pb in the digests were determined using ICP-OES (Varian 710-ES model). The method’s accuracy was tested by analysing a certified reference material (NIM-GBW07425, soil) and the determined recoveries ranged from 97% to 107% (Table S2).

2.2.4. Potential Health-Risk Assessment Model

The non-carcinogenic risks of exposure to metals through the ingestion pathway were assessed using the health risk assessment model, developed by the United States Environmental Protection Agency [42], and applied in several previous studies [15,18,20,43].
The average daily dose (ADD) was calculated using Equations (1)–(3) [42,44,45,46]:
ADD ingestion = C × IngR × EF × F × ED BW × AT × CF
ADD inhalation = C × InhR × EF × F × ED PEF × BW × AT
ADD dermal = C × SA × AF × ABS × EF × F × ED BW × AT × CF
where C is the concentration of heavy metals in the soil and sand samples (in mg kg−1), IngR is the ingestion rate (in mg d−1); InhR is the inhalation rate (in m3 day −1); SA is the skin surface (in cm2), AF is the skin adherence factor (in mg cm−2); ABS is the dermal absorption factor (unitless); EF is the exposure frequency (days year −1), F is the fraction of time spent in a playground; ED is the exposure duration; CF is the conversion factor (10−6 kg mg−1); BW is the average body weight; AT is the averaging time, PEF is the soil-to-air particle emission factor (in m3 kg−1). The values of all parameters are given in the Supplementary Materials.
The potential health risks of children exposed to contaminated soils was evaluated by calculating the hazard quotients HQ by Equation (4):
Hazard   Quotient   ( HQ ) = ADD   RfD
where RfD is the reference dose of metals (in mg kg–1 d–1), given in Table S3.
Then, the Hazard Index (HI) was calculated by adding HQs for all studied elements. By adding all the element risks and exposure pathways, the total hazard index (HIT) was calculated. Values of HI or HIT < 1.0 suggest that significant additive or toxic interactions are unlikely. Values of HI or HIT > 1.0 suggest that undesirable, non-carcinogenic health effects are probable [47].

2.2.5. Statistical Analysis and Data Presentation

Descriptive statistics (mean, standard deviation, median, minimum, and maximum values) were used to explore the distribution of the determined parameters in the soil and sand sample sets. Normality and homogeneity of the data sets were tested by the Shapiro–Wilk and Levene’s tests, respectively. Data transformation was applied when departures from normality were encountered. Factor analysis (FA) was applied to explore the relationships between the physicochemical properties and heavy metal contents. Kaiser–Meyer–Olkin (KMO) and Bartlett’s tests were applied to determine the suitability of the data set. Principal component analysis was the applied method after Varimax rotation. Factors with eigenvalues equal to or greater than one were retained in FA. Factor loadings >0.70 were considered as high [3,28]. Hierarchical cluster analysis (HCA) with the Ward’s method was employed to cluster together playgrounds based on the differences in heavy metal contents between soil and sand samples. Statistical differences in the variables between soil and sand data sets were evaluated by running the t-test (normally distributed parameters) or the Mann–Whitney U test (non-normal distributions). All analyses were performed using the IMB SPSS statistics software, v. 17 [48].
The geochemical mapping of heavy metals in the analysed samples was conducted using the ArcGIS 10.1 software [49].

3. Results and Discussion

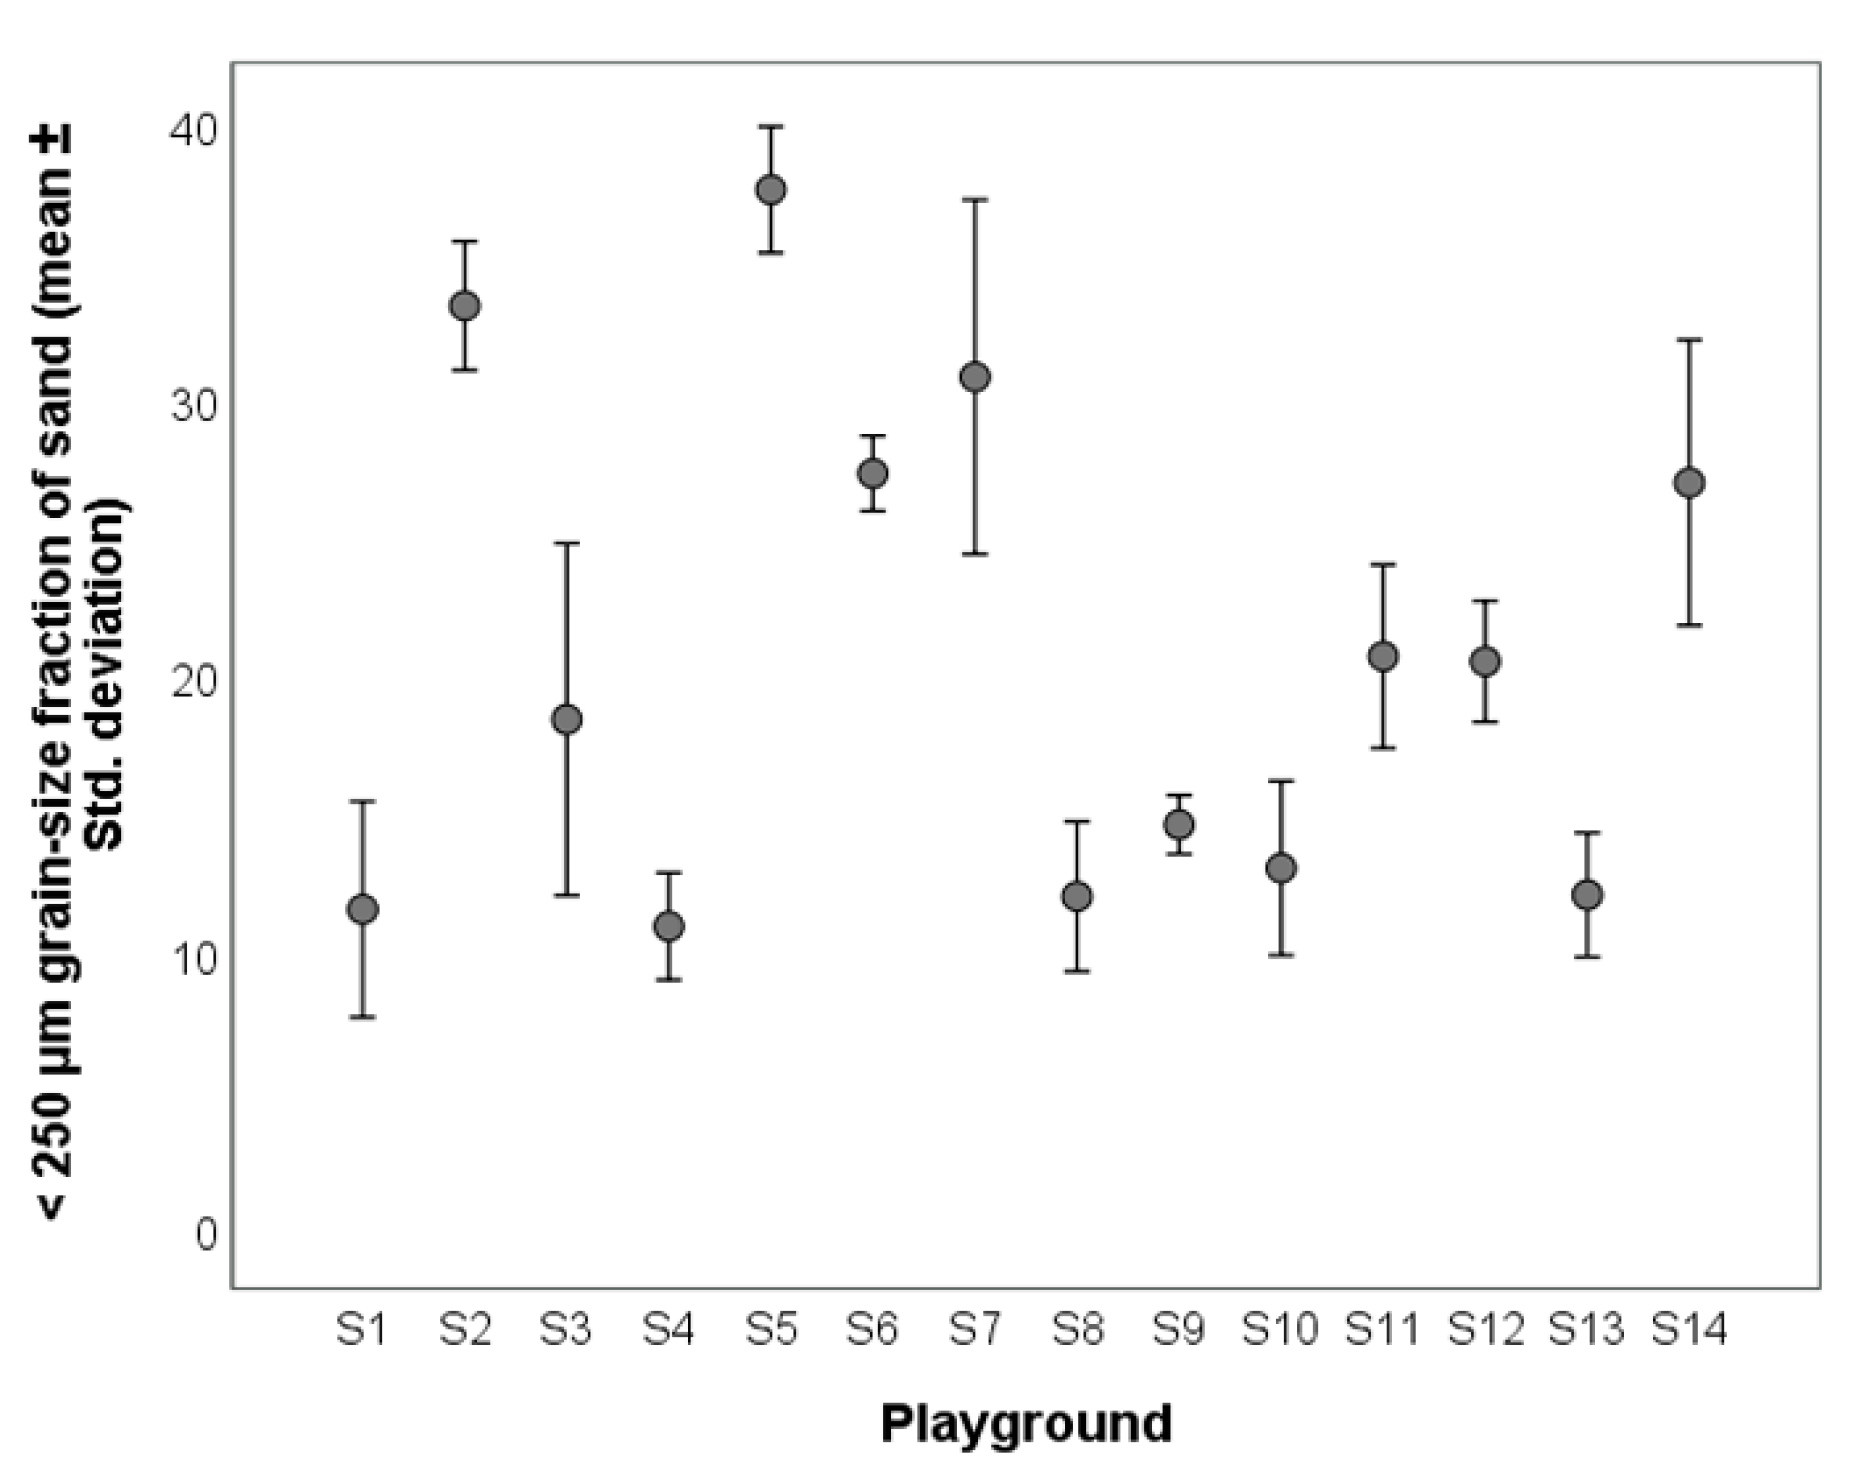
3.1. Physicochemical Properties of Soil and Sand

The physicochemical properties of soil and sand samples obtained from the studied playgrounds are given in Table 1 and graphically illustrated in Figure S1. Most soil samples (65%) were sandy loams, followed by clay loam (14%) and loam (14%), and sandy clay loam (7%). The pH values were near-neutral, whereas electrical conductivity (EC) had a mean value of 0.8 dS m−1, indicating salt-free soils [50]. Soil carbonate contents were in the range from 2.9 to 19.8%, while soil organic matter contents ranged from 1.6 to 9.1%.
The sand from the sandboxes consisted mainly of medium sand (250–500 µm), accounting on average for 38%, followed by coarse sand (0.5–1 mm) (24%), very coarse sand (1–2 mm) (17%), and fine sand (125–250 μm) (15%). Very fine sand (63–125 μm) and the silt and clay fraction (<63 μm) were low, accounting for less than 3% (Table 1). Prolonged use of sand, i.e., the time elapsed since sand renewal or replenishment, results in the grinding of sand, consequently in the reduction of particles size [13,51]. For example, Valido et al. [51] found that the <10 μm fraction increases at a rate of 18% per year of sand use. In our study, detailed registers on the frequency of sand replenishment were not available from the responsible city authorities. However, a high variability of grain-size distribution was detected among the sandboxes of the different parks. “Fine” particles (calculated here by adding the silt, very fine and fine sand fractions, i.e., of <250 μm grain-size) accounted for 6–41% (Figure 2) and had an overall variance equaling 104%. These results are suggestive of the different ages of sand in the various playgrounds. In turn, this may have serious implications for the attenuation of heavy metals [18], as well as for health risks posed to children, as the finer the grain-size of sand, the higher the susceptibility to intake by ingestion and inhalation [51].

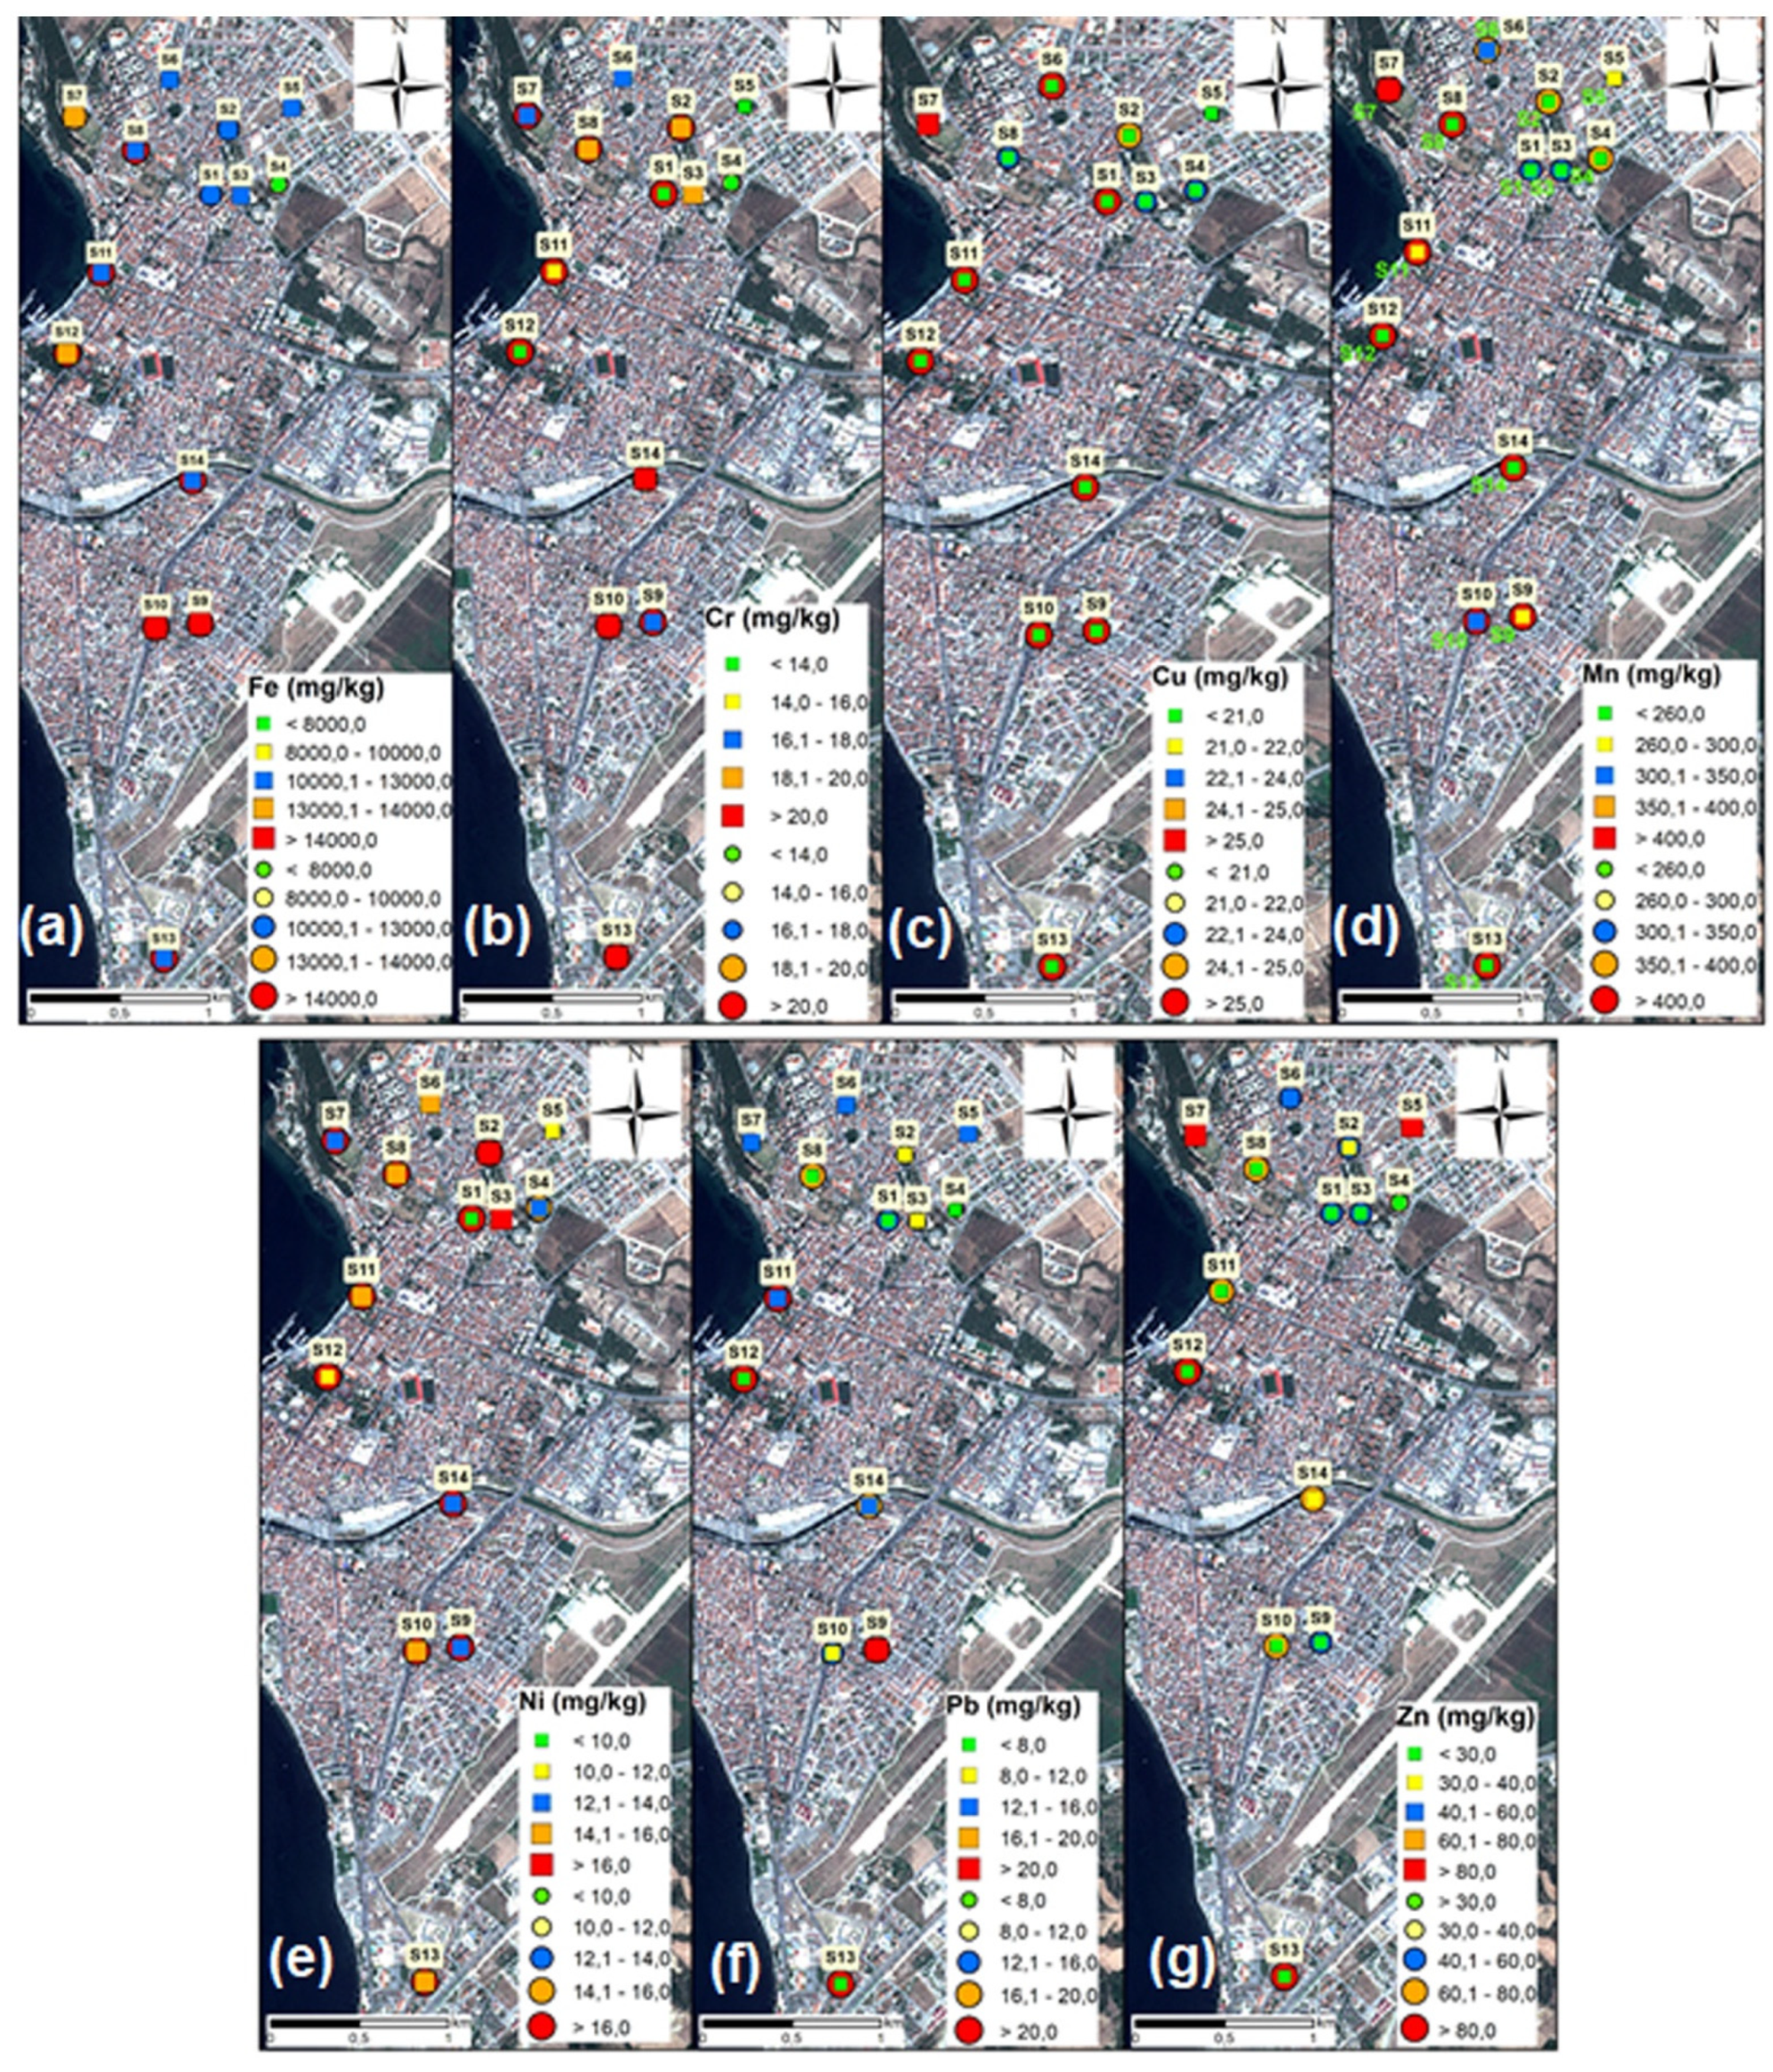
3.2. Levels of Heavy Metals

A summary statistics of heavy metals contents of soil and sand samples is given in Table 2. Based on the intervention values proposed by the Dutch regulation [52] and the limits set by Turkish law on Soil Pollution Control [53] (Table 3), in none of the playgrounds were the levels of heavy metals alarming, either in soil, or in sand. However, a few exceedances of the Dutch target values were observed, when considering the sampling sites, instead of the average values of playgrounds. Copper contents of soils exceeded the target value in three sites (out of 42), and Ni and Pb in one site. In the case of sand, Cu exceeded the target value in one site (out of 42), whereas Zn exceeded the respective target value in two sites. In all other sites, heavy metal contents were below the target values.
Table 3 summarizes the results from previous studies on metallic contaminations in soil and sand with which children may have regular contact during recreational activities. A wide variation on the levels of heavy metals levels is observed, which could be ascribed to the diversity of the sampling analytical protocols employed. Furthermore, specific characteristics of the surveyed cities (size, age, and population of city, traffic density, industrial activities), together with site-specific soil properties, may also affect the levels and distribution of trace elements [5,6,7]. Copper, Pb, and Zn contents found in Çanakkale’s soil samples were much lower than those found in mega and large cities, such as Hong Kong [54], Beijing [26], Istanbul [24], and Athens [19], which are influenced by heavy traffic loads, and atmospheric deposition has been reported to be the primer source of these metals. Soil influenced by local industrial activities also had higher Cu, Pb, and Zn contents, as for example in Khagra city, India [16] and the industrial complex of Biobio Region, Chile [6]. Higher Cr, Fe, and Ni values than the ones of our study were reported in soils with a strong geogenic signal and following a more aggressive digestion procedure, such as from Athens [19] and Beijing [26]. Elevated Cr values found in soil from Sarajevo, Bosnia and Herjegovina [5], and the Biobio Region [6] were ascribed to Cu-Cr-As (CCA)-treated wood in playground equipment.
The CCA treatment of wood used in sandboxes has been recognized as a source of sand pollution also in Norway [14] (Table 3). Higher Cr and Zn contents in sand than those in our study were reported in Lublin, Poland [9] and Thessaloniki, Greece [13], and were ascribed to anthropogenic sources.

3.3. Source Apportionment and Controlling Factors

The sources of trace elements and the factors that control their distribution were investigated by factor analysis (FA). Prior to FA, and to include meaningful variables in the analysis, the correlation matrix (Pearson correlation coefficient on transformed data) of trace elements and physicochemical was inspected (Table S4). SOM exhibited a negative correlation with pH (r = −0.536; p < 0.01) and a positive correlation with EC (r = 0.359; p < 0.05). No correlation was found between heavy metals and pH and EC. Carbonate contents correlated positively with fine sand (r = 0.313; p < 0.05) and negatively with Mn and Zn (r = −0.344 and −0.321, respectively; p < 0.05). The negative correlation coefficient implies a dilution effect of carbonates to Mn and Zn contents. Based on these results, the physicochemical parameters introduced to FA were fine sand (as a means of soil grain-size distribution) and SOM.
The KMO statistic in the soil was determined as 0.704. The results of FA are presented in Table 4 and graphically illustrated in Figure S2. Three factors explained 85.3% of the variability of soils dataset. Factor 1 (41.3% of variance) included Pb, Zn, Cu, and Mn with high positive loadings. These metals are commonly associated with traffic-related emissions and fuel combustion processes [43,55,56]. For example, Cu and Zn derive from brake linings and brake-wear particles [56,57,58]. Manganese is added as an antiknock agent in fuels [2]. Lead is a legacy contaminant from the leaded-petrol era, while current traffic-related sources include brake wear and wheel weights [2,56,57]. Thus, F1 represents the anthropogenic factor. High loadings of Fe with this factor implies its origin from anthropogenic sources (e.g., combustion processes and non-combustion traffic-related emissions) [57], and/or that Fe oxy(hydr)oxides act as significant carriers for Pb, Cu, and Zn [58].
The second factor (F2; 26.9% of the variance) included Cr and Ni, and represents the lithogenic factor. This is due to the widespread occurrence of ultramafic rocks in the study area [59], which are naturally enriched in Cr and Ni. Total Cr and Ni contents of serpentine soils, developed from igneous ultramafic rocks, could be as high as 2000 mg kg−1, or even greater [60]. By contrast, Cr and Ni contents of the upper continental crust are 92 mg kg−1 and 47 mg kg−1, respectively [61]. Finally, F3 (17.0% of variance) was closely related to SOM and fine sand and represented the physicochemical parameters.
The KMO statistics for the sand samples was 0.573. Three major components with eigenvalues greater than one explained 75.6% of the variance of the data set. The first factor explained 31.5% of the total variance and was related to “fine” sand (i.e., the sum of silt, very fine and fine sand fractions), Mn, Pb, and Zn. F1 was considered to represent the anthropogenic factor. The second factor, ascribed to lithogenic sources, explained 22.4% of the variance, and showed high positive loadings with Cr and Ni. The third factor explained 21.8% of the variance and was related to Fe and Cu. This factor could be associated with iron Fe (oxyhydr)oxides that are well-known scavengers for Cu [58]. The association of Cu to Fe (oxyhydr)oxides has been reported also in agricultural soils surrounding the city centre of Çanakkale [59]. Furthermore, the sand of playgrounds of Thessaloniki (Greece) was found to contain Fe-spherules, which are typical of combustion sources [13].

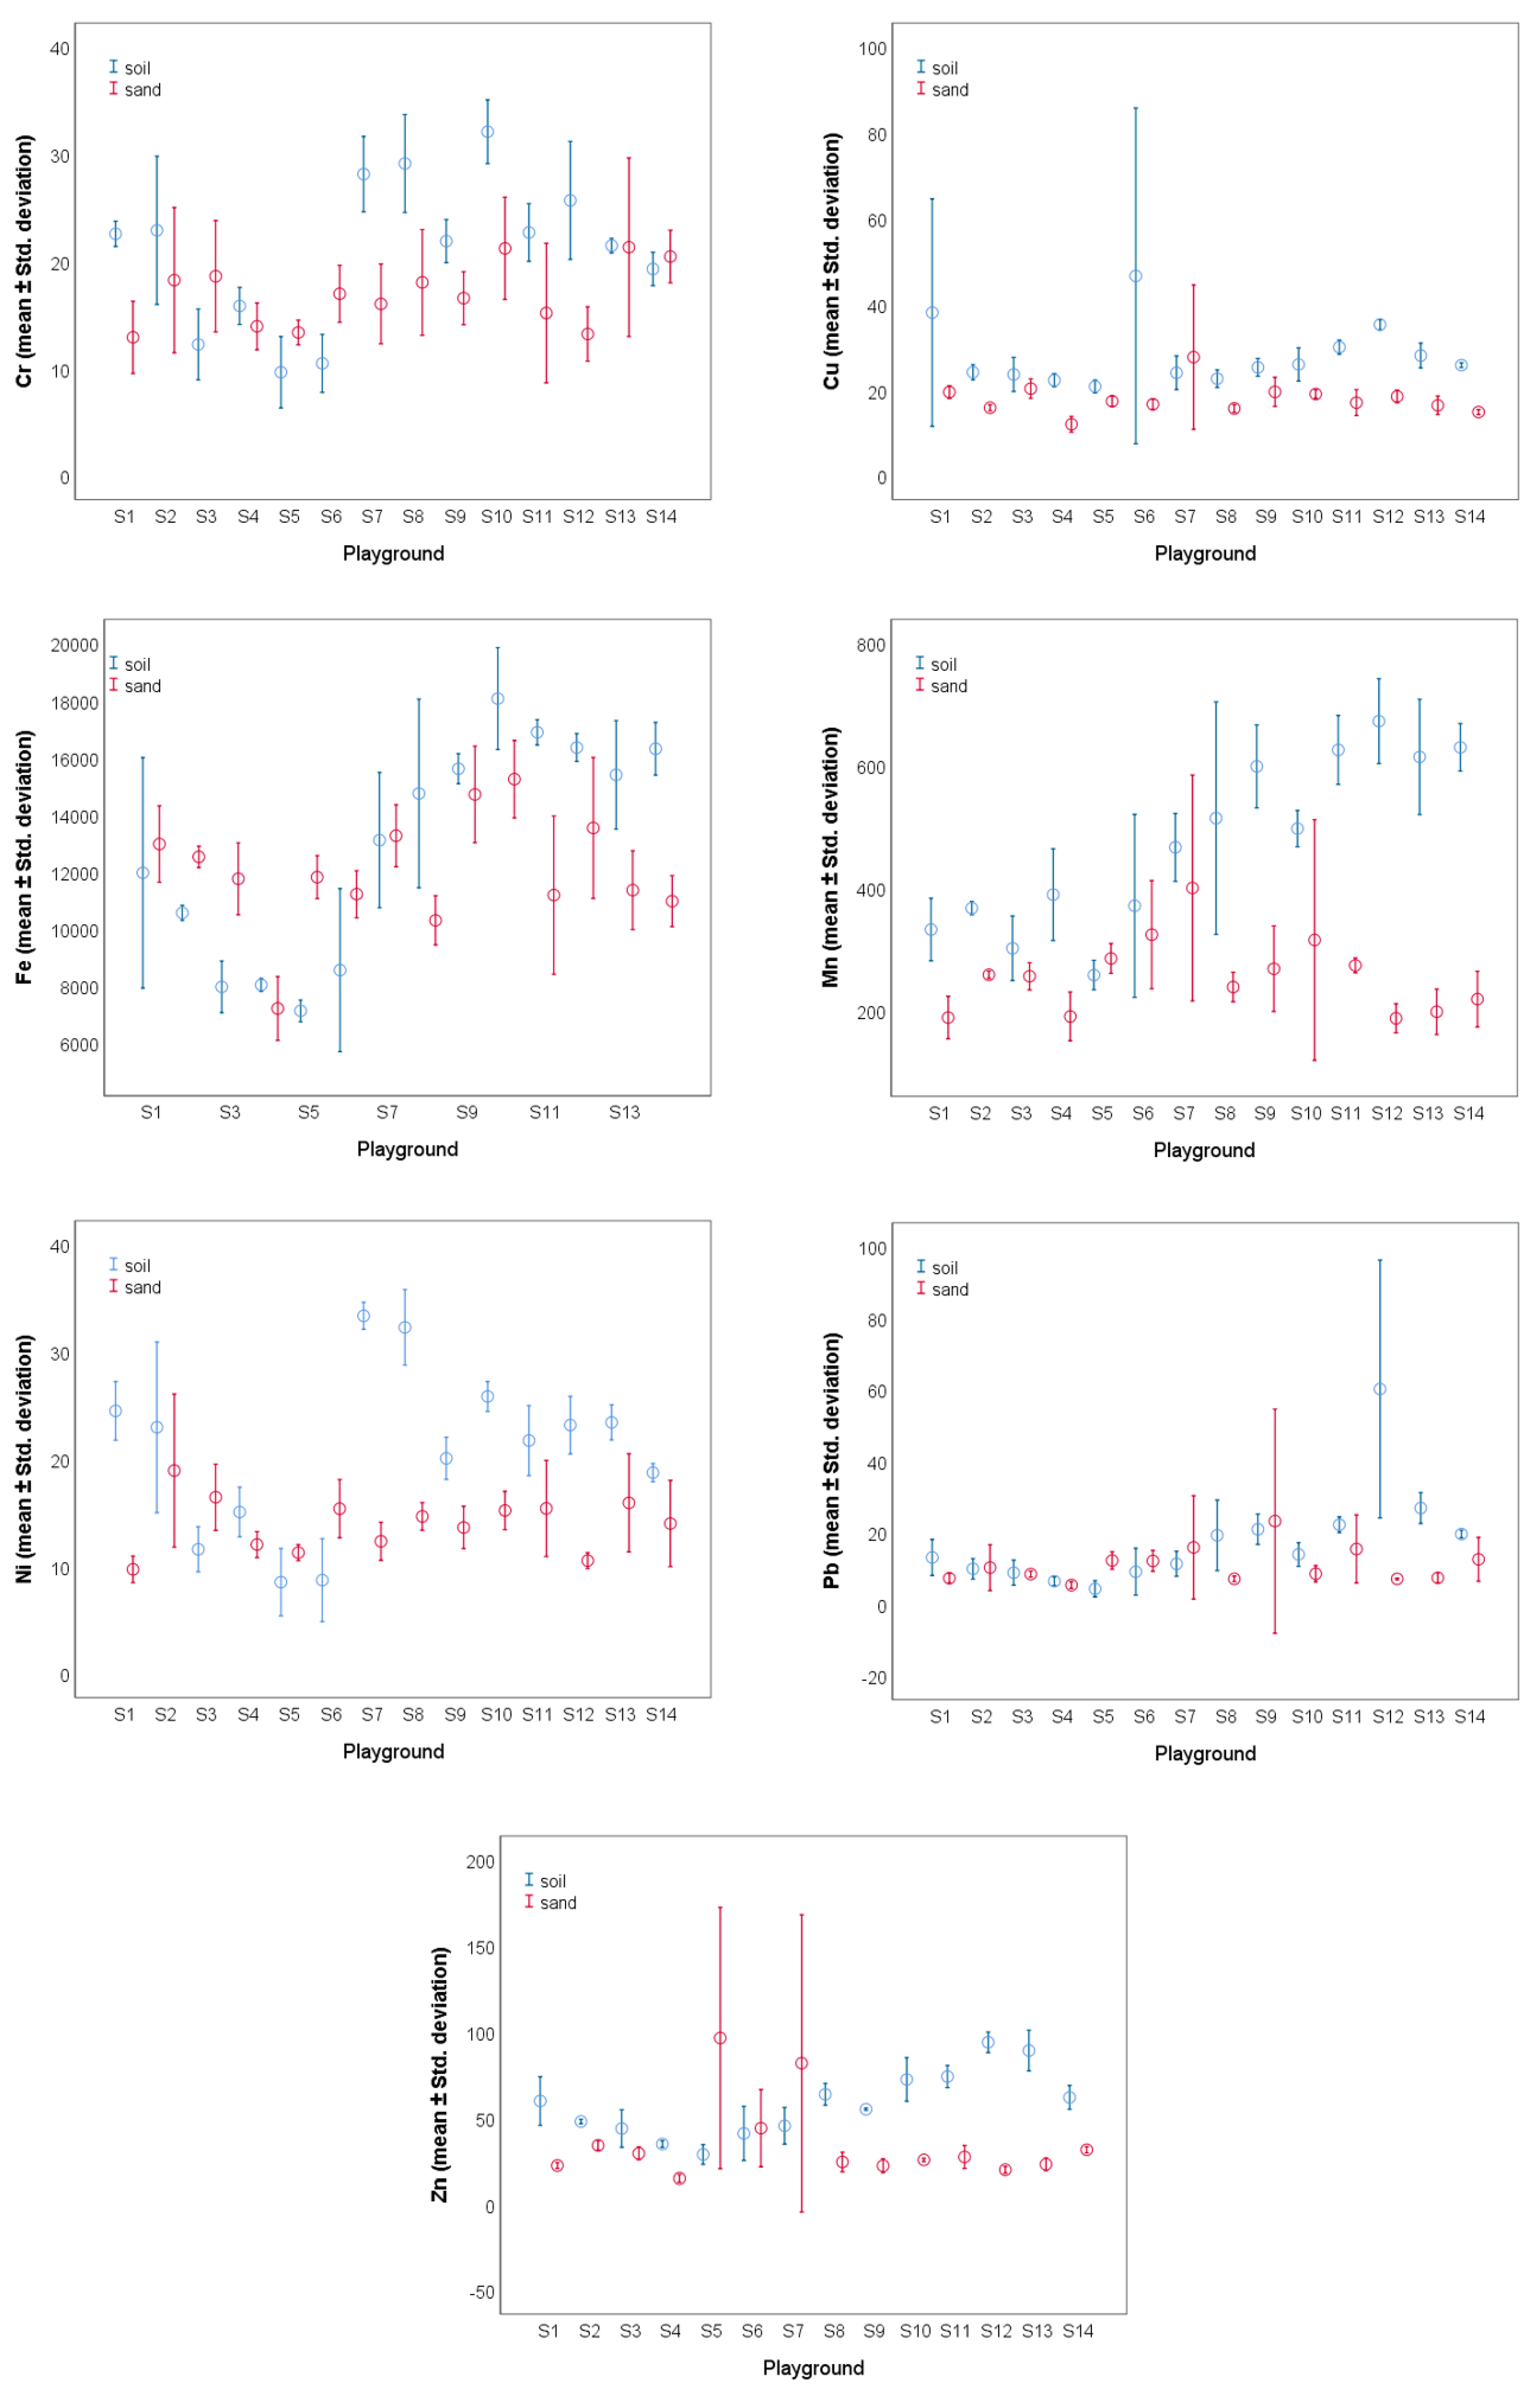
3.4. Comparison of HM Levels between Soil and Sand

The non-parametric independent Mann–Whitney U test was applied to test if there were differences on the levels of heavy metals between soil and sand. When all playgrounds are considered together, the Cr, Cu, Mn, Ni, Pb, and Zn contents of soil were found to be higher than those of sand (p < 0.05). Similar findings have been reported previously, and were ascribed to the coarser texture and lower organic matter contents of sand compared to soil, as well as the shorter time period that sand is exposed to pollution sources due to its regular replacement [14,30]. Contrarily to other metals, Fe did not show statistically significant differences (p > 0.05) between the two matrices.
Figure 3 shows the detailed distribution of heavy metal contents of soil and sand in the sampled playgrounds. In several playgrounds, the metal contents of sand were found to be equal to (e.g., Cr, Ni, Pb in playgrounds S1, S2, S11, and S14; Zn in playgrounds S5, S6, S7) or even higher than those of soil (Fe in playgrounds S2, S3, S5, and S6; Pb in S5) at the 0.05 level of confidence. To understand the reasons for such patterns, we first inspected the spatial variation of the mean values of heavy metals in soil and sand (Figure 4).
The lower mean values of heavy metals within the soil dataset were detected in the northern part of the study area, where, occasionally, higher mean values within the sand dataset were observed. To verify this spatial pattern, the differences of means of heavy metals in soil and sand were subjected to cluster analysis. Two major clusters were identified (Figure 5). The first cluster included the playgrounds located on the northern part of the city, while the second one included the playgrounds of the central and southern part. Such patterns are explained by the prevailing winds blowing from the NE to the SW direction, with monthly average wind speeds (for the period of 1980–2013) being lowest in June and highest in December, ranging from 3.3 m s−1 to 4.3 m s−1 with an annual average of 3.8 m s−1 [62,63]. Additionally, a north-easterly expansion of the residential area occurred during the last decades. The age of the site and the time the soil has been on-site to accumulate metals has been reported as an important factor in determining the soil metal contents [27].
Furthermore, correlation analysis was employed to explore whether the differences in means of heavy metal contents between soils and sand were related to the physicochemical parameters. Two kinds of relationship emerged. The first involved grain-size distribution. Negative correlation coefficients between the silt content in sand and the differences for Mn (r = −0.560; p < 0.05), Pb (r = −0.587; p < 0.05) and Zn (r = −0.798; p < 0.01) were found, suggesting that the more abundant the fine particles were in sand, the more comparable the contents of Mn, Pb, and Zn became between the two matrices. The second type of relationship involved Fe and Mn contents, either in soils or sand. On the one hand, positive correlations were found between the Fe contents of the soil samples and the differences for Ni (r = 0.600; p < 0.05), Cr (r = 0.878; p < 0.01), Pb (r = 0.657; p < 0.05), and Zn (r = 0.674; p < 0.01). Additionally, a positive correlation of Mn contents in soils and the differences for Zn was found (r = 0.682; p < 0.01). These positive correlations show that the more enriched the soils were with Fe and Mn, the higher the difference was for Cr, Ni, Pb, and Zn between the two samples sets. On the other hand, negative correlation coefficients were found between the Mn contents of sand samples and the differences for Pb (r = 0.574; p < 0.05), and Zn (r = −0.606; p < 0.05), implying that enrichment of sand samples with Mn tended to diminish the differences for Pb and Zn. These relationships clearly underline the role of Fe and Mn, most probably in the form of (oxydr)oxides as scavengers for heavy metals.

3.5. Health Risk Assessment

The results of the non-carcinogenic health risk assessment for children exposed to heavy metals while playing in the studied playgrounds of Çanakkale is summarized in Table 5.
Average daily doses for all studied metals and both matrices were found to be two to three orders of magnitude higher through ingestion compared to dermal contact, and four to five orders of magnitude higher than inhalation. This is in line with previous studies, reporting the prevalence of ingestion among the exposure routes [15,16,18,64]. For all exposure routes and both matrices, the elements with the highest and lowest ADD values were Mn and Pb, respectively.
With respect to risk posed on children’s health, the values of HIT were found to be 0.024 and 0.015 for exposure to soils and sand, respectively, hence adverse effects are unlikely under the conditions assumed in the model. The transport route of highest concern was ingestion, contributing by 87% to the overall potential risk. The elements with the highest contribution to the hazard index through ingestion were Mn (42%), followed by Cr (29%) and Pb (21%).
Nevertheless, it should be mentioned that despite the low level of concern determined by the model, further research is needed with respect to elements of high toxicity, such as Hg and As, as pointed out by risk assessments in playgrounds [22,24].

4. Conclusions

In this study, we examined the levels of heavy metals in soils and the sand from sandboxes of the central district of Çanakkale, as well as the potential hazards posed to children while playing outdoors. The heavy metal contents of soils and sand were found to be much lower than the international limits informing the need for remediating contaminated sites. The spatial distribution of heavy metals followed the pattern of urban sprawl. An increase in heavy metal contents seems likely, following increasing urbanization and related activities, such as vehicular traffic.
The levels of heavy metals in soils and sand currently do not pose a health risk to children. Although contamination of sand of sandboxes is a largely understudied issue, the risk assessment on children’s health showed that the level of concern arising from exposure to sand is equivalent to that related to exposure to soils. Since spending time in playgrounds may affect children’s health, regular monitoring of heavy metals is recommended both in soils and the sand from sandboxes. Furthermore, the research should be expanded to other toxic elements, such as Hg and As, which have been recognized as elements of concern in other relevant studies worldwide.

Supplementary Materials

The following are available online at https://www.mdpi.com/article/10.3390/su14031145/s1. Table S1: Sampling sites and traffic density around the studied playgrounds, Table S2: Comparison of the certified and the measured values (mg kg–1) for the soil (NIM-GBW07425) standard reference material (Mean ± Std. deviation; n = 3), Table S3: Reference doses (RfDs) for ingestion (ing), inhalation (inh), and dermal contact (derm) of heavy metals, Table S4: Pearson correlation coefficient between physicochemical properties of soils and heavy metal contents, Figure S1: Ternary diagram of soil classification scheme, Figure S2: Component plots on rotated space after Factor Analysis of (a) the soil and (b) the sand samples.

Author Contributions

Conceptualization, M.P. and T.T.; methodology, M.P. and T.T.; validation, M.P. and T.T.; formal analysis, T.T. and F.B.; investigation, M.P. and T.T.; resources, M.P.; data curation, M.P. and. F.B.; writing—original draft preparation, M.P. and F.B.; writing—review and editing, M.P. and F.B.; visualization, T.T. and F.B.; supervision, M.P.; project administration, M.P.; funding acquisition, M.P. All authors have read and agreed to the published version of the manuscript.

Funding

This research received no external funding.

Institutional Review Board Statement

Not applicable.

Informed Consent Statement

Not applicable.

Data Availability Statement

The data presented in this study are available on request from the corresponding author.

Acknowledgments

The authors wish to thank two anonymous reviewers for their critical comments and suggestions that greatly improved the quality of the paper.

Conflicts of Interest

The authors declare no conflict of interest.

References

  1. Ajmone-Marsan, F.; Biasioli, M. Trace Elements in Soils of Urban Areas. Water Air Soil Pollut. 2010, 213, 121–143. [Google Scholar] [CrossRef]
  2. Sager, M. Urban Soils and Road Dust—Civilization Effects and Metal Pollution—A Review. Environments 2020, 7, 98. [Google Scholar] [CrossRef]
  3. Modabberi, S.; Tashakor, M.; Sharifi Soltani, N.; Hursthouse, A.S. Potentially toxic elements in urban soils: Source apportionment and contamination assessment. Environ. Monit. Assess. 2018, 190, 1–18. [Google Scholar] [CrossRef] [PubMed] [Green Version]
  4. Sachithanandam, V.; Parthasarathy, P.; Sai Elangovan, S.; Kasilingam, K.; Dhivya, P.; Mageswaran, T.; Mohan, P.M. A baseline study on trace metals concentration and its ecological risk assessment from the coast of South Andaman Island, India. Reg. Stud. Mar. Sci. 2020, 36, 101242. [Google Scholar] [CrossRef]
  5. Sapcanin, A.; Cakal, M.; Jacimovic, Z.; Pehlic, E.; Jancan, G. Soil pollution fingerprints of children playgrounds in Sarajevo city, Bosnia and Herzegovina. Environ. Sci. Pollut. Res. 2017, 24, 10949–10954. [Google Scholar] [CrossRef] [PubMed]
  6. Rodríguez-Oroz, D.; Vidal, R.; Fernandoy, F.; Lambert, F.; Quiero, F. Metal concentrations and source identification in Chilean public children’s playgrounds. Environ. Monit. Assess. 2018, 190, 1–14. [Google Scholar] [CrossRef]
  7. Donado, E.P.; Oliveira, M.L.S.; Gonçalves, J.O.; Dotto, G.L.; Silva, L.F.O. Soil contamination in Colombian playgrounds: Effects of vehicles, construction, and traffic. Environ. Sci. Pollut. Res. Int. 2021, 28, 166–176. [Google Scholar] [CrossRef] [PubMed]
  8. Turhan, S.B.; Oruc, I.; Ozdemir, H. Impact of heating season on the soil pollution in Kirklareli province of Turkey. Environ. Monit. Assess. 2021, 193, 1–15. [Google Scholar] [CrossRef]
  9. Zgłobicki, W.; Telecka, M.; Skupiński, S. Heavy metals in playgrounds in Lublin (E Poland): Sources, pollution levels and health risk. Environ. Sci. Pollut. Res. 2021, 28, 18328–18341. [Google Scholar] [CrossRef]
  10. Balali-Mood, M.; Naseri, K.; Tahergorabi, Z.; Khazdair, M.R.; Sadeghi, M. Toxic Mechanisms of Five Heavy Metals: Mercury, Lead, Chromium, Cadmium, and Arsenic. Front. Pharmacol. 2021, 12, 227. [Google Scholar] [CrossRef]
  11. Jia, Z.; Li, S.; Wang, L. Assessment of soil heavy metals for eco-environment and human health in a rapidly urbanization area of the upper Yangtze Basin. Sci. Rep. 2018, 8, 1–14. [Google Scholar] [CrossRef] [Green Version]
  12. Ahmad, W.; Alharthy, R.D.; Zubair, M.; Ahmed, M.; Hameed, A.; Rafique, S. Toxic and heavy metals contamination assessment in soil and water to evaluate human health risk. Sci. Rep. 2021, 11, 1–12. [Google Scholar] [CrossRef]
  13. Bourliva, A.; Aidona, E.; Papadopoulou, L.; Ferreira da Silva, E.; Patinha, C. Levels, oral bioaccessibility and health risk of sand-bound potentially harmful elements (PHEs) in public playgrounds: Exploring magnetic properties as a pollution proxy. Environ. Pollut. 2021, 290, 118122. [Google Scholar] [CrossRef]
  14. Ottesen, R.T.; Alexander, J.; Langedal, M.; Haugland, T.; Høygaard, E. Soil pollution in day-care centers and playgrounds in Norway: National action plan for mapping and remediation. Environ. Geochem. Health 2008, 30, 623–637. [Google Scholar] [CrossRef]
  15. Javed, S.A.; Al-Bratty, M.; Al-Rajab, A.J.; Alhazmi, H.A.; Ahsan, W.; Abdelwahab, S.I.; Thangavel, N. Risk-based exposure assessment for multiple toxic elements encountered by children in school playgrounds and parks in the southwest region of Saudi Arabia. Environ. Monit. Assess. 2019, 191, 1–16. [Google Scholar] [CrossRef] [PubMed]
  16. Laha, T.; Gope, M.; Datta, S.; Masto, R.E.; Balachandran, S. Oral bioaccessibility of potentially toxic elements (PTEs) and related health risk in urban playground soil from a medieval bell metal industrial town Khagra, India. Environ. Geochem. Health 2020, 191, 1–16. [Google Scholar] [CrossRef] [PubMed]
  17. Pavlović, D.; Pavlović, M.; Perović, V.; Mataruga, Z.; Čakmak, D.; Mitrović, M.; Pavlović, P. Chemical Fractionation, Environmental, and Human Health Risk Assessment of Potentially Toxic Elements in Soil of Industrialised Urban Areas in Serbia. Int. J. Environ. Res. Public Health 2021, 18, 9412. [Google Scholar] [CrossRef] [PubMed]
  18. De Miguel, E.; Iribarren, I.; Chacón, E.; Ordoñez, A.; Charlesworth, S. Risk-based evaluation of the exposure of children to trace elements in playgrounds in Madrid (Spain). Chemosphere 2007, 66, 505–513. [Google Scholar] [CrossRef] [PubMed]
  19. Massas, I.; Ehaliotis, C.; Kalivas, D.; Panagopoulou, G. Concentrations and Availability Indicators of Soil Heavy Metals; the Case of Children’s Playgrounds in the City of Athens (Greece). Water Air Soil Pollut. 2010, 212, 51–63. [Google Scholar] [CrossRef]
  20. Kicińska, A.; Mamak, M.; Skrzypek, M. Heavy metals in sands of sandboxes: Health risk associated with their quantities and form of occurrence in some spas of Poland. Environ. Sci. Pollut. Res. 2017, 24, 19733–19748. [Google Scholar] [CrossRef] [PubMed] [Green Version]
  21. Wang, M.; Han, Q.; Gui, C.; Cao, J.; Liu, Y.; He, X.; He, Y. Differences in the risk assessment of soil heavy metals between newly built and original parks in Jiaozuo, Henan Province, China. Sci. Total Environ. 2019, 676, 1–10. [Google Scholar] [CrossRef] [PubMed]
  22. Penteado, J.O.; Brum, R.L.; Ramires, P.F.; Garcia, E.M.; dos Santos, M.; da Silva Júnior, F.M.R. Health risk assessment in urban parks soils contaminated by metals, Rio Grande city (Brazil) case study. Ecotoxicol. Environ. Saf. 2021, 208, 111737. [Google Scholar] [CrossRef] [PubMed]
  23. Moya, J.; Phillips, L. A review of soil and dust ingestion studies for children. J. Expo. Sci. Environ. Epidemiol. 2014, 24, 545–554. [Google Scholar] [CrossRef] [PubMed] [Green Version]
  24. Guney, M.; Zagury, G.J.; Dogan, N.; Onay, T.T. Exposure assessment and risk characterization from trace elements following soil ingestion by children exposed to playgrounds, parks and picnic areas. J. Hazard. Mater. 2010, 182, 656–664. [Google Scholar] [CrossRef]
  25. Han, Q.; Wang, M.; Cao, J.; Gui, C.; Liu, Y.; He, X.; He, Y.; Liu, Y. Health risk assessment and bioaccessibilities of heavy metals for children in soil and dust from urban parks and schools of Jiaozuo, China. Ecotoxicol. Environ. Saf. 2020, 191, 110157. [Google Scholar] [CrossRef]
  26. Jin, Y.; O’Connor, D.; Ok, Y.S.; Tsang, D.C.W.; Liu, A.; Hou, D. Assessment of sources of heavy metals in soil and dust at children’s playgrounds in Beijing using GIS and multivariate statistical analysis. Environ. Int. 2019, 124, 320–328. [Google Scholar] [CrossRef]
  27. Ljung, K.; Selinus, O.; Otabbong, E. Metals in soils of children’s urban environments in the small northern European city of Uppsala. Sci. Total Environ. 2006, 366, 749–759. [Google Scholar] [CrossRef]
  28. Tepanosyan, G.; Maghakyan, N.; Sahakyan, L.; Saghatelyan, A. Heavy metals pollution levels and children health risk assessment of Yerevan kindergartens soils. Ecotoxicol. Environ. Saf. 2017, 142, 257–265. [Google Scholar] [CrossRef]
  29. Yesil, P.; Yesil, M. Heavy metal pollution in children’s playgrounds in Ordu, Turkey. Fresenius Environ. Bull. 2019, 28, 5090–5098. [Google Scholar]
  30. Kicińska, A. Health risk to children exposed to Zn, Pb, and Fe in selected urban parks of the Silesian agglomeration. Hum. Ecol. Risk Assess. Int. J. 2016, 22, 1687–1695. [Google Scholar] [CrossRef]
  31. DMI. Turkish State Meteorological Service. Meteorological Bulletin. Available online: https://www.mgm.gov.tr/ (accessed on 15 May 2021).
  32. TUIK. Türkiye İstatistik Kurumu 2020. Available online: https://data.tuik.gov.tr/Kategori/GetKategori?p=nufus-ve-demografi-109&dil=1 (accessed on 12 April 2021).
  33. Atabey, E.; Ilgar, A.; Sakıtaş, A. Çanakkale Havzasının orta-üst miosen stratigrafisi, Çanakkale, KB Türkiye. MTA Derg. 2004, 128, 79–97. [Google Scholar]
  34. Bozcu, M.; Akgün, F.; Gürdal, G.; Bozcu, A.; Yeşilyurt, S.K.; Karaca, Ö.; Akkiraz, S.M. Evolution of Çan-Etili (Çanakkale-NW Turkey) lignite basin: Sedimentology, petrology, palynology and lignite characterization. Int. J. Sediment Res. 2015, 30, 190–207. [Google Scholar] [CrossRef]
  35. Erenoglu, O. UAV-based 3D modeling of formation processes for fairy chimney-like structures, Çanakkale, NW Turkey. Arab. J. Geosci. 2021, 14, 1–13. [Google Scholar] [CrossRef]
  36. Gee, G.W.; Or, D. 2.4 Particle-Size Analysis. In Methods of Soil Analysis; Dane, J.H., Topp, C.G., Eds.; Soil Science Society of America, Inc.: Madison, WI, USA, 2002; pp. 255–293. [Google Scholar] [CrossRef]
  37. Rhoades, J.D. Salinity: Electrical Conductivity and Total Dissolved Solids. In Methods of Soil Analysis; Sparks, D.L., Page, A.L., Helmke, P.A., Loeppert, R.H., Soltanpour, P.N., Tabatabai, M.A., Johnston, C.T., Sumner, M.E., Eds.; Soil Science Society of America, Inc.: Madison, WI, USA, 1996; pp. 417–435. [Google Scholar] [CrossRef]
  38. Thomas, G.W. Soil pH and Soil Acidity. In Methods of Soil Analysis; Sparks, D.L., Page, A.L., Helmke, P.A., Loeppert, R.H., Soltanpour, P.N., Tabatabai, M.A., Johnston, C.T., Sumner, M.E., Eds.; Soil Science Society of America, Inc.: Madison, WI, USA, 1996; pp. 475–490. [Google Scholar] [CrossRef] [Green Version]
  39. Nelson, D.W.; Sommers, L.E. Total Carbon, Organic Carbon, and Organic Matter. In Methods of Soil Analysis, 2nd ed.; Page, A.L., Ed.; Soil Science Society of America, Inc.: Madison, WI, USA, 1983; pp. 539–579. [Google Scholar] [CrossRef]
  40. Loeppert, R.H.; Suarez, D.L. Carbonate and Gypsum. In Methods of Soil Analysis; Sparks, D.L., Page, A.L., Helmke, P.A., Loeppert, R.H., Soltanpour, P.N., Tabatabai, M.A., Johnston, C.T., Sumner, M.E., Eds.; Soil Science Society of America, Inc.: Madison, WI, USA, 1996; pp. 437–474. [Google Scholar] [CrossRef]
  41. US EPA. Method 3050B: Acid Digestion of Sediments, Sludges, and Soils, 2nd ed.; U.S. Environmental Protection Agency: Washington, DC, USA, 1996.
  42. US EPA. Superfund Public Health Evaluation Manual EPA 540/1-86-060, OSWER 9285.4-1; U.S. Environmental Protection Agency: Washington, DC, USA, 1986.
  43. Botsou, F.; Moutafis, I.; Dalaina, S.; Kelepertzis, E. Settled bus dust as a proxy of traffic-related emissions and health implications of exposures to potentially harmful elements. Atmos. Pollut. Res. 2020, 11, 1776–1784. [Google Scholar] [CrossRef]
  44. US EPA. Risk Assessment Guidance for Superfund Volume I Human Health Evaluation Manual (Part A), Interim Report; EPA /540/1-89/002; U.S. Environmental Protection Agency: Washington, DC, USA, 1989.
  45. US EPA. Exposure Factors Handbook (Final Report) National Center for Environmental Assessment; Office of Research and Development: Washington, DC, USA, 2011.
  46. US EPA. Regional Screening Levels 2019. Available online: https://www.epa.gov/risk/regional-screening-levels-rsls-generic-tables (accessed on 12 April 2021).
  47. ASTDR. Public Health Assessment Guidance manual (Update); Agency for Toxic Substances and Disease Registry: Atlanta, GA, USA, 2005.
  48. IBM SPSS Inc. SPSS Statistics for Windows, Version 17.0; SPSS Inc.: Chicago, IL, USA, 2007. [Google Scholar]
  49. ESRI. Environmental Systems Research Institute Inc. ArcGIS 10.1: Getting Started with ArcGIS 2009. Available online: http://downloads.esri.com/support/documentation/ao_/1003Getting_Started_with_ArcGIS.pdf (accessed on 20 December 2021).
  50. FAO. Guidelines for Soil Description; Food and Agricultural Organization of United Nations: Rome, Italia, 2006; p. 110. [Google Scholar]
  51. Valido, I.; Padoan, E.; Moreno, T.; Querol, X.; Font, O.; Amato, F. Physico-chemical characterization of playground sand dust, inhalable and bioaccessible fractions. Chemosphere 2018, 190, 454–462. [Google Scholar] [CrossRef]
  52. VROM. Dutch Target and Intervention Values (the New Dutch List), Circular on Target Values and Intervention Values for Soil Remediation; The Ministry of Housing, Spatial Planning and the Environment: The Hague, The Netherlands, 2000. [Google Scholar]
  53. Soil Pollution Control Regulation. In SPCR Official Gazette No, 25831; Republic of Turkey, Ministry of Environment and Forestry: Ankara, Turkey, 2005.
  54. Wong, J.W.C.; Mak, N.K. Heavy Metal Pollution in Children Playgrounds in Hong Kong and Its Health Implications. Environ. Technol. 1997, 18, 109–115. [Google Scholar] [CrossRef]
  55. Charlesworth, S.; De Miguel, E.; Ordóñez, A. A review of the distribution of particulate trace elements in urban terrestrial environments and its application to considerations of risk. Environ. Geochem. Health 2011, 33, 103–123. [Google Scholar] [CrossRef] [Green Version]
  56. Kelepertzis, E.; Argyraki, A.; Chrastný, V.; Botsou, F.; Skordas, K.; Komárek, M.; Fouskas, A. Metal(loid) and isotopic tracing of Pb in soils, road and house dusts from the industrial area of Volos (central Greece). Sci. Total Environ. 2020, 725, 138300. [Google Scholar] [CrossRef]
  57. Thorpe, A.; Harrison, R.M. Sources and properties of non-exhaust particulate matter from road traffic: A review. Sci. Total Environ. 2008, 400, 270–282. [Google Scholar] [CrossRef]
  58. Bradl, H.B. Adsorption of heavy metal ions on soils and soils constituents. J. Colloid Interface Sci. 2004, 277, 1–18. [Google Scholar] [CrossRef]
  59. Sungur, A.; İşler, M. Geochemical fractionation, source identification and risk assessments for trace metals in agricultural soils adjacent to a city center (Çanakkale, NW Turkey). Environ. Earth Sci. 2021, 80, 1–12. [Google Scholar] [CrossRef]
  60. Gonnelli, C.; Renella, G. Chromium and Nickel. In Heavy Metals in Soils: Trace Metals and Metalloids in Soils and their Bioavailability; Alloway, B.J., Ed.; Springer: Dordrecht, The Netherlands, 2013; pp. 313–333. ISBN 978-94-007-4470-7. [Google Scholar]
  61. Rudnick, R.L.; Gao, S. 3.01-Composition of the Continental Crust. In Treatise on Geochemistry; Holland, H.D., Turekian, K.K., Eds.; Pergamon: Oxford, UK, 2003; pp. 1–64. ISBN 9780080437514. [Google Scholar] [CrossRef]
  62. Mentese, S.; Yayintas, O.T.; Bas, B.; İrkin, L.C.; Yilmaz, S.A. comparative view to heavy metal pollution in soil and rainwater in Çanakkale, Turkey. J. Chem. Metrol. 2021, 15, 88–101. [Google Scholar] [CrossRef]
  63. Arslan, H.; Baltaci, H.; Akkoyunlu, B.O.; Karanfil, S.; Tayanc, M. Wind speed variability and wind power potential over Turkey: Case studies for Çanakkale and İstanbul. Renew. Energy 2020, 145, 1020–1032. [Google Scholar] [CrossRef]
  64. Jadoon, S.; Muhammad, S.; Hilal, Z.; Ali, M.; Khan, S.; Khattak, N.U. Spatial distribution of potentially toxic elements in urban soils of Abbottabad city, (N Pakistan): Evaluation for potential risk. Microchem. J. 2020, 153, 104489. [Google Scholar] [CrossRef]
Figure 1. Location map of Çanakkale city in the homonymous province and the sampling site network (in a Sentinel 2-A multispectral image obtained on 10 August 2021 with a 10 m spatial resolution).
Sustainability 14 01145 g001
Figure 2. Plot of mean ± 1 std. deviation values of the <250 μm grain-size fraction of sand samples in the studied playgrounds.
Sustainability 14 01145 g002
Figure 3. Plots of mean ± 1 Std. deviation values of heavy metals in soil and sand samples.
Sustainability 14 01145 g003
Figure 4. Mean values of (a) Fe, (b) Cr, (c) Cu, (d) Mn, (e) Ni, (f) Pb, and (g) Zn in soil (circles) and sand (rectangles) samples of Çanakkale’s playgrounds.
Sustainability 14 01145 g004
Figure 5. Dendrogram of cluster analysis of the difference in heavy metal contents between soil and sand samples.
Sustainability 14 01145 g005
Table 1. Physicochemical properties of soil and sand in playgrounds.
SamplesParametersMeanStd. DeviationMinimumMaximumMedian
SoilClay (%)18.65.38.331.917.7
Silt (%)27.34.618.439.227.4
Fine sand (%)46.39.028.367.644.8
Coarse sand (%)8.13.61.816.57.7
pH7.20.26.97.67.2
EC (dS m−1)0.80.20.51.30.8
CaCO3 (%)8.33.92.919.87.5
SOM (%)3.91.61.69.13.8
SandVery coarse (%)17.48.53.93617.4
Coarse (%)24.28.212.84522.8
Medium (%)37.88.4175335.1
Fine (%)14.97.83.83012.9
Very fine (%)2.81.90.16.92.4
Silt and clay (%)2.91.20.86.62.8
Table 2. Heavy metals contents (in mg kg−1) of soil and sand in children’s playgrounds.
SamplesMetalsMeanStd. DeviationMinimumMaximumMedian
SoilCr21783421
Cu2813199225
Fe12,9014040575519,99013,403
Mn47515223275347
Ni21863620
Pb1816310214
Zn58212210256
SandCr17592916
Cu185104718
Fe11,9982280628816,77012,205
Mn25890149613245
Ni14492713
Pb11105598
Zn35351318126
Table 3. Literature data on soil quality criteria and heavy metal contents (in mg kg−1) of soil and sand in playgrounds.
TypeLocationCrCuFeMnNiPbZnRefs
Soil Quality CriteriaThe Netherlands 1100–38036–190 35–21085–530140–720[52]
Turkey100140 75300300[53]
Playground soilHong Kong (China)-201---3021517[54]
Istanbul (Turkey)45.859.8 -11.67.153[24]
Athens (Greece)79.943.417,000311.681.5110.3174.3[19]
Sarajevo (Bosnia and Herzegovina)40.324.2--26.233.673.2[5]
Biobio Region (Chile)21.139--20.917.182.5[6]
Beijing (China)54.743.418,64060033.736.6-[26]
Ordu (Turkey)35.943.8--21.125.4167.2[29]
Khagra (India)-999.418,988343.119.02180.81229[16]
Katowice (Poland) 8343 247166[30]
Playground sandTrondheim (Norway)4021--423237[14]
Lublin (Poland)177.811.4--13.63252.6[9]
Thessaloniki (Greece)14517.428,84372436.430.274.5[13]
Katowice (Poland) 499 32103[30]
1 Target—Intervention values.
Table 4. Factor analysis in soil and sand samples.
VariablesSoilSand
Factor 1Factor 2Factor 3Factor 1Factor 2Factor 3
Fe0.7670.498−0.2140.1520.0310.896
Cr0.2900.911−0.0830.0830.8800.147
Cu0.829−0.0710.149−0.0210.0400.913
Mn0.8160.240−0.4110.6170.2290.220
Ni0.2040.9350.0060.0920.925−0.075
Pb0.8990.203−0.1460.8490.0070.043
Zn0.8730.3250.0860.8240.2910.120
Fine sand 1−0.2680.4350.7250.836−0.134−0.123
SOM0.098−0.2730.856---
Eigenvalues4.6321.6791.3632.8411.6841.524
% of variance41.30326.95217.01331.46322.36421.785
% cumulative variance41.30368.25485.26731.46353.82775.612
1 Soil: 125–250 μm; Sand: <250 μm. High loadings are marked in bold.
Table 5. Average daily doses (ADD) of heavy metals, hazard indices (HI) for all heavy metals through ingestion (ing), inhalation (inh), and dermal contact (derm), and hazard index (HIT) for all heavy metals and exposure routes.
Sample TypeHeavy MetalsADD ingADD inhADD dermHI ingHI inhHI dermHIT
SoilCr1.7910 × 10−5110 × 10−95.0310 × 10−82.0710 × 10−21.6610 × 10−31.4310 × 10−32.3810 × 10⁻²
Cu2.410 × 10−51.3410 × 10−96.7110 × 10−8
Mn4.0610 × 10−42.2710 × 10−81.1410 × 10−6
Ni1.7710 × 10−59.8910 × 10−104.9610 × 10⁻⁸
Pb1.510 × 10−58.3810 × 10−104.210 × 10⁻⁸
Zn4.9510 × 10−52.7710 × 10−91.3910 × 10−7
SandCr1.4410 × 10−58.0510 × 10−104.0410 × 10−81.3310 × 10−29.1510 × 10−49.6710 × 10−41.5210 × 10⁻²
Cu1.5310 × 10−58.5510 × 10−104.2910 × 10⁻⁸
Mn2.210 × 10−41.2310 × 10−86.1710 × 10−7
Ni1.1910 × 10−56.6610 × 10−103.3410 × 10⁻⁸
Pb9.310 × 10−65.210 × 10−102.6110 × 10⁻⁸
Zn3.0310 × 10−51.6910 × 10−98.4810 × 10−8
Publisher’s Note: MDPI stays neutral with regard to jurisdictional claims in published maps and institutional affiliations.

