Article

Agricultural Biogas Production—Climate and Environmental Impacts

1
Department of Biological and Chemical Engineering, Aarhus University, Blichers Allé 20, 8830 Tjele, Denmark
2
Department of Agroecology, Aarhus University, Blichers Allé 20, 8830 Tjele, Denmark
3
Concito, Læderstræde 20, 1201 København, Denmark
*
Author to whom correspondence should be addressed.
Sustainability 2022, 14(3), 1849; https://doi.org/10.3390/su14031849
Submission received: 5 January 2022 / Revised: 1 February 2022 / Accepted: 3 February 2022 / Published: 6 February 2022
(This article belongs to the Special Issue Ecological Transition and Circular Economy)

Abstract

:
Livestock manure is a major source of the greenhouse gases (GHGs) methane (CH4) and nitrous oxide (N2O). The emissions can be mitigated by production of biogas through anaerobic digestion (AD) of manure, mostly together with other biowastes, which can substitute fossil energy and thereby reduce CO2 emissions and postdigestion GHG emissions. This paper presents GHG balances for manure and biowaste management as affected by AD for five Danish biogas scenarios in which pig and cattle slurry were codigested with one or more of the following biomasses: deep litter, straw, energy crops, slaughterhouse waste, grass–clover green manure, and household waste. The calculated effects of AD on the GHG balance of each scenario included fossil fuel substitution, energy use for transport, leakage of CH4 from biogas production plants, CH4 emissions during storage of animal manure and biowaste, N2O emissions from stored and field applied biomass, N2O emissions related to nitrate (NO3) leaching and ammonia (NH3) losses, N2O emissions from cultivation of energy crops, and soil C sequestration. All scenarios caused significant reductions in GHG emissions. Most of the reductions resulted from fossil fuel substitution and reduced emissions of CH4 during storage of codigestates. The total reductions in GHG emissions ranged from 65 to 105 kg CO2-eq ton−1 biomass. This wide range showed the importance of biomass composition. Reductions were highest when straw and grass–clover were used as codigestates, whereas reductions per unit energy produced were highest when deep litter or deep litter plus energy crops were used. Potential effects of iLUC were ignored but may have a negative impact on the GHG balance when using energy crops, and this may potentially exceed the calculated positive climate impacts of biogas production. The ammonia emission potential of digestate applied in the field is higher than that from cattle slurry and pig slurry because of the higher pH of the digestate. This effect, and the higher content of TAN in digestate, resulted in increasing ammonia emissions at 0.14 to 0.3 kg NH3-N ton−1 biomass. Nitrate leaching was reduced in all scenarios and ranged from 0.04 to 0.45 kg NO3-N ton−1 biomass. In the scenario in which maize silage was introduced, the maize production increased leaching and almost negated the effect of AD. Methane leakage caused a 7% reduction in the positive climate impact for each percentage point of leakage in a manure-based biogas scenario.

1. Introduction

Emissions of nitrous oxide (N2O) and methane (CH4) from livestock manure management contribute around 10% of the total non-CO2 greenhouse gas (GHG) emissions globally calculated as CO2 equivalents [1]. N2O and CH4 have global warming potentials for time horizons of 100 years (GWP100) of 298 and 25 times, respectively, higher than GWP100 per kg of carbon dioxide (CO2) [2]. Ammonia (NH3) emission and leaching losses of nitrate (NO3) are important indirect sources of N2O [3,4].
Globally, manure management contributes about 10% of agricultural CH4 emissions [5], but in confined livestock production systems (e.g., dairies and piggeries) with liquid manure management, this proportion can exceed 50% depending on climate [1]. Animal manure applied to soil contributes to maintenance of soil carbon (C) insofar as a fraction of the manure C is sequestered. The Danish Energy Agency has calculated that of the Danish GHG emissions from livestock production, manure management contributes 22%, manure and mineral fertilizers applied to soil contribute 39%, and enteric fermentation contributes 39% to total agricultural GHG emissions [6].
Emissions of CH4 and N2O are regulated and accounted under the UNFCCC as part of the Paris Agreement. The reduction target for the EU on GHG is 55% by 2030 with reference to the year 1990 [7]. The Danish parliament has decided that GHG emissions from Denmark must be reduced by 70% with reference to 1990 by 2030 [6], and agriculture must contribute to this reduction. This calls for the implementation of technologies that cost-effectively reduce GHG emissions from the livestock slurry management chain. Slurry is in focus because 80% of Danish livestock manures are managed in the form of slurries [8].
GHG emissions from slurry management systems can be reduced by AD treatment, frequent export of slurry from livestock buildings to colder outside stores, acidification, or separation of slurry combined with incineration [9,10,11,12,13].
In Denmark, more than 25% (weight basis) of animal manure is today anaerobically codigested on centralized biogas plants with organic wastes from the food industry, slaughterhouses, dairies, and the fish industry with the aim to produce CH4 for bioenergy. The residues from AD must be recycled as fertilizer and meet the requirements for content of pathogens, heavy metals, and environmentally harmful substances. Biogas plants use almost all industrial residues available in Denmark, and increasing amounts of straw, grass, deep litter, etc. are used in the codigestion of slurry.
The economy is critical when making decisions about the introduction of technologies in farming aiming to reduce GHG emissions, and socioeconomic impacts of different types of biomass for AD have been calculated [14,15]. In scenarios with codigestion of slurry with fibre fraction from slurry separation, maize silage, grass, and sugar beet, NO3 leaching was assessed, but the effects of the AD treatment on GHG emissions and NO3 leaching were not well documented [14]. More recently, a refined model of CH4 from manure management that accounted for different storage conditions was used to calculate the effects of biogas and frequent export of slurry from livestock housing to an outside storage tank [16]. However, no biomasses other than slurry were accounted for, nor were any other effects, such as energy and environmental impacts.
When assessing the effect of AD as a potential mitigation measure, a whole-farm approach is needed to estimate GHG emissions from the pig or dairy farm, and calculations must include evaluation of side effects in the form of increased NH3 emissions, reduced C sequestration, leakage of CH4 from the biogas plant, etc. [17]. It is relevant to improve estimates of the potential of AD to reduce the negative GHG balance of livestock farming. Therefore, in the present study, the effect of AD on the GHG gas balance was calculated using a “system analysis approach”, which included substituting CO2 emission from power and heat production using fossil fuel; leakage of CH4 from biogas production plants; CH4 emissions during storage of animal manure and organic waste; N2O emissions from stored and field applied manure, organic waste, and digestate; N2O emissions related to NO3 leaching and NH3 emission; N2O emission from cultivating energy crops; and effects on soil C sequestration (Figure 1).
This quantification of the climate and environmental effects of biogas production constitutes an important basis for designing and targeting future biogas subsidies to optimize the climate and environmental benefits of production. In this study, assessments are reported for five biomass scenarios in a Danish biogas context with different retention times and biomass compositions. The assessment was based on the best technologies currently used by the Danish biogas sector.

2. Materials and Methods

The calculated climate and environmental effects of introducing centralized codigestion AD in the livestock sector were compared with typical reference management of slurry and waste biomasses. Environmental impacts of introducing AD in five manure management systems (Figure 1; Table 1) were calculated with a whole-system calculation approach for each scenario using one ton of dry matter of biomass as the functional unit. The calculations included CH4 and N2O emissions from each scenario (AD and reference farm without AD), the effect on soil C storage, and AD effects on N2O emissions related to NO3 leaching and NH3 emission. GHG and environmental effects were calculated using the models applied in the Danish national inventory. Global warming potentials for a 100-year time horizon (GWP100) of CH4 and N2O at 25 and 298 CO2-eq kg−1, respectively, were used [18].

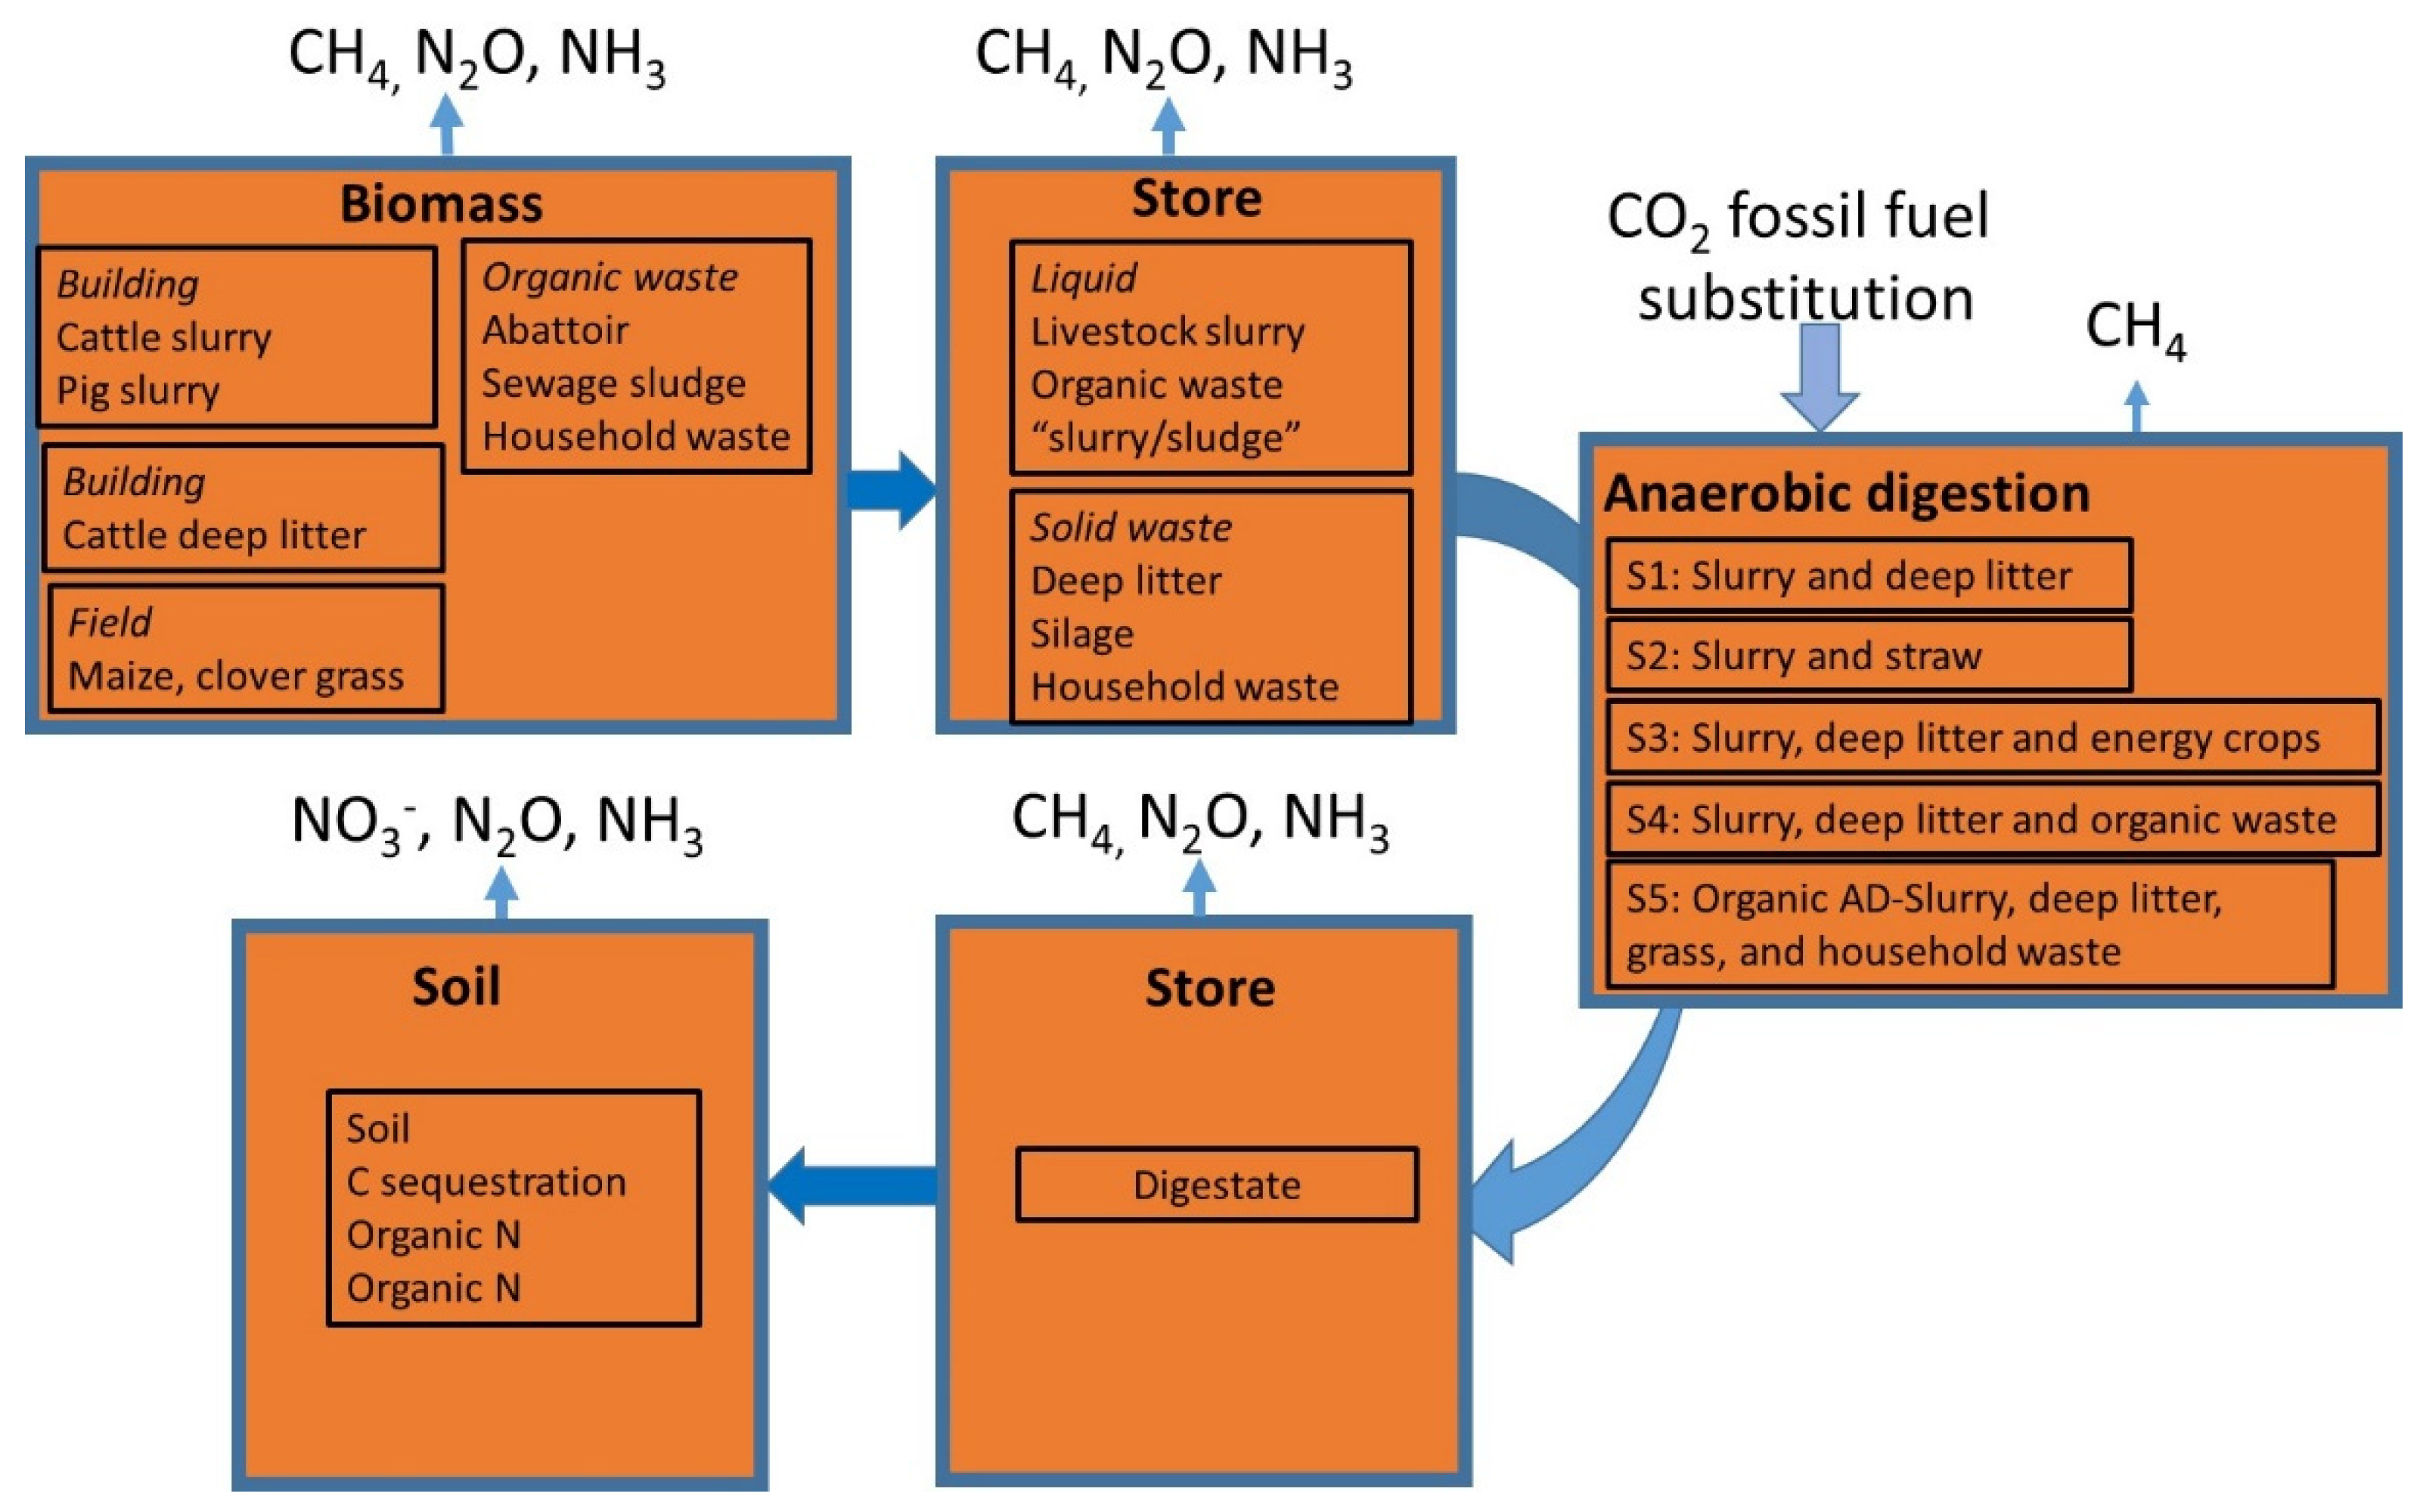
2.1. Slurry and Biowaste Management

In this study, the starting point was the collection of excreta and urine in slurry channels. The retention time was set at 20 days for cattle and 19 days for pigs [16], and the average slurry temperature was set at 13.8 °C for cattle and 18.6 °C for pigs. From the channels, slurry was transferred to an outside store and subsequently applied to grassland or arable land between March and August. In the outdoor storage tank, the temperature of untreated slurry was calculated based on monthly mean temperatures [16]. Untreated slurry and digestate must be stored according to national regulations to minimize ammonia emissions [19]. About 80% of untreated slurry was covered by a floating layer of natural crust, straw, or clay pebbles, and 20% was covered by a tent cover. Solid manure was stored for an average of 5 months in heaps covered by a PVC sheet. The deep litter in the reference system was covered with PVC and stored for an average of 5 months.
Slurries were applied by injection to bare soil and grassland and by trail hoses to autumn-sown crops such as winter cereals, whereas deep litter had to be incorporated within 4 h after application to soil.
In the reference system, slaughterhouse waste was stored together with livestock slurry and then spread on fields in the growing season. Glycerine was used for energy production by incineration, and source-separated household and industrial organic wastes were composted and used as fertilizer. The maize grown for codigestion in S3 was assumed to substitute a cereal crop in the reference system, and the grass–clover grown for codigestion in the organic farming scenario (S5) was assumed to be cut and mulched in the reference system.
In the AD concepts, liquid manure was transferred from livestock buildings to stores on the farm, as in the reference system (Figure 1). Every 3–30 d, the slurry in the outside store and slurry channels within the building were assumed to be emptied and transferred to stores on the AD plant and covered according to regulations. Deep litter was assumed to be transferred from the farms to biogas plants, where it was stored in covered heaps until used for biogas production. Straw was used for biogas production, and in the organic farm scenario, grass–clover crops were fed to the digester as silage. Organic waste in the form of abattoir waste was fed to the biogas reactors after storage in concrete stores similar to those used for animal slurry, and glycerine was assumed to be stored in containers until use. Source-separated household waste and industrial organic waste were assumed to be stored in covered heaps.
In the five scenarios examined in this study (Table 1), biomass was fed to centralized biogas plants with 45 d hydraulic retention times (HRT) in primary thermophilic reactors (53 °C) and an average retention time of 45 d. In newly built biogas plants in Denmark, HRT tends to be longer, and therefore, the calculations included scenarios with retention times of 60 and 90 days. Digestate was defined to be cooled by heat exchange to 25 °C and then stored at the plant for 20 d in a storage tank with CH4 gas collection. In all model plants, digestion took place by serial operation in two reactors with the same retention time in each unit, and the biogas was assumed to be upgraded and transferred to the natural gas distribution network by removal of CO2 in the biogas.
The digestate was transferred from the AD plant to farmer concrete stores, where 50% of the digestate was assumed to be covered with a tent and the rest by a floating cover, straw, or natural surface crust. The digestate was applied by injection to bare soil and grass crops (mandatory in Denmark) and by trail hoses to other growing crops.

2.2. Calculations

Greenhouse gases, NH3 emissions, and leaching of NO3 from different farm compartments in the reference and AD biomass management continuum are depicted in Figure 1. An overview of the calculation of biogas production, emissions, leaching, and soil C storage is given in the following. Short reviews about the algorithms used to calculate emissions, transformation, and leaching losses are presented in Supplementary Materials, which also contain tables with parameters for the algorithms and emission factors.

2.2.1. Biogas Production

The CH4 production from the different biomasses was estimated from our own experiments and other studies (Supplementary Materials, Table S1). The ultimate CH4 yield in terms of volatile solids (VS) is the yield achieved at a retention time of more than 90 days, and to determine the yield at shorter retention times, the CH4 produced in the biogas reactor was determined for each biomass through modelling using the Gompertz equation [20]. The gas potential at a given time was calculated as follows:
M ( t ) = B 0   · ( 1 e k · t )
where M is the cumulative CH4 yield (mL g−1 (VS)), B0 is the theoretical CH4 yield (mL g−1 (VS)), k is a first-order kinetic rate constant representing the hydrolysis constant, and t is retention time (days). The biogas production was calculated from this equation and thus determined by the amount and quality of biomasses and the retention time in the biogas reactor.

2.2.2. Energy Production and Consumption

The calculations of CO2 substitution from energy production were based on the displacement of natural gas, in which CH4 substituted CO2 corresponding to 0.057 kg CO2-eq MJ−1 [21]. The electricity demand for agitators, pumps, etc. at the plant was assumed to be covered by a mix of the Danish electricity production, which in 2019 was estimated at 0.150 g CO2 kWh−1, as calculated using data from [22]. The volume of biomass transported in one truckload to and from the biogas plant varied among the different biomass types, and diesel consumption was given per kilometre driven. The distances were calculated as the average additional transport of biomass compared to the reference scenario without AD and varied from 0.8 kg CO2-eq ton−1 for grass and maize silage to 11.6 kg CO2-eq ton−1 for glycerol. The effect on GHGs of replacing mineral N fertilizer due to higher N availability in the digestates was estimated by assuming that the long-term N availability equivalent of total N was 5% higher in the treated than in untreated manure [23]. The potential reduction in N fertilizer use was assumed to give a reduction in GHGs of 5.6 kg CO2 kg−1 N [24], equivalent to 0.28 kg CO2 kg−1 treated N in the biogas plant.

2.2.3. Methane Emission from Slurry and Digestate

Daily methane emissions from slurry and digestate during storage were estimated from the volumes of readily degradable (VSd, kg kg−1) and slowly degradable organic matter (VSnd, kg kg−1) as proposed by Sommer et al. [9]:
F t = ( V S d + 0.01 V S n d ) e ( l n A E α R T )
where Ft is the methane production rate (g CH4 kg−1 VS h−1), Eα is the process activation energy (J mol−1), lnA (g CH4 kg−1 VS h−1) represents the methanogenic potential of the substrate, R is the universal gas constant (J K−1 mol−1), and T is the temperature (K). Equation (1) assumes that the amount and degradability of biomass organic matter, and storage temperature, are main controlling variables.
Eα was set to 81,000 J mol−1 [25]. The parameter lnA was highly variable and depended on slurry origin, treatment, storage conditions, and age [4]. Petersen et al. [26] estimated lnA for slurry collected in pig and cattle barns by measuring CH4 production rates at the storage temperature and calculating lnA from Equation (1) after rearrangement:
l n A = l n [ F t ( V S d + 0.01 V S n d ) ] + E α R T
The degradability of VS in slurry changes during storage, and no data were available from outside storage tanks. Instead, a different approach was used in which lnA estimates were related to total VS:
l n A = l n [ F t V S t o t a l ] + E α R T
Note that the parameter value derived from total VS is referred to as lnA′ to distinguish from the original calculation of lnA with reference to degradable VS. A limited number of studies were identified for which information about storage temperature and VS content were available to allow estimation of lnA′ in pig and cattle slurry, as well as digestate (Supplementary Materials, Table S4). For the present study, the lnA of pig and cattle slurry in barns reported by Petersen et al. [26] were recalculated to lnA′; Table 2 summarizes the values used.
Methane emissions were calculated separately for cattle and pig slurry in barns and for untreated slurry, digestate, and other biomasses assumed to be stored in outside storage tanks. Assumptions regarding retention time, storage temperatures, etc. are given in Supplementary Materials.
After field application, manure environments are predominantly at a redox level at which little, if any, CH4 is produced. Transient emissions have sometimes been reported; these are probably due to release of dissolved methane produced during storage [30,31].

2.2.4. Methane Emission from Solid Manure

Methane may be emitted from solid manure (deep litter, fibre fraction from separated slurry or digestate) during storage. The emission level is determined by VS degradability, air- and water-filled porosity, and coverage, which in turn determine biological oxygen demand, gas exchange rates, temperature, and anaerobic volume developing during storage. The Danish emission inventory estimates this source with a model proposed in [4]:
E F = B M P M C F 0.67
where EF (kg CH4 kg−1(VS)) is the CH4 emission factor, BMP (m3 CH4 kg−1(VS)) is the biochemical methane production potential, and MCF (%) is a country-specific CH4 conversion factor. For deep litter, an MCF of 3% is assumed if manure is exported at 1-month intervals or less, and an MCF of 17% is assumed if manure is removed at longer intervals. With a BMP of 0.24 m3 kg−1(VS), the overall CH4 emission from barns and during outside storage were as shown in Table 3.
We assumed that half of these emissions would come from outside stores, corresponding to 0.005 and 0.027 kg CH4 kg−1(VS) for short- and long-term storage periods, respectively (Table 3). Recent studies have shown that emission of CH4 from uncovered and uncompacted manure heaps are at a level of 0.027 kg CH4 kg−1(VS) [32,33,34], and we therefore assumed that the emission factor was 0.03 kg CH4 kg−1(VS) for uncovered manure heaps and half as much for heaps with PVC tent covers (i.e., 0.015 kg CH4 kg−1(VS)) (Table 3) [34].
In organic farming, animal manure is often actively composted by turning the heap. This reduces the development of anaerobic volumes in the heap and contributes to lower CH4 emission compared to undisturbed heaps. Based on a CH4 emission from actively composted organic waste corresponding to 3% C [32], and assuming the same C/VS ratio in organic waste and deep litter, CH4 emissions from deep litter were estimated (Table 3).

2.2.5. Nitrous Oxide Emission

Nitrous oxide may be emitted from slurry and digestate, as well as solid manure, during storage and after field application. Nitrous oxide emissions are associated with nitrification and denitrification, two interdependent processes occurring under aerobic and anaerobic conditions, respectively. Oxic–anoxic gradients occur in slurry storages with surface crusts and in the outer layers of manure heaps.
Nitrous oxide emissions during storage of slurry or digestate depend on the development of a floating crust where populations of nitrifying and denitrifying bacteria live. The IPCC guidelines give a default emission factor for storage tanks with a surface crust of 0.5%, i.e., 0.5% of total N entering the storage tank is converted to N2O [4]. Danish pilot-scale measurements indicated lower emissions, 0.2–0.4% [35], but the level of emissions is influenced by climatic conditions, especially the water balance (rain and evaporation). The emission factor of 0.5% of N in the total flow of slurry was used here even though only the surface can be a source of N2O. Without a surface crust, the emission factor for N2O was set to 0 for both untreated slurry and digestate.
For cattle deep litter, IPCC [4] recommends a N2O emission factor for barn and storage of 1% regardless of retention time in the barn. Assuming half of these emissions occur during outdoor storage, this effectively corresponded to 0.5% of total N. In a review by Pardo et al. [32], N2O-N emissions from compost heaps with organic waste corresponded to 2.2% of total N (Table 3).
The default emission factor for nitrous oxide emissions from N in field-applied liquid and solid manure is 1% [4]. In soil with organic amendments, be they manure, digestate, or crop residues, the balance between oxygen (O2) demand and O2 supply is an important control of denitrification and N2O emissions [36]. While anaerobic digestion reduces the availability of degradable VS, and hence O2 demand, the net effect on N2O emissions depends on the interaction with specific soil conditions. A review of field studies [37] reported mostly reductions in N2O emissions with AD, but increases have also been reported. In the present study, no effect of anaerobic digestion on N2O emissions was assumed. Nitrous oxide emissions related to NH3 emissions and nitrate (NO3) leaching were accounted for with emission factors of 1% and 0.75%, respectively, in accordance with the national inventory of Denmark [18].

2.2.6. Ammonia Emission

The emissions of NH3 from slurry storage tanks and solid manure heaps were calculated using emission factors estimated by [38]. These were within the ranges given in the recent review by Kupper et al. [39]. The NH3 emission factor for composting of source separated organic waste was taken from the review by Pardo et al. [32]. When deposited, the emitted NH3 contributes to N2O emissions [4], and this indirect source of N2O was included in the calculations. Ammonia emission factors for applied livestock liquid manure given by [38] were used in this study, while emission factors for each month were calculated with the ALFAM model [40] using average monthly weather conditions and average slurry compositions for Denmark. Based on a review of recent studies, we assumed that NH3 emission from digestate would be higher than emission from untreated slurry (Supplementary Materials, Table S6).
Data from studies on emissions of NH3 from deep litter applied to soil were limited in 2008 [38], and only one emission factor for application during different months was given. The evidence about the effects of climatic conditions on emission of NH3 from solid manure applied to soil is still limited, and emission factors cannot be assessed at a monthly scale [41]. We therefore used the same emission factor for applied deep litter regardless of whether the application took place in the spring or autumn. Deep litter must, in Denmark, be incorporated into the soil within 4 h of application, and it was assumed that within this timespan, 25% of total ammoniacal N (TAN) was emitted as NH3.

2.2.7. Crop Production and Nitrate Leaching

AD processing of animal slurry and biowaste affects NO3 leaching from crop production in both direct and indirect ways. The direct effects are through the effects of applied N in both the first and following year after application of fertilizer or manure; here, AD affects the quality and quantity of N applied. The indirect effects of AD on NO3 leaching occur through AD effects on NH3 volatilization, which affects the N available for plants through both the N loss and the deposited N.
Nitrate leaching during the first year after fertilizer or manure application was assumed to be proportional to the amount of total N (mineral N + organic N) applied [23,42,43]. Total N application was assumed to be similar before and after AD, in accordance with Danish fertilizer regulations, despite more N being plant available after AD. This means that more N is taken up in the first crop and less organic N is left in the soil from digestates. In the scenario with an energy crop (S3), total N application increased by AD, as the energy crop contributed with extra organic N to the system, and the N derived from the energy crop was assumed to replace only mineral N fertilizers with an efficiency of 40% as in the Danish legislation. In the other scenarios, total N application remained the same before and after digestion.
The effect of AD on NO3 leaching over a 10-year period was calculated using a model based on the principles described by Sørensen et al. [23]. It was assumed that about 40% of the organic N input would be mineralized during years 2–10 after application, and that 34% of the mineralized N would be leached as nitrate [23]. Because of the lower N mineralization after AD, NO3 leaching was also slightly reduced after digestion. The model uses information on soil and climatic conditions, and it was assumed that 80% of the manures were used on sandy soils with precipitation above average Danish levels [44].
The direct and indirect effects of increased NH3 volatilization after AD on NO3 leaching were calculated separately. It was assumed that increased NH3 emission caused a net reduction in NO3 leaching [8] as estimated with the following assumptions. The empirical NLES5 model estimates an average marginal leaching of 17% during the first three years after mineral N application in spring under Danish conditions and at N rates near the economic optimum [44]. In Denmark, 80% of livestock manure is applied to sandy soils [45] with higher-than-average marginal leaching, and therefore, 20% of NH4+-N in applied manure/digestate was assumed to be lost by leaching over a 3-year time period. Furthermore, NH4+-N applied to soil contributes to organic N from plant residues that may give an extra NO3 N leaching equivalent to 2% of the N input in years 3–10 after application [8]. The total reduction in NO3 N leaching from NH4+-N was therefore 22% of the increase in NH4+-N volatilization loss over a 10-year period. However, part of the lost NH3 would be deposited on agricultural land where part of that pool is leached. It was estimated that 10% the NH4+-N lost by volatilization was land deposited and leached as nitrate [8]. Thus, the net effect of increased NH3 loss on reduction in NO3 N leaching was set to 22% − 10% =12% of the increase in NH3-N loss over a 10-year period. This factor was used to calculate the leaching reduction due to increased ammonia volatilization.

2.2.8. Soil Carbon Storage

The effect of biogas treatment of slurry and other livestock manure on soil C storage is still relatively poorly quantified, but a study based on laboratory incubations measured slightly smaller soil C storage in connection with AD treatment [46]. Based on Thomsen et al. [46], the amount of C digested in the biogas plant was assumed to have contributed to C storage by 25% of the effect achieved when adding C in fresh plant material and straw, i.e., 0.25 × 15% = 3.75% of the C transformed to CO2 and CH4 in biogas during the digestion process would alternatively have been stored after a 20-year period, assuming retention in the soil of 15% of the C added in plant material over 20 years [46].

3. Results

3.1. Biogas Production

The largest biogas production was achieved in the scenarios in which slurry was codigested with straw or grass, which were the scenarios with largest energy output. In the energy balances showing reduced CO2-eq emissions, it was assumed that the CH4 produced substituted natural gas (Figure 2). Power is used in biogas plants for heating, pumping, and mixing, which reduces the net energy production, but most Danish biogas plants limit the energy consumption using heat exchangers, reducing the digestate temperature to 25 °C. Without heat exchange, the digestate would be stored at higher temperatures and be a significant source of CH4 emissions. In the calculations, the use of heat exchangers reduced the need for process heat and thereby enhanced the CO2 balance by around 10% (Figure 2).
The use of diesel for transport of biomass had little influence on GHG balances (Figure 2 and Figure 3) in the biogas plants and constituted less than 3% of the energy produced.

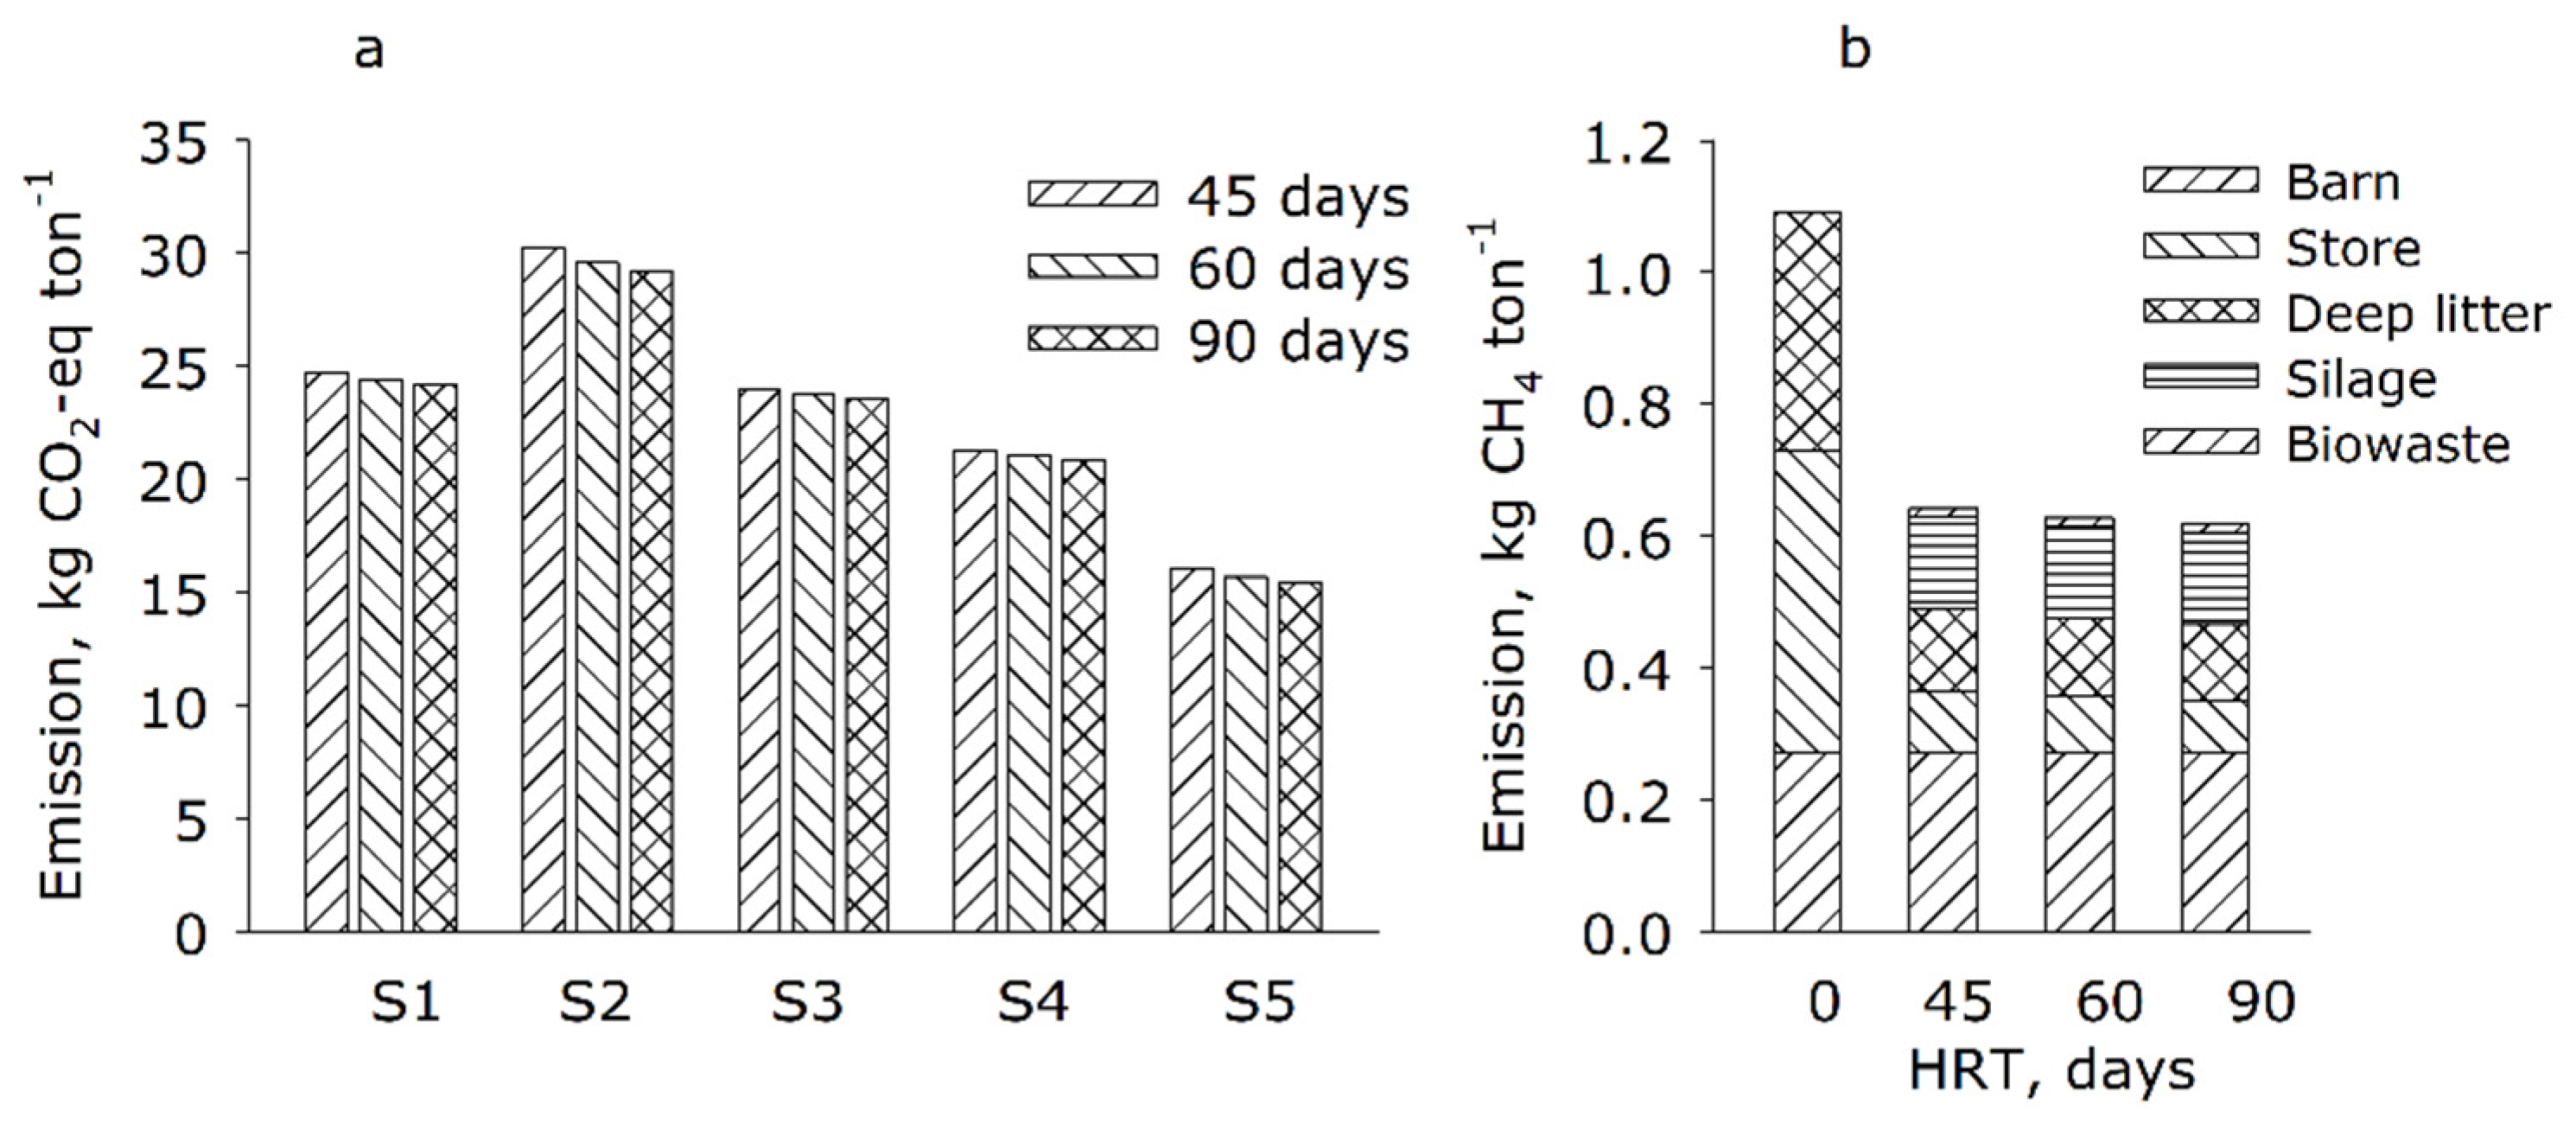
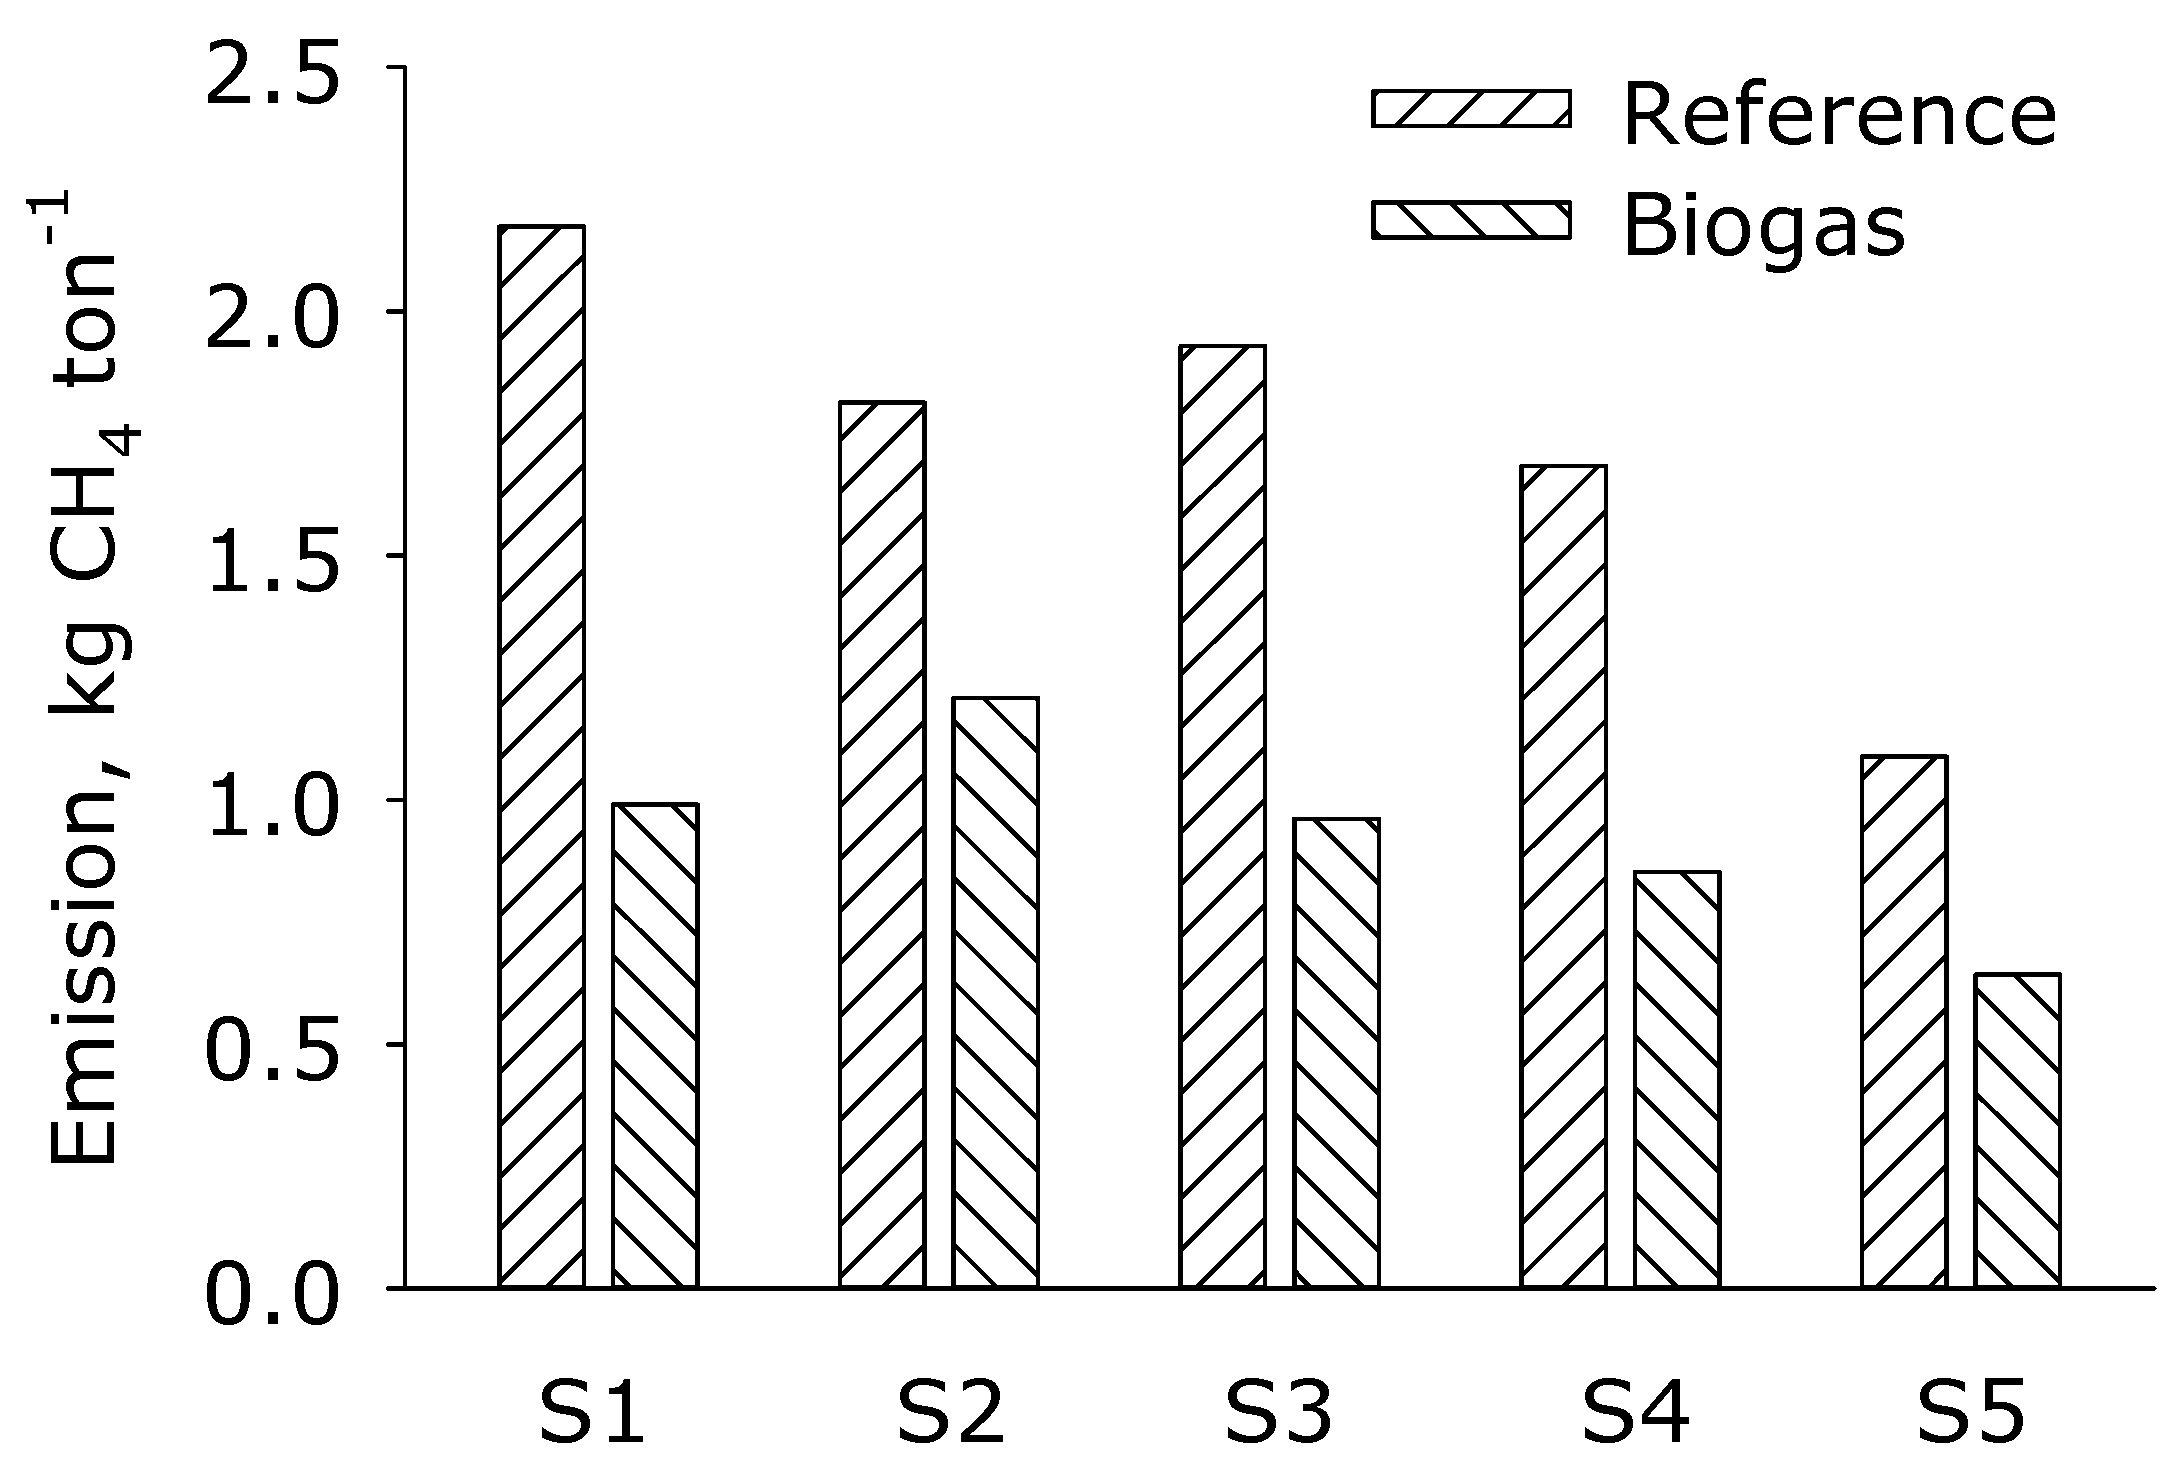
3.2. Methane Emissions

Whereas experimental data were available for the estimation of daily CH4 emissions from cattle and pig slurry in barns, parameters representing the methanogenic potential during storage had to be extracted from published storage experiments. The lnA′ values (Table 2) indicated that the methanogenic potential in stored digestate was around 70% lower than that in cattle slurry and 90% lower than that in pig slurry. This was in accordance with the assumption that anaerobic digestion would remove 90% of the degradable VS. With these differences in methanogenic potential, the five biogas scenarios showed reductions in CH4 emissions from barns and subsequent outside storage that varied between 41 and 56% (Figure 4).
In the model calculations, the relationship between VS degradation and CH4 production depended on assumptions regarding the proportions of C in VS converted to CH4 and CO2, a ratio that is subject to large uncertainty (cf. Supplementary Materials). In the scenario calculations, the CH4/CO2 ratio was set at 25:75 for untreated slurry and codigestates stored anaerobically and 10:90 for digestates. The importance of these ratios was evaluated in a sensitivity analysis calculating the effects of reducing by half, or doubling, the share of CH4 produced in pig and cattle slurry (Table 4). Untreated pig slurry was sensitive to the assumption regarding CH4 share, with 21% lower CH4 emissions if the assumed CH4 share was reduced by half and 17% higher emissions if the assumed CH4 share was doubled. All other relative changes were negligible. Experimental data on CH4 emissions from slurry and digestate were the reference for model calculations, and as a consequence, a lower or higher CH4/CO2 ratio would lead to less or more residual VS, respectively, being exported and available as substrate for CH4 emissions from the outside storage. The limited effect of changing the CH4/CO2 ratio for digested slurry was due to the fact that pretreatment emissions in barns were identical, and the CH4 emissions following biogas treatment were greatly reduced.
For each scenario, the CH4 emissions were calculated using 45, 60, and 90 days of HRT in the reactor, which may affect the predicted CH4 emissions during subsequent storage of the digestate. This is exemplified in Figure 5b, which shows the sources of CH4 for scenario S5 (organic biogas) with cattle slurry, deep litter, grass–clover silage, and biowaste, as well as CH4 emissions without treatment (HRT 0 d) for reference. It was mainly the emission of CH4 from cattle slurry that was affected by increasing HRT, the emission being 16% less at 90 than at 45 days HRT. The reduction for deep litter was 5–6%, and the changes for grass silage and biowaste were <1%.
The total CH4 emissions for scenarios with HRT at 45, 60, or 90 d, expressed as CO2 equivalents, are shown in Figure 5a. All scenarios showed the same trend, with 2–3% lower GHG emission at 90 than at 45 d HRT.
Overall GHG balances were calculated for biogenic CH4 and N2O emissions from barns and outside storage, and after field application (Figure 6). While biogas treatment gave a substantial reduction in CH4 emissions, ranging from 41% to 56%, as described above, no effect on N2O emissions was assumed, and N2O emissions are therefore directly proportional to the N content of the biomasses used in each scenario, which were identical in reference and biogas scenarios. As a result, the overall GHG balances corresponded to reductions through biogas treatment ranging between 21% and 40%.

3.3. Ammonia Emission

The digestion of animal slurry, crops, and biowaste increases emission of NH3 because of the higher emission potential of digestate due to its higher pH and TAN to N ratio. Consequently, AD increased NH3 emission in all five scenarios. The highest increases were in scenarios S3 and S5, in which slurry was codigested with maize silage and grass–clover, which increased the N content in the digestate. This was, in the scenarios with deep litter, to some extent counteracted by reduced emissions from the solid manure management, as emissions were lower from the fraction of digested solid manure than from the solid manure managed in the reference scenarios (Table 5).

3.4. Crop Production and Nitrate Leaching

The change in NO3 leaching by implementing AD was estimated for a mixture of the most common crops in Denmark and calculated with and without the inclusion of NH3 emission after digestion. The increase in NH3 emission reduced NO3 leaching by only 0.02–0.04 kg NO3-N ton−1 (biomass) (data not shown). In the reference scenario, slaughterhouse waste was assumed to be applied to crops as untreated biofertilizer hygienized and mixed with slurry. The source-separated organic household waste would in the reference system be composted and applied to a spring-sown crop as an alternative to digestion. The reduction in NO3 leaching by AD was 0.04–0.45 kg NO3-N ton−1 (biomass), with the lowest reduction in the scenario with an energy crop (S3) and the largest in the organic system with digestion of a grass–clover green manure crop that would alternatively be cut and mulched in the field (S5). The reduction in NO3 leaching was lowest in S3 because the overall input of N increased in this scenario. We did not include the effect of a crop change to maize in the leaching effect because of the uncertainty of which crop was being replaced by maize, although it was expected to be mainly cereals. Nitrate leaching is higher from maize than from most other crops [44], and if this effect had been accounted for, or if a higher proportion of maize had been applied in S3, then an increase in NO3 leaching would be expected by AD [47].

3.5. Soil Carbon Storage
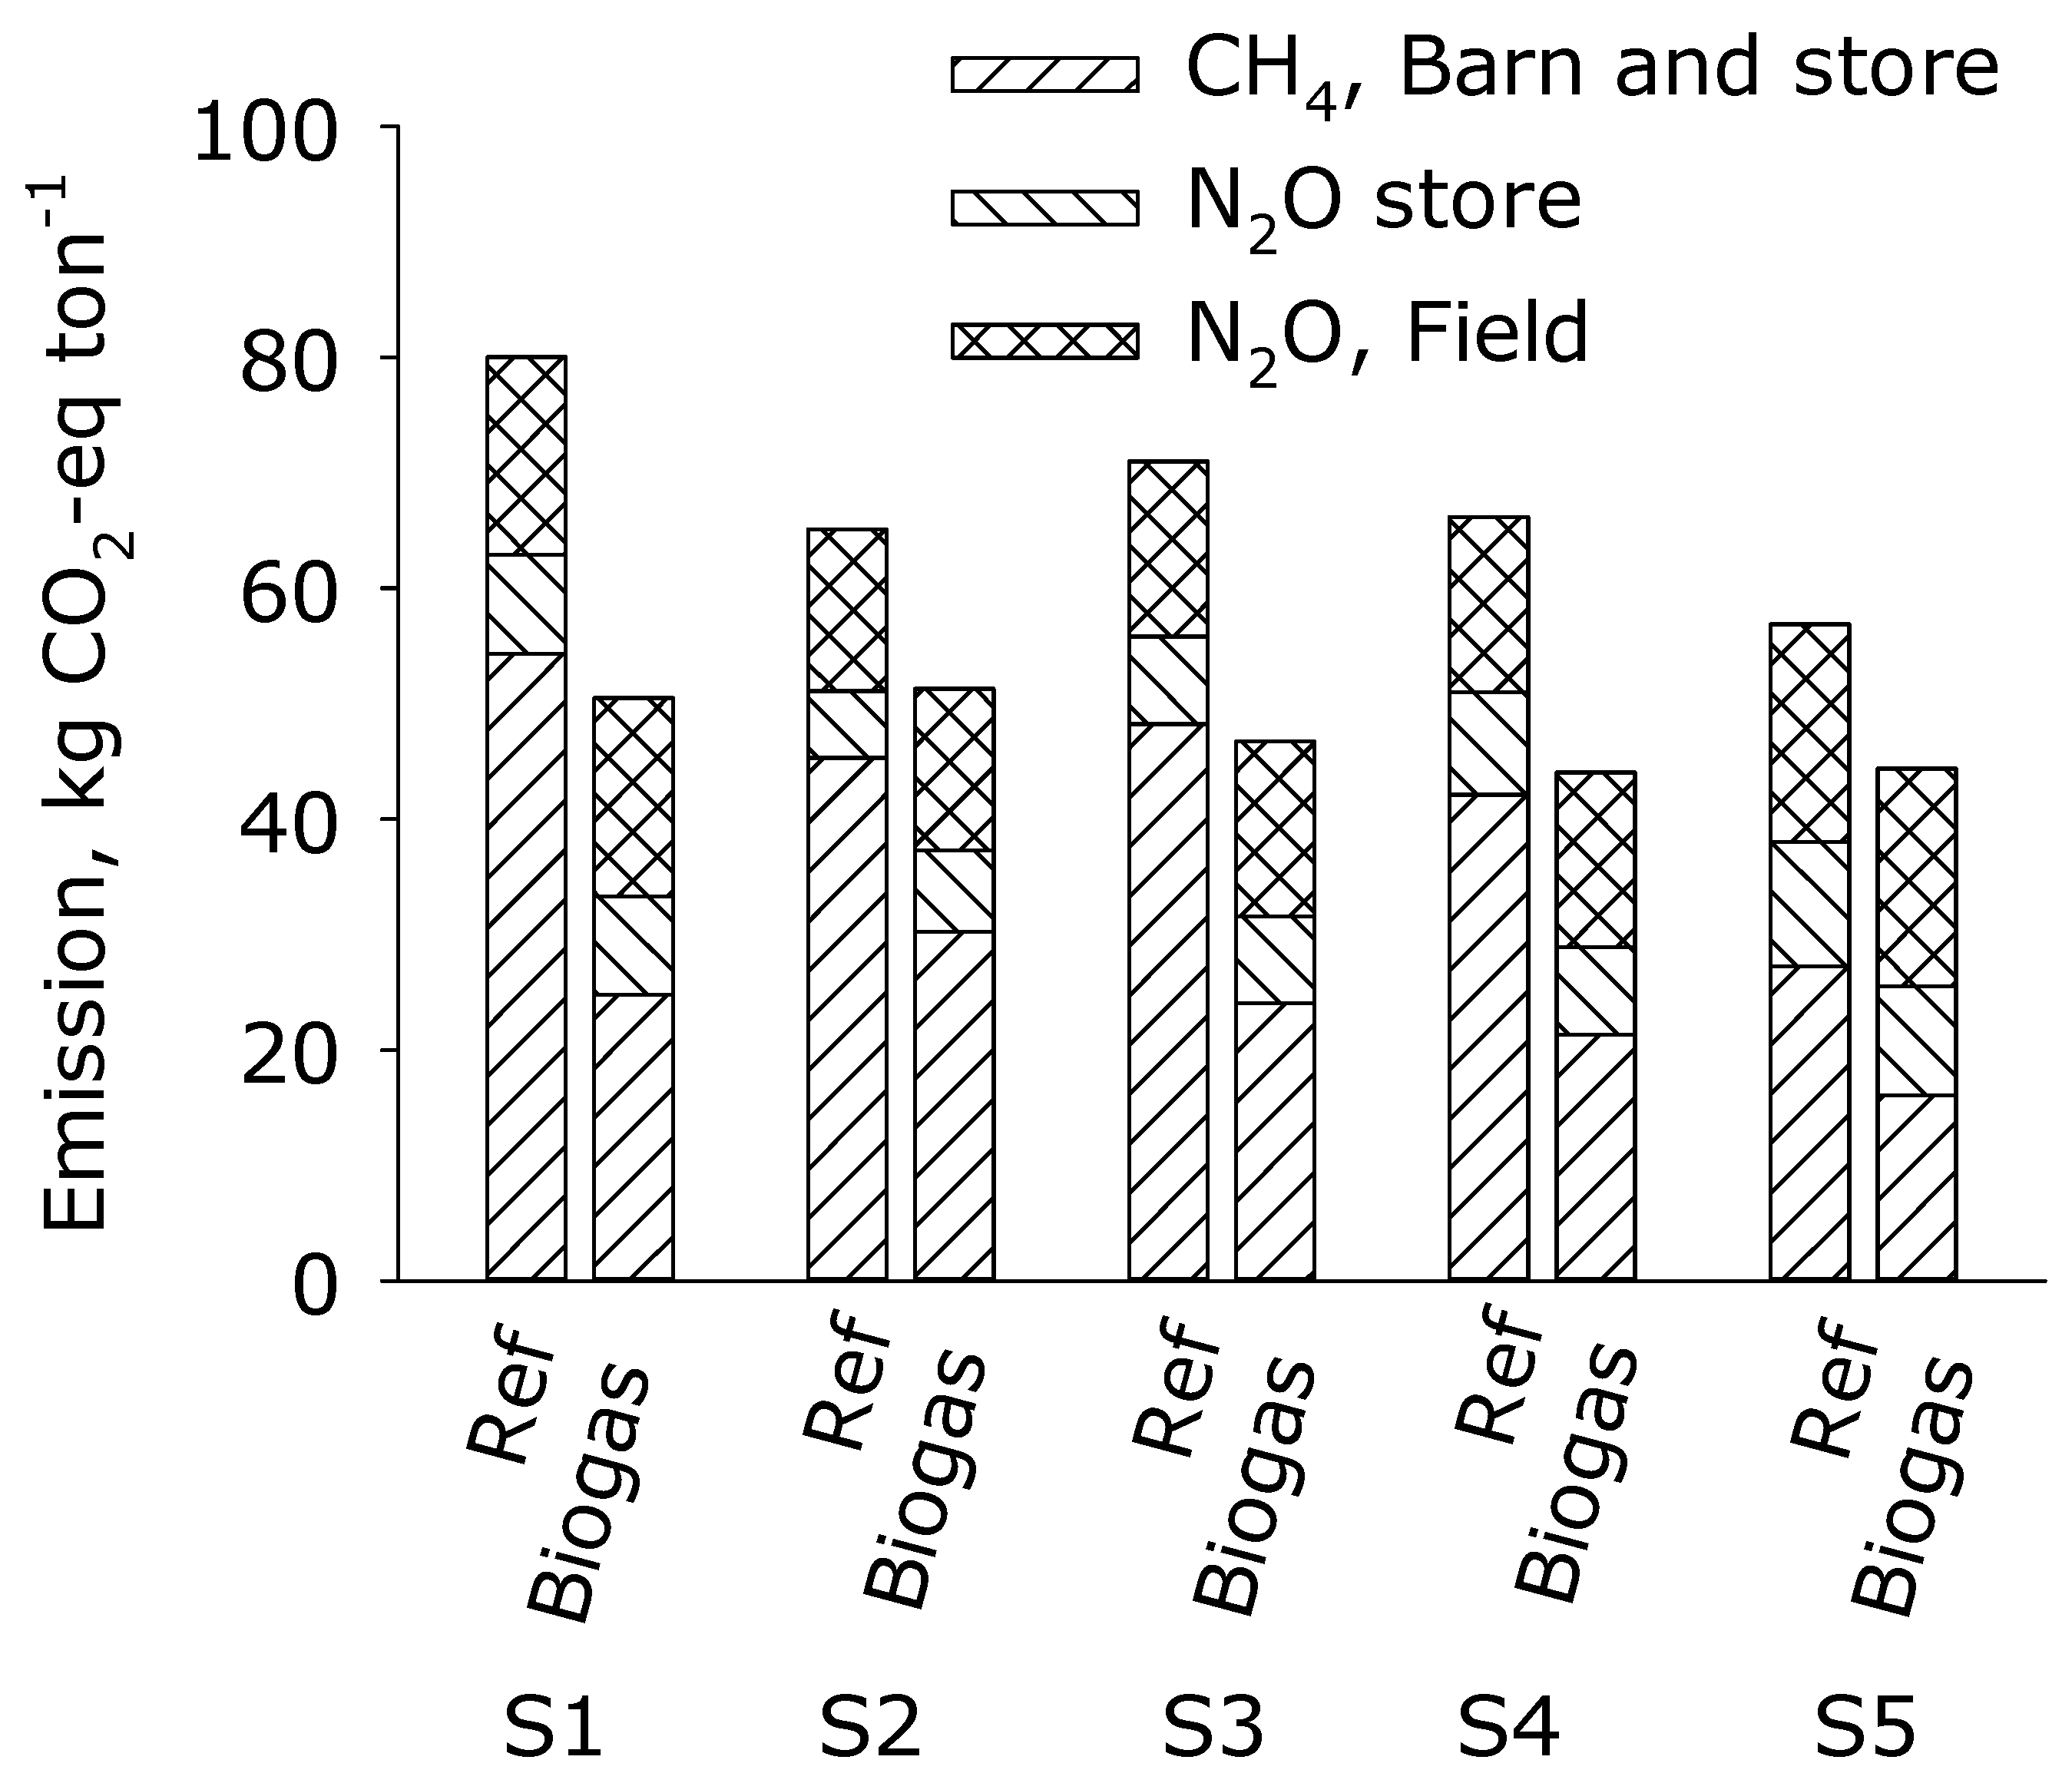
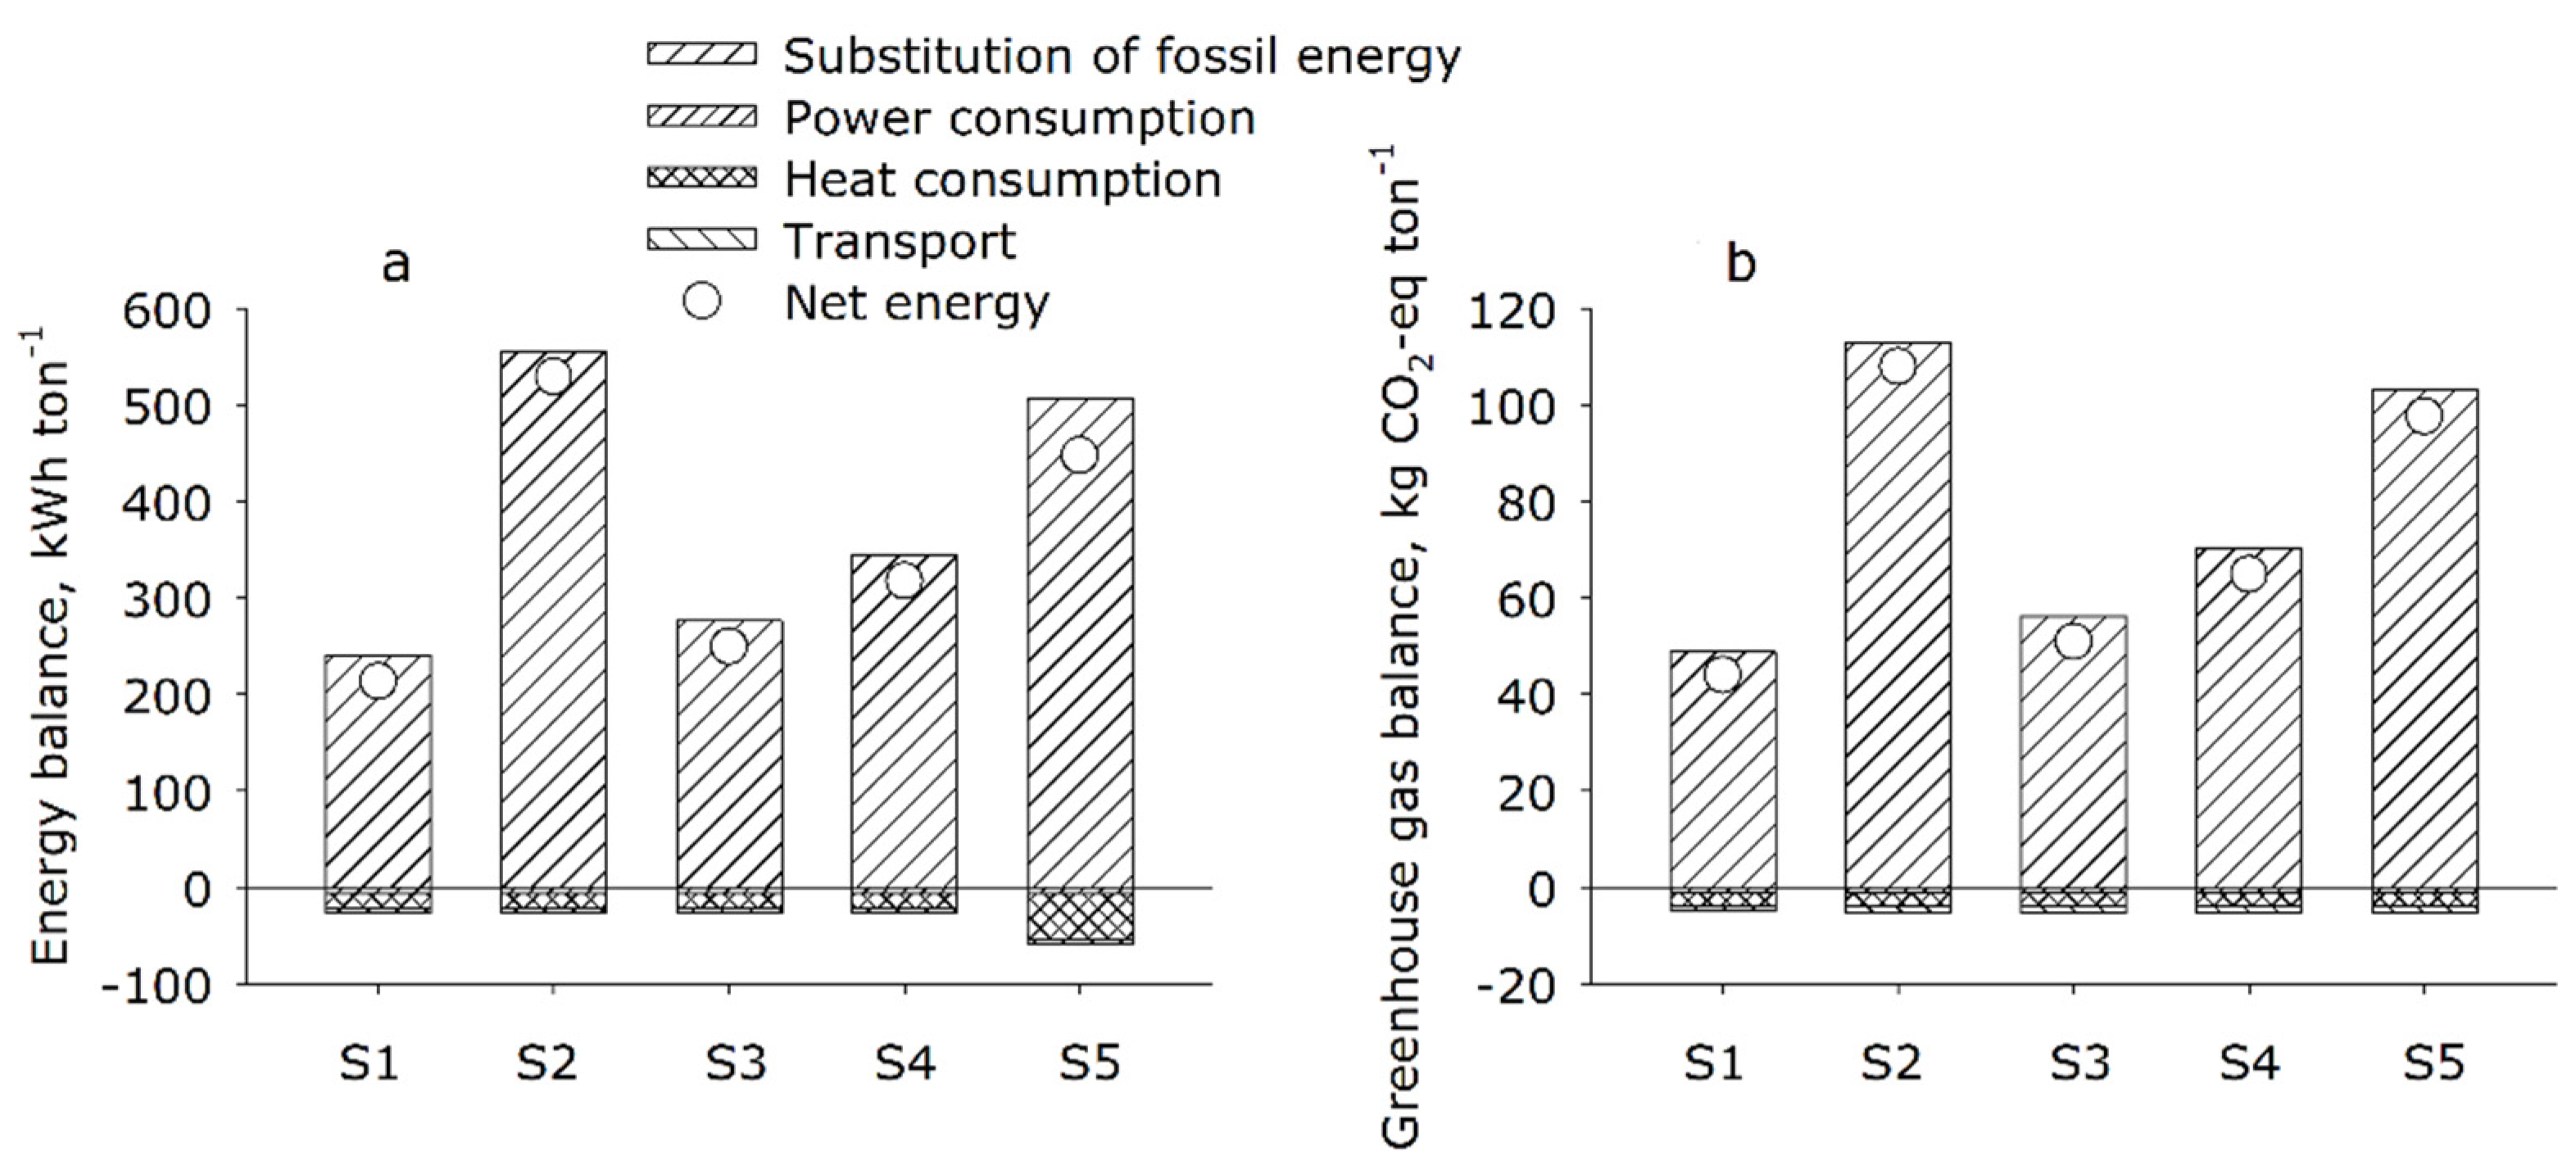
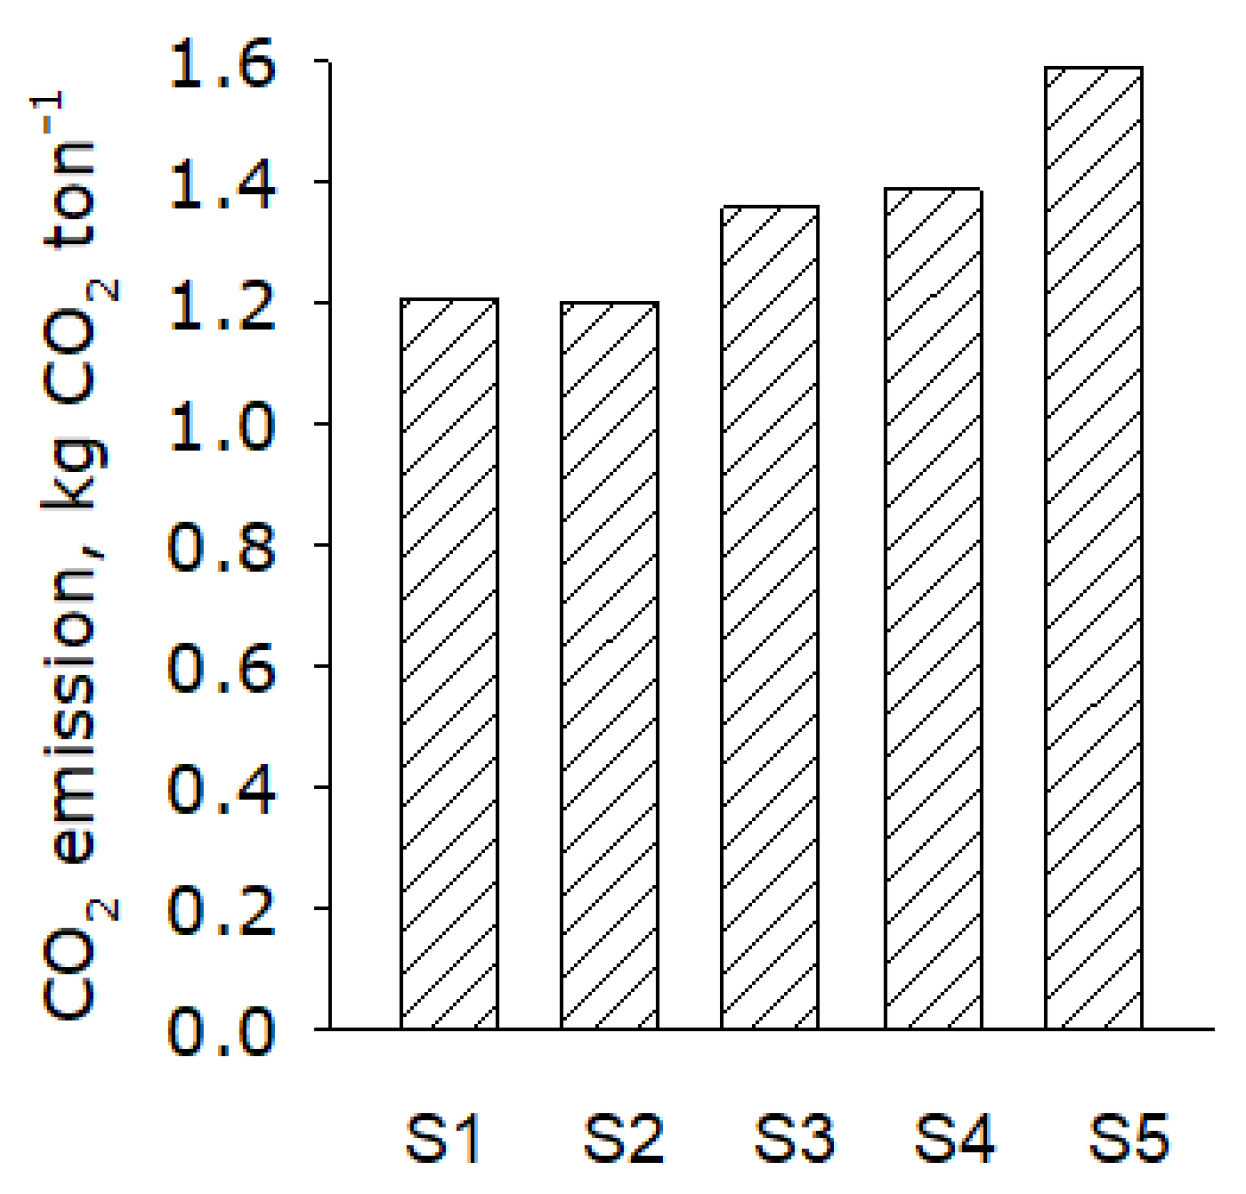
For the scenario including straw as a cosubstrate, the alternative was assumed to be incorporation of straw into the soil. For one ton of straw with a dry matter content of 85%, and 45% C in the dry matter, this corresponded to reduced soil C storage of 7.7 kg C, equal to 28.1 kg CO2-eq. It was assumed that substituting cereals for silage maize would not affect soil C storage [48] and that changes from mulching grass–clover to a cutting regime with return of the digestate would also have little effect [49].

3.6. GHG Emissions

Introducing AD in the five different scenarios reduced the net GHG emissions of livestock farming by 67–111 kg CO2-eq ton−1 of biomass at 60 d HRT (Table 6). The corresponding effect in terms of DM was 479–613 kg CO2-eq ton−1 DM. Most of this reduction was ascribed to substitution of fossil energy in energy production and avoided CH4 emission during storage of biomass. The difference in biogas production in the five scenarios was due to the different amounts of dry matter and biogas potentials in the substrates supplied to the plants.
The biogas plants in scenarios S2 and S5 were supplied with biomasses with high dry matter concentrations, which contributed to a high amount of energy produced per ton of biomass and thus a considerable GHG reduction. If the comparison were to be made independently of these differences in dry matter content, the assessment should be based on the GHG effect per GJ or dry matter input. For example, scenario S2 with straw had a significantly higher GHG effect per ton of biomass than S1 with deep litter. The reason is that considerably more dry matter was supplied in the straw scenario. If the same amount of dry matter had been supplied in the straw scenario as in the deep litter scenario, then the straw scenario would have had a lower GHG effect. This was reflected in the lower GHG effect per GJ of straw than of deep litter. The model plant with the greatest GHG reduction per ton of biomass was the scenario in which 20% straw was added (S2). However, this was also the scenario with the lowest GHG effect in terms of dry matter.

4. Discussion

The analysis presented here showed that anaerobic codigestion of slurry with biowaste, crop residues, and crops primarily reduced GHG emissions by substituting fossil fuel for power and heat production and reducing CH4 emission during postdigestion storage. The main environmental benefits from biogas energy systems compared to fossil fuel energy systems occurred in terms of reduced GHG emissions and reduced resource consumption [50]. The impact of utilizing animal manure for biogas production is important in this respect, since avoided emissions from the reference system of conventional manure management could be credited to the biogas system [50], which was not the case for energy crops and straw that would not be sources of GHGs in a non-AD scenario.
In our study, AD was assumed not to affect N2O emissions, in contrast to calculations presented in a previous study by Sommer et al. [9], in which the removal of degradable organic matter during AD was assumed to reduce N2O emissions from digestate applied to soil by reducing the potential for denitrification. However, experimental results on this aspect have conflicted [37], and recent studies have made it clear that the amount and composition of denitrification products depend on complex interactions between digestate and soil properties. Thus, accounting for the effect of AD on N2O emissions would probably require considering the composition of residual VS in digestates, as modified by codigestates and soil gas exchange controlling the exchange of oxygen and denitrification products [51]. The consideration of specific site and weather conditions was beyond the scope of this study, but this should be investigated further.
In our study, the total impact on GHG was 67–111 kg CO2-eq ton−1 of biomass at 60 d HRT, which demonstrates that the biomass mix played an important role. In a study by Poeschl et al. [52] the GHG impact was 75 kg CO2-eq ton−1 for a small-scale plant and 120 kg CO2-eq ton−1 for a large-scale plant. In this study, liquid manure accounted for 55% in the small-scale plant, while in the large-scale plant, only wastes from industry and household were included [53]. Including corn silage had a high positive GHG impact, while grass silage had a negative GHG impact. This was in contrast to our study, in which the scenario with maize had the lowest GHG impact while the scenario with glass–clover had significantly higher impact. However, in a study by Hijazi et al. [50], nonleguminous perennial grass was used. In organic farming, leguminous perennial grass is used as a source for N fertilizer because of its ability to fix atmospheric N [53]. This type of grass might be better than nonleguminous perennial grass in terms of the savings of direct N2O emission from N input in the form of mineral or organic fertilizers [53].

4.1. Biomass Sources for Biogas

The GHG impacts calculated in our study were based on a Danish territorial perspective; in general, only impacts on Danish national GHG emissions were included. However, the production of commercial N fertilizer was taken into account with a minor climate impact corresponding to 0.28 kg CO2-eq per kg biomass N, or about 1.5 kg CO2-eq per ton of biomass. The fertilizer replacement value of biomass is increased after digestion. However, Danish legislation with quotas on mineral N fertilizer application does not account for this, and it is uncertain whether farmers take the higher N availability into account. Therefore, this effect is uncertain in practice but has potential to be utilized. Since there is no fertilizer production in Denmark, such emissions are not included in Denmark’s national GHG inventory and therefore were not considered. Neither were the possible effects of changed land use elsewhere on the planet (iLUC) considered. This was relevant only for scenario S2, in which the cultivation of maize as an energy crop was set to replace the production of cereals and could, thus, potentially have iLUC impacts. The iLUC impacts are uncertain, but they may potentially exceed the calculated positive climate impacts of biogas production [53]. In the inventory of biofuels under the EU’s Renewable Energy Directive (RED), iLUC impacts are included, although they are not included in the EU requirements for compliance with the RED II [54]. For maize for biogas production, the iLUC impact in a RED context was most recently calculated as 21 kg CO2-eq MJ−1 [55].
Besides livestock manure, the model plants used different types of biomasses from the agricultural sector. Addition of 20% straw to the slurry (S2) gave the largest GHG reduction per ton, but the smallest reduction in terms of DM. The Danish biogas sector is considered a cornerstone in Danish green energy production, and there is increasing demand for more biomass for codigestion with slurry. While there is plenty of unused straw available as cosubstrate, the amount of straw added in scenario S2 cannot be managed with existing biogas technology because of problems related to pumping and agitating the biomass. However, the Danish biogas industry has projected that future technologies in form of pretreatment, pumps, and agitators will be able to manage this amount of dry matter. The calculations in this report assumed that the alternative to the use of straw for biogas was incorporation in the field. If the alternative had been incineration for combined heat and power, the climate impact would have been considerably lower. On the other hand, biogas from straw has the advantage that plant nutrients and part of the slowly degradable C in the straw is returned to the field.
Substituting some of the deep litter (S1) with maize silage (S3) improved the GHG emission reduction per ton slightly. The high degradability of the organic matter in maize contributes to high biogas production per ton of biomass, and energy production was therefore higher for S3 than for S1. In a study from 2013 [14], the GHG emission by codigestion of slurry and 10% maize was reduced by 72 kg CO2-eq ton−1 (wet basis), which was about 10 kg CO2-eq ton−1 (wet basis) more than in our study. In the mentioned study [14], the fibre fraction from separation of slurry was included in the calculation, and it was assumed that it had a higher CH4 emission potential during storage than deep litter.
Glycerol can be used for energy production in power plants and Otto engines [56], and it is also a useful raw material for biogas production. When glycerol is used in conventional heat and power (CHP) production, the CO2 reduction effect is 690 kg CO2 ton−1 when it substitutes natural gas, and when producing biogas substituting natural gas, it reduces GHG emissions with an equivalent of 558 kg CO2 per ton. When compared to incineration in power plants, biogas is considered a high-value energy carrier that can be stored and converted to electricity.
Among the biogas plants, the GHG effect was lowest in the plant with deep litter (S1), since CH4 emissions during storage increased because of the higher CH4 emission from digestate than from heaps of deep litter. In S4, with added glycerol, it was assumed that the glycerol would otherwise have been used efficiently for heat and power production. This assumption has not previously been used and is one of the reasons why the GHG reduction potential of an “industrial waste plant” was lower than in the study by Nielsen et al. [57], in which the total GHG effect was a reduction at 90 kg CO2-eq ton−1.
The organic farming biogas plant (S5) had, next to the deep litter and straw model plant (S2), the largest GHG reduction potential per ton (102 CO2-eq ton−1), which may be attributed to the high biogas yield as a result of the high proportion of grass, deep litter, and biowaste. In a previous analysis from 2013, the GHG reduction calculated for the introduction of AD in an organic farming system was 83 kg CO2-eq ton−1 [15], but lower effects of both energy production and CH4 emission during storage was assumed. In our study, the effect of substituting fossil fuels contributed more to the overall GHG impact than in previous studies, in which the importance of reducing CH4 emissions was greater and a reduction in N2O emissions was included in the calculations [57].
Energy crops, such as maize, are still a significant source of substrates used by Danish biogas plants, but the amount that can be used is constrained by restrictions under subsidy schemes. Compared with cereal crops such as wheat, there are only limited negative effects of growing maize and other energy crops. However, grass and sugar beets have better environmental and GHG profiles for biogas production than maize [58], and in the future, cover crops are also expected to be used for biogas production. This may reduce the N2O emissions currently seen after the incorporation of cover crops [59] while at the same time maintaining and possibly improving soil C storage potential. Cover crops and straw together provide a promising source of biogas while at the same time increasing the recycling of nutrients in crop production [60]. Utilization of the expanding area with cover crops as a source of biomass for biogas production would not have the negative iLUC effects that are associated with the cultivation of energy crops for biogas.

4.2. Biogas Plant Configuration

Increasing the reactor size and hydraulic retention time (HRT) reduced net GHG emissions via an increase in the production of biogas and a reduction in the amount of degradable VS in digestate transferred for downstream storage, which will reduced CH4 emissions from the digestate (Figure 7). The effect of increasing HRT was related to the degradability of the organic matter in the biomass used, and the highest effect was calculated when adding straw or deep litter, which feature high concentrations of slowly degradable biomass. There were increases in the GHG reduction potential by increasing HRT from 45 to 60 days in all scenarios, whereas the effect of extending HRT further was positive only for scenarios S1 to S4, because the positive effect in S5 was outweighed by greater consumption of process energy.
Methane leakage may have a significant effect on total climate impact, which would mainly be due to the global warming potential of CH4 and, to a lesser extent, the unrealized energy production (Figure 8). The total climate impact was almost linearly reduced with increasing CH4 leakage (Figure 8). The total impact was reduced by about 5 kg CO2-eq per ton of biomass from scenario S1 at a methane leakage of 1% to about 10 kg CO2-eq ton−1 of biomass at a methane leakage of 2%. This means that about 7% of the positive climate impact of the plant was lost for each percentage point of leakage. For a leakage of 15%, biogas no longer had a positive effect for scenario S1. Release and leakage of CH4 from small, unheated digesters may, in a scenario in which biogas energy substitutes coal, negate the GHG-reducing effect of biogas production if 40% of the biogas produced is emitted to the atmosphere [61].
Nielsen et al. [57] assumed that the organic waste used as codigestate would be stored under anaerobic conditions in the reference scenario and therefore be a significant source of CH4 emissions. Compared with [57], the biogas scenarios in the present study used a greater diversity of biomasses as codigestates. The relevant alternative management of these biomasses was incorporation (straw), ensiling (maize), storage in a heap (deep litter), or composting (biowaste), and only the slaughterhouse waste included in scenario S4 was assumed to be stored under anaerobic conditions if not digested. To the extent that codigestates were not stored anaerobically in the reference scenarios, this reduced the CH4 mitigation potential of biogas treatment compared with that in the previous analyses.

4.3. Nitrogen Losses

The reduction in NO3 leaching from the AD scenarios was lowest in the system with energy crops (S3), because the overall N input increased in this system with the introduction of more organic N from plant material. If 12% maize silage was used, the effect of digestion on leaching was close to zero, in accordance with previous estimates by Sørensen and Børgesen [23]. Nitrate leaching is typically greater for maize cultivation than for most other crops [44], and if this effect could be included, or if a higher proportion of energy crops were applied in S3, then an increase in NO3 leaching would be expected with AD compared with the corresponding reference scenario. However, since the effect is much affected by the assumption about which crop would be replaced by maize, we did not include the effect of a crop change to maize. On organic farms, AD of plant biomass from green manure crops, as in S5, increased the average plant availability of N [60]. This meant that less organic N was left in the soil to contribute to leaching by mineralization in the following years, and the effect of AD in such a system was estimated to reduce NO3 leaching by 0.45 kg N ton−1 biomass.
The NH3 emission potential of digestate applied in the field was higher than that of cattle slurry and pig slurry because of the higher pH of the digestate. This effect, and the higher content of TAN in digestate, contributed to higher emission from the AD systems. The effect of higher TAN concentration contributed 60–70% of the increase in NH3 emission from AD systems, and most of this increase was due to higher emission from digestate applied to soil. The relatively small increase in NH3 emission in scenario S3 was due to the emissions from storage and application of deep litter and biowaste being large in the reference system. Ammonia emission in the organic scenario, S5, was high because of the increase in the TAN content of digestate originating from N in the codigested grass–clover and the low NH3 emission from the reference system. This increase in NH3 can be avoided if organic farms inject slurry into the soil, which is feasible because of the high share of spring crops in organic crop rotations for which slurry can be injected prior to seeding or on grassland during the growing season.
In Denmark, slurry acidification is an alternative to incorporation and injection, but this technology is not suitable for digestates, because the high pH buffer capacity of the digestate results in high demand for acid and thus high cost for this treatment; furthermore, acidification with sulfuric acid is not allowed in organic farming.

4.4. Uncertainties

The calculations were based on the current knowledge about energy production in the form of biogas from different types of biomasses and their related environmental and GHG impacts. Biogas technology is constantly developing, and so is the alternative use of biomasses. This leads to uncertainty with respect to the representativeness of the biogas plants defined and their composition of biomasses. However, the model plants analysed in this study represent the types of biomasses currently used for biogas production in Denmark.
Other uncertainties are associated with the way in which impacts were quantified. The study was based on the models and data used in Denmark’s inventories of environmental and GHG impacts. These models are constantly being developed, particularly to better account for variation in environmental controls of the biological processes that determine the impacts and in the properties of biomasses and how they are managed in practice. With the current knowledge, it is not possible to quantify those uncertainties, but a qualitative discussion follows.
The gas potentials of the different biomasses, and the rate at which the gas was produced, are significant sources of uncertainty, especially in the assessment of the effect of retention time in the biogas reactor. The degradation profiles used were, therefore, essential for the estimates of gas yield with different retention times and for the assessment of residual VS in the digestates. The degradation profiles further influenced the CH4 emissions during the subsequent storage. There is a considerable need for documentation of the rate at which biogas is produced and identification of any interactions between biomasses that may give rise to synergies and/or antagonism. Moreover, it is necessary to provide better documentation of the correlation of CH4 production between batch tests and continuous systems. These sources of uncertainty may have affected the reported differences among the effects of 45, 60, and 90 d retention time.
Our study assumed that electricity for the process energy used in biogas production was covered by a mix of Danish electricity production, which was estimated to be 0.150 g CO2 kWh−1 in 2019. It may be argued that such emissions could have been 0 g kWh−1 if only renewable energy had been used. If it were assumed that no CO2 was emitted from the production of process energy, the total positive climate impact would increase by about 0.97 kg CO2 ton−1 of biomass at 45 d retention time, increasing the total climate effect by a maximum of 1.7%. Hence, the emission factor assumed for electricity for process energy was less important.
The estimation of CH4 emissions and the related degradation of organic matter during storage of biomasses was based on simplified input data and assumptions. Firstly, CH4 emissions were assumed to be a product of VS and temperature alone, but this does not always well explain temporal dynamics [62], and the composition and growth of methanogenic communities would probably be part of an improved model [63]. Furthermore, CH4 emissions were calculated from total VS and not degradable VS because of a lack of relevant experimental data regarding VS composition. In the analysis presented here, increasing the retention time in biogas reactors from 45 to 90 days showed only a limited effect on CH4 emissions during subsequent storage, with a 15% reduction in posttreatment emissions from cattle slurry being the most significant effect. A possible reason for the limited sensitivity to HRT could be that CH4 emissions were estimated on the based on total VS and using the same lnA′ value for digestate regardless of retention time. This parameter also represents the slowly degradable parts of VS for which anaerobic degradation was small whether HRT was 45, 60, or 90 days. It is likely that a model in which the VS degradability of each biomass was defined would better capture differences among digestates from the five scenarios with very different feedstocks.
Biogas treatment of pig and cattle slurry (and codigestates) reduces the availability of easily degradable organic matter. All other factors being equal, the resulting decline in demand for oxygen to degrade residual organic matter after field application should reduce the extent and lifetime of anoxic conditions with a potential for N2O production in well-drained soil. There are, however, confounding effects. For example, soil compaction and periods with rainfall reduce soil oxygen status and change the conditions for N2O production in untreated manure and digestates applied to soil [36]. Furthermore, fibre-rich codigestates such as maize silage or deep litter may change the distribution of degradable VS in the soil of digestates compared with that of untreated manure [64]. A systematic investigation is needed to elucidate interactions among manure and digestate properties, soil conditions, and N2O emissions before the effect of anaerobic digestion on N2O emissions can be included in biogas assessments.
The calculations included an assumption that digestion of slurry and biomasses reduced soil C storage compared with direct field application of those biomasses. Only very limited documentation exists of this effect [46], which is very difficult to determine experimentally. Therefore, the effect is also uncertain, and further studies are needed.
In our calculations, the higher content of TAN in the digestate caused a significant increase in NH3 emissions in the scenario calculations, corresponding to 60–70% of the higher NH3 emission. However, there is great uncertainty in these estimates due to a lack of knowledge about how the different combinations of substrates and slurry in the biogas scenarios would affect digestate physical characteristics and infiltration in the soil. Ammonia emissions from slurry or digestates are reduced with faster infiltration, which is a function of viscosity, dry matter content, and adhesiveness. It is poorly understood how infiltration of digestate is affected by the substrates used for AD.
Regardless the types of biomasses used for biogas production, the following measures are important to achieve the potential environmental and climate benefits:
-
CH4 leaks from the biogas installation should be minimized.
-
Digestate storage should be covered, and low-NH3-emission technology should be used for field application.
-
Heat exchangers should be employed to cool down the digestate to ambient temperature before storage to improve the energy balance and reduce GHG and NH3 emissions.

5. Conclusions

Environmental and climate assessments were conducted for different biogas scenarios to evaluate the sustainability of this treatment technology and identify potential improvements of environmental and climate impacts. The scenarios were analysed considering (i) biomass composition; (ii) process temperatures; (iii) hydraulic retention time; (iv) methane leakage from biogas installations; and (v) digestate storage and field application. With respect to energy production, only upgrading for the natural gas grid and substitution of natural gas with biogas were considered.
On the basis of this study, the following conclusions were drawn:
(1)
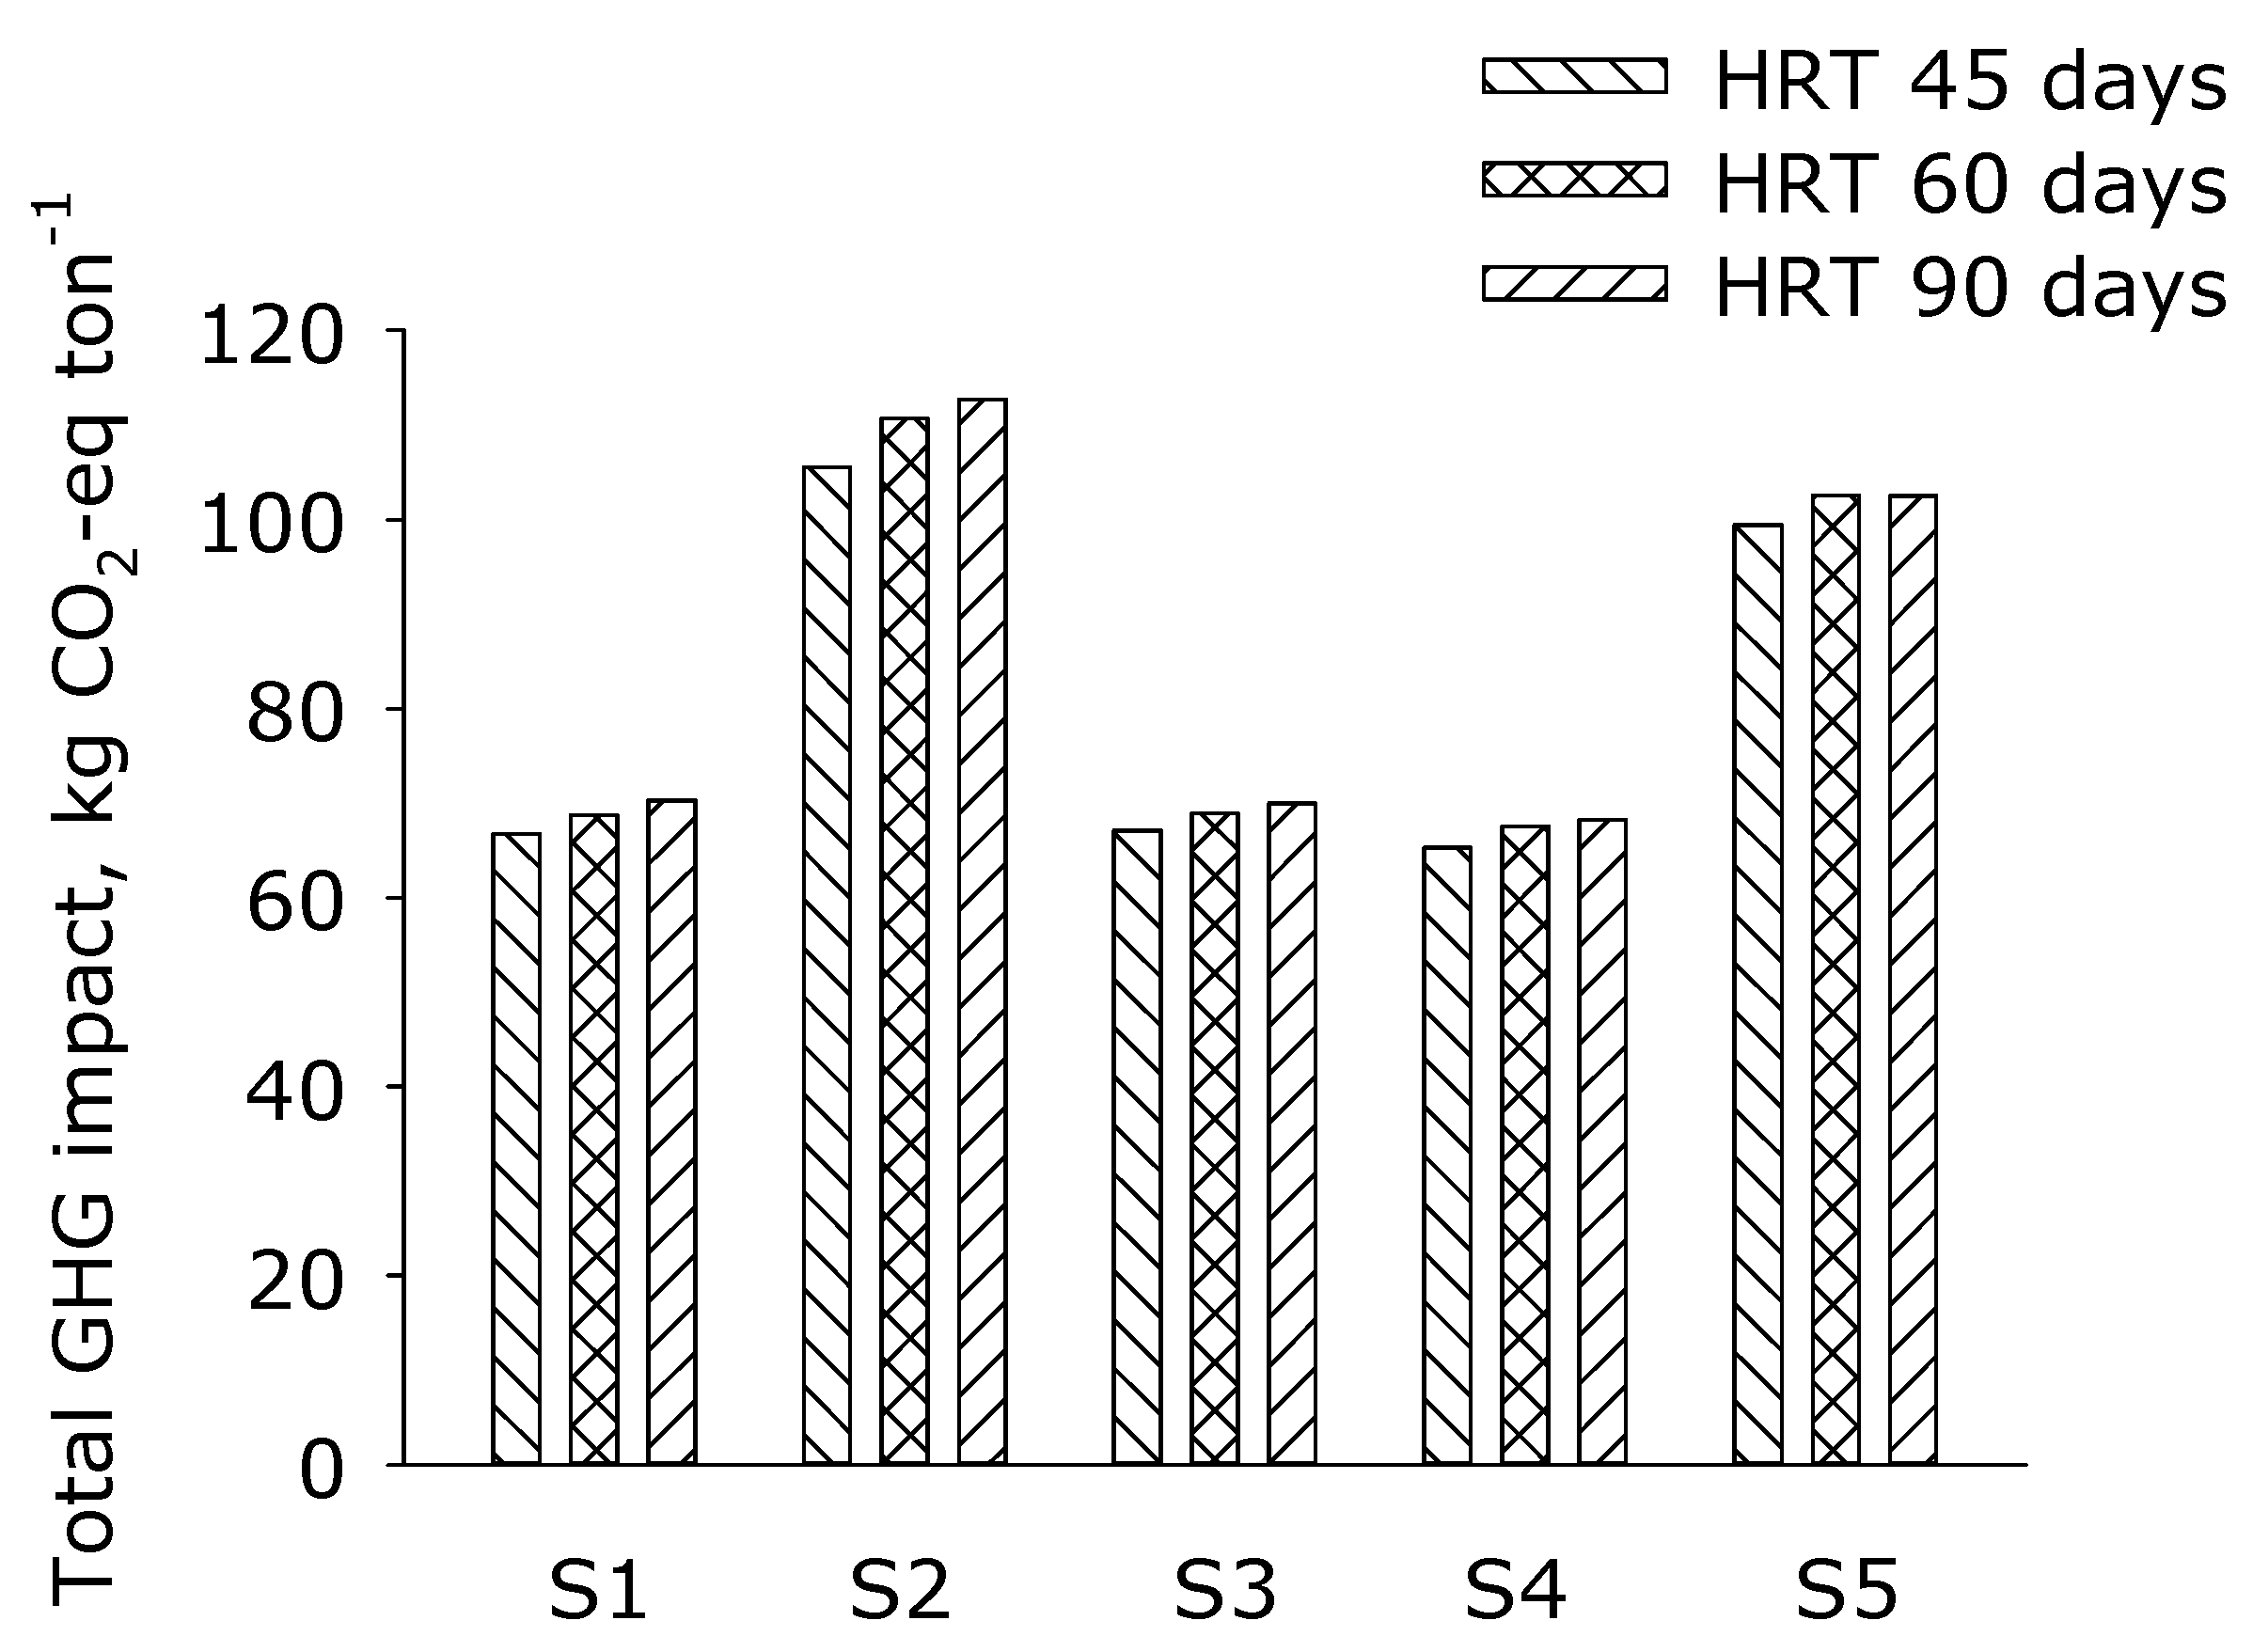
The scenarios investigated resulted in GHG mitigation ranging from 65 to 105 kg CO2-eq ton−1 biomass. Reductions per ton of biomass were greatest when straw or grass–clover was used for codigestion, whereas reductions per unit energy produced were highest with deep litter and deep litter plus maize silage.
(2)
The ammonia emission potential of digestate applied in the field was higher than that from untreated cattle and pig slurry because of digestates’ higher pH, resulting in an increase in ammonia emission of 0.14 to 0.3 kg NH3-N ton −1 biomass. The use of low-emissions application technology for a larger share of the digestate should limit these higher emissions.
(3)
All scenarios reduced nitrate leaching (0.04 to 0.45 kg NO3-N ton−1 biomass). However, introducing maize silage almost eliminated this reduction.
(4)
Increasing the hydraulic retention times led to higher climate impact via increased energy production and lower amounts of volatile solids available for degradation and subsequent CH4 emission during digestate storage.
(5)
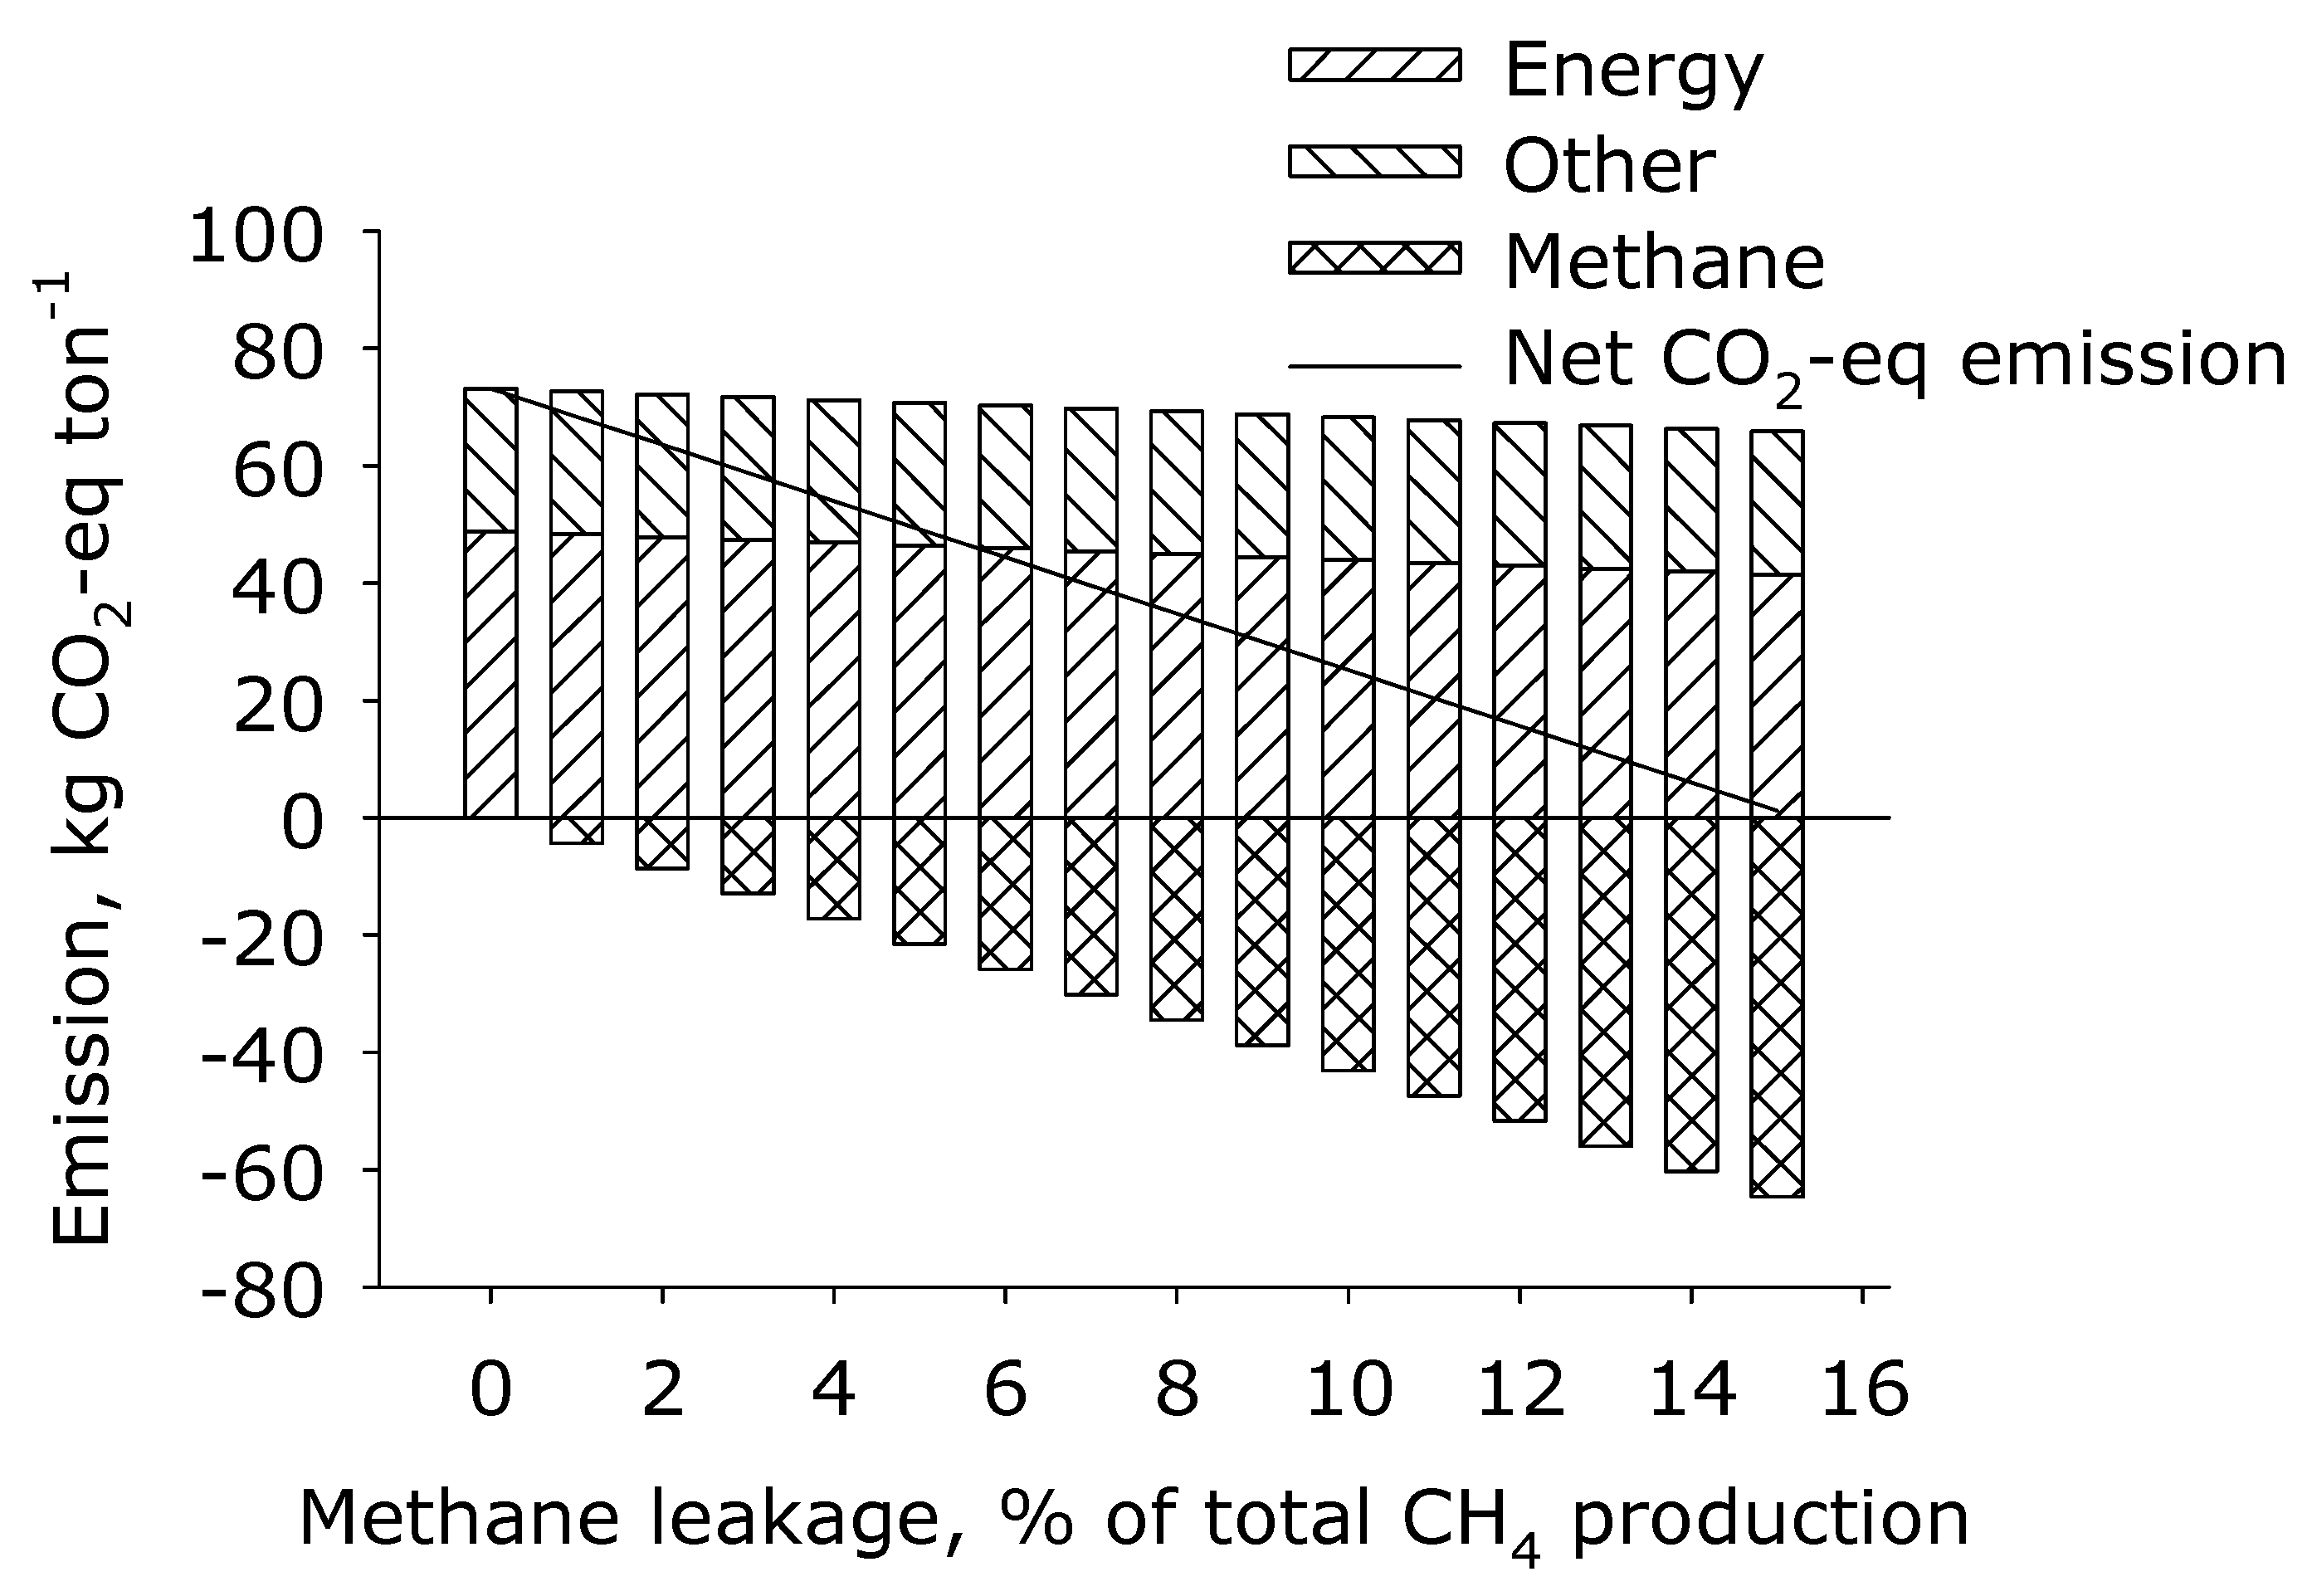
Methane leakages can have a significant effect on the total climate impact, with about 7% of the positive climate impact being lost for each percentage point of leakage in a manure-based biogas scenario.
(6)
The methodology used predicted significant reductions in CH4 emissions but assumed there was no reduction in direct emissions of N2O from digestates, which is not always true. Furthermore, iLUC, which was ignored which for bioenergy use, may have a negative impact on the GHG balance.
These and other examples given above show the importance of the assumptions chosen for this type of analysis. Still, it was concluded that biogas treatment of livestock slurry and biowastes has the potential to reduce GHG emissions, improve N use efficiency, and reduce nitrate leaching losses. However, the risks of higher ammonia emission and CH4 leakage during AD need to be managed.

Supplementary Materials

The following supporting information can be downloaded at: www.mdpi.com/article/10.3390/su14031849/s1, Table S1: Assumptions on dry matter content and gas potential of different biomasses used in biogas production. The ultimate CH4 yield is the yield achieved at a retention time of more than 90 days. The CH4 yields after 45 and 60 days and ultimate gas yield are based on data from tests at the Foulum biogas plant Aarhus University. Sources; (1) Average of 50 analyses of slurry supplied to two biogas plants, (2) Olesen et al. (2018), (3) Data from Foulum biogas plant, Aarhus University and (4) Data from tests at Foulum biogas plant, Aarhus University; Table S2: Data used for the calculation of energy consumption on a standard Danish biogas plant; Table S3: Energy use and CO2 emission due to transportation of biomass. CO2 emissions of 2.7 kg per litre of diesel is assumed; Table S4: The methane production potential values, lnA′, for digestate, cattle slurry and pig slurry were calculated based on information extracted from published studies about methane production rate, total VS and temperature. In the table, x ¯ ± s.e. refers to average and standard errors, Table S5: Ammonia emission factors for stored liquid and solid manure (Hansen et al. 2008) and organic food waste (Pardo et al. 2015); Table S6: Ammonia emission factors for cattle and pig slurry applied to soil (Hansen et al. 2008), and the novel estimates emission from digestate; Table S7: Assumptions about plant available N (NH4+-N) in biomasses before and after biogas treatment during the first crop growing season after application of manure, required N use efficiency for manures and organic wastes (by Danish legislation), and calculated reduction in NO3 leaching due to AD of manure—not accounting for changed NH3 loss. The share of NH4+-N in manure is based on Sørensen and Børgesen (2015). Organic N expected to be transformed to NH4+ within the first season is included in the NH4+-N share of total N; Figure S1: Average cumulative net N mineralisation from organic N applied in livestock manure over a 10-year period after application.

Author Contributions

Funding acquisition, H.B.M. and J.E.O.; methodology, H.B.M., P.S., J.E.O., S.O.P., T.N. and S.G.S.; project administration, J.E.O.; writing—original draft, J.E.O.; writing—review and editing, H.B.M., P.S., S.O.P., T.N. and S.G.S. All authors have read and agreed to the published version of the manuscript.

Funding

This report was prepared as part of the agreement between the Danish Energy Agency and Aarhus University.

Institutional Review Board Statement

Not applicable.

Informed Consent Statement

Not Applicable.

Conflicts of Interest

The authors declare no conflict of interest.

References

  1. Owen, J.J.; Silver, W.L. Greenhouse gas emissions from dairy manure management: A review of field-based studies. Glob. Chang. Biol. 2014, 21, 550–565. [Google Scholar] [CrossRef] [PubMed] [Green Version]
  2. Olesen, J.E.; Møller, H.B.; Petersen, S.O.; Sørensen, P.; Nyord, T.; Sommer, S.G. Sustainable Biogas—Climate and Environmental Impacts of Biogas Production; DCA report nr. 181; Aarhus Universitet, DCA—Danish Centre for Food and Agriculture: Aarhus, Denmark, 2020; p. 85. Available online: https://dcapub.au.dk/djfpdf/DCArapport181.pdf (accessed on 1 January 2021).
  3. Venterea, R.T.; Halvorson, A.D.; Kitchen, N.; Liebig, M.A.; Cavigelli, M.A.; Del Grosso, S.J.; Motavalli, P.P.; Nelson, K.A.; Spokas, K.; Singh, B.P.; et al. Challenges and opportunities for mitigating nitrous oxide emissions from fertilized cropping systems. Front. Ecol. Environ. 2012, 10, 562–570. [Google Scholar] [CrossRef]
  4. IPCC. 2006 IPCC Guidelines for National Greenhouse Gas In-ventories, Prepared by the National Greenhouse Gas Inventories Programme; Eggleston, H.S., Buendia, L., Miwa, K., Ngara, T., Tanabe, K., Eds.; IGES: Yokohama, Japan, 2006; Available online: www.ipcc-nggip.iges.or.jp/support/Primer_2006GLs.pdf (accessed on 1 January 2010).
  5. Yusuf, R.O.; Noor, Z.Z.; Abba, A.H.; Hassan, M.A.A.; Din, M.F.M. Methane emission by sectors: A comprehensive review of emission sources and mitigation methods. Renew. Sustain. Energy Rev. 2012, 16, 5059–5070. [Google Scholar] [CrossRef]
  6. Anonymous. Basisfremskrivning 2020—Danmarks Klima- og Energifremskrivning; Energistyrelsen: København, Denmark, 2020; Available online: https://ens.dk/sites/ens.dk/files/Basisfremskrivning/basisfremskrivning_2020-webtilg.pdf (accessed on 14 March 2021).
  7. EU Commission. 2030 Climate Target Plan. EU climate action and the European Green Deal. 2020. Available online: https://ec.europa.eu/clima/policies/eu-climate-action/2030_ctp (accessed on 14 March 2021).
  8. Eriksen, J.; Thomsen, I.K.; Hoffmann, C.C.; Hasler, B.; Jacobsen, B.H. Virkemidler Til Reduktion af Kvælstofbelastningen af Bandmiljøet; DCA rapport nr 174; Aarhus Universitet: Aarhus, Denmark, 2020; p. 452. [Google Scholar]
  9. Sommer, S.; Petersen, S.; Møller, H. Algorithms for calculating methane and nitrous oxide emissions from manure management. Nutr. Cycl. Agroecosyst. 2004, 69, 143–154. [Google Scholar] [CrossRef]
  10. Olesen, J.E.; Schelde, K.; Weiske, A.; Weisbjerg, M.; Asman, W.; Djurhuus, J. Modelling greenhouse gas emissions from European conventional and organic dairy farms. Agric. Ecosyst. Environ. 2006, 112, 207–220. [Google Scholar] [CrossRef]
  11. Sommer, S.G.; Olesen, J.E.; Petersen, S.O.; Weisbjerg, M.R.; Valli, L.; Rodhe, L.; Béline, F. Region-specific assessment of greenhouse gas mitigation with different manure management strategies in four agroecological zones. Glob. Chang. Biol. 2009, 15, 2825–2837. [Google Scholar] [CrossRef]
  12. Petersen, S.; Højberg, O.; Poulsen, M.; Schwab, C.; Eriksen, J. Methanogenic community changes, and emissions of methane and other gases, during storage of acidified and untreated pig slurry. J. Appl. Microbiol. 2014, 117, 160–172. [Google Scholar] [CrossRef] [Green Version]
  13. Baral, K.R.; Arthur, E.; Olesen, J.E.; Petersen, S.O. Predicting nitrous oxide emissions from manure properties and soil moisture: An incubation experiment. Soil Biol. Biochem. 2016, 97, 112–120. [Google Scholar] [CrossRef]
  14. Jacobsen, B.H.; Laugesen, F.M.; Dubgaard, A.; Bojesen, M. Biogas Production in Denmark—Assessments of Operation and Socioeconomics (Biogasproduktion i Danmark—Vurderinger af Drifts og Samfundsøkonomi); IFRO Report 220; University of Copenhagen: Copenhagen, Denmark, 2013. [Google Scholar]
  15. Møller, F.; Martinsen, L. Socioeconomic Evaluation of Selected Biogas Technologies; Scientific Report from DCE no. 62; University of Aarhus: Aarhus, Denmark, 2013. [Google Scholar]
  16. Mikkelsen, M.H.; Albrektsen, R.; Gyldenkærne, S. Consequences of Biogas Production for Greenhouse Gas Emissions in the Agricultural Sector (Biogasproduktions Konsekvenser for Drivhusgasudledning i Landbruget); Scientific Report from DCE—Danish Centre for Environment and Energy no. 197; Aarhus University: Aarhus, Denmark, 2016; p. 41. [Google Scholar]
  17. Chadwick, D.; Sommer, S.G.; Thorman, R.; Fangueiro, D.; Cardenas, L.; Amon, B.; Misselbrook, T. Manure management: Implications for greenhouse gas emissions. Anim. Feed Sci. Technol. 2011, 166–167, 514–531. [Google Scholar] [CrossRef]
  18. Nielsen, O.K.; Plejdrup, M.S.; Winther, M.; Nielsen, M.; Gyldenkærne, S.; Mikkelsen, M.H.; Albrektsen, R.; Thomsen, M.; Hjelgaard, K.; Fauser, P.; et al. Denmark’s National Inventory Report 2019. Emission Inventories 1990–2017—Submitted under the United Nations Framework Convention on Climate Change and the Kyoto Protocol; Scientific Report No. 318; Aarhus University, DCE—Danish Centre for Environment and Energy: Aarhus, Denmark, 2019; p. 886. [Google Scholar]
  19. Sommer, S.G.; Knudsen, L. Impact of Danish livestock and manure management regulations on nitrogen pollution, crop production and economy. Front. Sustain. 2021, 2, 658231. [Google Scholar] [CrossRef]
  20. Li, P.; Li, W.; Sun, M.; Xu, X.; Zhang, B.; Sun, Y. Evaluation of Biochemical Methane Potential and Kinetics on the Anaerobic Digestion of Vegetable Crop Residues. Energies 2018, 12, 26. [Google Scholar] [CrossRef] [Green Version]
  21. Møller, H.B.; Nielsen, A.; Murto, M.; Christensson, K. Manure and Energy Crops for Biogas Production; Nordic Council of Ministers TemaNord: Copenhagen, Denmark, 2008. [Google Scholar]
  22. Energinet.dk. 2019. Available online: https://energinet.dk/Om-nyheder/Nyheder/2020/01/16/Rekord-lav-CO2udledning-fradanskernes-elforbrug-i-2019 (accessed on 1 January 2021).
  23. Sørensen, P.; Børgesen, C.D. Nitrogen Leaching and Fertilising Effect from Digestate (Kvælstofudvaskning og GødningsVirkning ved Anvendelse af Afgasset Biomasse); DCA report no. 65; Aarhus University, DCA—Danish Centre for Food and Agriculture: Aarhus, Denmark, 2015; p. 46. Available online: https://pure.au.dk/portal/files/93094219/DCArapport065.pdf (accessed on 3 January 2022).
  24. Chojnacka, K.; Kowalski, Z.; Kulczycka, J.; Dmytryk, A.; Górecki, H.; Ligas, B.; Gramza, M. Carbon footprint of fertilizer technologies. J. Environ. Manag. 2018, 231, 962–967. [Google Scholar] [CrossRef] [PubMed]
  25. Elsgaard, L.; Olsen, A.B.; Petersen, S.O. Temperature response of methane production in liquid manures and co-digestates. Sci. Total Environ. 2016, 539, 78–84. [Google Scholar] [CrossRef]
  26. Petersen, S.O.; Olsen, A.B.; Elsgaard, L.; Triolo, J.M.; Sommer, S.G. Estimation of Methane Emissions from Slurry Pits below Pig and Cattle Confinements. PLoS ONE 2016, 11, e0160968. [Google Scholar] [CrossRef] [PubMed] [Green Version]
  27. Maldaner, L.; Wagner-Riddle, C.; VanderZaag, A.C.; Gordon, R.; Duke, C. Methane emissions from storage of digestate at a dairy manure biogas facility. Agric. For. Meteorol. 2018, 258, 96–107. [Google Scholar] [CrossRef]
  28. Husted, S. Seasonal Variation in Methane Emission from Stored Slurry and Solid Manures. J. Environ. Qual. 1994, 23, 585–592. [Google Scholar] [CrossRef]
  29. Sharpe, R.; Harper, L.; Byers, F. Methane emissions from swine lagoons in Southeastern US. Agric. Ecosyst. Environ. 2002, 90, 17–24. [Google Scholar] [CrossRef]
  30. Clemens, J.; Trimborn, M.; Weiland, P.; Amon, B. Mitigation of greenhouse gas emissions by anaerobic digestion of cattle slurry. Agric. Ecosyst. Environ. 2006, 112, 171–177. [Google Scholar] [CrossRef]
  31. Sherlock, R.R.; Sommer, S.G.; Khan, R.Z.; Wood, C.W.; Guertal, E.A.; Freney, J.R.; Dawson, C.O.; Cameron, K.C. Ammonia, Methane, and Nitrous Oxide Emission from Pig Slurry Applied to a Pasture in New Zealand. J. Environ. Qual. 2002, 31, 1491–1501. [Google Scholar] [CrossRef] [Green Version]
  32. Pardo, G.; Moral, R.; Aguilera, E.; del Prado, A. Gaseous emissions from management of solid waste: A systematic review. Glob. Chang. Biol. 2014, 21, 1313–1327. [Google Scholar] [CrossRef] [Green Version]
  33. Chadwick, D. Emissions of ammonia, nitrous oxide and methane from cattle manure heaps: Effect of compaction and covering. Atmos. Environ. 2005, 39, 787–799. [Google Scholar] [CrossRef]
  34. Hansen, M.N.; Henriksen, K.; Sommer, S.G. Observations of production and emission of greenhouse gases and ammonia during storage of solids separated from pig slurry: Effects of covering. Atmos. Environ. 2006, 40, 4172–4181. [Google Scholar] [CrossRef] [Green Version]
  35. Petersen, S.O.; Dorno, N.; Lindholst, S.; Feilberg, A.; Eriksen, J. Emissions of CH4, N2O, NH3 and odorants from pig slurry during winter and summer storage. Nutr. Cycl. Agroecosyst. 2013, 95, 103–113. [Google Scholar] [CrossRef]
  36. Thomsen, I.K.; Pedersen, A.R.; Nyord, T.; Petersen, S.O. Effects of slurry pre-treatment and application technique on short-term N2O emissions as determined by a new non-linear approach. Agric. Ecosyst. Environ. 2010, 136, 227–235. [Google Scholar] [CrossRef]
  37. Möller, K. Effects of anaerobic digestion on soil carbon and nitrogen turnover, N emissions, and soil biological activity. A review. Agron. Sustain. Dev. 2015, 35, 1021–1041. [Google Scholar] [CrossRef]
  38. Hansen, M.N.; Sommer, S.G.; Hutchings, N.J.; Sørensen, P. Emission Factors for Calculating Ammonia Evaporation from Storage and Application of Livestock Manure (Emissionsfaktorer til Beregning af Ammoniakfordampning ved Lagring og Udbringning af Husdyrgødning); DJF Husdyrbrug no. 84; Ministry of Agriculture: Aarhus, Denmark, 2008; p. 43. Available online: https://pure.au.dk/portal/files/2424282/djfhus84.pdf (accessed on 1 June 2019).
  39. Kupper, T.; Häni, C.; Neftel, A.; Kincaid, C.; Bühler, M.; Amon, B.; VanderZaag, A. Ammonia and greenhouse gas emissions from slurry storage—A review. Agric. Ecosyst. Environ. 2020, 300, 106963. [Google Scholar] [CrossRef]
  40. Søgaard, H.; Sommer, S.; Hutchings, N.; Huijsmans, J.; Bussink, D.; Nicholson, F. Ammonia volatilization from field-applied animal slurry—The ALFAM model. Atmos. Environ. 2002, 36, 3309–3319. [Google Scholar] [CrossRef]
  41. Sommer, S.G.; Webb, J.; Hutchings, N. New Emission Factors for Calculation of Ammonia Volatilization From European Livestock Manure Management Systems. Front. Sustain. Food Syst. 2019, 3, 101. [Google Scholar] [CrossRef] [Green Version]
  42. De Notaris, C.; Rasmussen, J.; Sørensen, P.; Olesen, J.E. Nitrogen leaching: A crop rotation perspective on the effect of N surplus, field management and use of catch crops. Agric. Ecosyst. Environ. 2018, 255, 1–18. [Google Scholar] [CrossRef]
  43. Pedersen, B.N.; Eriksen, J.; Christensen, B.T.; Sørensen, P. Fertilizer replacement value and leaching of nitrogen applied to spring barley in cattle deep litter: A 3-year lysimeter study. Soil Tillage Res. 2021, 209, 104954. [Google Scholar] [CrossRef]
  44. Børgesen, C.D.; Sørensen, P.; Blicher-Mathiesen, G.; Kristensen, K.; Pullens, J.W.M.; Zhao, J.; Olesen, J.E. NLES5: An Empirical Model for Predicting Nitrate Leaching from the Root Zone of Agricultural Land in Denmark; DCA report No. 163; Aarhus University, DCA—Danish Centre for Food and Agriculture: Aarhus, Denmark, 2019; p. 116. Available online: http://web.agrsci.dk/djfpublikation/index.asp?action=show&id=1313 (accessed on 1 June 2020).
  45. Blicher-Mathiesen, G.; Olesen, J.E.; Jung-Madsen, S. Update of Baseline 2021 (Opdatering af Baseline 2021); Technical report from DCE no. 162; Aarhus University, DCA—Danish Centre for Food and Agriculture: Aarhus, Denmark, 2020; p. 135. [Google Scholar]
  46. Thomsen, I.K.; Olesen, J.E.; Møller, H.; Sørensen, P.; Christensen, B.T. Carbon dynamics and retention in soil after anaerobic digestion of dairy cattle feed and faeces. Soil Biol. Biochem. 2013, 58, 82–87. [Google Scholar] [CrossRef]
  47. Christensen, B.T. Kulstoflagring ved nedmuldning af halm og efterafgrøder. In Jordbrug og klimaændringer—Samspil til Vandmiljøplaner; DJF rapport Markbrug nr. 109. s; Olesen, J.E., Petersen, S.O., Gyldenkærne, S., Mikkelsen, M.H., Jacobsen, B.H., Vesterdal, L., Jørgensen, A.M.K., Christensen, B.T., Abildtrup, J., Heidmann, T., et al., Eds.; Ministry of Agriculture: Copenhagen, Denmark, 2004; pp. 157–166. [Google Scholar]
  48. Taghizadeh-Toosi, A.; Olesen, J.E. Modelling soil organic carbon in Danish agricultural soils suggests low potential for future carbon sequestration. Agric. Syst. 2016, 145, 83–89. [Google Scholar] [CrossRef]
  49. Hu, T.; Sørensen, P.; Olesen, J.E. Soil carbon varies between different organic and conventional management schemes in arable agriculture. Eur. J. Agron. 2018, 94, 79–88. [Google Scholar] [CrossRef]
  50. Hijazi, O.; Munro, S.; Zerhusen, B.; Effenberger, M. Review of life cycle assessment for biogas production in Europe. Renew. Sustain. Energy Rev. 2016, 54, 1291–1300. [Google Scholar] [CrossRef]
  51. Petersen, S.O.; Sommer, S.G. Ammonia and nitrous oxide interactions: Roles of manure organic matter management. Anim. Feed Sci. Technol. 2011, 166–167, 503–513. [Google Scholar] [CrossRef]
  52. Poeschl, M.; Ward, S.; Owende, P. Environmental impacts of biogas deployment e Part II: Life cycle assessment of multiple production and utilization pathways. J. Clean. Prod. 2012, 24, 184–201. [Google Scholar] [CrossRef]
  53. Searchinger, T.D.; Wirsenius, S.; Beringer, T.; Dumas, P. Assessing the efficiency of changes in land use for mitigating climate change. Nature 2018, 564, 249–253. [Google Scholar] [CrossRef]
  54. European Commission. Directive (EU) 2015/1513 of the European Parliament and of the Council of 9 September 2015 Amending Directive 98/70/EC Relating to the Quality of Petrol and Diesel Fuels and Amending Directive 2009/28/EC on the Promotion of the Use of Energy from Renewable Sources; Law, European Commission: Brussels, Belgium, 15 September 2015. [Google Scholar]
  55. Valin, H.; Peters, D.; van den Berg, M.; Frank, S.; Havlik, P.; Forsell, N.; Hamelinck, C.; Pirker, J.; Mosnier, A.; Balkovic, J.; et al. The Land Use Changes the Impact of Biofuels Consumed in the EU. Quantification of Area and Greenhouse Gas Impacts; European Commission Project: BIENL13120; Ecofys: Utrecht, The Netherlands, 2015; p. 242. [Google Scholar]
  56. Bohon, M.D.; Metzger, B.A.; Linak, W.P.; King, C.J.; Roberts, W.L. Glycerol combustion and emissions. Proc. Combust. Inst. 2010, 33, 2717–2724. [Google Scholar] [CrossRef]
  57. Nielsen, L.H.; Hjort-Gregersen, K.; Thygesen, P.; Christensen, J. Socioeconomic Analyses of Central Biogas Plants—with Technical and Financial Background Analyses (Samfundsøkonomiske Analyser af Biogasfællesanlæg—Med Tekniske og Selskabsøkonomiske Baggrundsanalyser); Report No. 136; Institute of Food and Resource Economics: Copenhagen, Denmark, 2002. [Google Scholar]
  58. Olesen, J.E.; Petersen, S.O.; Lund, P.; Jørgensen, U.; Kristensen, T.; Elsgaard, L.; Sørensen, P.; Lassen, J. Measures to Reduce Greenhouse Gasses in the Agricultural Sector (Virkemidler til Reduktion af Klimagasser i Landbruget); DCA Report No. 130; DCA—Danish Centre for Food and Agriculture: Aarhus, Denmark, 2018; p. 119. [Google Scholar]
  59. Li, X.; Petersen, S.O.; Sørensen, P.; Olesen, J.E. Effects of contrasting catch crops on nitrogen availability and nitrous oxide emissions in an organic cropping system. Agric. Ecosyst. Environ. 2015, 199, 382–393. [Google Scholar] [CrossRef]
  60. Fontaine, D.; Feng, L.; Labouriau, R.; Møller, H.B.; Eriksen, J.; Sørensen, P. Nitrogen and Sulfur Availability in Digestates from Anaerobic Co-digestion of Cover Crops, Straw and Cattle Manure. J. Soil Sci. Plant Nutr. 2019, 20, 621–636. [Google Scholar] [CrossRef]
  61. Bruun, S.; Jensen, L.S.; Vu, V.T.K.; Sommer, S.G. Small-scale household biogas digesters: An option for global warming mitigation or a potential climate bomb? Renew. Sustain. Energy Rev. 2014, 33, 736–741. [Google Scholar] [CrossRef]
  62. Baral, K.R.; Jégo, G.; Amon, B.; Bol, R.; Chantigny, M.H.; Olesen, J.E.; Petersen, S.O. Greenhouse gas emissions during storage of manure and digestates: Key role of methane for prediction and mitigation. Agric. Syst. 2018, 166, 26–35. [Google Scholar] [CrossRef]
  63. Dalby, F.R.; Hafner, S.D.; Petersen, S.O.; VanderZaag, A.C.; Habtewold, J.; Dunfield, K.; Chantigny, M.H.; Sommer, S.G. Understanding methane emission from stored animal manure: A review to guide model development. J. Environ. Qual. 2021. [Google Scholar] [CrossRef] [PubMed]
  64. Petersen, S.O.; Nissen, H.H.; Lund, I.; Ambus, P. Redistribution of slurry in soil as influenced by organic matter content and injection method. J. Environ. Qual. 2003, 32, 2399–2409. [Google Scholar] [CrossRef] [PubMed] [Green Version]
Figure 1. Flow diagram depicting the transfer of biomass among the five compartments of the biomass transfer continuum or system.
Sustainability 14 01849 g001
Figure 2. The energy (a) and GHG (b) balances of the energy production at model plants with heat exchangers installed. Scenarios were (S1) slurry and deep litter; (S2) slurry and straw; (S3) slurry, deep litter, and maize silage; (S4) slurry, deep litter, and organic waste; and (S5) slurry, deep litter, organic waste, and organic grass–clover.
Sustainability 14 01849 g002
Figure 3. CO2 emissions from biomass transport in model plants in which slurry was codigested with the following biomasses: (S1) deep litter, (S2) straw, (S3) deep litter and maize silage, (S4) deep litter and organic waste, and (S5) deep litter, organic waste, and organic grass–clover.
Sustainability 14 01849 g003
Figure 4. Calculated CH4 emissions from barn and slurry storage tanks for the five reference and biogas scenarios. The model plants included slurry codigestates as follows (S1): deep litter, (S2) straw, (S3): deep litter and maize silage, (S4) deep litter and organic waste, and (S5): deep litter, organic waste, and organic grass–clover.
Sustainability 14 01849 g004
Figure 5. (a): Total GHG emissions in each of the five scenarios with 45, 60, and 90 d HRT calculated as CO2-eq. (b): Methane emissions from stored biomasses without biogas treatment (HRT 0 d) or (S5) with biogas treatment at increasing hydraulic retention time (HRT). In the biogas scenarios, livestock slurry was codigested with (S1) deep litter, (S2) straw, (S3) deep litter and maize silage, (S4) deep litter and organic waste, and (S5) deep litter, organic waste, and grass–clover.
Sustainability 14 01849 g005
Figure 6. Total biogenic CH4 and N2O emissions, calculated as CO2-eq, from stored slurry and other biomasses in the reference (Ref) and biogas scenarios (Biogas). The scenarios were (S1) slurry and deep litter; (S2) slurry and straw; (S3) slurry, deep litter, and maize silage; (S4) slurry, deep litter, and organic waste; and (S5) slurry, deep litter, organic waste, and organic grass–clover.
Sustainability 14 01849 g006
Figure 7. Effect of hydraulic retention time in AD reactor on total GHG impact.
Sustainability 14 01849 g007
Figure 8. Effect of methane leakage on the climate impact for model plant (S1) with 45 days HRT. Methane and nitrous oxide emissions shown are from storage of livestock manure and biogas slurry.
Sustainability 14 01849 g008
Table 1. Model plants used in the five scenarios. Distribution of biomass input is given in weight percentage. The slurry input was a mixture of 50% cattle slurry and 50% pig slurry, except in S5, where only cattle slurry was used.
ScenarioInputInput g DM kg−1 BiomassReactor g DM kg−1 BiomassReference Scenario
1Slurry (80%) + deep litter (20%)11295Animal slurry is stored in a slurry tank and then applied by injection or trailing hose. Deep litter is stored in covered stacks/manure piles for five months and applied before sowing spring cereals.
2Slurry (80%) + straw (20%)22095Straw is cut and incorporated.
3Slurry (80%) + deep litter (8%) + energy crops (12%)9451The land farmed with energy crops is used for cereal crops.
4Slurry (70%) + deep litter (10%) + organic waste (20%)14153The organic waste is stored as slurry and then spread directly on the field (slaughterhouse waste), incinerated (glycerine), or composted and then applied (biowaste).
5Organic grass–clover (25%) + cattle slurry (50%) + deep litter (20%) + biowaste (5%)9795At an organic farm without a biogas plant, the grass–clover is managed as green manure.
Table 2. Values of the parameter lnA′ used in scenario analyses to represent methanogenic potential; for derivation, see text. In the table, x ¯ ± s.e. refers to average and standard error.
CategoryStorage PeriodlnA
g CH4 kg−1 VS h−1
Reference
Cattle slurryBarn30.1[20]
Outside store29.2 ± 0.1[25,27,28]
Pig slurryBarn30.6[20]
Outside store30.3 ± 0.4[25,27,28]
DigestateOutside store27.9 ± 0.4[28,29]
Table 3. Emission factors for CH4 and N2O from deep litter in housing and storage facilities (IPCC 2006) as well as emission factors used for the storage period in this report. BMP was 0.240 m3 (CH4) kg−1 (VS).
CategoriesMethaneNitrous Oxide
IPCC (housing and outside storage)
MCF (% of BMP)kg CH4 kg−1 (VS)N2O-N % of total N
<1 month in housing30.0051
>1 month in housing170.0271
This study (outside storage)
kg CH4 kg−1 (C)kg CH4 kg−1 (VS)% of total-N
Storage in covered heaps0.0150.00750.5
Composting0.030.0152.2
Table 4. Sensitivity analysis of the importance of the CH4/CO2 ratio in the gas produced from VS degradation of untreated and digested slurry for the cumulated CH4 emissions from barn and outside slurry storage (relative differences with scenario results as basis).
Untreated SlurryDigested Slurry
CH4/CO2CattlePigCH4/CO2CattlePig
12.5:87.50.990.795:950.980.99
25:751.001.0010:901.001.00
50:501.011.1720:801.011.00
Table 5. Changes in NO3 leaching, NH3 emission, and NOx emission by introducing AD in manure management. In the model plants, pig and cattle slurry was codigested with (S1) deep litter, (S2) straw, (S3) deep litter and maize silage, (S4) deep litter and organic waste, and (S5) deep litter, organic waste, and organic grass–clover.
SourceScenarios
S1S2S3S4S5
NO3 (kg NO3-N ton−1 (biomass))−0.19−0.13−0.04−0.18−0.45
NH3 (kg NH3-N ton−1 (biomass))0.190.180.210.140.30
NOx (g NOx ton−1 (biomass))2.492.482.303.972.13
Table 6. Calculated GHG emissions per ton of biomass and per kg of dry matter (DM) (values in brackets) for five model plants at 60 d HRT and 1% methane leakage from the biogas plant. The model plants were (S1) slurry and deep litter; (S2) slurry and straw; (S3) slurry, deep litter, and maize silage; (S4) slurry, deep litter, and organic waste; and (S5): slurry, deep litter, organic waste, and organic grass–clover. Positive values indicate lower emissions, and negative values indicate higher emissions, from biogas.
SourceUnitS1S2S3S4S5
Energykg CO2-eq ton−1 biomass or kg CO2-eq ton−1 DM50.44 (450.4)117.05 (532.1)57.84 (507.4)71.83 (509.4)105.30 (534.5)
Glycerol for heating −13.80 (−97.9)
Process energy−4.08 (−36.4)−4.08 (−18.5)−4.08 (−35.8)−4.08 (−28.9)−4.08 (−20.9)
Transport−1.21 (−10.8)−1.20 (−5.5)−1.15 (−10.1)−1.62 (−11.5)−1.20 (−6.1)
Fertilizer production, N1.61 (14.4)1.32 (6.0)1.43 (12.5)1.43 (10.1)1.77 (9.0)
Methane leakage from biogas plant−4.50 (−40.1)−10.3 (−46.9)−5.42 (−47.5)−6.34 (−44.9)−9.29 (−47.2)
Methane from storage *29.91 (267.1)15.75 (71.6)24.50 (214.9)21.04 (149.2)11.54 (58.6)
Nitrous oxide from storage *0.00−1.26 (−5.7)0.001.32 (9.3)1.32 (6.7)
Nitrous oxide after application0.000.000.000.000.00
Nitrous oxide from nitrogen leaching0.40 (3.6)0.27 (1.3)0.04 (0.8)0.40 (2.8)1.01 (4.9)
Nitrous oxide from ammonia emission−0.69 (−6.2)−0.66 (−3.0)−0.76 (−6.6)−0.51 (−3.6)−1.11 (5.63)
Nitrous oxide from maize cropping0.000.00−0.74 (−12.1)0.000.00
Soil C storage (digested biomass)−3.14 (−28.0)−6.16 (−28.0)−2.12 (−18.6)−2.11 (−15.0)−2.64 (13.4)
Total impact68.8 (613)110.7 (503)69.6 (604)67.6 (479)102.6 (520)
Energy productionGJ gross energy ton−1 biomass0.902.071.021.271.86
Total impactkg CO2-eq GJ−1 gross energy76.4753.6168.1953.2955.21
Nitrate leachingkg NO3-N ton−1 biomass0.19 (1.7)0.13 (0.6)0.04 (0.4)0.18 (1.3)0.45 (2.3)
NH3kg NH3-N ton−1 biomass−0.19 (−1.7)−0.18 (−0.8)−0.21 (−1.8)−0.14 (1.0)−0.30 (1.5)
NOxg NOx ton−1 biomass−2.49 (22.2)−2.48 (11.3)−2.30 (20.2)−3.97 (28.1)−2.13 (10.8)
* Methane and N2O from storage relate to emissions from storage of biomasses, especially slurry, deep litter, and slaughterhouse waste.
Publisher’s Note: MDPI stays neutral with regard to jurisdictional claims in published maps and institutional affiliations.

