
Feasibility Investigation for Residential Battery Sizing Considering EV Charging Demand

 ,
, 
 ,
,  and
and 
Abstract
:1. Introduction
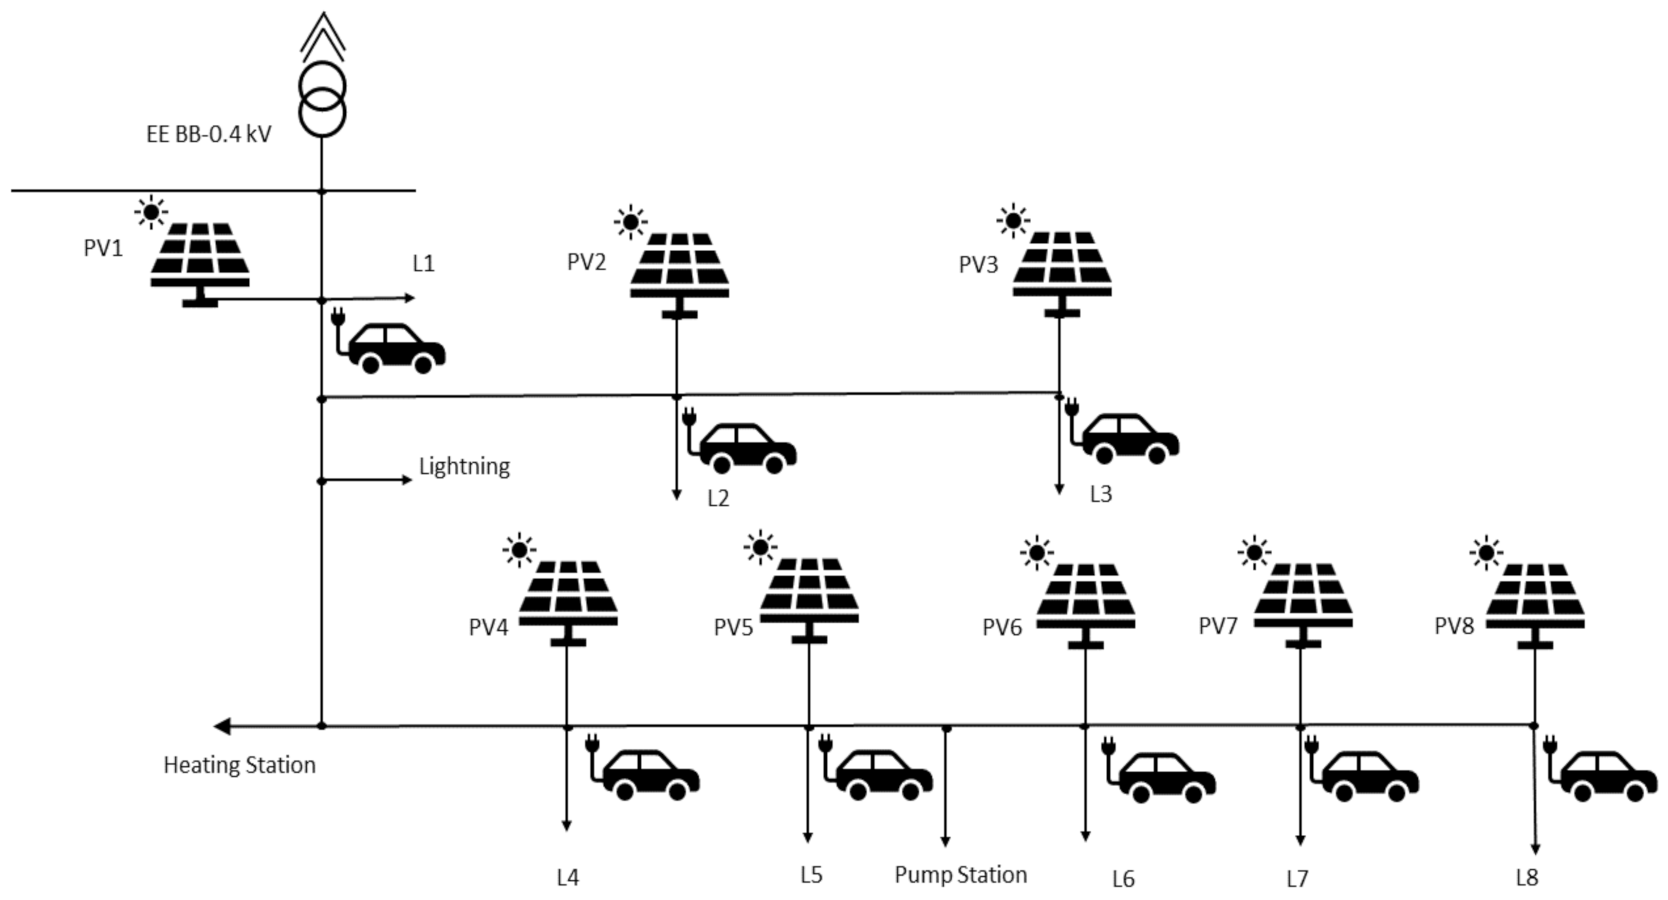
- A PV production-oriented BESS has been proposed for the electrical load and EVs in a residential household and eight different cases of small, medium and large scale have been discussed.
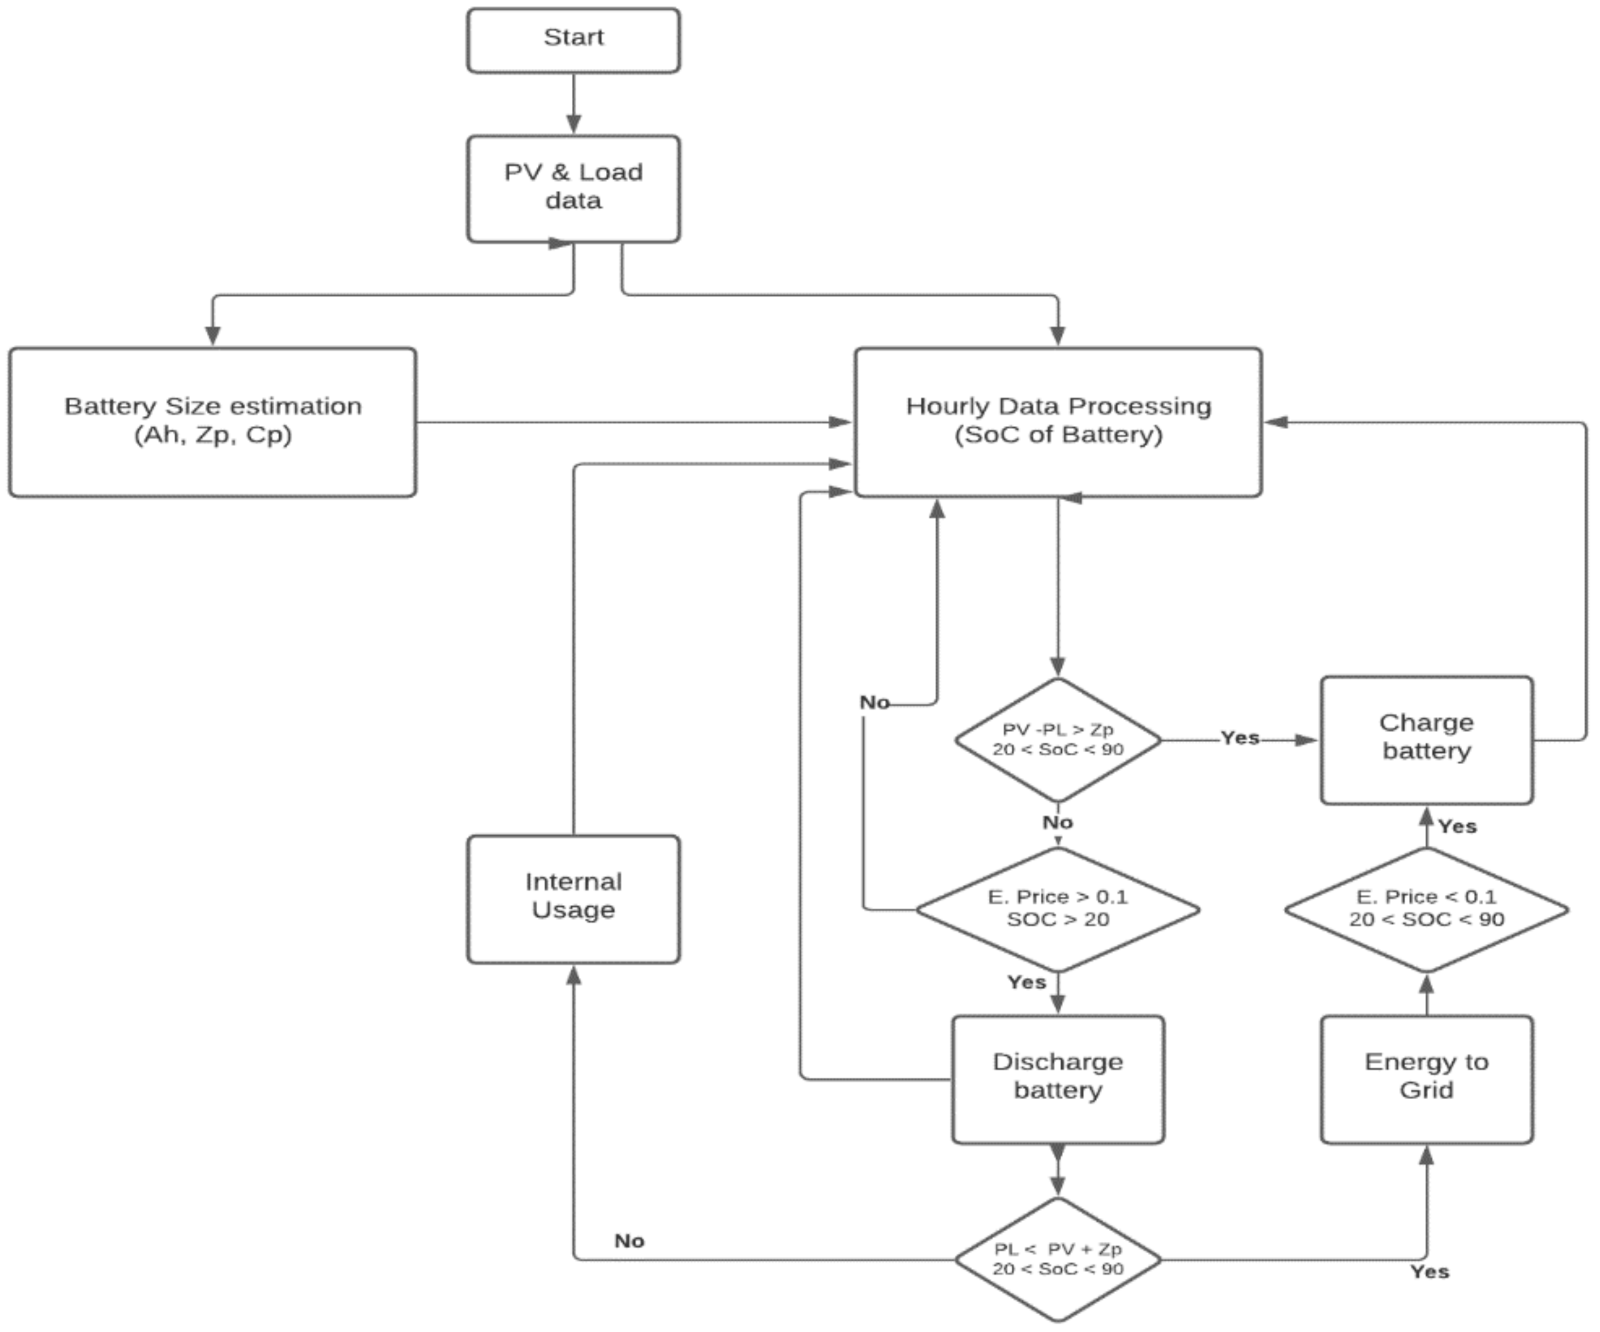
- A linear programming-based battery charging algorithm is used to target minimum annual energy costs by reducing the number of grid usage hours.
- The economic analysis of all the eight household cases with EVs along with variation in the BESS size has also been carried out.
- The payback period for all cases is estimated.
2. Data Profiles
2.1. Load Profiles
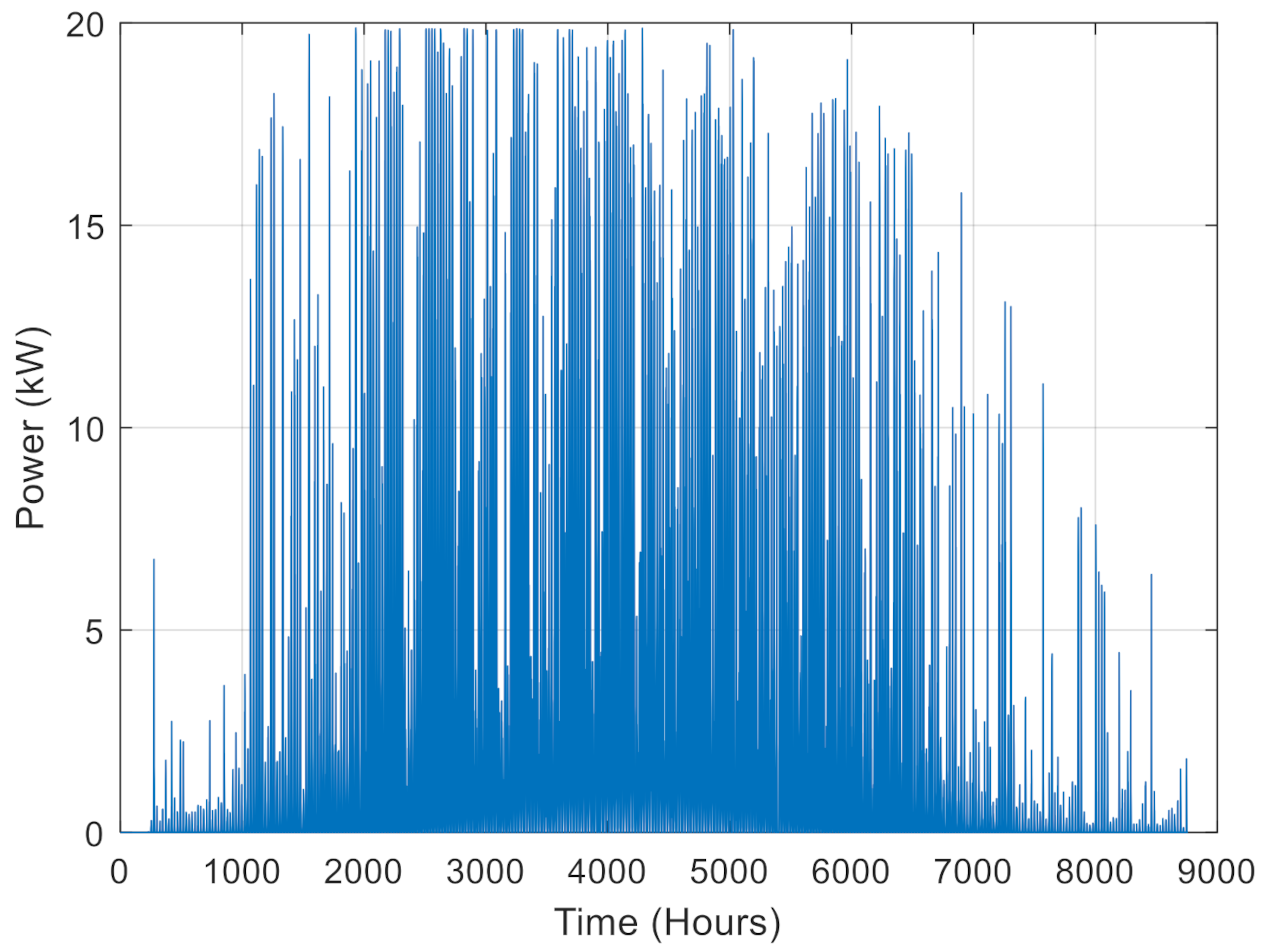
2.2. PV Profile
2.3. EV Profiles
3. Methodology
3.1. Battery Energy Storage System (BESS)
3.2. Economic Analysis
4. Discussion

| Rated PV Power (kW) | Battery Size (%) | j (hours) | a (hours) | b (hours) | c (hours) | d (hours) | Net Energy Cost (€) |
|---|---|---|---|---|---|---|---|
| 50 | 4131 | 1269 | 102 | 552 | 3810 | 2557.3 | |
| 40 | 100 | 3505 | 1543 | 151 | 617 | 4178 | 2256.8 |
| 200 | 3151 | 1580 | 189 | 786 | 4626 | 1636.1 | |
| 50 | 4088 | 1338 | 143 | 522 | 3713 | 1617.2 | |
| 60 | 100 | 3314 | 1662 | 194 | 535 | 4125 | 1456 |
| 200 | 2689 | 1832 | 227 | 664 | 4676 | 943 |
5. Conclusions
Author Contributions
Funding
Institutional Review Board Statement
Informed Consent Statement
Data Availability Statement
Conflicts of Interest
References
- European Environment Agency (EEA) Climate Change. Camb. Univ. Press 2019, 53, 1689–1699. [CrossRef]
- Fachrizal, R.; Ramadhani, U.H.; Munkhammar, J.; Widén, J. Combined PV–EV hosting capacity assessment for a residential LV distribution grid with smart EV charging and PV curtailment. Sustain. Energy Grids Netw. 2021, 26, 100445. [Google Scholar] [CrossRef]
- Ioannis, L.; Alskaif, T.; Coccato, S.; van Sark, W.; Schram, E.B.W. Review of Energy in the Built Environment. Smart Cities 2020, 3, 248–288. [Google Scholar]
- IEA. In 2017 Global Outlook EV Electric Vehicles; IEA: Paris, France, 2017.
- Khezri, R.; Mahmoudi, A.; Aki, H. Optimal planning of solar photovoltaic and battery storage systems for grid-connected residential sector: Review, challenges and new perspectives. Renew. Sustain. Energy Rev. 2022, 153, 111763. [Google Scholar] [CrossRef]
- Ahmadiahangar, R.; Husev, O.; Blinov, A.; Karami, H.; Rosin, A. Development of a Battery Sizing Tool for Nearly Zero Energy Buildings. IECON Proc. 2020, 2020, 5149–5154. [Google Scholar] [CrossRef]
- Georgiou, G.S.; Christodoulides, P.; Kalogirou, S.A. Optimizing the energy storage schedule of a battery in a PV grid- connected nZEB using linear programming. Energy 2020, 208, 118177. [Google Scholar] [CrossRef]
- Shabbir, N.; Usman, M.; Jawad, M.; Zafar, M.H.; Iqbal, M.N.; Kütt, L. Economic analysis and impact on national grid by domestic photovoltaic system installations in Pakistan. Renew. Energy 2020, 153, 509–521. [Google Scholar] [CrossRef]
- Luthander, R.; Lingfors, D.; Widén, J. Large-scale integration of photovoltaic power in a distribution grid using power curtailment and energy storage. Sol. Energy 2017, 155, 1319–1325. [Google Scholar] [CrossRef]
- Papaioannou, I.T.; Alexiadis, M.C.; Demoulias, C.S.; Labridis, D.P.; Dokopoulos, P.S. Modeling and field measurements of photovoltaic units connected to LV grid. Study of penetration scenarios. IEEE Trans. Power Deliv. 2011, 26, 979–987. [Google Scholar] [CrossRef]
- Dubey, A.; Santoso, S. Electric Vehicle Charging on Residential Distribution Systems: Impacts and Mitigations. IEEE Access 2015, 3, 1871–1893. [Google Scholar] [CrossRef]
- Johansson, S.; Persson, J.; Lazarou, S.; Theocharis, A. Investigation of the impact of large-scale integration of electric vehicles for a Swedish distribution network. Energies 2019, 12, 4717. [Google Scholar] [CrossRef] [Green Version]
- Leemput, N.; Geth, F.; Van Roy, J.; Delnooz, A.; Buscher, J.; Driesen, J. Impact of electric vehicle on-board single-phase charging strategies on a flemish residential grid. IEEE Trans. Smart Grid 2014, 5, 1815–1822. [Google Scholar] [CrossRef]
- Luthander, R.; Shepero, M.; Munkhammar, J.; Widén, J. Photovoltaics and opportunistic electric vehicle charging in the power system—A case study on a Swedish distribution grid. IET Renew. Power Gener. 2019, 13, 710–716. [Google Scholar] [CrossRef] [Green Version]
- Shepero, M.; Munkhammar, J.; Widén, J.; Bishop, J.D.K.; Boström, T. Modeling of photovoltaic power generation and electric vehicles charging on city-scale: A review. Renew. Sustain. Energy Rev. 2018, 89, 61–71. [Google Scholar] [CrossRef] [Green Version]
- Richardson, D.B. Electric vehicles and the electric grid: A review of modeling approaches, Impacts, and renewable energy integration. Renew. Sustain. Energy Rev. 2013, 19, 247–254. [Google Scholar] [CrossRef]
- Mwasilu, F.; Justo, J.J.; Kim, E.K.; Do, T.D.; Jung, J.W. Electric vehicles and smart grid interaction: A review on vehicle to grid and renewable energy sources integration. Renew. Sustain. Energy Rev. 2014, 34, 501–516. [Google Scholar] [CrossRef]
- Liu, L.; Kong, F.; Liu, X.; Peng, Y.; Wang, Q. A review on electric vehicles interacting with renewable energy in smart grid. Renew. Sustain. Energy Rev. 2015, 51, 648–661. [Google Scholar] [CrossRef]
- Denholm, P.; O’Connell, M.; Brinkman, G.; Jorgenson, J. Overgeneration from Solar Energy in California: A Field Guide to the Duck Chart (NREL/TP-6A20-65023). Tech. Rep. 2015, 1–46. [Google Scholar]
- Shafiq, M.; Kutt, L.; Lehtonen, M.; Nieminen, T.; Hashmi, M. Parameters identification and modeling of high-frequency current transducer for partial discharge measurements. IEEE Sens. J. 2013, 13, 1081–1091. [Google Scholar] [CrossRef]
- Ali, A.; Mahmoud, K.; Lehtonen, M. International Journal of Electrical Power and Energy Systems Maximizing Hosting Capacity of Uncertain Photovoltaics by Coordinated Management of OLTC, VAr Sources and Stochastic EVs. Int. J. Electr. Power Energy Syst. 2021, 127, 106627. [Google Scholar] [CrossRef]
- Vinnal, T.; Puusepp, H.; Shabbir, N.; Iqbal, N. Case study of non-linear PV inverter devices attached to the LV distribution network. Agron. Res. 2020, 18, 2639–2652. [Google Scholar]
- Guo, C.; Zhu, K.; Chen, C.; Xiao, X. Characteristics and effect laws of the large-scale electric Vehicle’s charging load. eTransportation 2020, 3, 100049. [Google Scholar] [CrossRef]
- Jawad, M.; Qureshi, M.B.; Ali, S.M.; Shabbir, N.; Khan, M.U.; Aloraini, A.; Nawaz, R. A cost-effective electric vehicle intelligent charge scheduling method for commercial smart parking lots using a simplified convex relaxation technique. Sensors 2020, 20, 4842. [Google Scholar] [CrossRef] [PubMed]
- Parra, D.; Patel, M.K. The nature of combining energy storage applications for residential battery technology. Appl. Energy 2019, 239, 1343–1355. [Google Scholar] [CrossRef]
- Mulleriyawage, U.G.K.; Shen, W.X. Optimally sizing of battery energy storage capacity by operational optimization of residential PV-Battery systems: An Australian household case study. Renew. Energy 2020, 160, 852–864. [Google Scholar] [CrossRef]
- Thygesen, R.; Karlsson, B. Simulation and analysis of a solar assisted heat pump system with two different storage types for high levels of PV electricity self-consumption. Sol. Energy 2014, 103, 19–27. [Google Scholar] [CrossRef]
- Nyholm, E.; Goop, J.; Odenberger, M.; Johnsson, F. Solar photovoltaic-battery systems in Swedish households—Self-consumption and self-sufficiency. Appl. Energy 2016, 183, 148–159. [Google Scholar] [CrossRef] [Green Version]
- Hanna, R.; Kleissl, J.; Nottrott, A.; Ferry, M. Energy dispatch schedule optimization for demand charge reduction using a photovoltaic-battery storage system with solar forecasting. Sol. Energy 2014, 103, 269–287. [Google Scholar] [CrossRef]
- Chen, X.; Wei, T.; Hu, S. Uncertainty-aware household appliance scheduling considering dynamic electricity pricing in smart home. IEEE Trans. Smart Grid 2013, 4, 932–941. [Google Scholar] [CrossRef]
- Nottrott, A.; Kleissl, J.; Washom, B. Energy dispatch schedule optimization and cost benefit analysis for grid-connected, photovoltaic-battery storage systems. Renew. Energy 2013, 55, 230–240. [Google Scholar] [CrossRef]
- Rahmani-Andebili, M.; Shen, H. Energy scheduling for a smart home applying stochastic model predictive control. In 25th International Conference on Computer Communication and Networks (ICCCN); IEEE: Piscataway, NJ, USA, 2016; pp. 3–8. [Google Scholar] [CrossRef]
- Wang, R.; Li, J.; Wang, J.; Gao, C. Research and application of a hybridwind energy forecasting system based on data processing and an optimized extreme learning machine. Energies 2018, 11, 1712. [Google Scholar] [CrossRef] [Green Version]
- Bandyopadhyay, S.; Mouli, G.R.C.; Qin, Z.; Elizondo, L.R.; Bauer, P. Techno-Economical Model Based Optimal Sizing of PV-Battery Systems for Microgrids. IEEE Trans. Sustain. Energy 2020, 11, 1657–1668. [Google Scholar] [CrossRef]
- Cai, H.; Shen, S.; Lin, Q.; Li, X.; Xiao, H. Predicting the Energy Consumption of Residential Buildings for Regional Electricity Supply-Side and Demand-Side Management. IEEE Access 2019, 7, 30386–30397. [Google Scholar] [CrossRef]
- Bhoi, S.K.; Nayak, M.R. Optimal scheduling of battery storage with grid tied PV systems for trade-off between consumer energy cost and storage health. Microprocess. Microsyst. 2020, 79, 103274. [Google Scholar] [CrossRef]
- Wu, X.; Hu, X.; Yin, X.; Zhang, C.; Qian, S. Optimal battery sizing of smart home via convex programming. Energy 2017, 140, 444–453. [Google Scholar] [CrossRef]
- Dietrich, A.; Weber, C. What drives profitability of grid-connected residential PV storage systems? A closer look with focus on Germany. Energy Econ. 2018, 74, 399–416. [Google Scholar] [CrossRef]
- Saber, A.Y.; Venayagamoorthy, G.K. Plug-in vehicles and renewable energy sources for cost and emission reductions. IEEE Trans. Ind. Electron. 2011, 58, 1229–1238. [Google Scholar] [CrossRef]
- Fachrizal, R.; Shepero, M.; van der Meer, D.; Munkhammar, J.; Widén, J. Smart charging of electric vehicles considering photovoltaic power production and electricity consumption: A review. eTransportation 2020, 4. [Google Scholar] [CrossRef]
- Hoarau, Q.; Perez, Y. Interactions between electric mobility and photovoltaic generation: A review. Renew. Sustain. Energy Rev. 2018, 94, 510–522. [Google Scholar] [CrossRef] [Green Version]
- Bhatti, A.R.; Salam, Z.; Aziz, M.J.B.A.; Yee, K.P.; Ashique, R.H. Electric vehicles charging using photovoltaic: Status and technological review. Renew. Sustain. Energy Rev. 2016, 54, 34–47. [Google Scholar] [CrossRef]
- Datta, U.; Kalam, A.; Shi, J. Smart control of BESS in PV integrated EV charging station for reducing transformer overloading and providing battery-to-grid service. J. Energy Storage 2020, 28, 101224. [Google Scholar] [CrossRef]
- Yong, J.Y.; Ramachandaramurthy, V.K.; Tan, K.M.; Mithulananthan, N. A review on the state-of-the-art technologies of electric vehicle, its impacts and prospects. Renew. Sustain. Energy Rev. 2015, 49, 365–385. [Google Scholar] [CrossRef]
- Iqbal, M.N.; Kütt, L.; Lehtonen, M.; Millar, R.J.; Püvi, V.; Rassõlkin, A.; Demidova, G.L. Travel activity based stochastic modelling of load and charging state of electric vehicles. Sustainability 2021, 13, 1550. [Google Scholar] [CrossRef]
- Ma, C.T. System planning of grid-connected electric vehicle charging stations and key technologies: A review. Energies 2019, 12, 4201. [Google Scholar] [CrossRef] [Green Version]
- Ahmadian, A.; Mohammadi-Ivatloo, B.; Elkamel, A. A Review on Plug-in Electric Vehicles: Introduction, Current Status, and Load Modeling Techniques. J. Mod. Power Syst. Clean Energy 2020, 8, 412–425. [Google Scholar] [CrossRef]
- Wang, Y.; Das, R.; Putrus, G.; Kotter, R. Economic evaluation of photovoltaic and energy storage technologies for future domestic energy systems–A case study of the UK. Energy 2020, 203, 117826. [Google Scholar] [CrossRef]
- Yu, H.J.J. System contributions of residential battery systems: New perspectives on PV self-consumption. Energy Econ. 2021, 96, 105151. [Google Scholar] [CrossRef]
- Baes, K.; Kolk, M.; Carlot, F.; Merhaba, Y.I.A. Future of Batteries. Available online: https://www.adlittle.com/en/insights/viewpoints/future-batteries (accessed on 10 July 2021).
- Dufo-López, R.; Zubi, G.; Fracastoro, G.V. Tecno-economic assessment of an off-grid PV-powered community kitchen for developing regions. Appl. Energy 2012, 91, 255–262. [Google Scholar] [CrossRef]
- Numbi, B.P.; Malinga, S.J. Optimal energy cost and economic analysis of a residential grid-interactive solar PV system- case of eThekwini municipality in South Africa. Appl. Energy 2017, 186, 28–45. [Google Scholar] [CrossRef]
- Ahmadiahangar, R.; Karami, H.; Husev, O.; Blinov, A.; Rosin, A.; Jonaitis, A.; Sanjari, M.J. Analytical approach for maximizing self-consumption of nearly zero energy buildings- case study: Baltic region. Energy 2022, 238, 121744. [Google Scholar] [CrossRef]
- Shabbir, N.; Kütt, L.; Astapov, V.; Jawad, M.; Allik, A.; Husev, O. Battery Size Optimization with Customer PV Installations and Domestic Load Profile. IEEE Access 2022. [Google Scholar]
- ELERING Elering. Available online: https://elering.ee/ (accessed on 20 November 2021).


| Number of Load | Peak Load (kW) | Average Load (kW) | Median Load (kW) | Annual Energy Consumption (kWh) |
|---|---|---|---|---|
| Case 1 | 1.9 | 0.1 | 0.1 | 741 |
| Case 2 | 5.4 | 1.1 | 0.7 | 9056 |
| Case 3 | 36.7 | 11.9 | 11.1 | 103,842 |
| Case 4 | 2.2 | 0.3 | 0.2 | 2176 |
| Case 5 | 2.7 | 0.3 | 0.2 | 1975 |
| Case 6 | 5.1 | 0.7 | 0.5 | 6482 |
| Case 7 | 5.9 | 0.7 | 0.5 | 6639 |
| Case 8 | 4.1 | 0.4 | 0.3 | 3765 |
| Number of Load | Number of EVs | Number of Load | Number of EVs |
|---|---|---|---|
| Case 1 | 1 | Case 5 | 1 |
| Case 2 | 3 | Case 6 | 2 |
| Case 3 | 10 | Case 7 | 4 |
| Case 4 | 1 | Case 8 | 1 |
| Number of Load | Peak Load (kW) | Average Load (kW) | Median Load (kW) | Annual Energy Consumption (kWh) | Installed PV Power (kW) |
|---|---|---|---|---|---|
| Case 1 | 4.6 | 0.8 | 0.1 | 7250 | 5 |
| Case 2 | 15.4 | 2.9 | 2.6 | 25,800 | 10 |
| Case 3 | 60 | 16.4 | 15.4 | 143,725 | 20 |
| Case 4 | 5.7 | 0.9 | 0.3 | 8686 | 5 |
| Case 5 | 6.2 | 0.9 | 0.2 | 8485 | 5 |
| Case 6 | 15.2 | 2.3 | 1.2 | 20,450 | 10 |
| Case 7 | 16 | 2.3 | 1.7 | 20,610 | 10 |
| Case 8 | 7.9 | 1.8 | 0.4 | 10,270 | 5 |
| Number of Load | Battery Capacity (kWh) |
|---|---|
| Case 1 | 4 |
| Case 2 | 41 |
| Case 3 | 548 |
| Case 4 | 10 |
| Case 5 | 10 |
| Case 6 | 35 |
| Case 7 | 35 |
| Case 8 | 20 |
| Number of Load | Battery Size (%) | j (hour) | a (hours) | b (hours) | c (hours) | d (hours) |
|---|---|---|---|---|---|---|
| 50 | 2051 | 3040 | 292 | 286 | 3663 | |
| Case 1 | 100 | 1456 | 3139 | 400 | 248 | 4013 |
| 200 | 1237 | 3171 | 473 | 241 | 4120 | |
| 50 | 3740 | 1616 | 248 | 395 | 3551 | |
| Case 2 | 100 | 3441 | 1701 | 310 | 441 | 3749 |
| 200 | 3125 | 1742 | 359 | 524 | 4058 | |
| 50 | 3764 | 1690 | 227 | 416 | 3495 | |
| Case 3 | 50 | 3622 | 1002 | 96 | 489 | 4529 |
| 100 | 3214 | 1035 | 156 | 614 | 4969 | |
| 200 | 2776 | 1035 | 205 | 769 | 5513 | |
| Case 4 | 100 | 2542 | 2400 | 335 | 383 | 3866 |
| 200 | 2178 | 2449 | 367 | 411 | 4177 | |
| 50 | 2720 | 2372 | 254 | 330 | 3744 | |
| Case 5 | 100 | 2082 | 2495 | 344 | 320 | 4159 |
| 200 | 1724 | 2538 | 401 | 342 | 4439 | |
| 50 | 3083 | 2002 | 261 | 347 | 3761 | |
| Case 6 | 100 | 2580 | 2173 | 341 | 347 | 4013 |
| 200 | 2231 | 2243 | 382 | 401 | 4305 | |
| 50 | 2922 | 1770 | 242 | 305 | 4131 | |
| Case 7 | 100 | 2490 | 1879 | 322 | 347 | 4416 |
| 200 | 2084 | 1942 | 372 | 394 | 4756 | |
| 50 | 2970 | 1818 | 273 | 349 | 4048 | |
| Case 8 | 100 | 2365 | 1999 | 338 | 352 | 4410 |
| 200 | 2001 | 2059 | 381 | 400 | 4719 |
| Number of Load | Battery Size (%) | Peak Power Drawn from Grid (kW) | Peak Power Injected into the Grid (kW) | |||||||
|---|---|---|---|---|---|---|---|---|---|---|
| Wt. | Sp. | Sum. | Aut. | Wt. | Sp. | Sum. | Aut. | Wt. | ||
| 50 | 4.5 | 4.83 | 4.5 | 3.9 | 4.3 | −4.9 | −4.9 | −4.7 | 4.5 | |
| Case 1 | 100 | 4.5 | 4.83 | 4.5 | 3.9 | 4.2 | −4.9 | −4.9 | −4.7 | 4.5 |
| 200 | 4.5 | 4.37 | 4.2 | 3.8 | 4.2 | −4.9 | −4.9 | −4.7 | 4.5 | |
| 50 | 13.7 | 9.1 | 10 | 10 | 12.7 | −9.7 | −9.9 | −9.6 | 13.4 | |
| Case 2 | 100 | 13.7 | 9.7 | 10 | 11.9 | 12.8 | −9.7 | −9.9 | −9.4 | 13.4 |
| 200 | 13.7 | 9.6 | 10 | 10 | 12.8 | −9.7 | −9.9 | −9.4 | 13.4 | |
| 50 | 115.8 | 113.7 | 99.1 | 40.1 | 110 | −75.2 | −76.6 | −73.6 | 115.5 | |
| Case 3 | 100 | 116.8 | 113.3 | 99.1 | 40.1 | 110 | −75.2 | −76.6 | −75.5 | 116.7 |
| 200 | 113.7 | 113.3 | 99.1 | 40.1 | 110 | −75.2 | −76.6 | −75.5 | 113.6 | |
| 50 | 4.8 | 4.5 | 4.7 | 4.3 | 4.7 | −4.9 | −4.9 | −4.4 | 4.8 | |
| Case 4 | 100 | 4.8 | 4.5 | 4.7 | 4.3 | 4.7 | −4.9 | −4.9 | −4.6 | 4.8 |
| 200 | 4.8 | 3.7 | 4.6 | 4.8 | 4.7 | −4.9 | −4.9 | −4.6 | 4.8 | |
| 50 | 4.8 | 4.3 | 4.3 | 3.9 | 4.4 | −4.8 | −4.8 | −4.6 | 4.8 | |
| Case 5 | 100 | 4.8 | 4.2 | 4.2 | 3.9 | 4.4 | −4.8 | −4.8 | −4.6 | 4.8 |
| 200 | 51 | 3.6 | 4.2 | 3.7 | 4.4 | −4.8 | −4.8 | −4.6 | 5 | |
| 50 | 14.2 | 12 | 11.7 | 12.6 | 13.4 | −9.6 | −9.6 | −8.6 | 14.2 | |
| Case 6 | 100 | 14.2 | 12 | 11.7 | 12.6 | 13.4 | −9.6 | −9.6 | −8.6 | 14.2 |
| 200 | 14.2 | 12 | 11.7 | 12.6 | 13.4 | −9.6 | −9.6 | −8.6 | 14.2 | |
| 50 | 13.8 | 11.7 | 12.5 | 12.5 | 12.6 | −9.7 | −9.7 | −8.8 | 13.8 | |
| Case 7 | 100 | 13.8 | 11.7 | 12.5 | 12.5 | 12.6 | −9.7 | −9.7 | −8.8 | 13.8 |
| 200 | 13.8 | 11.7 | 12.5 | 12.5 | 12.6 | −9.7 | −9.7 | −8.8 | 13.8 | |
| 50 | 6.5 | 5.74 | 5.3 | 5.4 | 5.63 | −4.8 | −4.8 | −4.6 | 6.5 | |
| Case 8 | 100 | 6.5 | 5.78 | 5.8 | 5.4 | 5.63 | −4.8 | −4.8 | −4.6 | 6.5 |
| 200 | 6.5 | 5.78 | 5.8 | 5.4 | 5.63 | −4.8 | −4.8 | −4.6 | 6.5 | |
| Number of Load | Battery Size (%) | Accumulated Cost of Energy from the Grid (€) | Accumulated Cost with PV-BESS-EV (€) |
|---|---|---|---|
| 50 | 200 | −35.0 | |
| Case 1 | 100 | 200 | −45.0 |
| 200 | 200 | −56.6 | |
| 50 | 793 | 289 | |
| Case 2 | 100 | 793 | 270 |
| 200 | 793 | 242 | |
| 50 | 5237 | 3556 | |
| Case 3 | 100 | 5237 | 3130 |
| 200 | 5237 | 2565 | |
| 50 | 246 | −4.4 | |
| Case 4 | 100 | 246 | −16 |
| 200 | 246 | −30 | |
| 50 | 245 | −5.3 | |
| Case 5 | 100 | 245 | −17 |
| 200 | 245 | −31 | |
| 50 | 546 | 40.2 | |
| Case 6 | 100 | 546 | 33.2 |
| 200 | 546 | 16.1 | |
| 50 | 875 | 374.2 | |
| Case 7 | 100 | 875 | 360.8 |
| 200 | 875 | 344.3 | |
| 50 | 314 | 54 | |
| Case 8 | 100 | 314 | 50 |
| 200 | 314 | 41 |
| Rated PV Power (kW) | Battery Size (%) | Peak Power Drawn from Grid (kW) | Peak Power Injected into the Grid (kW) | ||||||
|---|---|---|---|---|---|---|---|---|---|
| Wt. | Sp. | Sum. | Aut. | Wt. | Sp. | Sum. | Aut. | ||
| 50 | 113.9 | 113.3 | 99.1 | 40.1 | 110 | −106.6 | −112.1 | −103 | |
| 40 | 100 | 115.8 | 113.3 | 99.1 | 40.1 | 110 | −73.5 | −104.1 | −77.4 |
| 200 | 113.7 | 106.6 | 99.1 | 40.1 | 110 | −73.5 | −76.7 | −77.4 | |
| 50 | 113.7 | 102.6 | 99.1 | 40.1 | 110 | −111.9 | −131.7 | −113.4 | |
| 60 | 100 | 115.5 | 109.8 | 95.6 | 40.1 | 110 | −126.3 | −131.6 | −110.9 |
| 200 | 116.7 | 106.5 | 95.6 | 40.1 | 110 | −126.3 | −128.1 | −76.7 | |
| Number of Load | Battery Size (%) | PV Rated Power (kW) | Cost of PV and Inverter (€) | Cost of BESS (€) | Total Savings per Years (€) | Payback Period (years) |
|---|---|---|---|---|---|---|
| Case 1 | 50 | 5 | 3000 | 200 | 235 | 14 |
| 100 | 5 | 3000 | 400 | 245 | 14 | |
| 200 | 5 | 3000 | 800 | 256 | 15 | |
| No EV (BESS 100%) | 5 | 3000 | 400 | 245 | 14 | |
| No BESS | 5 | 3000 | - | 241 | 12 | |
| Case 2 | 50 | 10 | 6000 | 2100 | 506 | 16 |
| 100 | 10 | 6000 | 4100 | 524 | 19 | |
| 200 | 10 | 6000 | 8100 | 552 | 26 | |
| No EV (BESS 100%) | 10 | 6000 | 4100 | 472 | 16 | |
| No BESS | 10 | 6000 | - | 472 | 13 | |
| Case 3 | 50 | 20 | 12,000 | 27,500 | 1680 | 24 |
| 100 | 20 | 12,000 | 54,900 | 2107 | 32 | |
| 200 | 20 | 12,000 | 109,800 | 2672 | 46 | |
| No EV (BESS 100%) | 20 | 12,000 | 54,900 | 954 | 20 | |
| No BESS | 20 | 12,000 | - | 954 | 13 | |
| Case 4 | 50 | 5 | 3000 | 500 | 250 | 14 |
| 100 | 5 | 3000 | 1000 | 262 | 15 | |
| 200 | 5 | 3000 | 2000 | 275 | 18 | |
| No EV (BESS 100%) | 5 | 3000 | 1000 | 241 | 13 | |
| No BESS | 5 | 3000 | - | 241 | 12 | |
| Case 5 | 50 | 5 | 3000 | 500 | 250 | 14 |
| 100 | 5 | 3000 | 1000 | 261 | 15 | |
| 200 | 5 | 3000 | 2000 | 275 | 18 | |
| No EV (BESS 100%) | 5 | 3000 | 1000 | 241 | 13 | |
| No BESS | 5 | 3000 | - | 241 | 12 | |
| Case 6 | 50 | 10 | 6000 | 1800 | 506 | 15 |
| 100 | 10 | 6000 | 3500 | 513 | 19 | |
| 200 | 10 | 6000 | 7000 | 530 | 25 | |
| No EV (BESS 100%) | 10 | 6000 | 3500 | 513 | 14 | |
| No BESS | 10 | 6000 | - | 472 | 15 | |
| Case 7 | 50 | 10 | 6000 | 1800 | 506 | 15 |
| 100 | 10 | 6000 | 3500 | 500 | 19 | |
| 200 | 10 | 6000 | 7000 | 514 | 25 | |
| No EV (BESS 100%) | 10 | 6000 | 3500 | 514 | 14 | |
| No BESS | 10 | 6000 | - | 472 | 13 | |
| Case 8 | 50 | 5 | 3000 | 1000 | 260 | 15 |
| 100 | 5 | 3000 | 2000 | 264 | 19 | |
| 200 | 5 | 3000 | 4000 | 272 | 26 | |
| No EV (BESS 100%) | 5 | 3000 | 2000 | 264 | 14 | |
| No BESS | 5 | 3000 | - | 241 | 12 |
Publisher’s Note: MDPI stays neutral with regard to jurisdictional claims in published maps and institutional affiliations. |
© 2022 by the authors. Licensee MDPI, Basel, Switzerland. This article is an open access article distributed under the terms and conditions of the Creative Commons Attribution (CC BY) license (https://creativecommons.org/licenses/by/4.0/).
Share and Cite
Shabbir, N.; Kütt, L.; Daniel, K.; Astapov, V.; Raja, H.A.; Iqbal, M.N.; Husev, O. Feasibility Investigation for Residential Battery Sizing Considering EV Charging Demand. Sustainability 2022, 14, 1079. https://doi.org/10.3390/su14031079
Shabbir N, Kütt L, Daniel K, Astapov V, Raja HA, Iqbal MN, Husev O. Feasibility Investigation for Residential Battery Sizing Considering EV Charging Demand. Sustainability. 2022; 14(3):1079. https://doi.org/10.3390/su14031079
Chicago/Turabian StyleShabbir, Noman, Lauri Kütt, Kamran Daniel, Victor Astapov, Hadi Ashraf Raja, Muhammad Naveed Iqbal, and Oleksandr Husev. 2022. "Feasibility Investigation for Residential Battery Sizing Considering EV Charging Demand" Sustainability 14, no. 3: 1079. https://doi.org/10.3390/su14031079
APA StyleShabbir, N., Kütt, L., Daniel, K., Astapov, V., Raja, H. A., Iqbal, M. N., & Husev, O. (2022). Feasibility Investigation for Residential Battery Sizing Considering EV Charging Demand. Sustainability, 14(3), 1079. https://doi.org/10.3390/su14031079