1. Introduction
Fuel cells directly convert the chemical energy of fuel, such as hydrogen or methane, to electrical energy using electrochemical reactions [
1,
2]. Fuel cells have many strong points, such as high efficiency, no emissions (operated with hydrogen), silence, high power density, etc. [
1,
2,
3,
4,
5,
6,
7,
8,
9]. Among the various types of fuel cells, polymer electrolyte membrane fuel cells or proton exchange membrane fuel cells (PEMFCs) are widely used as energy generation devices for mobile applications, such as vehicles, ships, and drones, because of their low operating temperature (<100 °C), rapid start up and shut down, and high power density [
10,
11,
12,
13,
14]. However, PEMFCs used in power generation systems for mobile applications are exposed to various environments, including low temperatures and contaminated air. An air blower is used to supply oxygen to the fuel cell stack in the power generation system of mobile applications. Generally, chemical and physical filters are used to remove impurities in the air [
15]. For example, fuel cells in fuel cell electric vehicles (FCEVs) are exposed to contaminants, such as SOx, NOx, or CO, generated from other vehicles that use traditional internal combustion engines. Therefore, filters are used in FCEVs to ensure the performance of fuel cells. Furthermore, fuel cells are considered as next-generation power generation devices for ships to reduce NO
x produced through traditional diesel engines [
16]. Due to the remote operating environment in the ocean, maintenance is significantly essential for a ship’s power generation system [
17]. Long-term operation and low noise levels are also required for navy applications (submarines). [
17].
Fuel cell systems in a ship also use a blower to supply air to the fuel cell stack. However, the air is different from that on land or in a city, such as higher humidity and the presence of other corrosive ions in the mist. L. Veleva et al. reported that the main governing reason for corrosion of the copper sample exposed to the ocean environment was not SO
x but Cl [
18]. Generally, seawater contains Cl
-, Na
+, SO
42-, and Mg
2+ ions [
19]. These ions are also detected in fog near the sea. Among these ions, Cl
- and Na
+ have known degradation factors in the performance of PEMFCs [
19,
20]. Mikkola et al. reported that the movement of Na
+ in ionomers replaced the movement of H
+ [
21]. Therefore, the ionic conductivity of the electrolyte in PEMFCs decreased. In addition, Cl
- is usually adsorbed on nanosized Pt particle catalysts [
22,
23]. So, triple phase boundaries (TPBs) decreased where electrochemical reactions occur, and the activation resistance of fuel cells increased [
22,
23]. Additionally, Cl- affects the degradation of components of PEMFCs, such as the gas diffusion layer (GDL) [
23,
24,
25,
26]. B. V. Sasank et al. reported the results of PEMFC operated with actual seawater operation [
27]. The cathode of the passive PEMFC was exposed to air containing NaCl.
In this study, we fabricated a custom-made mist generator using an ultrasonic vibrator to generate NaCl solution mist. Air was supplied to the cathode through the custom-made mist generator. Na+ and Cl- ions were carried by air to the fuel cell cathode. The effects of NaCl solution on the electrochemical characteristics of PEMFCs were investigated using the custom-made mist generator. The current density–voltage–power density and electrochemical impedance spectroscopy (EIS) of fuel cells were measured. The long-term stability of fuel cells operated with NaCl solution mist was also evaluated. The regeneration of fuel cells was conducted with DI water after the long-term stability experiments. We believe that the results of this study provide meaningful insight for other researchers about the marine application of fuel cells.
2. Experiments
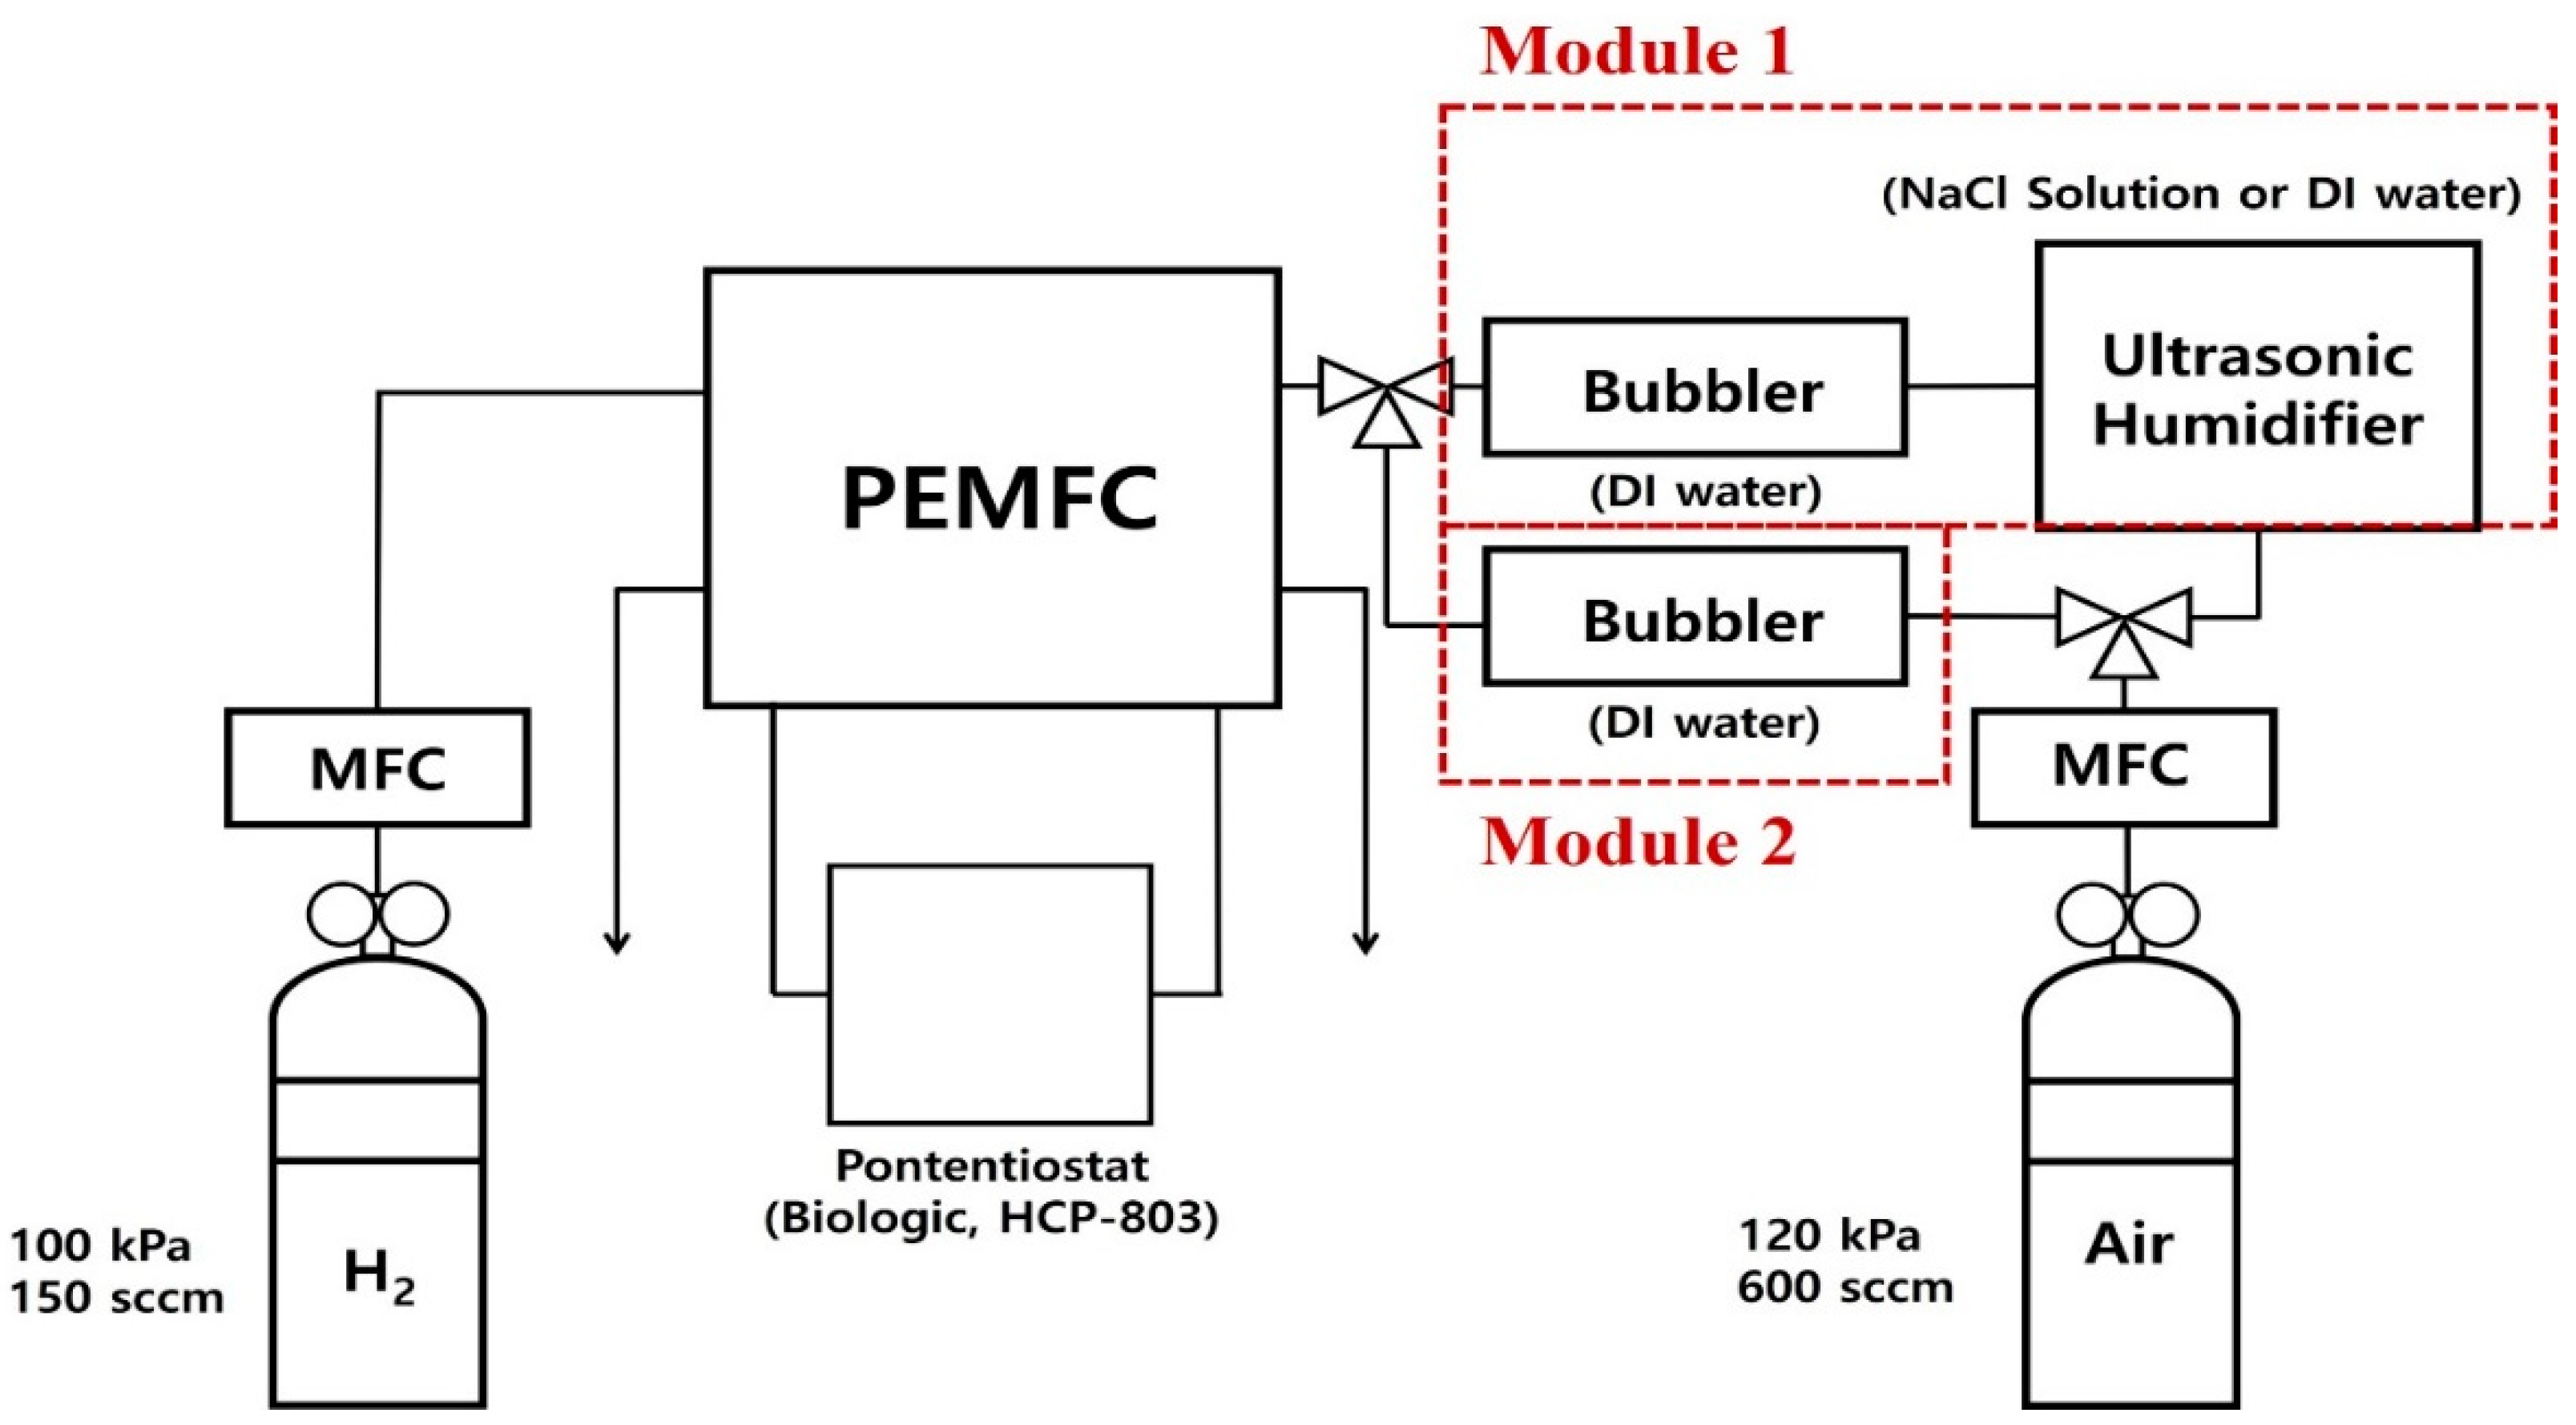
This study investigated the effects of NaCl solution mist on the electrochemical characteristics of PEMFCs. As previously mentioned, NaCl (or Na+ and Cl−) mist was supplied to the cathode through the air supply system of fuel cells in ocean environments. In order to simulate NaCl mist, a custom-made mist generator using ultrasonic vibrators was applied between the fuel cell and air mass flow controller (MFC). The concentration of NaCl solution was maintained at 3.5 wt.%.
Figure 1 shows the pipe and instrument drawing of the custom-made fuel cell test set-up. A total of 150 sccm of dry H
2 (Samjung energy, Paju-si, Republic of Korea) was supplied to the anode of PEMFCs, and 600 sccm of humidified air (Samjung energy, Paju-si, Republic of Korea) was provided. Relative humidity was kept at 100% for all experiments. As shown in
Figure 1, humidification was carried out using both a bubbler and a custom-made humidifier. Humidification module No. 1 consisted of an ultrasonic vibrator and a bubbler with de-ionized water (DI water). Humidification module No. 1 was used to evaluate the effects of NaCl on fuel cells. Therefore, clean mist (i.e., DI water mist) was supplied for the reference case, and NaCl mist was supplied for the NaCl case. The bubbler with DI water was placed before fuel cells to simulate NaCl flowing in through an air duct. Humidification module No. 2 consisted of a bubbler with DI water. Module No. 2 was used to regenerate PEMFCs with uncontaminated water.
Table 1 summarizes the experiment cases.
For the PEMFC, a commercial membrane electrode assembly (MEA) with a 5.06 cm2 active area (CNL Energy, Seoul, Republic of Korea) was used. The catalyst loading (Pt loading) of the anode was 0.4 mg/cm2 and the cathode was 0.4 mg/cm2, respectively. A commercial gas diffusion layer (GDL) was also used (SGL, GDL 39 BB, Germany). Graphite bipolar plates with serpentine-type flow channels were used. The depth of the flow channel was 0.8 mm, and the width was 1.0 mm.
A commercial potentiostat (HCP-803, BioLogic, Seyssinet-Pariset, France) was used to evaluate the electrochemical characteristics of PEMFCs. The Current density–voltage–power density and EIS of fuel cells were measured. EIS was measured with a sinusoidal frequency range from 200 kHz to 100 mHz at various biased voltages. The effects of NaCl mist on fuel cells were investigated using chronoamperometry measurements between 0.7 V and 0.3 V for 20 h. After the experiments with NaCl solutions (module No. 1), the PEMFCs were regenerated using the bubbler with DI water (module No. 2). For regenerations, humidified air was supplied to the cathode of fuel cells through bubbling at open circuit conditions and constant voltage conditions (0.4 V) for 3 h. All experiments were conducted at 25 °C.
3. Results and Discussions
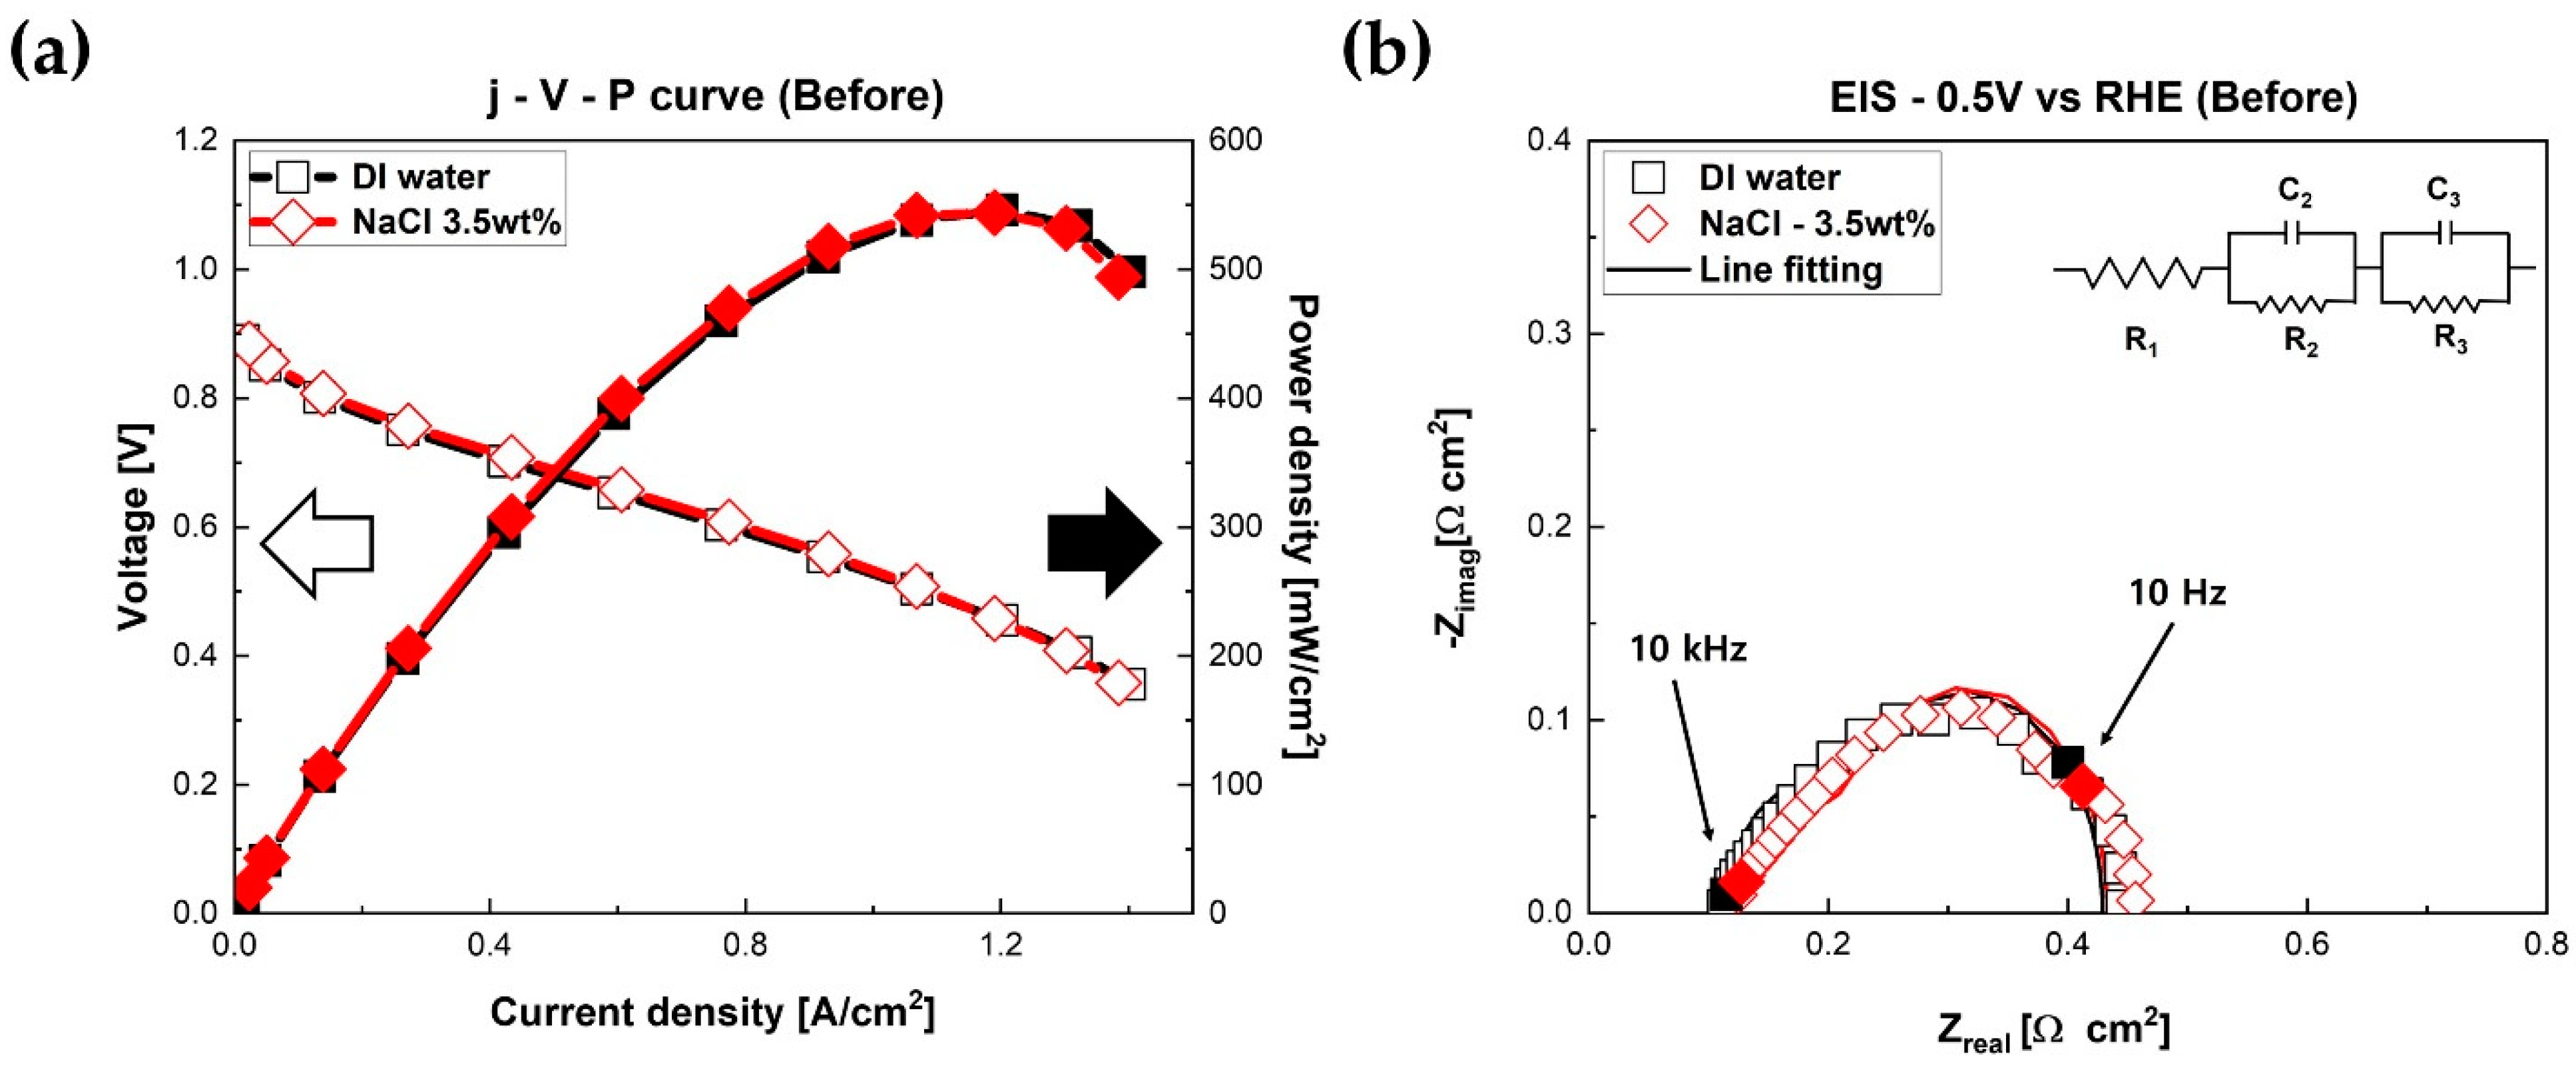
Figure 2 presents polarization curves of fuel cells measured at different humidification conditions using humidification module No. 1 (Cases 1 and 2). As illustrated in
Figure 2a, the initial performances of PEMFCs were almost identical, regardless of the solutions. Both fuel cells achieved very similar open circuit voltages (OCVs). The maximum power densities of fuel cells were about 546 mW/cm
2 with DI water mist and NaCl mist. These almost similar performances imply that NaCl solution mist, or Na
+ and Cl
- ions in the mist, had negligible impact on the electrochemical characteristics of PEMFCs for the first short time. Mikkola et al. reported that Na
+ ions, which substituted protons (H
+), moved through ionomers [
21]. Therefore, in this prior report, proton conductivity in the electrolyte was significantly reduced. B. V. Sasank et al. also reported that the movement of Na
+, which was supplied to the cathode of fuel cells, was strenuous because of the difference in electrical potentials between the anode and cathode of fuel cells [
27]. In order to verify the detailed electrochemical behavior of fuel cells, EIS measurements at 0.5 V were performed. As shown in
Figure 2b, both fuel cells had almost identical ohmic resistances (0.115 Ω·cm
2 for DI water and 0.12 Ω·cm
2 for NaCl solution) and faradaic resistances (0.314 Ω·cm
2 for DI water and 0.313 Ω·cm
2 for NaCl solution) at 0.5 V. There was no difference between ohmic resistance and faradaic resistance.
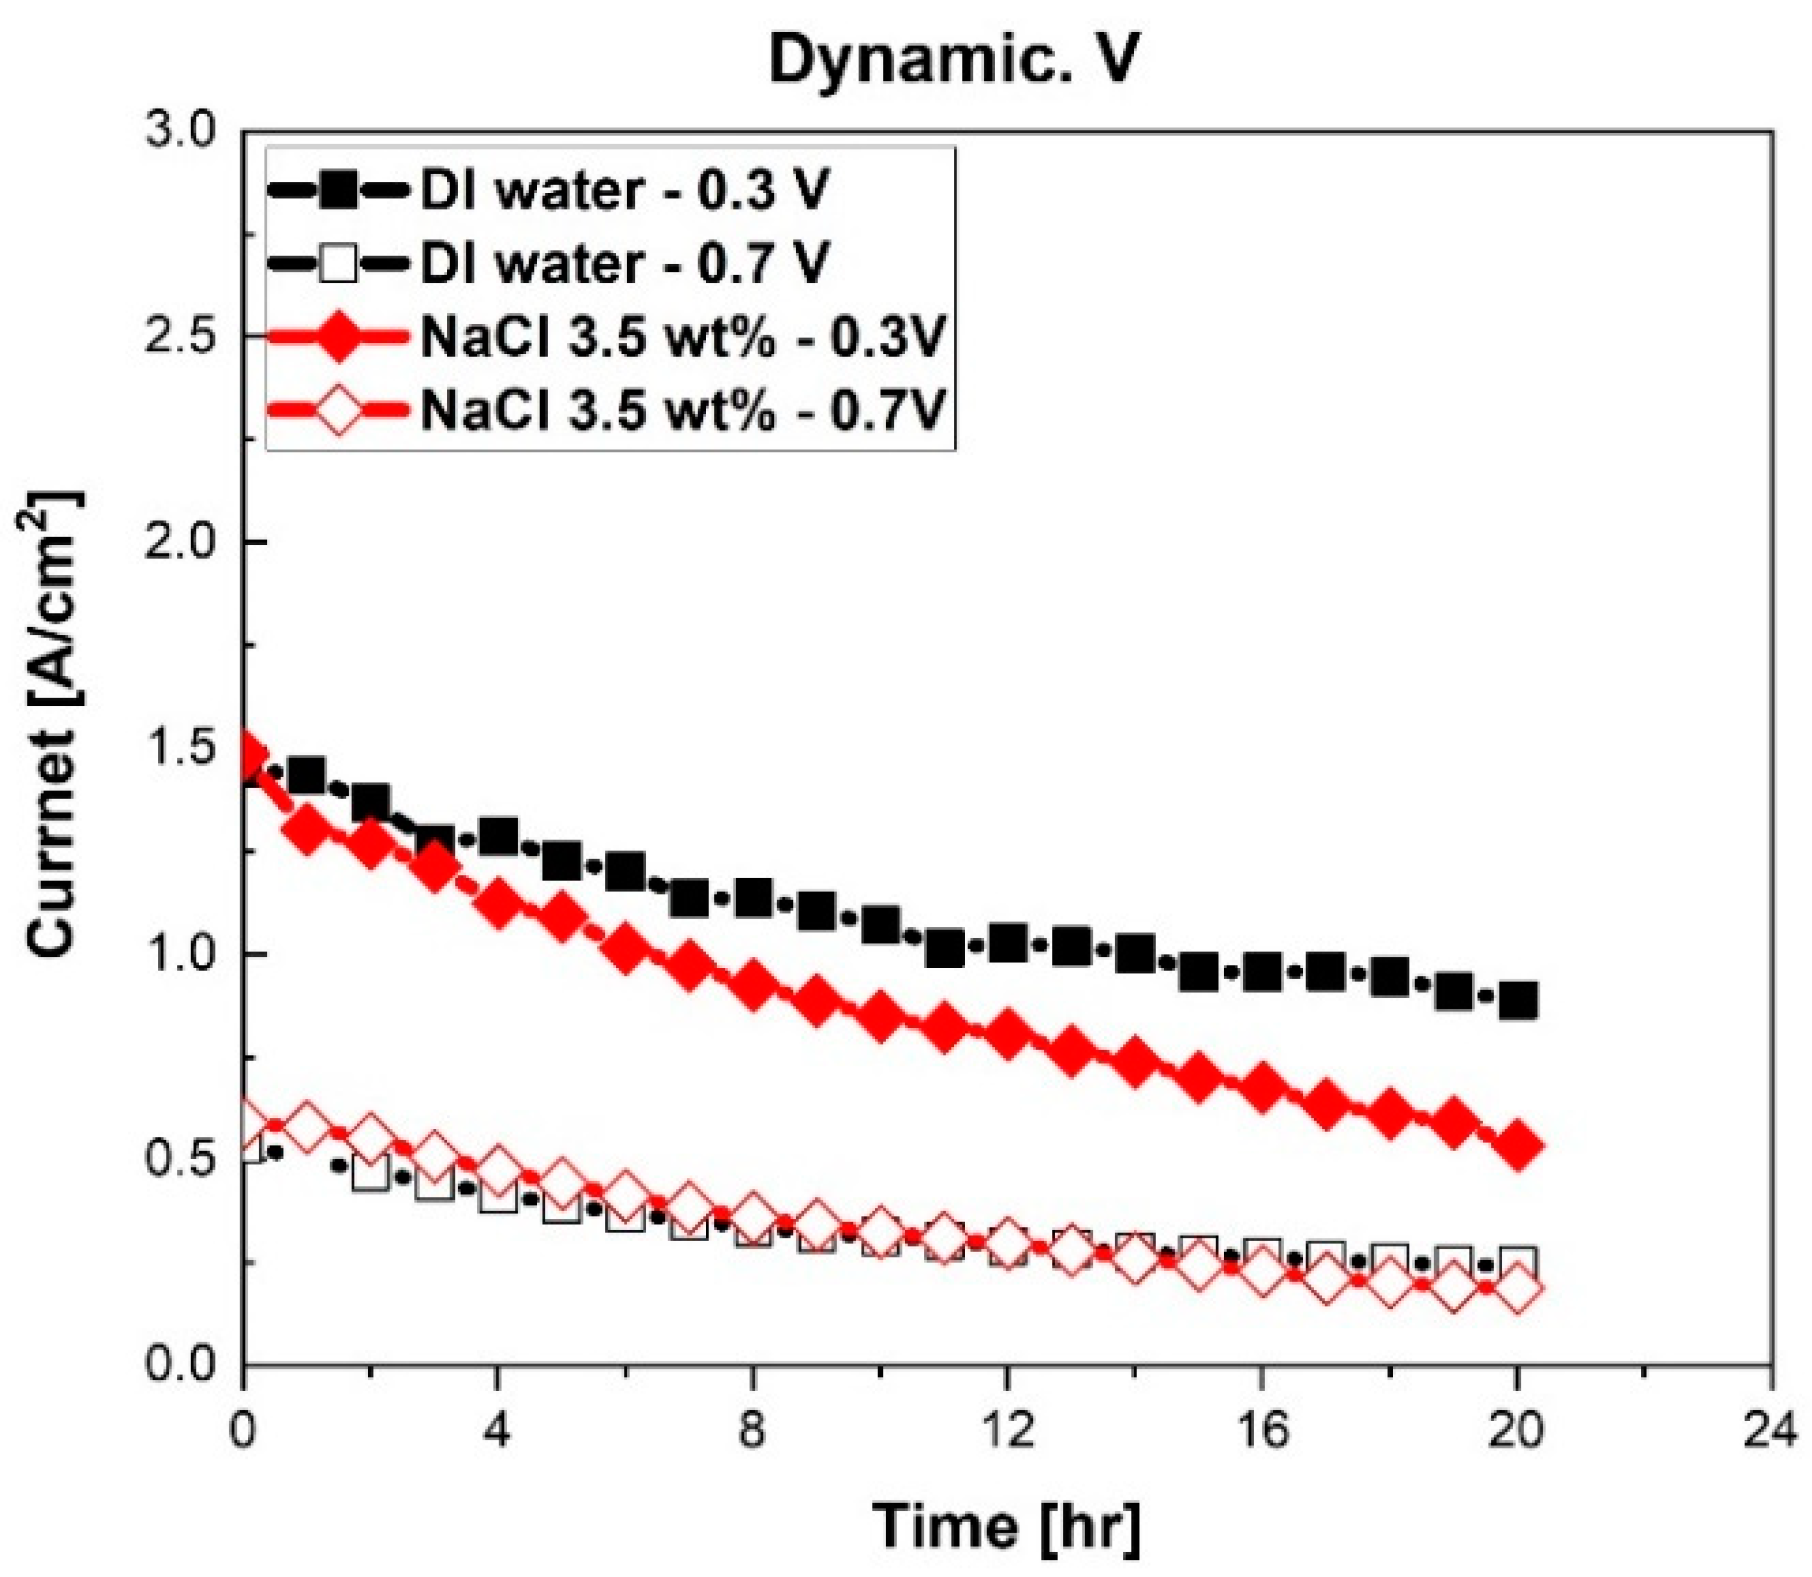
After the characterization of fuel cells at the initial stage, long-term stability experiments were conducted. As previously mentioned, chronoamperometry measurements were conducted for 20 h. Currents of fuel cells at 0.7 V and 0.3 V were measured. The results of the chronoamperometry test are illustrated in
Figure 3.
The performance of a fuel cell with NaCl solution decreased more compared to the fuel cell with DI water, as shown in
Figure 3. Notably, the higher current area of fuel cells measured at 0.3 V reduced significantly. The current of the PEMFC with DI water reduced from 1.45 A/cm
2 to 0.89 A/cm
2 at 0.3 V (reduction 0.56 A/cm
2, 38.8%). The current at 0.7 V reduced from 0.54 A/cm
2 to 0.24 A/cm
2 (reduction 0.3 A/cm
2, 54.8%). However, in the case of the fuel cell with NaCl solution, the current of the fuel cell at 0.3 V reduced from 1.48 A/cm
2 to 0.54 A/cm
2 (reduction 0.95 A/cm
2, 63.9%). The current at 0.7 V reduced from 0.59 A/cm
2 to 0.19 A/cm
2.(reduction 0.4 A/cm
2, 68%) Furthermore, the degradation rate of the current was high at 0.3 V with NaCl solution. The degradation rates of the fuel cell with DI water were 0.015 A/cm
2·h at 0.7 V and 0.028 A/cm
2·h at 0.3 V. The degradation rates of the PEMFC humidified with NaCl solution were 0.020 A/cm
2·h at 0.7 V and 0.047 A/cm
2·h at 0.3 V. Therefore, NaCl solution mist, or Na
+ and Cl
- in mist, decreased the performance of fuel cells, especially in high current density areas. In other prior research, Cl
- ions were adsorbed on Pt catalysts in the catalyst layer [
22,
23]. Therefore, TPBs in Pt catalysts decreased, and then, activation loss of PEMFCs increased. Thus, in our study, it was assumed that accumulated Na+ and Cl- in PEMFCs degraded electrochemical characteristics.
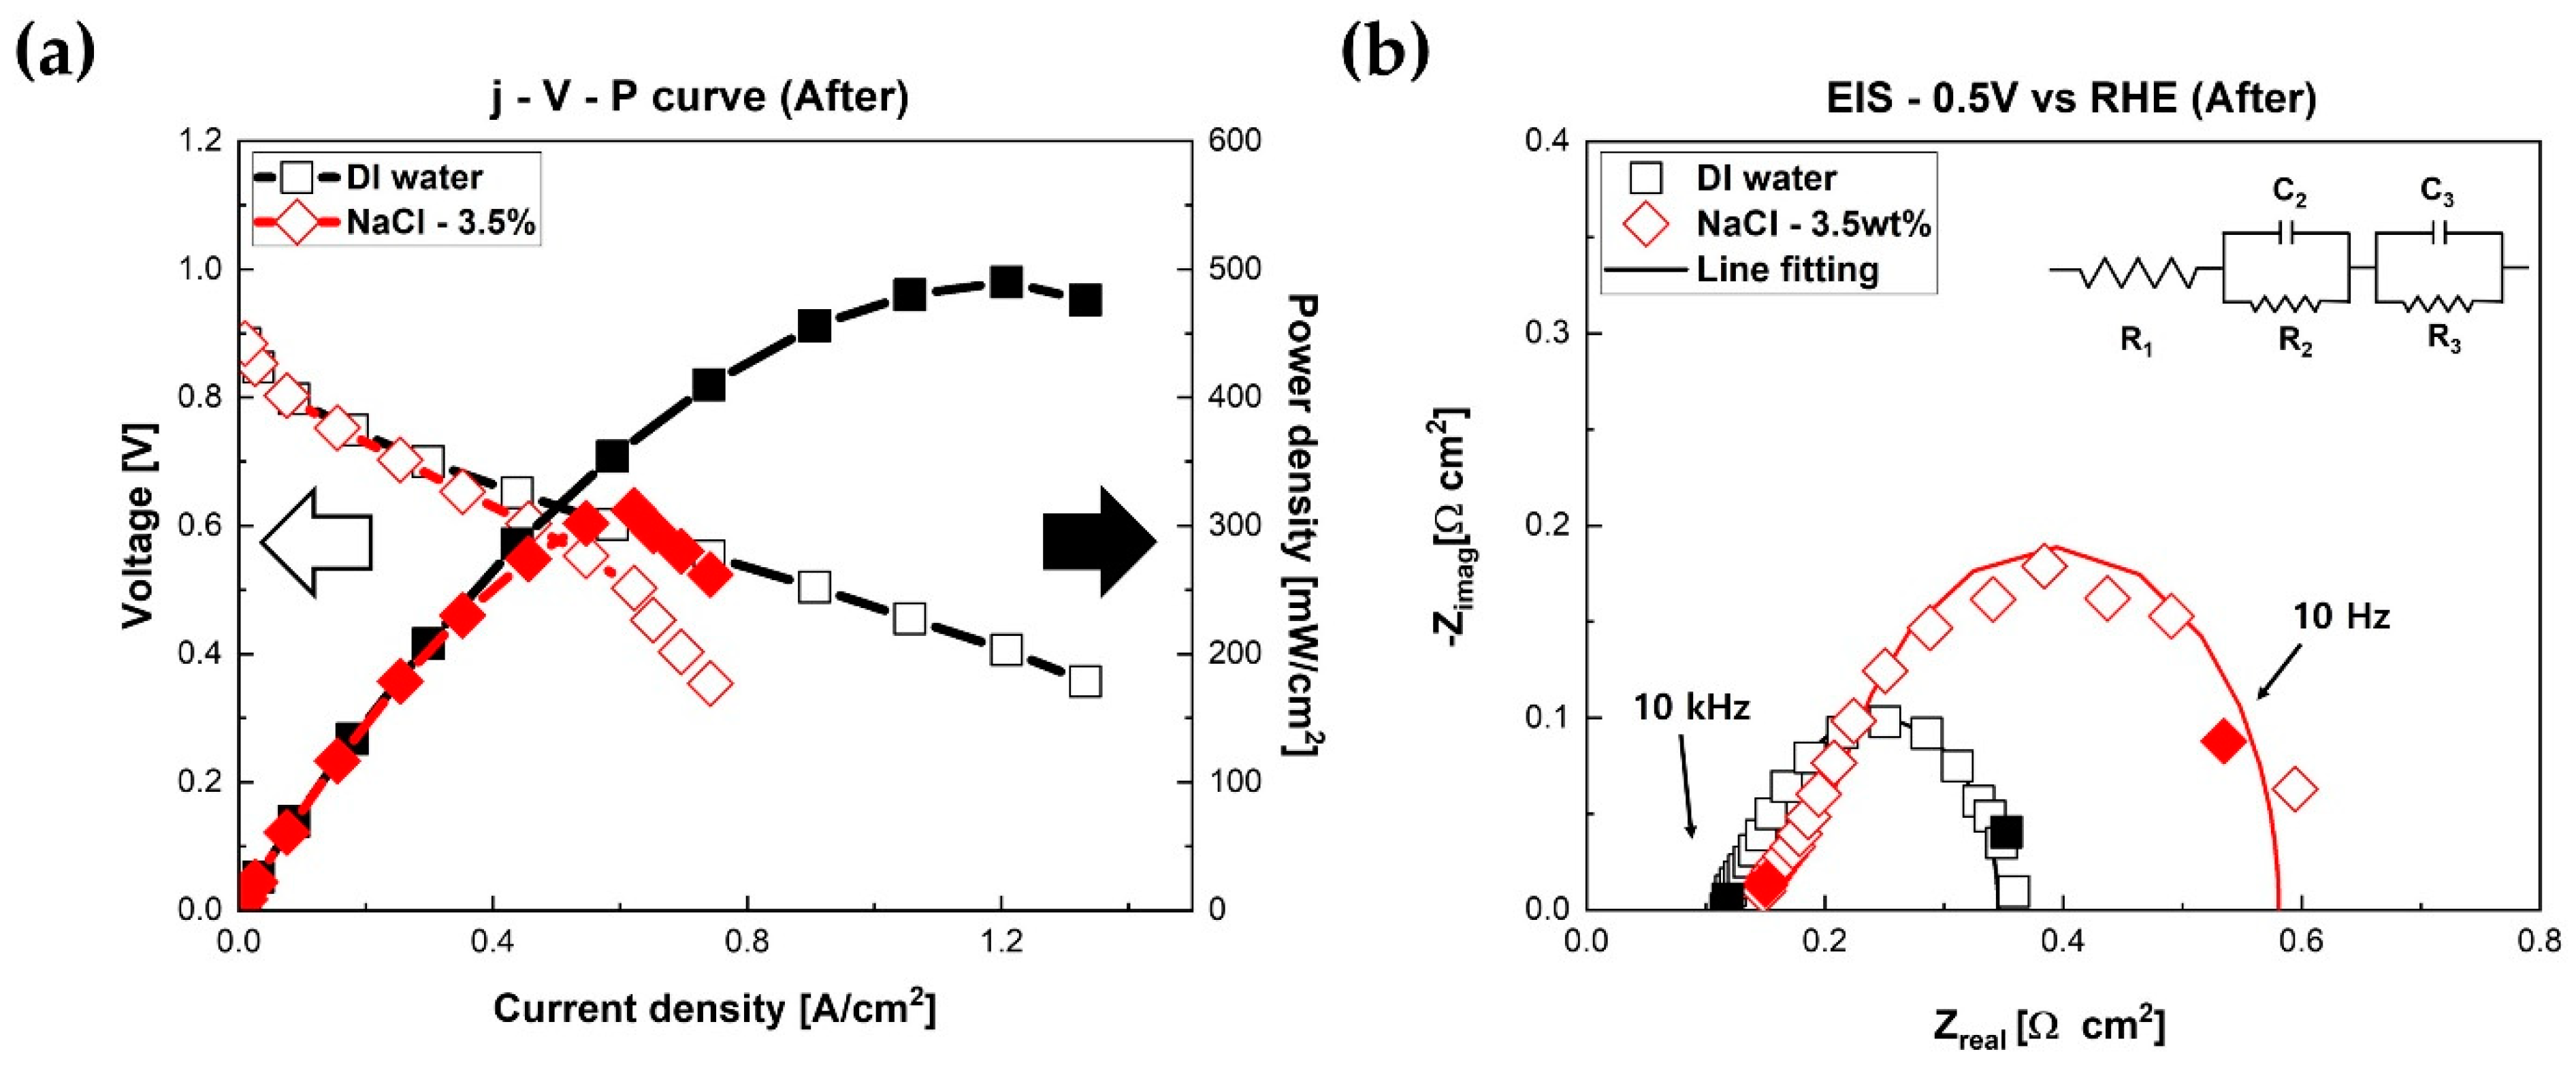
Electrochemical characterizations of fuel cells were conducted again after chronoamperometry measurements.
Figure 4 presents the results of current density–voltage–power density curves and Nyquist plots of fuel cells after chronoamperometry measurements. The polarization curves of fuel cells are presented. As shown in
Figure 4a, the performance of PEMFC humidified with NaCl mist decreased significantly compared to the fuel cell with DI water. The maximum power density reduced from 546 mW/cm
2 to 314 mW/cm
2 (reduction 242 mW/cm
2, 42.4%). However, the fuel cell humidified with DI water mist reduced from 546 mW/cm
2 to 492 mW/cm
2 (reduction 54 mW/cm
2, 5%). After 20 h chronoamperometry experiments, the performance of fuel cells humidified with NaCl mist reduced by a factor of 4 compared to the fuel cells humidified with DI water.
Figure 4b illustrates Nyquist plots of fuel cells measured at 0.5 V. Compared to the EIS results in
Figure 2b, the size of the circle of the fuel cell humidified with NaCl solution increased remarkably.
It is generally known that the
x-axis intercept pointing at the high-frequency area in EIS results represents the ohmic resistance of fuel cells [
8]. Furthermore, the diameter of the circle illustrated in the low-frequency area in EIS results represents the faradaic resistance of fuel cells [
10]. Therefore, as shown in
Figure 4b, both the ohmic resistance and faradaic resistance of PEMFC with NaCl solution became higher after 20 h experiments compared to the fuel cell with DI water at 0.5 V. Notably, the faradaic resistance of the fuel cell increased significantly. The ohmic resistance of the fuel cell with DI water was 0.118 Ω·cm
2, and the faradaic resistance was 0.23 Ω·cm
2. The ohmic resistance of the PEMFC with NaCl solution was 0.15 Ω·cm
2 (+0.03 Ω·cm
2, +25%). The faradaic resistance was 0.431 Ω·cm
2 (+0.118 Ω·cm
2, +37.7%) at 0.5 V. All resistances (ohmic resistance and faradaic resistance) increased remarkably compared to the EIS results of the fuel cell with DI water.
Finally, regeneration experiments were performed.
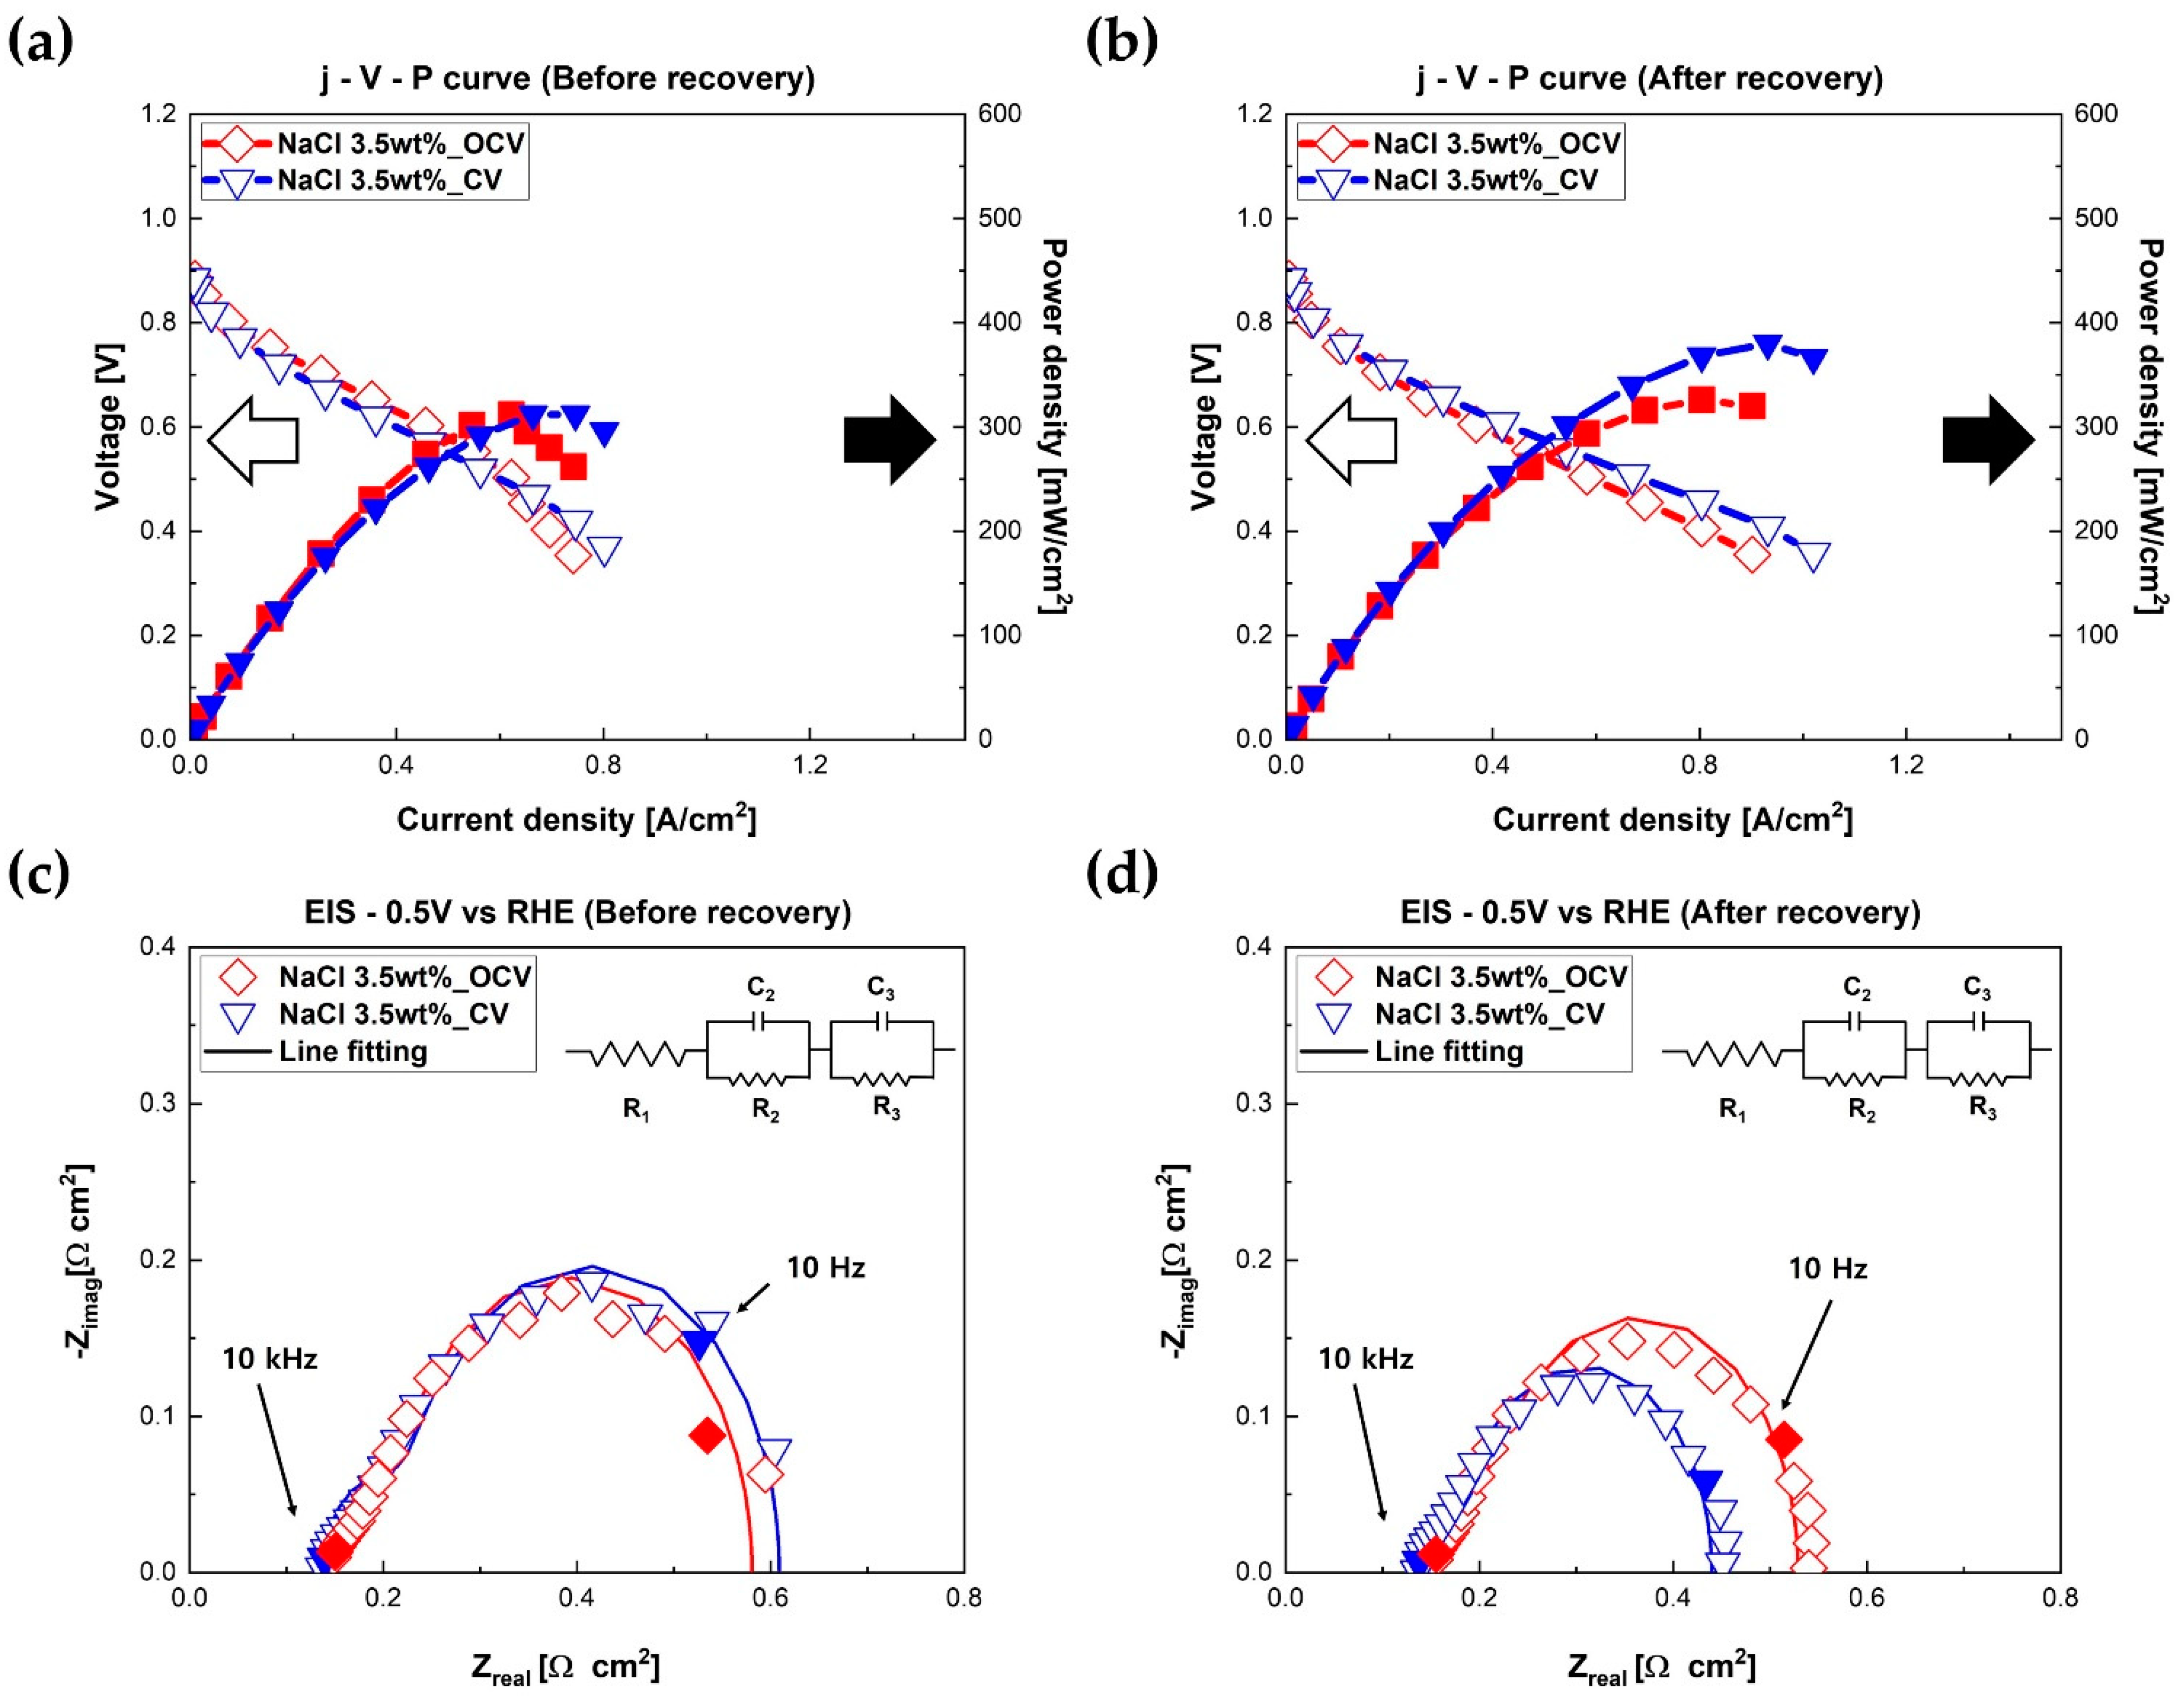
Figure 5 shows the electrochemical characteristics of fuel cells before and after regeneration experiments. Clean DI water was supplied to the cathode of fuel cells for regeneration to remove Na
+ and Cl
- from components of fuel cells, i.e., Pt catalyst, GDL, gasket, and flow channel. Humidification module No. 2 (the bubbler with DI water only) was used to regenerate fuel cells. In addition to the external DI water supplied by the bubbler, water generated by electrochemical reactions of the fuel cell was used. Therefore, two methods were applied to regenerate fuel cells to verify the effects of water generation on fuel cells. First, the contaminated fuel cell operated with NaCl solution after 20 h was regenerated at OCV status and humidified with DI water for 3 h. The other contaminated fuel cell was regenerated at 0.4 V (the high current area) and humidified with DI water for 3 h.
Figure 5a presents polarization curves of fuel cells before regeneration.
Figure 5b shows polarization curves of fuel cells after regeneration. As shown in
Figure 5b, the maximum power densities of fuel cells improved after regeneration with DI water. Interestingly, increased maximum power density was clearly dependent on the regeneration method. The fuel cell regenerated at OCV status for 3 h recovered its performance from 314 mW/cm
2 to 326 mW/cm
2 (+12 mW/cm
2, +3.6%). Remarkably, the PEMFC that was regenerated at 0.4 V, i.e., high current area status, for 3 h recovered its performance from 318 mW/cm
2 to 380 mW/cm
2 (+62 mW/cm
2, +16.3%). In other words, the fuel cell regenerated in the high current area recovered more than five times in performance compared to the fuel cell regenerated in the OCV state. The regeneration rate of each method was 4 mW/cm
2·h at OCV status and 20.7 mW/cm
2·h at 0.4 V. Additionally, EIS measurements were performed after regeneration at 0.5 V.
Figure 5c,d present Nyquist plots of fuel cells before and after the regeneration process. Similar to the results of polarization curves in
Figure 5b, faradaic resistances of fuel cells reduced slightly after regeneration. Interestingly, the improved amount of faradaic resistances, i.e., reduced amount of faradaic resistances of fuel cells, was dependent on the regeneration methods. The faradaic resistance of the fuel cell regenerated at 0.4 V reduced from 0.472 Ω·cm
2 to 0.305 Ω·cm
2 (−0.167 Ω·cm
2, −35.4%). However, the faradaic resistance of PEMFC regenerated at OCV status decreased from 0.431 Ω·cm
2 to 0.369 Ω·cm
2 (−0.062 Ω·cm
2, −14.4%). This implies that both external DI water supplied by air and internally generated water were effective in removing Na
+ and Cl
- ions in fuel cells, especially related to the catalyst for regeneration. It is interesting to note that the ohmic resistances of fuel cells showed negligible changes after regeneration compared to faradaic resistances of fuel cells. The ohmic resistance of the fuel cell regenerated at 0.4 V decreased from 0.138 Ω·cm
2 to 0.135 Ω·cm
2 (−0.003 Ω·cm
2, −0.02%). However, the faradaic resistance of PEMFC regenerated at OCV status decreased from 0.431 Ω·cm
2 to 0.369 Ω·cm
2 (−0.062 Ω·cm
2, −14.4%). This means that, compared to the faradaic resistance, the recovery of the ohmic resistance of PEMFC was not significantly affected by fuel cell regenerations carried out using externally provided water and internally produced water.
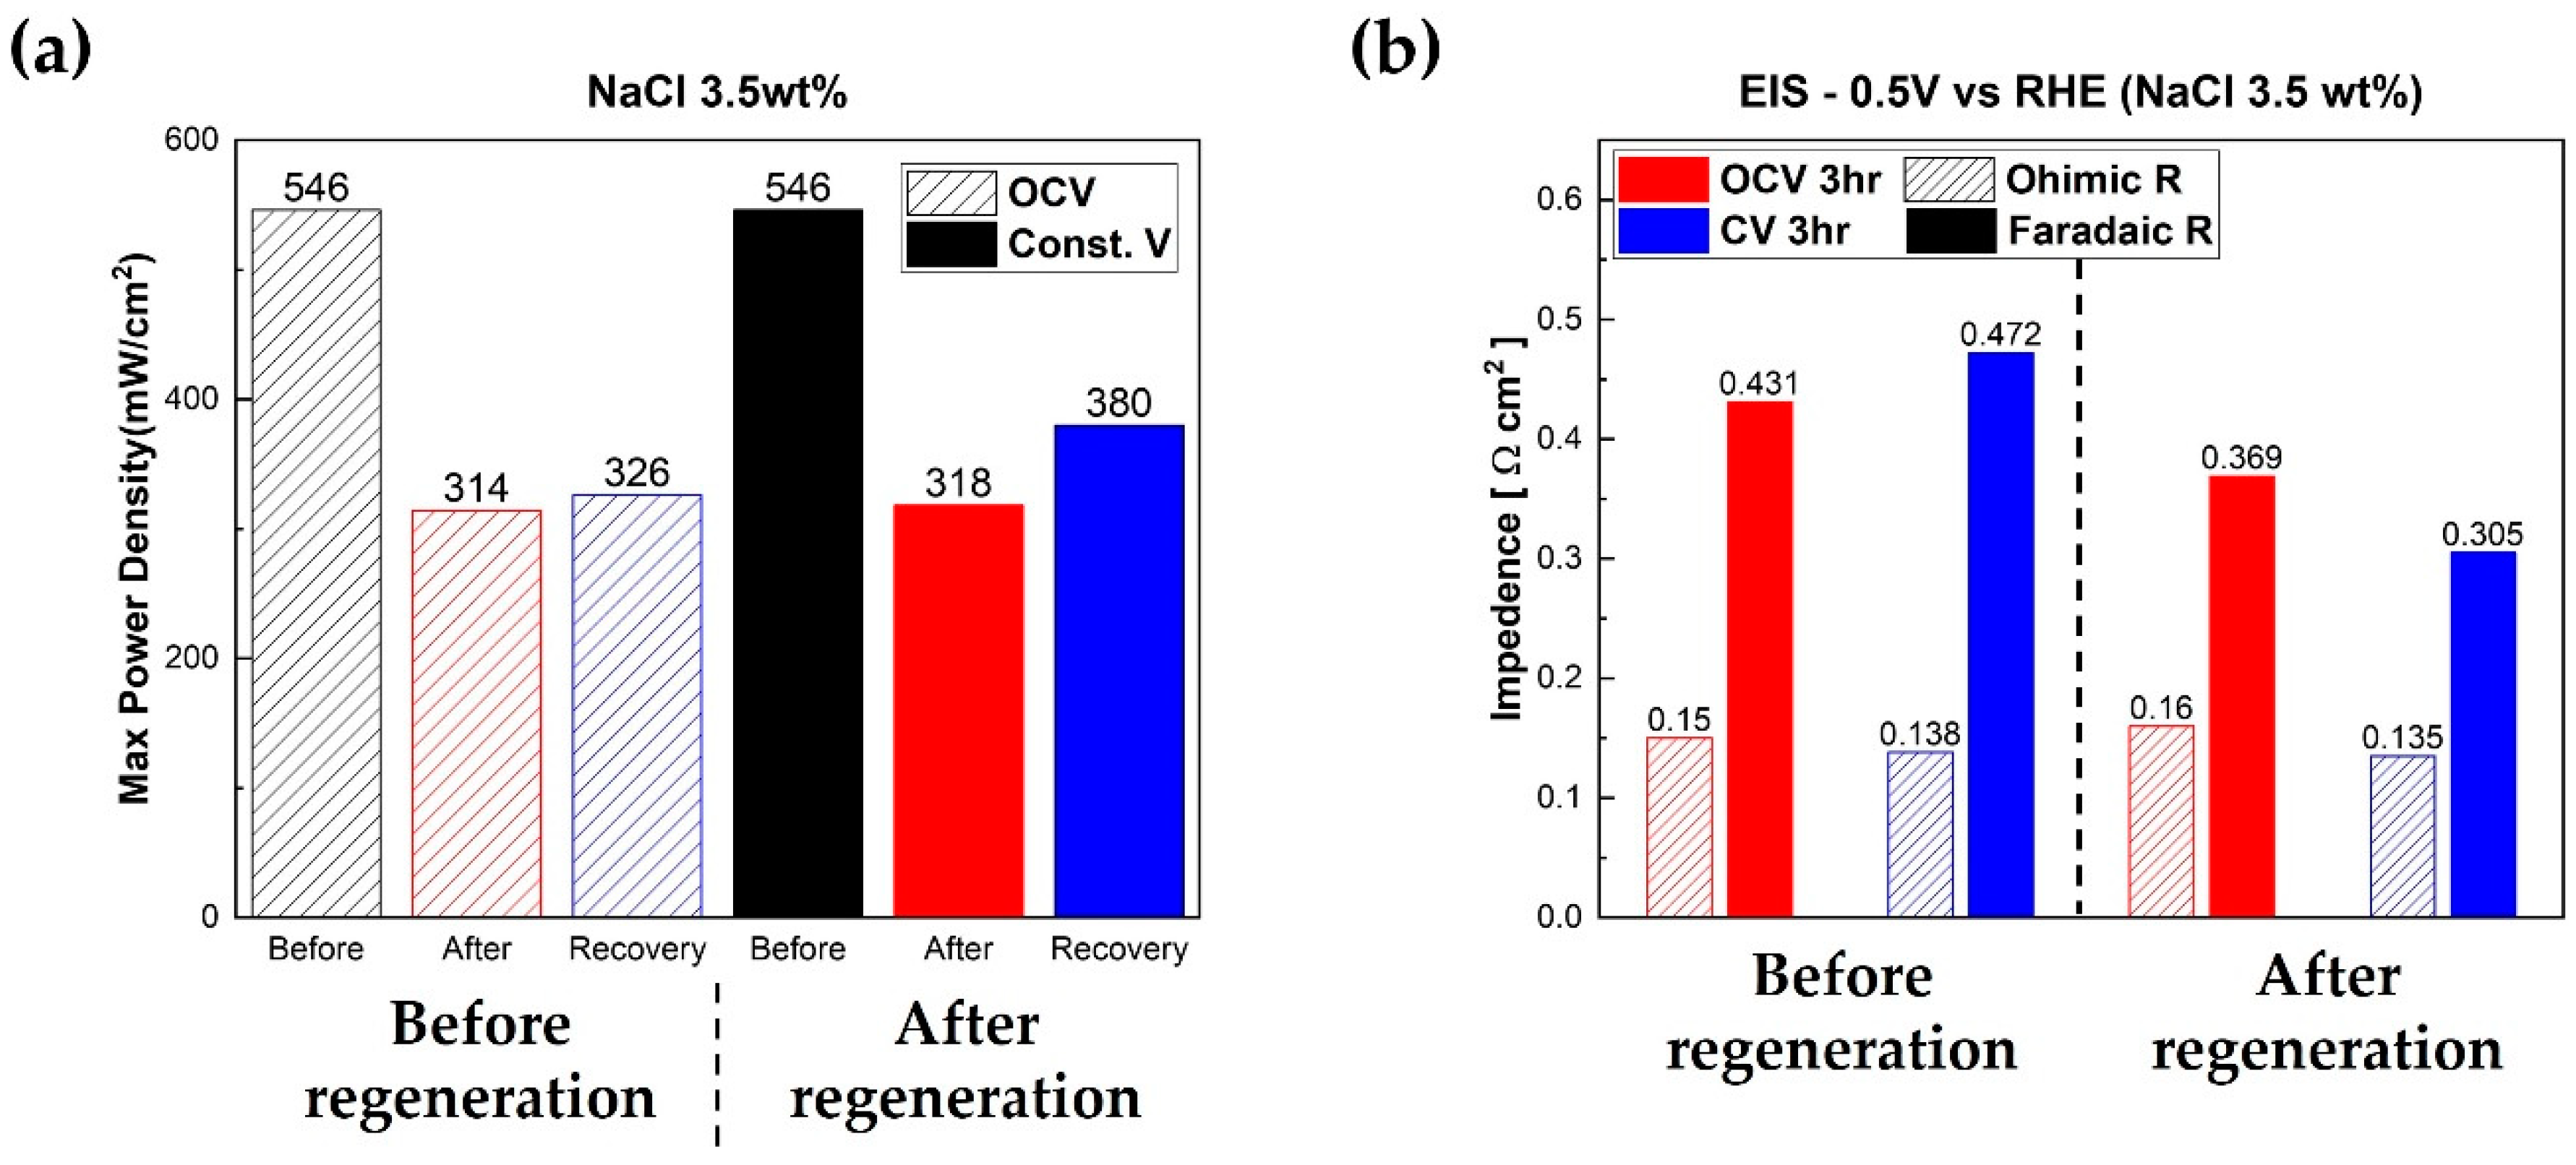
Figure 6 summarizes the results of regeneration experiments.
Figure 6a shows the maximum power densities of fuel cells. As we mentioned before, the performance of fuel cells humidified with NaCl solution degraded more than the PEMFC with DI water. Additionally, the regeneration of PEMFC at 0.4 V for 3 h was remarkably effective compared to the regeneration at OCV for 3 h. The summary of the EIS analysis is illustrated in
Figure 6b. Long-term stability experiments were conducted on fuel cells using chronoamperometry modes between 0.7 V and 0.3 V for 20 h. After chronoamperometry measurements, regeneration tests were carried out using DI water. Faradaic resistance of the fuel cell regenerated at the high current area (0.4 V) decreased notably because of the externally supplied water and the internally generated water compared to the fuel cell regenerated at OCV.


