Abstract
Climate change has been affecting agricultural water resources dynamics spatially and temporally. This article presents analysis results of climate change impact on agricultural water availability in Cimanuk Watershed, Indonesia. STREAM was utilized to model agricultural water availability through FAO MOSAICC web application. Climate spatial data time-series were generated using 3 Global Climate Model (GCM), i.e.,: CanESM2, CNRM-CM5, and MPI-ESM-MR following two climate change scenarios of RCP4.5 and 8.5. Model inputs were split into three periods of 1981–2010 (historical), 2010–2039 (near-future), and 2040–2069 (far-future). Historical data model validation showed the efficiency coefficient of the observed and simulated discharge data ratio was 0.68. The results showed a decreasing volumetric water availability from all generated climate data and scenarios, identified by comparing the discharge normal distribution of the historical and future data periods. Whereas, trend analysis of RCP4.5 scenario showed increasing maximum discharge of Cimanuk river using CanESM2 and MPI-ESM-MR GCM’s data, with a Mann–Kendall coefficient of 3.23 and 3.57. These results indicate a different agricultural water balance status within the watershed area, particularly a “very critical” water balance in Indramayu and Majalengka, “critical” in Garut, and “close to critical” in Sumedang Regency.
1. Introduction
Global climate change has impacted most of human life aspects, including water resources. Those evidences have been reported systematically by the Intergovernmental Panel on Climate Change [1] and The United Nations Framework Convention on Climate Change [2]. Climate change has accelerated the increase in hydrological cycles variability, change in temperature and rainfall [3,4,5], and shift in the direction of water flow in the snow area [6]. Climate change has reduced water supply and demand, exacerbating water scarcity, affecting the hydrological response, and, therefore, threatening sustainable development worldwide. In response to these negative impacts on water resources, governments worldwide have issued water management strategies to mitigate climate change, including the United States federal agency [7], the Philippines [8], and India [9].
Climate change has caused a water production decrease in several watersheds, worsened by irregular rainfall patterns due to increasing duration of extreme dry and/or wet months. For example, a decrease in annual rainfall in the southern part of Java Island was recorded during the periods of 1931–1960 and 1968–1998, to reach about 100 mm [10].
Researchers have developed models to compare, evaluate, and then mitigate climate change’s negative impacts to the environment. Such a model—developed by the Food and Agriculture Organization (FAO, Rome, Italy) particularly to evaluate climate change impact in agriculture—is the Modelling System for Agricultural Impacts of Climate Change or MOSAICC [11]. MOSAICC integrated climate scenarios data, crop growth simulations, hydrological, and also economic modeling in its analysis [12]. MOSAICC has been successfully implemented to assess the climate change impacts to develop adaptation and mitigation strategies in Morocco [13]. Various data output from climate models such as the Global Circular Model (GCM) can also be utilized in MOSAICC to further simplify the analysis process in regards to data preparation.
MOSAICC utilizes the Spatial Tools for River Basins and Environment and Analysis of Management Options (STREAM) for hydrologic analysis and modeling. STREAM is a GIS-based model that is used to assess impacts of climate change and its variability, as well as changes in land uses, on the availability of water resources and projected discharge patterns in a watershed in the future [14]. Hydrologic models are the most popular environmental research topic in agronomy. The topics include simulating the effects of irrigation and other agricultural practices and studying the impact of extreme weather events and climate change [15], ensuring water security by the application of best management practices varying from focused sectoral measures of sustainable water use to emission regulations to protect water quality and all dependent ecosystems’ chain [16]. STREAM is generally used to study and analyze the impact of land use and climate change on hydrological conditions in a watershed, specifically to estimate discharge under several climatic conditions and scenarios [17]. STREAM has been successfully utilized to analyze the impact of climate change and land use change on the hydrological conditions in the Ganges Brahmaputra watershed in South Asia and the Rhine in Europe [14], to assess increasing water use and runoff of the Khrisna River in India [18], to estimate the availability of water for irrigation for heterogeneous watersheds in eastern Africa [19], and also to estimate river flow in areas with limited data availability in the Philippines [20]. This model has also been reported to produce reliable data at various locations with different climatic characteristics [21,22]. The STREAM model has also been implemented to simulate river discharges in several watersheds in Indonesia [23,24].
In the previous study, STREAM direct uses for agricultural water analysis have not been extensively reported. However, several research have utilized STREAM as part of the MOSAICC system to assess climate change impact on agricultural water and changes in hydrological characteristics [25,26,27,28,29]. This research utilized STREAM as an integrated hydrological model in the MOSAICC system to simulate the impact of climate change on the past, current, and future river discharges [14]. This research also specifically implemented a novel approach of integrating the STREAM model and crop water-balance analysis to assess not only river discharge dynamics due to climate change, but also its impacts on agriculture land productivity. STREAM as a distributed hydrology model better represents spatial variation of its model inputs compared to the general hydrology lumped model. STREAM is also able to examine river discharges at any point along the generated artificial drainage network, making it possible to identify discharge variation at any selected water outlet. This particular STREAM feature opens the possibility to manage irrigation water at the administrative level rather than watershed level, hence, further simplifying the complex irrigation water management in a central agriculture region.
The main objective of this study was to analyze impacts of climate change on agricultural water availability in Cimanuk watershed, Indonesia. This article specifically addressed (1) current and future agricultural water availability under different climate change scenarios, which will be useful for better management of water resources, water resources strategies, planning agricultural production, in addition to research related to food security from the effects of climate change in Indonesia; (2) changes in hydrological characteristics of Cimanuk watershed caused by the projected climate change events; and (3) changes in crop water balance in the agricultural area within the Cimanuk watershed. Cimanuk watershed was selected as the study site because its role as the main water source that provides about 2.2 billion m3 water per year for agricultural irrigation in the area [30]. Therefore, results of this research might be beneficial for policymakers to design water use management plans for climate change adaptation and mitigation measures and to better regulate sustainable water supply and demand in the Cimanuk watershed.
2. Materials and Methods
2.1. Study Site Description
The Cimanuk watershed is an area along the Cimanuk river and geographically located at 06°13.7′–07°25.7′ South Latitude and 107°42.5′–108°24.5′ East Longitude (Figure 1). The watershed area is about 3493 km2, with the length of the main Cimanuk river is about 337.67 km [31]. The Cimanuk watershed is administratively shared by 4 regencies including Garut, Sumedang, Majalengka, and Indramayu.
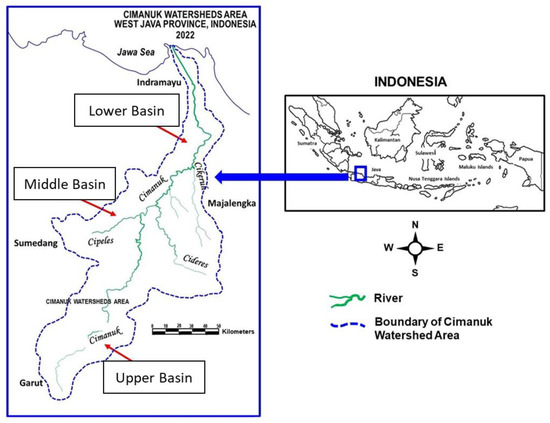
Figure 1.
Location of Cimanuk Watersheds.
The area of the Cimanuk watershed is generally divided into three geographical zones, namely the Lower Basin, Middle Basin, and Upper Basin, which characterizes a distinctive landscape with an area of 81,299 Ha, 114,477 Ha, and 145.677 Ha, respectively [31,32]. The Lower Basin covers most of the Indramayu Regency and is the closest zone to the Java Sea and mostly flat topography with slope in the range of <1 to 15%. The Middle Basin has more diverse topography and landscape, with a steeper slope up to 25%. Moreover, the Upper Basin is a volcanic cone, choppy to hilly landscape, with high variation of slope in the range of 3 to more than 40% [33].
2.2. Materials
Agricultural water availability analysis was performed utilizing available online spatial global datasets from various sources. Spatial data of the study area consist of an SRTM 30 m resolution digital elevation model (DEM) [34], 1:250,000 land use map [35], soil water holding capacity map at 250 m resolution [36], and spatial climate data series (monthly temperature and precipitation from 1981 to 2069). The spatial climate data series were generated using 3 downscaled global climate models (GCM) including CanESM2 [37], CNRM-CM5 [38], and MPI-ESM-MR [39] followed 2 global climate change scenarios (i.e., RCP4.5 and RCP8.5). The climate data downscaling process utilized Statistical Downscaling Model (SDSM) in the tropical region involving procedures of (1) observation data transformation and quality control, (2) screening of predictor variables, (3) model calibration, (4) generating downscaled weather parameter data according to scenario, (4) frequency and time series analysis, and (5) summary statistics [40]. All spatial data were pre-processed using QGIS software [41]. The generated climate data series were later divided into 3 data periods, consisting of historical (1981–2010), near-future (2011–2039), and far-future projection period (2040–2069). Along with these global datasets, this research also utilized local monthly river discharge and precipitation data that were collected from Eretan water monitoring ground stations installed in the Cimanuk river. This local data was mainly used for model calibration and result assessment.
2.3. Methods
The global climate change impacts on agricultural water availability in the Cimanuk watershed were assessed through three consecutive steps of analysis. The first analysis was river discharged simulation modeling following the 2 global climate change scenarios from the 3 GCMs utilizing the STREAM hydrology model through MOSAICC system [11,14]. STREAM as a grid-based hydrology model specifically treats the catchment hydrology cycle as a series of the storage compartment and flows [14]. MOSAICC integrates a modified version of STREAM that offers the flexibility of data input, the possibility to incorporate dams in the water cycle, and a model calibration module [12]. The STREAM model flow chart is presented in Figure 2.
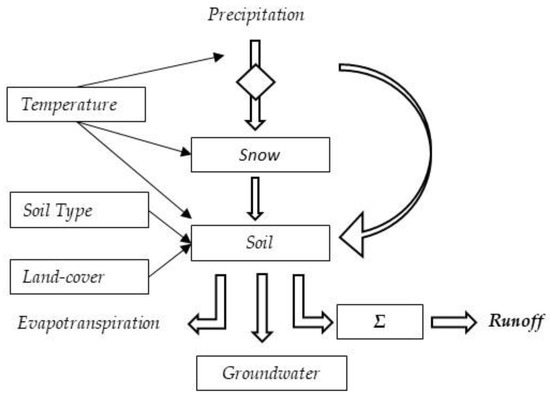
Figure 2.
Flow chart of the STREAM mode, Modified from [14].
STREAM considers climate, snow, soil, and groundwater reservoir in its model, and has a fast and slow runoff component. The soil moisture storage affects the fast component, while ground water storage influences the slow component. Potential evapotranspiration is derived from temperature, based on the Thornthwaite and Mather (1957) approach [42]. Snow accumulation is equal to precipitation when temperature is below a threshold (e.g., zero degrees Celsius), and snow melts linearly depending on temperature. The fast and slow flows are routed to the catchment outlet by flow accumulation based on a DEM. The STREAM model assumes that all water moves through the system in a monthly basis. The quality of the simulated river discharges output of the MOSAICC STREAM analysis was assessed using Nash-Sutcliffe model efficiency analysis (NSE), which is defined as:
where is the mean of observed discharges, is modeled discharges, while is the observed discharge at time t [43]. Furthermore, comparison between the resulted simulated discharges was performed using normal distribution analysis, while future trends of the Cimanuk river discharges were assessed through Mann–Kendall trend analysis of maximum, minimum, and average discharges [44,45].
The next step of the analysis was water availability analysis in the study area using dependable flow analysis. The water availability in agricultural area can be represented by dependable flow of river cross to the area. Dependable flow is the amount of discharge available to meet water needs with a calculated risk of failure. Dependable flow represents 80% of exceedance provability of the minimum discharge [46]. This analysis utilized the simulated discharge output from the MOSAICC STREAM analysis as models input. The final step of analysis was the agricultural water balance analysis using modified CROPWat model by integrating inundation parameter [47]. This research specifically used the rice water balance model with inundation parameter integration to identify the balance between available water within the watershed and required water for agricultural purposes in the study area. The water balance formula used in this research is presented in Figure 3.
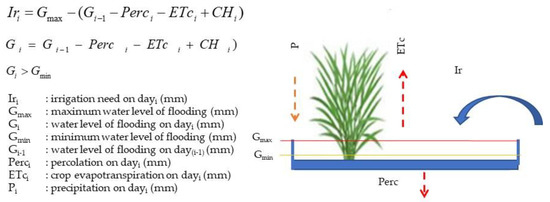
Figure 3.
The illustrated water balance analysis.
Water balance in the watershed and the administrative level were represented by the water critical index using the equation as follows:
WCI: Water Critical Index
WR: Annually water requirement (million cubic meter, MCM)
WA: Annually Water Availability (million cubic meter, MCM)
Furthermore, this research followed a published official report in 2005 [48] to determine the water criticality index (WCI) values as presented in Table 1.

Table 1.
Value and criteria of Water Critical Index (WCI) [48].
3. Results
3.1. Model Calibration and Validation Results
Figure 4 and Figure 5 show comparisons between observed discharge and STREAM simulation results for model calibration and validation, respectively. Observed monthly hydrologic data within the period of 1994–1997 were used for model calibration, while data within the period of 1998–2007 were used for model validation. The NSE value of the model calibration and validation results were 68.6% and 68.0%, respectively. That is under criteria of good discharge simulation results [49]. This relatively high NSE was achieved by calibrating STREAM model parameter values of water holding capacity, groundwater flow speed, and rainfall to direct runoff fraction, to compensate possible discrepancy of the observed precipitation data used in the simulation. The STREAM simulation result accuracy in this research is comparable with other published rainfall-runoff modeling results in Cimanuk watershed reported by [50,51,52,53]. The respective accuracy was 0.66 (NSE of the Rainfall-Runoff Inundation model), 0.71 (NSE of the Soil and Water Assessment Tool model), 0.64 (NSE of the Hydrologic Modeling System model), and 0.78 of the Kling-Gupta Efficiency (KGE) of the SWAT model, in which the model accuracy of this research was 0.77 in term of KGE. Therefore, the calibrated STREAM model is qualified to generate modeled discharge data to assess future effect of different climate change scenarios in agricultural water availability in the study area. River discharge simulation results in Figure 4 identifies a delay in the simulated discharges compared to the observed discharges. This delay could be attributed to the high spatial heterogeneity of the precipitation data that might reduce the accuracy of the downscaled climate data within the study area. Furthermore, rainfall spatial variation could also increase soil moisture variation in the study area that directly affected the river discharges simulation result. Increasing discharge in the area during the period of September-December is also common as it is the beginning of the rainy season.
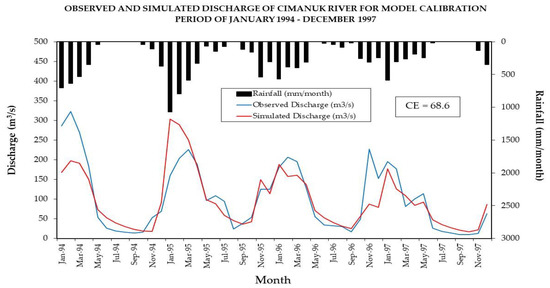
Figure 4.
Observed and simulated discharge of Cimanuk River for model calibration, data period of January 1994–December 1997.
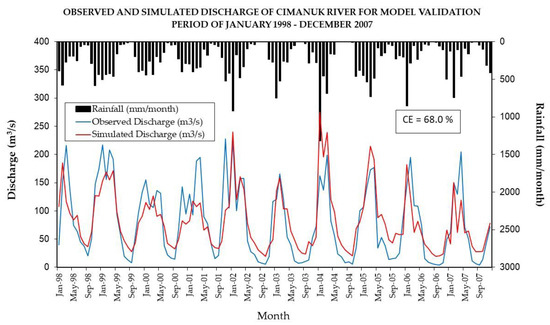
Figure 5.
Observed and simulated discharge of Cimanuk River for model validation, data period of January 1998–December 2007.
3.2. Discharge Simulation Results
Figure 6 presents yearly river discharge simulation results in the Cimanuk watershed, while statistics and norm distributions of the of the simulated discharges are presented in Table 2. Discharge simulation results showed that compared to the simulated historical discharges, all scenarios projected a decrease in average discharge in the study area for the near-future time period. Variation in the simulated results was identified for the far-future projection, in which in comparison to the simulated baseline discharges, CanESM2 predicted no change, CNRM-CM5 estimated decrease, while MPI-ESM-MR projected increase in the average discharge of the Cimanuk watershed. These results are in line with other published research on the impacts of climate change on watershed hydro meteorological characteristic [54].
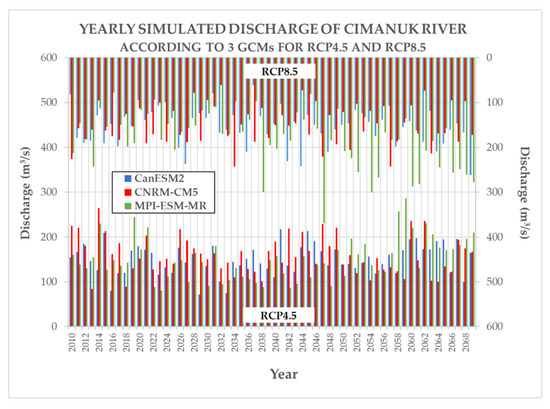
Figure 6.
Cimanuk river yearly discharge simulation based on 3 GCM models following RCP4.5 and RCP8.5 scenarios.

Table 2.
Statistics of simulated discharges of the Cimanuk watershed according to 3 GCM with 2 RCPs.
Statistical series analysis has been applied to produce the norm distribution of hydrograph. Figure 7, Figure 8 and Figure 9 show the norm distribution of Cimanuk watershed discharge according to 3 GCMs (CanESM2, CNRM-CM5, and MPI-ESM-MR) for near future and far future. The norm distribution of past discharge (historical) is represented by the blue line, RCP 4.5 is brown line and RCP 8.5 is grey line. For 3 GCMs, the norm distribution of hydrograph indicates that the simulated discharge from RCP 4.5 and RCP 8.5 is lower than historical.
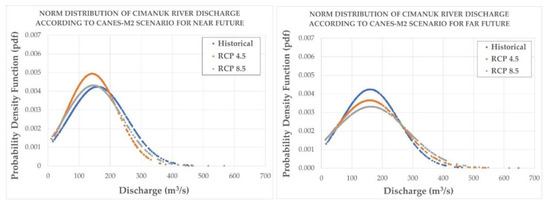
Figure 7.
Norm distribution of Cimanuk River Discharge according to CanESM2 scenario for near and far future.
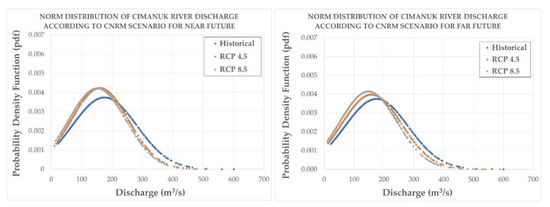
Figure 8.
Norm distribution of Cimanuk River Discharge according to CNRM-CM5 scenario for near and far future.
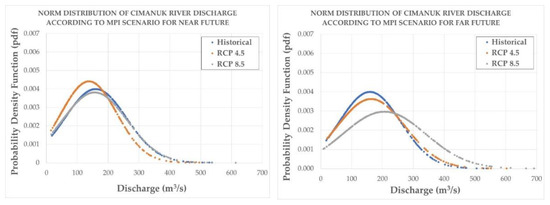
Figure 9.
Norm distribution of Cimanuk River Discharge according to MPI-ESM-MR scenario for near and far future.
3.3. Future Trends of the Cimanuk River Discharges
Figure 10 shows trends of the maximum, average, and minimum of the resulted simulated discharges of the Cimanuk Watershed, while the slope and Mann–Kendall coefficient of the trend is presented in Table 3. The Mann–Kendall trend analysis generally did not detect any trend for the simulated Cimanuk river discharges, except for the increasing trend of future discharges from RCP4.5 scenario of the MPI-ESM-MR model and decreasing trend from RCP8.5 scenario of the CNRM-CM5 and MPI-ESM-MR model. This result is in accordance with published similar research in Cimanuk watershed. Discharge simulation using the STREAM model yielded an insignificant trend of increasing discharge during the period of 1961 to 1980 and a decreasing trend in the next period from 1981 to 2006 [24].
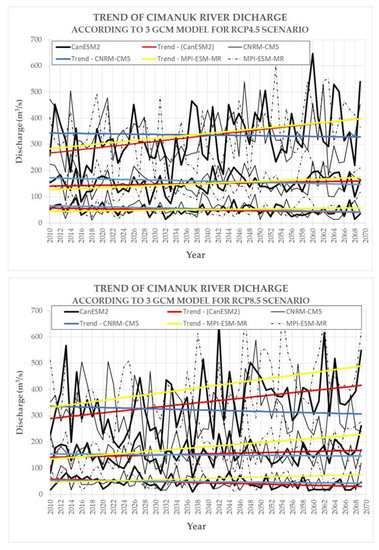
Figure 10.
Trend of Cimanuk River Discharges according to 3 GCM model following RCP4.5 and RCP8.5 scenario.

Table 3.
Mann–Kendall trend analysis of the simulated Cimanuk river discharges following the RCP45 and RCP85 scenario of the 3 GCMs.
3.4. Water Availability Analysis Results
Figure 11 shows dependable flow of Cimanuk Watershed according to the CNRM-CM5 RCP 4.5 scenario and the CNRM-CM5 RCP 8.5 scenario. The color-coded hydrographs show a blue line for historical data, red line for near-future, and grey line for far-future projection. Table 4 shows that all the model scenarios identified that monthly discharges generally begin to decline in April until it reaches the lowest discharge in September, and then increases again until December. Large monthly discharge fluctuations during the dry and rainy season in the Cimanuk watershed, ranges from 68–95% in all model scenarios, indicating the critical condition of the Cimanuk watershed [55].
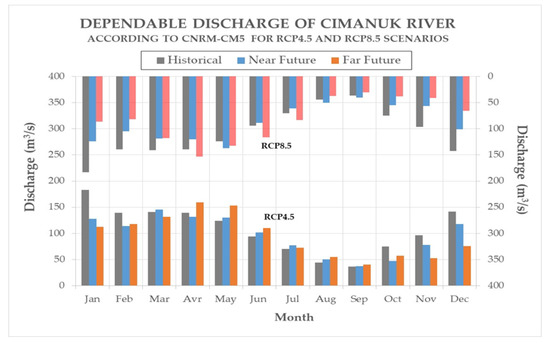
Figure 11.
Dependable flow of Cimanuk Watershed according to CNRM-CM5 following RCP4.5 and RCP8.5 scenarios.

Table 4.
Dependable flow of Cimanuk River according to RCP4.5 and RCP8.5 scenarios of the 3 GCMs.
3.5. Water Balance Analysis Results
Water requirement was calculated based on paddy irrigation requirements in the Cimanuk watershed. Total area of the Cimanuk paddy field was about 173,039 ha, estimated from the 2018 Indonesia Paddy Field Map, which was about 46.7% of the total Cimanuk watershed area (Table 5).

Table 5.
Rice field area according to administrative district level in Cimanuk Watershed.
The Cimanuk paddy water requirement was calculated based on the assumption of 2× annual paddy cropping during the historical period, and 3× annual paddy cropping with alternate wetting and drying (AWD) irrigation application for the near- and far-future period. This assumption considered increasing the demand of rice, steady or declining area of paddy fields, and massive application of irrigation efficient cropping techniques in the near- and far future period. The AWD technique has an irrigation efficiency up to 75% of the conventional irrigation technique [56]. Results of the water balance analysis of the 4 regencies in Cimanuk watershed according to the RCP4.5 and RCP8.5 scenarios of the CanESM2 model in the historical, near-future and far-future period are presented in Table 6.

Table 6.
Water Balance and water critically index of Citarum Watershed.
Based on the water balance analysis results, this research identified a shift of water criticality status from “not yet critical” to “critical” and “close to critical”, specifically in Garut and Sumedang regency, respectively, in the near-future period under both RCP scenarios. However, water criticality stayed in “not yet critical” for the far-future period under RCP8.5 scenario. Moreover, the historical status of water criticality in Majalengka regency was already “critical”, and was projected to worsen to “very critical” in the future under both RCP scenarios. There was no change of Indramayu regency’s water criticality status, as historically it has already in “very critical” condition in both RCP scenarios.
4. Discussion
In general, the result of the trend analysis on the Cimanuk river simulated historical and projected future discharges did not indicate any significant increasing or decreasing trend. Nevertheless, this result is in line with other similar research that reported no trend in discharge trend analysis [57,58,59]. Discharge trend was depended on the local geographical situation, the length of the observed hydro-meteorological data series, the observation period, and other anthropogenic factors [60,61]. Others have also reported that other factors influencing discharges simulation could be the different characteristics of the used GCMs, the applied downscaling technique, and hydrologic models [62,63,64]. Monthly fluctuation of the used precipitation, temperature, and potential evapotranspiration data in this research would also have significant impact on the resulted simulated discharges. Decreasing precipitation with increasing temperature data tends to decrease future discharges [65].
Climate change projection predicted increasing extreme events of drought and flood in the near- and far-future that would negatively impact food, water, and energy security [66,67]. GCM projection in China estimated decreasing water resources about 4 to 24% due to increasing agricultural water demand and evapotranspiration (global warming). Climate change adaptation and mitigation strategy through water management is, therefore, critical to sustainable development and necessary to achieve the 2030 Agenda for Sustainable Development, the Paris Agreement, and the Sendai Framework for Disaster Risk Reduction [68].
Water availability analysis of the 3 GCMs following the 2 RCPs on the near- and far-future in the Cimanuk watershed is generally lower than its historical data. Discharge variations between the wet and dry season was mainly caused by differences in precipitation and evapotranspiration. River flow discharges were influenced by rainfall quantity and watershed characteristic [69]. Other climatic factors could include temperature and precipitation patterns [70]. Other than climatic factors, differences in water availability on different watersheds were also determined by local geology, topography, soils, and land uses. Based on the geological formation, the upper basin is the Central Volcanic Zone dominated by loose volcanic spice composed of andesite-basalt, which originate from an old volcanic (Qv formation). The middle basin is the Alluvial and Lacustrine areas compose of several formations, namely Tnsb (Neogene Sediment), Tmsb (Late Miocene Sediment) and Tomsb (Oligo-Miocene Sediments). While the lower basin is dominated by the river and coastal deposit formation—which is composed of pebble, gravel, sand, silt, mud, and clay—it is widespread around the coast to some areas around the river (Qa formation) [71,72].
Furthermore, water balance analysis indicated that water criticality status of the 4 regencies in the Cimanuk watershed tend to degrade in the future. This worsening critical status due to the increasing of water uses in this study as a result of increasing agricultural intensification and extensification. Another important factor could include decreasing annual water availability as a result of climate change. High crop water requirements in the Cimanuk watershed could be possibly caused by the ratio of paddy fields to the watershed area that dominates up to 46.7%. Indramayu Regency with the largest rice field area within the Cimanuk watershed (15.9%) has historically experienced a “very critical” water criticality status due to the high water requirement of paddy cropping that exceeded the water availability in the area. Water demand for paddy fields in conventional irrigation systems (continuous land submergence) reached 12,400 m3/ha/season [73]. Estimated paddy cropping water requirement as 12,310 m3/ha/season for Gleysol, and 12,510 m3/ha/season for Vertisol soils [74].
Water balance information is used to (1) calculate the water supply at surface water and groundwater, (2) predict water use patterns of available water. (3) contribute balancing the amount of excess and shortage of water, and (4) as a basis for calculating the optimization of water resource management. The benefits of the results of the water balance analysis are as follows: (1) if the results of the water balance analysis show water deficit in many months, it can be used as the basis for constructing water storage infrastructure, and canals; (2) if the results of the water balance analysis show water surplus in many months, it can be used as the basis for constructing drainage channels and flood control techniques; (3) as a basis for using water for various agricultural purposes, such as food crops, horticulture, plantations, forestry, and fisheries [42,75,76].
Climate change adaptation and mitigation strategies have been widely implemented globally to face various risks of water shortage (water criticality status) or excess water. Such strategies include precisive planting time to increase irrigation efficiency in India [77], reducing wheat planting area in water-limited basin during the Winter, and increasing water use efficiency for agricultural intensification under the threat of climate change in the North China Plain [78], enhancing farmers’ knowledge on agricultural water use efficiency [25,79,80]. Climate change negative impacts to agricultural water resources could be minimized through improvement of irrigation infrastructures and the large-scale implementation of water harvesting technologies and artificial water recharge facilities in all vulnerable countries [25].
In Indonesia, several statutes and action plans related to water resources management are currently available including Law 17 of 2019, about water resources; Law 24 of 2007 about disaster counter-measurements; and Law 23 of 1997 about environments. TheIndonesia National Action Plan on Climate Change Adaptation and Mitigation is a dynamic policy instrument that can be evaluated, updated, and enhanced regularly to adjust to the current climate change situation [81]. Adaptation and mitigation efforts that have been applied in Indonesia include (1) development of dams for flood prevention and water management purposes; (2) large-scale implementation of bio-porous water infiltration for flood prevention; (3) enhance water management, including irrigation channel network and system; and (4) development of water harvesting technology, such as field ponds and micro channel dams [82]. Furthermore, several climate change mitigation strategies include implementation of (1) water use efficiency, (2) non-fossil electric sources to power irrigation equipment and other water management instrumentations, (3) low-emission paddy strands, (4) sustainable peatland management, and (5) environmentally friendly plantation management.
Future research and anticipated directions require intensive research efforts for the availability of agricultural water in the long term by implementing a strategic anticipation program through forest and land rehabilitation programs and changing horticultural farming to agroforestry in the upstream area of the Cimanuk River in the Garut Regency area due to the lack of vegetation in the upstream area. Increasing the manufacture of dam units or retaining dams in the Majalengka district and repairing and improving irrigation infrastructure, especially in the downstream area of the Cimanuk river to overcome flood problems in the Indramayu district.
In the future implementation, it is necessary to have multidisciplinary and cross-sectoral watershed management by to account for climate change impacts by employing techno-logical advancements and holistic, cross-disciplinary approaches to ensure watersheds continue to serve their ecological, social, and economic functions [83] as well as implementing an integrated watershed management planning system, through the One River One Plan principle, at regional and national levels as well as its sustainability. In addition, MOSAICC can be applied to all watersheds in Indonesia, to define the status of agricultural water availability at the sub-district level according to climate change scenarios.
5. Conclusions
This research has successfully simulated river discharges in the Cimanuk watershed utilizing 3 GCMs generated data following the RCP4.5 and RCP8.5 climate change scenarios. The result of the discharge simulation from CNRM-CM5 model identified projected decreases in Cimanuk river discharges for the period of near- and far-future, in comparison to the historical simulated data, in both RCP4.5 and RCP8.5 scenarios. There was also detected decreases in predicted discharges from the wet to dry period in all periods, but in general near- and far- future discharges were higher than historical. The lowest historical discharges during dry season in RCP8.5 scenario was lower than its near-future, but higher than its far-future discharges. Furthermore, trend analysis results did not identify any significant trend on near- and far-future discharges.
Further near- and far-future water balance analysis projected shift in water criticality of the Cimanuk watershed, to be worsened than its historical status, although the degree was different for each regency within the Cimanuk watershed. This decreasing status of water criticality in the Cimanuk watershed can be due to the increasing area of irrigated rice fields which would further increase agricultural water demands, when water availability tends to decrease as an impact of climate change. Other problems such as population increase and fast industrial sector development could further increase the uncertainties of the agricultural water availability in the long run. This situation would require strategic anticipation programs, such as irrigation infrastructures updates and enhancements, as an effort in supporting food security in the study area and Indonesia in general.
Author Contributions
Conceptualization, N.H., B.K. and P.R.; methodology, H.S. and S.H.A.; software, S.H.A.; formal analysis, B.K. and S.H.A.; investigation, S., C.T., A.M., Y. and C.S.; resources, A.D.; data curation, Y.A. and A.P.; writing—original draft preparation, N.H., B.K., H.S. and P.R.; writing—review and editing, N.H., B.K., H.S., S.H.A. and P.R.; visualization, S.H.A. and H.S.; supervision, M.P.Y. and A.A.R.; funding acquisition, N.H., B.K., H.S., S.H.A., P.R., Y.A., A.P., M.P.Y., C.T., A.A.R., S., A.D., A.M., Y. and C.S. All authors as the main contributors of this article. All authors have read and agreed to the published version of the manuscript.
Funding
This research was funded by by FAO, Budget Code: TFJP110014404.
Institutional Review Board Statement
Not applicable.
Informed Consent Statement
Not applicable.
Data Availability Statement
Data are not publicly available.
Acknowledgments
All authors deeply appreciate the valuable comments and suggestions in preparing this paper for publication from the editorial board of Sustainability and the two anonymous reviewers. Thanks to Hideki Kanamaru, Lead Technical Officer of Analysis and Mapping of Impacts under Climate Change for the Adaptation and Food Security (AMICAF-FAO). All authors also thank the Indonesian Agency Agricultural Research and Development (IAARD) for supporting the project and facilitating the training of MOSAICC (Modelling System for Agricultural Impacts of Climate Change).
Conflicts of Interest
The authors declare no conflict of interest.
References
- Parry, M.L.; Canziani, O.; Palutikof, J.; der Linden, P.; Hanson, C. Climate Change 2007-Impacts, Adaptation and Vulnerability: Working Group II Contribution to the Fourth Assessment Report of the IPCC; Cambridge University Press: Cambridge, UK, 2007; Volume 4. [Google Scholar]
- UNFCCC. Climate Change and Freshwater Resources: A Synthesis of Adaptation Actions Undertaken by Nairobi Work Programme Partner Organizations; UNFCCC: Bonn, Germany, 2011. [Google Scholar]
- Nan, Y.; Bao-hui, M.; Chun-kun, L. Impact Analysis of Climate Change on Water Resources. Procedia Eng. 2011, 24, 643–648. [Google Scholar] [CrossRef]
- UN Water. UN-Water Policy Brief on Climate Change and Water; UN Water: Geneva, Switzerland, 2019. [Google Scholar]
- Du, P.; Xu, M.; Li, R. Impacts of Climate Change on Water Resources in the Major Countries along the Belt and Road. PeerJ 2021, 9, e12201. [Google Scholar] [CrossRef]
- Barnett, T.P.; Adam, J.C.; Lettenmaier, D.P. Potential Impacts of a Warming Climate on Water Availability in Snow-Dominated Regions. Nature 2005, 438, 303–309. [Google Scholar] [CrossRef]
- Brekke, L.D. Climate Change and Water Resources Management: A Federal Perspective; Diane Publishing: Darby, PA, USA, 2009. [Google Scholar]
- Jose, A.M.; Cruz, N.A. Climate Change Impacts and Responses in the Philippines: Water Resources. Clim. Res. 1999, 12, 77–84. [Google Scholar] [CrossRef]
- Mall, R.K.; Gupta, A.; Singh, R.; Singh, R.S.; Rathore, L.S. Water Resources and Climate Change: An Indian Perspective. Curr. Sci. 2006, 90, 12. [Google Scholar]
- Pawitan, H. Long Term Changes of Java Hydrologic Regimes. In Proceedings of the International Symposium on Fresh Perspectives in Hydrology and the Eight Regional Steering Committee (RSC) Meeting for International Hydrological Program Southeast Asia and the Pacific, Christchurch, New Zealand, 20–24 November 2000. [Google Scholar]
- Kuik, O.; Reynes, F.; Delobel, F.; Bernardi, M. FAO-MOSAICC: The FAO Modelling System for Agricultural Impacts of Climate Change to Support Decision-Making in Adaptation. In Proceedings of the 14th Annual Conference on Global Economic Analysis, Venice, Italy, 16–18 June 2011. [Google Scholar]
- Poortinga, A.; Delobel, F.; Rojas, O. MOSAICC: An Inter-Disciplinary System of Models to Evaluate the Impact of Climate Change on Agriculture. Agro Environ. 2012, 2012, 248. [Google Scholar]
- Balaghi, R.; el Hairech, T.; Alaouri, M.; Motaouakil, S.; Benabdelouahab, T.; Mounir, F.; Lahlou, M.; Arrach, R.; Abderrakif, M.; Colmant, R.; et al. Climate Change Impact Assessment Using MOSAICC in Morocco; INRA: Rabat, Morocco, 2016. [Google Scholar]
- Aerts, J.C.J.H.; Kriek, M.; Schepel, M. STREAM (Spatial Tools for River Basins and Environment and Analysis of Management Options): ‘Set up and Requirements’. Phys. Chem. Earth Part B Hydrol. Ocean. Atmos. 1999, 24, 591–595. [Google Scholar] [CrossRef]
- Curk, M.; Glavan, M. Perspectives of Hydrologic Modeling in Agricultural Research. In Hydrology; Hromadka, T.V., II, Rao, P., Eds.; IntechOpen: Rijeka, Croatia, 2021. [Google Scholar]
- Bariamis, G.; Baltas, E. Hydrological Modeling in Agricultural Intensive Watershed: The Case of Upper East Fork White River, USA. Hydrology 2021, 8, 137. [Google Scholar] [CrossRef]
- Aerts, J.C.J.H.; Renssen, H.; Ward, P.J.; de Moel, H.; Odada, E.; Bouwer, L.M.; Goosse, H. Sensitivity of Global River Discharges under Holocene and Future Climate Conditions. Geophys. Res. Lett. 2006, 33, 19401. [Google Scholar] [CrossRef]
- Bouwer, L.M.; Aerts, J.C.J.H.; Droogers, P.; Dolman, A.J. Detecting the Long-Term Impacts from Climate Variability and Increasing Water Consumption on Runoff in the Krishna River Basin (India). Hydrol. Earth Syst. Sci. 2006, 10, 703–713. [Google Scholar] [CrossRef]
- Kiptala, J.K.; Mul, M.L.; Mohamed, Y.A.; van der Zaag, P. Modelling Stream Flow and Quantifying Blue Water Using a Modified STREAM Model for a Heterogeneous, Highly Utilized and Data-Scarce River Basin in Africa. Hydrol. Earth Syst. Sci. 2014, 18, 2287–2303. [Google Scholar] [CrossRef]
- Tolentino, P.L.M.; Poortinga, A.; Kanamaru, H.; Keesstra, S.; Maroulis, J.; David, C.P.C.; Ritsema, C.J. Projected Impact of Climate Change on Hydrological Regimes in the Philippines. PLoS ONE 2016, 11, e0163941. [Google Scholar] [CrossRef]
- Stürck, J.; Poortinga, A.; Verburg, P.H. Mapping Ecosystem Services: The Supply and Demand of Flood Regulation Services in Europe. Ecol. Indic. 2014, 38, 198–211. [Google Scholar] [CrossRef]
- Hurkmans, R.T.W.L.; de Moel, H.; Aerts, J.C.J.H.; Troch, P.A. Water Balance versus Land Surface Model in the Simulation of Rhine River Discharges. Water Resour. Res. 2008, 44, 1418. [Google Scholar] [CrossRef]
- Poerbandono, P.; Ward, P.J.; Julian, M.M. Set up and Calibration of a Spatial Tool for Simulating Latest Decades’ Flow Discharges of the Western Java: Preliminary Results and Assessments. ITB J. Eng. Sci. 2009, 41, 50–64. [Google Scholar] [CrossRef][Green Version]
- Julian, M.M.; Nishio, F.; Poerbandono; Ward, P.J. Simulation of River Discharges in Major Watersheds of Northwestern Java From 1901 To 2006. Int. J. Technol. 2011, 1, 37–46. [Google Scholar] [CrossRef]
- Misra, A.K. Climate Change and Challenges of Water and Food Security. Int. J. Sustain. Built Environ. 2014, 3, 153–165. [Google Scholar] [CrossRef]
- Singh, C.; Bazaz, A.; Ley, D.; Ford, J.; Revi, A. Assessing the Feasibility of Climate Change Adaptation Options in the Water Sector: Examples from Rural and Urban Landscapes. Water Secur. 2020, 11, 100071. [Google Scholar] [CrossRef]
- Deligios, P.A.; Chergia, A.P.; Sanna, G.; Solinas, S.; Todde, G.; Narvarte, L.; Ledda, L. Climate Change Adaptation and Water Saving by Innovative Irrigation Management Applied on Open Field Globe Artichoke. Sci. Total Environ. 2019, 649, 461–472. [Google Scholar] [CrossRef]
- Tan, L.; Feng, P.; Li, B.; Huang, F.; Liu, D.L.; Ren, P.; Liu, H.; Srinivasan, R.; Chen, Y. Climate Change Impacts on Crop Water Productivity and Net Groundwater Use under a Double-Cropping System with Intensive Irrigation in the Haihe River Basin, China. Agric. Water Manag. 2022, 266, 107560. [Google Scholar] [CrossRef]
- Malek, K.; Adam, J.C.; Stöckle, C.O.; Peters, R.T. Climate Change Reduces Water Availability for Agriculture by Decreasing Non-Evaporative Irrigation Losses. J. Hydrol. 2018, 561, 444–460. [Google Scholar] [CrossRef]
- Hardjanto, H. Kontribusi Hutan Rakyat Terhadap Pendapatan Rumah Tangga Di Sub DAS Cimanuk Hulu. J. Manaj. Hutan Trop. 2001, 7, 2. [Google Scholar]
- Rahman, A. Analisis Aliran Pada Daerah Aliran Sungai Cimanuk Hulu (Studi Kasus Cimanuk-Bojongloa Garut). J. Konstr. 2017, 14, 1. [Google Scholar] [CrossRef]
- Dent, F.J.; Desaunettes, D.R.; Malingreau, J.-P. Detailed Reconnaissance Land Resources Survey Cimanuk Watershed Area (West Java): A Case Study of Land Resource Survey and Land Evaluation Procedures Designed for Indonesian Conditions; Trust Fund of the Government of Indonesia/Food and Agriculture Organization: Bali, Indonesia, 1977. [Google Scholar]
- BBSDLP. Indonesia Soil Map 1:50.000; BBSDLP: Bogor, Indonesia, 2017.
- USGS SRTM 1 Arc-Second Global. Available online: https://earthexplorer.usgs.gov/ (accessed on 7 October 2022).
- Ministry of Environment and Forestry Indonesia Land Use Map. Available online: https://sigap.menlhk.go.id/sigap/peta-interaktif (accessed on 7 October 2022).
- Poggio, L.; de Sousa, L.M.; Batjes, N.H.; Heuvelink, G.B.M.; Kempen, B.; Ribeiro, E.; Rossiter, D. SoilGrids 2.0: Producing Soil Information for the Globe with Quantified Spatial Uncertainty. SOIL 2021, 7, 217–240. [Google Scholar] [CrossRef]
- Chylek, P.; Li, J.; Dubey, M.K.; Wang, M.; Lesins, G. Observed and Model Simulated 20th Century Arctic Temperature Variability: Canadian Earth System Model CanESM2. Atmos. Chem. Phys. Discuss. 2011, 11, 22893–22907. [Google Scholar] [CrossRef]
- Voldoire, A.; Sanchez-Gomez, E.; Salas y Mélia, D.; Decharme, B.; Cassou, C.; Sénési, S.; Valcke, S.; Beau, I.; Alias, A.; Chevallier, M.; et al. The CNRM-CM5.1 Global Climate Model: Description and Basic Evaluation. Clim. Dyn. 2013, 40, 2091–2121. [Google Scholar] [CrossRef]
- Mauritsen, T.; Roeckner, E. Tuning the MPI-ESM1.2 Global Climate Model to Improve the Match With Instrumental Record Warming by Lowering Its Climate Sensitivity. J. Adv. Model Earth Syst. 2020, 12, e2019MS002037. [Google Scholar] [CrossRef]
- Wilby, R.L.; Dawson, C.W.; Murphy, C.; O’Connor, P.; Hawkins, E. The Statistical DownScaling Model—Decision Centric (SDSM-DC): Conceptual Basis and Applications. Clim. Res. 2014, 61, 259–276. [Google Scholar] [CrossRef]
- QGIS.org. QGIS Geographic Information System. 2022. Available online: http://www.qgis.org (accessed on 7 October 2022).
- Thornthwaite, C.W.; Mather, J.R. Instructions and Tables for Computing Potential Evapotranspiration and the Water Balance. Centerton 1957, 230–240, 206–208. [Google Scholar]
- Nash, J.E.; Sutcliffe, J.V. River Flow Forecasting through Conceptual Models Part I—A Discussion of Principles. J. Hydrol. 1970, 10, 282–290. [Google Scholar] [CrossRef]
- Mann, H.B. Nonparametric Tests Against Trend. Econometrica 1945, 13, 245. [Google Scholar] [CrossRef]
- Kendall, M.G. Rank Correlation Methods; Charles Griffin: London, UK, 1948. [Google Scholar]
- Sebayang, I.S.D.; Fahmia, M. Dependable Flow Modeling in Upper Basin Citarum Using Multilayer Perceptron Backpropagation. Int. J. Artif. Intell. Res. 2021, 4, 75. [Google Scholar] [CrossRef]
- Smith, M. CROPWAT: A Computer Program for Irrigation Planning and Management; Food & Agriculture Organazation: Rome, Italy, 1992. [Google Scholar]
- Classification of Water Criticality Index; Directorate of Program Development: Jakarta, Indonesia, 2005.
- Moriasi, D.N.; Arnold, J.G.; van Liew, M.W.; Bingner, R.L.; Harmel, R.D.; Veith, T.L. Model Evaluation Guidelines for Systematic Quantification of Accuracy in Watershed Simulations. Trans. ASABE 2007, 50, 885–900. [Google Scholar] [CrossRef]
- Ardiansyah, M.; Nugraha, R.A.; Iman, L.O.S.; Djatmiko, S.D. Impact of Land Use and Climate Changes on Flood Inundation Areas in the Lower Cimanuk Watershed, West Java Province. J. Ilmu Tanah Dan Lingkung. 2021, 23, 51–58. [Google Scholar] [CrossRef]
- Widayati, R.M.; Lasminto, U. Numerical Rainfall-Runoff Model of Cimanuk Watershed before and after the Operation of Jatigede Reservoir. IOP Conf. Ser. Mater. Sci. Eng. 2020, 930, 012072. [Google Scholar] [CrossRef]
- Widyastuti, M.T.; Taufik, D.M. Long-Term Monthly Discharge Prediction for Cimanuk Watershed. Agromet 2019, 33, 96–104. [Google Scholar] [CrossRef]
- Ridwansyah, I.; Fakhrudin, M.; Wibowo, H.; Yulianti, M. Application of the Soil and Water Assessment Tool (SWAT) to Predict the Impact of Best Management Practices in Jatigede Catchment Area. IOP Conf. Ser. Earth Environ. Sci. 2018, 118, 012030. [Google Scholar] [CrossRef]
- Selvarajah, H.; Koike, T.; Rasmy, M.; Tamakawa, K.; Yamamoto, A.; Kitsuregawa, M.; Zhou, L. Development of an Integrated Approach for the Assessment of Climate Change Impacts on the Hydro-Meteorological Characteristics of the Mahaweli River Basin, Sri Lanka. Water 2021, 13, 1218. [Google Scholar] [CrossRef]
- Nahib, I.; Ambarwulan, W.; Rahadiati, A.; Munajati, S.L.; Prihanto, Y.; Suryanta, J.; Turmudi, T.; Nuswantoro, A.C. Assessment of the Impacts of Climate and LULC Changes on the Water Yield in the Citarum River Basin, West Java Province, Indonesia. Sustainability 2021, 13, 3919. [Google Scholar] [CrossRef]
- Biswas, A.; Mailapalli, D.R.; Raghuwanshi, N.S. Consumptive Water Footprints, Water Use Efficiencies and Productivities of Rice under Alternate Wetting and Drying for Kharagpur, West Bengal, India. Water Supply 2021, 21, 2935–2946. [Google Scholar] [CrossRef]
- Labat, D.; Goddéris, Y.; Probst, J.L.; Guyot, J.L. Evidence for Global Runoff Increase Related to Climate Warming. Adv. Water Resour. 2004, 27, 631–642. [Google Scholar] [CrossRef]
- Kundzewicz, Z.W.; Graczyk, D.; Maurer, T.; Pińskwar, I.; Radziejewski, M.; Svensson, C.; Szwed, M. Trend Detection in River Flow Series: 1. Annual Maximum Flow/Détection de Tendance Dans Des Séries de Débit Fluvial: 1. Débit Maximum Annuel. Hydrol. Sci. J. 2005, 50, 810. [Google Scholar] [CrossRef]
- Cunderlik, J.M.; Ouarda, T.B.M.J. Trends in the Timing and Magnitude of Floods in Canada. J. Hydrol. 2009, 375, 471–480. [Google Scholar] [CrossRef]
- Bezak, N.; Brilly, M.; Šraj, M. Flood Frequency Analyses, Statistical Trends and Seasonality Analyses of Discharge Data: A Case Study of the Litija Station on the Sava River. J. Flood Risk Manag. 2016, 9, 154–168. [Google Scholar] [CrossRef]
- Li, C.; Fang, H. Assessment of Climate Change Impacts on the Streamflow for the Mun River in the Mekong Basin, Southeast Asia: Using SWAT Model. Catena 2021, 201, 105199. [Google Scholar] [CrossRef]
- Gosling, S.N.; Taylor, R.G.; Arnell, N.W.; Todd, M.C. A Comparative Analysis of Projected Impacts of Climate Change on River Runoff from Global and Catchment-Scale Hydrological Models. Hydrol. Earth Syst. Sci. 2011, 15, 279–294. [Google Scholar] [CrossRef]
- Saddique, N.; Usman, M.; Bernhofer, C. Simulating the Impact of Climate Change on the Hydrological Regimes of a Sparsely Gauged Mountainous Basin, Northern Pakistan. Water 2019, 11, 2141. [Google Scholar] [CrossRef]
- Hoan, N.X.; Khoi, D.N.; Nhi, P.T.T. Uncertainty Assessment of Streamflow Projection under the Impact of Climate Change in the Lower Mekong Basin: A Case Study of the Srepok River Basin, Vietnam. Water Environ. J. 2020, 34, 131–142. [Google Scholar] [CrossRef]
- Feyissa, N.T.; Kumar, S.A. Estimation of Water Yield under Baseline and Future Climate Change Scenarios in Genale Watershed, Genale Dawa River Basin, Ethiopia, Using SWAT Model. J. Hydrol. Eng. 2021, 26, 05020051. [Google Scholar] [CrossRef]
- Rejekiningrum, P. Impact of Climate Change on Water Resources: Identification, Simulation, and Action Plan. Indones. J. Land Resour. 2014, 8, 1–15. (In Indonesian) [Google Scholar]
- Siswanto; van der Schrier, G.; Jan van Oldenborgh, G.; van den Hurk, B.; Aldrian, E.; Swarinoto, Y.; Sulistya, W.; Eka Sakya, A. A Very Unusual Precipitation Event Associated with the 2015 Floods in Jakarta: An Analysis of the Meteorological Factors. Weather Clim. Extrem. 2017, 16, 23–28. [Google Scholar] [CrossRef]
- Pltonykova, H.; Koeppel, S.; Bernardini, F.; Tiefenauer-Linardon, S.; de Strasser, L. The United Nations World Water Development Report 2020: Water and Climate Change; UNESCO for UN-Water: Bonn, Germany, 2020. [Google Scholar]
- Mirrah, A.A.; Kusratmoko, E. Application of GIS for Assessment of Water Availability in the Cianten Watershed, West Java. In Proceedings of the IOP Conference Series: Earth and Environmental Science, Depok, Indonesia, 24 December 2017; Volume 98, p. 012018. [Google Scholar]
- Zengin, H.; Özcan, M.; Degermenci, A.S.; Citgez, T. Effects of Some Watershed Characteristics on Water Yield in the West Black Sea Region of Northern Turkey. Bosque (Valdivia) 2017, 38, 479–486. [Google Scholar] [CrossRef]
- Soehaimi, A.; Sopyan, Y.; Ma’mur, A. Active Foult Map of Indonesia, Scale 1:5.000.000. Geological Survey Center, 2019, Geology Agency, Ministry of Energy and Mineral Resources. Bandung. Indonesia. Available online: https://contact@grdc.esdm.go.id (accessed on 7 October 2022).
- Sukamto, R.; Ratman, N.; Simandjuntak, T.O. Geology Map of Indonesia. Sheet Indonesia, Scale 1:5.000.000. Geological Survey Center, 2011, Geology Agency, Ministry of Energy and Mineral Resources. Bandung. Available online: https://contact@grdc.esdm.go.id (accessed on 7 October 2022).
- Pavan Kumar, K.; Kumar Barik, D. Comparison of Agricultural Yield with and without a Canal Head Regulator. Int. J. Adv. Technol. Eng. Sci. 2015, 3, 19–30. [Google Scholar]
- ICRISAT. Pyawt Yaw Pump Irrigation Project Irrigation and Nutrient Management of Major Crops in PYPIP; Technical Bulletin; ICRISAT: Patancheruvu, India, 2019. [Google Scholar]
- Oldeman, L.R.; Frere, M. A Study of the Agroclimatology of the Humid Tropics of South-East Asia; WMO: Rome, Italy, 1979. [Google Scholar]
- Purnama, I.L.S.; Trijuni, S.; Hanafi, F.; Aulia, T.; Razali, R. Water Balance Analysis in Kupang and Sengkarang Watershed; Cahaya Press: Yogyakarta, Indonesia, 2012. [Google Scholar]
- Kaushika, G.S.; Arora, H.; Hari Prasad, K.S. Analysis of Climate Change Effects on Crop Water Availability for Paddy, Wheat and Berseem. Agric. Water Manag. 2019, 225, 105734. [Google Scholar] [CrossRef]
- Mo, X.-G.; Hu, S.; Lin, Z.-H.; Liu, S.-X.; Xia, J. Impacts of Climate Change on Agricultural Water Resources and Adaptation on the North China Plain. Adv. Clim. Change Res. 2017, 8, 93–98. [Google Scholar] [CrossRef]
- Shemdoe, R.; Kassenga, G.; Mbuligwe, S. Implementing Climate Change Adaptation and Mitigation Interventions at the Local Government Levels in Tanzania: Where Do We Start? Curr. Opin. Environ. Sustain. 2015, 13, 32–41. [Google Scholar] [CrossRef]
- Azhoni, A.; Jude, S.; Holman, I. Adapting to Climate Change by Water Management Organisations: Enablers and Barriers. J. Hydrol. 2018, 559, 736–748. [Google Scholar] [CrossRef]
- Ministry of National Development Planning. National Action Plan for Climate Change Adaptation (RAN-API). Bappenas National Action Plan for Climate Change Adaptation; Bappenas: Jakarta, Indonesia, 2014. (In Indonesian) [Google Scholar]
- Aldrian, E.; Karmini, M.; Budiman. Adaptation and Mitigation of Climate Change in Indonesia. Cent. Clim. Change Air Qual. 2011, 174. (In Indonesian) [Google Scholar]
- Wang, G.; Mang, S.; Cai, H.; Liu, S.; Zhang, Z.; Wang, L.; Innes, J.L. Integrated watershed management: Evolution, development and emerging trends. J. For. Res. 2016, 27, 967–994. [Google Scholar] [CrossRef]
Publisher’s Note: MDPI stays neutral with regard to jurisdictional claims in published maps and institutional affiliations. |
© 2022 by the authors. Licensee MDPI, Basel, Switzerland. This article is an open access article distributed under the terms and conditions of the Creative Commons Attribution (CC BY) license (https://creativecommons.org/licenses/by/4.0/).