
Morphology and Genetic Structure Profile of Farmed Snails Cornu aspersum aspersum and Cornu aspersum maximum in Greece


Abstract
1. Introduction
2. Materials and Methods
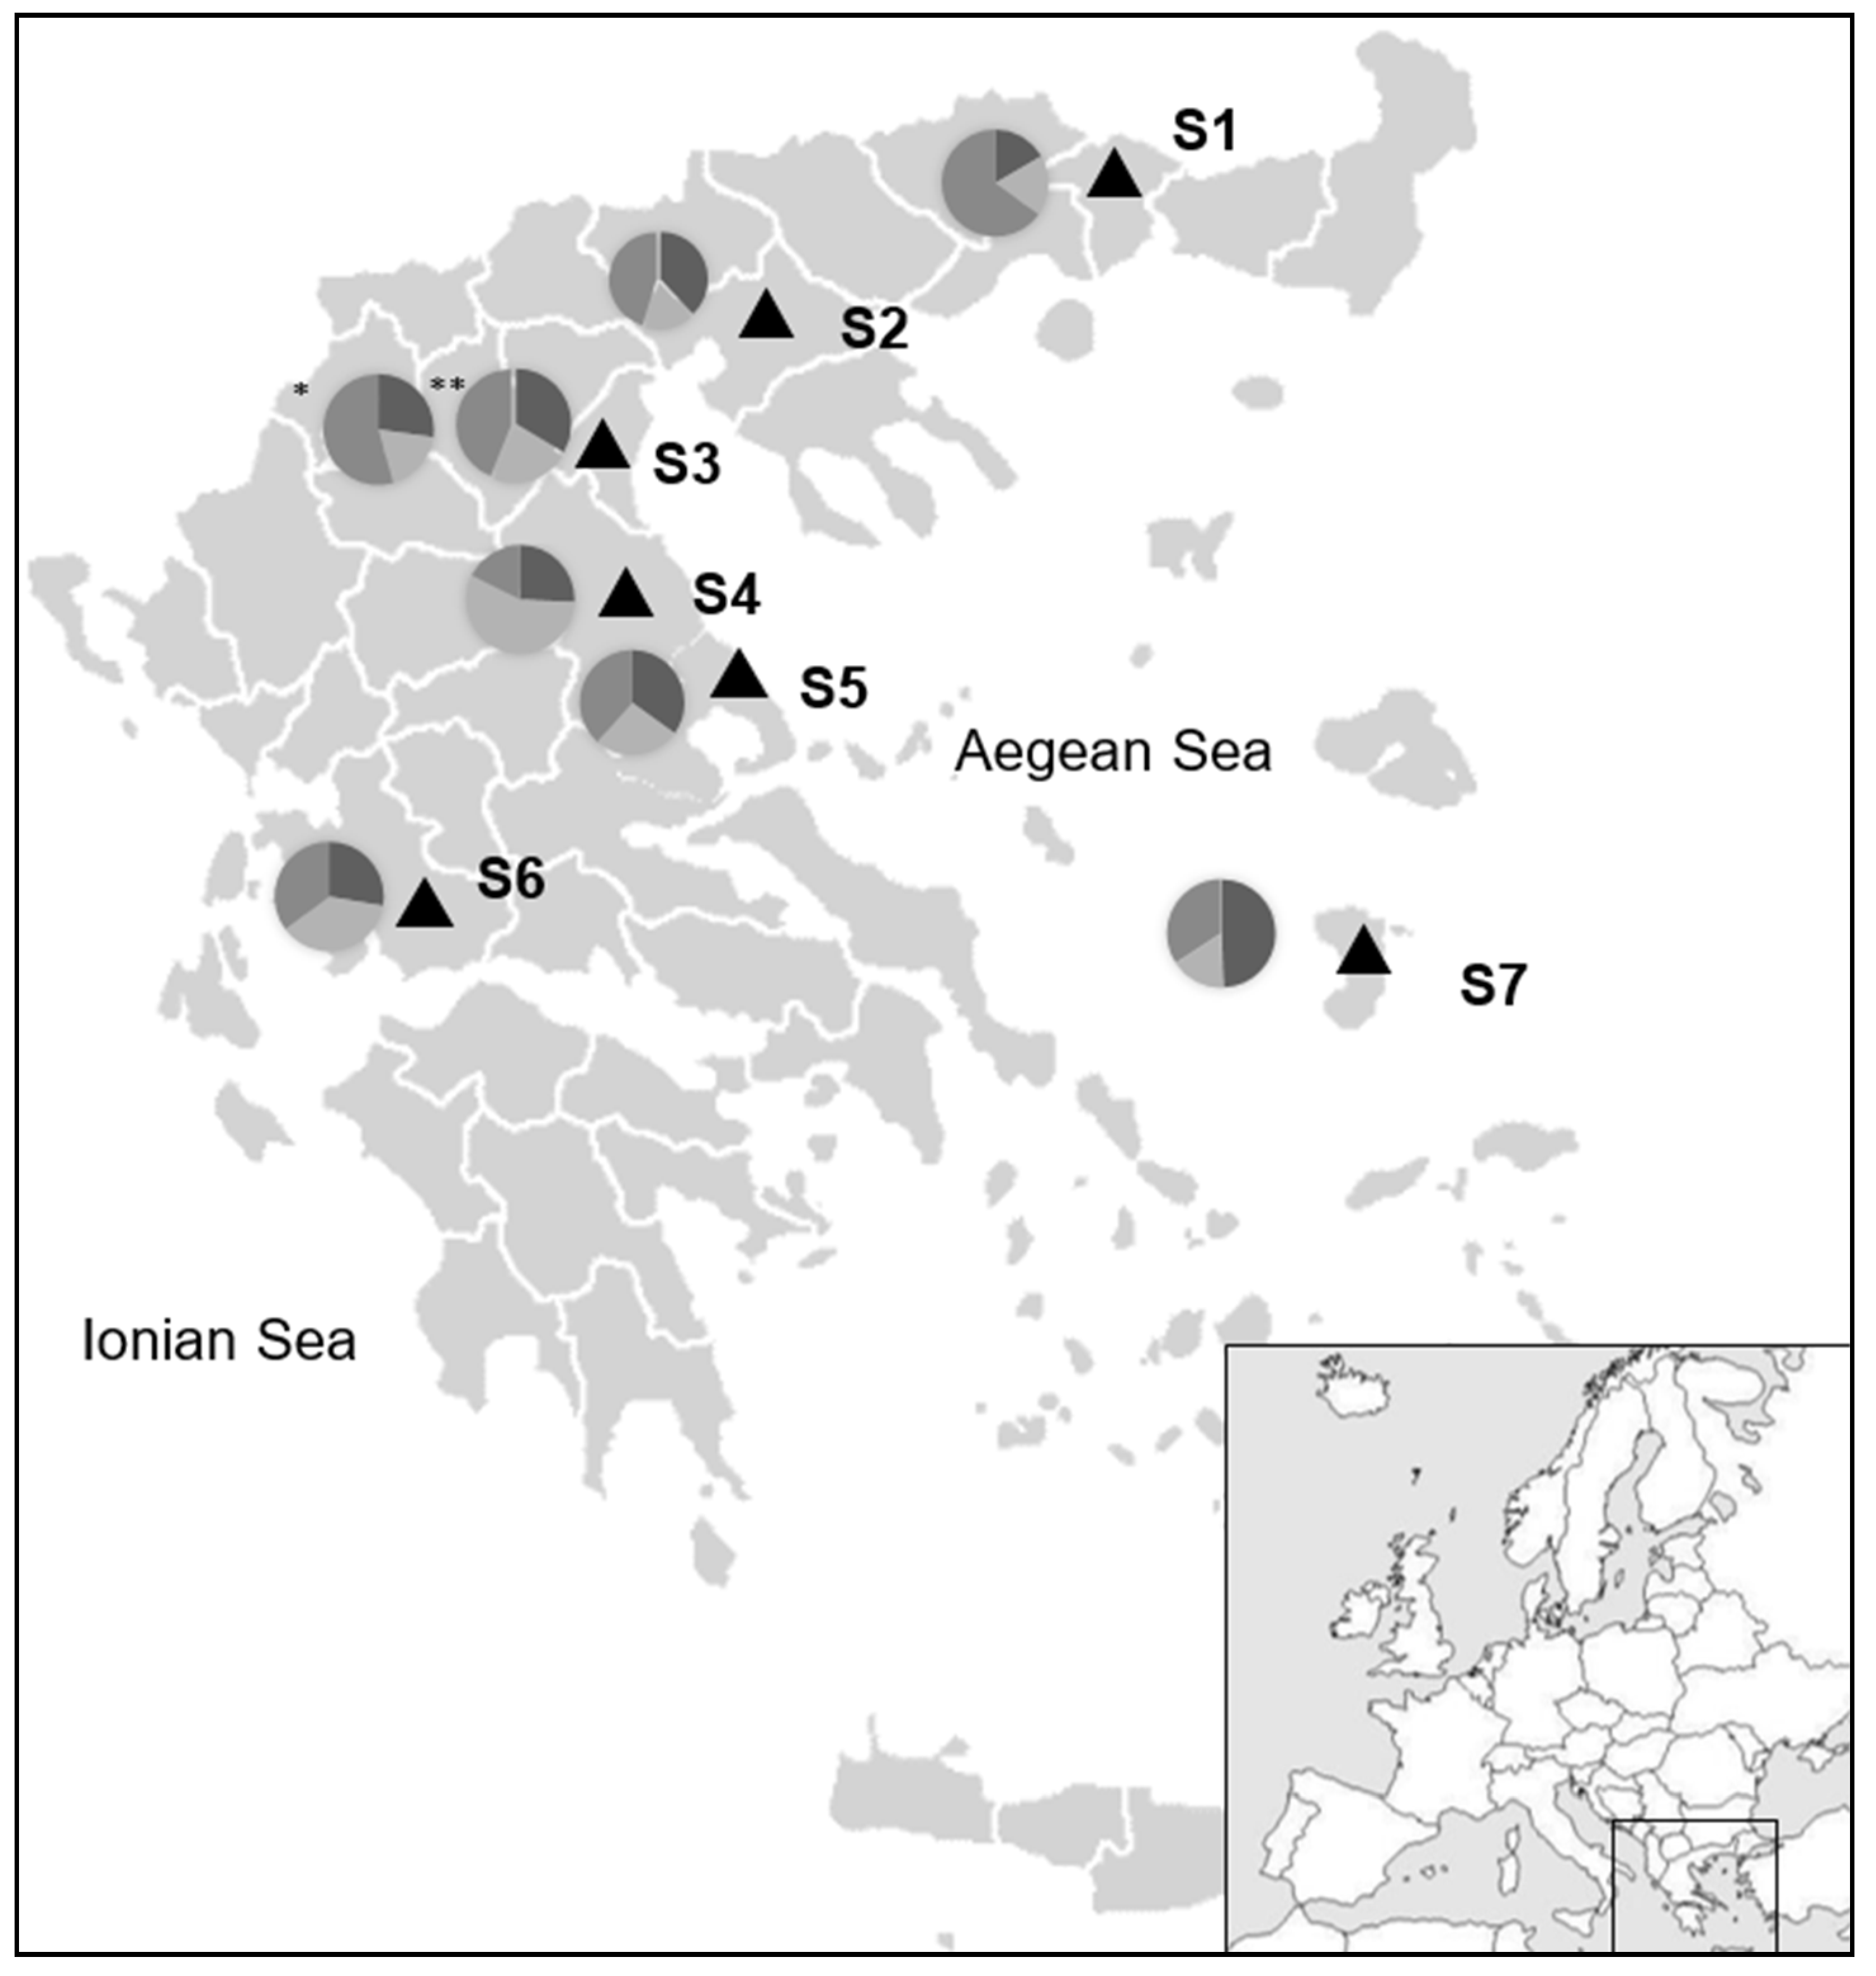
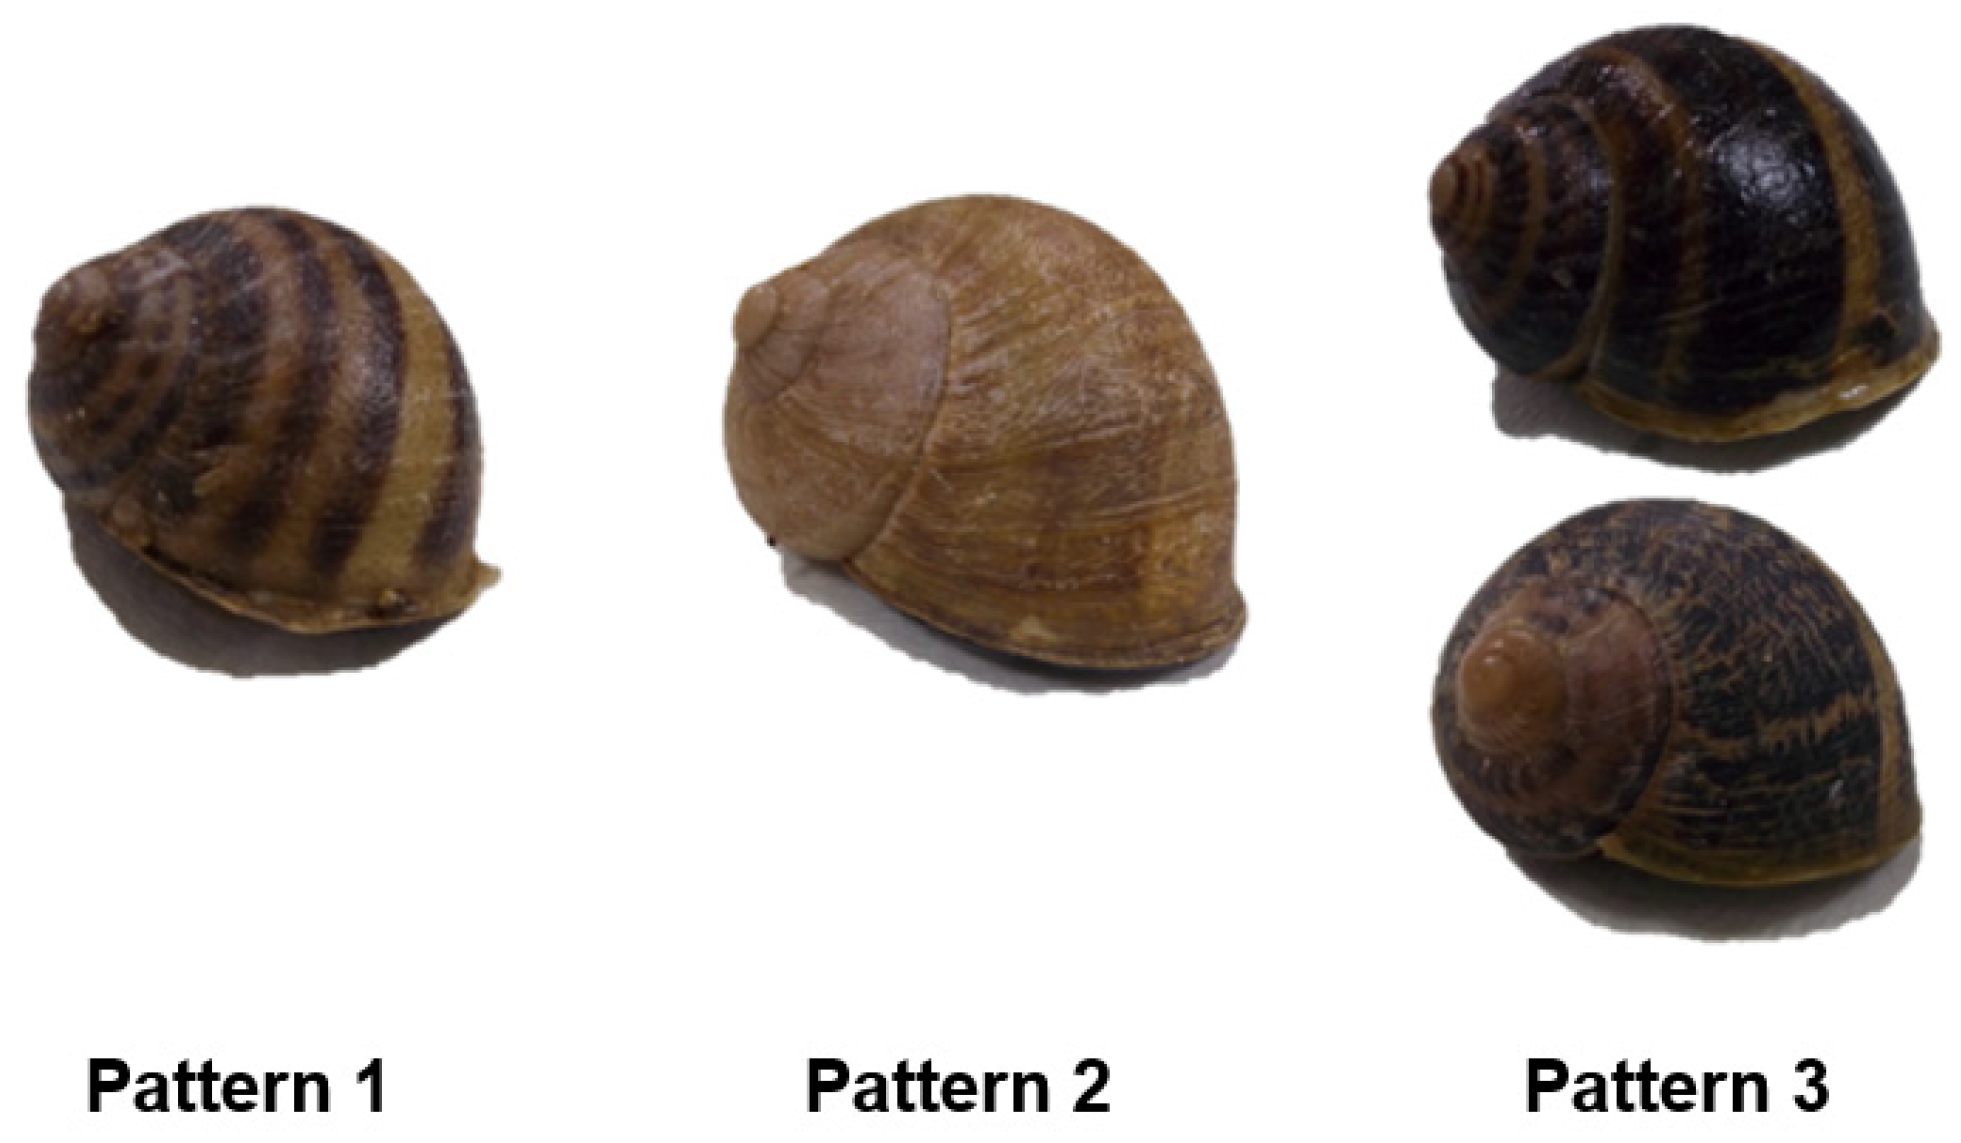
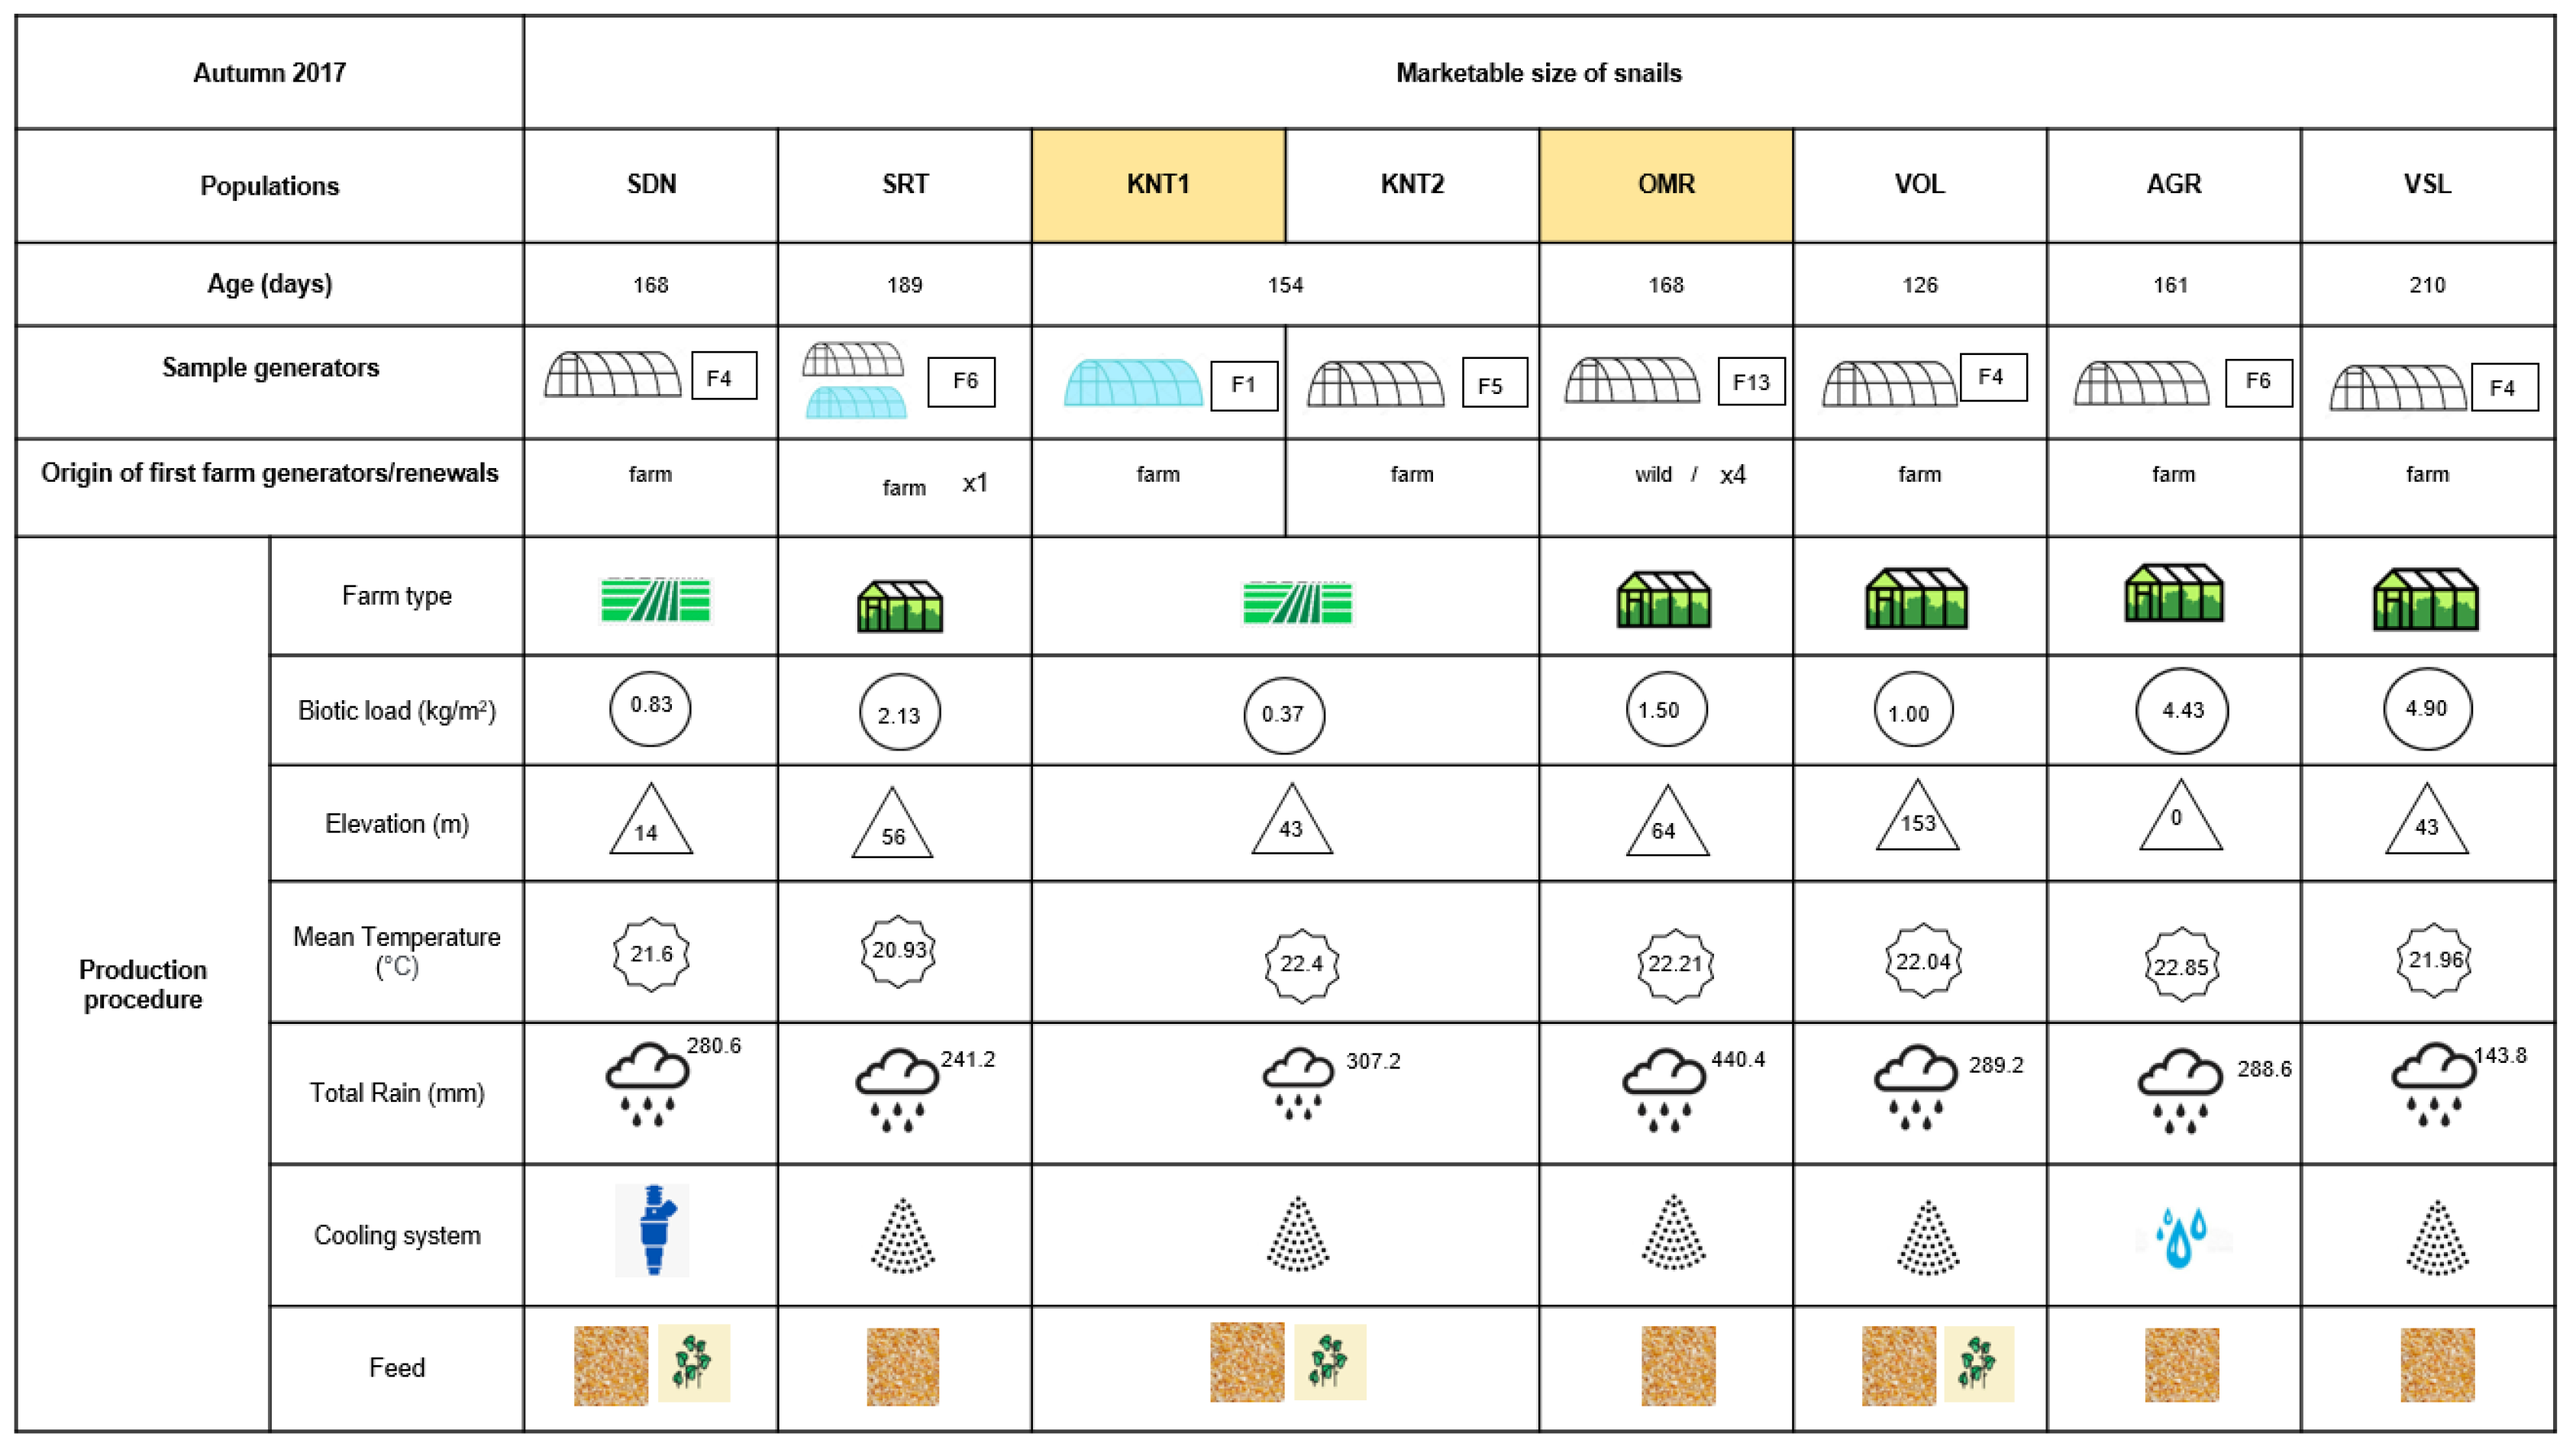
2.1. Snail Collection and Tissue Isolation
2.2. DNA Extraction and PCR Amplification
2.3. Data Analysis
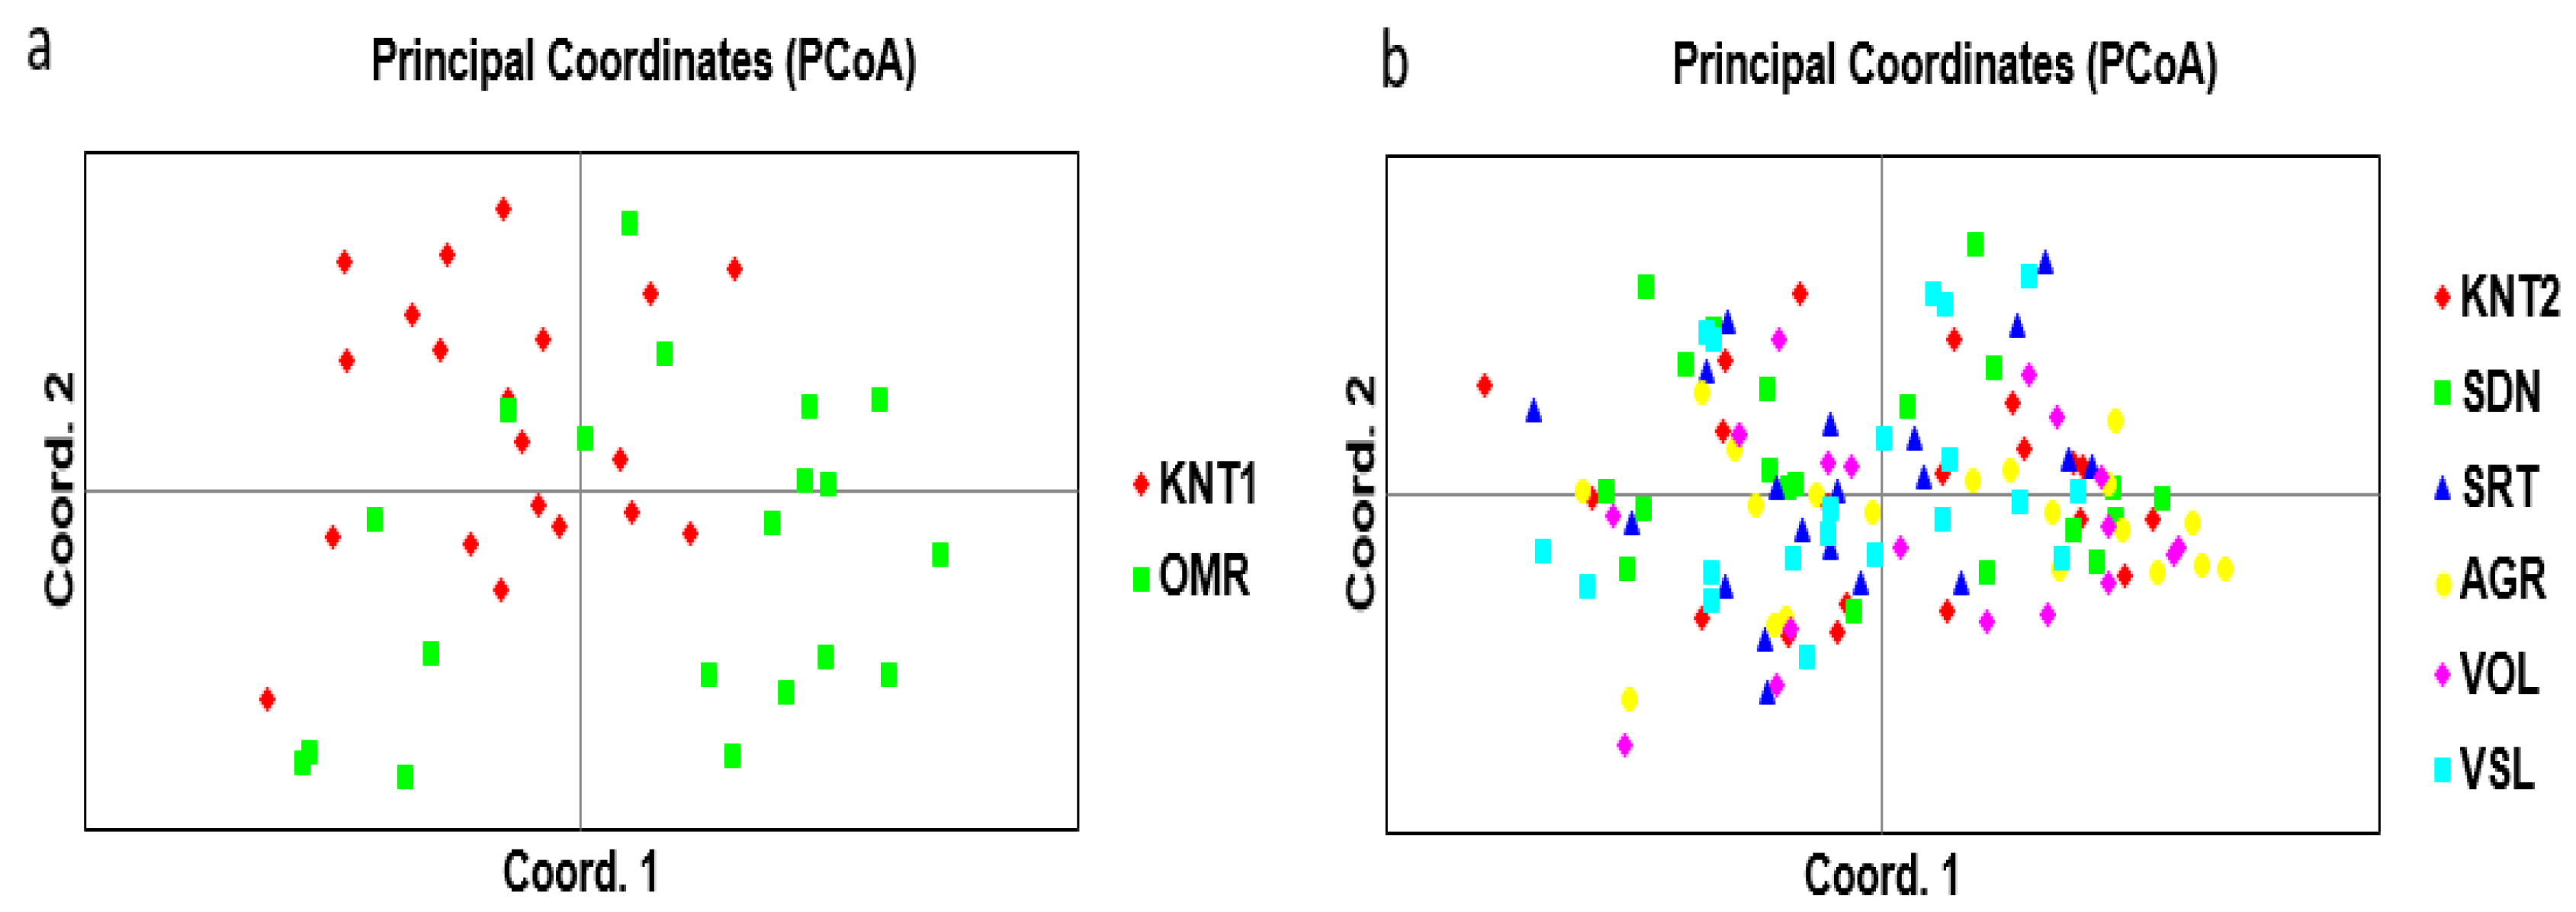
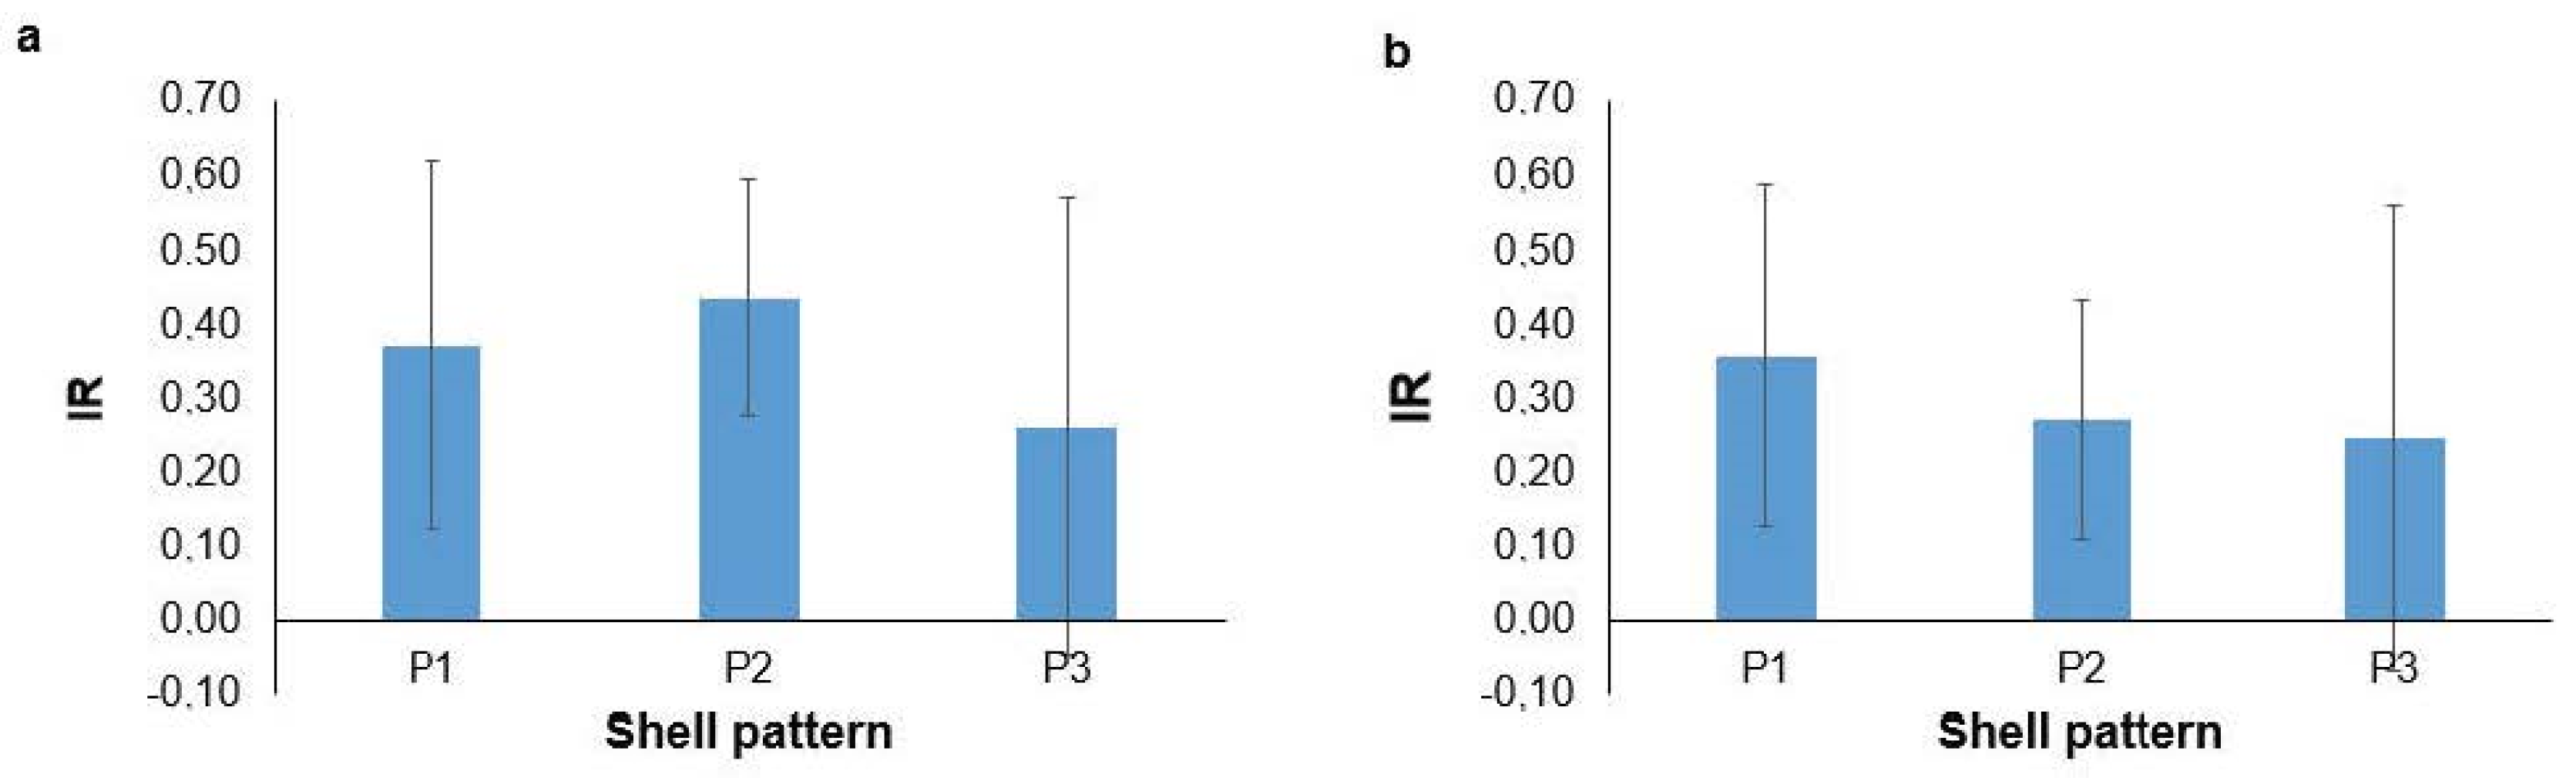
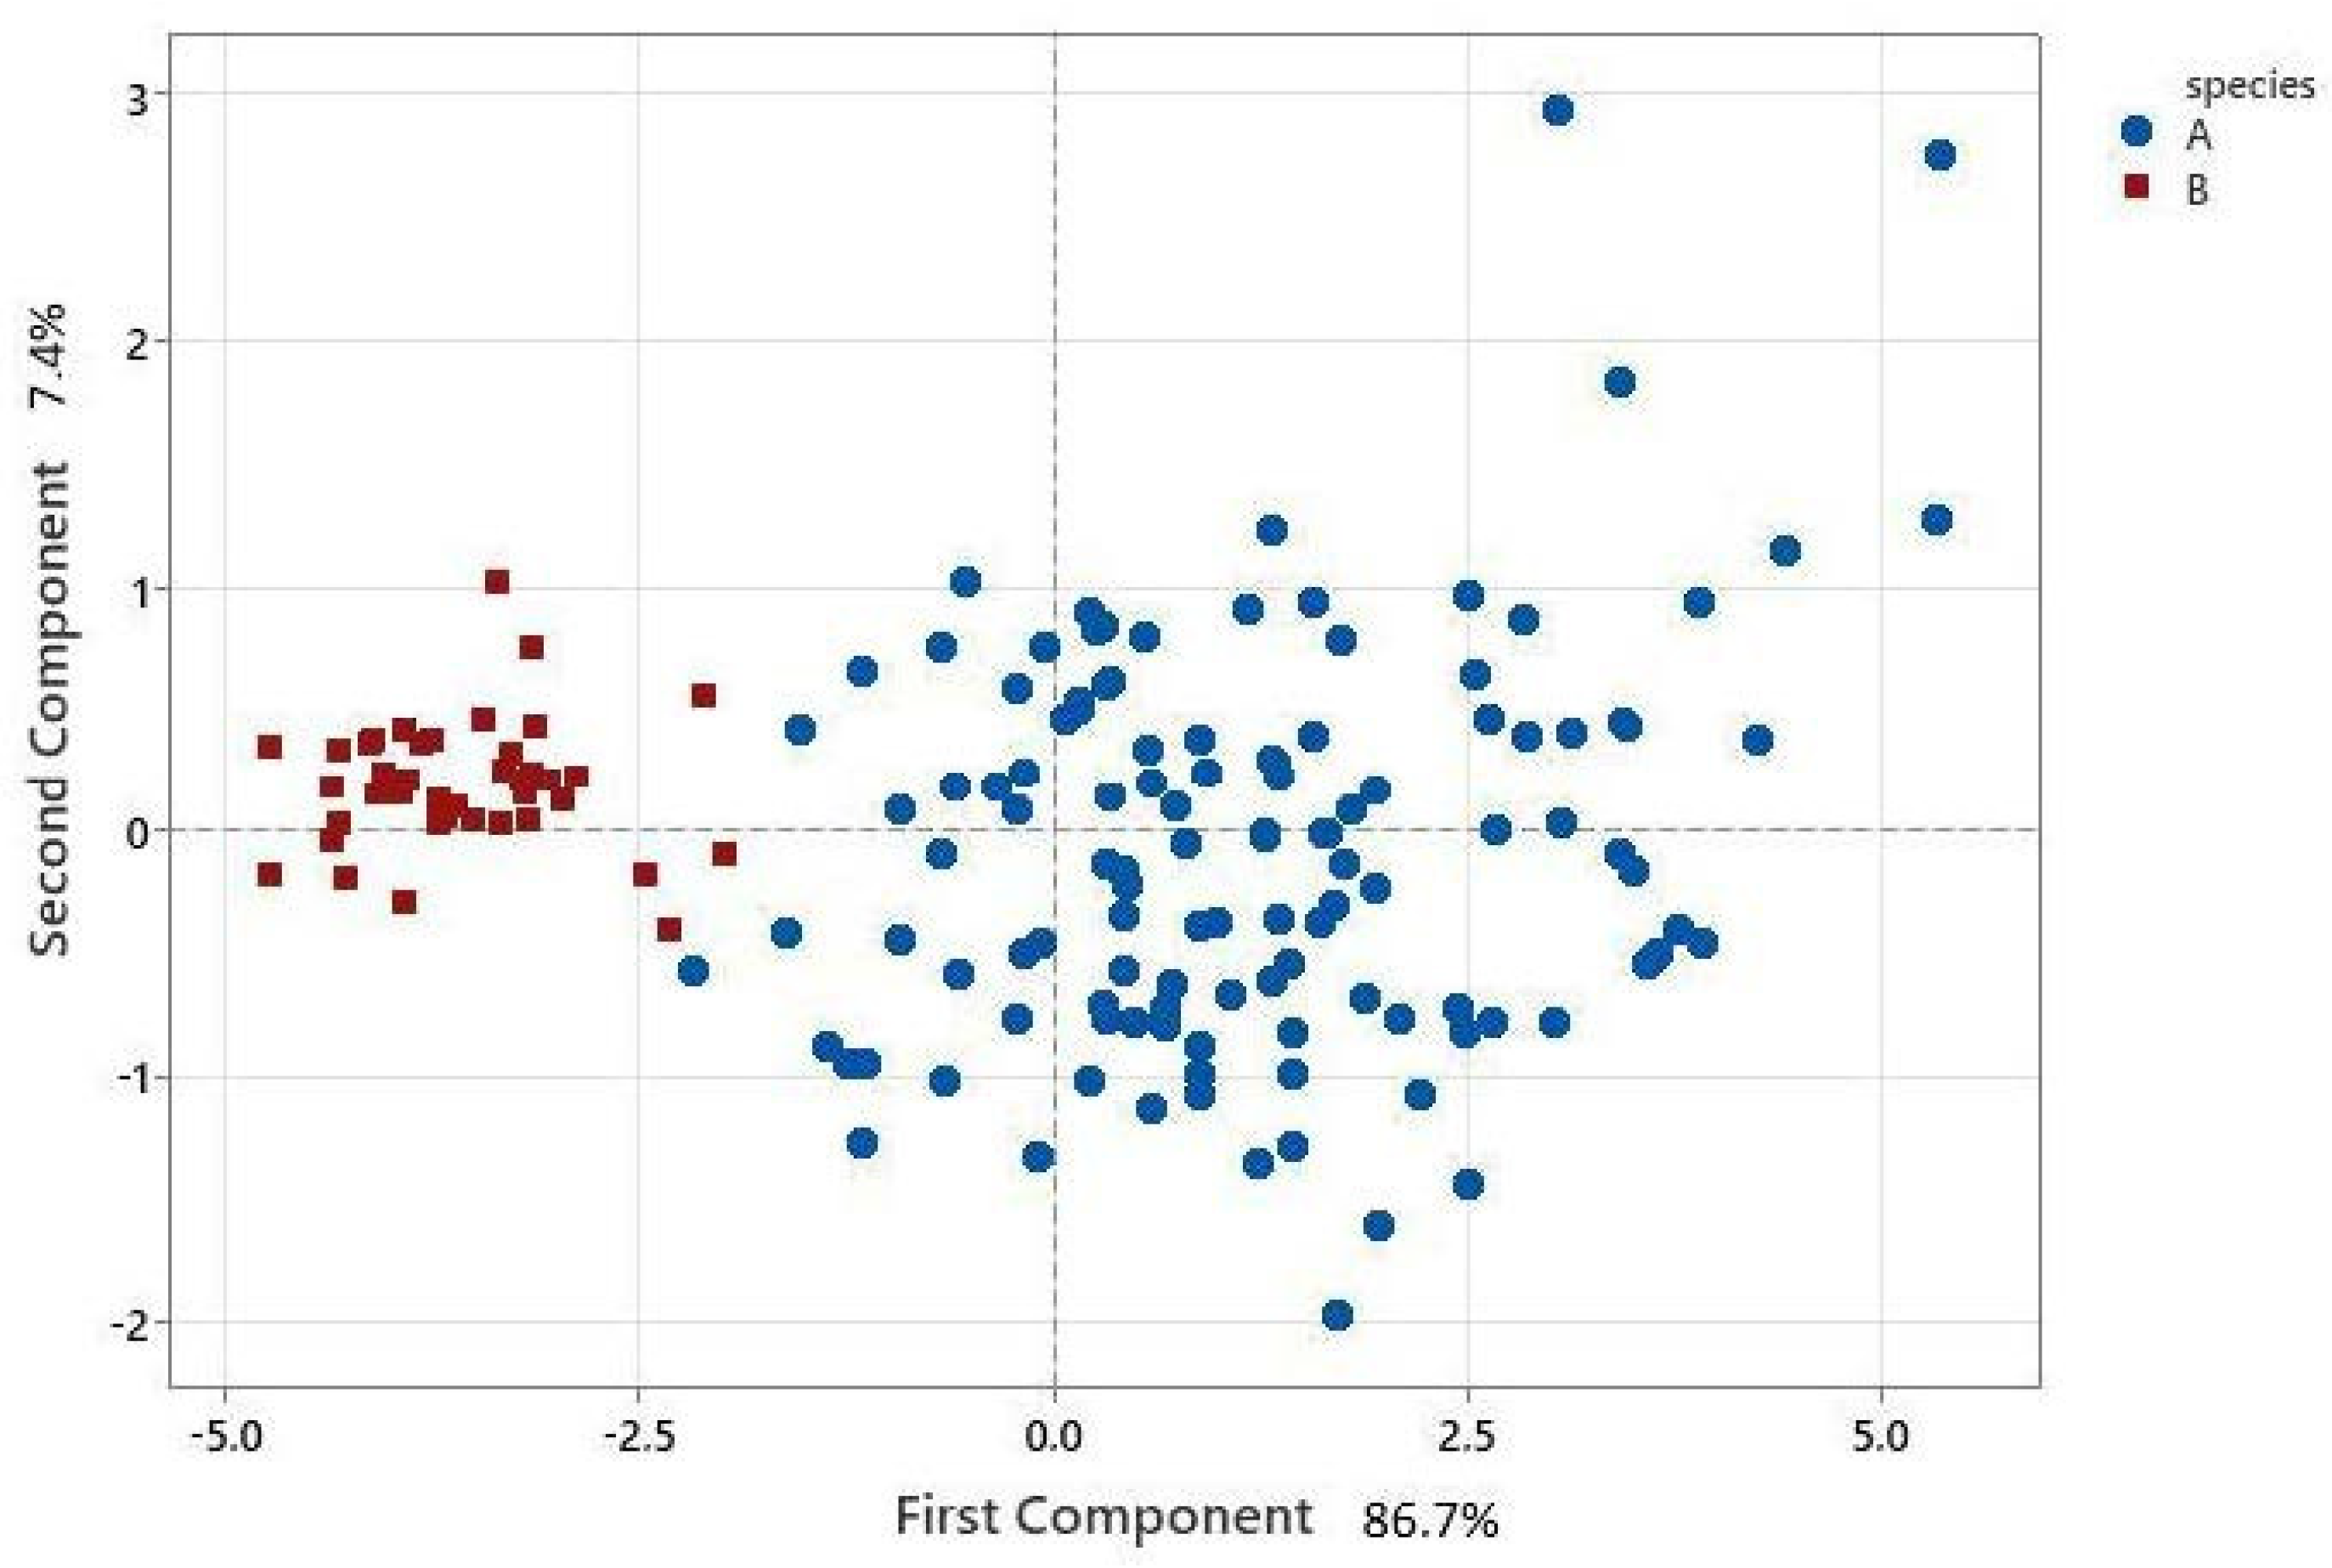
3. Results
4. Discussion
5. Conclusions
Author Contributions
Funding
Institutional Review Board Statement
Conflicts of Interest
Appendix A


References
- Pfenninger, M.; Bahl, A.; Streit, B. Isolation by distance in a population of small land snail Trochoidea geyeri: Evidence from direct and indirect methods. Proc. R. Soc. Lond. B 1996, 263, 1211–1217. [Google Scholar]
- Davison, A. Isolation and Characterization of long compund microsatellite repeat loci in the land snail. Cepaea nemoralis L. (Mollusca. Gastropoda. Pulmonata). Mol. Ecol. 1999, 8, 1760–1761. [Google Scholar] [CrossRef] [PubMed]
- Schweiger, O.; Frenzel, M.; Durka, W. Spatial genetic structure in a metapopulation of the land snail Cepaea nemoralis (Gastropoda: Helicidae). Mol. Ecol. 2004, 13, 3645–3655. [Google Scholar] [CrossRef] [PubMed]
- Taberlet, P.; Fumagalli, L.; Wust-Saucy, A.G.; Cosson, J.F. Comparative phylogeography and postglacial colonization routes in Europe. Mol. Ecol. 1998, 7, 453–464. [Google Scholar] [CrossRef] [PubMed]
- Moritz, C.; Patton, J.L.; Schneider, C.J.; Smith, T.B. Diversification of rainforest faunas: An integrated molecular approach. Annu. Rev. Ecol. Evol. Syst. 2000, 31, 533–563. [Google Scholar] [CrossRef]
- Guiller, A.; Coutellec-Vreto, M.A.; Madec, L.; Deunff, J. Evolutionary history of the land snail Helix aspersa in the Western Mediterranean: Preliminary results inferred from mitochondrial DNA sequences. Mol. Ecol. 2001, 10, 81–87. [Google Scholar] [CrossRef]
- Czarnoleski, M.; Labecka, A.M.; Kozłowski, J. Thermal plasticity of body size and cell size in snails from two subspecies of Cornu aspersum. J. Molluscan Stud. 2016, 82, 235–243. [Google Scholar] [CrossRef]
- Guiller, A.; Martin, M.C.; Hiraux, C.; Madec, L. Tracing the invasion of the Mediterranean land snail Cornu aspersum aspersum becoming an agricultural and garden pest in areas recently introduced. PLoS ONE 2012, 7, e49674. [Google Scholar] [CrossRef]
- Sherpa, S.; Ansart, A.; Madec, L.; Martin, M.C.; Dréano, S.; Guiller, A. Refining the biogeographical scenario of the land snail Cornu aspersum aspersum: Natural spatial expansion and human-mediated dispersal in the Mediterranean basin. Mol. Phylogenet. Evol. 2018, 120, 218–232. [Google Scholar] [CrossRef]
- Guiller, A.; Madec, L.; Daguzan, J. Geographical patterns of genetic differentiation in the landsnail Helix aspersa Müller (Gastropoda: Pulmonata). J Molluscan Stud. 1994, 60, 205–221. [Google Scholar] [CrossRef]
- Guiller, A.; Bellido, A.; Coutelle, A.; Madec, L. Spatial genetic pattern in the land mollusc Helix aspersa inferred from a ‘centre-based clustering’ procedure. Genet. Res. 2006, 88, 27–44. [Google Scholar] [CrossRef] [PubMed][Green Version]
- Guiller, A.; Madec, L. Historical biogeography of the land snail Cornu aspersum: A new scenario inferred from haplotype distribution in the Western Mediterranean basin. BMC Evol. Biol. 2010, 10, 18. [Google Scholar] [CrossRef] [PubMed]
- Schneider, C.; Moritz, C. Rainforest refugia and Australia’s Wet Tropics. Proc. R. Soc. Lond. B Biol. Sci. 1999, 266, 191–196. [Google Scholar] [CrossRef]
- Hewitt, G.M. Quaternary phylogeography: The roots of hybrid zones. Genetica 2011, 139, 617–638. [Google Scholar] [CrossRef]
- Adams, D.C.; Rohlf, F.J.; Slice, D.E. Geometric morphometrics: Ten years of progress following the ‘revolution’. Ital. J. Zool. 2004, 71, 5–16. [Google Scholar] [CrossRef]
- Madec, L.; Bellido, A.; Guiller, A. Shell shape of the land snail Cornu aspersum in North Africa: Unexpected evidence of a phylogeographical splitting. Heredity 2003, 91, 224–231. [Google Scholar] [CrossRef][Green Version]
- Cain, A.J. Variation in shell shape and size of helicid snails in relation to other pulmonates in faunas of the Palaearctic region. Malacologia 1981, 21, 149–176. [Google Scholar]
- De Matos, R.M. Genetics of shell ground colour in Helix aspersa I. Colour locus. uniform and their interactions. Heredity 1984, 53, 11–20. [Google Scholar] [CrossRef]
- Cook, L.M.; Pettitt, C.W.A. Morph frequencies in the snail Cepaea nemoralis: Changes with time and their interpretation. Biol. J. Linn. Soc. 1998, 64, 137–150. [Google Scholar] [CrossRef]
- Desouky, M.M.; Busais, S. Phylogenetic relationships of the land snail; Eobania vermiculata (Müller, 1774) from Egypt and Saudi Arabia. A combined morphological and molecular analysis. J. Basic Appl. Zool. 2012, 65, 144–151. [Google Scholar] [CrossRef]
- Gomot, A. Biochemical composition of Helix snails: Influence of genetic and physiological factors. J. Molluscan Stud. 1998, 64, 173–181. [Google Scholar] [CrossRef]
- Barker, G.M. (Ed.) Gastropods on Land: Phylogeny, Diversity and Adaptive Morphology. In The Biology of Terrestrial Molluscs; CABI Publishing: Wallingford, UK, 2001; pp. 1–146. [Google Scholar]
- Milinsk, M.C.; Padre, R.; Hayashi, C.D.; Oliveira, C.C.; Visentainer, J.V.; Souza, N.E.; Matsushita, M. Effect of feed protein and lipid contents on fatty acid profile of snail (Helix aspersa maxima) meat. J. Food Compos. Anal. 2006, 19, 212–216. [Google Scholar] [CrossRef]
- Kougiagka, Ε.; Apostologamvrou, C.; Giannouli, P.; Hatziioannou, M. Quality Factors of Commercial Snail Fillets as Affected by Species. Food Technol. Biotechnol. 2022, 60, 330–337. [Google Scholar] [CrossRef] [PubMed]
- Johnson, M.S. Thirty-four years of climatic selection in the land snail Theba pisana. Heredity 2001, 106, 741–748. [Google Scholar] [CrossRef]
- Lecompte, O.; Madec, L.; Daguzan, J. Temperature and phenotypic plasticity in the shell colour and banding of the land snail Helix aspersa. Comptes Rendus l’Academie Sci. Ser. III Sci. Vie 1998, 8, 649–654. [Google Scholar]
- Guiller, A.; Arnaud, J.F.; Vautrin, D.; Solignac, M. Highly polymorphic microsatelite markers in the land snail Helix aspersa (Mollusca Gastropoda). Mol. Ecol. 2000, 9, 1171–1193. [Google Scholar] [CrossRef] [PubMed]
- Guiller, A.; Bellido, A.; Madec, L. Genetic distances and irdination: The land snail Helix aspersa in North Africa as a test case. Syst. Biol. 1998, 47, 208–227. [Google Scholar] [CrossRef]
- Lazaridou-Dimitriadou, Μ.; Karakousis, N.; Staikou, A. Geographical variation in shell morphology and isoenzymes of Helix aspersa Müller. 1774 (Gastropoda. Pulmonata), the edible land snail, from Greece and Cyprus. Heredity 1994, 72, 23–35. [Google Scholar] [CrossRef][Green Version]
- Exadactylos, A.; Malandrakis, E.E.; Panagiotaki, P.; Geffen, A.J. The development of size variation in Dover sole, Solea solea and turbot, Scophthalmus maximus: Genetic variability between different geographic and among year class farmed strains. Aquac. Res. 2013, 44, 1912–1925. [Google Scholar] [CrossRef]
- Konstantinidis, I.; Gkafas, G.A.; Karamitros, G.; Lolas, A.; Antoniadou, C.; Vafidis, D.; Exadactylos, A. Population structure of two benthic species with different larval stages in the eastern Mediterranean Sea. J. Environ. Prot. Ecol. 2017, 18, 930–939. [Google Scholar]
- Price, M.R.; Hadfield, M.G. Population genetics and the effects of a severe bottleneck in an exsitu population of critically endangered Hawaiian tree snails. PLoS ONE 2014, 9, e114377. [Google Scholar] [CrossRef] [PubMed]
- Smith, E.M.; Hoffman, J.I.; Green, L.E.; Amos, W. Preliminary association of microsatellite heterozygosity with footrot in domestic sheep. Livest. Sci. 2012, 143, 293–299. [Google Scholar] [CrossRef][Green Version]
- Aljumaah, R.S.; Kibogo, H.; Kwallah, A.; Jianlin, H.; Musthafa, M.M. Genetic Relationships among Four Saudi Arabian Sheep Populations. Iran. J. Appl. Anim. Sci. 2014, 4, 775–779. [Google Scholar]
- Mitton, J.B.; Grant, M.C.; Yoshino, A.M. Variation in allozymes and stomatal size in pinyon (Pinus edulis, Pinaceae), associated with soil moisture. Am. J. Bot. 2011, 85, 1262–1265. [Google Scholar] [CrossRef]
- Borrell, Y.; Espinosa, G.; Romo, J.; Blanco, G.; Vázquez, E.; Sánchez, J.A. DNA microsatellite variability and genetic differentiation among natural populations of the Cuban white shrimp Litopenaeus schmitti. Mar. Biol. 2004, 144, 327–333. [Google Scholar] [CrossRef]
- Elliott, A.C.; Pierce, B.A. Size, growth rate and multiple-locus heterozygosity in the land snail (Otala lactea). J. Hered. 1992, 83, 270–274. [Google Scholar] [CrossRef]
- Sobolev, A.; Circi, A.; Capitani, D.; Ingallina, C.; Mannina, L. Molecular fingerprinting of food authenticity. Curr. Opin. Food Sci. 2017, 16, 59–66. [Google Scholar] [CrossRef]
- Borgo, R.; Souty-Grosset, C.; Bouchon, D.; Gomot, L. PCR-RFLP Analysis of mitochondrial DNA for identification of snail meat species. J. Food Sci. 1996, 61, 1–4. [Google Scholar] [CrossRef]
- Martsikalis, P.V.; Kavouras, M.; Gkafas, G.A.; Apostolidis, A.P.; Boziaris, I.; Exadactylos, A. Morphological and free amino acid profile variability, as a tool for stock identification among farmed rainbow trout, Oncorhynchus mykiss of different origin. Aquac. Res. 2018, 49, 621–630. [Google Scholar]
- Perea, J.; Garcia, A.; Acero, R.; Valerio, D.; Gómez, G. A photogrammetric methodology for size measurements: Application to the study of weight–shell diameter relationship in juvenile Cantareus aspersus snails. J. Molluscan Stud. 2000, 74, 209–213. [Google Scholar] [CrossRef]
- Exadactylos, A. Population Genetics of the Dover sole, Solea solea (Linnaeus, 1758) (Teleostei: Soleidae). Doctoral Dissertation, University of Liverpool, Liverpool, UK, 1997. [Google Scholar]
- Toonen, R.J.; Hughes, S. Increased throughput for fragment analysis on ABI prism 377 automated sequencer using a membrane comb and STRand software. BioTechniques 2001, 31, 1320–1324. [Google Scholar]
- SPSS, v. 23; IBM: New York, NY, USA, 2018.
- Raymond, M.; Rousset, F. Genepop (Version 1.2): A population genetics software for exact tests and ecumenicism. J. Hered. 1995, 86, 248–249. [Google Scholar] [CrossRef]
- Weir, B.S.; Cockerham, C.C. Estimating F-statistics for the analysis of population structure. Evolution 1984, 38, 1358–1370. [Google Scholar] [PubMed]
- Peakall, R.; Smouse, P.E. GenAlEx 6.5: Genetic analysis in Excel. Population genetic software for teaching and research-an update. Bioinformatics 2012, 28, 2537–2539. [Google Scholar] [CrossRef] [PubMed]
- Excoffier, L.; Lischer, H.E. Arlequin suite ver 3.5: A new series of programs to perform population genetics analyses under Linux and Windows. Mol. Ecol. Resour. 2010, 10, 564–567. [Google Scholar] [CrossRef]
- Pritchard, J.K.; Stephens, M.; Donnelly, P. Inference of population structure using multilocus genotype data. Genetics 2000, 155, 945–959. [Google Scholar] [CrossRef]
- Earl, D.A.; von Holdt, B.M. STRUCTURE HARVESTER: A website and program for visualizing STRUCTURE output and implementing the Evanno method. Conserv. Genet. Resour. 2012, 4, 359–361. [Google Scholar] [CrossRef]
- Evanno, G.; Regnaut, S.; Goudet, J. Detecting the number of clusters of individuals using the software structure: A simulation study. Mol. Ecol. 2005, 14, 2611–2620. [Google Scholar] [CrossRef]
- Apostolou, K.; Staikou, A.; Sotiraki, S.; Hatziioannou, M. An Assessment of Snail-Farm Systems Based on Land Use and Farm Components. Animals 2021, 11, 272. [Google Scholar] [CrossRef]
- Apostolou, K.; Pappas-Zois, E.; Flessas, A.; Neofitou, C.; Katsoulas, N.; Kittas, C.; Hatziioannou, M. Snail farming in net-covered greenhouses: A comparison between semi-natural and artificial conditions. Agric. Food 2016, 4, 646–654. [Google Scholar]
- Chiba, S. Morphological divergence as a result of common adaptation to a shared environment in land snails of the genus Hirasea. J. Molluscan Stud. 2009, 75, 253–259. [Google Scholar] [CrossRef]
- Lazaridou-Dimitriadou, M.; Alpoyanni, E.; Baka, M.; Brouziotis, T.H.; Kifonidis, N.; Mihaloudi, E.; Vellis, G. Growth, mortality and fecundity in successive generations of Helix aspersa müller cultured indoors and crowding effects on fast-, medium-and slow-growing snails of the same clutch. J. Molluscan Stud. 1998, 64, 67–74. [Google Scholar] [CrossRef]
- Martsikalis, P.; Gkafas, G.A.; Apostolidis, A.P.; Exadactylos, A. Genetic structure profile of rainbow trout (Oncorhynchus mykiss) farmed strains in Greece. Turk. J. Fish. Aquat. Sci. 2014, 14, 749–757. [Google Scholar] [CrossRef] [PubMed]
- Scheil, A.E.; Hilsmann, S.; Triebskorn, R.; Köhler, H.R. Shell colour polymorphism, injuries and immune defense in three helicid snail species, Cepaea hortensis, Theba pisana and Cornu aspersum maximum. Results Immunol. 2013, 3, 73–78. [Google Scholar] [CrossRef] [PubMed]
- Dowle, E.J.; Morgan-Richards, M.; Brescia, F.; Trewick, S.A. Correlation between shell phenotype and local environment suggests a role for natural selection in the evolution of Placostylus snails. Mol. Ecol. 2015, 24, 4205–4221. [Google Scholar] [CrossRef]
- Pigliucci, M. Phenotypic Plasticity: Beyond Nature and Nurture; JHU Press: Baltimore, MD, USA, 2001. [Google Scholar]
- Auld, J.R.; Relyea, R.A. Inbreeding depression in adaptive plasticity under predation risk in a freshwater snail. Biol. Lett. 2010, 6, 222–224. [Google Scholar] [CrossRef]
- Reed, D.H.; Frankham, R. Correlation between fitness and genetic diversity. Conserv. Biol. 2003, 17, 230–237. [Google Scholar] [CrossRef]
- Gkafas, G.A.; Hatziioannou, M.; Malandrakis, E.E.; Tsigenopoulos, C.S.; Karapanagiotidis, I.T.; Mente, E.; Vafidis, D.; Exadactylos, A. Heterozygosity fitness correlations and generation interval of the Norway lobster in the Aegean Sea, eastern Mediterranean. J. Biol. Res. 2019, 26, 14. [Google Scholar] [CrossRef]
- Falconer, D.S.; Mackay, T.F.C. Introduction to Quantitative Genetics, 4th ed.; Longmans Green: Harlow, UK, 1996. [Google Scholar]
- Fiorentino, V.; Pavesi, L.; Hartmann, S.; Pfautsch, S.; Tiedemann, R.; Ketmaier, V. Characterization of novel microsatellite loci using deep sequencing in the Sicilian 1 endemic land snail Murella muralis ssp. (Gastropoda: Pulmonata). Mol. Ecol. Resour. 2012, 10, 341–347. [Google Scholar]
- Ma, H.; Yu, D.; Xiao, S.; Qin, Y.; Zhang, Y.; Li, J.; Yu, Z. A Significant Genetic Admixture in Farmed Populations of the Noble Scallop Chlamys nobilis Revealed by Microsatellite DNA Analysis in Southern China. Front. Mar. Sci. 2001, 8, 721292. [Google Scholar] [CrossRef]
- Locher, R.; Baur, B. Isolation microsatellite markers in the hermaphroditic land snail Arianta arbostorum (Gastropoda). Mol. Ecol. Notes 2001, 1, 39–40. [Google Scholar] [CrossRef]
- Arnaud, J.F.; Madec, L.; Guiller, A.; Bellido, A. Spatial analysis of allozyme and microsatellite DNA polymorphisms in the land snail Helix aspersa (Gastropoda: Helicidae). Mol. Ecol. 2001, 10, 1563–1576. [Google Scholar] [CrossRef] [PubMed]
- Exadactylos, A.; Vafidis, D.; Tsigenopoulos, C.S.; Gkafas, G.A. High connectivity of the white seabream (Diplodus sargus, L. 1758) in the Aegean Sea, eastern Μediterranean basin. Animals 2019, 9, 979. [Google Scholar] [CrossRef] [PubMed]
- Pascoal, A.; Barros-Velázquez, J.; Cepeda, A.; Gallardo, J.M.; Calo-Mata, P. Survey of the authenticity of prawn and shrimp species in commercial food products by PCR-RFLP analysis of a 16S rRNA/tRNAVal mitochondrial region. Food Chem. 2008, 109, 638–646. [Google Scholar] [CrossRef]
- Palmeira, C.A.M.; da Silva Rodrigues-Filho, L.F.; de Luna Sales, J.B.; Vallinoto, M.; Schneider, H.; Sampaio, I. Commercialization of a critically endangered species (largetooth sawfish, Pristis perotteti) in fish markets of northern Brazil: Authenticity by DNA analysis. Food Control 2013, 34, 249–252. [Google Scholar] [CrossRef]


| Primer | Sequence | Pigment | ||
|---|---|---|---|---|
| Ha5 | F:GTGTGACACACTGCCCTGGA | (TG)19 | 117–207 | FAM |
| R:CAATGGCAAACTACTGAAAGCAA | ||||
| Ha6 | F:TTATCCGCTTGATATATCCT | (GA)23(GGA)4 | 145–215 | HEX |
| R:ACTCGTACATGGTTGAAAAC | ||||
| Ha8 | F:AGTTTGCTGGTTTGTACACTCG | (CA)14CGTG(CA)3AGATG(CA)2 | 152–210 | FAM |
| R:CGTTTTTAGCTCTTGAATACGG | ||||
| Ha9 | F:AGCTAACCCACACTCAGATTT | (TG)5 … (CA)20… (AT)6 | 108–172 | TAMRA |
| R:AGCCAGCTAATATGTTTGGA | ||||
| Ha10 | F:GCGTTCAATGTAGTTTATGTGCG | (CA)6(CGCA)3(CA)4TACACG(CA)14 | 211–253 | TAMRA |
| R:GAGAACATGCATACAAACAAACATG | ||||
| Ha11 | F:CGTGTACTACTGGGCAACGT | (TC)2ACTGTTCC(TC)33 | 175–240 | HEX |
| R:ACGGAAAGAGACAGAAAGTGAG |
| Subspecies | Population | D (mm) | H(mm) | d(mm) | W(g) | Wf (g) | Wv(g) | Ws(g) |
|---|---|---|---|---|---|---|---|---|
| C. a. aspersum | ΚΝΤ1 | 29.36 ± 1.58 a | 28.74 ± 1.04 a | 14.50 ± 1.80 a | 6.52 ± 0.83 a | 0.80 ± 0.12 a | 3.26 ± 0.49 a | 2.46 ± 0.52 a |
| OΜR | 27.20 ± 1.84 b | 26.23 ± 1.33 b | 13.61 ± 0.92 a | 5.22 ± 0.78 b | 0.72 ± 0.08 b | 2.84 ± 0.60 b | 1.67 ± 0.41 b | |
| Statistics | P = 0.00, T = 3.98 | P = 0.00, T = 6.66 | P = 0.058, T = 1.98 | P = 0.00, T = 5.06 | P = 0.022, T = 2.40 | P = 0.00, T = 5.28 | P = 0.019, T = 2.45 | |
| C. a. maximum | SDN | 38.08 ± 2.08 b | 36.83 ± 1.40 b,c | 19.98 ± 1.57 b | 12.36 ± 1.92 | 2.31 ± 0.26 | 3.99 ± 0.92 | 6.06 ± 1.20 c |
| SRT | 35.37 ± 2.14 c | 34.50 ± 1.96 d | 18.17 ± 1.59 c | 10.64 ± 1.69 | 2.10 ± 0.19 | 3.62 ± 0.90 | 4.92 ± 1.06 c | |
| KNT2 | 37.74 ± 2.08 b | 36.26 ± 1.96 c | 20.19 ± 2.74 b | 12.26 ± 2.03 | 1.77 ± 0.36 | 5.33 ± 0.90 | 5.16 ± 1.30 b | |
| VOL | 39.97 ± 2.57 a | 38.26 ± 1.98 a.b | 21.42 ± 1.58 a.b | 14.06 ± 2.09 | 2.29 ± 0.28 | 5.68 ± 1.22 | 6.09 ± 1.43 b | |
| AGR | 41.78 ± 1.59 a | 38.86 ± 1.81 a | 22.24 ± 1.49 a | 17.90 ± 2.02 | 3.00 ± 0.41 | 7.71 ± 1.57 | 7.19 ± 1.30 a | |
| VSL | 37.83 ± 1.55 b | 35.81 ± 1.63 c.d. | 18.28 ± 1.37 c | 12.13 ± 1.85 | 1.94 ± 0.13 | 6.08 ± 1.43 | 4.10 ± 0.68 b | |
| Statistics | P = 0.00, F = 23.17 | P = 0.00, F = 15.98 | P = 0.00, F = 16.76 | P = 0.00, H = 61.85 | P = 0.00, H = 73.73 | P = 0.00, H = 51.68 | P = 0.00, F = 31.34 |
| C. a. aspersum | ΚΝΤ1 | |||||
| OΜR | 0.034 * | |||||
| ΚΝΤ2 | SDN | SRT | AGR | VOL | ||
| SDN | −0.0065 | 0 | ||||
| SRT | −0.0026 | −0.0013 | 0 | |||
| AGR | 0 | 0.0095 | 0.0082 | 0 | ||
| VOL | −0.0014 | 0.0053 | 0 | −0.0027 | 0 | |
| VSL | −0.0016 | 0.0009 | −0.0021 | 0.0088 | 0.0092 |
| C. a. aspersum | |||||
| df | Sum of squares | Percentage of variation | Fixation index | ||
| Among populations | 1 | 0.175 | 0 | FST = 0.030 | P = 0.001 |
| Within populations | 38 | 10.7 | 100 | ||
| Total | 39 | 10.875 | |||
| C. a. maximum | |||||
| df | Sum of squares | Percentage of variation | Fixation index | ||
| Among populations | 5 | 1.517 | 0 | FST = 0.002 | P = 0.197 |
| Within populations | 114 | 51.450 | 100 | ||
| Total | 119 | 52.967 | |||
| Population | |||||||||||
|---|---|---|---|---|---|---|---|---|---|---|---|
| C. a. aspersum | C. a. maximum | ||||||||||
| Locus | KNT1 | OΜR | All | SDN | SRT | ΚΝΤ2 | VOL | AGR | VSL | All | |
| Ha5 | HEXP | 0.885 | 0.856 | 0.882 | 0.922 | 0.891 | 0.924 | 0.891 | 0.877 | 0.876 | 0.904 |
| HOBS | 0.450 | 0.400 | 0.425 | 0.500 | 0.500 | 0.300 | 0.550 | 0.706 | 0.650 | 0.528 | |
| No | 11 | 12 | 14 | 13 | 10 | 11 | 11 | 13 | 10 | 16 | |
| FIS | 0.498 | 0.539 | 0.518 | 0.464 | 0.445 | 0.681 | 0.389 | 0.200 | 0.263 | 0.416 | |
| Ha6 | HEXP | 0.894 | 0.958 | 0.933 | 0.913 | 0.858 | 0.904 | 0.908 | 0.919 | 0.869 | 0.900 |
| HOBS | 0.550 | 0.750 | 0.650 | 0.800 | 0.800 | 0.500 | 0.700 | 0.790 | 0.550 | 0.690 | |
| No | 16 | 19 | 23 | 14 | 13 | 13 | 13 | 15 | 14 | 27 | |
| FIS | 0.391 | 0.221 | 0.303 | 0.126 | 0.069 | 0.453 | 0.233 | 0.144 | 0.373 | 0.234 | |
| Ha8 | HEXP | 0.905 | 0.838 | 0.879 | 0.847 | 0.889 | 0.924 | 0.945 | 0.916 | 0.900 | 0.912 |
| HOBS | 0.474 | 0.700 | 0.587 | 0.650 | 0.500 | 0.500 | 0.700 | 0.684 | 0.550 | 0.597 | |
| No | 14 | 14 | 21 | 13 | 16 | 15 | 17 | 14 | 13 | 25 | |
| FIS | 0.483 | 0.169 | 0.333 | 0.238 | 0.444 | 0.466 | 0.264 | 0.258 | 0.395 | 0.345 | |
| Ha9 | HEXP | 0.684 | 0.878 | 0.786 | 0.815 | 0.746 | 0.845 | 0.810 | 0.809 | 0.763 | 0.806 |
| HOBS | 0.632 | 0.550 | 0.587 | 0.632 | 0.750 | 0.450 | 0.650 | 0.579 | 0.500 | 0.596 | |
| No | 10 | 10 | 14 | 11 | 10 | 10 | 10 | 10 | 9 | 18 | |
| FIS | 0.079 | 0.380 | 0.249 | 0.230 | −0.005 | 0.474 | 0.202 | 0.290 | 0.350 | 0.260 | |
| Ha10 | HEXP | 0.928 | 0.923 | 0.934 | 0.935 | 0.941 | 0.921 | 0.939 | 0.956 | 0.921 | 0.947 |
| HOBS | 0.450 | 0.800 | 0.625 | 0.632 | 0.500 | 0.450 | 0.400 | 0.526 | 0.500 | 0.501 | |
| No | 15 | 14 | 20 | 16 | 16 | 12 | 16 | 18 | 13 | 23 | |
| FIS | 0.522 | 0.136 | 0.331 | 0.330 | 0.475 | 0.518 | 0.580 | 0.456 | 0.463 | 0.471 | |
| Ha11 | HEXP | 0.921 | 0.928 | 0.933 | 0.937 | 0.955 | 0.941 | 0.928 | 0.946 | 0.941 | 0.950 |
| HOBS | 0.550 | 0.650 | 0.600 | 0.667 | 0.579 | 0.700 | 0.526 | 0.611 | 0.700 | 0.631 | |
| No | 16 | 14 | 20 | 15 | 17 | 16 | 14 | 15 | 16 | 27 | |
| FIS | 0.409 | 0.305 | 0.357 | 0.294 | 0.400 | 0.261 | 0.439 | 0.361 | 0.261 | 0.336 | |
| All loci | HEXP | 0.869 | 0.897 | 0.895 | 0.880 | 0.910 | 0.903 | 0.904 | 0.878 | ||
| HOBS | 0.518 | 0.642 | 0.647 | 0.605 | 0.483 | 0.588 | 0.649 | 0.580 | |||
| HWE | * | * | * | * | * | * | * | * | |||
| No | 13.67 | 13.83 | 13.67 | 13.50 | 13 | 13.50 | 14.17 | 12.50 | |||
| FIS | 0.411 | 0.290 | 0.281 | 0.318 | 0.475 | 0.355 | 0.293 | 0.351 | |||
Publisher’s Note: MDPI stays neutral with regard to jurisdictional claims in published maps and institutional affiliations. |
© 2022 by the authors. Licensee MDPI, Basel, Switzerland. This article is an open access article distributed under the terms and conditions of the Creative Commons Attribution (CC BY) license (https://creativecommons.org/licenses/by/4.0/).
Share and Cite
Kougiagka, E.; Gkafas, G.A.; Exadactylos, A.; Hatziioannou, M. Morphology and Genetic Structure Profile of Farmed Snails Cornu aspersum aspersum and Cornu aspersum maximum in Greece. Sustainability 2022, 14, 15965. https://doi.org/10.3390/su142315965
Kougiagka E, Gkafas GA, Exadactylos A, Hatziioannou M. Morphology and Genetic Structure Profile of Farmed Snails Cornu aspersum aspersum and Cornu aspersum maximum in Greece. Sustainability. 2022; 14(23):15965. https://doi.org/10.3390/su142315965
Chicago/Turabian StyleKougiagka, Efkarpia, Georgios A. Gkafas, Athanasios Exadactylos, and Marianthi Hatziioannou. 2022. "Morphology and Genetic Structure Profile of Farmed Snails Cornu aspersum aspersum and Cornu aspersum maximum in Greece" Sustainability 14, no. 23: 15965. https://doi.org/10.3390/su142315965
APA StyleKougiagka, E., Gkafas, G. A., Exadactylos, A., & Hatziioannou, M. (2022). Morphology and Genetic Structure Profile of Farmed Snails Cornu aspersum aspersum and Cornu aspersum maximum in Greece. Sustainability, 14(23), 15965. https://doi.org/10.3390/su142315965