Article

Exploring the Structure of Static Net Fisheries in a Highly Invaded Region: The Case of Rhodes Island (Eastern Mediterranean)

by
Gerasimos Kondylatos
1,*,
Georgios Vagenas
2,
Konstantinos Kalaentzis
1,
Dimitris Mavrouleas
1,
Alexios Conides
2,
Paraskevi K. Karachle
2,
Maria Corsini-Foka
1 and
Dimitris Klaoudatos
3
1
Hydrobiological Station of Rhodes, Hellenic Centre for Marine Research, 85131 Rhodes, Greece
2
Institute of Marine Biological Resources and Inland Waters, Hellenic Centre for Marine Research, 19013 Anavissos, Greece
3
Department of Ichthyology and Aquatic Environment (DIAE), School of Agricultural Sciences, University of Thessaly (UTh), 38446 Volos, Greece
*
Author to whom correspondence should be addressed.
Sustainability 2023, 15(20), 14976; https://doi.org/10.3390/su152014976
Submission received: 25 July 2023 / Revised: 11 October 2023 / Accepted: 13 October 2023 / Published: 17 October 2023
(This article belongs to the Special Issue Advances in Rural and Aquatic Sustainability)

Abstract

:
Experimental fishing was conducted in three different locations along the coastal marine waters of eastern Rhodes Island, Levantine Sea, Hellas, from April 2021 to March 2022 on a monthly basis. Twelve samplings with gill nets and 12 with trammel nets at each of three selected locations resulted in a total of 72 samplings. The numbers of indigenous and non-indigenous species, as well as their abundances, biomasses and frequencies of occurrence, were recorded. Overall, the samplings yielded 71 species, of which 14 were non-indigenous. The total abundance was 1879 individuals, corresponding to a fish biomass of 433.57 kg. Fistularia commersonii, Sparisoma cretense and Pterois miles exhibited the highest numbers of individuals, whereas three of the invasive alien species in the Hellenic seas, namely, F. commersonii, Lagocephalus sceleratus and P. miles had the highest biomasses. The results exhibited a strong presence of P. miles in the Rhodian fisheries as the dominant invasive species based on the examined indicators (i.e., abundance, catches and frequency of occurrence). Comparisons in regard to the collected biomass between the locations, seasons, species origins and types of fishing gear were performed. All three locations were characterized by a good ecological status based on the relationship between abundance and biomass. The results of this study contribute valuable information on the ongoing changes in small-scale fisheries in the marine waters of Rhodes Island, which is one of the Eastern Mediterranean regions most affected by biological invasions.

1. Introduction

Mediterranean biodiversity is undergoing a rapid alteration driven by multiple stress factors, mostly due to anthropogenic activities [1,2,3,4]. Among these factors, alien species are a major threat to the biodiversity of the basin, affecting the synthesis of communities, habitats, ecosystem functioning, and services and fisheries [4,5,6,7,8]. Non-indigenous species (NIS) have also turned into a major social issue [8] and the socio-economic impacts of certain NIS were assessed [9]. On the other hand, NIS can have positive effects on the ecosystem by filling in lost niches and/or functions and improving its services, such as in the case of fisheries [8,10,11,12,13,14]. In the Mediterranean Sea, marine biological invasions are rapidly increasing since more than 1000 non-indigenous species have been introduced, while the rate of establishment has increased by 40% over the last decade [15,16,17]. The phenomenon of invasions mainly unfolds in the eastern parts, where most of the non-indigenous biota are of Indo-Pacific/Red Sea origin, as they were most probably introduced through the Suez Canal [3,6,16,18,19,20] and are progressively expanding westward.
The south Aegean Sea (Eastern Mediterranean), particularly its eastern parts on the Anatolian coasts, and the Hellenic Levantine are characterized by an oligotrophic subtropical environment that is heavily influenced by the eastern Levantine water masses and the Asia Minor current, which embraces the southern islands of the Dodecanese Archipelago. This environment is not only suitable for indigenous thermophilic biota but also for tropical or subtropical non-indigenous biota introductions [21,22] that can lead to the invasion of native habitats. This region is located along the natural pathway of the dispersion of NIS that follow the Levantine coasts upon their entrance into the Mediterranean via the Suez Canal. They are called “Lessepsian migrants” [23,24,25] and the main secondary pathway of their further westward or northward expansion certainly crosses the marine waters around the island of Rhodes [26]. The establishment and further spread of non-indigenous biota in the area are further assisted by the ongoing warming of the sea [27,28,29]. Rhodes Island is the largest of the Dodecanese islands and an ideal study area for the investigation of non-indigenous species, along with their interaction with the native fauna [22].
Among the 45 alien bony fish species recorded to date in the Hellenic Levantine waters, 40 are Lessepsian migrants [30]. Most of them were first recorded from Rhodes and adjacent regions, and today, 37 Lessepsian migrant fish species are known from that area [22,31,32,33,34,35], twelve times higher than those known at the beginning of the 1940s [36].
Some NIS, referred to as invasive alien species (IAS), have the ability to develop large populations that affect biodiversity, ecosystem services and the local economy in a short period [5,9,37,38,39]. In Hellas, 22 marine NIS have been characterized as IAS, and are included in the HELLAS-ALIENS database and the national list of IAS [40]. Among them, the following eight fish species are listed: Etrumeus golanii DiBattista Randall and Bowen, 2012; Fistularia commersonii Rüppell, 1838 (Figure 1A); Lagocephalus sceleratus (Gmelin, 1789) (Figure 1B); Parupeneus forsskali (Fourmanoir and Guézé, 1976); Pterois miles (Bennett, 1828) (Figure 1C); Siganus luridus (Rüppell, 1829); Siganus rivulatus (Forsskål and Niebuhr, 1775); and Torquigener flavimaculosus Hardy and Randall, 1983 [40]. Additionally, most of these species have been recognized as priority species in relation to fisheries for the eastern Mediterranean [41]. Indeed, Pterois miles, F. commersonii, L. sceleratus, S. luridus and S. rivulatus interact with the Hellenic small-scale fisheries, either as discards, thus reducing the fishers’ income and increasing the handling time, or negatively impacting the fishing gear and the entangled species [9,14]. It should be noted, though, that locally, some of these species are being consumed and commercialized [36].
Small-scale fisheries present a long tradition in the Mediterranean, with the first evidence dating back to 600 BC [42]. They constitute a major socioeconomic sector of the fisheries, as they account for 82% of the total regional fleet, providing an income for 115,000 people, with a revenue that reaches 27% of the total revenue from fisheries [43,44,45]. The 163,000 tons produced by the small-scale fisheries correspond to 15% of the total regional catch in terms of the fleet. However, since 2000, the size of the fleet of small-scale fisheries in all Mediterranean EU countries has been shrinking significantly [46]. The reduction in the number of fishers has led to a reduction in the catches in certain areas. Moreover, the reductions in employment and incomes are degrading their importance and contribution to the local economies.
In Hellas, among the different types of fisheries, small-scale fisheries constitute the most significant type, as they involve the second largest number of fishers in the European Union (EU) [47,48]. At the same, they involve the largest number of fishing vessels in the EU, accounting for 18.4% of the total number of EU vessels. Small-scale fisheries are found and operate along the extensive and heterogeneous coastlines of the islands and mainland. According to the Hellenic Directorate-General for Fisheries [49], the largest proportion (96.51%) of the fishing vessels in Hellas belong to the coastal small-scale fisheries that employ static gears. The majority of these vessels (59.45%) fall in the length range of 6–11.99 m, with a gross tonnage of 22,621.89 GT. The largest small-scale fleet in the eastern Mediterranean is located in the Dodecanese Islands (i.e., Astypalaia, Kalymnos, Karpathos, Kasos, Kastellorizo, Kos, Leipsi, Leros, Nisyros, Patmos, Rhodes and Symi), where 944 vessels are registered [50]. In Rhodes Island, in 2020, there were 247 registered vessels belonging to the small-scale fisheries fleet, whereas the total number of registered vessels was 251 (Central Port Authority of Rhodes, pers. comm.). Currently, there are 227 registered vessels in the Fleet Register [50].
Despite the numerous types of fishing gear and their variations used within the basin and the Hellenic marine waters [51,52], the gill nets (GNSs) and trammel nets (GTRs) are the ones primarily deployed [47,50,53]. Similarly, small-scale fisheries in Hellas employ numerous types of fishing gear [47,52], including GNSs; GTRs; longlines; jigs; and bottom fish, shrimp and octopus traps. Various mesh sizes of both GNSs and GTRs are widely used by professional small-scale fishers in the Hellenic waters [54]. Fixed or static nets refer to the fishing gear of the small-scale fisheries that catch marine organisms passively (i.e., “passive nets”), which means being caught either by their gills, becoming entangled or becoming trapped in sac-like formations of the inner netting in GTRs or wedged in GNSs [55,56]. The standard abbreviations GNS and GTR are in accordance with the International Standard Statistical Classification of Fishing Gear (ISSCFG) [51].
In comparison with large-scale fisheries and other fishing types, small-scale fisheries are considered potentially more sustainable with far less discarded waste and impact on benthic communities [57,58]. At the same time, they present important economic and social benefits since they employ more people and spend far less fuel in order to catch roughly the same quantity of commercial fish [57]. Nevertheless, small-scale fisheries present disadvantages such as remoteness; lack of infrastructure; marginal political power; difficulties in monitoring; and competition for space and market access with the large-scale fisheries, recreational fisheries and human activities in coastal areas [45,46,59,60,61]. According to a recent multi-area study [62], the synthesis of the catches of small-scale fisheries in the Mediterranean presents a high species diversity; however, only a limited number of species contribute economically. In fact, the catches and revenues are defined by no more than five species [62].
Published data on the GNS and GTR fisheries in the Rhodian marine waters are scarce [36,63,64,65]. The importance of fisheries data collection is highlighted by the “Voluntary Guidelines for Securing Sustainable Small-Scale Fisheries in the Context of Food Security and Poverty Eradication” adapted by FAO Member Nations [62,66]. The Guidelines point out the urgent need for the continuous collection of data on small-scale fisheries since this data is very scarce, discontinuous, spatially and temporally limited, and rather difficult to gather [45,62], and at the same time, fundamentally important for the socially, economically and environmentally sustainable development of small-scale fisheries and fishers. The importance of data collection and assessment for improving fisheries management and the lack of information has been emphasized by various authors, e.g., [44,60,67].
The aim of this present study was the provision and addition of new data on the ongoing changes in diversity, abundance and biomass of NIS vs. IS caught by small-scale fisheries in the Levantine. More analytically, we aimed to (1) depict the present status of the fish population structure in Rhodian coastal waters, (2) estimate the catch composition of artisanal GNS and GTR fisheries in Rhodian coastal waters with particular interest in the NIS contribution in the catches, (3) investigate the spatial and temporal effects on the structure of the catches, and (4) evaluate the ecological condition of the under-study area. Such information can be highly important for the implementation of the first four Descriptors of the European Marine Strategy Framework Directive (MSFD) (2008/56/EC) [15,17,68].
The synthesis of the catches is expected to have altered toward a higher presence of NIS in terms of biomass and number of individuals, especially in regard to the IAS. The species that were expected to show significant abundance were two of the most recent invaders, P. forsskali and P. miles.

2. Materials and Methods

2.1. Study Area

Three areas (Figure 2) within the eastern coastal waters of Rhodes Island were selected for the monthly experimental fishing trials conducted from April 2021 to March 2022.
The areas were selected based on information acquired through questionnaires addressed to local professional fishers who indicated the areas with the highest presence for each of the three targeted invasive alien species (IAS) (F. commersonii, L. sceleratus and P. miles). Monthly measurements of the water parameters of each area of this present study were taken using a CTD (model SBE-19 Seacat Profiler). Monthly data on the temperature were obtained within the depth zone of 10–30 m. The type of substrate for each area was determined with the use of the Humminbird 998c SI Combo monobeam sounder, along with visual inspection with scuba diving in selected locations within each area.
The coastal region of area 1 was almost entirely urbanized and densely populated, including extensive infrastructure, port facilities and a large number of hotel units. Only a small portion of the land use was characterized as agricultural. The land use pattern of the coastal region bordering area 2 presented a mosaic of uses, partially residential, barren/unculturable and culturable land, with a small section under non-agricultural/other use. The coastal area of area 3 was almost entirely reserved for agricultural use, while only a very small portion had residential use.

2.2. Fishing Gear and Species Identification

Two small-scale commercial fishing vessels registered in the Port Authorities of Rhodes Island were hired for the trials. The vessel employed for the trials within areas 1 and 2 had a total length of 13.3 m and engine power of 106.5 KW. The vessel employed for the trials within area 3 had a total length of 9.0 m and engine power of 7.35 KW. In each area, gill nets (GNSs) and trammel nets (GTRs), as illustrated in Frid et al. (2019) [69], were set monthly, producing a total of 72 hauls, 36 for each type of fishing gear. For both fishing vessels, the total length, height and mesh size of the nets were identical.
Except for the length, all other sizes and dimensions of the GNSs and GTRs used in the study were the most commonly used by the professional fishers of the small-scale coastal fisheries around Rhodes Island. Given that we wanted to depict the actual catches of the local fisheries and not investigate gear selectivity, the employed gear had to have the characteristics of the gear most commonly used.
The nylon static nets included 600 m of GNSs with 1.7 m height and 22 mm knot-to-knot mesh size and 600 m of GTRs with 1.7 m height and 24–32/130 mm knot-to-knot mesh sizes of the inner and outer nets, respectively. The knot-to-knot distance was measured according to the commission regulation 517/2018 (L151/5/11.6.2008). The nets had a three-strand retwisted twine (type 210/6, Momoi®). The weight of the sinkers was 0.32 kg/m and the weight of the floats was 0.11 kg/m. The rope for sinkers and floats had a 5 mm diameter, weighing 0.025 kg/m. The total weights per meter of the GNSs and GTRs were 0.95 kg/m and 1.05 kg/m, respectively.
During the trials, two members of the scientific team of this work (G.K. and D.M.), were onboard to ensure that the relevant protocol and schedule were followed correctly. The deployment of both types of fishing gear was conducted in the early night hours, just before sunset by hand, parallel with the coastline. The latter were retrieved during sunrise and the former two hours after deployment with a mean soaking time of (1.5 h ± 7 min)/sampling and (12.5 h ± 15 mn)/sampling, respectively. These are the approximate durations the nets were left to fish by the fishers of the coastal small-scale fisheries in Rhodes Island. The soaking time was calculated as the time between the deployment of the last piece of the nets and the retrieval of the first. Retrieval was conducted using hydraulic winches. Sampling at all three areas was performed within the depth zone of 8–35 m.
All collected organisms were transported to the facilities of the Hydrobiological Station of Rhodes (HSR) of the Hellenic Centre for Marine Research (HCMR). Identification to species level was performed based on the morphological characteristics as given in the relevant literature [70,71,72,73,74,75]. All individuals were measured for total weight (TW, g; 0.1 g accuracy). The abundance (N), biomass and frequency of occurrence (F) were estimated for each fish species.
Following the laboratory measurements, carcasses of L. sceleratus were transported to a private company based in Rhodes and cremated in a furnace, as provided by the “European Regulation (EC) No 1774/2002 of the European Parliament and of the Council of 3 October 2002 laying down health rules concerning animal by-products not intended for human consumption”.

2.3. Statistical Analyses

Data for the statistical analyses were evaluated for normal distribution by employing the Shapiro–Wilk test for normality and homogeneity of variance with Levene’s and Bartlett’s tests. The non-parametric Mann–Whitney U test was employed for comparisons of the total biomass caught between species origin (indigenous species (IS) and non-indigenous species (NIS)) and fishing gear (GNS and GTR). The non-parametric Kruskal–Wallis test and associated Dwass–Steel–Critchlow–Flinger post hoc test were used for comparisons of the total captured biomass among sampling areas and Mood’s median test was employed for comparisons of the total captured biomass between sampling seasons. Statistical analysis was performed with Jamovi Software (2.3.28) [76] at an alpha level of 0.05. Minitab 20 software (Minitab, State College, PA, USA) was used to assess the main effects of the captured biomass in terms of the sampling areas, seasons, species origin and capture gear. The main effects plot was employed as a graphical tool to assess the effects of different categorical factors (area, season, species origin, fishing gear) on the captured biomass (continuous response). Interaction plots were employed to display the spatial, temporal and provenance factor interactions with the captured biomass. The spatial (area), temporal (seasonal) and provenance (indigenous or IAS) factors and their interactions with the captured biomass were assessed using the general linear model (GLM) analysis of covariance [77], which is a two-way ANOVA using a least squares regression approach. The abundance/biomass comparison (ABC) method was used as a tool to evaluate the levels of anthropogenic disturbance (pollution-induced or otherwise) on the biological communities’ structure [78].
The similarity percentage procedure SIMPER part of PRIMER package V 7.0.23 [79] was used to investigate the contributions of individual species to the observed dissimilarities between the sampling areas. Assessment of the community structure was based on univariate analysis with the use of diversity indices. The diversity was calculated with the use of the Shannon–Wiener index [80]. The species richness (R) was calculated based on Margalef (1958) [81] and species evenness (E) based on Pielou (1977) [82]. The abundance biomass comparison (ABC) method (Warwick, 1986) was used as a technique for monitoring the disturbance (pollution-induced or otherwise) on the community structure by comparing the dominance in terms of the abundance with dominance in terms of the biomass. Linear discriminant analysis (LDA), which is a supervised classification technique, was employed as a dimensionality reduction technique to identify area separability [83].
Hierarchical clustering with the UPGMA group average linkage method algorithm was employed [84]. To normalize the data and avoid skewness, a square root transformation was applied to the data using the Bray–Curtis similarity index as a resemblance measure. Nonmetric multidimensional scaling based on the Bray–Curtis similarity index using the UPGMA group average linkage method algorithm [84] was employed as a means of visualizing the level of similarity between sampling areas and seasons.
To explore the patterns of occurrence of local fish fauna in each sampling effort, principal component analysis (PCA) was applied to reduce the dimensionality of the system and display the most dominant species based on the numerical abundance (N%), biomass (W%) and frequency of occurrence (F%). Numerical analyses and subsequent figures were carried out with the open-source programming environment R v.4.2.0 [85].

3. Results

3.1. Study Area

The minimum surface temperature value in the study areas was 17 °C in late winter and early spring, while the maximum temperature was about 28 °C in midsummer. However, at a depth of 20–30 m, the maximum temperature did not exceed 25 °C throughout the year. The overall mean temperature and salinity fluctuated around 21.12 ± 3.04 °C and 39.25 ± 0.16 ppt, respectively. The substrate within area 1 presented a rough topography and consisted mainly of a hard bottom as an extension of the adjacent rocky shore. The presence of coarse sediment was limited and found only within small coastal inlets. In water depths of 10–25 m, the area was occupied mainly by sand. In the southern parts of this area, at water depths of up to 20–25 m, sparse stands of Posidonia oceanica meadows appeared. At water depths greater than 25 m, clay sediment dominated. In the northern part of area 2, the bottom was mainly rocky with local concentrations of pebbly and sandy material. P. oceanica meadows were virtually absent, with only small patches. At depths down to 25 m, in the rest of area 2, sandy sediments dominated, whereas in the deeper parts, clay dominated. The composition of the bottom sediment of area 3 was mainly sand and silty sand in the shallow parts (water depths <20 m) and fine grained (mainly clay) in the deeper parts.

3.2. Population Structure

A total of 72 experimental trials were conducted with gill nets (GNSs) and trammel nets (GTRs), which accumulatively yielded 433.57 kg of fish, corresponding to 1879 individuals of 71 fish species. The number of non-indigenous species (NIS) was 14, corresponding to 962 individuals, weighing 295.88 kg (51.2% of the number of individuals and 68.24% of the total biomass), whereas indigenous species (IS) were represented by 57 species that consisted of 917 individuals and weighed 137.69 kg (48.8% of the total individuals, 31.76% of the total biomass). In each of the three areas, the total biomasses of the catches were 116.50 kg, 114.44 kg and 202.62 kg, respectively.
The overall NIS biomass was significantly higher compared with the IS (p < 0.01), with the GTR biomass significantly higher compared with that of the GNSs (p < 0.001). The biomass was significantly higher in area 3, followed by areas 1 and 2 (p < 0.001), and was the highest during winter, followed by summer, spring and autumn, with significantly higher biomass in winter compared with autumn (p < 0.05).
Figure 3 shows the most dominant species in terms of N and biomass (Figure 3A,B), species frequency of occurrence (Figure 3C), monthly proportional number of individuals (Figure 3D) and biomass (Figure 3E), and monthly proportional indigenous and non-indigenous species number (Figure 3F).
A higher monthly proportional N and biomass of NIS was exhibited at the beginning of winter and spring and during summer. The species number was in favor of IS throughout the year, with a higher number of NIS caught during spring (Figure 3D).
The main effects plot (Figure 4) was employed as a graphical tool to assess the effects of different categorical factors (area, season, species origin, fishing gear) on the captured biomass (continuous response).
The main effects plot (Figure 4) indicates that all factors had a significant effect on the biomass. As far as the effect of area is concerned, area 3 was the factor that exerted the greatest effect on the biomass. In terms of seasons, a negative effect was found in summer and a positive effect was found in winter. The origin of the species presented a higher effect from the IS and the type of fishing gear showed a large shift toward GTR.

3.3. Species Prevalence Structure

Even though single-approach statistics allow for an efficient representation of the fisheries’ structure of this highly invaded region, the PCA applied on the Boolean dataset of each species was based on the presence/absence of fishing trips. The selected species included the 16 most dominant species in terms of numerical abundance, biomass and frequency of occurrence. The resulting pattern was relatively clear and distinct (Figure 5). Specifically, the two major principal components (i.e., PC1 and PC2) collectively explained 69.1% of the multidimensional variability. Apparently, the majority of IS and NIS were concentrated in the centroid of the analysis, except the cases of L. sceleratus; Synodus saurus (Linnaeus, 1758); and Muraena helena Linnaeus, 1758. Regarding the location of the NIS centroid, L. sceleratus exhibited a divergence compared with the presence/absence pattern of the rest of its NIS counterparts. Along the same line, P. miles appeared to be in a relatively IS-dominant region since most of the NIS were gathered along the centroid with several IS.

3.4. Static Gear Type Structure

With the use of GNSs only, 44 species were collected, of which 10 were NIS and 34 were IS. The top ten species in terms of abundance were Spicara maena (Linnaeus, 1758); P. miles; Pagellus erythrinus (Linnaeus, 1758); Boops boops (Linnaeus, 1758); Sparisoma cretense (Linnaeus, 1758); Mullus surmuletus Linnaeus, 1758; Pagellus acarne (Risso, 1827); P. forsskali; L. sceleratus; and Bothus podas (Delaroche, 1809). In terms of biomass, the top ten species were P. miles; L. sceleratus; S. cretense; B. boops; M. surmuletus; S. maena; P. erythrinus; S. saurus; Trachinus araneus Cuvier, 1829; and F. commersonii.
Conversely, the GTRs resulted in the collection of 62 species, of which 14 were NIS. The top 10 species in terms of abundance were P. miles, F. commersonii, S. cretense, S. rivulatus, L. sceleratus, Sargocentron rubrum (Forsskål, 1775), S. luridus, S. maena, Diplodus vulgaris (Geoffroy Saint-Hilaire, 1817) and Dasyatis pastinaca (Linnaeus, 1758). In terms of biomass, the top ten species were L. sceleratus; P. miles; F. commersonii; S. cretense; D. pastinaca; S. rivulatus; Raja clavata Linnaeus, 1758; S. rubrum; M. helena; and S. luridus.
The collective abundance, biomass and number of species caught for each type of static gear are shown in Figure 6.
The collective abundance and biomass were both higher for the GTRs. The IS number of species and biomass were higher in the GTRs. The opposite was exhibited for non-indigenous species abundance for GNSs, whereas the biomasses of both NIS and IS were similar (Figure 6). The indigenous species number was higher for both types of gear (Figure 6).

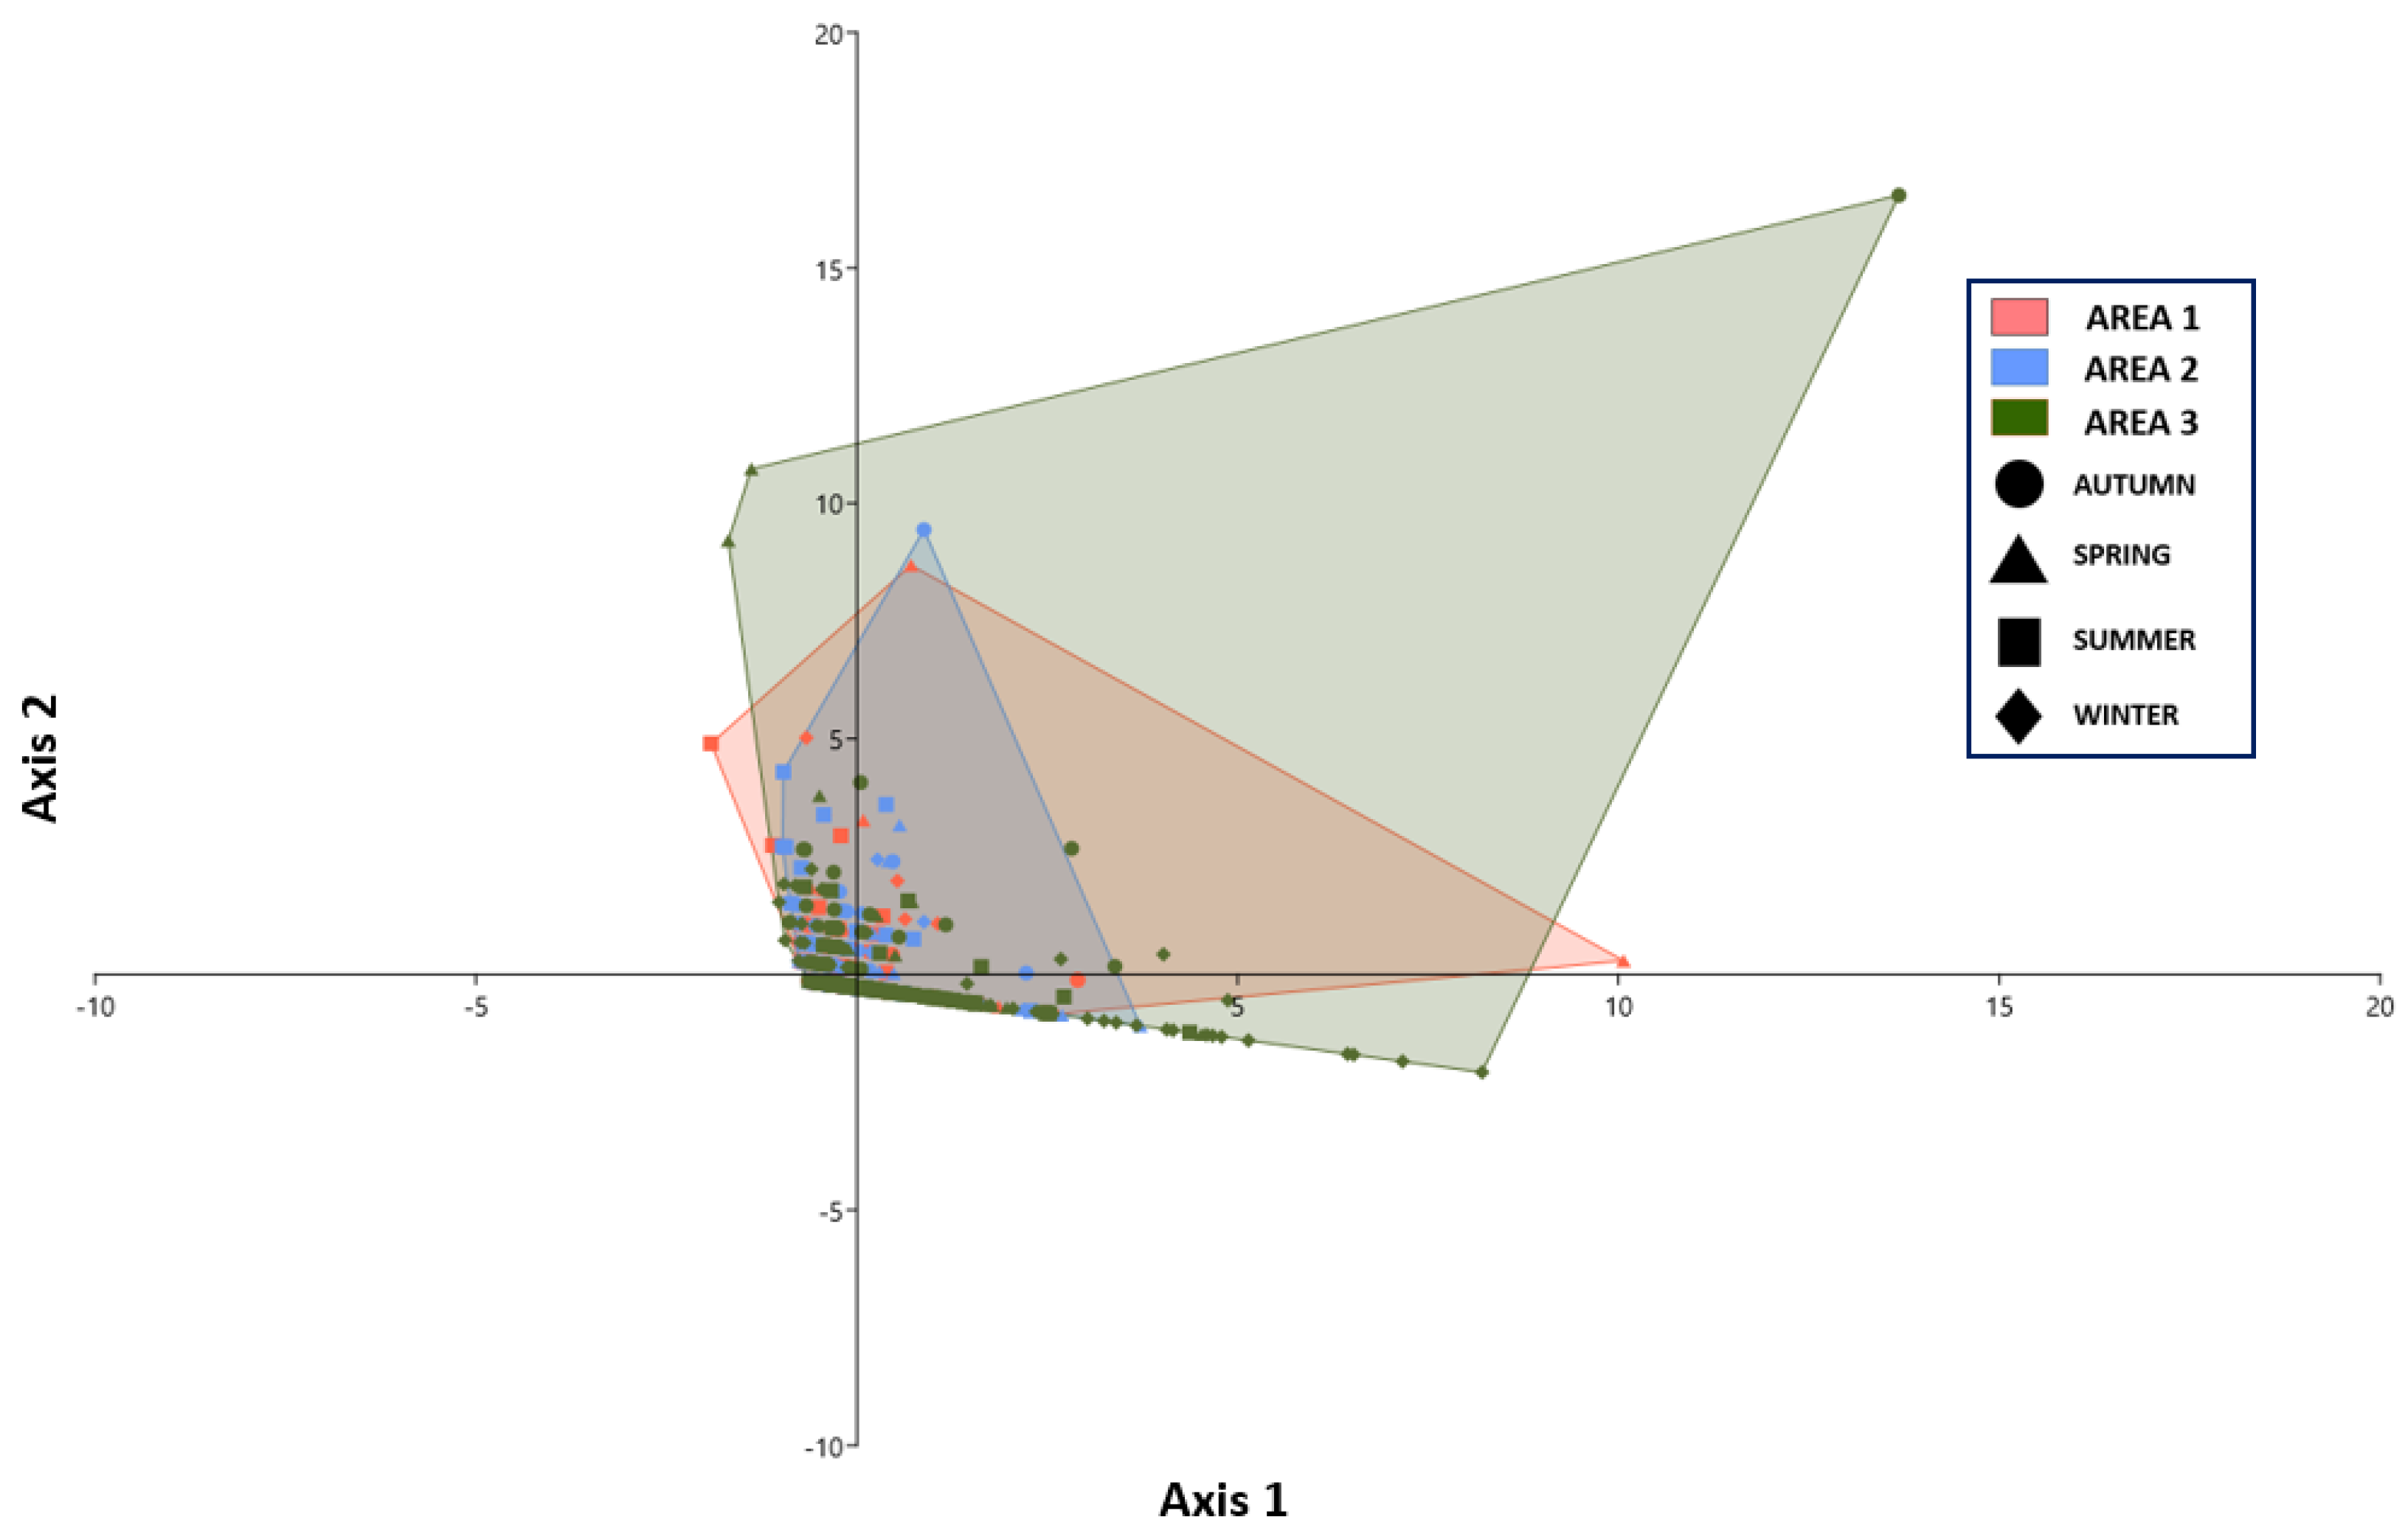
3.5. Spatial Effect Structure

Spatial similarity based on hierarchical clustering of the square-root-transformed biomass exhibited a higher level of similarity among areas 1 and 2 (72.1%) compared with area 3 (64.1%) (Figure 7).
Simper analysis based on the Bray–Curtis similarity indicated the top-ranked species for the observed sectoral dissimilarities based on the captured biomass (Table 1).
Linear discriminant analysis (Figure 8) was employed as a dimensionality reduction technique to identify the spatial separability. A high degree of overlap between areas was indicated, with a high degree of overlap. The primary contributing factor to the extent of the spatial overlap was the recorded biomass and secondary numerical abundance.

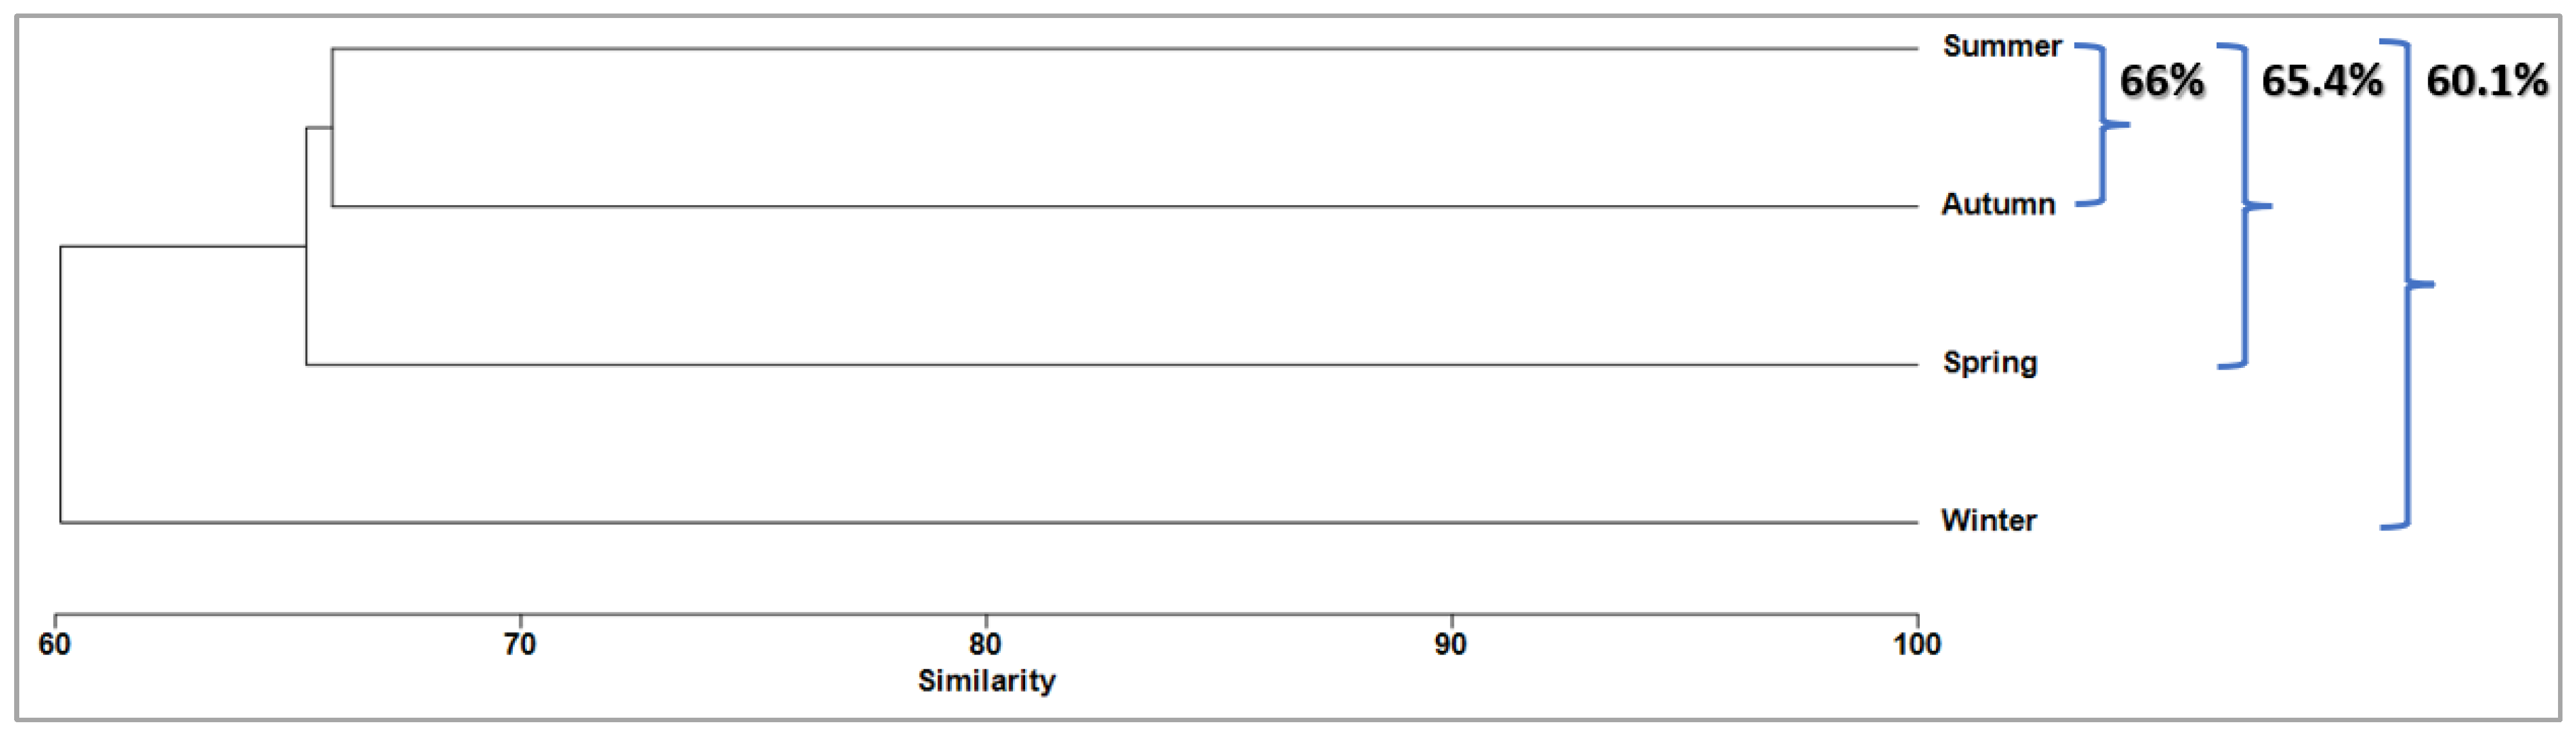
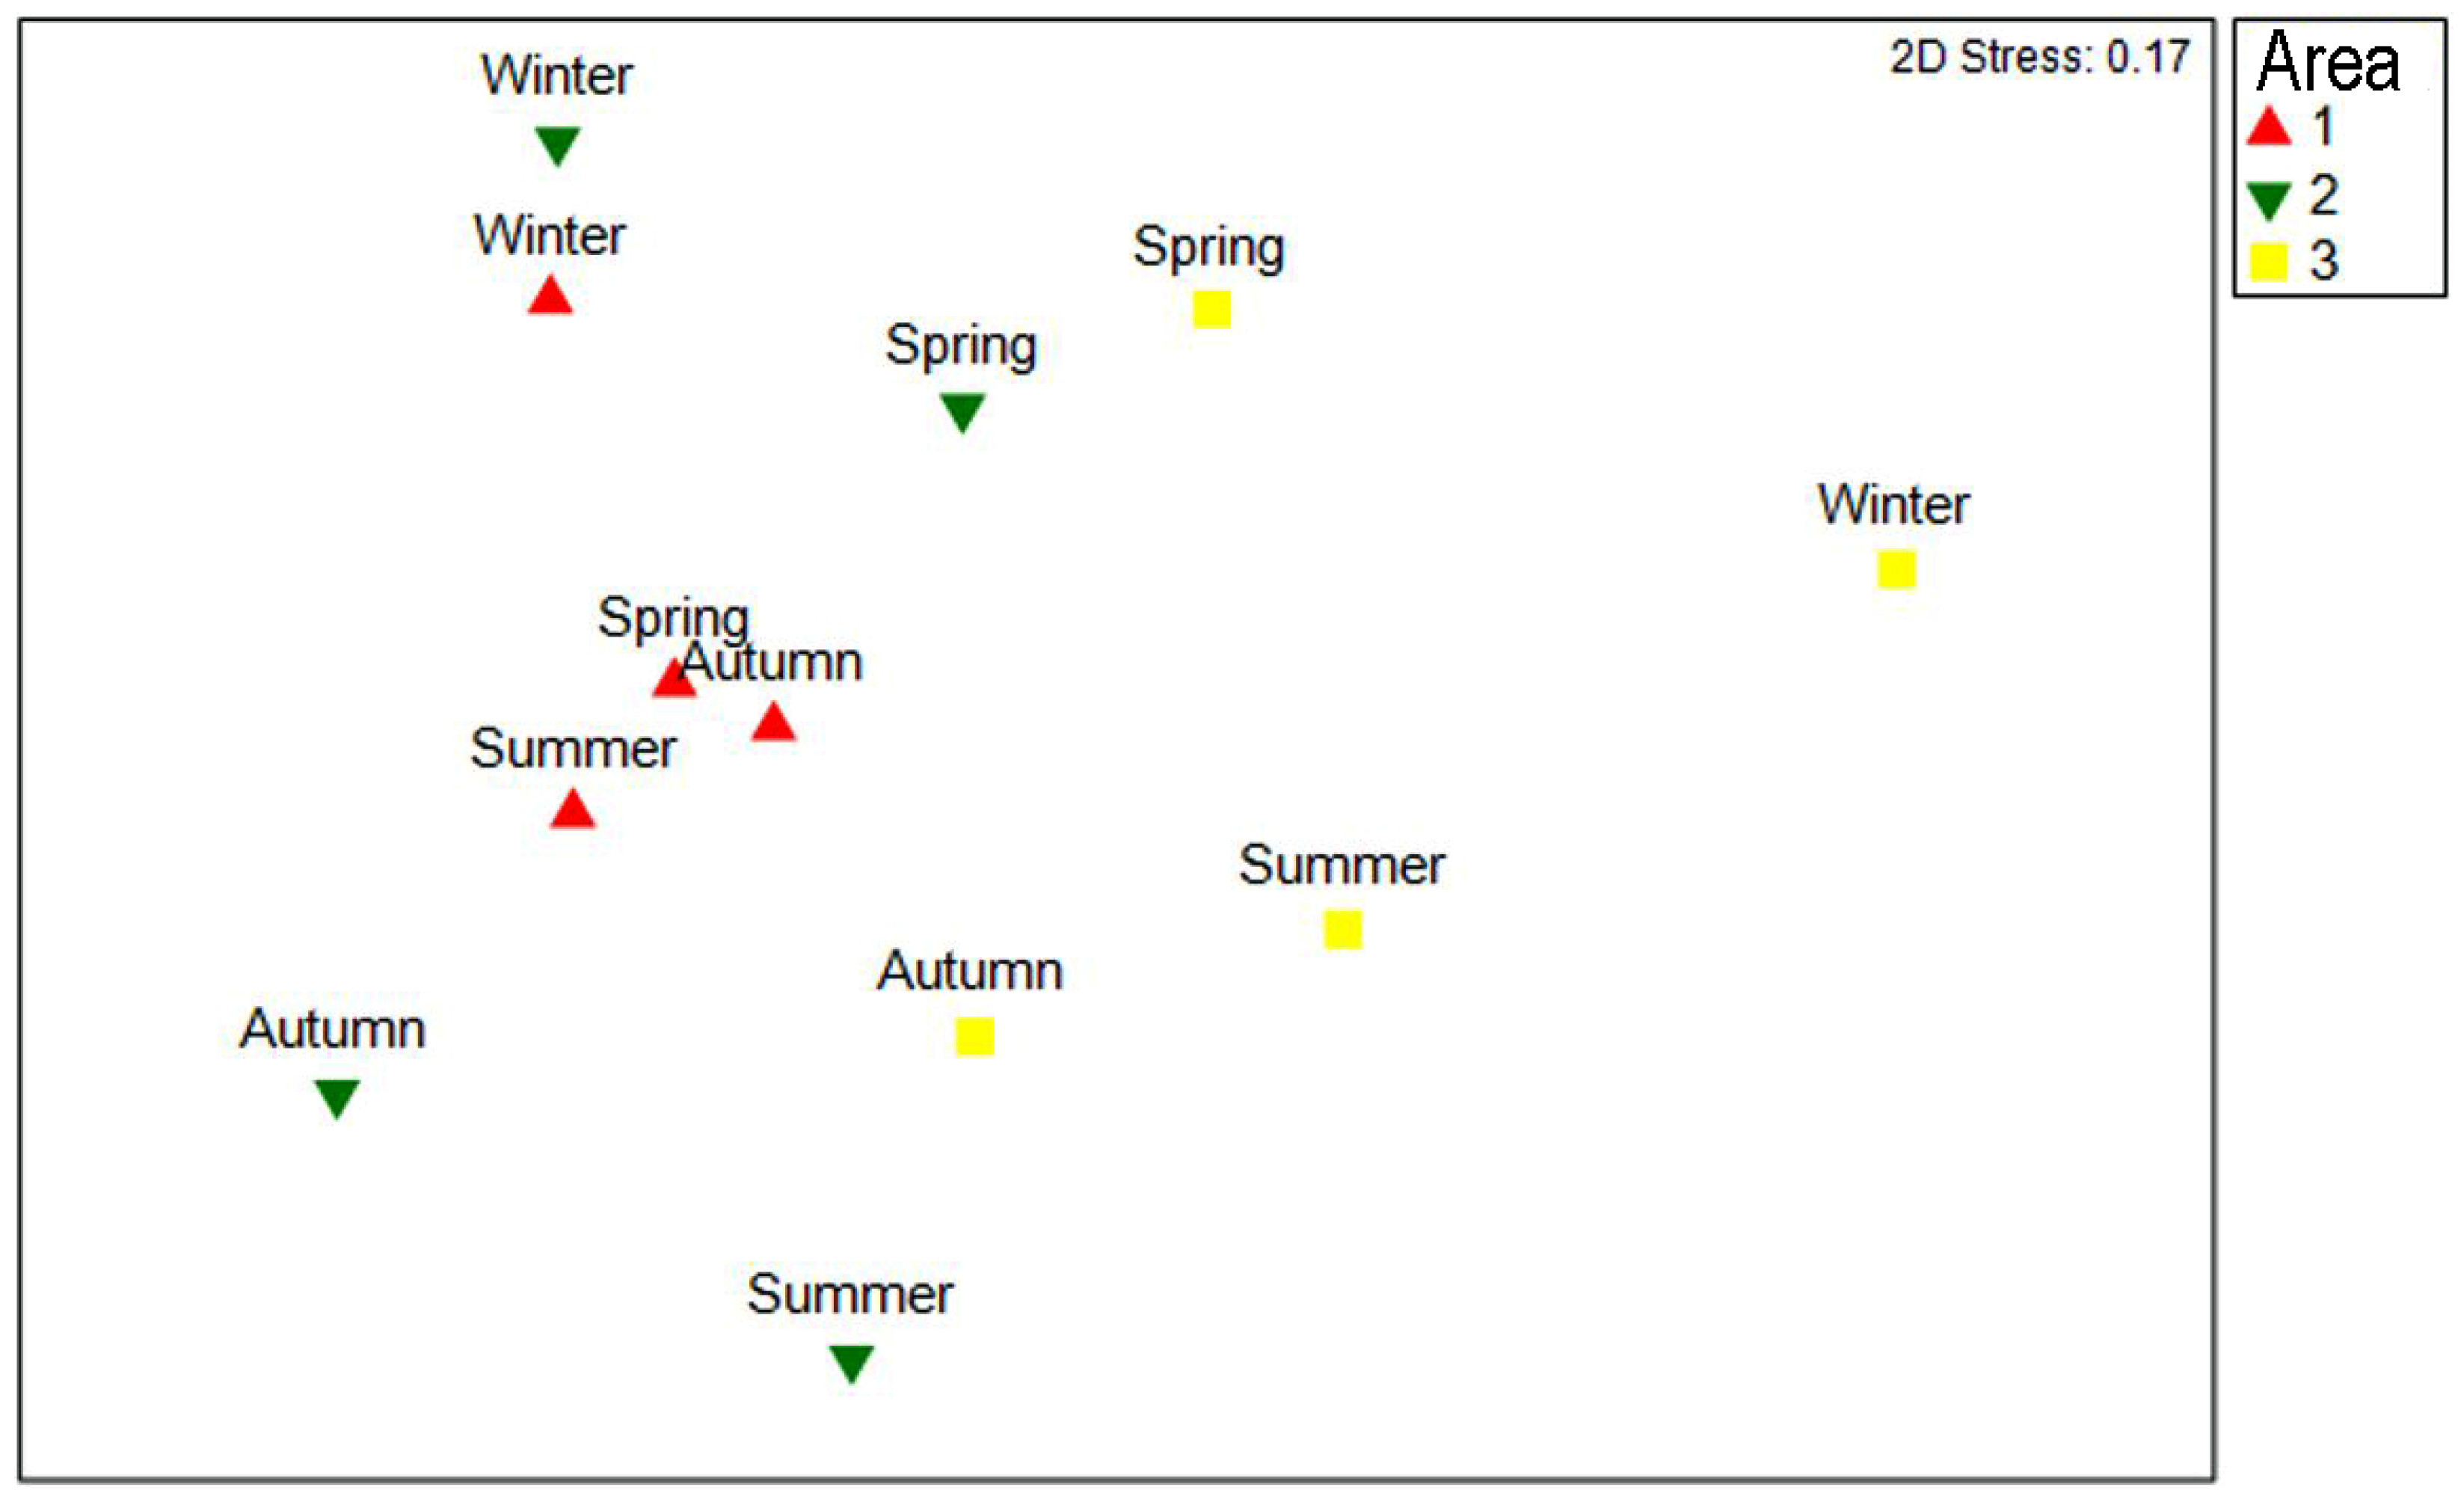
3.6. Temporal Structure

The highest temporal similarity was exhibited by summer and autumn (66% similarity), with summer, autumn and spring exhibiting a high similarity (65.4%) and all seasons exhibiting 60.1% similarity (Figure 9).
Simper analysis based on the Bray–Curtis similarity indicated the top-ranked species for the observed temporal similarities based on the captured biomass (Table 2).
The extent of the spatial and temporal similarity of the captured biomass is shown in Figure 10. The nonmetric multidimensional scaling (nMDS) plot indicates a higher level of similarity in the captured biomass between areas 1 and 2 and autumn, spring and summer.

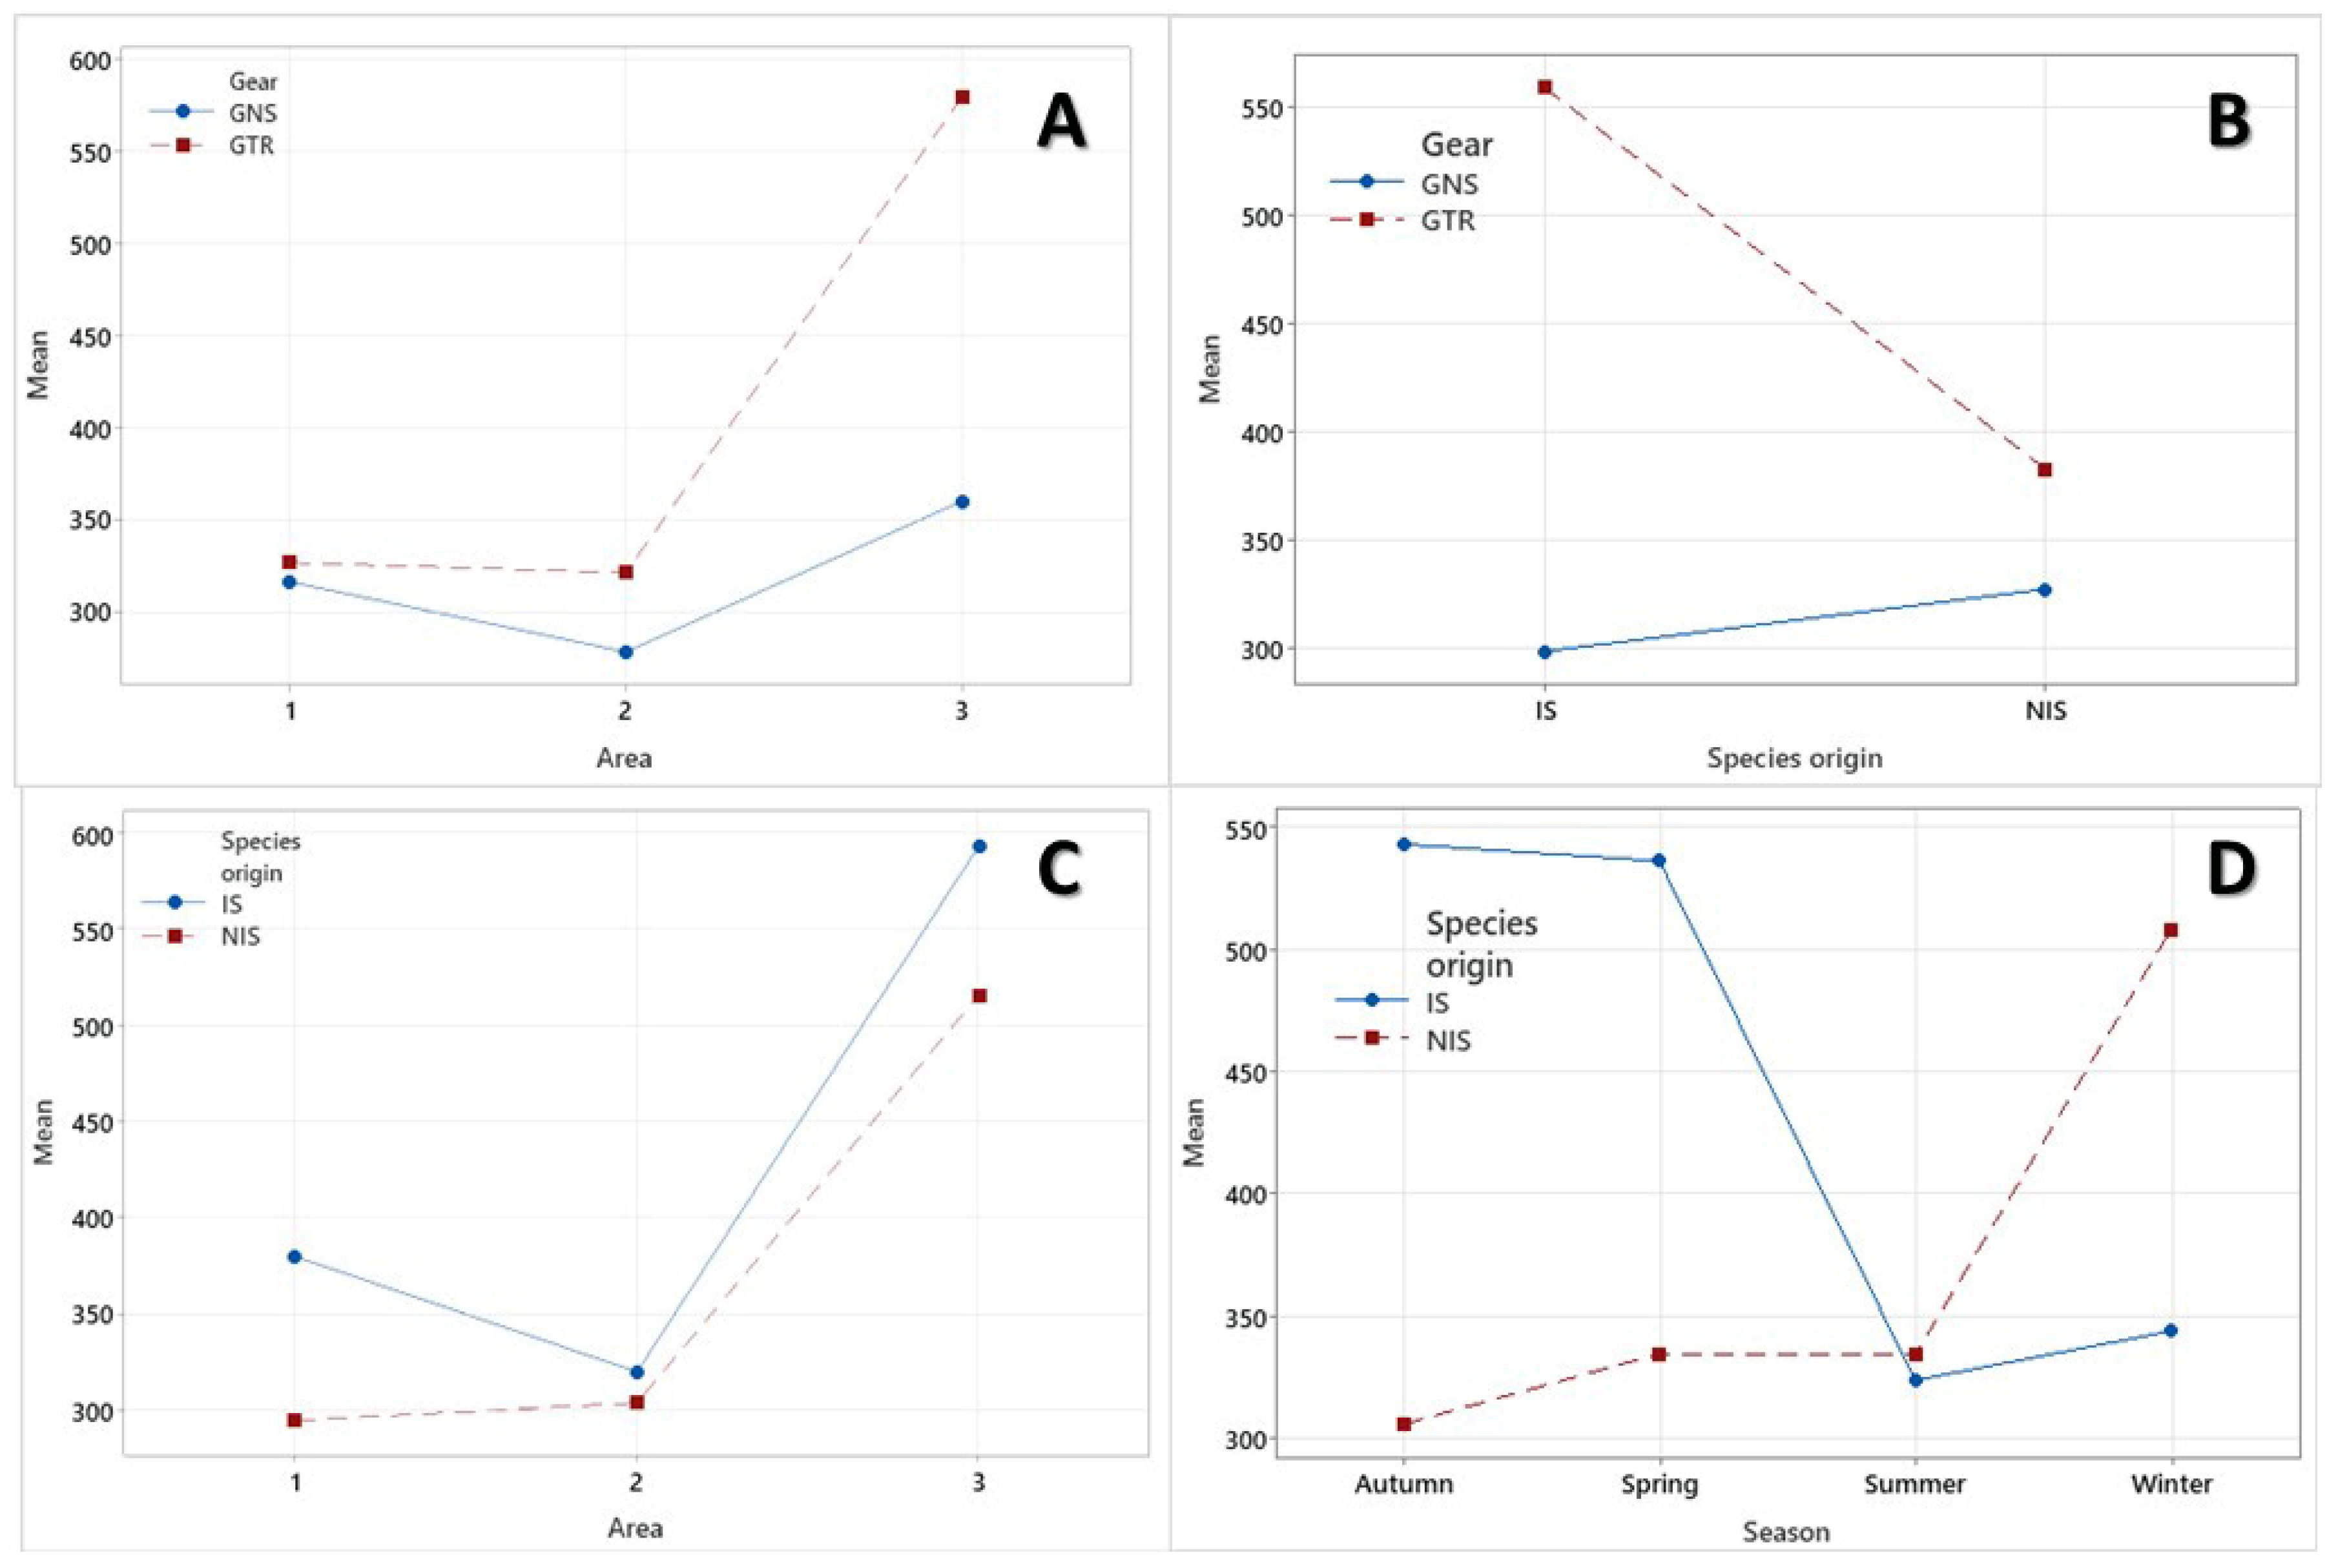
3.7. Factor Interaction

Interaction plots (Figure 11) were employed to display the spatial, temporal and provenance factor interactions with the captured biomass.
The interaction plots (Figure 11) indicate that for the GTRs, the greatest interaction on the captured total mean biomass was noticed in area 3, where the total mean biomass increased from 0.33 kg and 0.32 kg in areas 1 and 2, respectively, to 0.58 kg in area 3. The species origin interaction was more pronounced for the GTRs, where the mean total biomass increased from 0.38 kg for NIS to 0.56 kg for IS. The area interaction was clearly greater for both the NIS and IS in area 3. The higher interaction with captured biomass recorded in autumn and spring was reversed in summer and winter.
The statistical relationship between the predictors (gear–area, gear–provenance, provenance–area, provenance–season) and a continuous response variable (captured biomass) are given in Table 3. In the gear–area interaction (Table 3A), both the gear and area exerted a significant effect on captured biomass; however, their interaction did not. In the gear–provenance interaction (Table 3B), both the interaction and gear exerted a significant effect on captured biomass, with no significant effect exerted by provenance. In the provenance–area interaction (Table 3C), only the area exhibited a highly significant effect on the captured biomass. In the provenance–season interaction (Table 3D), only their interaction exhibited a highly significant effect on the captured biomass.

3.8. Ecological Condition

The species richness exhibited a higher value in area 2 (Table 4), followed by areas 3 and 1. Evenness, diversity and Simpson indices exhibited higher values in area 1, followed by areas 3 and 2. No significant spatial or temporal differences between any of the ecological indices were observed.
The abundance/biomass comparison (ABC) method (Figure 12) indicated an overall good ecological condition of all sampling areas since in an undisturbed state, the biomass dominance curve lay above the abundance curve. Higher disturbance (anthropogenic perturbation) was exhibited in area 2 compared with areas 1 and 3.

4. Discussion

The Rhodian marine waters area is characterized by oligotrophy, a subtropical environment and a heavy influence from the warm Levantine water masses, which are suitable attributes for colonization by tropical or subtropical species [21,22]. Some of these have been characterized as invasive [86], causing, among others, a series of problems in the small-scale fisheries of the invaded areas [2,5,9,37].
Static nets, along with longlines, constitute the most commonly used gear from professional small-scale fishers and the main source of income for many families within the Mediterranean Sea, including the Hellenic waters [47,87,88].
The results presented here indicate that half of the top 10 species in terms of abundance were non-indigenous (NIS), of which four (namely, F. commersonii, L. sceleratus, P. miles and S. rivulatus) were invasive alien species (IAS) [9]. Pterois miles constituted the highest numbers (361 individuals), followed by the indigenous species (IS) S. cretense (235 individuals) and the NIS F. commersonii (207 individuals). In terms of biomass, IS and NIS were equally represented in the first 10 species; however, L. sceleratus was on the top of the list, as the collected individuals were larger, and thus, heavier compared with other species caught in static nets, attaining a total biomass of 107.11 kg, followed by P. miles, with a biomass of 93.84 kg, and F. commersonii, with 64.75 kg. Dasyatis pastinaca and M. helena also consisted of large individuals and attained the fifth and eighth positions, with 23 and 8 individuals weighing 13.29 and 6.54 kg, respectively.
The prevalence of L. sceleratus in the catches with GTRs (11.27% of the total biomass), GNSs (1.26%) and longlines (0.47%) was documented in 90 fishing trips between June 2020 and August 2021 in Crete [89]. In this present study, the percentages were even higher, as the biomass of L. sceleratus collected with GTRs accounted for 21.29% of the GNS and GTR total biomass or 31.07% of the GTR biomass and the biomass of L. sceleratus collected with GNSs accounted for 3.42% of the GNS and GTR total biomass or 16.68% of the GNS biomass. In addition, the ordination patterns revealed by the PCA showed that even though L. sceleratus was among the dominant IAS in terms of all the examined indicators, the analyzed occurrence patterns per fishing trip highlight that the species was clearly characterized by a unique trend compared with its IS counterparts.
In similar studies with GNSs in the southeastern coastal waters of Rhodes Island, a total number of 49 species was reported, with the top ten species in abundance and biomass consisting of six IS and four NIS, which is a result very close to this present study (i.e., seven IS and three NIS) [36,65]. Sparisoma cretense attained the highest abundance, followed by S. rivulatus, S. luridus, M. surmuletus and S. rubrum. In terms of biomass, S. cretense was also in the highest position, followed by S. rivulatus; M. surmuletus; S. luridus; and Scorpaena scrofa Linnaeus, 1758. Most frequently present was S. luridus, followed by S. cretense and S. rivulatus, together with S. scrofa, S. rubrum and M. surmuletus. In this present study, the most abundant species was S. maena, followed by P. miles, whereas S. cretense was found in the fifth position. In terms of biomass, the first place was attained by P. miles, followed by another IAS, L. sceleratus, whereas S. cretence dropped into the third position. However, S. cretense attained the first place in terms of the frequency of occurrence, with P. miles in second, along with P. acarne and P. erythrinus. It should be noted that the sampling period of these studies coincided with the early period of the establishment of P. miles, namely, circa 2015 [90], when the species was scarce in the area. The establishment and buildup of large populations of P. miles within the period 2015–2022 in the Rhodian marine waters has undeniably led to the alteration of the composition of the catches and, by extension, the synthesis of the biocommunities. Pterois miles successfully gained the first, second and third places in terms of biomass, abundance and frequency of occurrence, respectively, due to its successful competition for niches and its generalist feeding strategy [91].
The two siganids were found to dominate among the NIS in terms of biomass in two studies with GNSs [36,65], where the same fishing vessel was employed in area 2 as in this present study. However, in the latter, their biomass (1.85% of NIS total biomass with GNSs) was surpassed by most of the NIS, except for Pempheris rhomboidea Kossmann and Räuber, 1877 and Torquigener flavimaculosus. This finding could be attributed to the smaller mesh size used herein, which reduced the capacity of the GNSs to catch the two congenerics. Analyzing the fishers’ perceptions [92] indicated that GTRs are more efficient at capturing the two Siganus species when compared with GNSs and these data agree with the findings of this present study.
Parupeneus forsskali and Upeneus moluccensis (Bleeker, 1855), which were the two NIS mullids caught in this present study, yielded a biomass of 4.61 kg (99.46% was the biomass contribution percentage of the former and 1.06% their biomass percentage over the total biomass), whereas the two IS (Mullus barbatus Linnaeus, 1758 and M. surmuletus) yielded 5.52 kg, which accounted for 1.27% of the total catch. In comparison with the study by Corsini-Foka et al. (2017) [36], the two IS Mullus species yielded a total biomass of 6.69 kg, corresponding to 6.48% of the total biomass, which is a percentage five times higher than that of this present study. None of the NIS mullids were collected by these authors. Since the first record of P. forsskali in the southern Aegean Sea in 2017 [93], the species has flourished in the area and established large populations [94]. A recent study on the biology of the species is given in [95]. Vagenas et al. (Vagenas; unpubl. data) discussed the fact that P. forsskali might negatively affect native populations of Mullus species through competition for resources, and the similarity in terms of the biomass contribution of NIS and IS mullids to the catches of this present study is an indication supporting their hypothesis. The impact of NIS on indigenous Mullus species was assessed by Arndt et al. (2018) [7]; however, these authors used data from trawl fisheries.
The presence of only one Sarpa salpa (Linnaeus, 1758) individual during this present study raises concerns regarding the reduction of the species’ yields and its possible replacement by the two siganids in the coastal waters of Rhodes. There is an indication that S. salpa could be under pressure, most probably by the two siganids [36,96], as in the case of Fournoi Island according to Pennington et al. (2013) [97], and they have been extirpated to other areas and/or depths. Sarpa salpa and the two siganids compete over the same food sources, whilst the negative impact of the latter on phytobenthos was documented [28].
Several studies with the use of static nets were conducted in the Aegean and Levantine Seas and their results revealed the ongoing changes in the synthesis of the catches. Long before the introduction of the NIS F. commersonii, L. sceleratus and P. miles in the Aegean Sea, Stergiou et al. (2002) [98] reported the prevalence of Spicara maena, followed by P. erythrinus and M. surmuletus, in a study with GNSs in the coastal waters of Naxos, Cyclades, south Aegean Sea, and the absence of NIS. Approximately 15 years later, Peristeraki et al. (2016) [99] reported cases in Cretean waters, where NIS composed a large proportion of the catches with static nets, as shown in this present study. A few years later, based on a survey of Gyaros Island, Damalas et al. (2022) [100] identified 75 species/taxa, of which only three were NIS, and reported that the species with the highest biomass was S. cretense, as was also the case in this present study.
Within 2015–2017, a study that included visual surveys in the coastal waters of Cyprus estimated that NIS constituted 18% of the fish biomass, but it is not clear whether this percentage includes data taken from bottom trawling. According to data from the Cyprus Department of Fisheries and Marine Research assessed by Kleitou et al. (2022) [8], from 2017 to 2019, the NIS F. commersonii, Lagocephalus spp., P. forsskali, P. miles, Sargocentrum rubrum (Forsskål, 1775), S. luridus and S. rivulatus contributed 29% of the total landings weight in Cyprus. The respective percentage in this present study was 2.33 times higher (67.53% of the total catch). This difference could be attributed to the fact that in Cyprus, the data included other types of fishing gear, such as longlines, that are not efficient in catching the above-mentioned species.
The number of species collected with demersal GNSs in a study from the Egyptian Mediterranean coast of Alexandria was 2.12 times higher than that of this present study (89 vs. 42) [101]. The NIS number was 14 (15.73% of the total A), corresponding to 463 individuals (11.99% of the total N), weighing 298.35 kg (8.1% of the total biomass). Compared with the percentages of this present study (22.73%, 24.88% and 47.48%, respectively), there was a big difference, especially with respect to biomass. However, these authors studied GNSs with a range of mesh sizes and the listed GNSs closer to the 22 mm of this study included a sample of 130 individuals weighing 5.64 kg, which defined herein as a total catch, was a lot lower than the 615 individuals weighing 88.79 kg of this study. Data from Lebanon on the catch composition between 2005 and 2006 revealed that NIS composed 37% of total landings by weight [14], which is rather high but lower than the percentage of this present study. The results of a study from Antalya Bay, Turkey, are not directly comparable with those of this present study, as the GTRs used were of larger mesh size and with a longer length and the fishing depth was greater [55]. However, what is interesting in that study is that the only marketable NIS caught was U. moluccensis and the only discarded NIS was Equulites klunzingeri (Steindachner, 1898), although more NIS fish existed in the area, namely, F. commersonii, P. miles and S. rubrum [102,103,104]. Another study from the Mediterranean coasts of Turkey with GNSs and GTRs revealed that NIS represented 29% to 38% of the total catch, respectively [105], which is lower than the 68.24% of this study. In the northwestern Adriatic Sea, there is a completely different situation in terms of the synthesis of catches [106], at least with the use of GTRs, where among the 23 fish species collected, none were NIS.
In terms of economic importance, five of the NIS (35.71% of all NIS)—namely, Golani’s round herring Etrumeus golanii DiBattista, Randall and Bowen, 2012; P. forsskali, S. luridus; S. rivulatus; and U. moluccensis—caught in this present study were sold in the fish market of Rhodes with prices fluctuating within the range of EUR 5.00 to 15.00 per kg [36]. Fistularia commersonii and P. miles (14.29% of all NIS) are sold in a limited number of fish markets, and by few local fishers at the price of EUR 10.00 per kg, as these species are still not favored by prospective buyers. Lagocephalus sceleratus was the NIS with the highest percentage (24.71%) of total biomass caught with both types of fishing gear in this present study. This finding surpasses by far the percentage reported in a study from Cyprus in 2017–2019 [8], where the Lagocephalus spp. constituted 13% of the total landings. However, in the same study, the percentages of S. rubrum and the two siganids were higher than those in this present study: 8.7% and 6% versus 1.47% and 3.66%, respectively.
Without commercial value, and thus, treated as discards were 13 IS, which made up 22.81% of all IS. The remaining 44 species (77.19% of all NIS) could be found at the local fish markets with prices fluctuating within the range of EUR 5.00 to 25.00 per kg. Overall, 51 species were commercially important (71.83% of the abundance) and 20 were discarded (28.17% of the abundance). Lagocephalus sceleratus and F. commersonii have been reported as common by-catches in Lebanon since the mid-2000s [14].
Although some of the IS and NIS may contribute to enhancing the local economy, a thorough economic study should be undertaken in order to reveal the actual losses and benefits from the presence of IS and NIS in the artisanal catches of Rhodes. Nevertheless, up to date, biological invasions have not been found to be economically positive for the European and global economies, but rather they exhibit a high economic cost [107,108]. In fact, this cost can be multifold times higher than the already calculated cost; as more data are adding up, the number of NIS and IAS rises and new assessment tools are being incorporated into the assessments [107,108,109].
In the GNSs, only two of the top 10 species with the highest F% were NIS, whereas in GTRs, the respective number of NIS was seven. Among the species within the 10 highest F% from both types of static gear, seven were NIS and five were IS. The highest F% was exhibited by P. miles, reaching 100% in the GTRs, and thus, it was the species caught in every GTR haul. Our findings with the use of GNSs only agree with those of Corsini-Foka et al. (2017) [36] in that the IS S. cretense was the species with the highest F%, although there were differences in the length, height and mesh eye of their GNSs compared with that of this present study. Surprisingly, P. forsskali was the NIS with the highest F% in the GNSs, and along with the IS B. boops, they constituted the two species that exhibited the second-highest F%.
Spatial, temporal, provenance and mode of capture factors significantly affected the captured biomass. The greatest biomass was observed in area 3 with 25.91 kg from the GNSs and 176.71 kg from the GTRs, cumulatively accounting for 46.73% of the total biomass. This could be attributed to the lower fishing pressure exerted in that area, as was documented in relevant questionnaire-based research conducted prior to the fishing trials of this present study (Kondylatos, unpubl. data) and reported in Sini et al. (2019) [110]. Indeed, fishers from other areas of the island do not prefer fishing in area 3, as it is far from their docking ports and the weather is rather unsteady in these southern parts of Rhodes (Kondylatos, unpubl. data). In contrast, areas 1 and 2 receive higher fishing pressure [110] due to the higher number of fishing vessels operating all year round within their boundaries, their proximity to safe harbors and the more stable weather conditions compared with that in southern Rhodes (data from the Fisheries Department of Dodecanese Islands).
For the three most abundant NIS, namely, F. commersonii, L. sceleratus and P. miles, their combined biomasses in each of the three areas were 55.47 kg, 62.56 kg and 63.91 kg, respectively, corresponding to 47.61%, 54.67% and 31.54% of the total biomasses collected in each area, respectively. In a similar study during the summer of 2009 with GTRs [63], among the 18 fish species caught, S. luridus, L. sceleratus and F. commersonii accounted for 85% of the total fish biomass, with this being a notably high percentage.
Based on the abundance, the average dissimilarity between areas 1 and 2 was 59.19%, between areas 1 and 3 was 63.68%, and between areas 2 and 3 was 62.43%. The dissimilarities were most probably caused by the differences in the synthesis of the sea floor in the sampling areas. The main four contributing species to all three dissimilarities were F. commersonii, L. sceleratus, P. miles and S. cretense, which coincided with the most dominant species in terms of biomass. This can be attributed to the selection of the sampling areas based on the higher presence of these three IAS.
Hierarchical clustering based on biomass further confirmed a higher level of similarity between areas 1 and 2 (72.1%) compared with area 3 (64.1%), as was also indicated by nonmetric multidimensional scaling, which displayed a higher level of similarity between areas 1 and 2 and between autumn, spring and summer. Interaction plots display the provenance factor interaction with the captured biomass. For the GTRs, the greatest interaction of the captured total mean biomass was exhibited in area 3, where the total mean biomass increased from 326.5 g and 321.1 g in areas 1 and 2, respectively, to 579.4 g in area 3. The area interaction was clearly greater for both the NIS and IS in area 3.
In terms of seasons, a negative effect on the captured biomass observed in summer is believed to be the result of the intensification of fishing efforts during the summer months because of the tourist season, and hence a higher demand for fresh catches, e.g., [111], combined with good weather conditions. Furthermore, recreational fisheries are also suspected to have contributed to this negative effect. This was also demonstrated in Israel, where recreational fisheries make up between 10 and 37% of the total annual fishing yields [112], and other Mediterranean regions, reaching as high as 50% of the total catch regarding commercial species [113]. An alternative activity of small-scale fishing is fishing tourism, which has gained the involvement of a large number of fishers throughout the Mediterranean [114,115]. In Hellas, the total number of fishers licensed for this activity was 197 in 2021 (during the period of the study), of which 20 (10.5% of the total number) were registered on the island of Rhodes [114]. However, according to data from the Fisheries Department of Dodecanese Islands, until 31 December 2021, the number of commercial fishing vessels involved in these fisheries had increased to 23. The positive effect shown by winter could be correlated to the (a) paucity of the higher demand on fisheries for tourism, (b) reduction in the frequency of the activities of coastal fisheries due to bad weather conditions, (c) paucity of fishing tourism and (d) paucity of recreational fisheries. Hierarchical clustering indicated the highest temporal similarity between summer and autumn (66% similarity), which was very close to the similarity exhibited by summer, autumn and spring (65.4%), whereas winter was the least similar (60.1%) to all other seasons. Sparisoma cretense, which was the species with the highest yield among the IS, was abundant during all seasons except for summer. Pterois miles, which was the NIS with the second highest biomass, was not among the highest contributors in autumn, whereas F. commersonii, which was the third in yield ranking, was present only during spring and winter.
The higher interaction on captured biomass was recorded in autumn and spring and was reversed in summer and winter. A higher interaction effect was indicated for IS. Throughout the study, 71 species were collected in total, of which 57 (80.28% of the total species) were IS and 14 (19.71% of the total species) were NIS. Accumulatively, IS comprised 31.76% of the total biomass and NIS comprised 68.24%. The number of IS was higher throughout the year, with a higher number of NIS occurring during spring. With the use of GNSs, 44 species were collected, of which 34 (77.27%) were IS, weighing 46.64 kg (52.53% of the total GNS biomass) and 10 NIS (22.73%) weighing 42.16 kg (47.47% of the total GNS biomass). In a previous study [26], Lessepsian fish represented 43% of the number and 38% of the weight of the total catch. Several years later, based on the results of samplings in coastal Rhodian waters [36], a total of 49 fish species was reported, five species more than this present study, of which 43 (87.75%) were IS and six (12.25% of total) NIS. The latter were F. commersonii, L. sceleratus, S. flavicauda, S. luridus, S. rivulatus and S. rubrum. Except for S. flavicauda, the other five species were collected with the use of GNSs in this present study.
On the other hand, using GTRs, 62 species were collected, of which 48 (77.42%) were IS, weighing 91.05 kg (26.41% of the total GTR biomass), and 14 (22.58%) were NIS, weighing 253.72 kg (73.59% of the total GTR biomass). Several years before the first records of F. commersonii (2000) [116] and L. sceleratus (2003) [117] and the second record of P. miles (the first record in 1991 from Israel [118], second record 2012 [103]), their biomass corresponded to 40.6% of the total catch biomass in experimental trials [119], which is a percentage lower than that of this present study. A relatively recent study on static nets from Israel reported that among the 69 collected species, the number of IAS alone was 16, constituting 24% of all species, which is a percentage that corresponded with 20% of the total biomass [69], with their abundance skyrocketing to 84% over shallow soft-bottoms.
In trials with GTRs in eastern Libya, a total of 42 species was collected [120,121], of which 16 were NIS (38%) (six commercial species); in middle Libya, NIS accounted for 45% (three commercial species); whereas in the western region, NIS accounted for 29% (two commercial species). All these percentages are higher compared with that of this present study (22.58%).
The abundance and biomass of the indigenous fish species captured in this present study are comparable with findings from previous studies [36,122,123,124,125], indicating no displacement or disappearance of any species from the sampling area.
The type of fishing gear showed a large shift toward GTRs, which, in numbers, corresponded to the large difference in the total biomass caught with each type of fishing gear. GNSs produced 88.79 kg and GTRs 344.77 kg, which comprised 20.48% and 79.52% of total biomass, respectively. Surprisingly, the top three NIS in terms of biomass (F. commersonii, L. sceleratus and P. miles) weighed 265.71 kg, which was 61.28% of the total biomass. L. sceleratus alone accounted for 24.7% of total biomass with 107.12 kg.
The combined effects of the season (mostly water temperature) and depth are known to exert a combined effect on species composition caught with GTRs when the depth range is large enough (10–100 m) [98]. Due to the limited depth range (8–35 m) of this present study, no correlations were investigated. Notably, the thermocline in the study area did not reach below the 35–40 m depth and was disrupted in mid-November, as reported previously by [26,126].
Ecological condition indices indicated a good ecological status in all areas, with no major differences observed despite the higher fishing pressure that occurred in areas 1 and 2 compared with area 3.
The catch composition of the GNSs and GTRs followed the different applications of the fishing gears, e.g., [52,53,64,127]. Future studies in the Rhodian marine waters should involve the investigation of more applications, which will include different mesh sizes and longlines in order to have a better comprehension of the small-scale fisheries in the area and clarify the reason why local fishers tend to use the mesh sizes applied in this study.
Fisheries data with static nets in the southeastern Aegean are scarce. The present work substantially contributes to the enrichment of scientific knowledge on the small-scale fisheries in the eastern Mediterranean. This thorough investigation in a marine area invaded by five of the most IAS in the Mediterranean, namely, F. commersonii, L. sceleratus, P. miles, S. luridus and S. rivulatus [26,126], can set the basis for a continuous monitoring of the area and the adaptation of management practices for assisting the declining small-scale fisheries. As the only truly discarded IAS was L. sceleratus, further work toward the promotion of the other four species in the fish markets is necessary because they can reach a market price of EUR 10.00, and thus, reinforce the income of the local fishers.

5. Conclusions

Qualitative and quantitative monitoring of gillnet and trammel net catch compositions took place in three areas of the eastern coastal waters of Rhodes Island, Levantine Sea, which is a Hellenic region that has been highly invaded by NIS. Pterois miles was the only IAS found within the top three species in terms of abundance, biomass and frequency of occurrence, indicating a strong presence in the structure of the Rhodian coastal small-scale fisheries. In comparison with fisheries data attained before the flourishing of the species in the under-study area, the clear reformation of the fisheries structure can be attributed to this prevailing fish species. The biomass was significantly greater for NIS, 2.15 times greater than for IS, with L. sceleratus alone accounting for a quarter of the total biomass. The abundance was roughly divided between NIS and IS. The area with the lowest fishing pressure (area 3) exhibited a significantly greater biomass, especially during winter. The results indicate a transitional shift in fish catch composition, with NIS competing with IS for food and space, which was facilitated synergistically by environmental and anthropogenic factors. Nevertheless, an overall good ecological condition was found for all three areas.
Pterois miles has to be treated as a new and promising fisheries resource, but a lot of work needs to take place before the acceptance by consumers and the broad commercialization of this species. Rhodian coastal small-scale fisheries are apparently undergoing a period of great restructuring as a result of biodiversity reformations, which are still not sufficiently understood or studied. In accordance with the “Voluntary Guidelines for Securing Sustainable Small-Scale Fisheries in the Context of Food Security and Poverty Eradication” authors suggest the repetition of the trials described in this work in the short term. We suggest that the management of IAS should be considered in terms of an ecological point of view rather than eradicating strategies that were traditionally implemented but have not been sustainable.

Author Contributions

Conceptualization: G.K.; methodology: G.K.; software: G.K.; validation: G.K.; formal analysis: G.K., G.V., D.K. and A.C.; investigation: G.K. and D.M.; resources: G.K. and K.K.; data curation: G.K. and K.K.; writing—original draft preparation: G.K., D.K. and M.C.-F.; writing—review and editing: G.K., G.V., P.K.K., D.K., M.C.-F., K.K., A.C. and D.M.; visualization: G.K., D.K. and K.K.; supervision, D.K.; project administration: G.K.; funding acquisition: G.K. All authors have read and agreed to the published version of the manuscript.

Funding

The present work was undertaken within the framework of the project EXPLIAS (“Design and piloting methods of commercial exploitation of invasive alien species with a view to contributing to their population control”; https://explias.gr/, accessed on 24 July 2023), which was coordinated by the National Technical University of Athens (NTUA) with the collaboration of the Hellenic Centre for Marine Research (HCMR) and the University of the Aegean (UoA) and funded by the Fisheries and Maritime Operational Program 2014–2020 of the Greek Ministry of Agricultural Development and Food, and the European Maritime and Fisheries Fund (MIS No: 5049912).

Institutional Review Board Statement

Not applicable.

Informed Consent Statement

Not applicable.

Data Availability Statement

The datasets analyzed from the current study are available from the corresponding author upon reasonable request.

Acknowledgments

The authors would like to thank Savvas Vagianos (fishing vessel Saratoga) and Osman Karaosman (fishing vessel Nikolaos), who were the two fishermen who contributed to conducting the samplings.

Conflicts of Interest

The authors declare no conflict of interest. The funders had no role in the design of the study; in the collection, analyses, or interpretation of data; in the writing of the manuscript; or in the decision to publish the results.

References

  1. Bianchi, C.N.; Morri, C.; Chiantore, M.; Montefalcone, M.; Parravicini, V.; Rovere, A. Mediterranean Sea biodiversity between the legacy from the past and a future of change. Life Mediterr. Sea A Look Habitat Changes 2012, 1, 55. [Google Scholar]
  2. Giakoumi, S.; Katsanevakis, S.; Albano, P.G.; Azzurro, E.; Cardoso, A.C.; Cebrian, E.; Deidun, A.; Edelist, D.; Francour, P.; Jimenez, C. Management priorities for Marine Invasive Species. Sci. Total Environ. 2019, 688, 976–982. [Google Scholar] [CrossRef]
  3. Katsanevakis, S.; Coll, M.; Piroddi, C.; Steenbeek, J.; Ben Rais Lasram, F.; Zenetos, A.; Cardoso, A.C. Invading the Mediterranean Sea: Biodiversity patterns shaped by human activities. Front. Mar. Sci. 2014, 1, 32. [Google Scholar] [CrossRef]
  4. Coll, M.; Piroddi, C.; Steenbeek, J.; Kaschner, K.; Ben Rais Lasram, F.; Aguzzi, J.; Ballesteros, E.; Bianchi, C.N.; Corbera, J.; Dailianis, T. The Biodiversity of the Mediterranean Sea: Estimates, Patterns, and Threats. PLoS ONE 2010, 5, e11842. [Google Scholar] [CrossRef] [PubMed]
  5. Katsanevakis, S.; Wallentinus, I.; Zenetos, A.; Leppäkoski, E.; Çinar, M.E.; Oztürk, B.; Grabowski, M.; Golani, D.; Cardoso, A.C. Impacts of Invasive Alien Marine Species on Ecosystem Services and Biodiversity: A Pan-European Review. Aquat. Invasions 2014, 9, 391–423. [Google Scholar] [CrossRef]
  6. Occhipinti-Ambrogi, A. Biopollution by Invasive Marine Non-Indigenous Species: A Review of Potential Adverse Ecological Effects in a Changing Climate. Int. J. Environ. Res. Public Health 2021, 18, 4268. [Google Scholar] [CrossRef] [PubMed]
  7. Arndt, E.; Givan, O.; Edelist, D.; Sonin, O.; Belmaker, J. Shifts in Eastern Mediterranean Fish Communities: Abundance Changes, Trait Overlap, and Possible Competition between Native and Non-Native Species. Fishes 2018, 3, 19. [Google Scholar] [CrossRef]
  8. Kleitou, P.; Moutopoulos, D.K.; Giovos, I.; Kletou, D.; Savva, I.; Cai, L.L.; Hall-Spencer, J.M.; Charitou, A.; Elia, M.; Katselis, G. Conflicting Interests and Growing Importance of Non-indigenous Species in Commercial and Recreational Fisheries of the Mediterranean Sea. Fish. Manag. Ecol. 2022, 29, 169–182. [Google Scholar] [CrossRef]
  9. Galanidi, M.; Zenetos, A.; Bacher, S. Assessing the Socio-Economic Impacts of Priority Marine Invasive Fishes in the Mediterranean with the Newly Proposed SEICAT Methodology. Mediterr. Mar. Sci. 2018, 19, 107. [Google Scholar] [CrossRef]
  10. Katsanevakis, S.; Rilov, G.; Edelist, D. Impacts of Marine Invasive Alien Species on European Fisheries and Aquaculture—Plague or Boon? CIESM Monogr. 2018, 50, 125–132. [Google Scholar]
  11. Chaffin, B.C.; Garmestani, A.S.; Angeler, D.G.; Herrmann, D.L.; Stow, C.A.; Nyström, M.; Sendzimir, J.; Hopton, M.E.; Kolasa, J.; Allen, C.R. Biological Invasions, Ecological Resilience and Adaptive Governance. J. Environ. Manag. 2016, 183, 399–407. [Google Scholar] [CrossRef]
  12. Kleitou, P.; Crocetta, F.; Giakoumi, S.; Giovos, I.; Hall-Spencer, J.M.; Kalogirou, S.; Kletou, D.; Moutopoulos, D.K.; Rees, S. Fishery Reforms for the Management of Non-Indigenous Species. J. Environ. Manag. 2021, 280, 111690. [Google Scholar] [CrossRef]
  13. Ünal, V.; Bodur, H.G. The Socio-Economic Impacts of the Silver-Cheeked Toadfish on Small-Scale Fishers: A Comparative Study from the Turkish Coast. Su Ürünleri Derg. 2017, 34, 119–127. [Google Scholar] [CrossRef]
  14. Carpentieri, P.; Lelli, S.; Colloca, F.; Mohanna, C.; Bartolino, V.; Moubayed, S.; Ardizzone, G.D. Incidence of Lessepsian Migrants on Landings of the Artisanal Fishery of South Lebanon. Mar. Biodivers. Rec. 2009, 2, e71. [Google Scholar] [CrossRef]
  15. Zenetos, A.; Albano, P.G.; Garcia, E.L.; Stern, N.; Tsiamis, K.; Galanidi, M. Established Non-Indigenous Species Increased by 40% in 11 Years in the Mediterranean Sea. Mediterr. Mar. Sci. 2022, 23, 196. [Google Scholar] [CrossRef]
  16. Galil, B.S.; Marchini, A.; Occhipinti-Ambrogi, A. East Is East and West Is West? Management of Marine Bioinvasions in the Mediterranean Sea. Estuar. Coast. Shelf Sci. 2018, 201, 7–16. [Google Scholar] [CrossRef]
  17. Zenetos, A.; Tsiamis, K.; Galanidi, M.; Carvalho, N.; Bartilotti, C.; Canning-Clode, J.; Castriota, L.; Chainho, P.; Comas-Gonzalez, R.; Costa, A.C. Status and Trends in the Rate of Introduction of Marine Non-Indigenous Species in European Seas. Diversity 2022, 14, 1077. [Google Scholar] [CrossRef]
  18. Mavruk, S.; Avsar, D. Non-Native Fishes in the Mediterranean from the Red Sea, by Way of the Suez Canal. Rev. Fish Biol. Fish. 2008, 18, 251–262. [Google Scholar] [CrossRef]
  19. Korakaki, E.; Legakis, A.; Katsanevakis, S.; Koulelis, P.P.; Avramidou, E.V.; Soulioti, N.; Petrakis, P.V. Invasive Alien Species of Greece. Invasive Alien Species Obs. Issues Around World 2021, 3, 124–189. [Google Scholar]
  20. Galil, B.S.; Mienis, H.K.; Hoffman, R.; Goren, M. Non-Indigenous Species along the Israeli Mediterranean Coast: Tally, Policy, Outlook. Hydrobiologia 2021, 848, 2011–2029. [Google Scholar] [CrossRef]
  21. Papaconstantinou, C. Fauna Graeciae. An Updated Checklist of the Fishes in the Hellenic Seas. Monographs on Marine Sciences; Hellenic Centre for Marine Research: Athens, Greece, 2014; p. 340. [Google Scholar]
  22. Corsini-Foka, M.; Zenetos, A.; Crocetta, F.; Cinar, M.; Kocak, F.; Golani, D.; Katsanevakis, S.; Tsiamis, K.; Cottier-Cook, E.; Froglia, C. Inventory of Alien and Cryptogenic Species of the Dodecanese (Aegean Sea, Greece): Collaborations through COST Action Training School. Manag. Biol. Invasions 2015, 6, 351–366. [Google Scholar] [CrossRef]
  23. Por, F.D.E. Lessepsian Migration, the Influx of Red Sea Biota into the Mediterranean by Way of the Suez Canal; Springer: Berlin/Heidelberg, Germany, 1978. [Google Scholar]
  24. Galil, B.S. The Marine Caravan–the Suez Canal and the Erythrean Invasion. In Bridging Divides: Maritime Canals as Invasion Corridors; Springer: Berlin/Heidelberg, Germany, 2006; pp. 207–300. [Google Scholar]
  25. Golani, D. Colonization of the Mediterranean by Red Sea Fishes via the Suez Canal-Lessepsian Migration. Fish Invasions Mediterr. Sea Chang. Renew. 2010, 145, 188. [Google Scholar]
  26. Corsini-Foka, M. Current Status of Alien Fishes in Greek Seas. In Fish Invasions of the Mediterranean Sea: Change and Renewal; Pensoft Publishers: Sofia, Bulgaria, 2010; pp. 219–253. [Google Scholar]
  27. Raitsos, D.E.; Beaugrand, G.; Georgopoulos, D.; Zenetos, A.; Pancucci-Papadopoulou, A.M.; Theocharis, A.; Papathanassiou, E. Global Climate Change Amplifies the Entry of Tropical Species into the Eastern Mediterranean Sea. Limnol. Oceanogr. 2010, 55, 1478–1484. [Google Scholar] [CrossRef]
  28. Bianchi, C.N.; Corsini-Foka, M.; Morri, C.; Zenetos, A. Thirty Years After-Dramatic Change in the Coastal Marine Habitats of Kos Island (Greece), 1981–2013. Mediterr. Mar. Sci. 2014, 15, 482–497. [Google Scholar] [CrossRef]
  29. Sisma-Ventura, G.; Yam, R.; Shemesh, A. Recent Unprecedented Warming and Oligotrophy of the Eastern Mediterranean Sea within the Last Millennium. Geophys. Res. Lett. 2014, 41, 5158–5166. [Google Scholar] [CrossRef]
  30. Zenetos, A.; Karachle, P.K.; Corsini-Foka, M.; Gerovasileiou, V.; Simboura, N.; Xentidis, N.J.; Tsiamis, K. Is the Trend in New Introductions of Marine Non-Indigenous Species a Reliable Criterion for Assessing Good Environmental Status? Τhe Case Study of Greece. Mediterr. Mar. Sci. 2020, 21, 775–793. [Google Scholar] [CrossRef]
  31. Dragičević, B.; Anadoli, O.; Angel, D.; Benabdi, M.; Bitar, G.; Castriota, L.; Crocetta, F.; Deidun, A.; Dulčić, J.; Edelist, D.; et al. New Mediterranean Biodiversity Records (December 2019). Mediterr. Mar. Sci. 2019, 20, 645–656. [Google Scholar] [CrossRef]
  32. Kousteni, V.; Bakiu, R.; Benhmida, A.; Crocetta, F.; Di Martino, V.; Dogrammatzi, A.; Doumpas, N.; Durmisha, S.; Giovos, I.; Gokoglu, M.; et al. New Mediterranean Biodiversity Records (April, 2019). Mediterr. Mar. Sci. 2019, 20, 230–247. [Google Scholar]
  33. Kampouris, T.E.; Doumpas, N.; Giovos, I.; Batjakas, I.E. First Record of the Lessepsian Nemipterus randalli Russell, 1986 (Perciformes, Nemipteridae) in Greece. Cah. Biol. Mar. 2019, 60, 559–561. [Google Scholar]
  34. Bariche, M.; Al-Mabruk, S.; Ates, M.; Büyük, A.; Crocetta, F.; Dritsas, M.; Edde, D.; Fortic, A.; Gavriil, E.; Gerovasileiou, V. New Alien Mediterranean Biodiversity Records (March 2020). Mediterr. Mar. Sci. 2020, 21, 129–145. [Google Scholar] [CrossRef]
  35. Ragkousis, M.; Abdelali, N.; Azzurro, E.; Badreddine, A.; Bariche, M.; Bitar, G.; Crocetta, F.; Denitto, F.; Digenis, M.; El Zrelli, R.; et al. New Alien Mediterranean Biodiversity Records (October 2020). Mediterr. Mar. Sci. 2020, 21, 631–652. [Google Scholar]
  36. Corsini-Foka, M.; Mastis, S.; Kondylatos, G.; Batjakas, I.E. Alien and Native Fish in Gill Nets at Rhodes, Eastern Mediterranean (2014–2015). J. Mar. Biol. Assoc. UK 2017, 97, 635–642. [Google Scholar] [CrossRef]
  37. Ünal, V.; Göncüoğlu, H.; Durgun, D.; Tosunoğlu, Z.; Deval, C.; Turan, C. Silver-Cheeked Toadfish, Lagocephalus sceleratus (Actinopterygii: Tetraodontiformes: Tetraodontidae), Causes a Substantial Economic Losses in the Turkish Mediterranean Coast: A Call for Decision Makers. Acta Ichthyol. Piscat. 2015, 45, 231–237. [Google Scholar] [CrossRef]
  38. Bellard, C.; Cassey, P.; Blackburn, T.M. Alien Species as a Driver of Recent Extinctions. Biol. Lett. 2016, 12, 20150623. [Google Scholar] [CrossRef] [PubMed]
  39. Turan, C. The invasion and Establishment of Lionfish Species (Pterois spp.) as a Major Threat to Marine Biodiversity of Turkey. In Lionfish Invasion Its Management in the Mediterranean Sea; Turkish Marine Research Foundation: Istanbul, Turkey, 2018; pp. 10–16. [Google Scholar]
  40. Arianoutsou, M.; Adamopoulou, C.; Andriopoulos, P.; Bazos, I.; Christopoulou, A.; Galanidis, A.; Kalogianni, E.; Karachle, P.K.; Kokkoris, Y.; Martinou, A.F. HELLAS-ALIENS. The Invasive Alien Species of Greece: Time Trends, Origin and Pathways. NeoBiota 2023, 86, 45–79. [Google Scholar] [CrossRef]
  41. GFCM-UNEP/MAP Report of the Joint GFCM-UN Environment/ MAP Subregional Pilot Study for the Eastern Mediterranean on Non-Indigenous Species in Relation to Fisheries. Chania, Greece: Food and Agriculture Organization of the United Nations and General. 2018. Available online: https://www.fao.org/gfcm/technical-meetings/detail/fr/c/1127974/ (accessed on 12 September 2023).
  42. Koutsouflakis, G.H. Fishing in the Greco-Roman World: Semiotics of Texts and Fishing Iconography, Fishing in the Greek Seas. Res. Noteb. 2010, 33, 55–83. (In Greek) [Google Scholar]
  43. FAO. GFCM. Available online: https://www.fao.org/gfcm/activities/fisheries/small-scale-fisheries/en/ (accessed on 12 September 2023).
  44. Gebremedhin, S.; Bruneel, S.; Getahun, A.; Anteneh, W.; Goethals, P. Scientific Methods to Understand Fish Population Dynamics and Support Sustainable Fisheries Management. Water 2021, 13, 574. [Google Scholar] [CrossRef]
  45. FAO. The State of World Fisheries and Aquaculture. Sustainability in Action. Rome. 2020. Available online: https://www.fao.org/3/ca9229en/ca9229en.pdf (accessed on 12 September 2023).
  46. Lloret, J.; Cowx, I.G.; Cabral, H.; Castro, M.; Font, T.; Gonçalves, J.M.S.; Gordoa, A.; Hoefnagel, E.; Matić-Skoko, S.; Mikkelsen, E. Small-Scale Coastal Fisheries in European Seas Are Not What They Were: Ecological, Social and Economic Changes. Mar. Policy 2018, 98, 176–186. [Google Scholar] [CrossRef]
  47. Tzanatos, E.; Georgiadis, M.; Peristeraki, P. Small-Scale Fisheries in Greece: Status, Problems, and Management. In Small-Scale Fisheries in Europe: Status, Resilience and Governance; Springer: Dodrecht, The Netherlands, 2020; pp. 125–150. [Google Scholar]
  48. Liontakis, A.; Tzouramani, I.; Mantziaris, S.; Sintori, A. Unravelling the Role of Gender in Fisheries’ Socio-Economic Performance: The Case of Greek Small-Scale Fisheries. Sustainability 2020, 12, 5304. [Google Scholar] [CrossRef]
  49. Ministry of Rural Development and Food. Annual Fleet Report 2020; Directorate General of Fishing: Athens, Greece, 2021.
  50. DG MARE. Fleet Register. Available online: https://webgate.ec.europa.eu/fleet-europa/results_en (accessed on 12 September 2023).
  51. Lucchetti, A.; Virgili, M.; Petetta, A.; Sartor, P. An Overview of Gill Net and Trammel Net Size Selectivity in the Mediterranean Sea. Fish. Res. 2020, 230, 105677. [Google Scholar] [CrossRef]
  52. Roditi, K.; Vafidis, D. Small-Scale Fisheries in the South Aegean Sea: Métiers and Associated Economics. Ocean Coast. Manag. 2022, 224, 106185. [Google Scholar] [CrossRef]
  53. Grati, F.; Azzurro, E.; Scanu, M.; Tassetti, A.N.; Bolognini, L.; Guicciardi, S.; Vitale, S.; Scannella, D.; Carbonara, P.; Dragičević, B. Mapping Small-scale Fisheries through a Coordinated Participatory Strategy. Fish Fish. 2022, 23, 773–785. [Google Scholar] [CrossRef]
  54. Adamidou, A. Commercial Fishing Gears and Methods Used in Hellas. In State of Hellenic Fisheries; HCMR: Athens, Greece, 2007; pp. 118–131. [Google Scholar]
  55. Olguner, M.T.; Deval, M.C. Catch and Selectivity of 40 and 44 Mm Trammel Nets in Small-Scale Fisheries in the Antalya Bay, Eastern Mediterranean. Ege J. Fish. Aquat. Sci. 2013, 30, 167–173. [Google Scholar]
  56. Petetta, A.; Herrmann, B.; Virgili, M.; De Marco, R.; Canduci, G.; Veli, D.L.; Bargione, G.; Vasapollo, C.; Lucchetti, A. Estimating Selectivity of Experimental Diamond (T0) and Turned Mesh (T90) Codends in Multi-Species Mediterranean Bottom trawl. Mediterr. Mar. Sci. 2020, 21, 545–557. [Google Scholar] [CrossRef]
  57. Jacquet, J.; Pauly, D. Funding Priorities: Big Barriers to Small-Scale Fisheries. Conserv. Biol. 2008, 22, 832–835. [Google Scholar] [CrossRef] [PubMed]
  58. Tzanatos, E.; Castro, J.; Forcada, A.; Matić-Skoko, S.; Gaspar, M.; Koutsikopoulos, C. A Métier-Sustainability-Index (MSI25) to Evaluate Fisheries Components: Assessment of Cases from Data-Poor Fisheries from Southern Europe. ICES J. Mar. Sci. 2013, 70, 78–98. [Google Scholar] [CrossRef]
  59. Ponte, S.; Raakjær, J.; Campling, L. Swimming Upstream: Market Access for African Fish Exports in the Context of WTO and EU Negotiations and Regulation. Dev. Policy Rev. 2007, 25, 113–138. [Google Scholar] [CrossRef]
  60. Nilsson, J.A.; Fulton, E.A.; Johnson, C.R.; Haward, M. How to Sustain Fisheries: Expert Knowledge from 34 Nations. Water 2019, 11, 213. [Google Scholar] [CrossRef]
  61. Kyvelou, S.S.I.; Ierapetritis, D.G. Fisheries Sustainability through Soft Multi-Use Maritime Spatial Planning and Local Development Co-Management: Potentials and Challenges in Greece. Sustainability 2020, 12, 2026. [Google Scholar] [CrossRef]
  62. Calo, A.; Di Franco, A.; Quattrocchi, F.; Dimitriadis, C.; Ventura, P.; Milazzo, M.; Guidetti, P. Multi-specific Small-scale Fisheries Rely on Few, Locally Essential, Species: Evidence from a Multi-area Study in the Mediterranean. Fish Fish. 2022, 23, 1299–1312. [Google Scholar] [CrossRef]
  63. Corsini-Foka, M.; Pancucci-Papadopoulou, M.A. Προκαταρκτική Μελέτη της Aλλόχθονης Πανίδας στο Θαλάσσιο Oικοσύστημα του Νοτιοανατολικού Aιγαίου; Τελική Τεχνική Έκθεση: Ρόδος, Greece, 2010; p. 77. (In Greek) [Google Scholar]
  64. Stergiou, K.I.; Moutopoulos, D.K.; Soriguer, M.C.; Puente, E.; Lino, P.G.; Zabala, C.; Monteiro, P.; Errazkin, L.A.; Erzini, K. Trammel Net Catch Species Composition, Catch Rates and Métiers in Southern European Waters: A Multivariate Approach. Fish. Res. 2006, 79, 170–182. [Google Scholar] [CrossRef]
  65. Mastis, S.; Corsini-Foka, M.; Kondylatos, G.B.I. Alien and Native Fish in Gill Nets at Rhodes, Eastern Mediterranean (2014–2015). In Proceedings of the 51st European Marine Biology Symposium, Rhodes, Greece, 26–30 September 2016; p. 59. [Google Scholar]
  66. FAO. Voluntary Guidelines for Securing Sustainable Small-Scale Fisheries. Voluntary Guidelines for Securing Sustainable Small-Scale Fisheries in the Context of Food Security and Poverty Eradication. 2015. Available online: https://www.fao.org/voluntary-guidelines-small-scale-fisheries/en/ (accessed on 12 September 2023).
  67. Tassetti, A.N.; Galdelli, A.; Pulcinella, J.; Mancini, A.; Bolognini, L. Addressing Gaps in Small-Scale Fisheries: A Low-Cost Tracking System. Sensors 2022, 22, 839. [Google Scholar] [CrossRef] [PubMed]
  68. Commission Decision (EU) 2017/848 of May 2017 Laying down Criteria and Methodological Standards on Good Environmental Status of Marine Waters and Specifications and Standardised Methods for Monitoring and Assessment, and Repealing Decision 2010/477/EU. Off. J. Eur. Union 2017, 125, 43–74.
  69. Frid, O.; Belmaker, J. Catch Dynamics of Set Net Fisheries in Israel. Fish. Res. 2019, 213, 1–11. [Google Scholar] [CrossRef]
  70. Whitehead, P.J.P.; Bauchot, M.L.; Hureau, J.C.; Nielsen, J.; Tortonese, E. Fishes of the North-eastern Atlantic and The Mediterranean. UNESCO 1986, 3, 1287–1293. [Google Scholar]
  71. Fischer, W.; Bauchot, M.L.; Schneider, M. Fiche FAO D’identification des Especes Pour les Besoins de la Peche, Rev. 1 Mediterranee et Mer Noire (Zone de Peche 37); FAO: Rome, Italy, 1987. [Google Scholar]
  72. Golani, D.; Orsi-Relini, L.; Massuti, E.; Quignard, J.-P. CIESM Atlas of Exotic Species in the Mediterranean–Vol. 1 Fishes; CIESM Publishers: Monte Carlo, Monaco, 2002; p. 256. [Google Scholar]
  73. Golani, D.; Öztürk, B.; Başusta, N. Fishes of the Eastern Mediterranean, 1st ed.; Turkish Marine Research Foundation: Istanbul, Turkey, 2006; p. 259. [Google Scholar]
  74. Golani, D.; Azzurro, E.; Dulčić, J.; Massutí, E.; Orsi-Relini, L. Atlas of Exotic Fishes in the Mediterranean Sea; Ciesm Publishers: Paris, France; Monte Carlo, Monaco, 2021. [Google Scholar]
  75. Louisy, P. Guide D’identification Des Poissons Marins: Europe De l’ouest et Méditerranée; Editions Eugen Ulmer: Paris, France, 2002. [Google Scholar]
  76. Şahin, M.; Aybek, E. Jamovi: An Easy to Use Statistical Software for the Social Scientists. Int. J. Assess. Tools Educ. 2019, 6, 670–692. [Google Scholar] [CrossRef]
  77. Rutherford, A. Introducing ANOVA And ANCOVA: A GLM Approach; Sage: Thousand Oaks, CA, USA, 2001; ISBN 9780761951612. [Google Scholar]
  78. Warwick, R.M. A New Method for Detecting Pollution Effects on Marine Macrobenthic Communities. Mar. Biol. 1986, 92, 557–562. [Google Scholar] [CrossRef]
  79. Clarke, K.R. Non-parametric Multivariate Analyses of Changes in Community Structure. Aust. J. Ecol. 1993, 18, 117–143. [Google Scholar] [CrossRef]
  80. Shannon, C.; Weiner, W. The Mathematical Theory of Communication; Urban University Illinois Press: Champaign, IL, USA, 1963; 125p. [Google Scholar]
  81. Margalef, D. Information Theory in Ecology, General Systems. Transl. Mem. Real Acad. Cienc. Artes Barcelona 1958, 32, 373–449. [Google Scholar]
  82. Pielou, E.C. Mathematical Ecology, 2nd ed.; Wiley and Sons: New York, NY, USA, 1977. [Google Scholar]
  83. Mika, S.; Ratsch, G.; Weston, J.; Scholkopf, B.; Mullers, K.R. Fisher Discriminant Analysis with Kernels. In Neural Networks for Signal Processing IX, Proceedings of the 1999 IEEE Signal Processing Society Workshop (cat. no. 98th8468), Madison, WI, USA, 25 August 1999; IEEE: Piscataway, NJ, USA, 1999; pp. 41–48. [Google Scholar]
  84. Sneath, P.H.; Sokal, R.R. Numerical Taxonomy. The Principles and Practice of Numerical Classification; Freeman W.H. and Company: San Francisco, CA, USA, 1973. [Google Scholar]
  85. The R Development Core Team. R A language and Environment for Statistical Computing; R Foundation for Statistical Computing: Vienna, Austria, 2021. [Google Scholar]
  86. Streftaris, N.; Zenetos, A. Alien Marine Species in the Mediterranean-the 100 ‘Worst Invasives’ and Their Impact. Mediterr. Mar. Sci. 2006, 7, 87–118. [Google Scholar] [CrossRef]
  87. García-de-la-Fuente, L.; Fernández-Vázquez, E.; Ramos-Carvajal, C. A Methodology for Analyzing the Impact of the Artisanal Fishing Fleets on Regional Economies: An Application for the Case of Asturias (Spain). Mar. Policy 2016, 74, 165–176. [Google Scholar] [CrossRef]
  88. Tzanatos, E.; Dimitriou, E.; Katselis, G.; Georgiadis, M.; Koutsikopoulos, C. Composition, Temporal Dynamics and Regional Characteristics of Small-Scale Fisheries in Greece. Fish. Res. 2005, 73, 147–158. [Google Scholar] [CrossRef]
  89. Christidis, G.; Batziakas, E.; Peristeraki, P.; Kosoglou, I.; Tampakakis, K.; Somarakis, S.; Tserpes, G. The Impact of Lagocephalus sceleratus (Gmelin, 1789) on Small-Scale Fisheries in Crete: Preliminary Results. In Proceedings of the Marine and Inland Waters Research Symposium, Porto Heli, Argolida, Greece, 16–19 September 2022; pp. 357–361. [Google Scholar]
  90. Azzurro, E.; Stancanelli, B.; Di Martino, V.; Bariche, M. Range expansion of the common lionfish Pterois miles (Bennett, 1828) in the Mediterranean Sea: An unwanted new guest for Italian waters. BioInvasions Rec. 2017, 6, 95–98. [Google Scholar] [CrossRef]
  91. Batjakas, I.E.; Evangelopoulos, A.; Giannou, M.; Pappou, S.; Papanikola, E.; Atsikvasi, M.; Poursanidis, D.; Gubili, C. Lionfish Diet Composition at Three Study Sites in the Aegean Sea: An Invasive Generalist? Fishes 2023, 8, 314. [Google Scholar] [CrossRef]
  92. Vagenas, G.; Dogrammatzi, A.; Apostolopoulos, G.; Konida, K.; Nalmpanti, M.; Koufalis, E.; Tsikliras, A.C.; Margaritis, M.K.P. Fishers Perceptions on the Status and Impact of the Alien Fish Siganus luridus and S. rivulatus in the Aegean and Ionian Seas. In Proceedings of the Marine and Inland Waters Research Symposium, Porto Heli, Argolida, Greece, 16–19 September 2022; p. 363. [Google Scholar]
  93. Stamouli, C.; Akel, E.; Azzurro, E.; Bakiu, R.; Bas, A.; Bitar, G.; Boyaci, Y.; Cakalli, M.; Corsini-Foka, M.; Crocetta, F.; et al. New Mediterranean Biodiversity Records (December 2017). Mediterr. Mar. Sci. 2017, 18, 534–556. [Google Scholar]
  94. Evagelopoulos, A.; Nikolaou, A.; Michailidis, N.; Kampouris, T.E.; Batjakas, I.E. Progress of the Dispersal of the Alien Goatfish Parupeneus forsskali (Fourmanoir & Guézé, 1976) in the Mediterranean, with Preliminary Information on Its Diet Composition in Cyprus. BioInvasions Rec. 2020, 9, 209–222. [Google Scholar]
  95. Saemundsson, S.; Tsikliras, A.C.; Chartosia, N. Reproduction and Growth of the Red Sea Goatfish Parupeneus forsskali in Its New Environment (Cyprus, Eastern Mediterranean Sea). Sci. Mar. 2023, 87, e064. [Google Scholar] [CrossRef]
  96. Giakoumi, S. Distribution Patterns of the Invasive Herbivore Siganus luridus (Rüppell, 1829) and its Relation to Native Benthic Communities in the Central Aegean Sea, Northeastern Mediterranean. Mar. Ecol. 2014, 35, 96–105. [Google Scholar] [CrossRef]
  97. Pennington, A.; Shepperson, J.; Jeffery, A.; Miliou, A.; Anagnostou, V. Siganus Species in an Artisanal Fishery in the Eastern Aegean. Rapp. Comm. Int. Mer Mediterr. 2013, 40, 591. [Google Scholar]
  98. Stergiou, K.I.; Moutopoulos, D.K.; Erzini, K. Gill Net and Longlines Fisheries in Cyclades Waters (Aegean Sea): Species Composition and Gear Competition. Fish. Res. 2002, 57, 25–37. [Google Scholar] [CrossRef]
  99. Peristeraki, P.; Skarvelis, K.; Giannakaki, A.; Tambakakis, K.; Tserpes, G. Preliminary Results on the Abundance of Alien Species in the Coastal Fisheries Catches of Crete. In Proceedings of the 11th Panhellenic Symposium on Oceanography and Fisheries, Mytilene, Lesvos Island, Greece, 13–17 May 2015; pp. 149–152. [Google Scholar]
  100. Damalas, D.; Stamouli, C.; Fotiadis, N.; Kikeri, M.; Kousteni, V.; Mantopoulou-Palouka, D. The Gyaros Island Marine Reserve: A Biodiversity Hotspot in the Eastern Mediterranean Sea. PLoS ONE 2022, 17, e0262943. [Google Scholar] [CrossRef] [PubMed]
  101. Ragheb, E.; Kamal, R.M.; Hasan, M.W.A. Species Diversity of Gillnet Catches along the Egyptian Mediterranean Coast of Alexandria. Egypt. J. Aquat. Res. 2022, 48, 281–289. [Google Scholar] [CrossRef]
  102. Kosswig, C. Erythräische Fische Im Mittelmeer Und an Der Grenze Der Ä Gais. In Syllegomena Biol; von Jordans, A., Peus, F., Eds.; Academie Verlag: Festschrift Kleinschmidt, Leipzig, 1950; pp. 203–212. [Google Scholar]
  103. Bariche, M.; Kajajian, A.; Azzurro, E. Reproduction of the Invasive Bluespotted Cornetfish Fistularia commersonii (Teleostei, Fistulariidae) in the Mediterranean Sea. Mar. Biol. Res. 2013, 9, 169–180. [Google Scholar] [CrossRef]
  104. Turan, C.; Öztürk, B. First Record of the Lionfish Pterois miles (Bennett 1828) from the Aegean Sea. J. Black Sea/Mediterr. Environ. 2015, 20, 334–388. [Google Scholar]
  105. Gurlek, M.; Turan, C.; Yağlioğlu, D. Catch Composition of Non-Indigenous Species by Gill and Trammel Net Fishery in the Mediterranean Coast of Turkey. Fish. Aquat. Sci. 2018, 47, 265–269. [Google Scholar]
  106. Petetta, A.; Vasapollo, C.; Virgili, M.; Bargione, G.; Lucchetti, A. Pots vs Trammel Nets: A Catch Comparison Study in a Mediterranean Small-Scale Fishery. PeerJ 2020, 8, e9287. [Google Scholar] [CrossRef]
  107. Haubrock, P.J.; Turbelin, A.J.; Cuthbert, R.N.; Novoa, A.; Taylor, N.G.; Angulo, E.; Ballesteros-Mejia, L.; Bodey, T.W.; Capinha, C.; Diagne, C.; et al. Economic costs of in-vasive alien species across Europe. NeoBiota 2021, 67, 153–190. [Google Scholar] [CrossRef]
  108. Henry, M.; Leung, B.; Cuthbert, R.N.; Bodey, T.W.; Ahmed, D.A.; Angulo, E.; Bal-zani, P.; Briski, E.; Courchamp, F.; Hulme, P.E.; et al. Unveiling the hidden economic toll of biological invasions in the European Union. Environ. Sci. Eur. 2023, 35, 1–16. [Google Scholar] [CrossRef]
  109. Cuthbert, R.N.; Pattison, Z.; Taylor, N.G.; Verbrugge, L.; Diagne, C.; Ahmed, D.A.; Leroy, B.; Angulo, E.; Briski, E.; Capinha, C.; et al. Global economic costs of aquatic invasive alien species. Sci. Total Environ. 2021, 775, 145238. [Google Scholar] [CrossRef]
  110. Sini, M.; Vatikiotis, K.; Thanopoulou, Z.; Katsoupis, C.; Maina, I.; Kavadas, S.; Karachle, P.K.; Katsanevakis, S. Small-Scale Coastal Fishing Shapes the Structure of Shallow Rocky Reef Fish in the Aegean Sea. Front. Mar. Sci. 2019, 6, 599. [Google Scholar] [CrossRef]
  111. Tzanatos, E.; Dimitriou, E.; Papaharisis, L.; Roussi, A.; Somarakis, S.; Koutsikopoulos, C. Principal Socio-Economic Characteristics of the Greek Small-Scale Coastal Fishermen. Ocean Coast. Manag. 2006, 49, 511–527. [Google Scholar] [CrossRef]
  112. Frid, O.; Gavriel, T.; Ben-Ari, Y.; Weinberger, A.; Yancovich-Shalom, H.; Belmaker, J. Catch Estimates and Species Composition of Recreational Fishing in Israel. Fishes 2023, 8, 69. [Google Scholar] [CrossRef]
  113. Font, T.; Lloret, J. Biological and Ecological Impacts Derived from Recreational Fishing in Mediterranean Coastal Areas. Rev. Fish. Sci. Aquac. 2014, 22, 73–85. [Google Scholar] [CrossRef]
  114. Tsafoutis, D.; Metaxas, T. Fishing Tourism in Greece: Defining Possibilities and Prospects. Sustainability 2021, 13, 13847. [Google Scholar] [CrossRef]
  115. González, R.C.L.; Piñeiro Antelo, M. de los Á. Fishing Tourism as an Opportunity for Sustainable Rural Development—The Case of Galicia, Spain. Land 2020, 9, 437. [Google Scholar] [CrossRef]
  116. Golani, D. First Record of the Bluespotted Cornetfish from the Mediterranean Sea. J. Fish Biol. 2000, 56, 1545–1547. [Google Scholar] [CrossRef]
  117. Akyol, O.; Ünal, V.; Ceyhan, T.; Bilecenoglu, M. First Confirmed Record of Lagocephalus sceleratus (Gmelin, 1789) in the Mediterranean Sea. J. Fish Biol. 2005, 66, 1183–1186. [Google Scholar] [CrossRef]
  118. Golani, D.; Sonin, O. New Records of the Red Sea Fishes, Pterois miles (Scorpaenidae) and Pteragogus pelycus (Labridae) from the Eastern Mediterranean Sea. Jpn. J. Ichthyol. 1992, 39, 167–169. [Google Scholar] [CrossRef]
  119. Spanier, E.; Pisanty, S.; Tom, M.; Almog-Shtayer, G. The Fish Assemblage on a Coralligenous Shallow Shelf off the Mediterranean Coast of Northern Israel. J. Fish Biol. 1989, 35, 641–649. [Google Scholar] [CrossRef]
  120. Shakman, E.A.; Kinzelbach, R. Distribution and characterization of Lessepsian migrant fishes along the coast of Libya. Acta Ichthyol. Piscat. 2007, 37, 7–15. [Google Scholar] [CrossRef]
  121. Shakman, E.; Kinzelbach, R. Commercial Fishery and Fish Species Composition in Coastal Waters of Libya. Rostocker Meeresbiol. Beiträge 2007, 18, 63–78. [Google Scholar]
  122. Kavalakis, G. Composition of Fish Catch in Dodecanese, Technical Report; Fishery Office of the Dodecanese: Rhodes, Greece, 1964; 19p. (In Greek) [Google Scholar]
  123. Tortonese, E. Biological Investigations in the Aegean Sea. Nature 1947, 159, 887–888. [Google Scholar] [CrossRef]
  124. Maldura, L.M. La Pesca Nelle Isole Italiane dell’Egeo. Boll. Pesca Piscic. Idrobiol. 1938, 14, 460–480. [Google Scholar]
  125. Papaconstantinou, C.; Mytilineou, C.; Panos, T. Aspects of the Life History and Fishery of Red Pandora, Pagellus erythrinus (Sparidae) off Western Greece. Cybium 1988, 12, 267–280. [Google Scholar]
  126. Kalogirou, S.; Wennhage, H.; Pihl, L. Non-Indigenous Species in Mediterranean Fish Assemblages: Contrasting Feeding Guilds of Posidonia oceanica Meadows and Sandy Habitats. Estuar. Coast. Shelf Sci. 2012, 96, 209–218. [Google Scholar] [CrossRef]
  127. Tzanatos, E.; Somarakis, S.; Tserpes, G.; Koutsikopoulos, C. Identifying and Classifying Small-Scale Fisheries Métiers in the Mediterranean: A Case Study in the Patraikos Gulf, Greece. Fish. Res. 2006, 81, 158–168. [Google Scholar] [CrossRef]
Figure 1. Three of the marine invasive alien species of fish in the Hellenic waters: (A) bluespotted cornetfish Fistularia commersonii; (B) silver-cheeked toadfish Lagocephalus sceleratus; (C) devil firefish Pterois miles. All photographs were taken by G.K.
Sustainability 15 14976 g001
Figure 2. Map of the study area and sampling areas. (A) Map of Hellas where the location of Rhodes is outlined. (B) Physical map of the island of Rhodes and the surrounding coastal waters where the three sampling areas are shown. Stars represent the main fishing port of each area.
Sustainability 15 14976 g002
Figure 3. The 10 major species in terms of number of individuals (A) (representing 70.78% of the total biomass) and biomass (B) (82.49% of the total biomass) caught in static nets; frequency of occurrence of the 10 most dominant fish species from all static gear (C); monthly proportional number of individuals (N%) per species (D) and biomass (W%) (E); monthly proportional number of species (A%) (F) between indigenous (IS; blue) and non-indigenous (NIS; red) species caught in static nets (DF) values are monthly averages in a standardized ratio.
Sustainability 15 14976 g003
Figure 4. Main effects plot of the influence that different factors, i.e., spatial (area), temporal (season), provenance (species origin) and capture method (fishing gear), exerted on the captured biomass.
Sustainability 15 14976 g004
Figure 5. Histogram of eigenvalues (top-right) and the ordination plot produced using principal component analysis (PCA) for the relationship of species and fishing trips based on a Boolean-based dataset (presence–absence; 0–1). The displayed species represent the 16 most dominant in terms of numerical abundance, biomass and frequency of occurrence. The convex polygons distinguish between indigenous (IS) and non-indigenous species (NIS).
Sustainability 15 14976 g005
Figure 6. Abundance (A), biomass (B) and number of species caught (C) among indigenous (IS; blue) and non-indigenous (NIS; red) species for each type of static gear.
Sustainability 15 14976 g006
Figure 7. Dendrogram for hierarchical clustering for each sampling area, using group-average clustering of Bray–Curtis similarities based on square-root-transformed biomass.
Sustainability 15 14976 g007
Figure 8. Linear discriminant analysis of abundance and biomass among sampling areas.
Sustainability 15 14976 g008
Figure 9. Dendrogram for hierarchical clustering of sampling seasons using group-average clustering of Bray–Curtis similarities based on square-root-transformed biomass.
Sustainability 15 14976 g009
Figure 10. Nonmetric multidimensional scaling ordination plot of the level of similarity between sampling areas and seasons based on the Bray–Curtis similarity index of square-root-transformed biomass. Closer points indicate higher similarity.
Sustainability 15 14976 g010
Figure 11. Gear–area (A), gear–provenance (B), provenance–area (C) and provenance–season (D) interaction plots with captured biomass (values in g).
Sustainability 15 14976 g011
Figure 12. Abundance/biomass comparison (AC) plots of the overall area and each area.
Sustainability 15 14976 g012
Table 1. Top-ranked species responsible for the observed dissimilarities between areas in terms of their average abundance, individual contribution (%) and cumulative contribution to the average dissimilarity value.
Area 1Area 2Average Dissimilarity: 59.19
SpeciesAverage AbundanceAverage AbundanceContribution %Cumulative Contribution %
Lagocephalus sceleratus35.9339.189.709.70
Fistularia commersonii42.9728.828.9018.60
Pterois miles46.8855.587.2825.88
Sparisoma cretense31.1932.334.6030.48
Siganus rivulatus17.914.664.1934.67
Area 1Area 3Average Dissimilarity: 63.68
Lagocephalus sceleratus35.9363.4111.0511.05
Fistularia commersonii42.9742.698.4619.51
Pterois miles46.8851.977.1126.62
Sparisoma cretense31.1932.544.9831.60
Dasyatis pastinaca10.2922.614.2735.87
Area 2Area 3Average Dissimilarity: 62.43
Lagocephalus sceleratus39.1863.4110.7410.74
Fistularia commersonii28.8242.698.1918.93
Pterois miles55.5851.977.9326.85
Sparisoma cretense32.3332.545.9932.84
Dasyatis pastinaca022.613.8936.73
Table 2. The top-ranked species responsible for the observed similarities in each season, along with their average abundance, individual contribution (%) and cumulative contribution to the average dissimilarity value.
SpeciesAverage AbundanceAverage SimilarityContribution %Cumulative Contribution %
AutumnAverage Similarity: 26.75
Sparisoma cretense51.737.0126.2126.21
Lagocephalus sceleratus20.524.1515.5241.73
Parupeneus forsskali13.682.9410.9952.72
Sargocentron rubrum15.032.047.6260.34
Pagellus erythrinus12.641.887.0167.35
Dasyatis pastinaca22.041.696.373.65
SpringAverage Similarity: 44.89
Lagocephalus sceleratus53.259.821.8321.83
Pterois miles54.59.3320.7942.63
Spicara maena28.915.9213.1955.82
Sparisoma cretense29.25.1811.5567.37
Fistularia commersonii38.852.485.5372.89
SummerAverage Similarity: 33.69
Pterois miles83.5716.4448.848.8
Lagocephalus sceleratus43.14.8714.4663.26
Sargocentron rubrum20.543.359.9573.2
WinterAverage Similarity: 24.12
Fistularia commersonii50.474.217.4217.42
Trachinus araneus17.513.3313.8131.23
Lagocephalus sceleratus67.812.399.941.13
Synodus saurus11.612.078.5749.7
Oblada melanura7.461.656.8456.55
Pterois miles31.981.566.4863.02
Diplodus vulgaris10.891.415.8368.85
Sparisoma cretense20.631.275.2874.13
Table 3. ANCOVA results of spatial, temporal and provenance factor interactions with captured biomass, sum of squares (SS), degrees of freedom (DFs), test statistic (F) and associated probability (P) (significance level: ns—not significant, * p < 0.05, ** p < 0.01, *** p< 0.001).
A. Gear–Area InteractionSSDFsFp
Model15,249,493.0958.74***
Gear1,703,481.1514.88*
Area4,359,783.8526.24**
Gear × area1,588,092.4522.27ns
Residuals385,064,808.81103
Total400,314,301.91108
B. Gear–Provenance Interaction
Model6,460,827.7636.04***
Gear4,551,604.13112.77***
Species origin989,154.6612.77ns
Gear × species origin1,912,391.9115.36*
Residuals393,584,9591104
Total400,045,786.71107
C. Provenance–Area Interaction
Model13,408,652.7457.64***
Species origin804,105.512.29ns
Area10,734,151.97215.3***
Species origin × area212,249.9420.3ns
Residuals386,637,1341102
Total400,045,786.71107
D. Provenance–Season Interaction
Model9,067,715.7273.64***
Species origin955,362.5712.69ns
Season1,656,432.8831.55ns
Species origin × season6,172,448.5535.79***
Residuals390,978,0711100
Total400,045,786.71107
Table 4. Species number, numerical abundance, species richness (d), evenness (J) and diversity index (H′) in each sampling area.
GroupSpecies NumberNumerical AbundanceSpecies Richness Margalef (d)Evenness (J)Shannon Diversity Index (H′)Simpson 1-Lambda′
Area 1435986.5690.80093.0120.9244
Area 2485877.3730.73012.8260.8974
Area 3496957.3350.75652.9440.9208
Disclaimer/Publisher’s Note: The statements, opinions and data contained in all publications are solely those of the individual author(s) and contributor(s) and not of MDPI and/or the editor(s). MDPI and/or the editor(s) disclaim responsibility for any injury to people or property resulting from any ideas, methods, instructions or products referred to in the content.

