Article

Field Experimental Study on the Infiltration and Clogging Processes at Aksu Research Site, Kazakhstan

1
Department of Chemical Engineering and the Eastern R&D Center, Ariel University, Ariel 40700, Israel
2
Zonal Hydrogeological-Ameliorative Center of the Ministry of Agriculture, Almaty 050018, Kazakhstan
3
Department of Hydrogeology and Engineering Geology, Satbayev University, Almaty 050000, Kazakhstan
*
Author to whom correspondence should be addressed.
Sustainability 2022, 14(23), 15645; https://doi.org/10.3390/su142315645
Submission received: 8 October 2022 / Revised: 10 November 2022 / Accepted: 20 November 2022 / Published: 24 November 2022

Abstract

:
The challenge of a good quality drinking water supply to southeastern Kazakhstan’s local population from far-away natural surface water sources motivates groundwater utilization from local aquifers. To prevent groundwater resource deficits, artificial groundwater recharge is needed. To this end, infiltration and clogging processes were evaluated through comprehensive field research in southeastern Kazakhstan’s typical river drainage basin (Aksu experimental site). The infiltration scenario included constructed mini pools and their typical soil profile clogging and silting processes. The local aquifer unsaturated and upper saturated zones underwent a detailed study of water balance, hydrodynamic setting, and filtration properties. The research results suggest that the infiltration rate decreased from 15 m/day until the saturation steady state and remained at 0.75 m/day until the end of the experiment. In summer, clogging layers with thicknesses ranging from 3 mm for the clayey silt layer to 6 mm for muddy clay began to form at the mini pools nearly one month after the test began. During infiltration, the mini pools’ upper soil layer dirt-holding capacity varied from 3.72 to 5.25 kg/m2. The field study results serve as a factual basis for artificial replenishment system design and groundwater replenishment methodology optimization in southeastern Kazakhstan and similar regions.

1. Introduction

Aquifer artificial recharge in arid and semiarid regions across the world is a possible resolution for groundwater depletion and deterioration. By applying qualitative and quantitative techniques for geo–environmental variable assessment, the artificial recharge potential of suitable regions was investigated [1,2,3]. Based on floodwater spreading in arid Iran, the recharge contribution from both ephemeral river channels and artificial recharge systems was quantified using MODFLOW modeling [4].
Infiltration pools are a popular method for managed aquifer recharge due to their low construction cost, managed aquifer flow, transport, and recharge that can be quantitatively modeled [5]. To design open infiltration basins, a groundwater artificial replenishment (GAR) detailed assessment should be performed. Such an assessment integrates water-physical and hydrodynamic properties and covers sediment and aquifer interface layer filtration properties, as well as clogging processes. In a saline aquifer north of Chennai, Tamil Nadu, India, infiltration assessment from a simple excavated pool, without providing slope support or bed paving, indicated that it may increase recharge and improve groundwater quality [6]. It was also suggested that cleaning the pond by scrapping the accumulated clogging sediments needs to be done once a year.
Different methods for clogging assessment are used: suspended solid clogging during laboratory soil column tests was assessed by numerical spatial–temporal modeling [7]; physical clogging of a one-dimensional gravel filter column under both constant and variable water levels was quantified for different sediment inflow concentrations [8]; the wastewater effluent clogging effect on structured silty clay loam subsoil was investigated by pilot-scale infiltration cells in different compositions and loading rates [9]. It was found that soil clogging development correlates with the mass density cumulative loadings, indicated by total biochemical oxygen demand and suspended solids. Using laboratory and field experiments, clogging mechanisms and quantifying infiltration performance declines as a function of sediment loading were also identified [10]. Laboratory and field experiments of small infiltration pools showed that the initial and final infiltration rates are dependent on the soil surface area, hydraulic conductivity, and initial saturation state. Trench stormwater infiltration effectiveness by water level monitoring has shown spatial variations in clogging rates [11]. GAR in Kazakhstan began in the 1960s to compensate for the uneven seasonal distribution of surface runoff in the driest years by infiltrating coastal wells.
The water-resource deficit in southeastern Kazakhstan requires the application of artificial groundwater recharge techniques to provide rural communities with drinking water from groundwater resources, especially small, isolated settlements [12]. The infiltration basin field studies and their clogging processes assessment was conducted on a mini pool physical model in the Karatal River watershed [13]. The water seepage natural conditions were simulated for the fully saturated cover soil layer and various infiltrating flows spreading up to the shallow groundwater level. With the surface water turbidity of the Karatal River reaching 38 mg/L, the clogging membrane thickness formed at the mini pool bottom was only 0.09 mm. Sites promising for GAR are mainly confined to areas composed of Quaternary alluvial deposits, mainly the modern and Upper Quaternary ages. The water-bearing layers of the lithological structure in the Karatal, Aksu, Lepsi, Keskenterek, Koksu, Tentek, and Bizhe river valleys are composed of gravel, crushed stone, sand, gravel-pebble, and boulders [14]. This comprehensive field research investigated infiltration and clogging processes at several study sites for future construction and practical use of GAR facilities.
In this context, the main objective of this study was to assess infiltration and clogging processes at the Aksu experimental site and to optimize infiltration site expansion and management under specific local conditions.

2. Main Framework

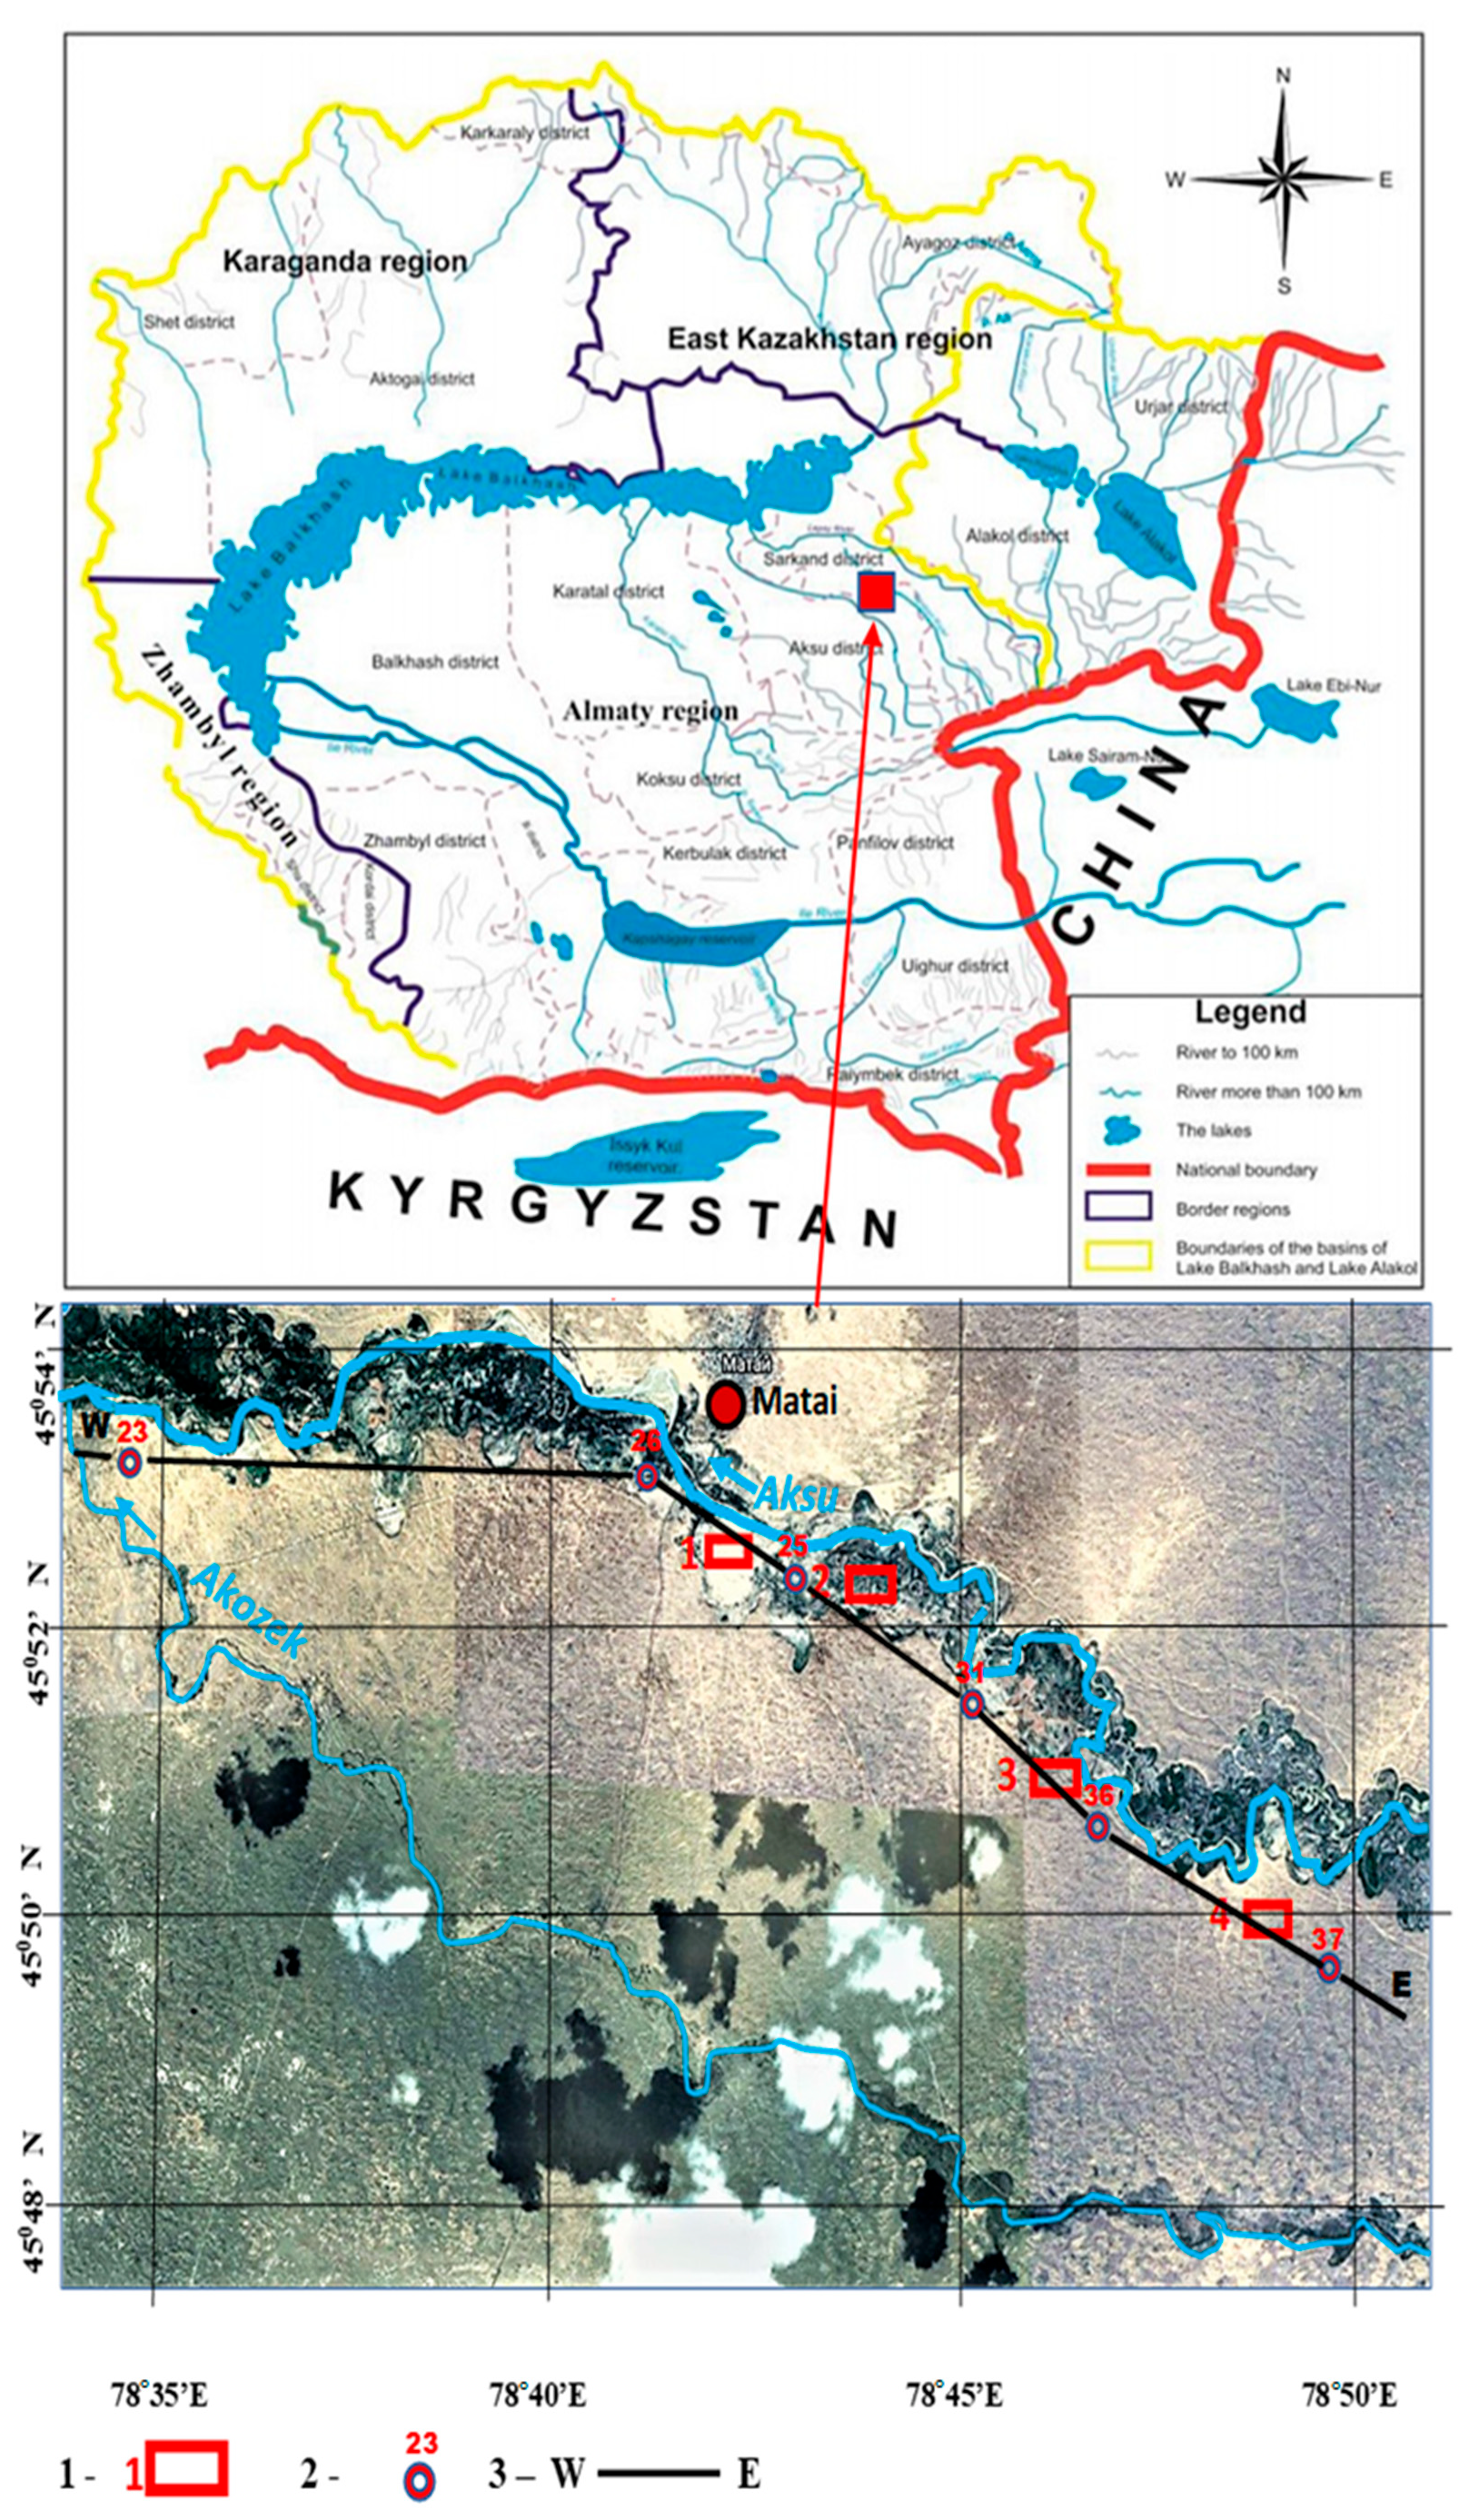
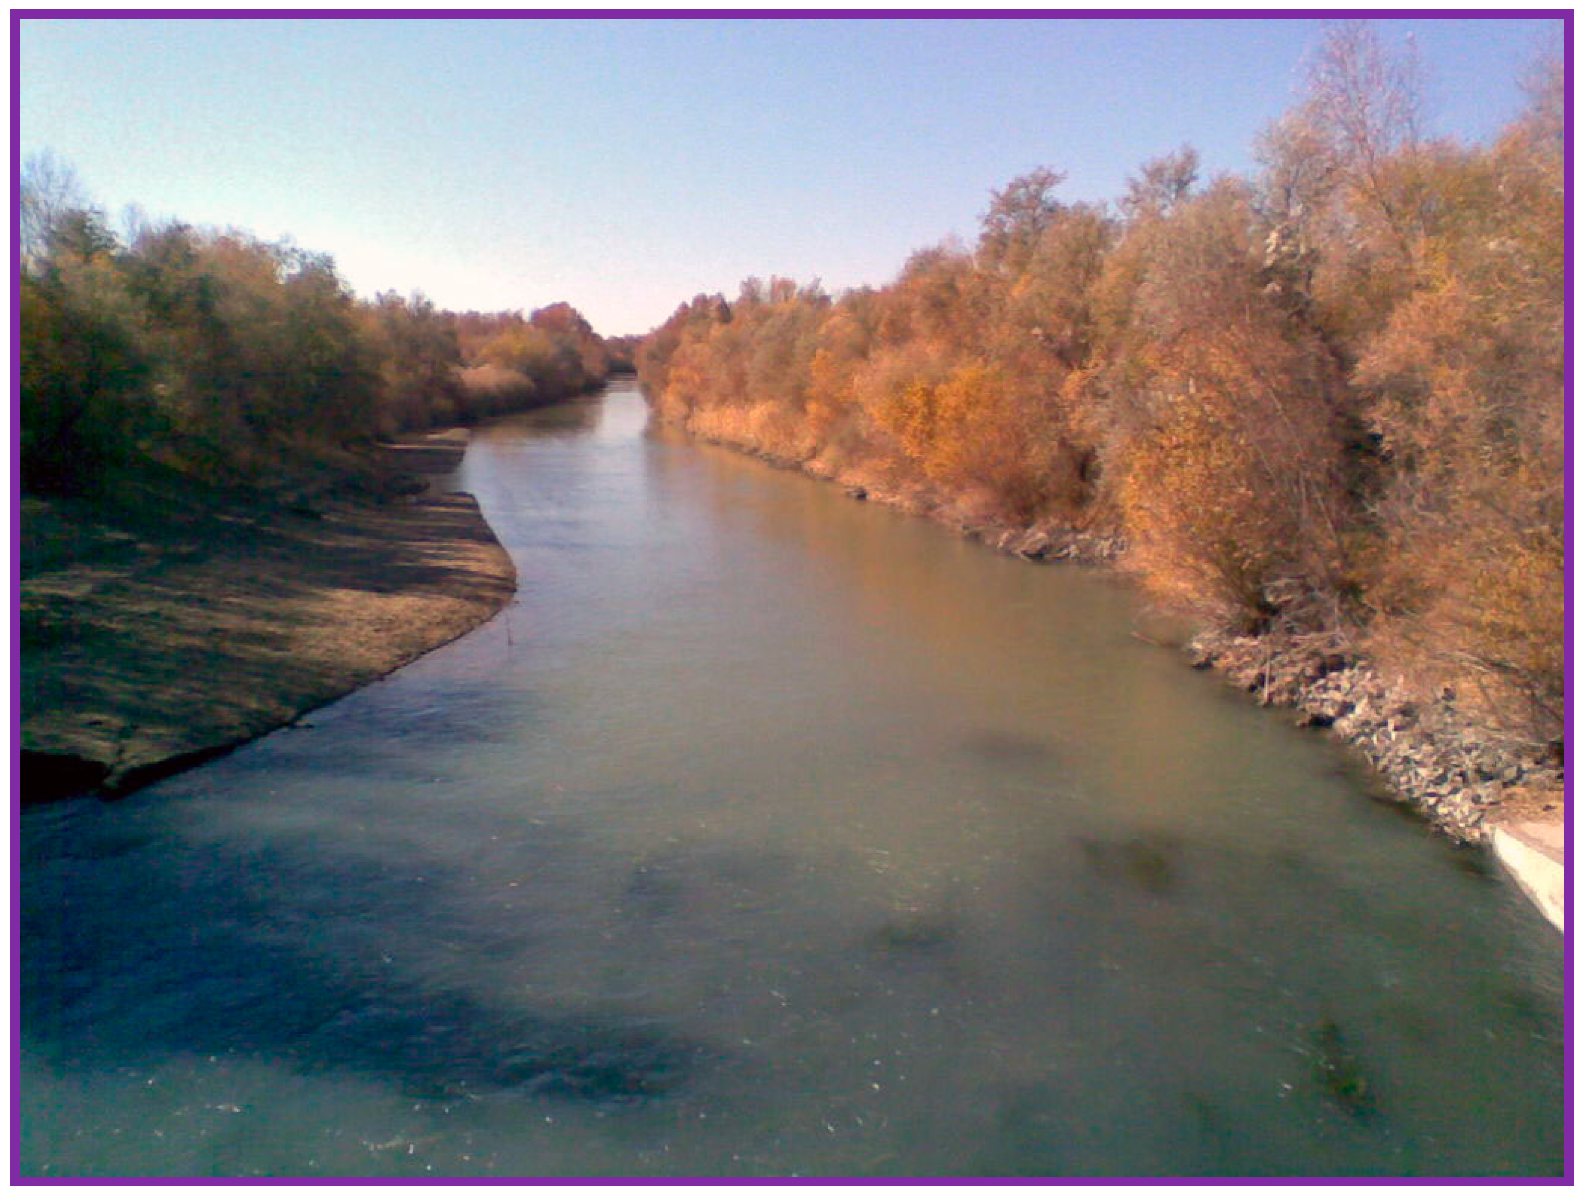
2.1. Geographical Framework

The Aksu River is southeastern Kazakhstan’s main source of water; it originates in the Dzungarsky Alatau Mountains and glacial moraine lakes (Figure 1). On leaving the mountains, the river flow gradient becomes minor until it discharges into Kukan Bay of Balkhash Lake. The Aksu River has 132 tributaries with a total length of 316 km and a basin area of 4100 km2. The river recharge is mainly from snow and ice melt, as well as from underground sources. In this regard, the maximum flood that occurs in July and August is regulated by a system of reservoirs. A small hydroelectric power station was built on the river near the Zhansugurov settlement for local needs.
The Aksu experimental site’s total area is approximately 470 km2; it is in the northern part of the Aksu district in the Almaty region of the Aksu River’s middle course on its left bank. The research site’s northern boundary is the Aksu riverbed, and the southern and western boundaries are the Akozek River, which has an intermittent river that flows to a full extent following major rain events and usually in sections that are less solitary as the annual precipitation amount increases. The eastern border of the site crosses the Aksu-Akozek interfluve and is limited by a strip of fertile vegetated land allocated to pasture infrastructure restoration and development. The climate in the study area is extremely continental, characterized by severe winters, hot summers, and short springs and autumns.
During 2017–2019, the minimum average monthly air temperature was noted in January (−17.9 °C), and the maximum was in July (+26.9 °C). The duration of the period with a constant temperature above 10 °C varied from 183–193 days. The total annual precipitation amount ranges from 250 to 370 mm, mostly during the warm season, and has a heterogeneous distribution over the study area. The rainiest months are March, April, May, and June, followed by January, October, November, and December (from 110 to 135 mm). During the warm period, precipitation due to the high evaporation rate does not contribute to soil moisture and is either infiltrating or evaporating. The average long-term evaporation value from the vegetated surface is 650 mm and, from the Aksu River water, the surface is 1050 mm. The river width in the research area is 40–50 m. The average hydraulic slope is 0.0005. The absolute height (from sea level) of the river bottom at the western border of the site is 411.6 m, and that at the eastern border is 427.9 m. The depth of the river in this area varies from 0.9 to 1.5 m and from 0.6 to 1.15 m, respectively, depending on the annual precipitation amount (Figure 2).
Based on the Kazakh Hydrometeorological Survey Matai hydrological station data from 1999 to 2020, the Aksu River average annual water flow rate in the experimental research site was calculated as 25 m3/s (0.6 km3/year) at 25% probability, 15 m3/s (0.45 km3/year) at 50% and 8 m3/s (0.25 km3/year) at 75% probability, respectively. The average long-term flow rate was 18 m3/s, with a maximum equal to 28 m3/s and a minimum equal to 5 m3/s. Floods were observed in May, June, and July, less often in August, with a maximum flow rate of up to 45 m3/s. The river’s water is used for water supply and irrigation. The mineralization of water is 0.3–0.5 g/L, and the composition is bicarbonate calcium.
The Aksu experimental site is geomorphologically a flat fluvial plain consisting of the main channel, banks, a floodplain with several terraces, a flat accumulative takyr-like plain, a shallow sandy plain, and a plain with hilly ridge eolian relief. The soil type distribution is closely related to the climatic, geomorphological, and hydrogeological conditions of the experimental site. River alluvial meadow soils have formed around the Aksu River floodplain and on the low terraces and, to a lesser extent, in the Akozek River. The upper and lower horizons of alluvial meadows have variable soil profiles and textures and are characterized by low humus content and loose structural composition.
In the rest of the study area, gray soils of sandy areas are spread. They are characterized by low thicknesses and low salinity of the soil profile.
To improve pasture infrastructure in the Aksu district by artificial recharge in artificial infiltration basins, a study of the upper aquifers indicated that groundwater levels are nearly 7 m or less. By resizing the water level to the soil capillary fringe, spontaneous irrigation may occur [16]. The relevant aquifers around the Aksu experimental site are shown in Figure 3.
-
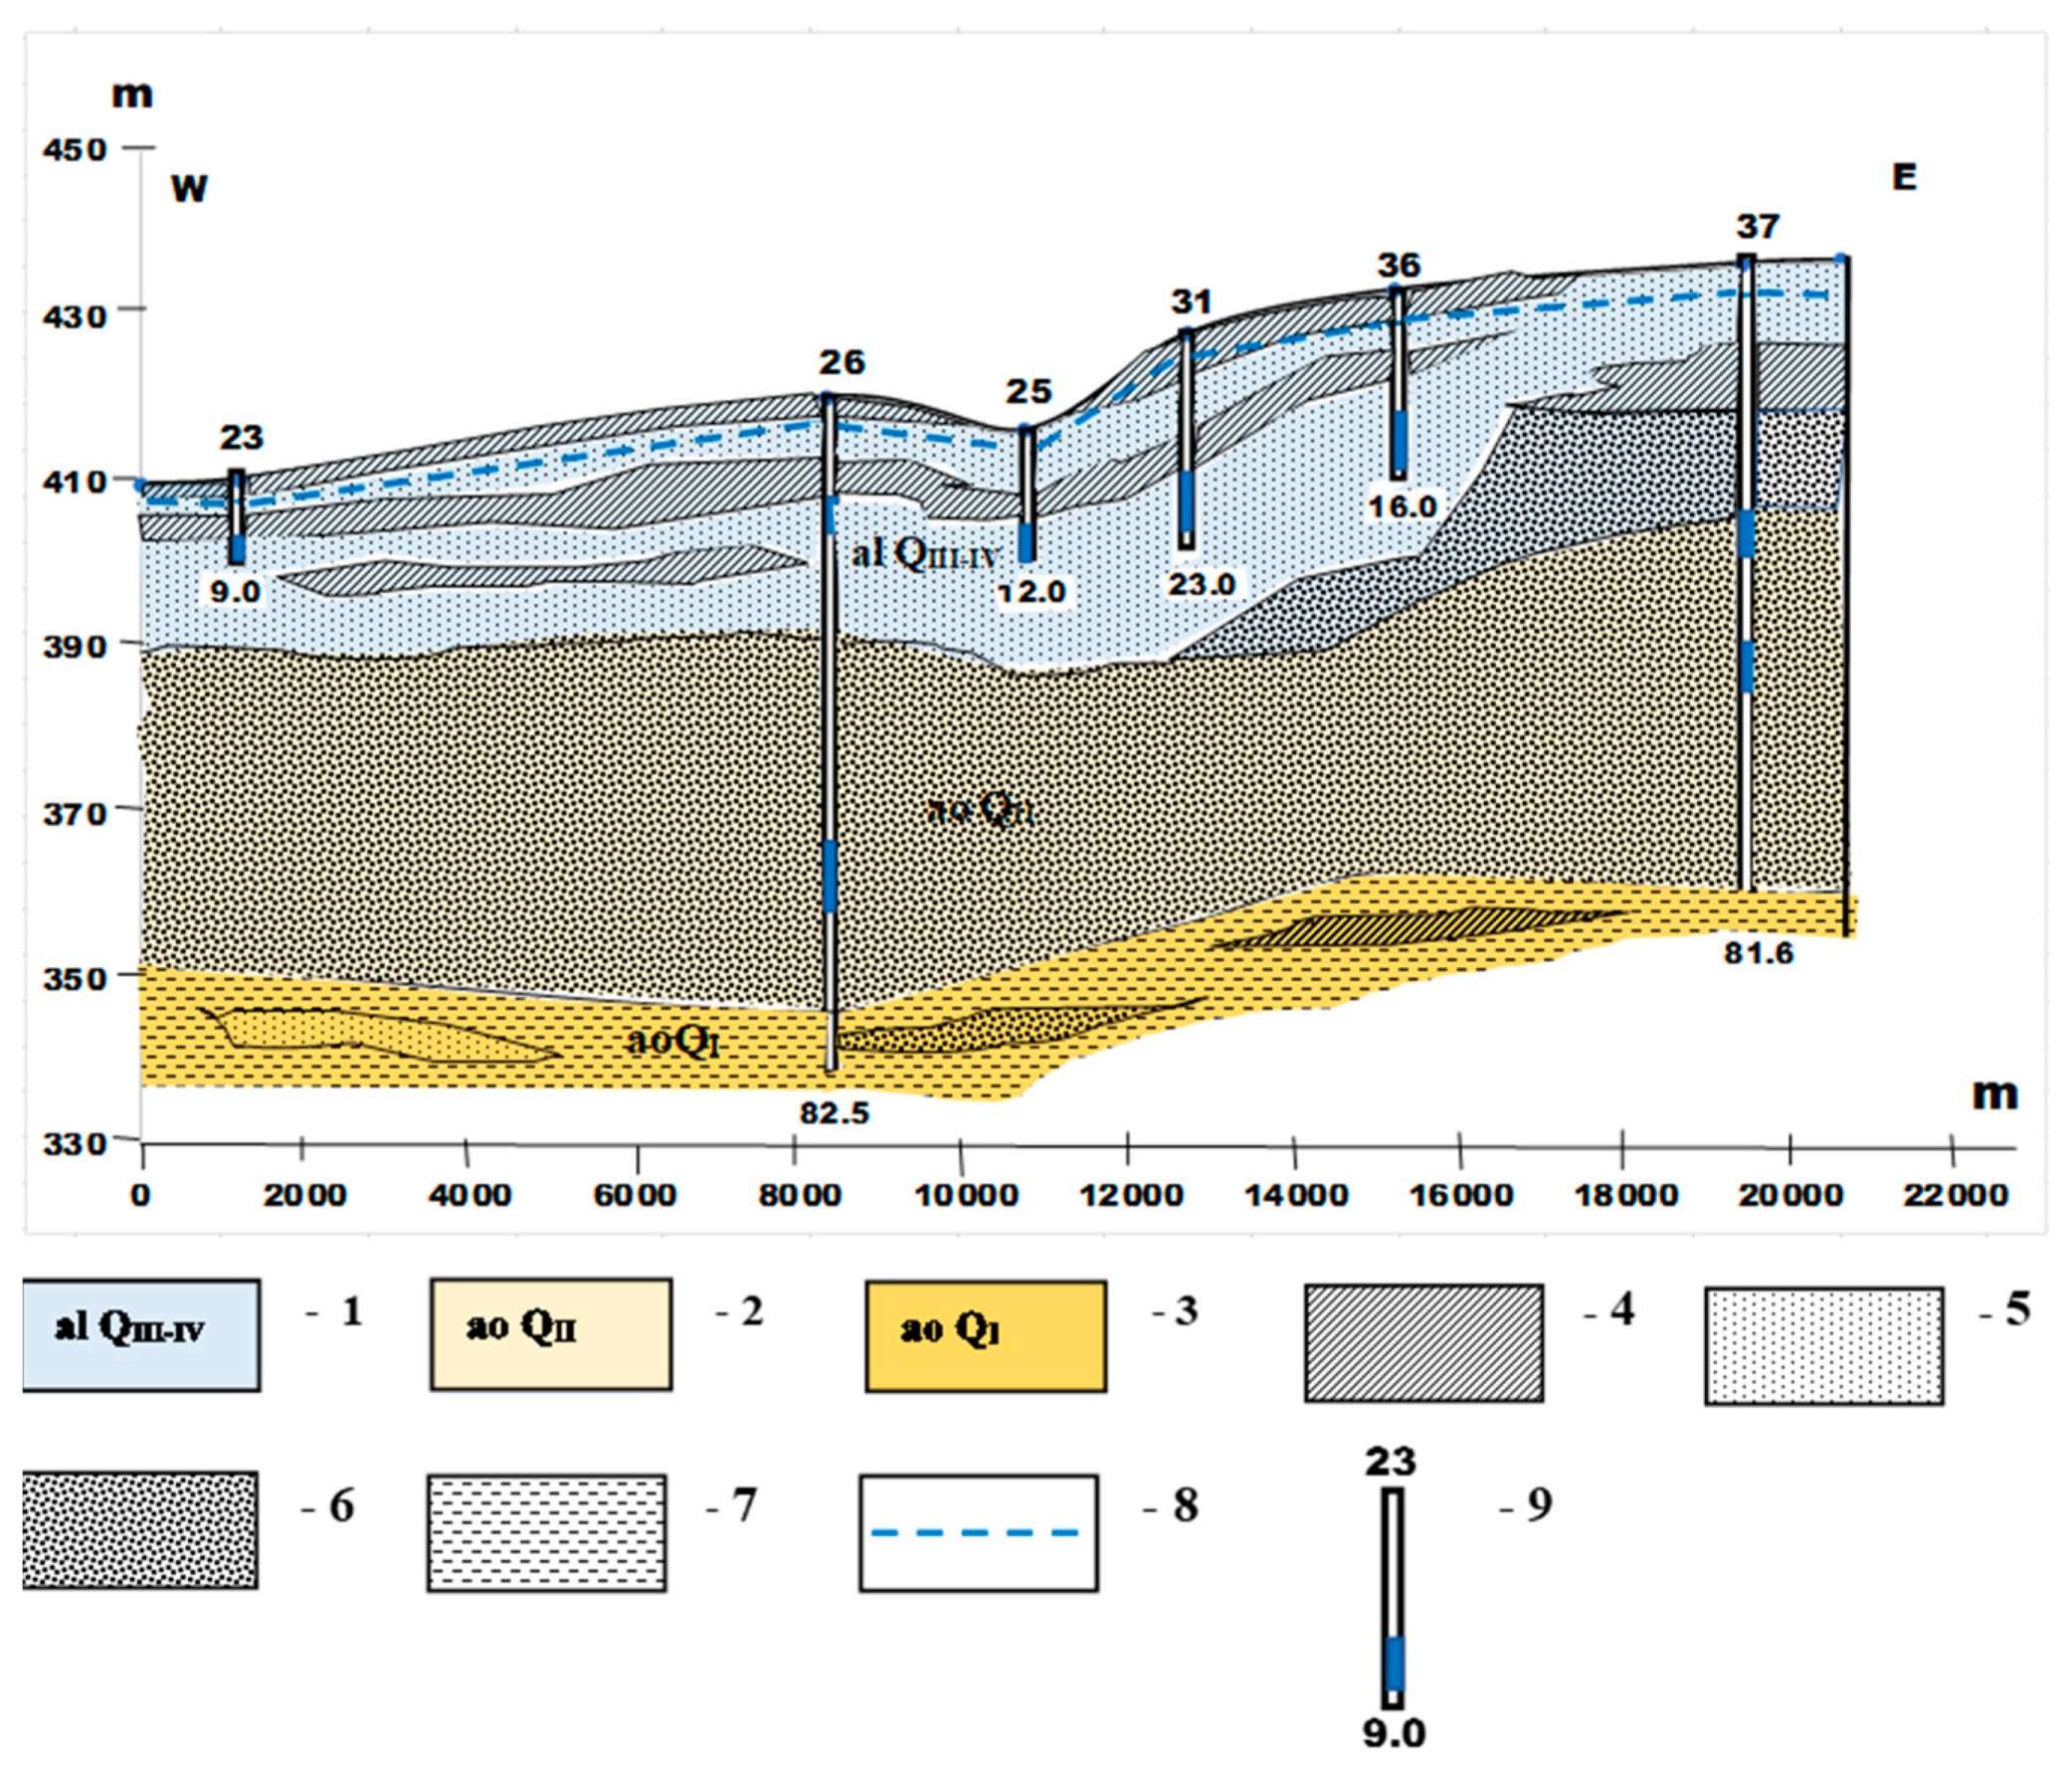
Aquifer of alluvial undivided recent and Upper Quaternary deposits (al QIII–IV), represented by sands, sandy loams, sandy gravel–pebble deposits with interlayers of loams, clays, and siltstones, and aquifer thickness that varies from 15 to 35 m. The groundwater level depth varies from 3 to 5 m in the spring and from 5 to 7 m in the summer. The groundwater salinity does not significantly change during the year and is up to 1 g/L TDS, with a predominant bicarbonate sulfate sodium composition. The hydraulic conductivity coefficient is 3.15–4.5 m/day. The water well discharge rate during experimental airlift pumping was 0.6–0.9 L/s with groundwater level drawdown equal to 1.5–2.5 m.
-
Aquifer of alluvial-lacustrine Middle Quaternary (QA) deposits, represented by fine and uneven-grained sands, loose, weakly cemented sandstones with interlayers of thin loams and clays. The aquifer thickness increases from 40 m closer to the Aksu riverbed to 100 m in the direction of the Akozek River. The groundwater level depth varies from 3 to 4 m in the spring and from 4 to 7 m in the summer. The groundwater salinity ranges from 1 to 2 g/L in the northern part of the study area to 2 to 2.5 g/L near the Akozek River. Groundwater has the prevailing sodium bicarbonate chloride and sodium bicarbonate chloride composition. The hydraulic conductivity coefficient of the deposits is 1.6–2.5 m/day. The water discharge rate of wells during experimental airlift pumping was 0.2–0.9 L/s with groundwater level drawdown equal to 1.0–3.2 m.
-
Aquifer of lacustrine-alluvial Lower Quaternary sediments (ao QI), represented by silty sandy loam and clays with lenses of fine, rarely medium-grained sands, located in the extreme eastern part of the experimental area with hilly ridge eolian relief. The thickness of the aquifer varies from 50 to 75 m. The groundwater level depth varies from 2 to 5 m in the spring and from 3 to 7 m in the summer. The groundwater salinity ranges from 1 to 2 g/L with a predominant bicarbonate sodium chloride composition. The hydraulic conductivity coefficient of the deposits is 1.3–1.5 m/day. The water discharge rate of wells during experimental airlift pumping was 0.5 L/s with groundwater level drawdown equal to 2.0 m.
All the above-described aquifers are hydraulically connected and represent, overall, a single unconfined groundwater complex. The groundwater flow’s general direction coincides with the northwest relief slope in the direction along the Aksu and Akozek rivers. The flow line direction near the Aksu River characterizes the groundwater recharge areas from and to the river. The Akozek River does not practically affect the groundwater flow direction, and its confluence with the Aksu River is only in the study area. The groundwater hydraulic gradient ranges from 0.0005 in the eastern and western areas of the site to 0.0027 in the central part of the site, depending on the topographic conditions and the total aquifer transmissivity. The groundwater depth from the soil surface varies from 1 to 2 m near the Aksu riverbed, and at the site central part in the interfluve of the rivers, it is characterized by groundwater depths from 1.5 to 2.5 m; in the rest of the area, the groundwater depth is from 2.5 m to 4–5 m.

2.2. Research Methodology and Procedure

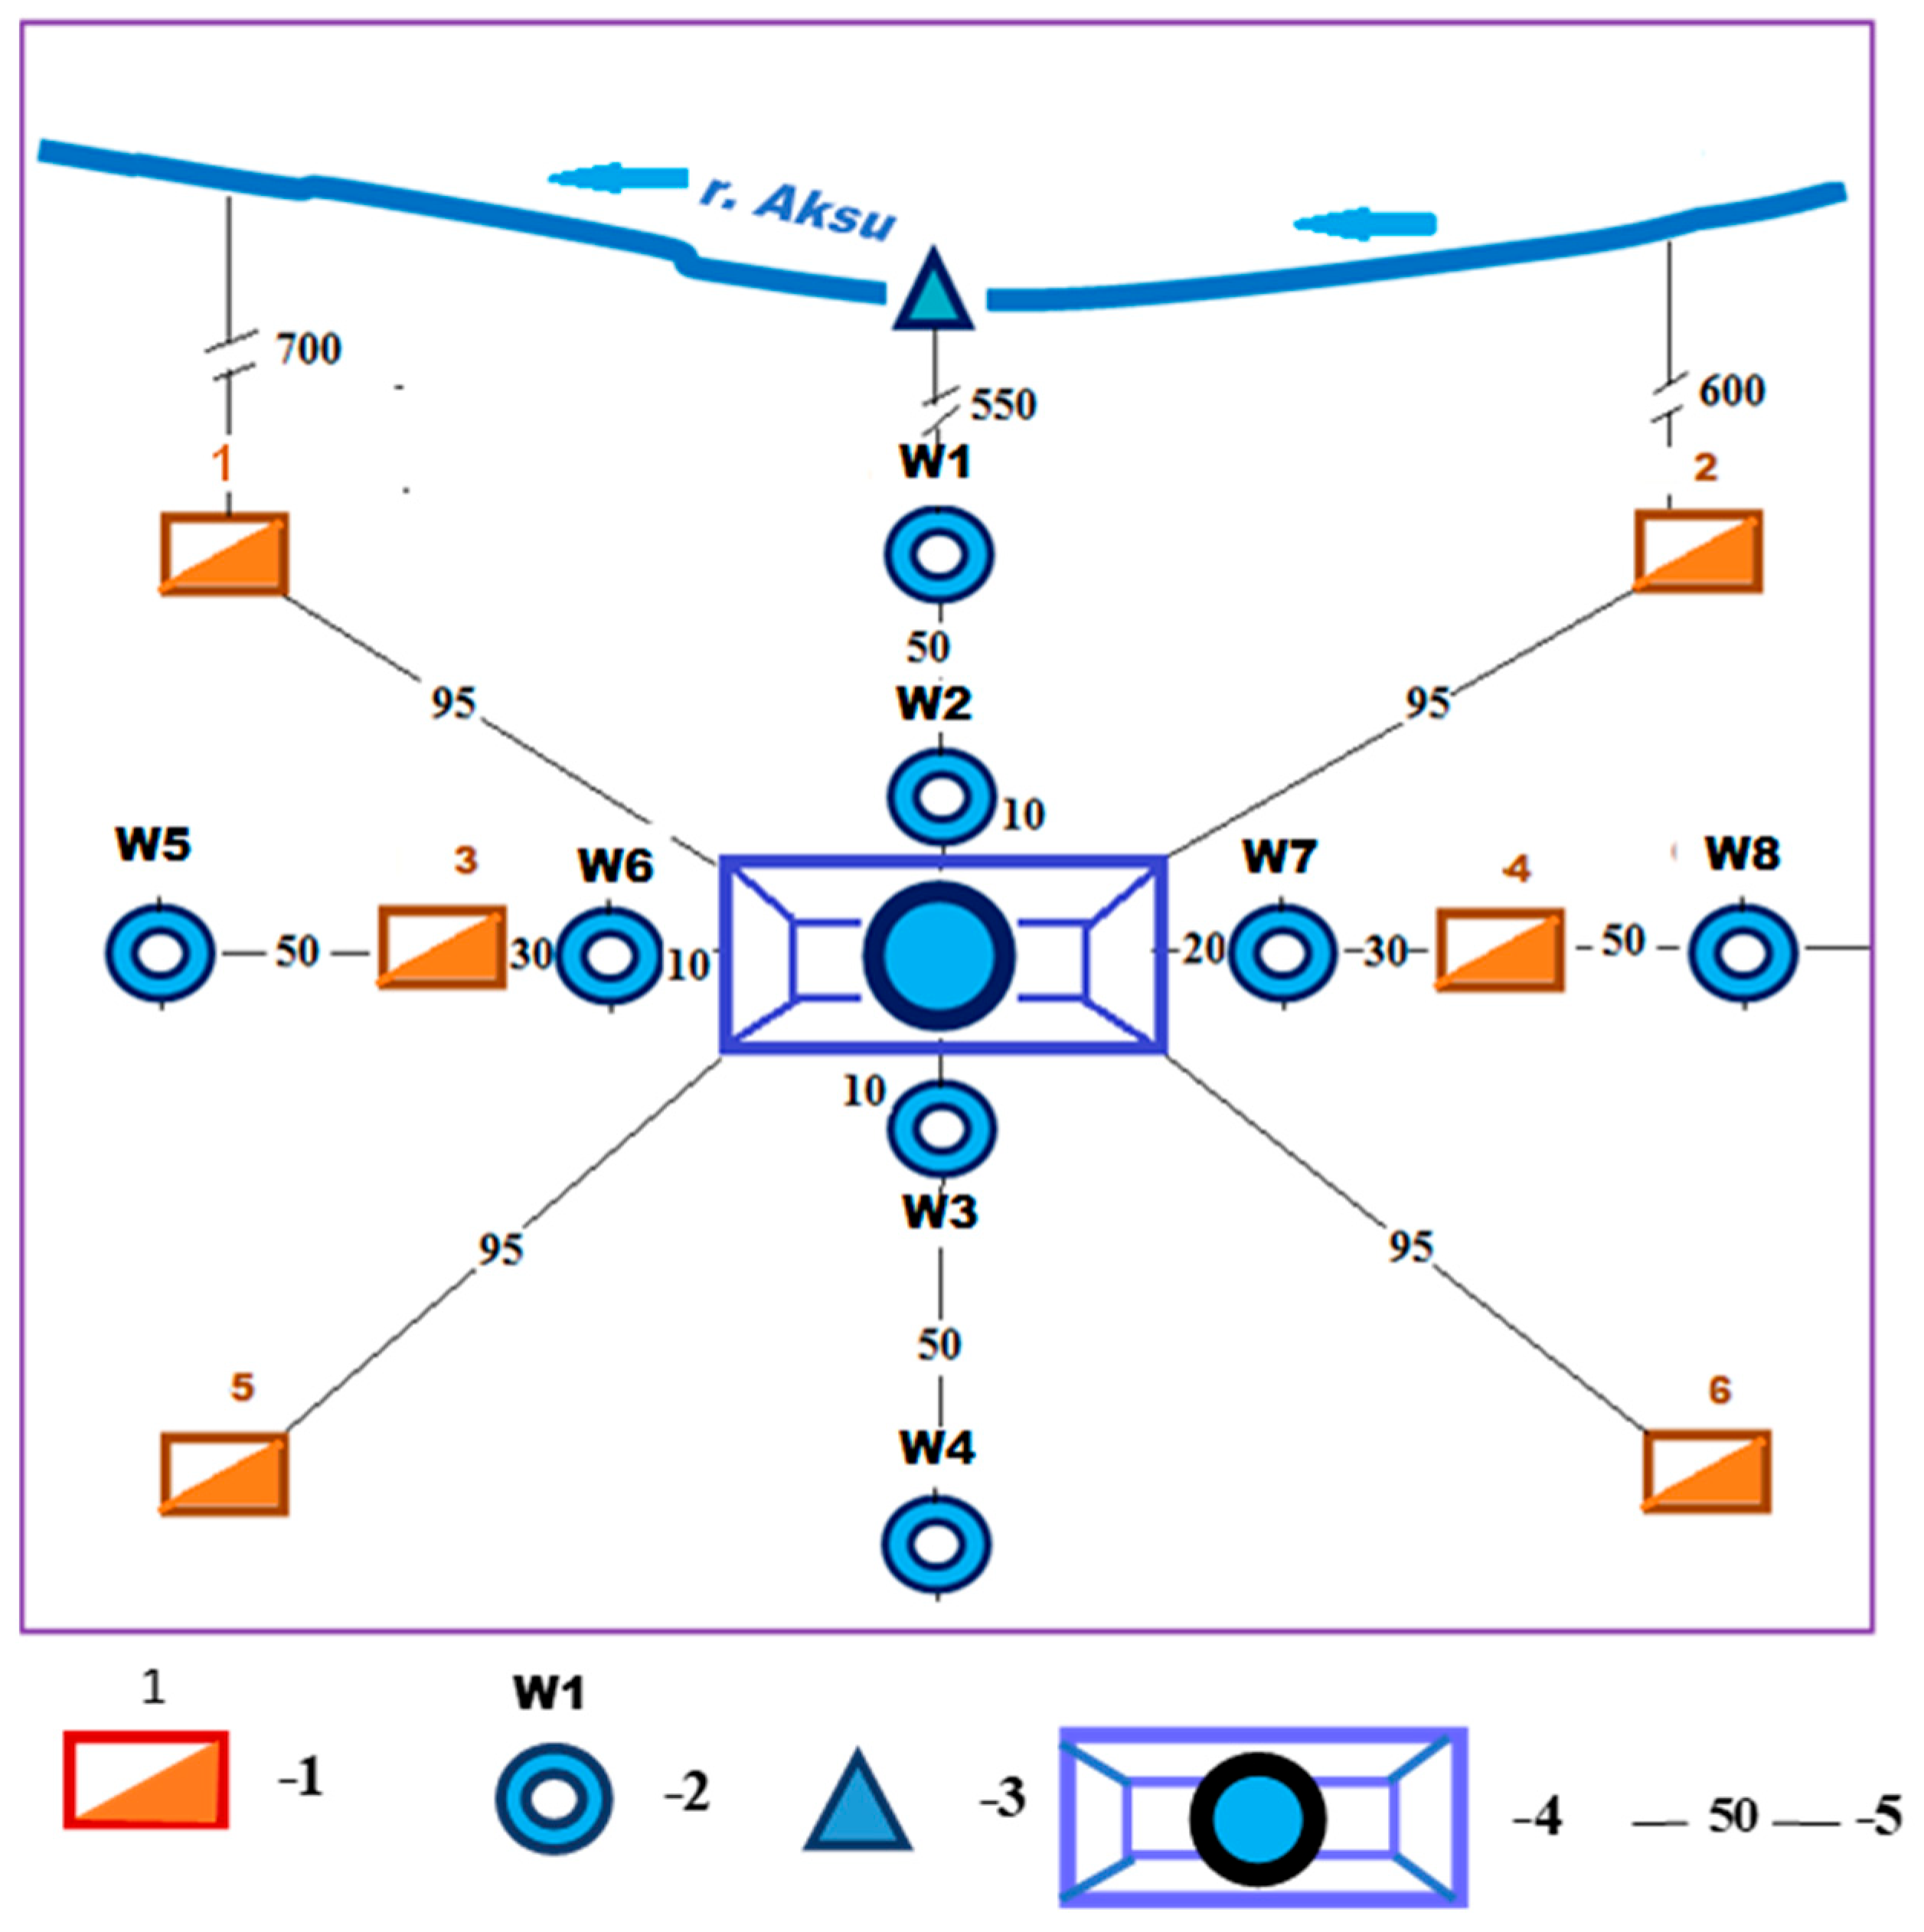
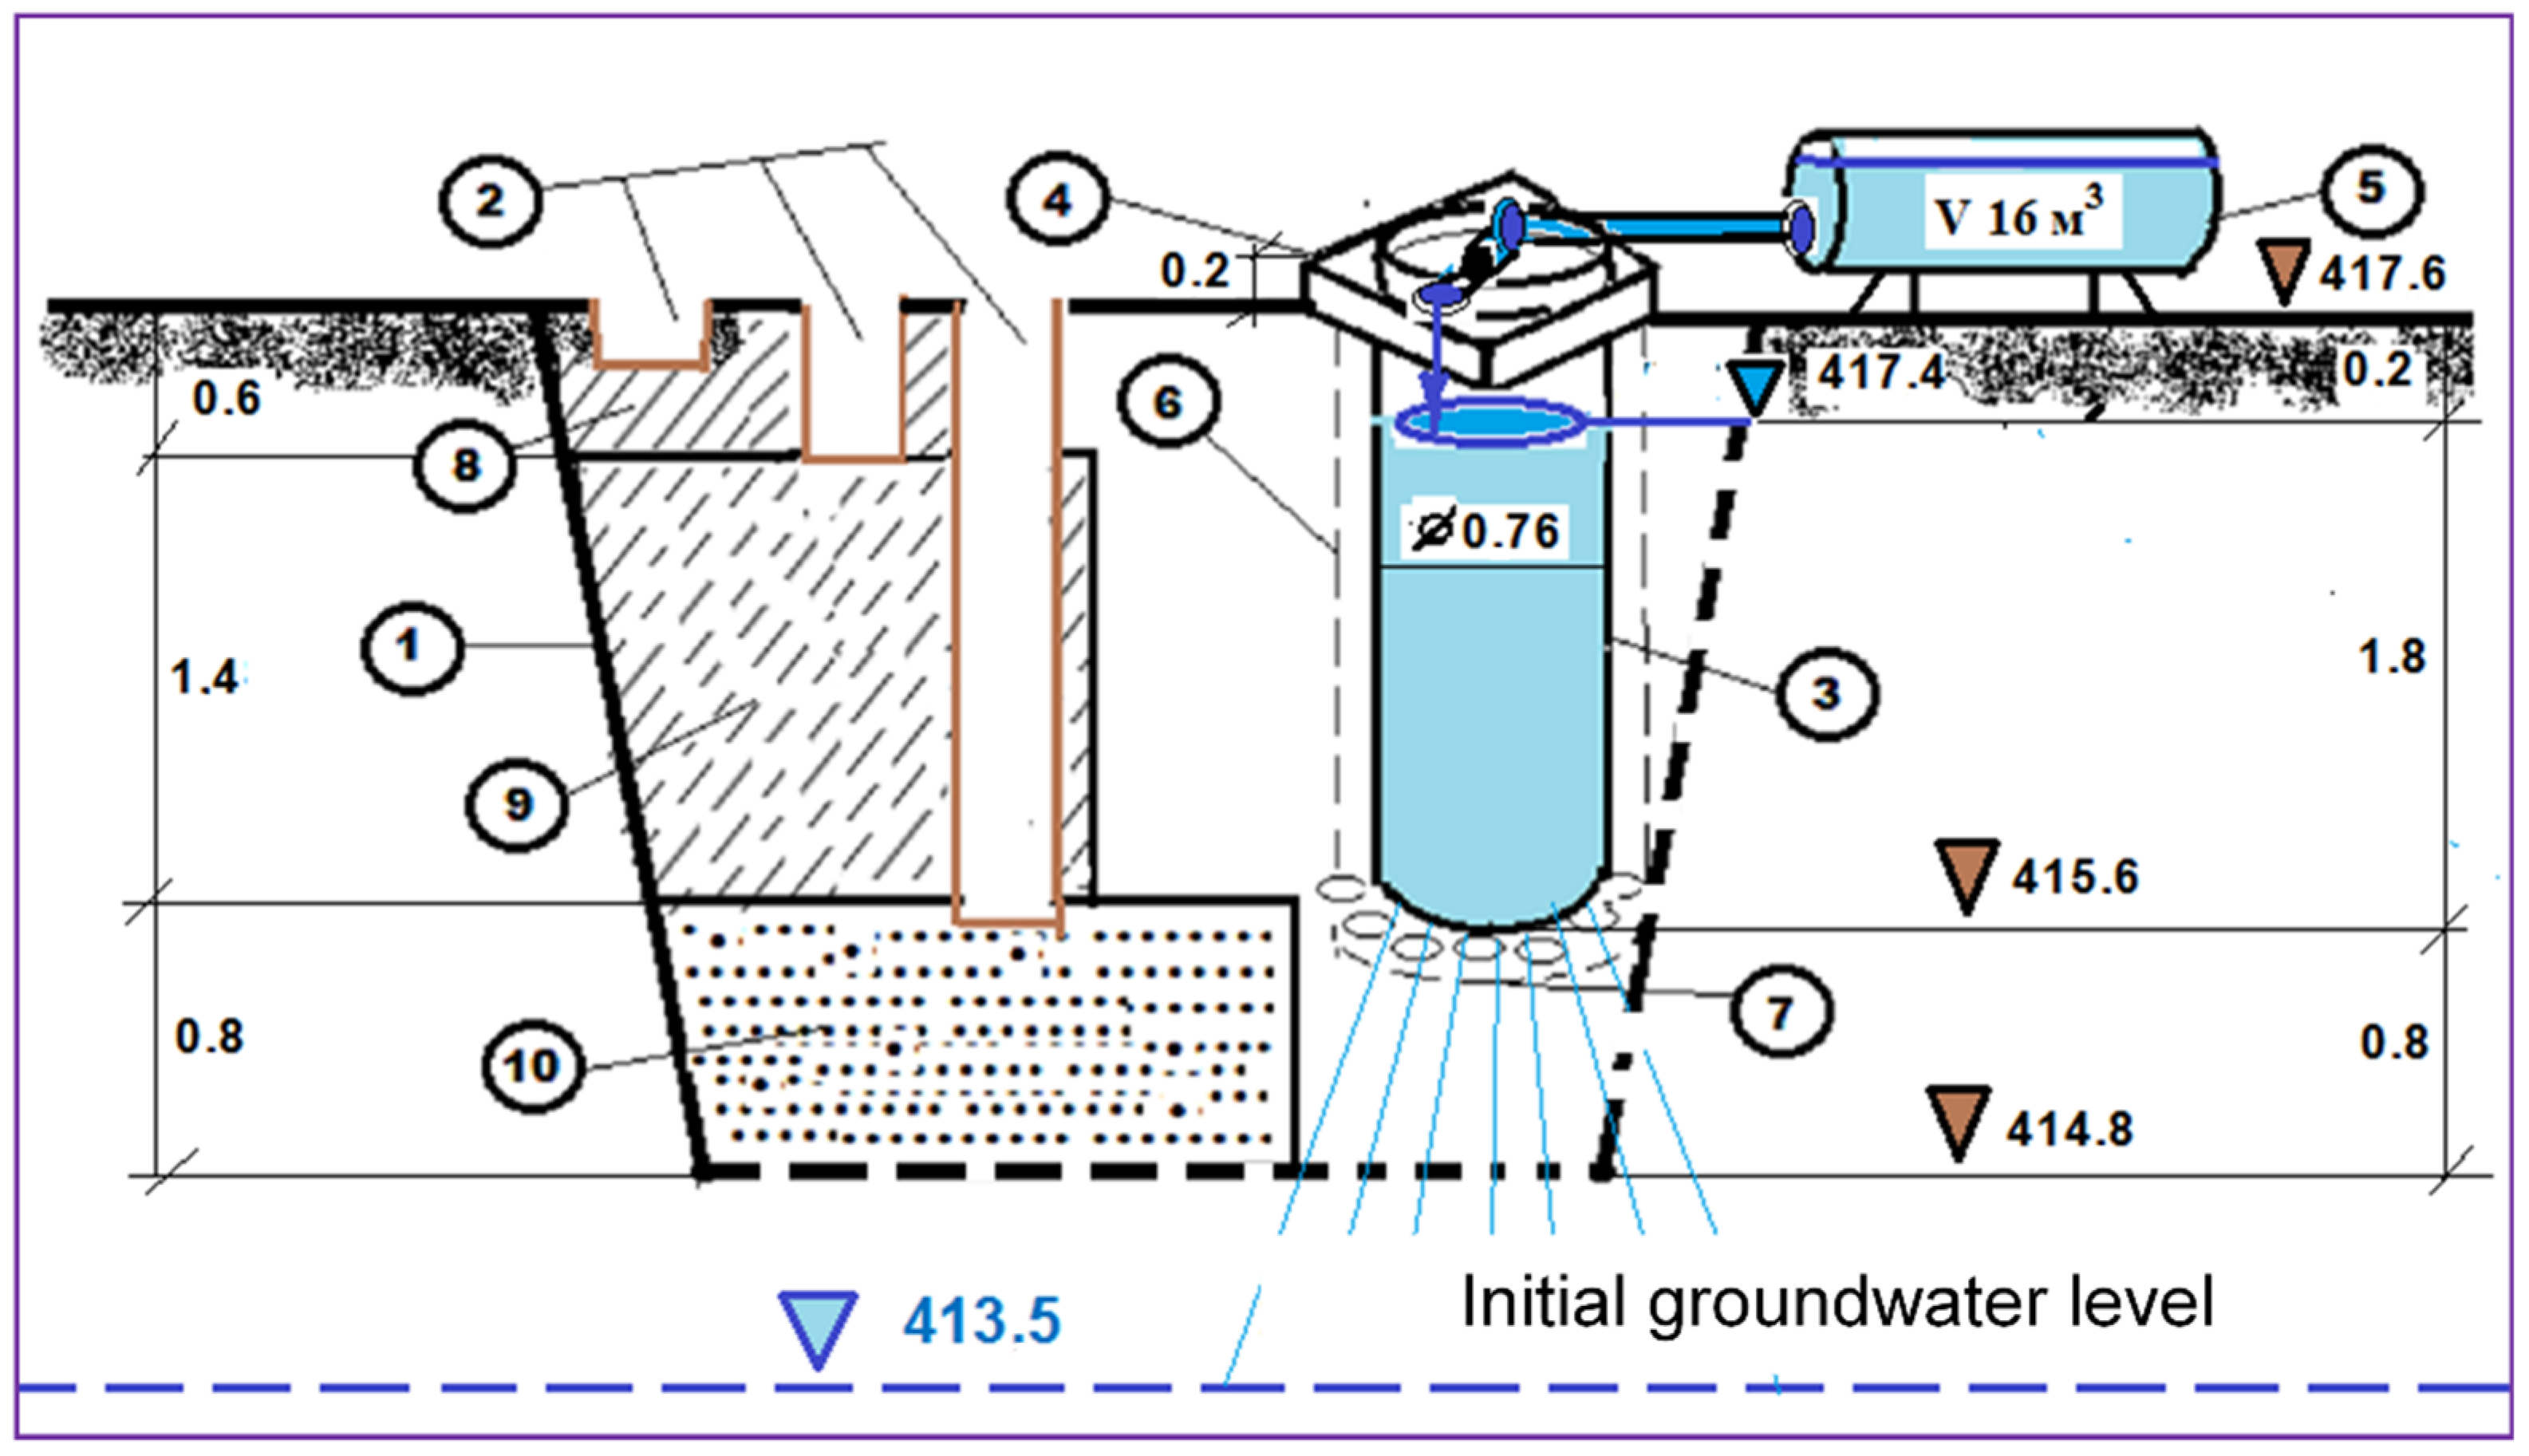
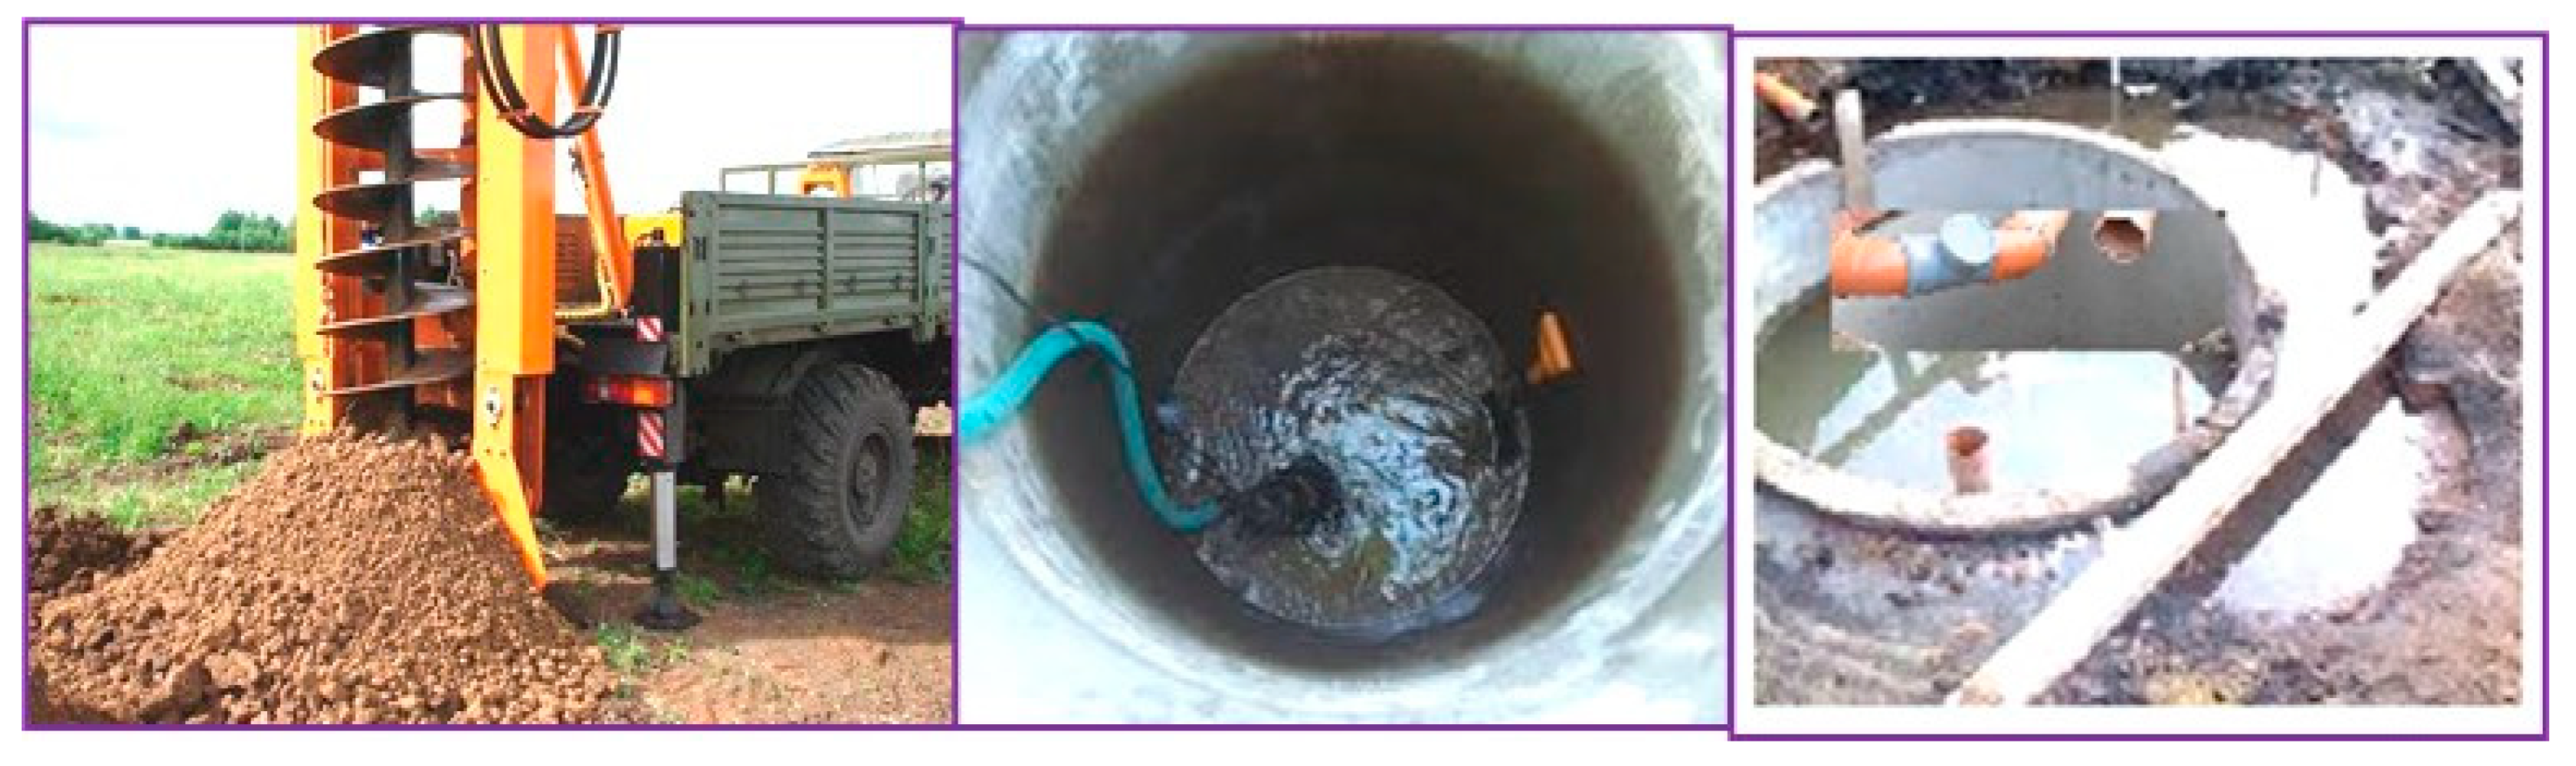
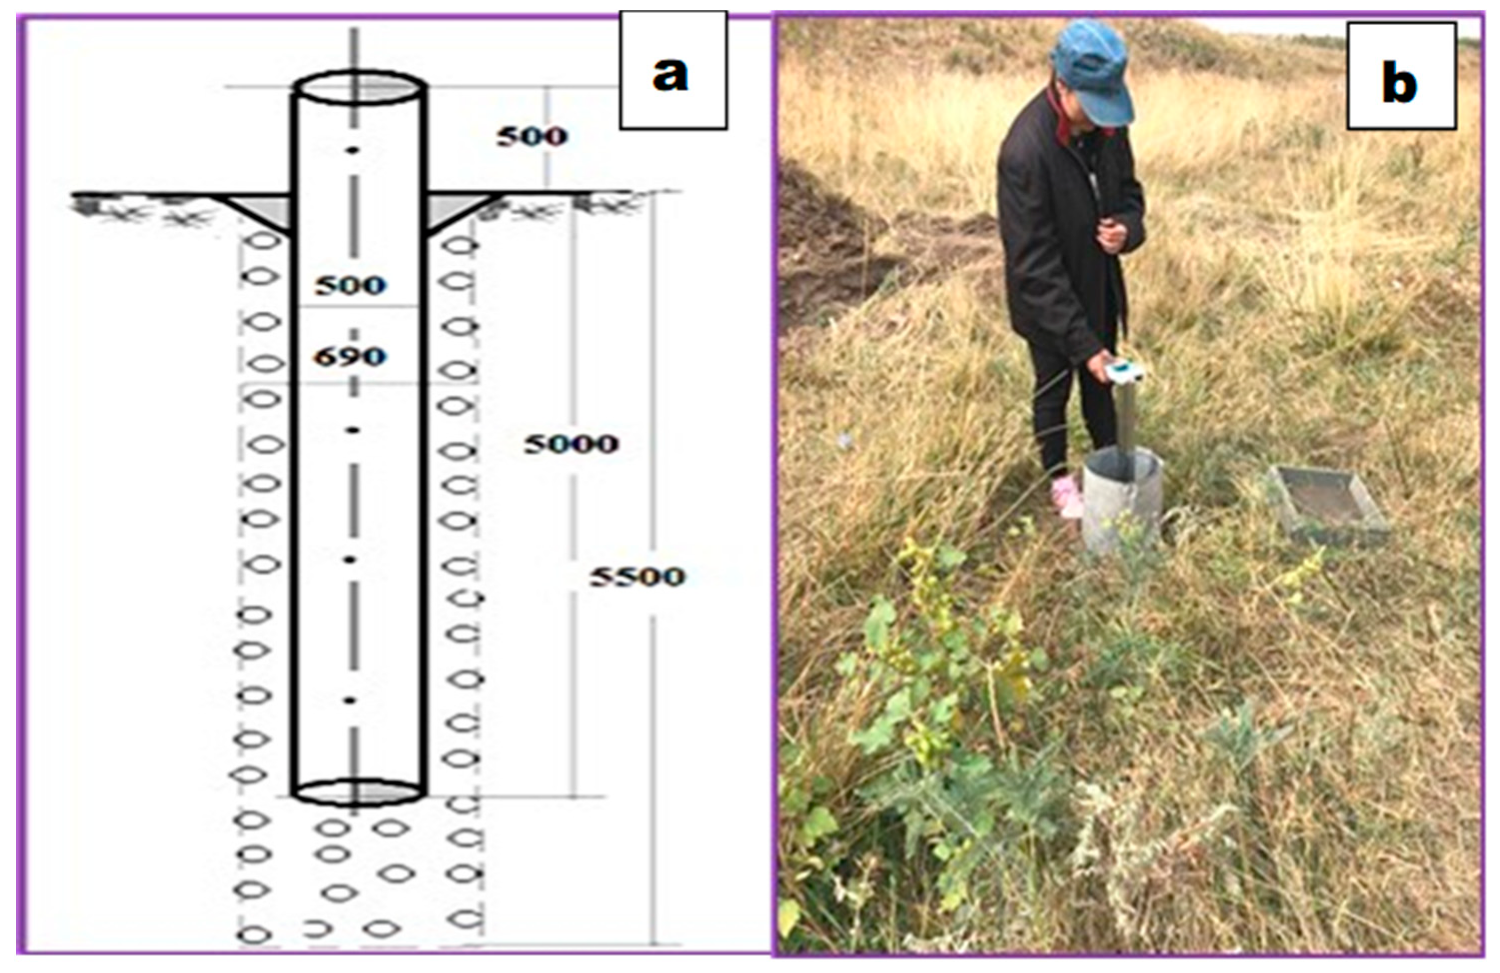
2.2.1. In Situ Research Site Organization

The upper aquifer with GAR potential in southeast Kazakhstan is narrow and built from low-permeability sediment cover; as such, open infiltration pools seem most applicable; nevertheless, almost no scientific or applied research has been done in the region. For the GAR system simulation, including infiltration and clogging process analysis, the field study included four similar mini pool infiltration systems across the experimental site. In each system, the field geological engineering and hydrogeological works included pits, drilling, sampling soils, and unsaturated zone sediments. Surface waters of the Aksu River, which are the source of groundwater resource replenishment, as well as the samples collected, were analyzed in the hydrological laboratory (Figure 4).
The infiltration mini pool system was divided into two sections (Figure 5) on the left, and three pits designated for the sequential study were used for water-physical, physical-mechanical, and filtration property measurements of lithological differences in the soil profile with undisturbed structure. On the right, an asbestos-cement pipe with an internal metal core with a diameter of 760 mm and a length of 2200 mm was installed to ensure the largest infiltration area (0.44 m2) while maintaining a constant water level (0.2 m) and a water column (1.8 m).
The infiltration well was drilled mechanically using a rotary drilling rig with a large diameter auger (960 mm), followed by a casing with an asbestos-cement pipe 760 mm in diameter and filling the bottom with an optimal gravel mixture with a diameter of 15 mm (Figure 6).
As a loading tank for river water with its preliminary settling, a metal tank with a volume of 16 m3 was used, installed on metal supports at a height of 1.0 m. The tank was periodically filled from the Aksu River at a gauging station using an auto-water transporter. The drip system with a set of float valves was mounted on the head with a stop valve to ensure an automated and fixed water supply to the mini pool at the constant water level (water column 1.8 m) while conducting research.
The pits for determining the unsaturated zone cover sediments’ physical-mechanical and water-physical properties were created by a small excavator and further manual stripping. The temporary gauging station located at the Aksu River cross-section was set up on a section downstream at a sufficient distance to reduce the unsteady water movement negative effect; this still water strip also enabled cable-boat crossing. Constant water turbidity sample collection spots in the vertical profiles of the measurement section were selected. Groundwater regime observation wells were drilled and equipped during the infiltration basin construction operation (Figure 7 and Figure 8). The placement of the observation wells considered the infiltration basin influence zone throughout the entire experimental research area. The minimum aquifer groundwater level below all observation wells was 3–4 m. To assess infiltration, when equipping observation wells, strict isolation of groundwater from surface waters was ensured, and coarse sand and fine gravel were added to the bottom of the piezometer.

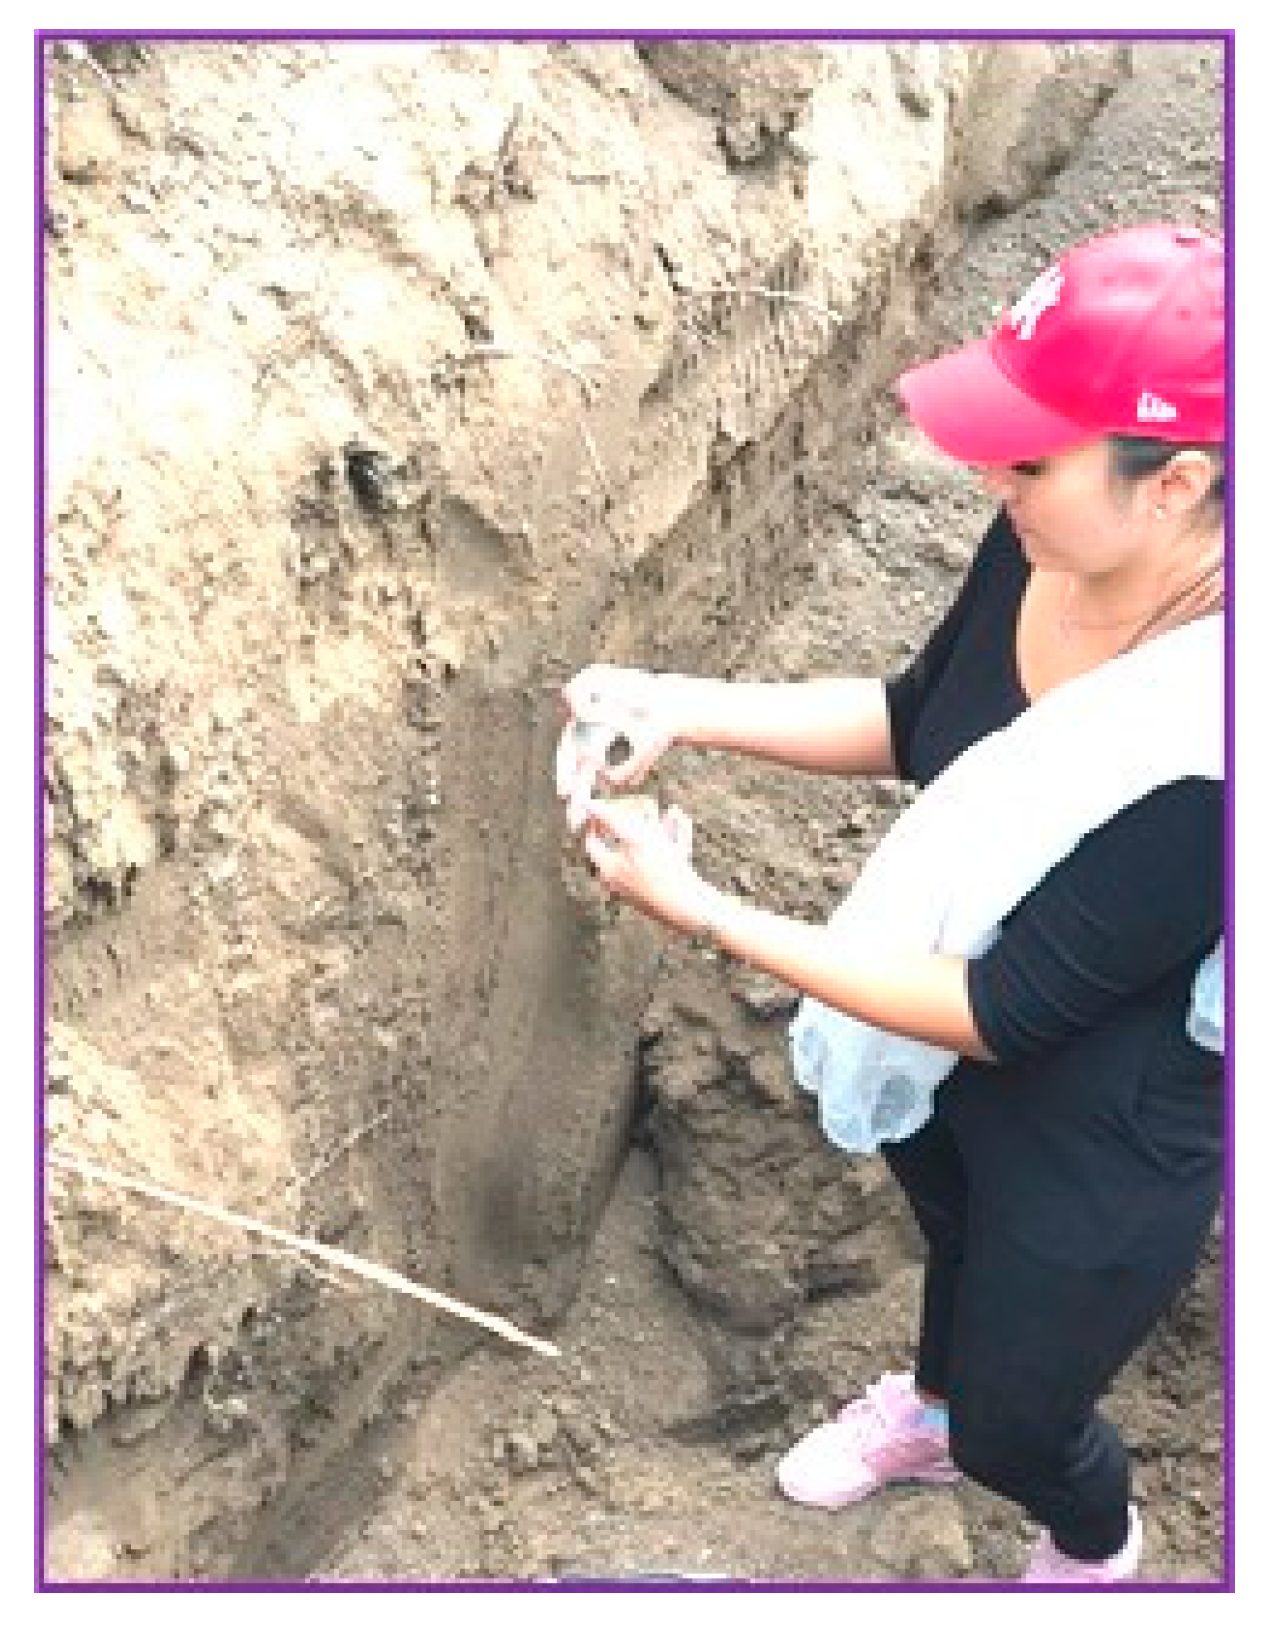
2.2.2. Field Measurements, Sampling, and Laboratory Analysis

Sediment sampling of each genetic soil horizon of the unsaturated zone overburden included undisturbed structures taken into bins (Figure 8). Sediment bulk density, natural weighting moisture, and maximum molecular moisture capacity were determined using the Litvinov field laboratory [17].
The sediment sample mechanical components are based on particle size analysis using sieve, aerometric, and pipette methods [18,19]. To determine the mechanical composition of the cover sediments, the following fraction sizes were measured (in mm): coarse gravel 7–5, fine gravel 5–2; sand is very coarse 2–1, coarse 1–0.5, medium 0.5–0.25, fine 0.25–0.10, fine-grained 0.10–0.05, dust 0.05–0.005; clay < 0.005. Water percolation tests in mono- and double-ring infiltrometers assessed the pit’s soil and unsaturated zone hydraulic conductivity in steady and unsteady filtration regimes [20]. The tests were continued until the flow rate stabilized. In the course of the experiments, a graph of the flow rate over time was built [21,22]. Figure 9 illustrates the water percolation test performed for poorly permeable soils (loam), and Figure 10 shows the test performed for permeable soils (sand with gravel).
The hydraulic conductivity coefficient (k) was calculated according to Formula (1) [22]:
k = Q*Z/W*(Hc + Z + h)
where:
Q—the stabilized flow rate along the inner ring, m3/day;
Z—the depth of infiltration seepage of water under the bottom of the pit, determined after the end of the experiment according to the soil moisture content, m;
W—the area of the inner ring, m2;
Hc—the capillary pressure, which is equal to 50% of the height of the capillary rise in the tested soil, m;
h—the constant high of the water column in the rings, m.
To determine the volumetric soil moisture in the unsaturated zone, each of the pits (Figure 4) was filled with Aksu River water using a measuring tank with a volume of 2 m3 equipped with a float system and a flow meter. Studies were carried out separately for each lithological sediment layer to obtain reliable characteristics. The water flow rate measurements were carried out for 78 h with the following intervals: at the beginning of the research, after 8, 12, and 24 h, and then at the end of the experiments. At the same time, undisturbed structure soil sampling of the water-percolated zone was carried out to determine the volumetric soil moisture.
The surface water infiltration rate and volume from the mini pools into the underlying aquifer were measured in the observation wells. The groundwater level was measured in the observation wells simultaneously with the water temperature. The measurement procedure was conducted by the following scheme: in March and April, when an unsteady regime and high infiltration rate were observed, the groundwater level measurements were carried out after 15, 30, and 45 min, then after 1.4, 6, and 8 h, and then after 15 days; in May and June, when unsteady infiltration regimes with insignificant changes in infiltration velocity were observed, groundwater level measurements were carried out once every 7 days; from July to November, when a lowering in the infiltration rate with a constant amplitude was observed, the groundwater level measurements were also carried out once every in 7 days. The total number of measurements was 332.
The main anion contents (HCO3, SO4− −, Cl) and cations (Ca++, Mg++, and Na+) indicated the groundwater chemical composition. According to the degree of groundwater salinity, it was classified as fresh (salt concentration up to 1 g/dm3), slightly saline (1–3), highly saline (3–5), and salty (more than 5). Groundwater chemical composition characterization was carried out using the Kurlov formula method [23], where the chemical composition is expressed by a major anion and cation quasi-fraction with numerator and denominator, respectively [24]. Determination of the chemical composition and groundwater salinity sampled from observation wells was carried out in the Zonal Hydrogeological-Ameliorative Center of the Ministry of Agriculture and Satbayev University, Republic of Kazakhstan laboratories. In the newly dug observation wells, groundwater sampling was carried out four times: 1 March, 12 June, 18 August, and 30 October. In the Aksu research site, at existing observation wells No. 23, 26, 25, 31, 33, 36, 37, 42, and 43, groundwater sampling was carried out three times: 1 March, 18 August, and 30 October. Sampling from observation wells was carried out after their preliminary pumping. At least 2–3 volumes of the water column in the well were pumped out of the well. After pumping out, the water level was restored.
During the infiltration mini pool sediment culmination process study, Aksu River water sampling and subsequent preparation for turbidity analysis were carried out once a month from April to September in 2018, 2019, and 2020. Turbidity instantaneous value measurements were carried out by the photometric method using a portable turbidity meter (Turb 355 T/IR WTW-operating manual, 2020) during water sampling and with control laboratory analyses using the gravimetric method [25]. The corresponding photometric and gravimetric water turbidity values involved optical density calibration with prepared kaolin suspensions with concentrations of 0.5, 1.0, 1.5, 2.0, 3.0, 4.0, and 5.0 mg/L. The optical density dependence on turbidity was determined on a spectrophotometer at a wavelength of 530 nm, producing an optical density to gravimetric turbidity calibration graph [26].

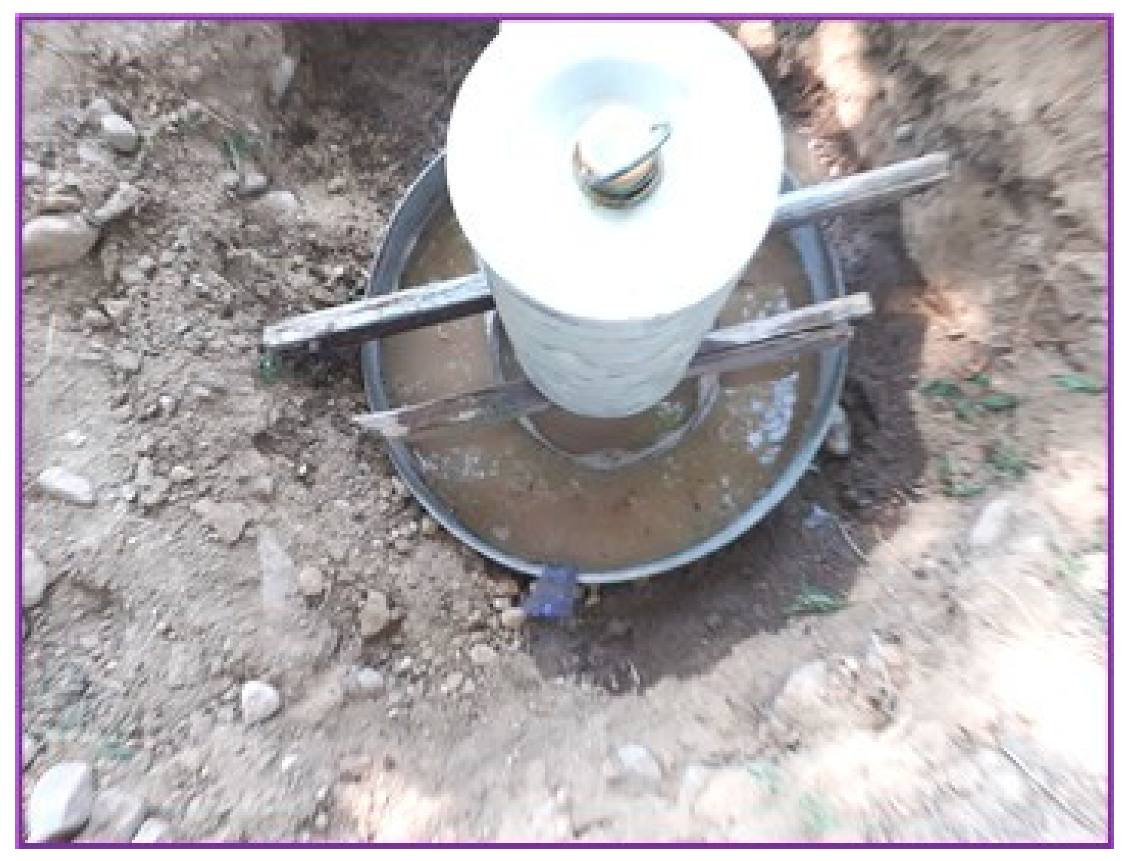
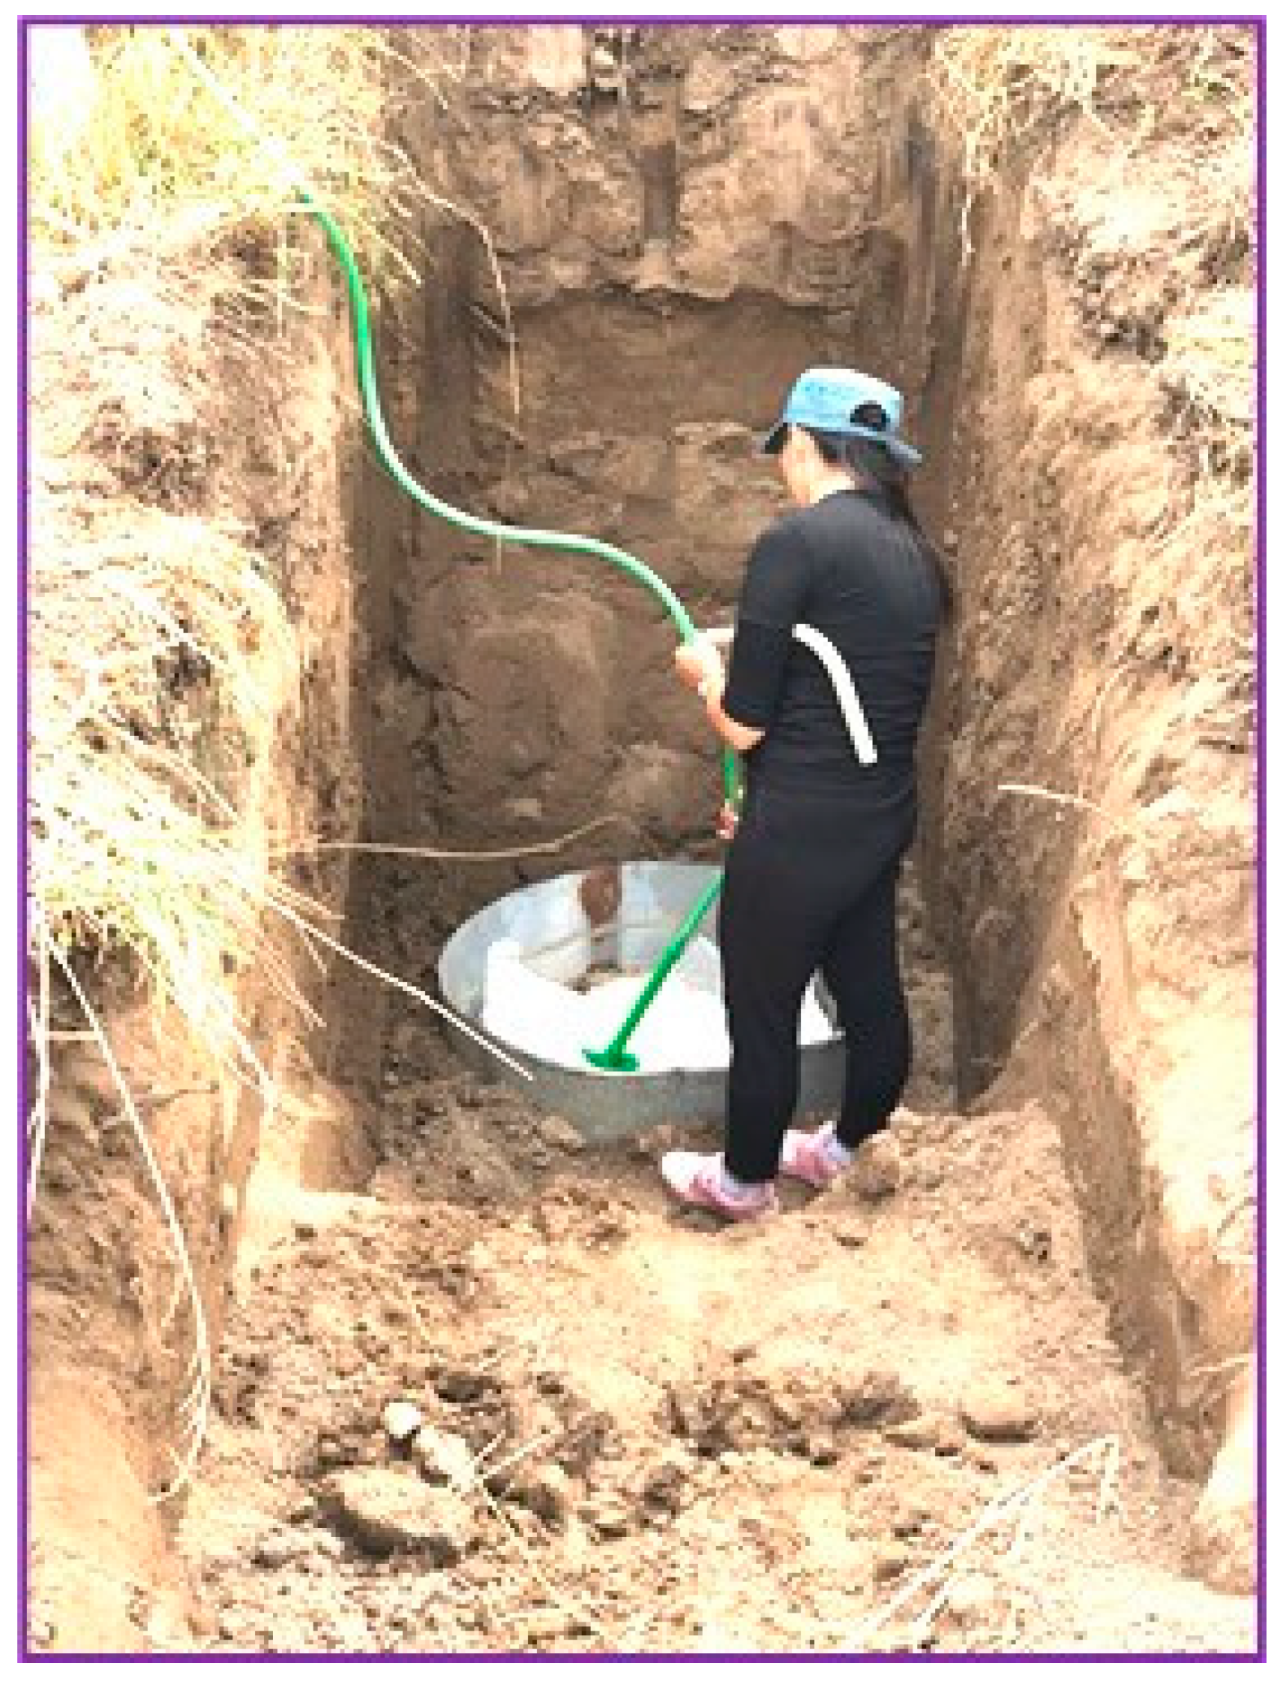
2.2.3. Field Test Infiltration from Mini Pools

The infiltration rate and clogging process experiments were carried out for each of the four mini pool sites separately in the period from 2017 to 2020. The water percolation tests were carried out while maintaining a constant water column of 1.8 m in an infiltrometer with a diameter of 760 mm and an infiltration area equal to 0.44 m2. The water supplied was preliminarily settled in a 16 m3 settling tank installed at a height of 1 m. During the experiments, in addition to water consumption measurements, water turbidity, silty sediment skeleton thickness, and bulk mass were also determined. These are the initial parameters for calculating water percolation under clogging conditions. The infiltration rate was determined as the supplied water flow rate ratio to the infiltration area where the infiltrometer was maintained at a constant water level. Mini pools used for percolation tests were located at different distances from the Aksu riverbed and have differences in lithological patterns and distribution of soil-water parameters. Temporal tests were carried out during the research period, characterizing river runoff levels at a probability of 25% to 75% and the different water turbidity characteristics.

2.2.4. Assessment of the Clogging Layer Created during Infiltration Tests

The clogging layer thickness depends on the granulometric composition of soils, their dirt-holding capacity (DHC), the infiltrating water head and turbidity, and also the suspended particles’ granulometric composition [27,28]. Quantitative determination of the mechanical particle content in the sediments formed at the bottom of the infiltration mini pools after filtration cycle completion was performed using the pipette method. When separating the dust and sludge fractions, the particle’s drop rate in water was taken as the basis, i.e., their hydraulic size, which was determined by the Stokes formula [29]. The infiltration mini pool deep clogging duration period for different lithological sediment types was calculated by Formula (2) [30]:
Tk = G/(Vavg*M)
where:
  • Tk—duration of the period of deep soil clogging, days;
  • G—the dirt holding capacity of the soil, kg/m2;
  • Vavg—average infiltration rate for a given period, m/day;
  • M—turbidity of incoming water, kg/m3.
The “dirt holding capacity” parameter, which refers to the ability of porous and fractured sediments to delay and accumulate mechanical thin slurry (turbidity) in the process of water infiltration, has the dimension kg/m2. Numerically, this parameter is equal to the amount of mechanical suspension accumulated in pores or cracks in sediments per unit area of the filtering layer. DHC was determined based on the general balance method of the mass of particles suspended in water entering the infiltration mini pool and was calculated according to Formula (3) [30]:
G = ((Q*T*M)/(1000*F)) − (1000*mo*Ysk)
where:
  • Q—average infiltration rate, m3/day;
  • T—total duration of water supply to infiltration, day;
  • M—turbidity of incoming water, mg/dm3;
  • F—area of the filtering surface, m2;
  • mo—average actual thickness of silty sediment, m;
  • Ysk—silty sediment skeleton bulk density, g/cm3.
The clogging layer thickness was measured immediately after the completion of the infiltration test, and water percolation was completed from the mini pool. The temporal clogging layer formation dynamics at the bottom of the mini pools during the infiltration tests and after its completion was traced and subsequently calculated based on the following relationship (4) [30]:
∆m = (M*q*∆t)/Ysk
where:
  • ∆m—clogging layer thickness formed during period ∆t, m;
  • q—infiltration velocity, m/day;
  • M and Ysk are the same as in Formula (3).

3. Results and Discussion

The effects of infiltration and clogging processes on artificial groundwater recharge may be evaluated by combining several parallel research methodologies [5]. Such integration was demonstrated on a laboratory scale [8] and on a remote sensing scale [4,6] but not on an applicable field scale. The innovative approach presented here utilizes results that were obtained through field measurements of various parallel parameters and, by integrative spatial modeling, enables infiltration capability assessment and the development of a sustainable infiltration pool operation management scheme.

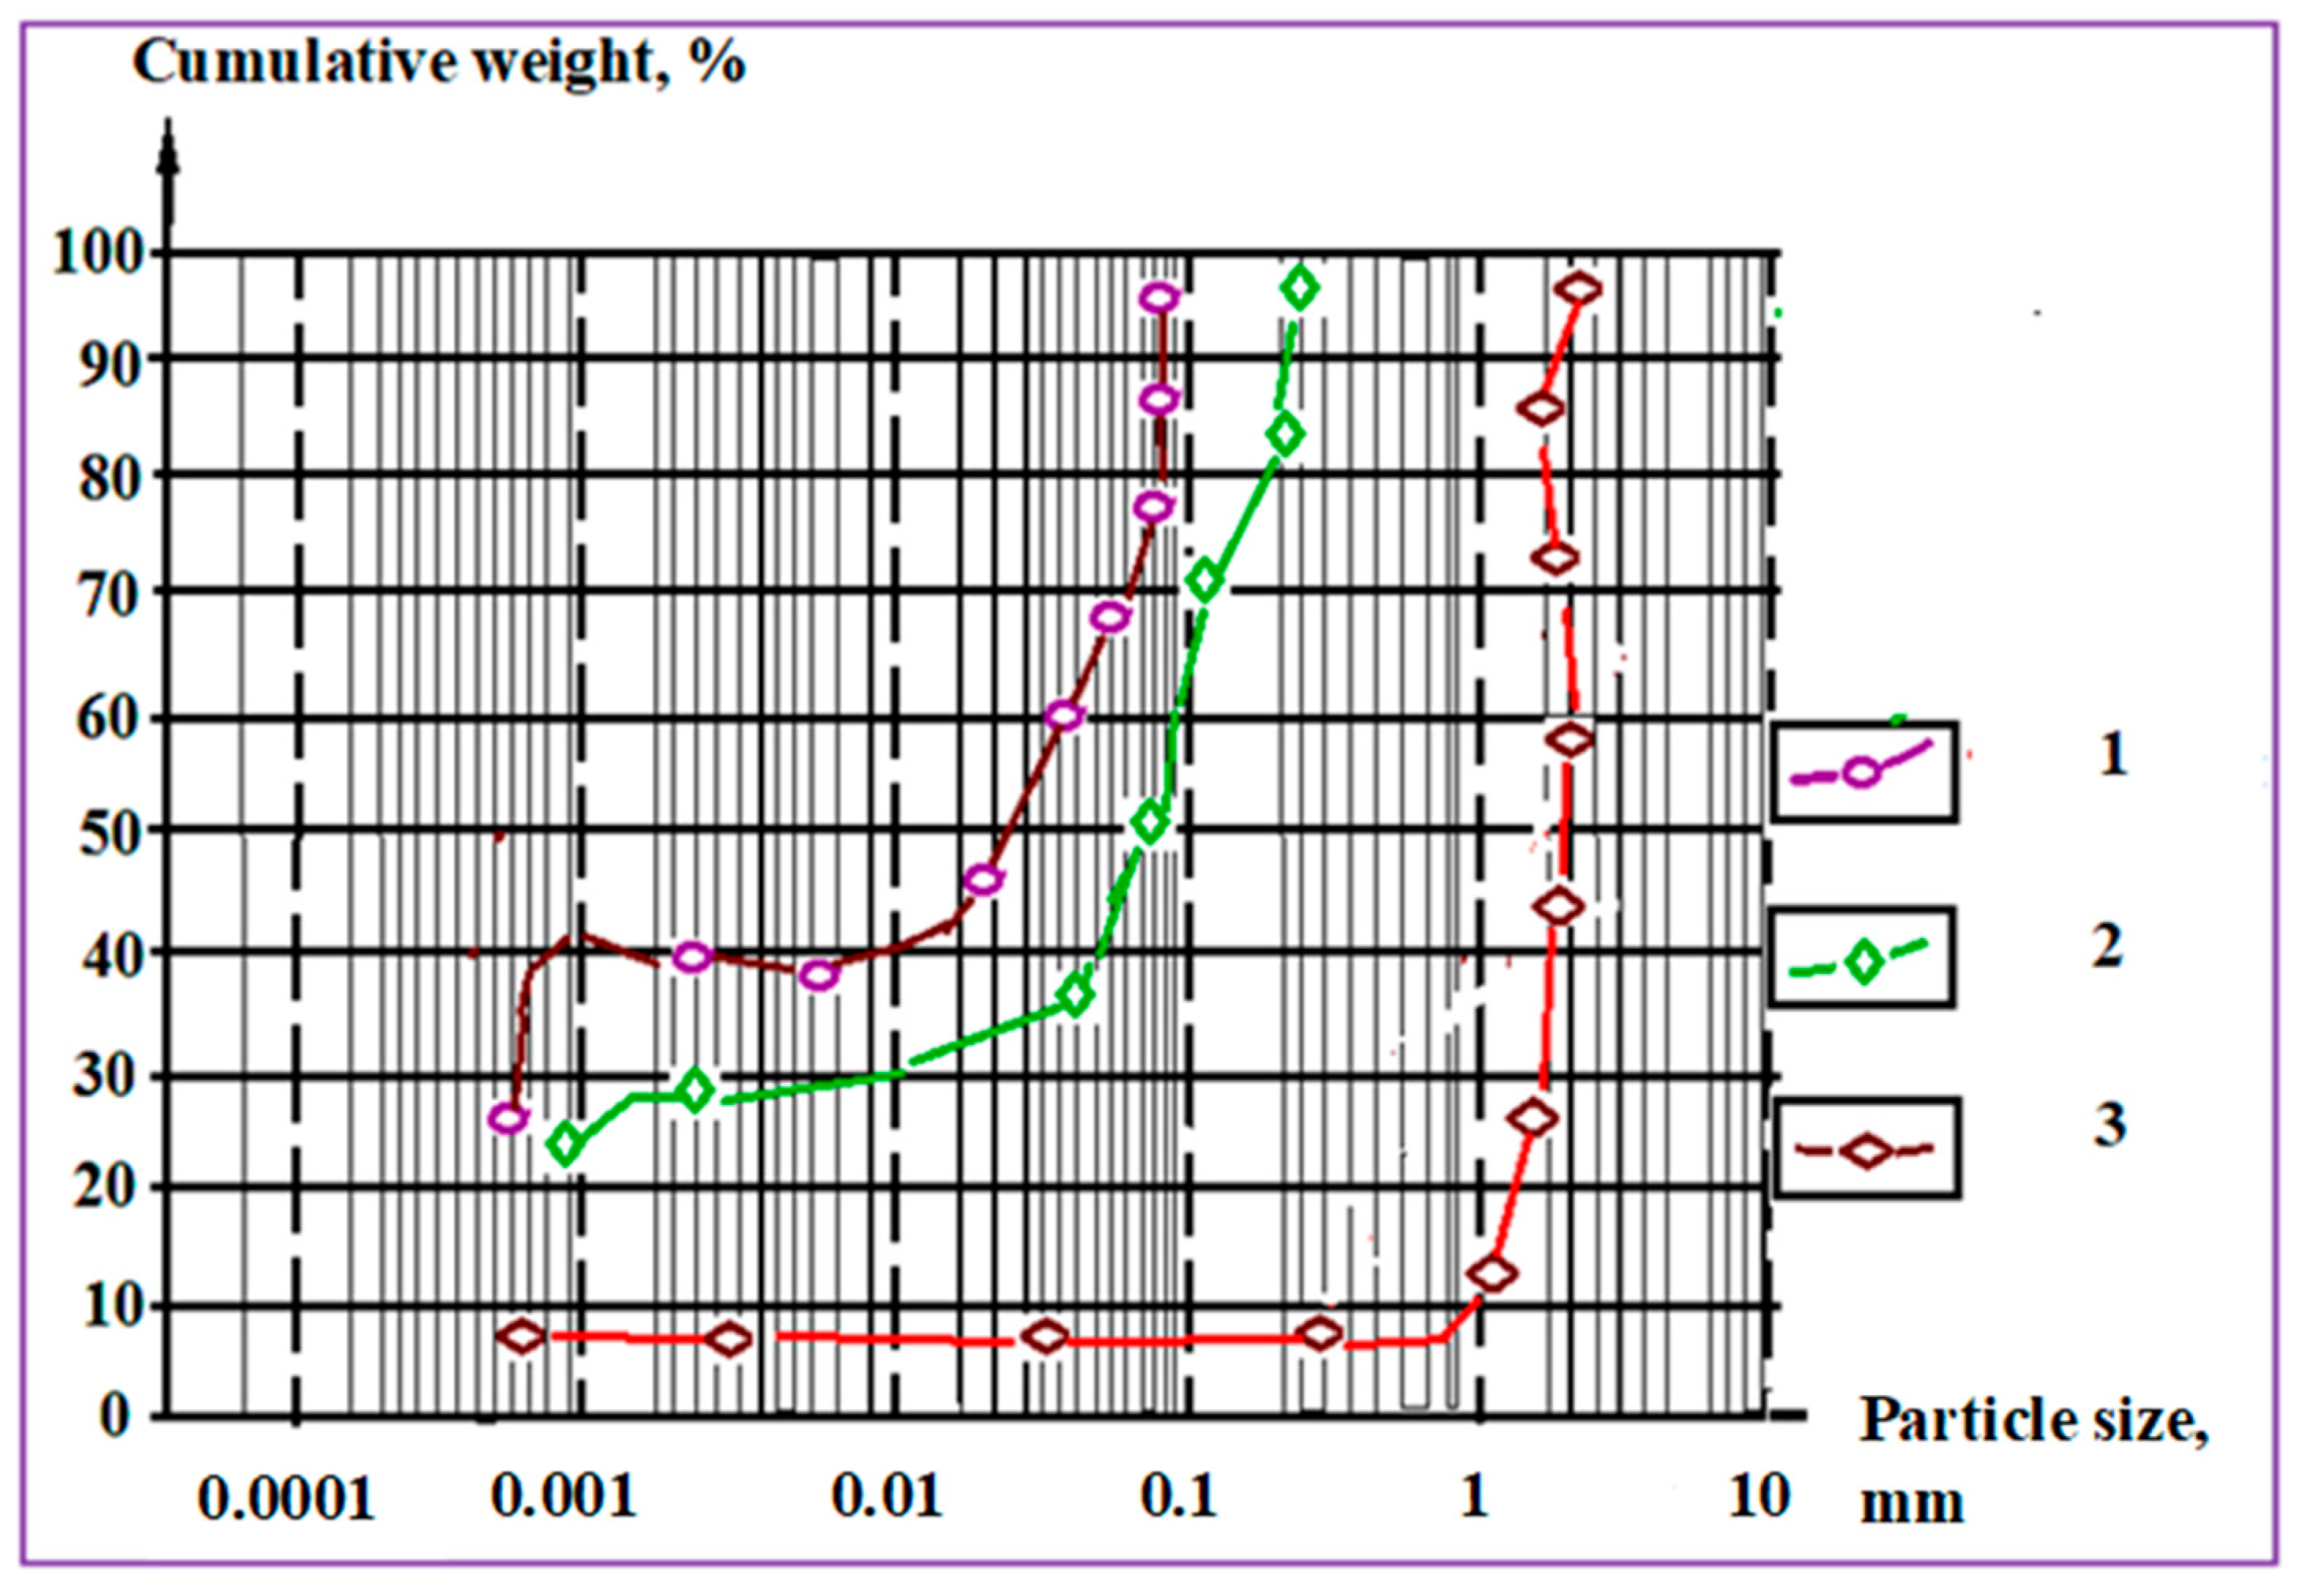
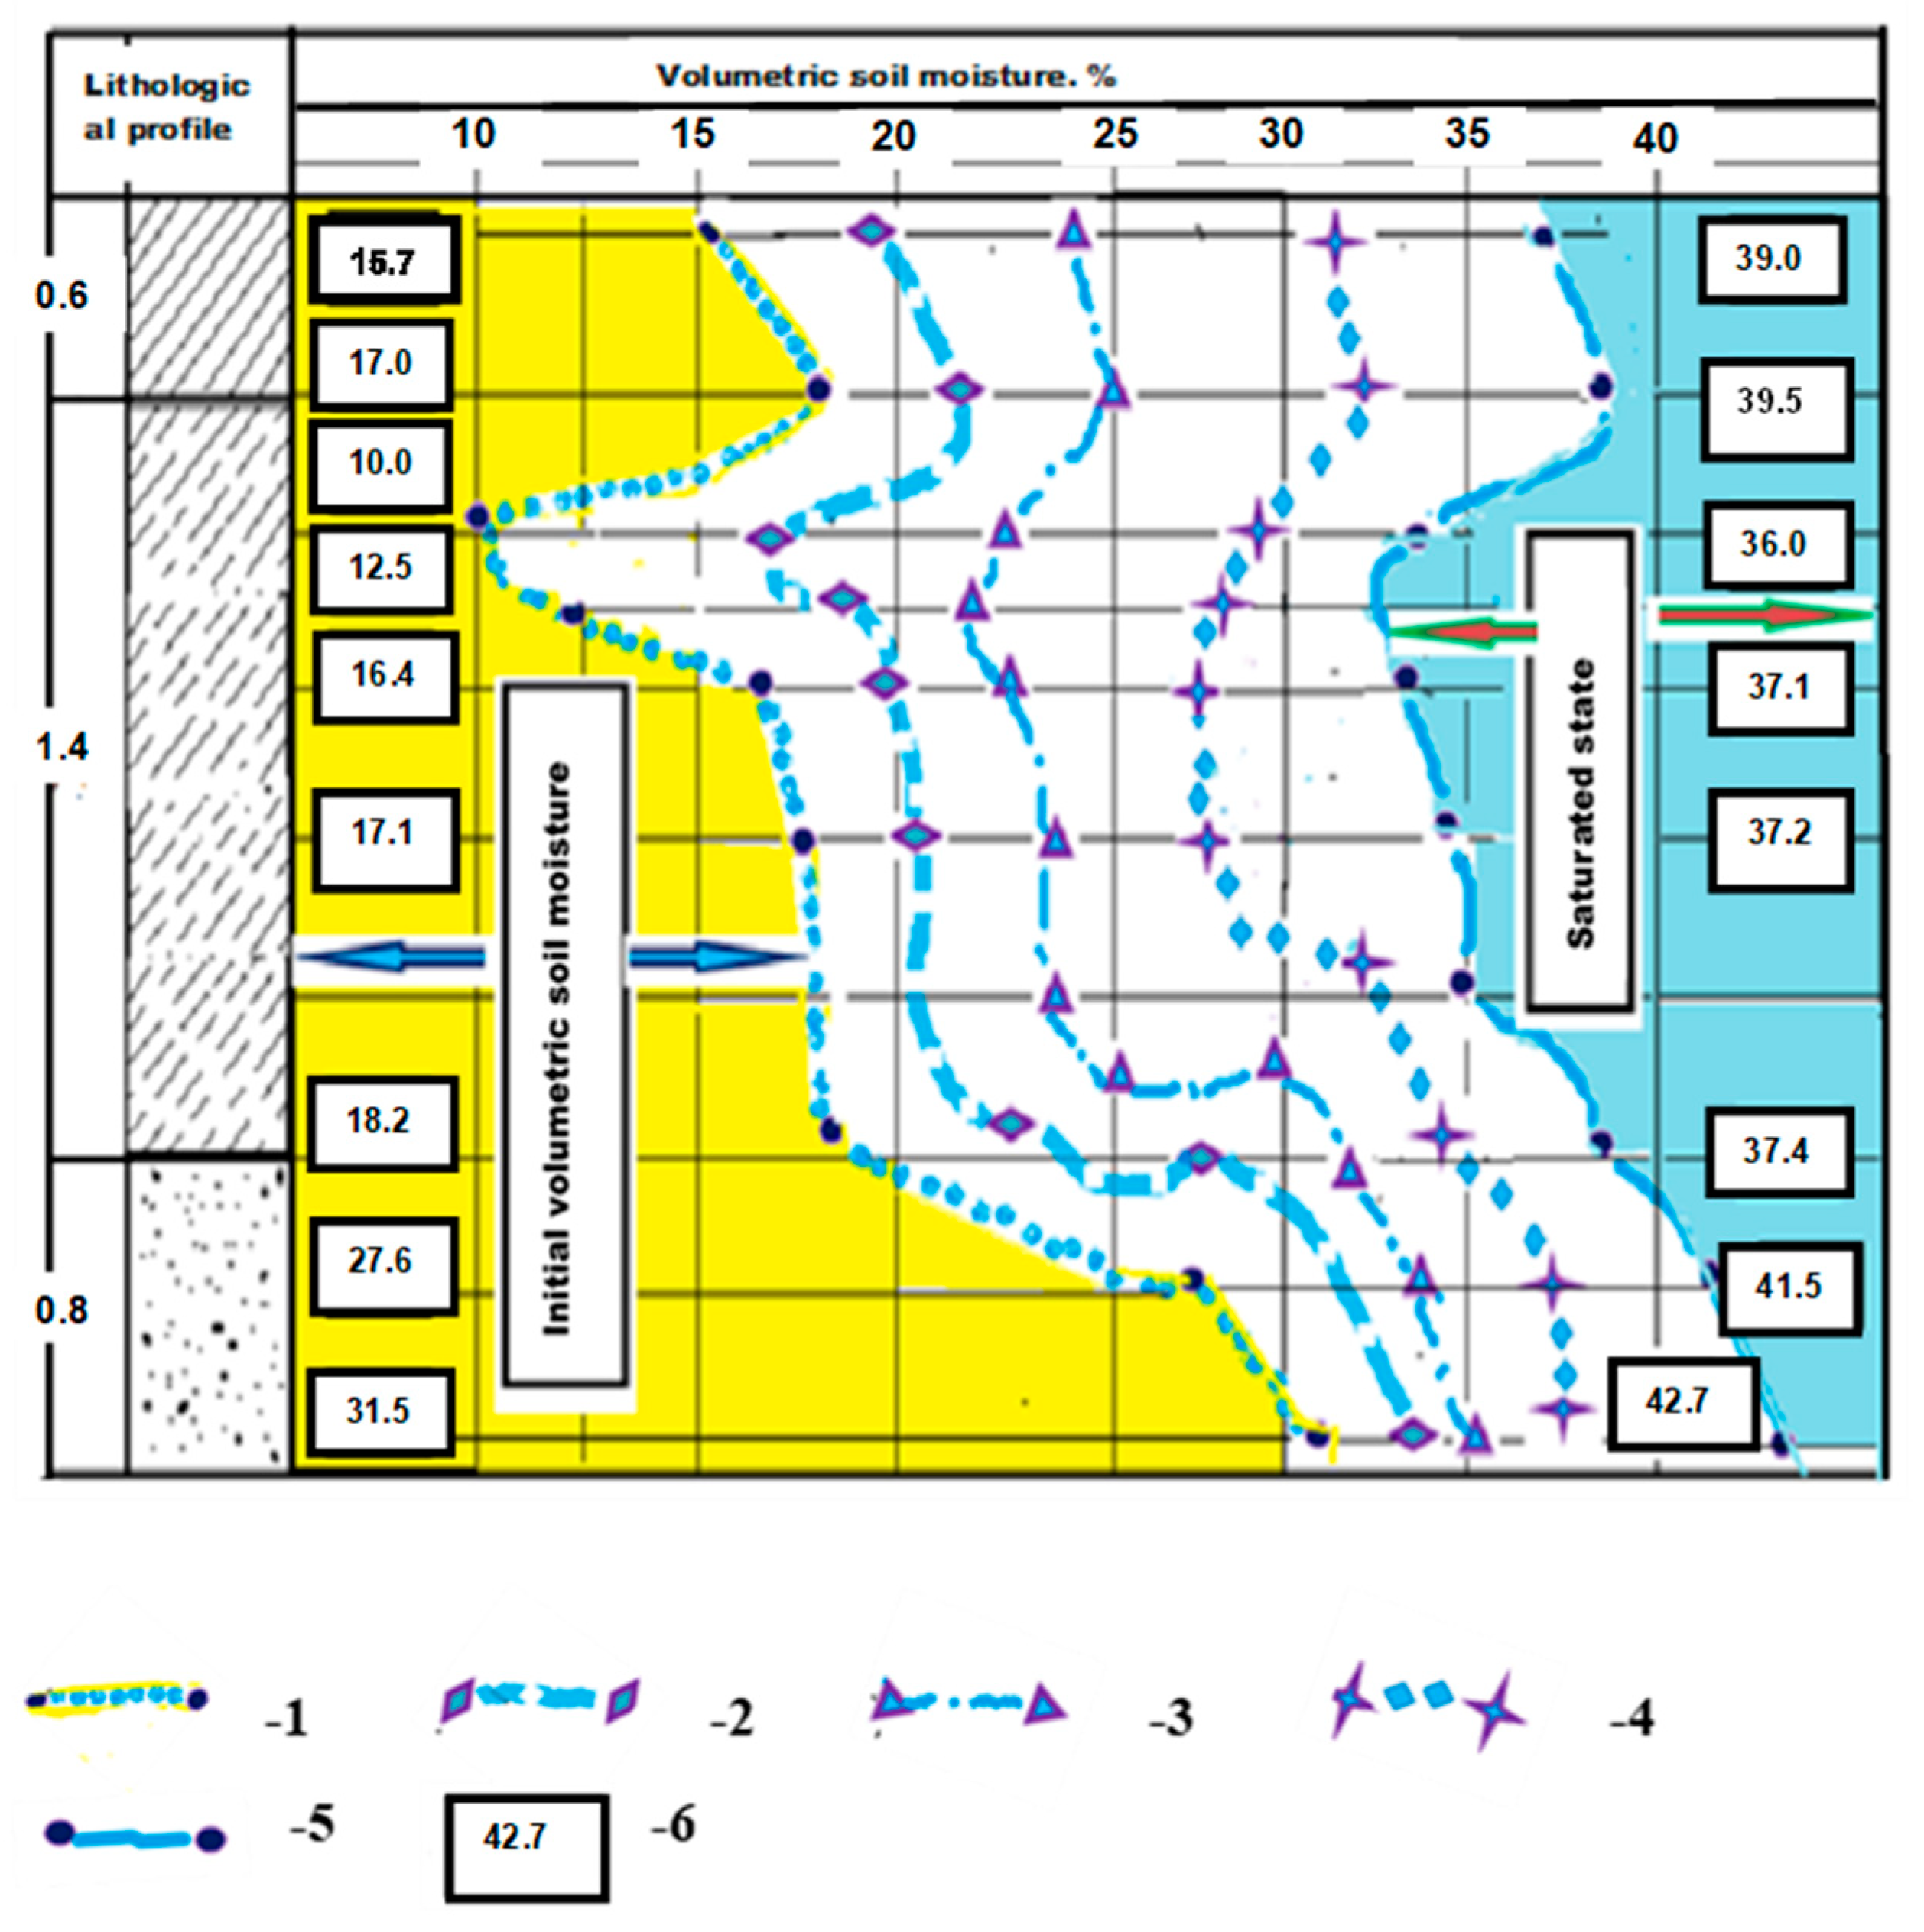
3.1. Mechanical Components of the Soil Profile

The granulometric analysis performed on each soil sampling pit for each unsaturated zone lithology and soil horizons (Figure 1, Figure 4 and Figure 8) suggests that, by the particle size results, the soils sediment types most common were, loam, sandy loam, and sand (Table 1).
The cumulative grain size distribution curves [31] for loam, sandy loam, and sand were the most common in the soil profile of the Aksu research site (Figure 11).
It is possible to find the effective diameter (D10, mm) of soil particles [32].
The effective diameter (D10, mm) is the diameter at which 10% by weight of soil grains are finer and may cause the same effect as a given soil. The effective diameter (D10, mm) values are 0.99, 0.0009 and 0.0006 for sand, sandy loam, and loam, respectively.
The D10 value is used in calculating the dirt holding capacity, which directly affects the muddy film formation in the infiltration basin’s bottom and, consequently, the clogging process’s magnitude. The smaller the soil particles’ effective diameter (D10), the lower the sediment skeleton bulk density (Ysk) (Formula (3)), and hence the lower the dirt holding capacity (DHC) is, which motivates the silty film formation that initiates the clogging process.

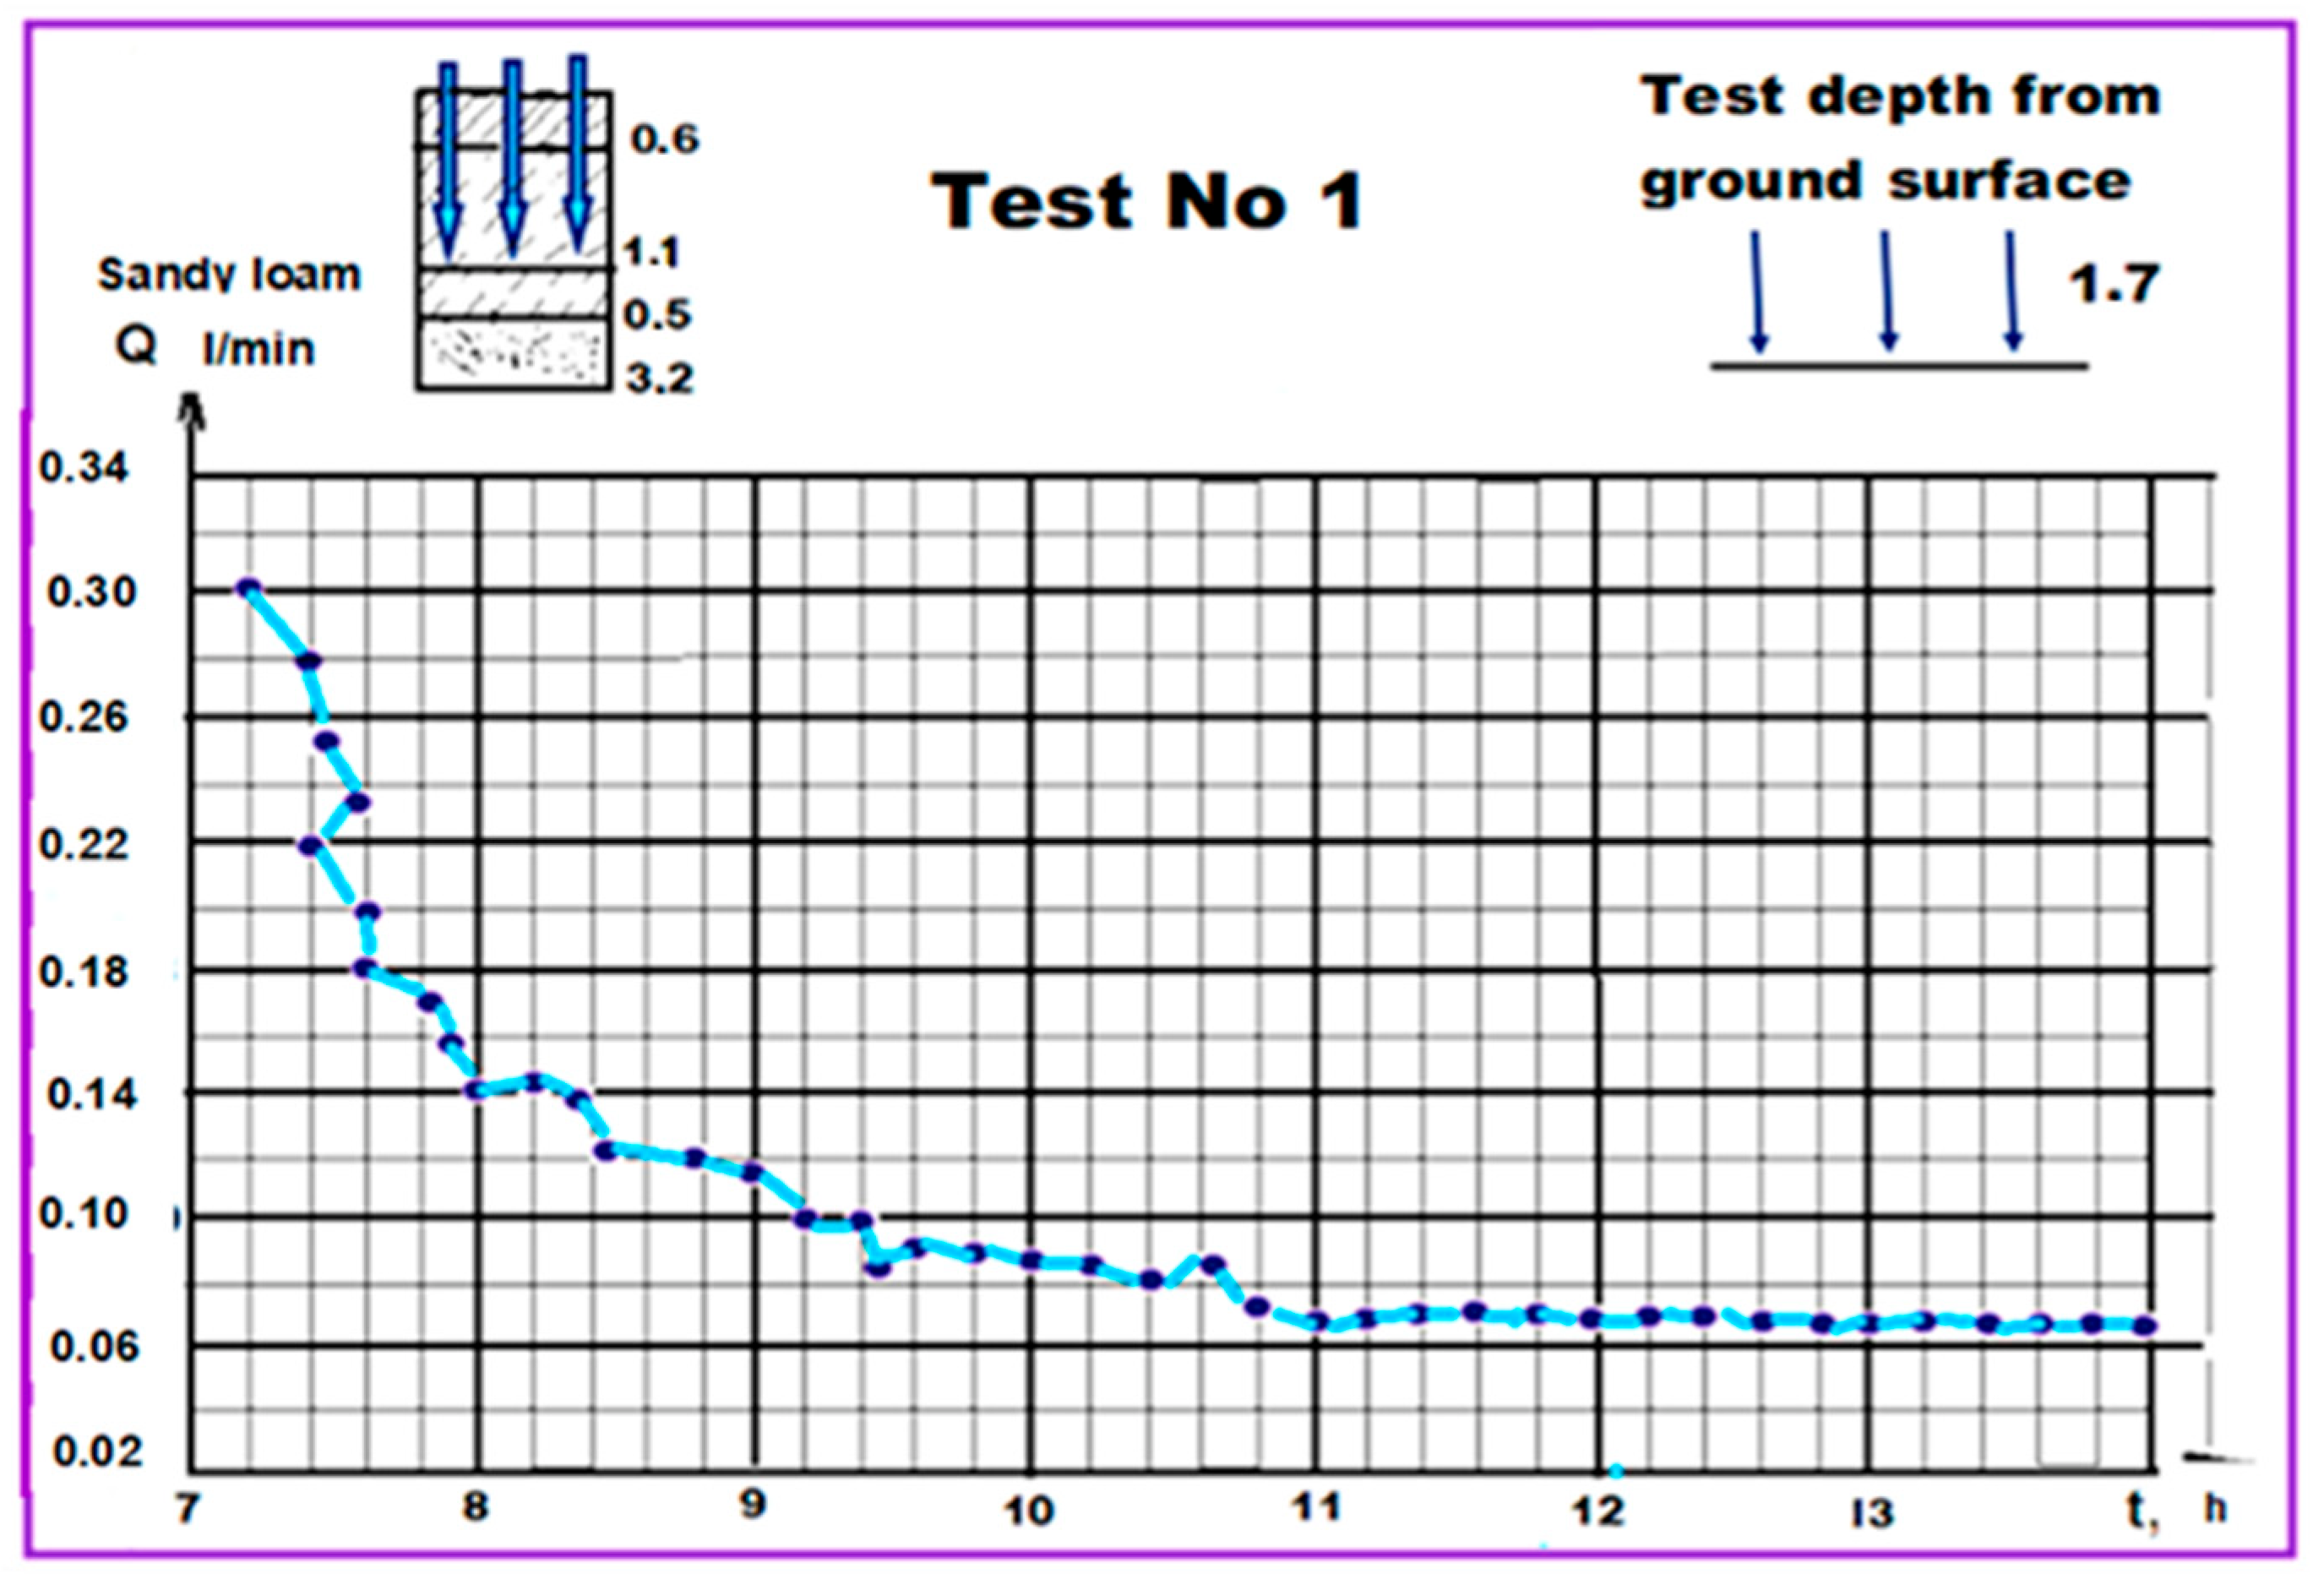
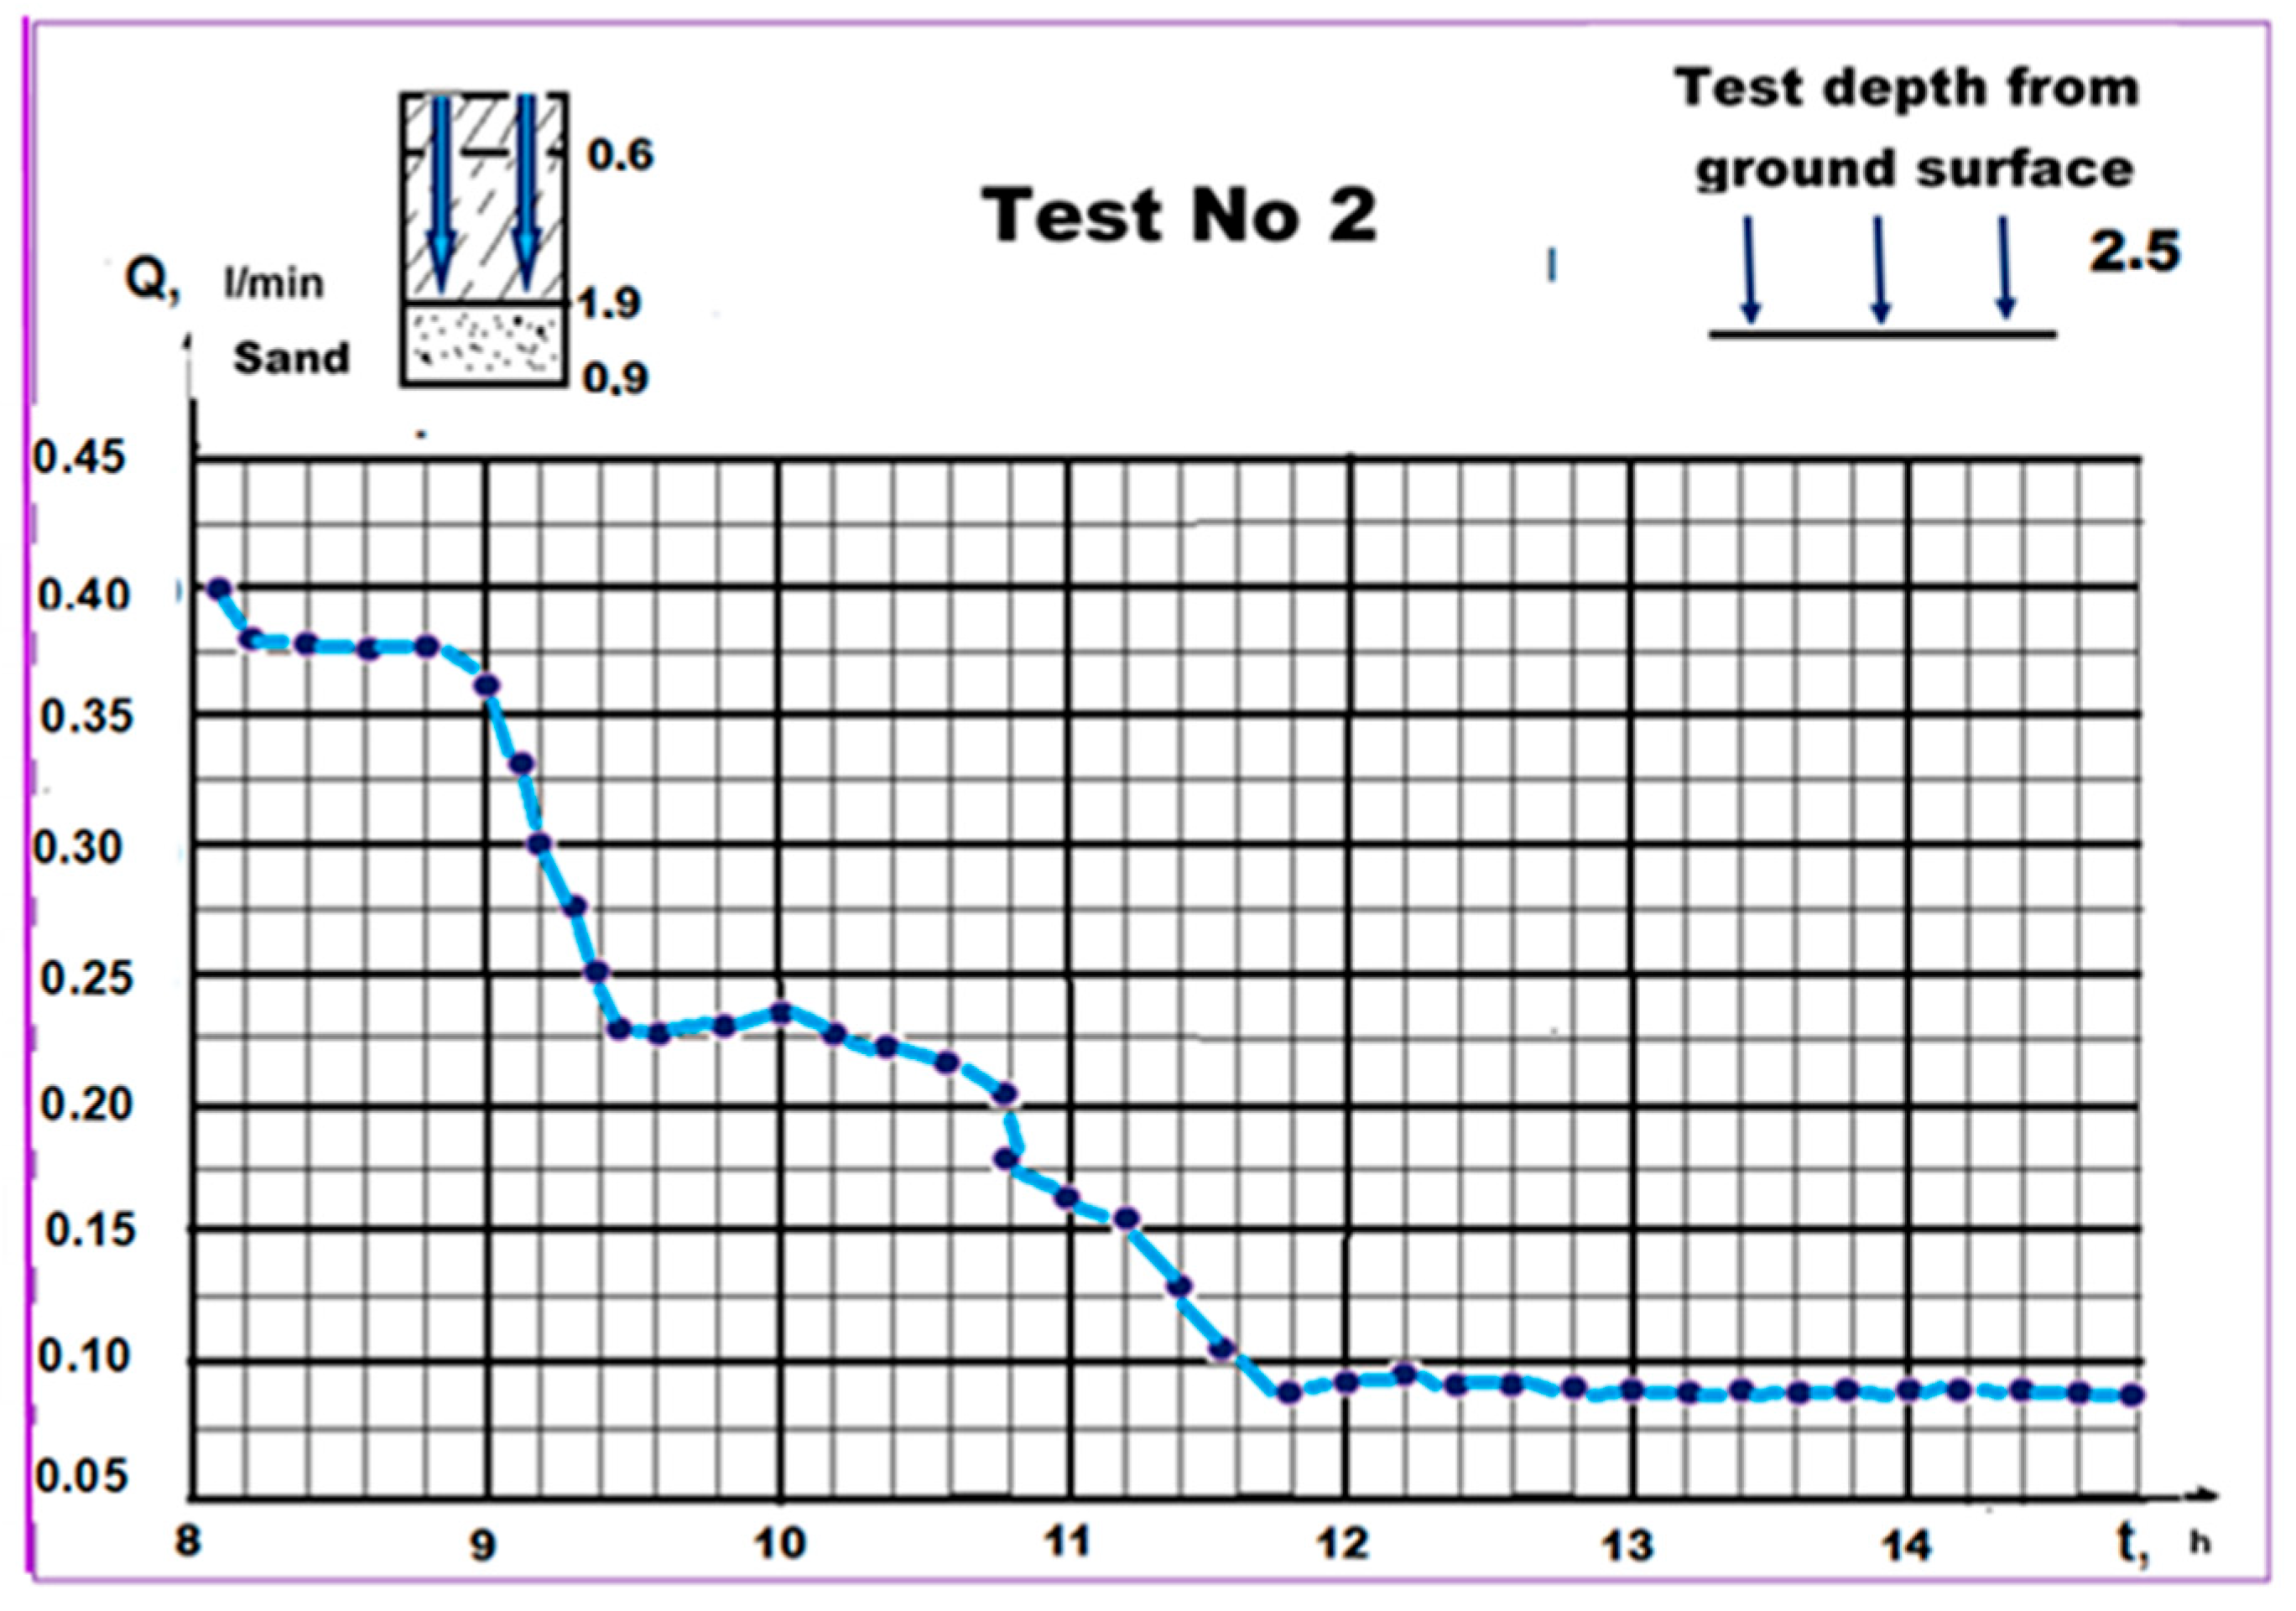
3.2. Soil Hydraulic Conductivity (Water Percolation Test Results)

Table 2 and Figure 12 and Figure 13 show the sandy loam water percolation test results (No. 1) and the sand with gravel test results (No. 2), both of which were carried out in mini pool No. 1 at the Aksu research site.
The percolation flow rate stabilization time during the beginning of the tests varied from 8 to 9 h for sandy loam and from 6 to 7 h for sand. The values of the steady-state percolation flow rate were 0.059 dm3/min for sandy loam and 0.087 dm3/min for sand. Hydraulic conductivity calculated values based on percolation tests were compared with the values calculated according to the empirical equation of Hazen [33,34] (Table 3). This comparison suggests that the greatest difference between the percolated test results and the empirical method for hydraulic conductivity and consequent filtration coefficients is plus 7–8% in sandy, well-permeability sediments, and the smallest difference was found for sandy loam sediments (+1%).
The initial soil moisture volumetric value received for infiltration mini pool No. 1 lithological profile before the filling test varied from 10% in the sandy loam at the 0.6–1.0 m depth to 30% in the sand at the 2.2 m depth (Figure 14). Under a saturated state, it varied from 32% in the sandy loam to 42.7% in the sand.

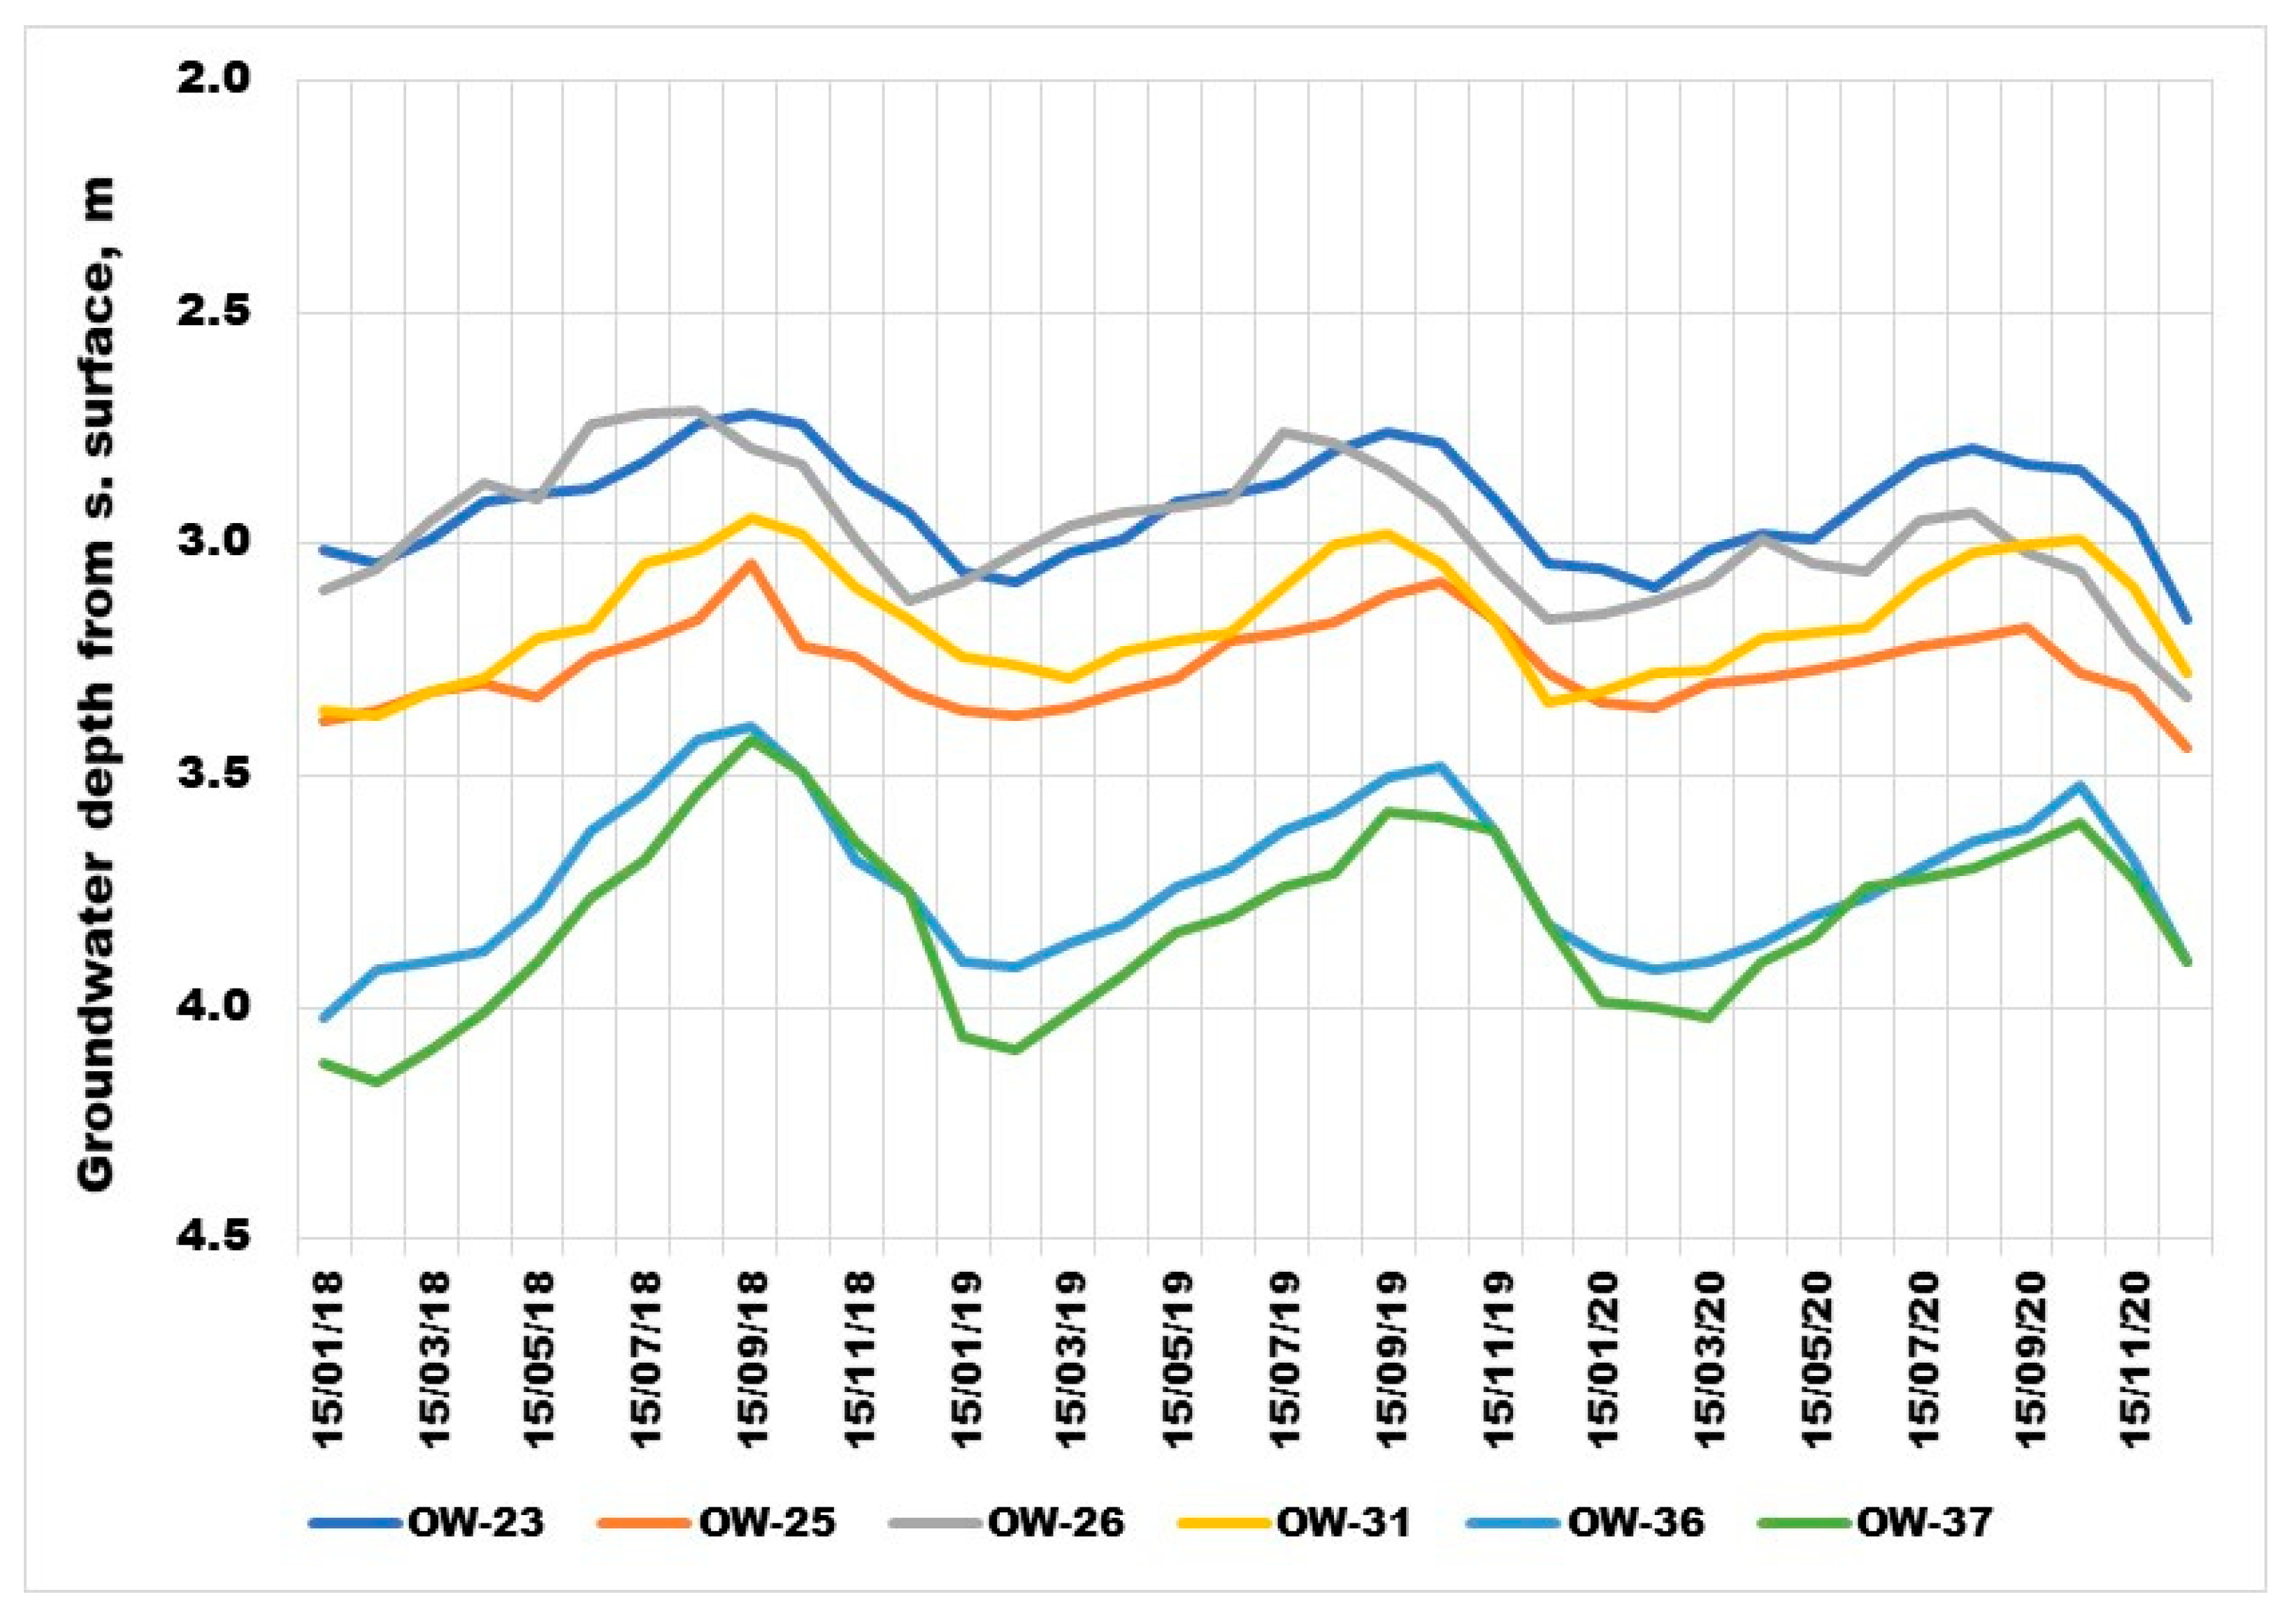
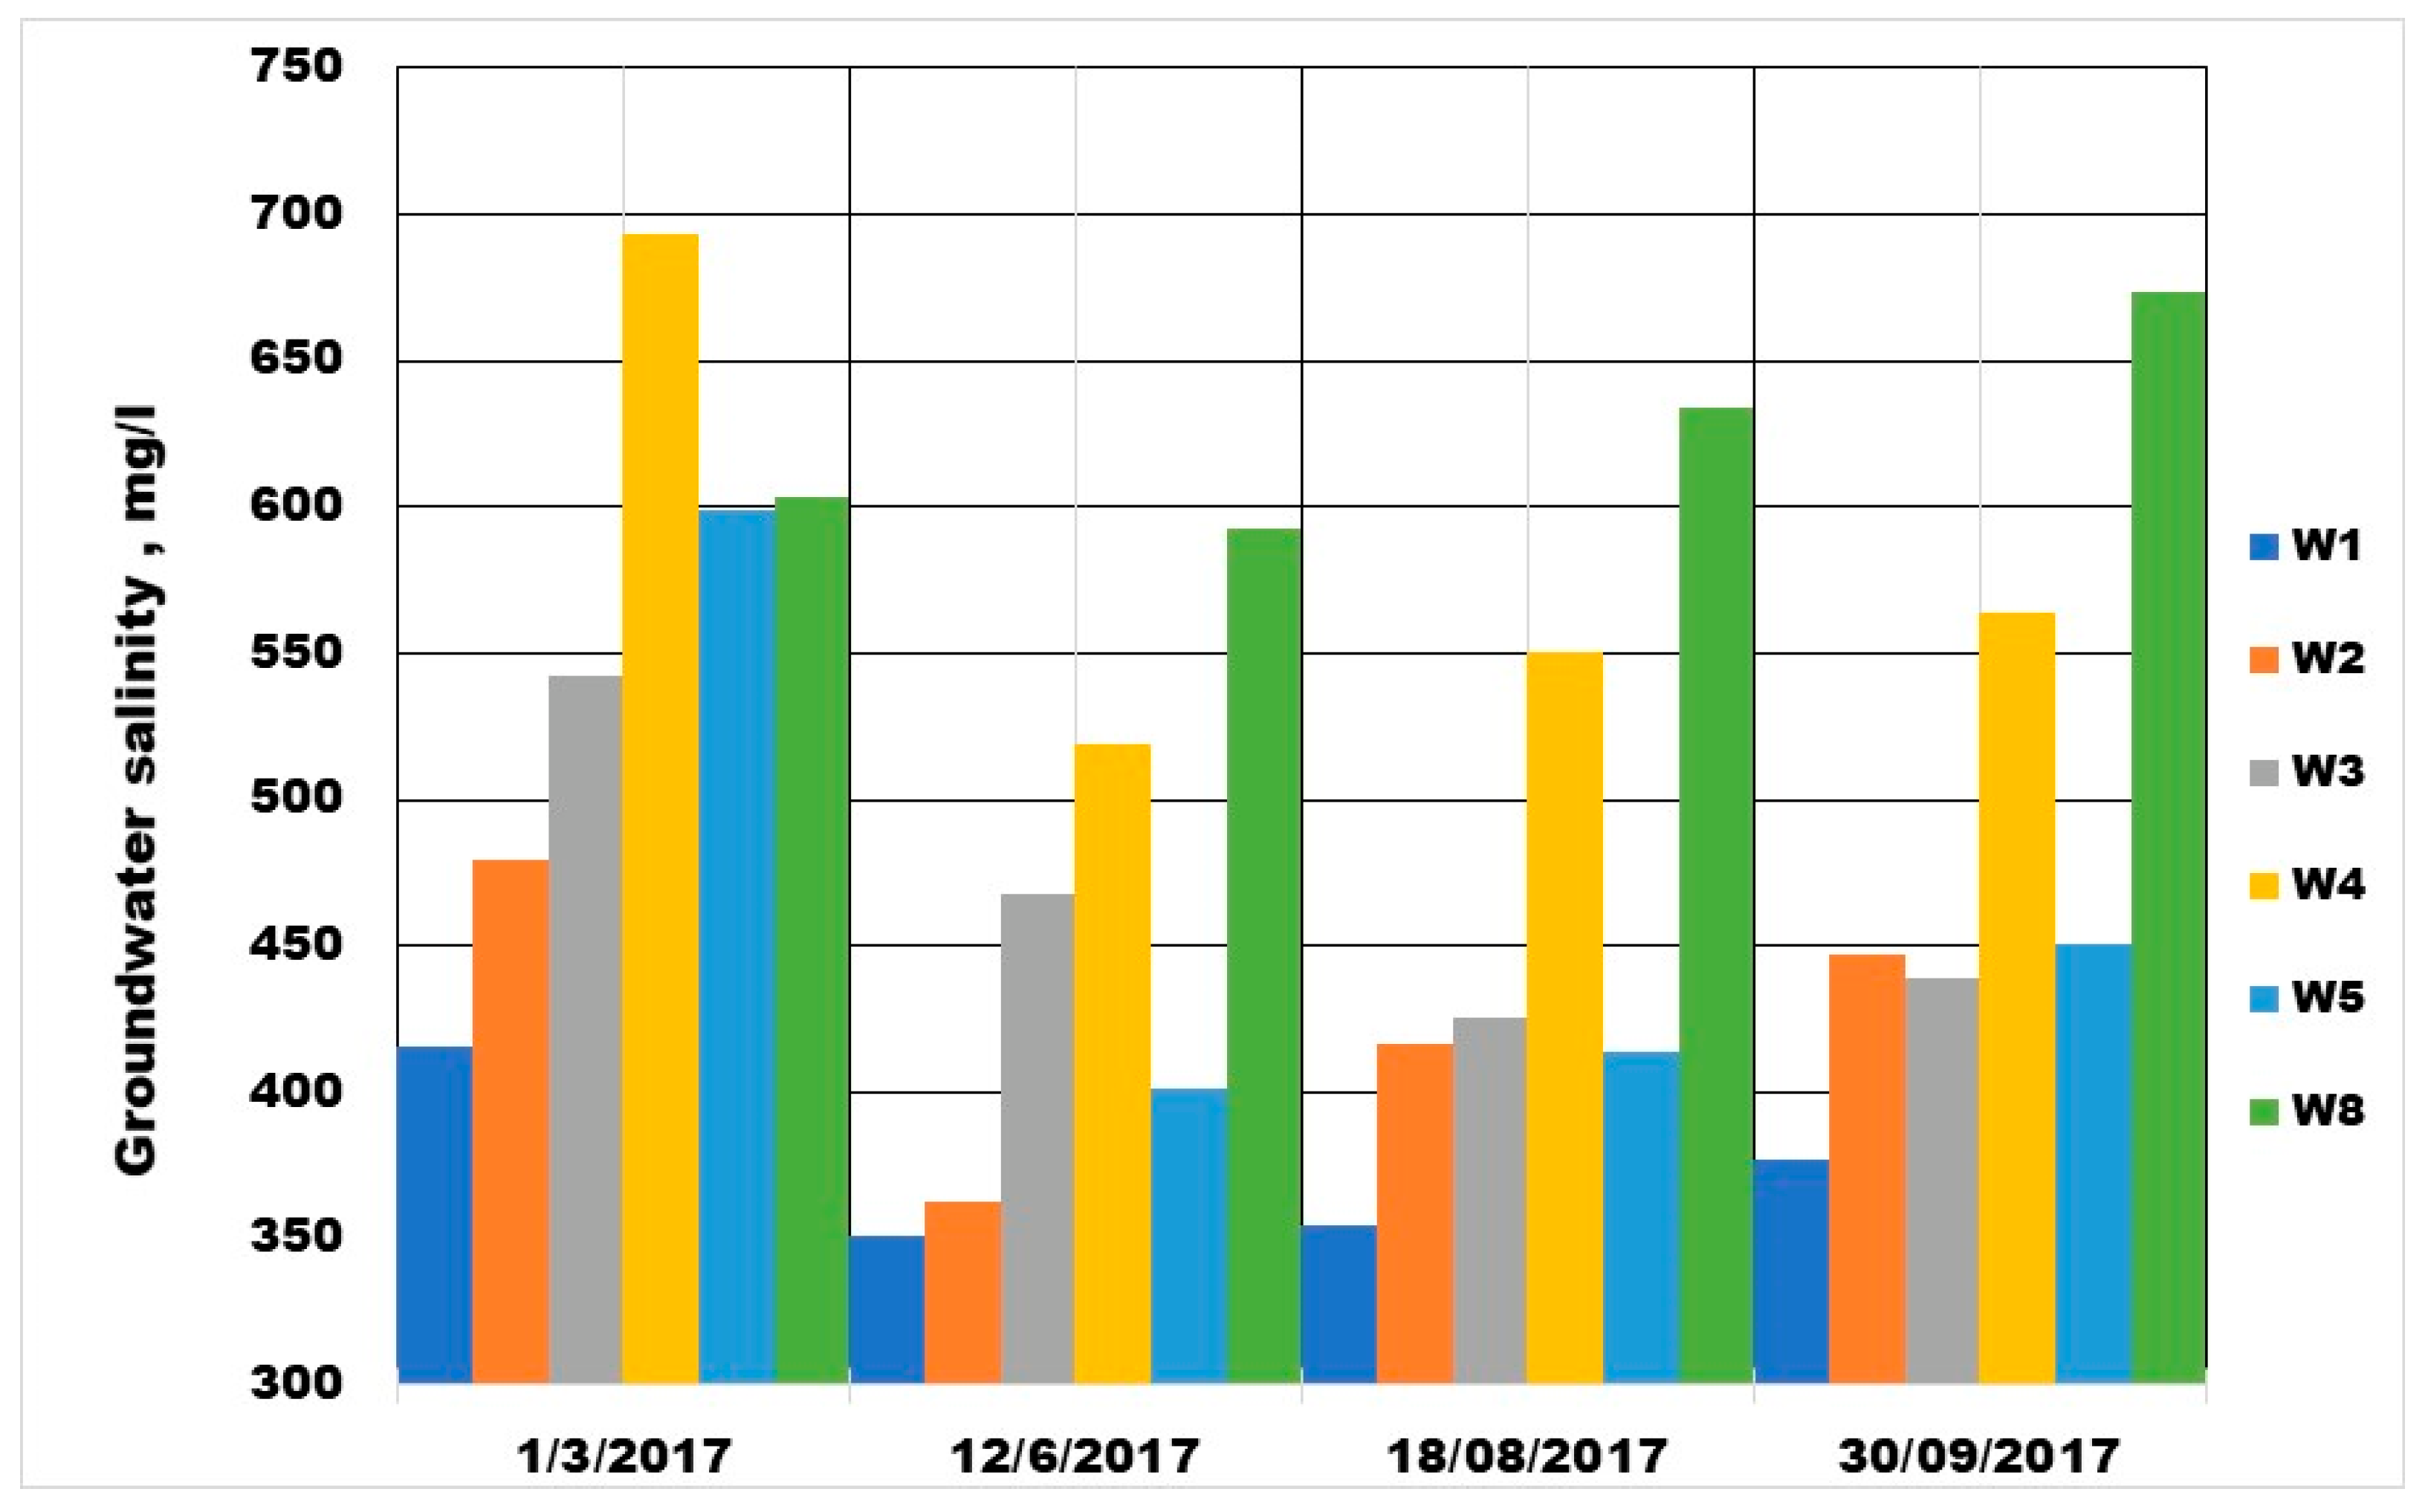
3.3. Groundwater Level Depth and Groundwater Salinity

The Aksu experimental site’s average monthly groundwater level depth according to the 2018–2020 observation well monitoring data ranges from 2.7 to 4.2 m (Figure 15). Under natural conditions, the minimal groundwater depth values were observed in the summer, and annual amplitudes ranged from 0.4 to 1.0 m. As expected, the shallower groundwater level depth and the smallest annual fluctuation amplitude were observed in observation wells located near the Aksu River channel.
The upper aquifer groundwater salinity increases with distance from the Aksu River from 350–400 mg/L (observation well W1) to 550–700 mg/L (observation well W4). The groundwater salinity maximum value was noted in early March, and the minimum was noted in June (Figure 16). The groundwater chemical composition also changed in parallel with the increase in salinity from bicarbonate–sulfate–calcium–sodium to sulphate–bicarbonate–sodium–magnesium (Table 4).

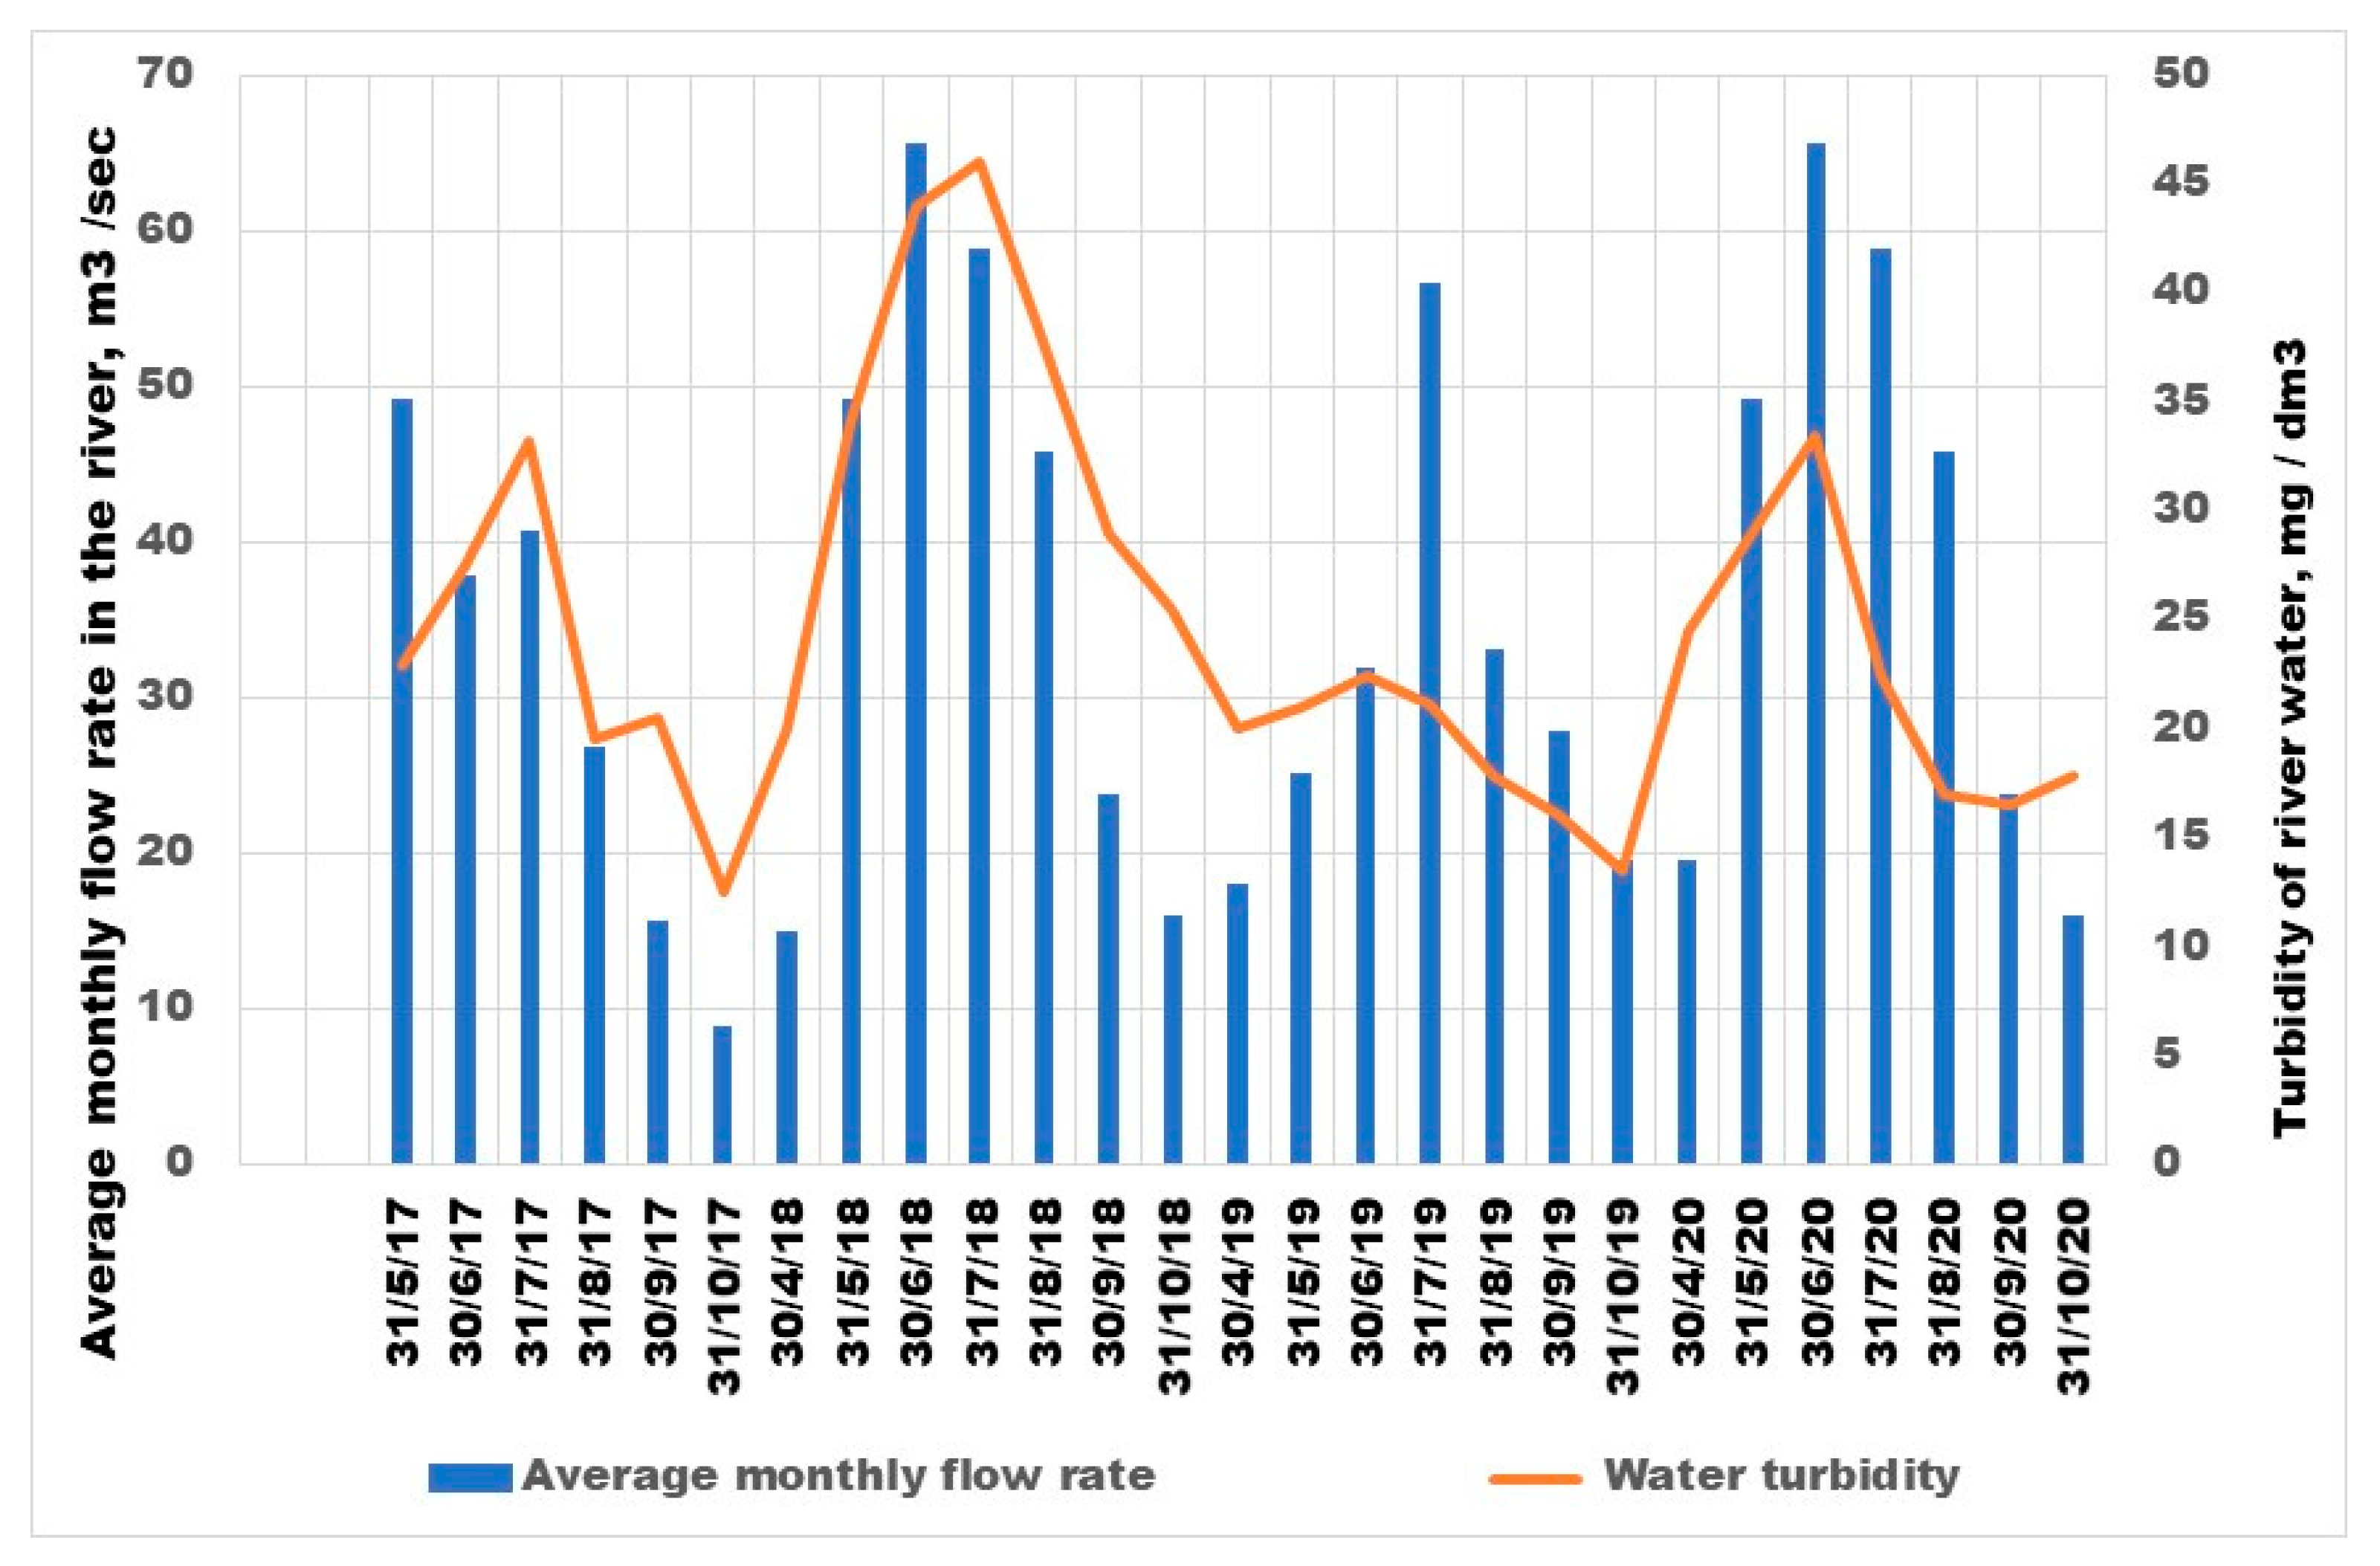
3.4. Aksu River Water Turbidity

The Aksu River water turbidity measured during 2017–2020 correlates with the river’s water flow rate (Figure 17). Water turbidity varied from 10 mg/dm3 in the autumn to 45 mg/dm3 in the middle of the summer.

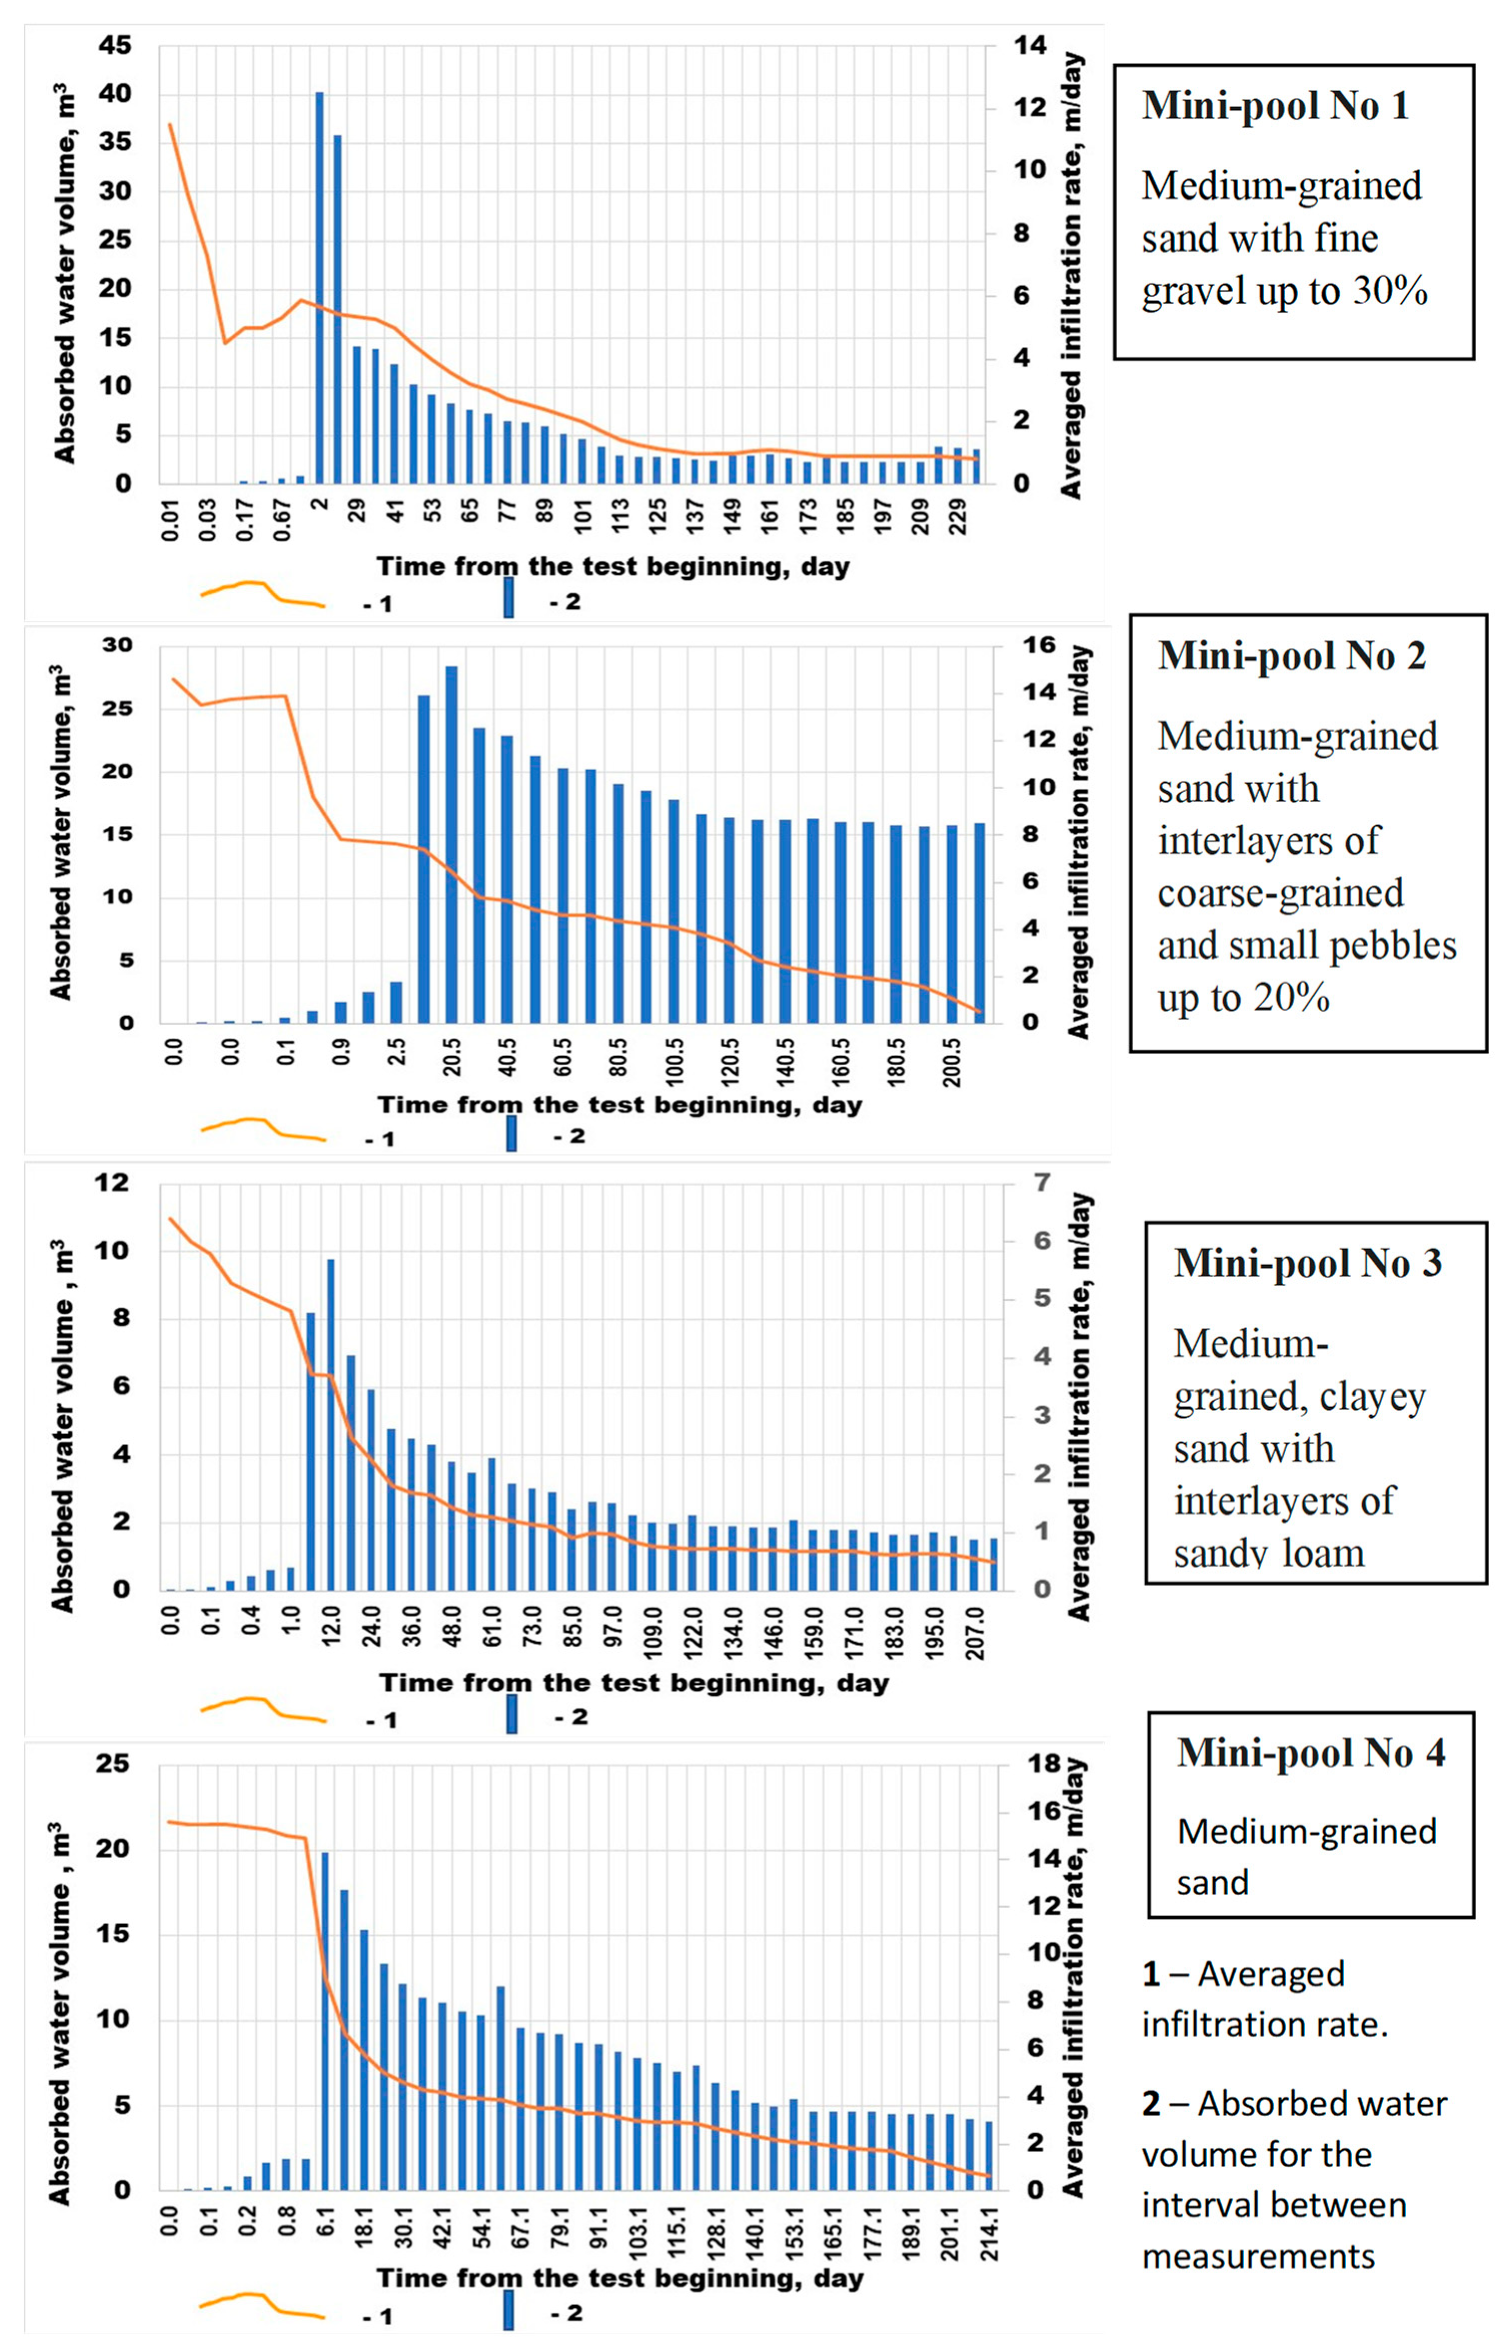
3.5. Infiltration Rate in the Aksu Experimental Site Mini Pools

The temporal dynamics of the absorbed water volume and infiltration rate during infiltration tests in mini pools 1–4 are illustrated in Figure 18, showing the infiltration test results in the form of temporally combined graphs of the infiltration rate dynamics and the water volume lost to infiltration. By measuring the water infiltration rates and water volume lost for infiltration, it is possible to distinguish three main infiltration process stages in all infiltration mini pools. Nonetheless, there is a certain difference in test results carried out in different years and for different lithological soil compositions. The first stage was characterized by a sharp decrease in the infiltration rate during the first two days. The unsteady state infiltration regime at this stage is due to the formation of a saturation layer under the infiltration mini pool bottom. An unsteady state infiltration regime with a gradual decrease in the infiltration rate with approximately equal intensity characterizes the second process stage, which continued up to 120–140 days. At this stage, an infiltration hillock was formed in the aquifer lying under the unsaturated zone.
The third and final stage of the infiltration process is characterized by a steady-state infiltration regime with an approximately constant volume of water loss and stabilization of the infiltration hillock in the aquifer lying under the unsaturated zone. At this stage, a groundwater hydraulic gradient flow under the mini pool is spreading. A slight decrease in the infiltration rate is related to clogging layer formation at the mini pool bottom.

3.6. Formation of a Clogging Layer in the Mini Pool Bottom

Table 5 demonstrates the clogging layer mechanical particle content formed at the bottom of the infiltration mini pools after the completion of filtration cycles.
The main clogging layer parameters describing the clogging process during infiltration tests in mini pools are shown in Table 6.
The dirt holding capacity of the upper soil layer under mini pools varied from 3.72 to 5.25 kg/m2, depending on the incoming water mechanical properties, turbidity, and infiltration rate. The clogging process duration throughout the infiltration tests varied from 3.2 months (for mini pool No. 2) to 5.6 months (for mini pool No. 3) and correlated with the water turbidity regime of the Aksu River. Active clogging layer formation began after nearly one month from the test beginning in summer, when turbidity values reached a maximum and caused a gradual decrease in the infiltration rate. The clogging layer measured thickness after finishing the infiltration tests varied from 3 to 6 mm. The measured values of the clogging layer thickness are correlated with the calculated values according to formula 4. Almost all values of the differences were within acceptable limits (discrepancies up to 10–14%) with a high correlation coefficient.

4. Conclusions

Field experimental studies were carried out in the southeastern region of the Kazakhstan Aksu research site. These enabled us to evaluate the infiltration and clogging processes using an integrated set of field experiments, monitoring, and laboratory investigations for typical soil profiles. The infiltration tests in the original mini pools simulating in miniature the GAR system optimal for a given region allowed us to study the water flow processes in different soil profiles under the mini pools and create a clogging layer under local natural conditions.
Soil sample particle size analysis made it possible to reliably determine the mechanical composition of all the main types of soils, namely, loam, sandy loam, and sand, composing the upper part of the soil profile in the areas of potential construction of infiltration basins. Based on sets of percolation tests, the values of the soil hydraulic coefficients for the saturated state across the soil profile from the soil surface to the upper unconfined aquifer were found.
Four years of monitoring made it possible to verify the regime and chemical composition of the upper unconfined aquifer groundwater and the Aksu River surface water changes in the turbidity from an annual perspective, suggesting that it may be utilized as a potential source of water for infiltration basins.
The experimental mini pool infiltration test results showed that the infiltration rate varied from 15 m/day at the beginning of the experiment until stabilizing at 0.75 m/day, which did not vary until the end of the experiment. It was found that there are three main stages in the infiltration regime: unsteady state with a sharp decrease in the infiltration rate, unsteady state with a gradual decrease in the infiltration rate, and steady state with an approximately constant volume of water loss.
The clogging layers began to form at the bottom of the mini pools nearly one month after the test began in summer, with thicknesses reaching 3 mm for clayey silt and 6 mm for muddy clay. The dirt-holding capacity of the upper soil layer under infiltration mini pools varied from 3.72 to 5.25 kg/m2.
These field studies serve as a factual basis for artificial groundwater resource replenishment system design and implementation methodology, which may extend their use in southeastern Kazakhstan and similar regions.

Author Contributions

V.M. was responsible for the conceptualization, methodology, and writing—original draft preparation; V.K. was responsible for methodology, the field investigation, performed measurements and data processing; A.I. assisted field investigation and data processing; Y.A. was responsible for the writing—reviewing and editing and conceptualization. All authors have read and agreed to the published version of the manuscript.

Funding

This research received no external funding.

Institutional Review Board Statement

Not applicable.

Informed Consent Statement

Not applicable.

Data Availability Statement

Not applicable.

Acknowledgments

The author would particularly like to thank I. I Shakibaev, the Head of the Zonal Hydrogeological-Ameliorative Center of the Ministry of Agriculture, the Republic of Kazakhstan, and its specialists for the equipment provided and the provision of practical and methodological assistance in laboratory measurements and field experiments, as well as A.L. Chernykh, General Director of GISS LTD for providing technical assistance during installing and equipping observation piezometers at the experimental site.

Conflicts of Interest

The authors declare no conflict of interest.

References

  1. Aju, C.D.; Achu, A.L.; Raicy, M.C.; Reghunath, R. Identification of Suitable Sites and Structures for Artificial Groundwater Recharge for Sustainable Water Resources Management in Vamanapuram River Basin, South India. HydroResearch 2021, 4, 24–37. [Google Scholar] [CrossRef]
  2. Dar, T.; Rai, N.; Bhat, A. Delineation of Potential Groundwater Recharge Zones Using Analytical Hierarchy Process (AHP). Geol. Ecol. Landsc. 2020, 00, 1–16. [Google Scholar] [CrossRef] [Green Version]
  3. Ahani Amineh, Z.B.; Hashemian, S.J.A.D.; Magholi, A. Integrating Spatial Multi Criteria Decision Making (SMCDM) with Geographic Information Systems (GIS) for Delineation of the Most Suitable Areas for Aquifer Storage and Recovery (ASR). J. Hydrol. 2017, 551, 577–595. [Google Scholar] [CrossRef]
  4. Hashemi, H.; Berndtsson, R.; Kompani-Zare, M.; Persson, M. Natural vs. Artificial Groundwater Recharge, Quantification through Inverse Modeling. Hydrol. Earth Syst. Sci. 2013, 17, 637–650. [Google Scholar] [CrossRef] [Green Version]
  5. Ringleb, J.; Sallwey, J.; Stefan, C. Assessment of Managed Aquifer Recharge through Modeling-A Review. Water 2016, 8, 579. [Google Scholar] [CrossRef] [Green Version]
  6. Christy, R.M.; Lakshmanan, E. Percolation Pond as a Method of Managed Aquifer Recharge in a Coastal Saline Aquifer: A Case Study on the Criteria for Site Selection and Its Impacts. J. Earth Syst. Sci. 2017, 126, 1–16. [Google Scholar] [CrossRef] [Green Version]
  7. Chu, T.; Yang, Y.; Lu, Y.; Du, X.; Ye, X. Clogging Process by Suspended Solids during Groundwater Artificial Recharge: Evidence from Lab Simulations and Numerical Modeling. Hydrol. Process. 2019, 33, 3226–3235. [Google Scholar] [CrossRef]
  8. Siriwardene, N.R.; Deletic, A.; Fletcher, T.D. Clogging of Stormwater Gravel Infiltration Systems and Filters: Insights from a Laboratory Study. Water Res. 2007, 41, 1433–1440. [Google Scholar] [CrossRef]
  9. Siegrist, R.L.; Boyle, W.C. WastewaterInduced Soil Clogging Development. J. Environ. Eng. 1987, 113, 550–566. [Google Scholar] [CrossRef]
  10. Conley, G.; Beck, N.; Riihimaki, C.A.; Tanner, M. Quantifying Clogging Patterns of Infiltration Systems to Improve Urban Stormwater Pollution Reduction Estimates. Water Res. X 2020, 7, 100049. [Google Scholar] [CrossRef]
  11. Toran, L.; Jedrzejczyk, C. Water Level Monitoring to Assess the Effectiveness of Stormwater Infiltration Trenches. Environ. Eng. Geosci. 2017, 23, 113–123. [Google Scholar] [CrossRef]
  12. Mirlas, V.; Antonenko, V.; Kulagin, V.; Kuldeeva, E. Assessing Artificial Groundwater Recharge on Irrigated Land Using the MODFLOW Model. Earth Sci. Res. 2015, 4, 16. [Google Scholar] [CrossRef]
  13. Ismagulova, A.Z.; Mirlas, V.M. Studies of Hydrodynamics of Infiltration and Colmatations Processes in Basins of Daily Regulation under Artificial Replacement of Ground Water Reserves. News Natl. Acad. Sci. Repub. Kazakhstan Ser. Geol. Tech. Sci. 2019, 3, 85–95. [Google Scholar] [CrossRef]
  14. Kulydeev, E.; Kulagin, V.; Kulydeeva, E.; Zapparov, M.; Ismagulova, A. Field Studies of Artificial Ground Water Spreading Processes in the Boundary Conditions of the Infiltration Basin Physical Model (by the Example of the Karatal Area of Experimental Studies in the South-East Kazakhstan). Ecol. Environ. Conserv. 2015, 21, S121–S130. [Google Scholar]
  15. Duskayev, K.; Myrzakhmetov, A.; Zhanabayeva, Z.; Klein, I. Features of the Sediment Runoff Regime Downstream the Ile River. J. Ecol. Eng. 2020, 21, 117–125. [Google Scholar] [CrossRef]
  16. Mirlas, V.; Makyzhanova, A.; Kulagin, V.; Kuldeev, E.; Anker, Y. An Integrated Aquifer Management Approach for Aridification-Affected Agricultural Area, Shengeldy-Kazakhstan. Water 2021, 13, 2357. [Google Scholar] [CrossRef]
  17. InterStroyPribor LTD. Instrukcija-Polevaya-Laboratoriya-Litvinova-Pll-9. Instruction Manual 2012. Sant Petersburg, Russia. Available online: https://www.studmed.ru/polevaya-laboratoriya-litvinova-pll-9-tehnicheskoe-opisanie-i-instrukciya-po-ekspluatacii_68f0f696ddf.html (accessed on 1 November 2022).
  18. Papuga, K.; Kaszubkiewicz, J.; Wilczewski, W.; Stas, M.; Belowski, J.; Kawałko, D. Soil Grain Size Analysis by the Dynamometer Method—A Comparison to the Pipette and Hydrometer Method. Soil Sci. Annu. 2018, 69, 17–27. [Google Scholar] [CrossRef]
  19. Kaszubkiewicz, J.; Papuga, K.; Kawałko, D.; Woźniczka, P. Particle Size Analysis by an Automated Dynamometer Method Integrated with an X-y Sample Changer. Meas. J. Int. Meas. Confed. 2020, 157, 107680. [Google Scholar] [CrossRef]
  20. Cushman, J.H.; Tartakovsky, D.M. The Handbook of Groundwater Engineering, 3rd ed.; CRC: Boca Raton, FL, USA, 2016; pp. 1–1073. [Google Scholar] [CrossRef]
  21. Giakoumakis, S.G.; Tsakiris, G.P. Quick Estimation of Hydraulic Conductivity in Unsaturated Sandy Loam Soil. Irrig. Drain. Syst. 1999, 13, 349–359. [Google Scholar] [CrossRef]
  22. Elrick, D.E.; Reynolds, W.D.; Tan, K.A. Hydraulic Conductivity Measurements in the Unsaturated Zone Using Improved Well Analyses. Groundw. Monit. Remediat. 1989, 9, 184–193. [Google Scholar] [CrossRef]
  23. Zaporozec, A. Graphical Interpretation of Water-Quality Data. Groundwater 1972, 10, 32–43. [Google Scholar] [CrossRef]
  24. Boulom, J.; Eka Putra, D.P.; Wilopo, W. Chemical Composition and Hydraulic Connectivity of Springs in the Southern Slope of Merapi Volcano. J. Appl. Geol. 2015, 6, 1–11. [Google Scholar] [CrossRef]
  25. Kitchener, B.G.B.; Wainwright, J.; Parsons, A.J. A Review of the Principles of Turbidity Measurement. Prog. Phys. Geogr. 2017, 41, 620–642. [Google Scholar] [CrossRef] [Green Version]
  26. Niskanen, I.; Räty, J.; Peiponen, K.-E. A Multifunction Spectrophotometer for Measurement of Optical Properties of Transparent and Turbid Liquids. Meas. Sci. Technol. 2006, 17, N87–N91. [Google Scholar] [CrossRef]
  27. Bouwer, H. Artificial Recharge of Groundwater: Hydrogeology and Engineering. Hydrogeol. J. 2002, 10, 121–142. [Google Scholar] [CrossRef] [Green Version]
  28. Chen, W.; Huang, C.; Chang, M.; Chang, P.; Lu, H. The Impact of Floods on Infiltration Rates in a Disconnected Stream. Water Resour. Res. 2013, 49, 7887–7899. [Google Scholar] [CrossRef]
  29. Weiss, P.T.; Erickson, A.J.; Gulliver, J.S.; Hozalski, R.M. Sedimentation Practices, Appendix B, Part Two. In Assessment of Stormwater Best Management Practices; Gulliver, J.S., Anderson, J.L., Eds.; Stormwater Management Practice Assessment Project, University of Minessota: Minneapolis, MN, USA, 2008; Available online: http://observatoriaigua.uib.es/repositori/suds_minnesotac.pdf (accessed on 1 November 2022).
  30. Plotnikov, N.A. Proektirovanie Sistem Iskusstvennogo Vospolenija Podzemnych Vod Dlja Vodosnabzenija; Strojizdat: Moskva, Russia, 1983; 232p. [Google Scholar]
  31. Righi, D.; Huber, K.; Keller, C. Clay Formation and Podzol Development from Postglacial Moraines in Switzerland. Clay Miner. 1999, 34, 319–332. [Google Scholar] [CrossRef]
  32. Ismail, M.M. Mathematical Correlations Between The Effective Diameter Of Soil And Other Properties. Eng. Technol. 2008, 26, 1274–1281. [Google Scholar]
  33. Hazen, A.; Johnson, G.A.; Knowles, M.; Whipple, G.C.; Longley, F.F. Discussion: Washington Water Filtration Plant. Trans. Am. Soc. Civ. Eng. 1911, 72, 362–401. [Google Scholar] [CrossRef]
  34. Cabalar, A.F.; Akbulut, N. Evaluation of Actual and Estimated Hydraulic Conductivity of Sands with Different Gradation and Shape. Springerplus 2016, 5, 1–16. [Google Scholar] [CrossRef]
Figure 1. Study site location and the location of the infiltration processes (squares) experimental sites. The figure was prepared by Windows Word: an overview map after [15], with a base image for the experimental site map taken from Google Earth. 1—infiltration processes experimental site and its number; 2—observation well. Numbers above—well number; 3—W–E hydrogeological cross-section line.
Sustainability 14 15645 g001
Figure 2. Aksu River in the study area [13].
Sustainability 14 15645 g002
Figure 3. Hydrogeological cross-section along the W–E line in Figure 1. 1—Undivided recent and Upper Quaternary deposits (al QIII–IV); 2—alluvial-lacustrine Middle Quaternary (ao QII) deposits; 3—lacustrine-alluvial Lower Quaternary sediments (ao QI); 4—clayey loam, silt; 5—sands; 6—sandy-gravel-pebble deposits; 7—silty sandy loam and clays; 8—groundwater level; 9—observation well. Blue shaded area—downhole filter. Numbers above—well number, below—well depth, m.
Sustainability 14 15645 g003
Figure 4. Hydrogeological, geological engineering, and gauging station layout for the study of infiltration and clogging processes at the Aksu research site. 1—pit; 2—observation well; 3—gauging station; 4—infiltration mini pool; 5—the distance between stations, m. Above the conventional sign is the station number.
Sustainability 14 15645 g004
Figure 5. Schematic view of a typical pit construction in the Aksu experimental site. 1—open-type infiltration mini pool; 2—pits for the water-physical and physical-mechanical properties of the unsaturated soil profile studied; 3—pipe for infiltration and culmination processes studied; 4—the head of a pipe with equipment for automatic control of the river water supply; 5—container for filling and settling river water; 6—drilled borehole for pipe installation; 7—gravel bedding; 8—light loam medium density; 9—light sandy loam; 10—sands with the inclusion of fine gravel.
Sustainability 14 15645 g005
Figure 6. Drilling and installation work of the asbestos-cement casing pipe and equipment of the stop valves with a system of float valves on the pipe top. Photo taken by V. Kulagin and A. Ismagulova, 2018.
Sustainability 14 15645 g006
Figure 7. Schematic design of the observation well (a) and observation well in situ (b). Photo by V. Kulagin and A. Ismagulova.
Sustainability 14 15645 g007
Figure 8. A sampling of the soil with undisturbed structure into bins from pit No 2. Photo taken by V. Kulagin and A. Ismagulova.
Sustainability 14 15645 g008
Figure 9. A water percolation test in low-permeability loams was carried out in prepared pit No. 1 at the Aksu research site. Photo taken by A. Ismagulova.
Sustainability 14 15645 g009
Figure 10. A water percolation test in the sand with gravel was carried out at a depth of 2.1 m in the prepared mini pool No. 1 at the Aksu research site. Photo taken by V. Kulagin and A. Ismagulova.
Sustainability 14 15645 g010
Figure 11. Cumulative grain size distribution curves for the most common soils of the Aksu research site. 1—loam; 2—sandy loam; 3—sand.
Sustainability 14 15645 g011
Figure 12. The percolation water flow rate was measured during test No. 1. The lithological soil layer is sandy loam at a depth of 1.7 m from the ground surface.
Sustainability 14 15645 g012
Figure 13. The percolation water flow rate was measured during test No. 2. The lithological soil layer is fine sand at a depth of 2.5 m from the ground surface.
Sustainability 14 15645 g013
Figure 14. Volumetric soil moisture variations in the lithological soil profile at infiltration mini pool No. 1 during filling tests in the experimental pits. 1—before test beginning; 2—after 8 h from test beginning; 3—after 12 h; 4—after 24 h; 5—after 72 h (saturated state); 6—volumetric soil moisture in %.
Sustainability 14 15645 g014
Figure 15. The average monthly groundwater level depth from the soil surface at the Aksu research site.
Sustainability 14 15645 g015
Figure 16. Groundwater total salinity in observation wells W1–W8 during a percolation test in mini pool No. 1.
Sustainability 14 15645 g016
Figure 17. Flow rate and water turbidity of the Aksu River at the research site.
Sustainability 14 15645 g017
Figure 18. Absorbed water volume and infiltration rate during infiltration tests in mini pools 1–4 at the Aksu experimental site.
Sustainability 14 15645 g018
Table 1. The mechanical components of the soil profile in the Aksu research site, %.
Lithological Composition of the SoilThe Mechanical Components of the Soil, %
7.0–5.05.0–2.02.0–1.01.0–0.50.5–0.050.05–0.005Less
0.005
The various grained sand, with up to 30% of fine gravel-17.210.815.334.412.89.5
Medium-grained sand-6.831.019.536.43.13.2
Fine-grained sand---11.682.44.71.3
The various grained sand with lenses of medium loam--59.612.82.13.612.5
Sandy loam---15.535.524.824.2
A loam with lenses of medium-grained sand--9.816.59.031.242.7
Medium loam----56.032.211.8
Heavy loam---3.720.558.717.5
Table 2. The results of water percolation tests No. 1 and No. 2.
Water Percolation Test NumberSoil Name and Layer Depth from the Ground SurfaceDateMeasurement NumberMeasurement Time, hour, min.The Time Interval between Measurements, minWater Percolated Volume, dm3Percolated Rate, dm3/minThe Calculated Value of Hydraulic Conductivity, m/day
123456789
Test No 1Sandy loam,
1.2 m.
28 May 2018108.00---1.10
208.0551.500.30
308.1051.300.26
408.1551.100.22
508.2050.950.19
608.30101.700.17
708.40101.650.165
808.50101.550.155
909.00101.400.14
1009.12121.680.14
1109.24121.710.142
1209.36121.680.14
1309.48121.440.12
1410.00121.380.115
1510.15151.500.10
1610.30151.200.08
1710.45151.270.085
1811.00151.260.084
1911.20201.700.085
2011.40201.640.082
2112.00201.600.08
2212.30301.830.061
2313.00301.830.061
2414.00603.600.061
2515.00603.600.061
2616.00603.540.059
2717.00603.540.059
Test No 2,The various grained sand, with up to 30% of fine gravel29 May 2018108.00- -3.13
208.0552.000.40
308.1051.8750.375
408.1551.8750.375
508.2051.8750.375
608.2551.8750.375
708.3051.8750.375
808.40103.750.375
908.50103.650.365
1009.00103.500.35
1109.10103.500.35
1209.20103.000.30
1309.30102.500.25
1409.40102.300.23
1509.50102.250.225
1610.00102.270.227
1710.15153.370.225
1810.30153.150.210
1910.45152.630.175
2011.00152.250.15
2111.20203.000.15
2211.40202.200.11
2312.00201.700.085
2412.30302.850.095
2513.00302.700.090
2614.00605.220.087
2715.00605.220.087
Table 3. Comparative data on the values of the hydraulic conductivity coefficients based on the results of percolated tests and calculations using the empirical equation of Hazen.
Lithological Composition of the Soil Hydraulic Conductivity, m/day The Difference, Abs. Difference, %
Percolated TestsAn Empirical Equation of Hazen
The various grained sand, with up to 30% of fine gravel3.134.50+1.37+6.9
4.325.05+0.73+8.5
Medium-grained sand1.491.91+0.42+7.8
1.641.95+0.01+8.4
Fine-grained sand1.321.36+0.04+1
1.381.35−0.03−1
The various grained sand with lenses of medium loam0.930.94+0.01+0.8
Sandy loam1.101.12+0.02+1
1.181.1800
A loam with lenses of medium-grained sand0.790.81+0.02+1
Medium loam0.710.73+0.02+1
Heavy loam0.110.12+0.01+1
Table 4. Groundwater chemical composition in observation wells W1–W8 during a percolation test in mini pool No. 1 (values in mg/L).
DateW1W2W3W4W5W8
1 March 2017HCO3 68 SO4 23 CI 9
Ca 38 Na 32 Mg 30
HCO3 81 SO4 13 CI 6
Mg 48 Na 30 Ca 22
HCO3 75 SO4 21 CI 4
Mg 39 Na 37 Ca 24
SO4 61 HCO3 33 CI 6
Na 68 Mg 19 Ca 13
HCO3 50 SO4 32 CI 18
Na 50 Mg 31 Ca 19
HCO3 79 SO4 12 CI 9
Na 84 Ca 13 Mg 3
12 June 2017HCO3 54 SO4 35 CI 11
Na 50 Mg 29 Ca 21
HCO3 54 SO4 35 CI 11
Na 50 Mg 29 Ca 21
HCO3 84 SO4 10 CI 6
Mg 45 Na 32 Ca 23
SO4 57 HCO3 32 CI 11
Na 53 Ca 29 Mg 18
SO4 78 HCO3 17 CI 5
Na 62 Mg 31 Ca 7
HCO3 68 SO4 21 CI 11
Na 88 Ca 10 Mg 2
18 August 2017HCO3 67 SO4 23 CI 10
Na 44 Mg 35 Ca 21
HCO3 75 SO4 18 CI 7
Mg 43 Na 38 Ca 19
HCO3 69 SO4 16 CI 15
Na 46 Mg 38 Ca16
SO4 52 HCO3 32 CI 6
Mg 46 Na 40 Ca 14
SO4 68 HCO3 23 CI 9
Na 38 Ca 33 Mg 29
HCO3 57 SO4 25 CI 9
Na 49 Ca 28 Mg 23
30 September 2017HCO3 68 SO4 24 CI 8
Na 56 Mg 26 Ca 18
HCO3 68 SO4 25 CI 7
Na 43 Mg 30 Ca 27
SO4 58 HCO3 37 CI 5
Na 73 Mg 15 Ca 12
HCO3 57 SO4 35 CI 8
Na 50 Ca 41 Mg 9
HCO3 76 SO4 16 CI 8
Na 69 Ca 17 Mg 14
HCO3 80 SO4 16 CI 4
Na 38 Mg 31 Ca 31
Table 5. The content of mechanical particles in the clogging layer.
Number of the Mini Pool Sediment’s NameEffective Diameter of
Mechanical Particles in the Sludge, mm
Size of Fractions, mmTotal Particle Size
0.25–0.050.05–0.010.01–0.0050.005–0.001Less 0.001Less 0.01More 0.01
1muddy clay0.001–0.000514.223.66.824.6530.7537.862.2
2muddy clay0.001–0.000515.1520.469.126.1329.1635.6164.39
3clayey silt0.001–0.00057.316.410.219.646.523.776.3
4muddy clay0.001–0.000511.4422.158.6529.628.1633.5966.41
Table 6. Clogging layer parameters.
Number of the Mini PoolSediment’s NameDirt Holding Capacity, kg/m2The Duration of
Deep Clogging, Day
The Clogging Layer Thickness, mm
MeasuredCalculatedDifference
(calc.-meas.)
A Correlation Coefficient
1muddy clay5.251144.045.31.260.76
2muddy clay3.929864.9−1.10.82
3clayey silt3.8316832.7−0.30.90
4muddy clay3.7215555.30.30.90
Publisher’s Note: MDPI stays neutral with regard to jurisdictional claims in published maps and institutional affiliations.

