1. Introduction
Urbanization and global climate change are two major global environmental phenomena in this century that are closely related and complementary [
1]. In particular, the accelerating urbanization process has led to an ever-increasing demand for urban construction land, and urban construction is developing with a higher density and plot ratio. Therefore, the increase in the number of buildings in urban areas under such a mode of development has changed the characteristics of the original underlying surface of the city, and the heat generated by human activities has changed physical meteorological elements, such as the air temperature, relative humidity, and ground level wind field, thereby forming a local microclimate with urban effect characteristics [
2,
3,
4].
Urban climate change has become one of the most important factors constraining urban development, and urban construction projects are being carried out worldwide to adapt to urban climate change. As early as the 1970s, some scholars found that urban green spaces could increase the relative air humidity and decrease the air temperature through plant photosynthesis and transpiration, which mitigate the heat island effect in the city [
5]. Since then, the number of studies on the role of urban green spaces in improving the microclimate has gradually increased, and urban green spaces have become the focus and subject of research for many scholars.
Existing studies on the impact of urban green spaces on the urban heat island effect are primarily conducted through actual measurements, remote sensing, and software simulation. Such studies consist at the macroscale, mesoscale, and microscale [
6]. The macro scale [
7,
8,
9,
10] mainly refers to studies carried out using remote sensing technology in urban areas; the mesoscale [
11,
12,
13,
14,
15,
16,
17] mainly refers to studies by means of field observations or simulations in urban areas; and the microscale [
18,
19,
20,
21,
22] mainly refers to measurements of the impacts of plants and water bodies on the microclimate at fixed points or software simulations of the microclimate. Since the early 1980s, microclimate simulation of outdoor environments has gradually shifted from mesoscale field observations to microscale software simulations [
23,
24,
25,
26,
27,
28,
29,
30,
31,
32]. At present, ENVI-met and CFD simulation software are the most widely used simulation tools, with ENVI-met being able to construct a more comprehensive plant model compared to CFD software, and it plays an important role in the research on green space [
33,
34,
35].
Many researchers have explored how different green space patterns affect the surrounding microclimate through the relationship between various green space landscape pattern indexes and the land surface temperature [
36,
37,
38,
39,
40]. For instance, Masoudi and Tan (2019) [
41] analyzed the correlation between various urban green patterns and land surface temperature in Singapore over multiple years. There were 14 different landscape metrics that were used to quantify the spatial patterns of urban green space, such percentage of landscape, edge density, patch density, mean patch size, and aggregation index, in the study. They found a greater number of and larger green spaces that were simpler in shape, more connected, and aggregated, and which were connected with lower land surface temperatures. In addition, Wu and Zhang (2011) [
42] analyzed the correlation between green space shape index and land surface temperature, and found that the wedge-shaped green space had the best cooling and humidifying effect among the four square green spaces in Beijing, namely, square, triangle, rectangle, and wedge-shaped green spaces. Park and Cho (2016) [
43] explored the cooling distance and intensity of 30 green spaces in Ulsan, Korea. In this research, the landscape shape index was an important landscape pattern index that was considered. They found that the cooling island effect produced by these green spaces mainly kept to within 120 m of such spaces, with the maximum cooling effect as far as 3.0 K. However, there are few studies that focused on classifying green spaces of different blocks according to the green space pattern of the block scale and on exploring the influence of each type of green space pattern on the surrounding land surface temperature. Most of the above studies analyzed the correlation between the green space landscape pattern index and the surface temperature based on the inversion of the urban scale surface temperature and the urban scale green space layout. These studies explored very little regarding the microclimate around the green spaces. Duan (2017) [
44] classified the green space pattern at the block scale in Beijing and simulated it with the software ENVI-met, which well simulated the microclimatic conditions, such as temperature, humidity, wind direction and speed around the green space and the differences in the microclimate conditions under the different green space layouts. Yet, there are a limited number of studies that classify the green space layout at the block scale and study the effect of the different green space layouts on the surrounding microclimate. Inspired by Duan (2017) [
44], this study suggests that it is necessary to further explore the effect of the block-scale green space patterns on the surrounding microclimate. Some researchers who used ENVI-met to evaluate human thermal comfort have identified high modeling accuracy. Sinsel (2022) [
45] measured and simulated the mean radiant temperature at six sites in Hong Kong. The mean radiant temperature is an important element in evaluating human thermal comfort. They implemented a six-directional radiative flux calculation approach and used three established shortwave radiation projection factors in ENVI-met. Researchers found that the simulation results showed high agreement with the measurements (R
2 = 0.9; d = 0.95) and low error magnitudes (RMSE = 3 K, MBE = 1.2 K). Ma et al. (2019) [
46] explored the outdoor thermal comfort of a commercial pedestrian block in Taizhou, China. To explore the rationality of the simulation study, they analyzed the correlation between the measured values and the simulated values of the temperature and humidity. In their diagram, the R
2 between the measured values and the simulated values was between 0.741 and 0.9693. Based on this, they pointed out that the simulation results were highly reliable. Cao et al. (2021) [
47] used ENVI-met to explore the influence of landscape tree species on human thermal comfort in cold seasons. Aiming to verify the reliability of the ENVI-met model, with the green space on the south side of the Tianjiabing Engineering Institute of Jiangsu Normal University as the test site, the researchers carried out a verification experiment on the winter wind speed. The results show that there was a strong correlation between the measured and simulated wind speeds, with R
2 as 0.719. In this study, PET was used as a measure of human comfort, and it was found that plants could improve PET to varying degrees in cold seasons.
In 1963, 1969, and 1970, Olgyay, Givoni, and Fanger, respectively, conducted the earliest research on bioclimate. Subsequently, various thermal indices that calculate bioclimatic and thermal comfort conditions were developed [
48]. Bioclimate indices have the strength of being able to consider the physiological system’s perception of climate characteristic [
49]. In recent years, a large number of researchers used bioclimate indices to explore urban and rural microclimate environments. To better understand the bioclimate situation in Iranian cities, Roshan et al. (2022) [
50] identified bioclimate zones in Iran based on the perceived temperature, PET, PMV, SET, and universal thermal climate index (UTCI). The researchers found that Iran can be divided into five bioclimate regions. Every region has specific patterns regarding the occurrence of a thermal threshold. This finding is beneficial for guiding land use and energy planning in Iran. Yeo et al. (2021) [
51] explored the influence of land use and land cover on human thermal comfort based on PMV and PET. They found that suburban and rural residents are less likely to suffer from heat stress than urban residents. A tree-covered area with a river in a rural area affords the best thermal experience. Zafarmandi et al. (2022) [
52] conducted a study on a university campus in Tehran to explore the most applicable bioclimate indices. Based on measured data and questionnaires, the researchers found that PMV and PET are better predictors than UTCI and SET in a semi-outdoor environment in the summer and winter. In general, few researchers use bioclimate indices to explore the impact of green space landscape patterns on urban thermal comfort.
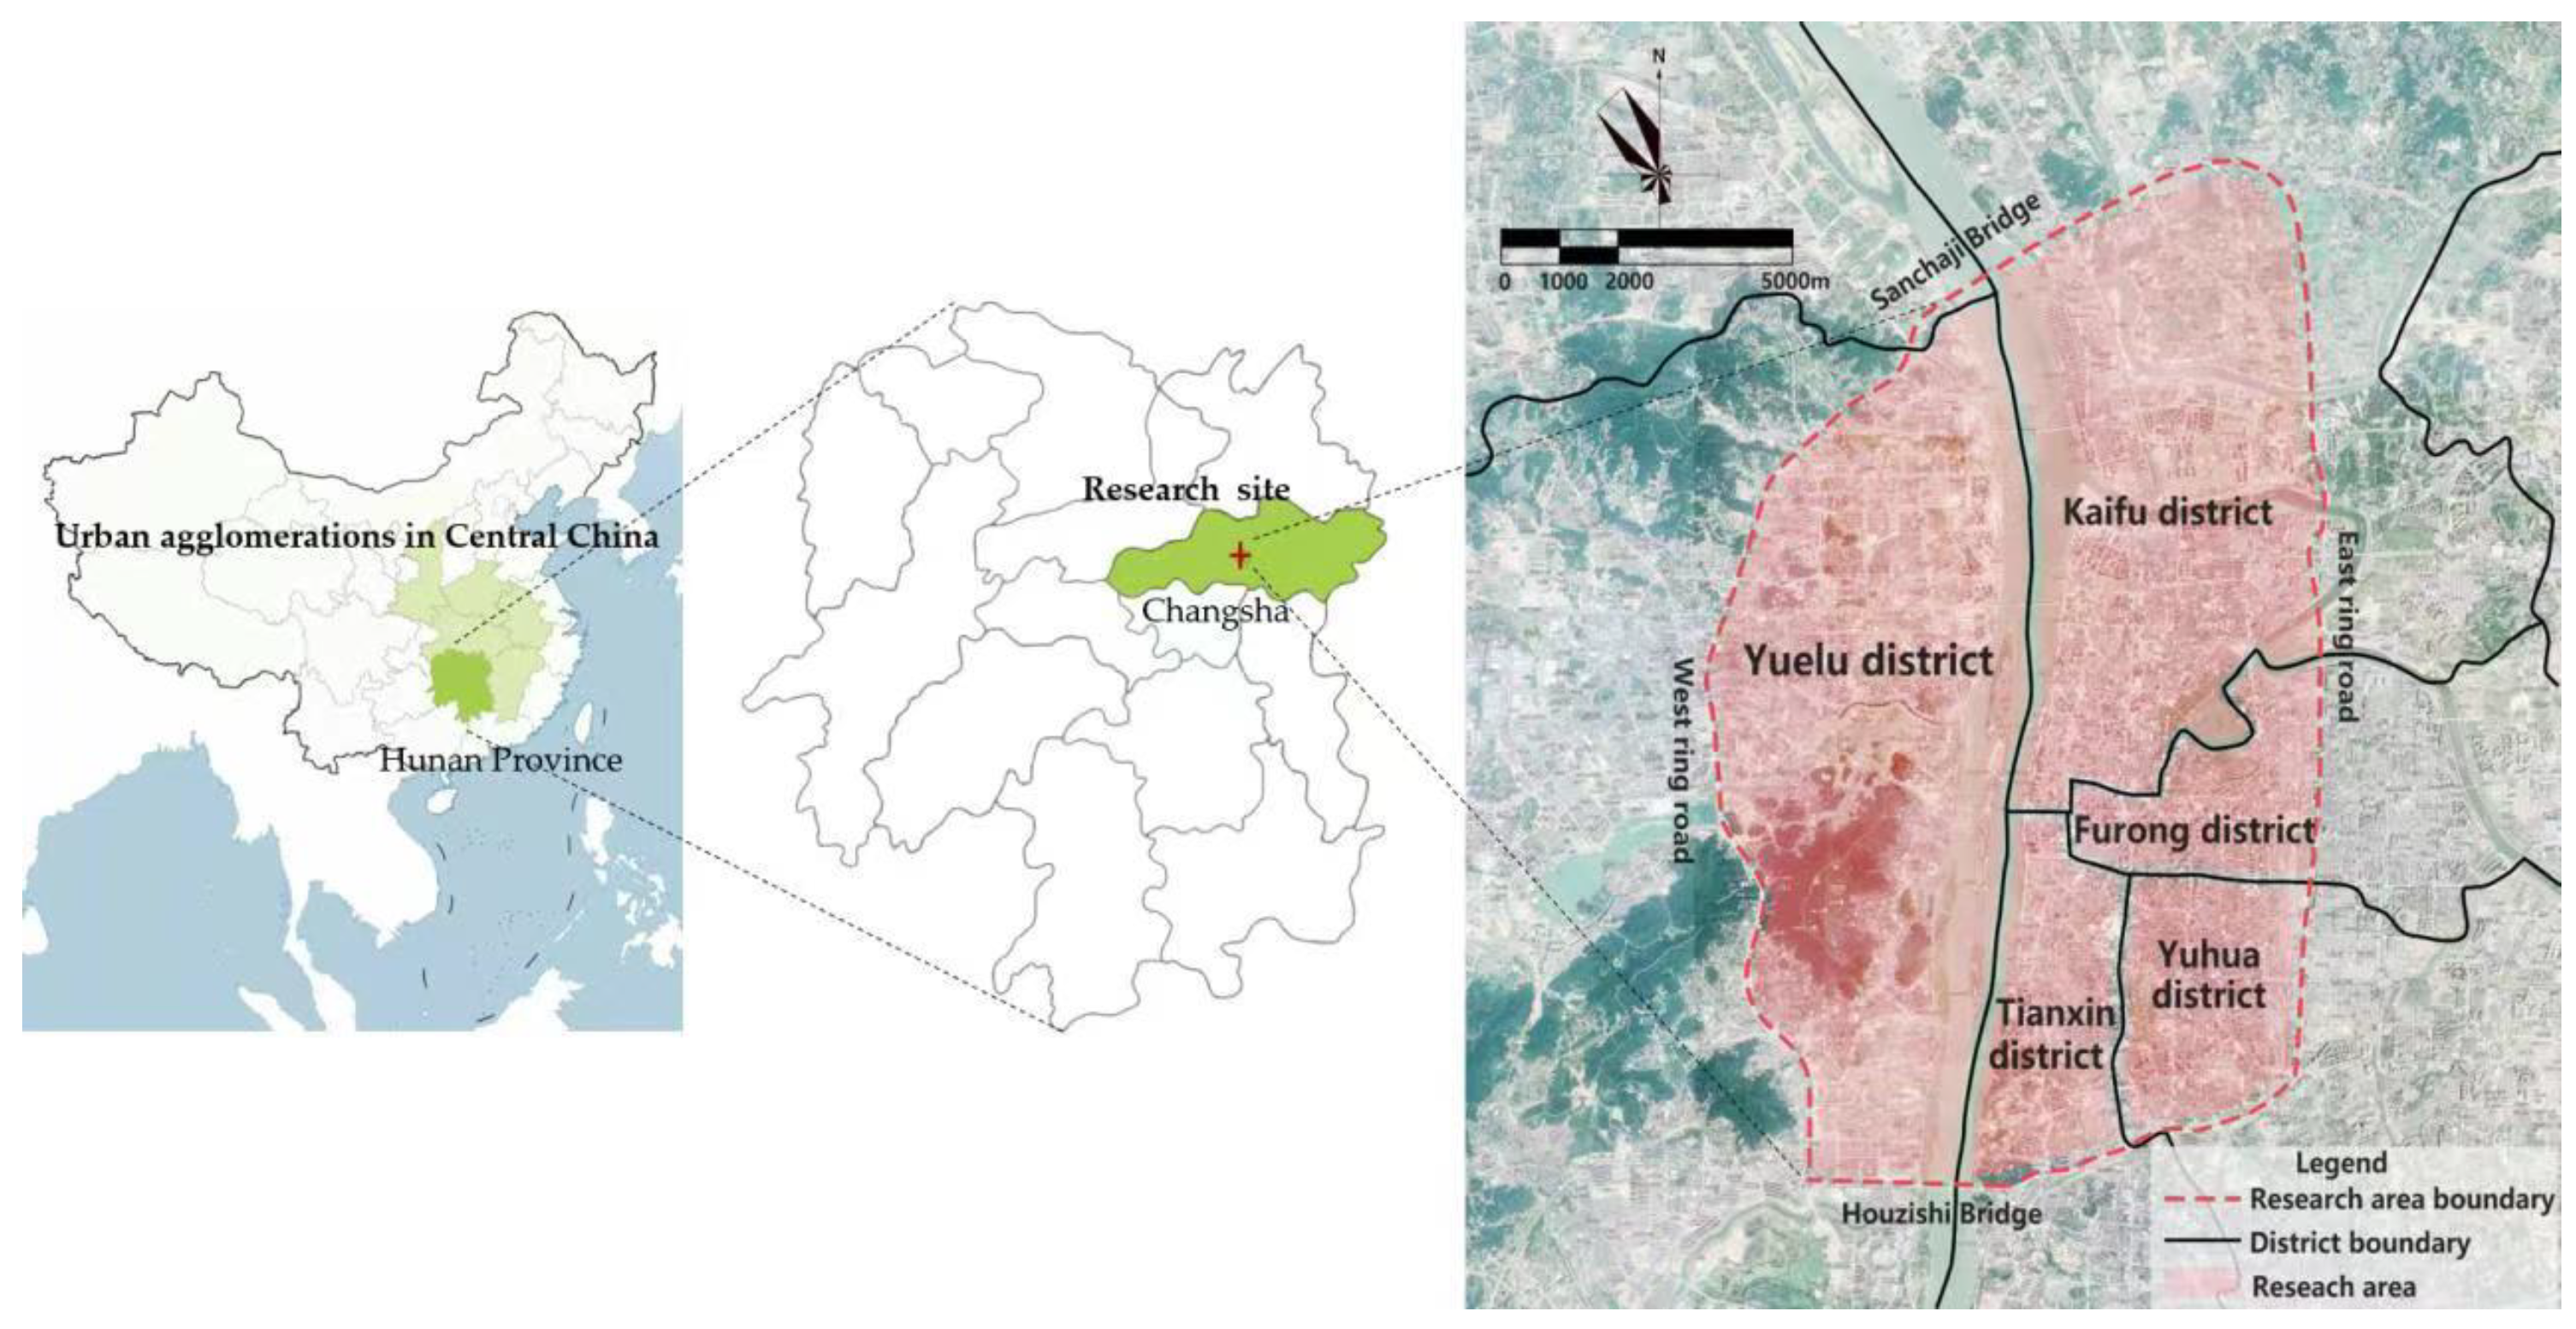
This paper aimed to study the microclimate of green space patterns in urban blocks at the microscale. Compared to those at the macroscale, studies at the microscale are more relevant to people’s lives. The urban block is, moreover, the most basic constituent cell of the urban organism, as the urban block is the basic unit for urban planning [
53]. Therefore, the microclimate of the urban block’s green space pattern has research relevance considering the advantages and disadvantages of actual measurements and software simulation, that is, its actual measurement has high accuracy but high cost, and software simulations have low cost but uncertainty concerning whether it can adapt to outdoor environments, with great random variability in meteorological parameters. In this paper, ENVI-met was selected as the software for the research, and a feasibility analysis was conducted to assess its suitability for the microclimate research. If applicable, the software simulation analysis method will be adopted for future research.
3. Results and Discussion
3.1. Research Results of the Green Space Patterns in the Urban Blocks
There were a total of 1101 blocks within Changsha’s second ring road. The statistics show that there was a certain regularity to the different block types’ land area of the block, the ratio of the block’s green space area to the building area, and the ratio of the block’s green space perimeter to the green space area. The researchers classified the green spaces into different types based on the spatial layout of the green spaces and buildings. Each type had characteristics that other ones did not feature. We found through extensive research that our block-scale green space pattern classification shared a similarity to a great extent with Duan’s (2017) [
44] classification, which further explains the rationality of this green space classification method.
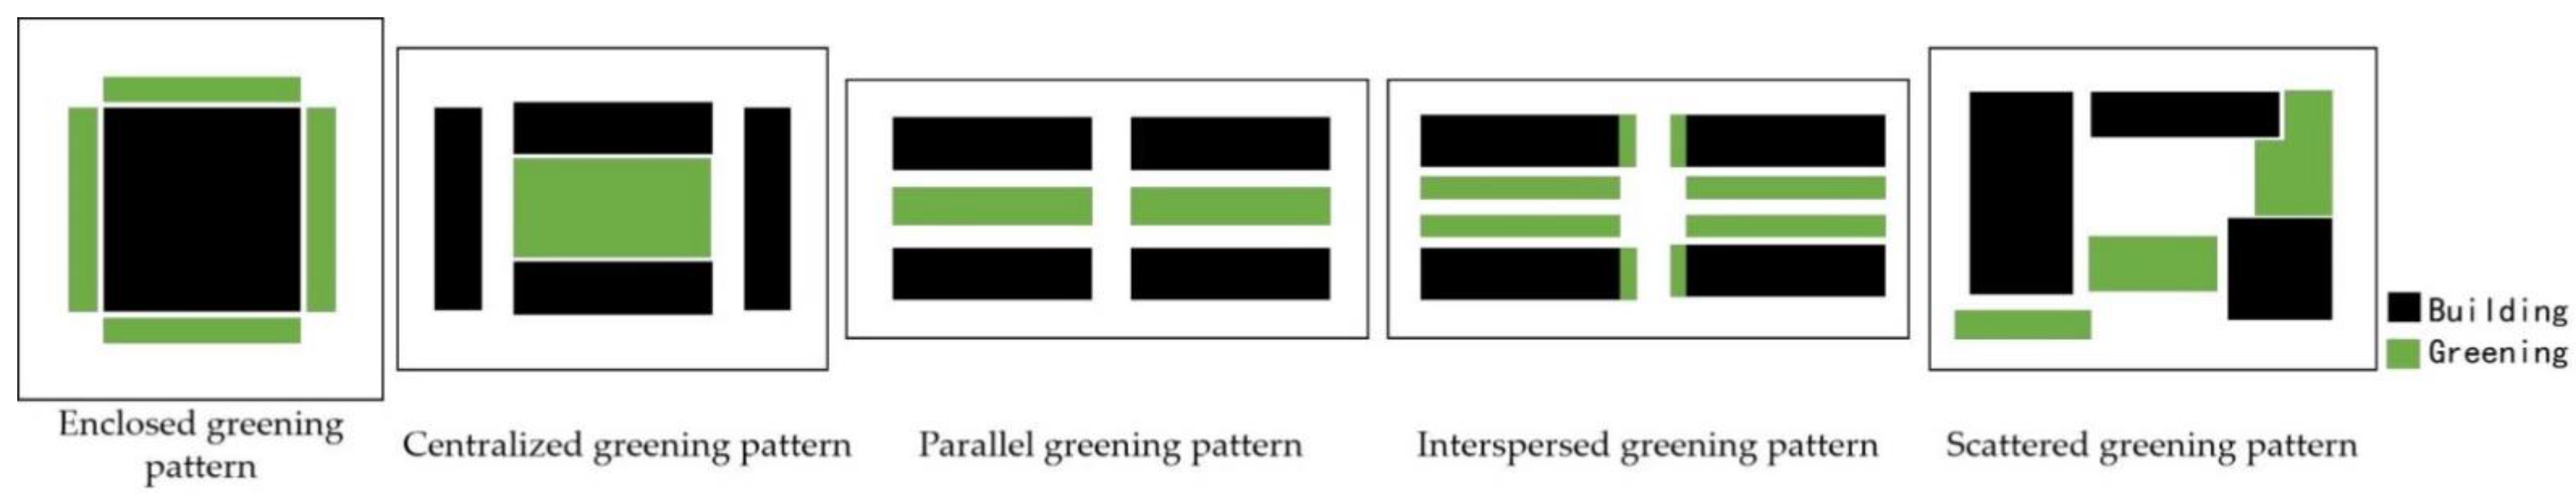
Upon visually assessing and analyzing the texture relationship between the block buildings and the green space, it was concluded that the green space pattern in the urban blocks could be divided into five types: enclosed greening pattern, centralized greening pattern, parallel greening pattern, interspersed greening pattern, and scattered greening pattern. You can find the basic characteristic of each greening pattern in
Figure 10. Since some blocks were very large and the layout between the buildings and the green spaces was complex, if only one classification of the green space pattern was adopted, it may result in some classifications that did not reflect the characteristics of some blocks properly. If different parts of the same blocks featured different types of characteristics, then researchers further classified the blocks into several parts based on the layout between its green spaces and buildings, and each part would have one of the five types of green space layout characteristics mentioned above in a very obvious way. So, Therefore, multiple green space patterns may exist in the same blocks due to the fact of their various conforming characteristics.
The enclosed greening pattern refers to the fact that the green space is arranged around the building, most of which were large and required an open space for activities. As shown in
Figure 9 and
Figure 10, a unique feature of the enclosed greening pattern was that all of the buildings were adjacent to green space around them or separated from the green space by only a road. In addition, as long as all buildings were adjacent to green space or separated from green space by only a road, it did not matter whether the green spaces surrounding them had the feature of other types of green space areas. For example, even if the green space was parallel to buildings (a feature of the parallel green space areas), researchers classified them as an enclosed greening pattern. From the perspective of urban spatial planning and design, due to the large floor area and larger population that passes by during normal hours in many major public buildings in China, such as movie theaters, university teaching and educational buildings, and department stores, researchers believe that more green spaces are usually required to maintain enough open space around buildings and to improve indicators, such as thermal comfort, air quality, and a green visual ratio. In addition, clear minimum standards for the green plot ratio are proposed in some urban planning and design codes in China. For example, the green plot ratio of residential areas should be no less than 30%, which is proposed in the thermal environment design standards for urban residential areas in China [
73]. The enclosed greening pattern designed around some buildings with large areas is also conducive to meeting the corresponding standards for the green plot ratio. According to our observation, many public buildings with large areas and their surrounding green spaces conform to the features of an enclosed greening pattern. In addition, this pattern is mainly found in commercial blocks, business blocks, and office blocks.
A centralized greening pattern refers to a green space that is arranged in the center of buildings. As shown in
Figure 8 and
Figure 10, such a green space must be surrounded by buildings. Similarly, researchers clearly defined that a green space is classified as a centralized greening pattern as long as it conforms to the above features, regardless of whether it has other features. During the investigation, the researchers found that many urban gardens, especially pocket gardens, and the buildings around them constitute such areas with a centralized greening pattern. Researchers believe that such green space research has good guiding significance for urban garden construction. In general, it is commonly seen in relatively closed-off campuses and office blocks with fixed users. In addition, it is also adopted in some residential blocks, commercial blocks, and business blocks.
A parallel greening pattern refers to a green space that is parallel to the building. As shown in
Figure 7 and
Figure 10, there is a regular parallel distribution between green spaces and buildings in the parallel greening pattern. Such areas border the building on at least one side or is separated from the building (instead of a green space) only by a road. Therefore, such an area does not show the feature that all buildings are adjacent to green spaces around them or are separated from green spaces only by a road. In addition, a green space that adjoins the building on at least one side or is only separated from the building (instead of a green space) by a road also does not show the feature that the green space is surrounded by buildings. Real estate developers usually try to increase the plot ratio of real estate development projects to achieve greater returns, but, at the same time, they need to design good greenery to attract buyers. Such green space layouts usually cater to their needs. This type of greening pattern is mainly seen in residential blocks with good connectivity (including residential blocks with high-rise buildings and residential blocks with multistory buildings) and in comprehensive blocks.
As shown in
Figure 10, in an interspersed greening pattern, all buildings have green spaces parallel to their long sides and short sides in areas between buildings. This forms a more intensive area with an interspersed greening pattern between the buildings. However, in an area with an interspersed greening pattern, not all buildings conform to the feature or are connected to a green space around them or separated by only a road (e.g., all buildings in the interspersed greening pattern in
Figure 10 have green spaces only on two sides rather than four sides). Therefore, such a greening pattern and those with an enclosed greening pattern exhibit a very distinct feature. The interspersed greening pattern in
Figure 10 is only a representative of this type, and different green spaces in the interspersed greening pattern in
Figure 10 do not overlap. It is also defined as an interspersed greening pattern if in the area enclosed between buildings, each building has green spaces parallel to its long side and short side, and several strip green spaces overlap. During the design of many residential communities, some real estate developers sometimes design the green spaces in the street as an interspersed greening pattern to better arrange the green spaces in the communities and improve the environment of the communities, thereby attracting more buyers. Therefore, such green spaces are also increasingly being used in residential communities.
It can be seen in
Figure 10 that the area with a scattered greening pattern, which does not correspond to the feature that all green space is surrounded by buildings and all buildings are surrounded by green spaces, because of the relative disorder of arrangement of buildings and green spaces and green spaces with complex shapes, there is no parallel relationship between all green spaces and all buildings as well as no crisscrossed ecotone of green space between buildings. Researchers uniformly define such areas as areas with a scattered greening pattern. According to our research, many naturally formed urban centers and old areas without good planning conform to this feature.
3.2. Feasibility Verification Results of the ENVI-met Software
3.2.1. Analysis of the Feasibility Verification Results in the Summer
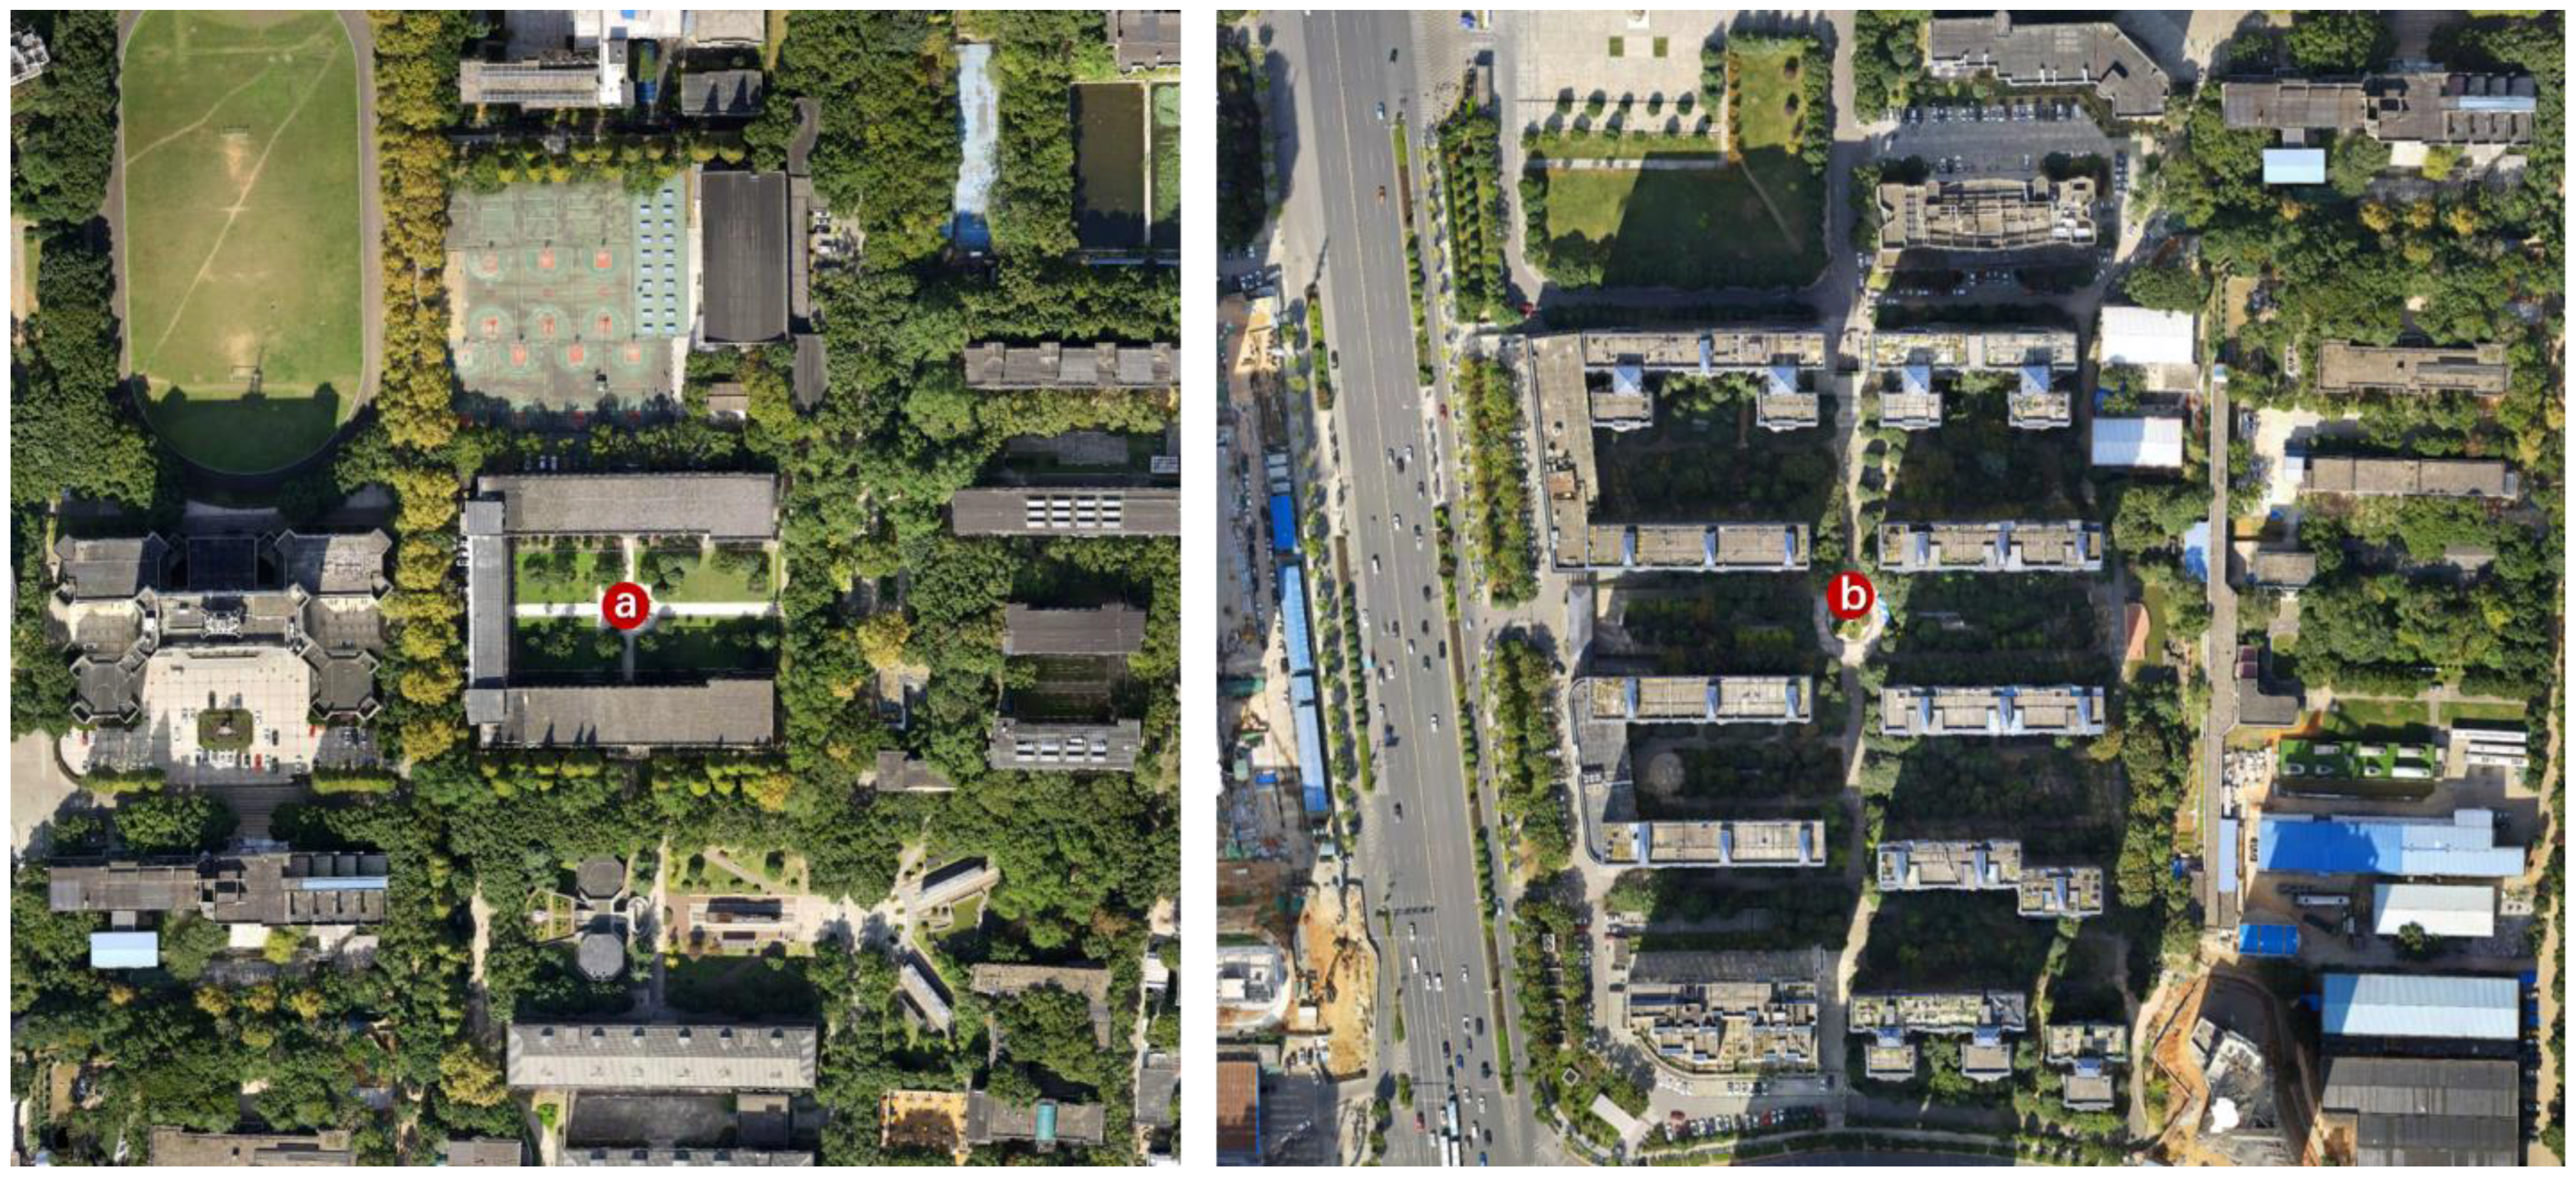
First, the researchers built three-dimensional models in the ENVI-met according to the actual situation of Chuangye Building (multistory) and its surrounding area and Tongtai Meiling Yuan (high-rise). In each of the two areas, a model was built. During the simulation, the researchers input the measured hourly temperature, relative humidity, wind direction, and wind speed from 8:00 to 20:00 on 7 August 2020 into the ENVI-met software. The researchers performed two simulations. Namely, the Chuangye Building (multistory) and its surrounding area and Tongtai Meiling Yuan (high-rise) were simulated under the relevant meteorological parameters on August 7. The simulation results showed the hourly temperature, relative humidity, wind direction, and wind speed of the two blocks from 8:00 to 20:00 on August 7. The researchers input the simulated results of temperature, relative humidity, and wind speed into the Bio-met module of ENVI-met and simulated the thermal-comfort PET, PMV and SET values of the two models from 8:00 to 20:00 on August 7. For each model at each hour of the simulated period, a thermal comfort map within the study area was drawn. The thermal comfort simulation maps (including PET, PMV and SET) at 10:00, 14:00, and 18:00 on August 7 were selected by researchers from the simulation results of the two models for analysis. The thermal comfort conditions at point a was extracted by the researchers from all simulation results of Chuangye Building (multistory) and its surrounding area model, while the thermal comfort at point b was extracted by them from all the simulation results of Tongtai Meiling Yuan model.
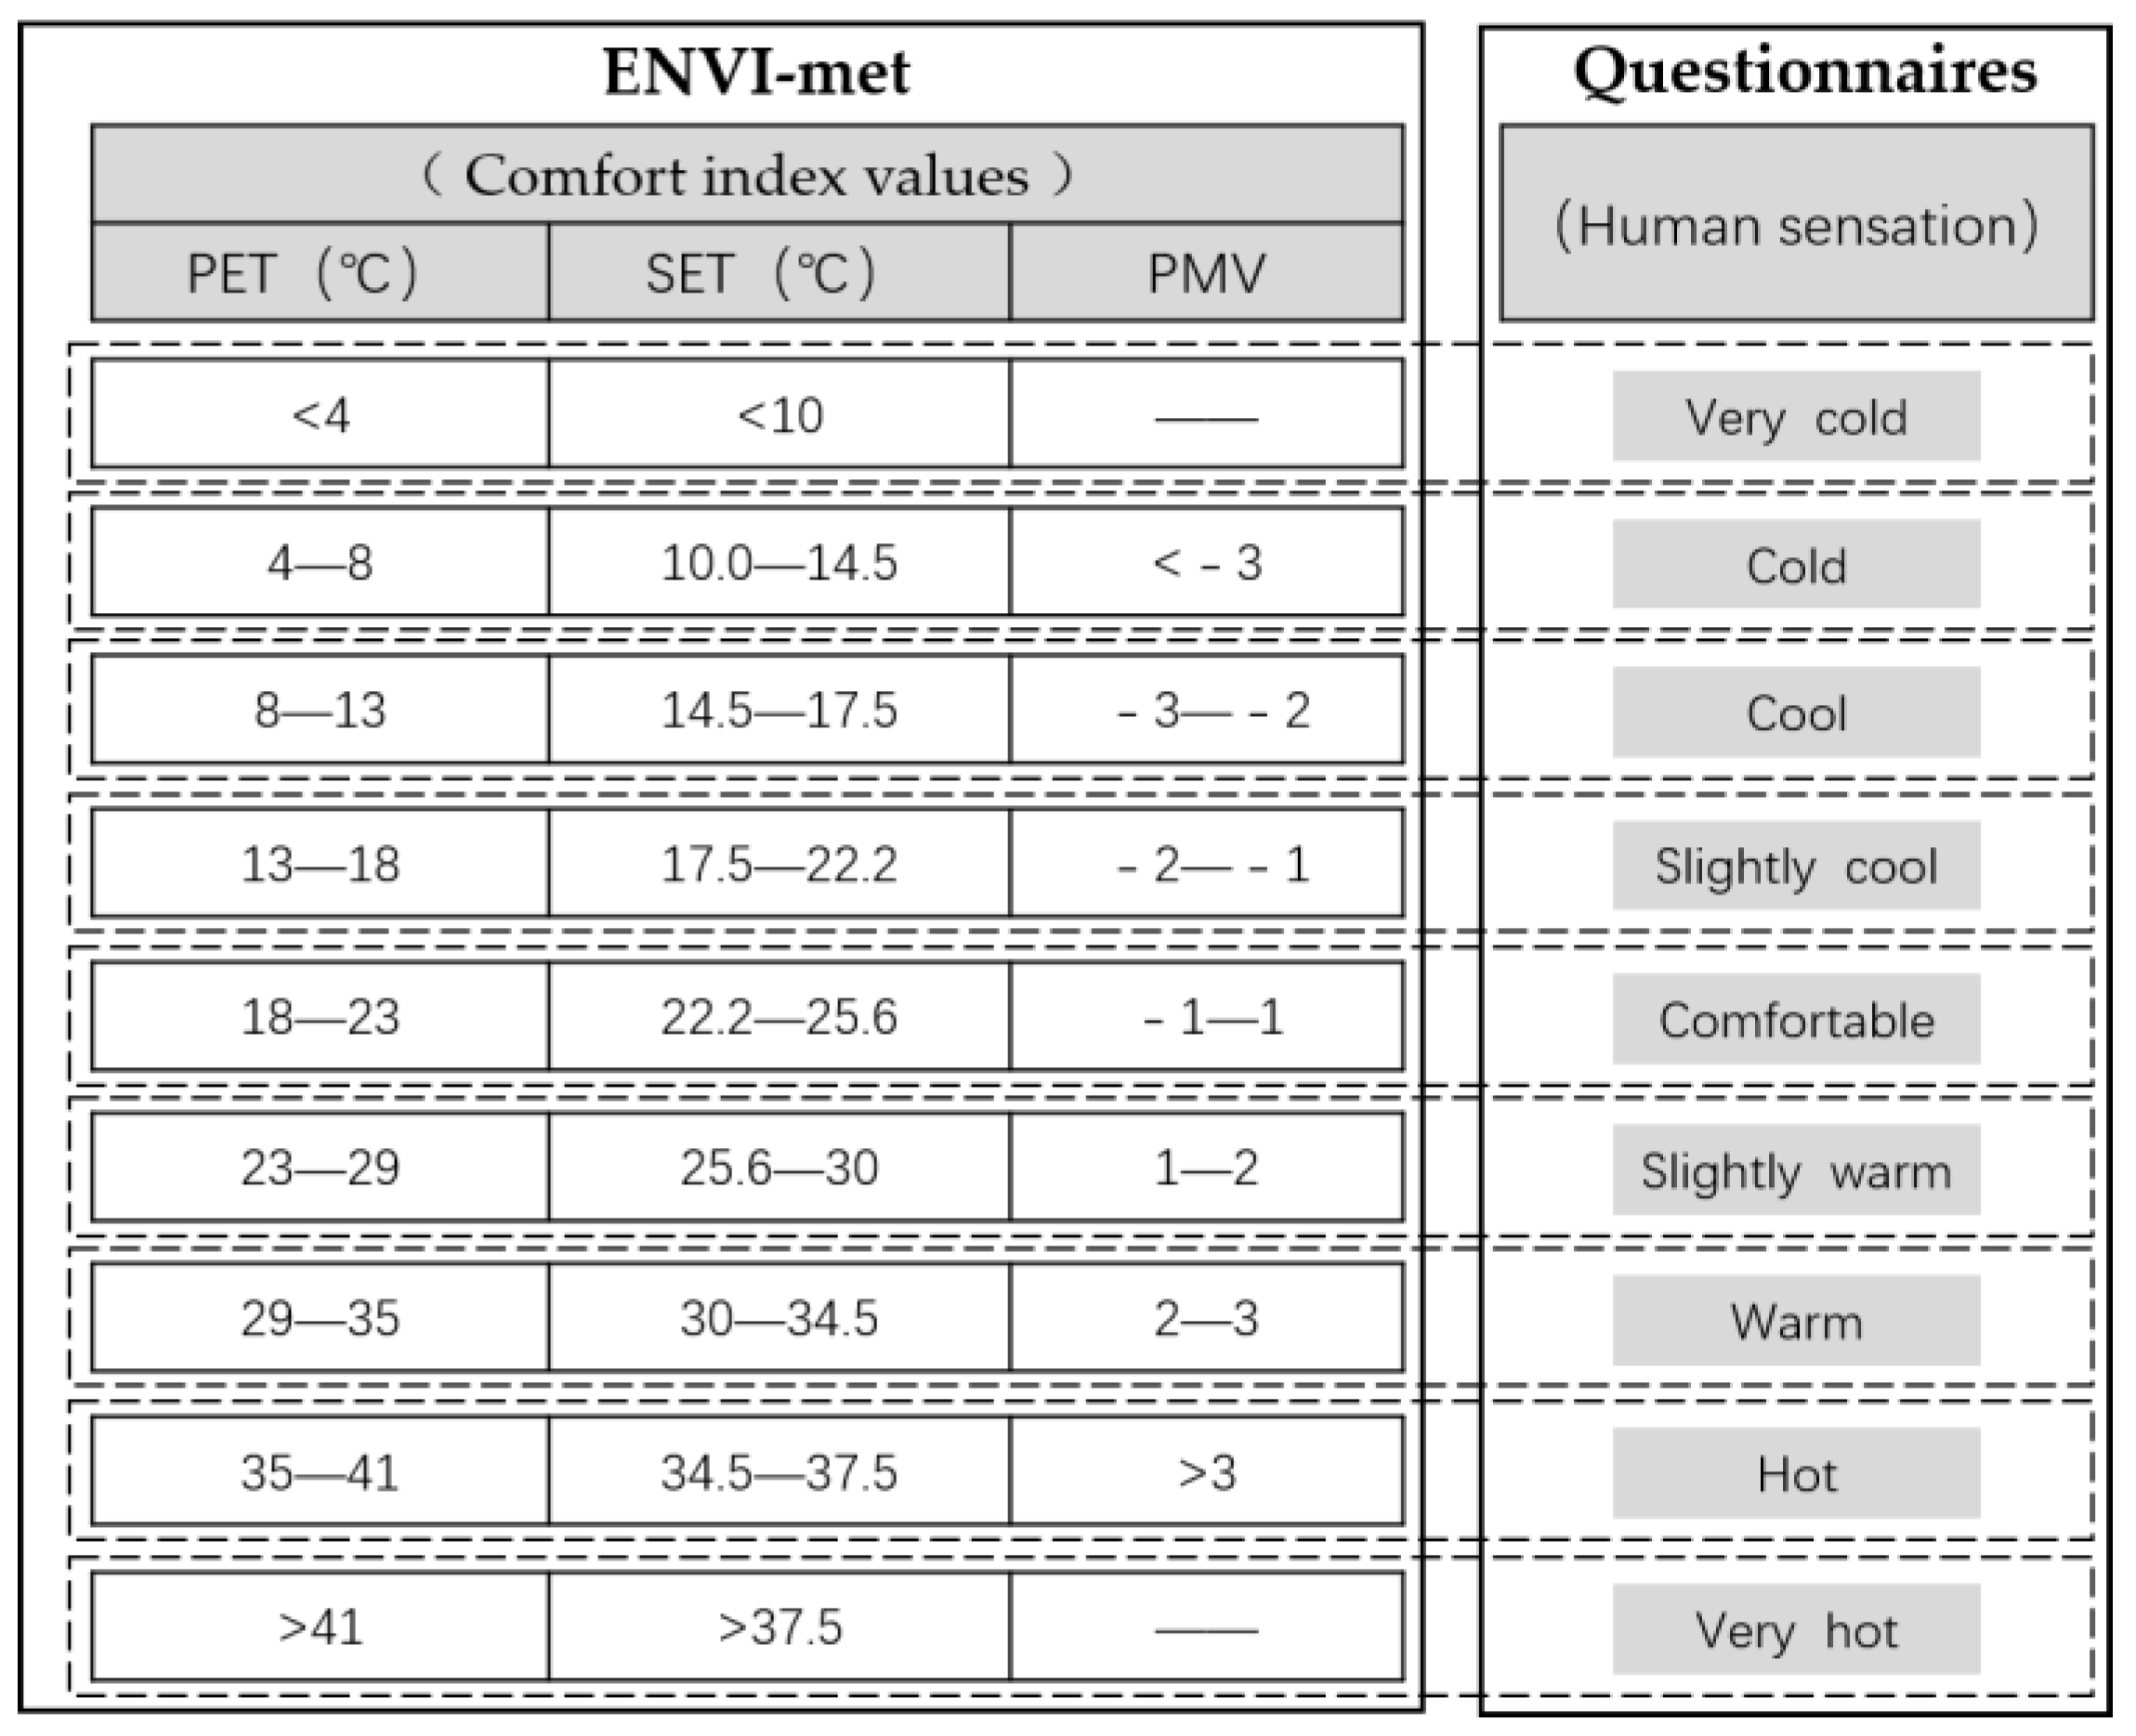
Table 1 below shows the thermal comfort conditions at each observation point during each time period. In addition, the researchers summarized the sensation of thermal comfort corresponding to the value ranges of all PET, SET, and PMV based on the relevant literature. The researchers determined a corresponding human sensation for each thermal comfort value.
The researchers investigated the thermal comfort of passengers from 10:00 to 11:00, 14:00 to 15:00, and 18:00 to 19:00 on 7 August 2020 at observation sites A and B, respectively. The researchers obtained a total of 61 questionnaire results at observation site A and 70 questionnaire results at observation site B. The number and results of questionnaires obtained at each observation site in each time period are shown in
Table 2 below. The total sample size for comparison was 131. In other words, each questionnaire obtained from each observation point in each time period can be compared with the human perception of the corresponding point in the corresponding time period according to each thermal comfort index (i.e., PET, PMV, and SET). The human perception obtained according to each thermal comfort index can be compared 131 times with the questionnaire surveys. The difference between the sample size of this study and that of similar studies was small, and the sample size was reasonable [
74,
75,
76]. By comparing the thermal comfort feelings obtained from the thermal comfort indexes (i.e., PET, SET, and PMV) in
Table 1 and those directly obtained from the questionnaire survey in
Table 2, the researchers believe that the simulation effect of thermal comfort in the summer with the PET and PMV is better in this study. The researchers decided to use the PET and PMV in all subsequent summer thermal comfort simulations.
3.2.2. Analysis of the Feasibility Verification Results in the Winter
Through ENVI-met, the researchers simulated the hourly temperature, relative humidity, and wind speed in the two areas of Chuangye Building (multistory) and its surrounding area and Tongtai Meiling Yuan from 8:00 to 20:00 on 15 December 2020. In Bio-met, researchers simulated the hourly PET, PMV, and SET values of the study areas based on simulated temperature, relative humidity, and wind speed. In the ENVI-met, researchers extracted hourly PET, PMV, and SET simulation values of observation point a around the Chuangye Building and observation point b in the Tongtai Meiling Yuan. After all the thermal comfort indexes (i.e., PET, PMV, and SET) were extracted, researchers determined the human sensation evaluated by PET, SET, and PMV in each period according to the thermal comfort indexes and corresponding human sensation in
Figure 4. The researchers also obtained the subjective thermal comfort of pedestrians in the two study areas through a questionnaire survey. On 15 December 2020, the researchers investigated the thermal comfort of passersby from 10:00 to 11:00, 14:00 to 15:00, and 18:00 to 19:00 at observation sites a and b. The researchers collected a total of 39 questionnaires at the observation site a and 62 questionnaires at the observation site b. The total sample size for comparison is 101. In other words, the questionnaire results of each observation point at each time period can be compared with the thermal comfort value determined by the thermal comfort index of each point at each time period. By comparing the human sensation obtained from various thermal comfort indexes at each observation site in each time period in
Table 3 and the questionnaire survey results of pedestrian thermal comfort perception at each observation site for each time period in
Table 4, one can see that the human sensation reflected by the PET and SET values was highly consistent with the thermal comfort perception of most pedestrians. In this study, the PET and SET values were used to simulate the thermal comfort in the winter.
3.3. Analysis of Characteristics of Microclimate Environment of Green Space Patterns in Urban Blocks
3.3.1. Comparison Results of the Microclimate of Green Space Patterns in Urban Blocks
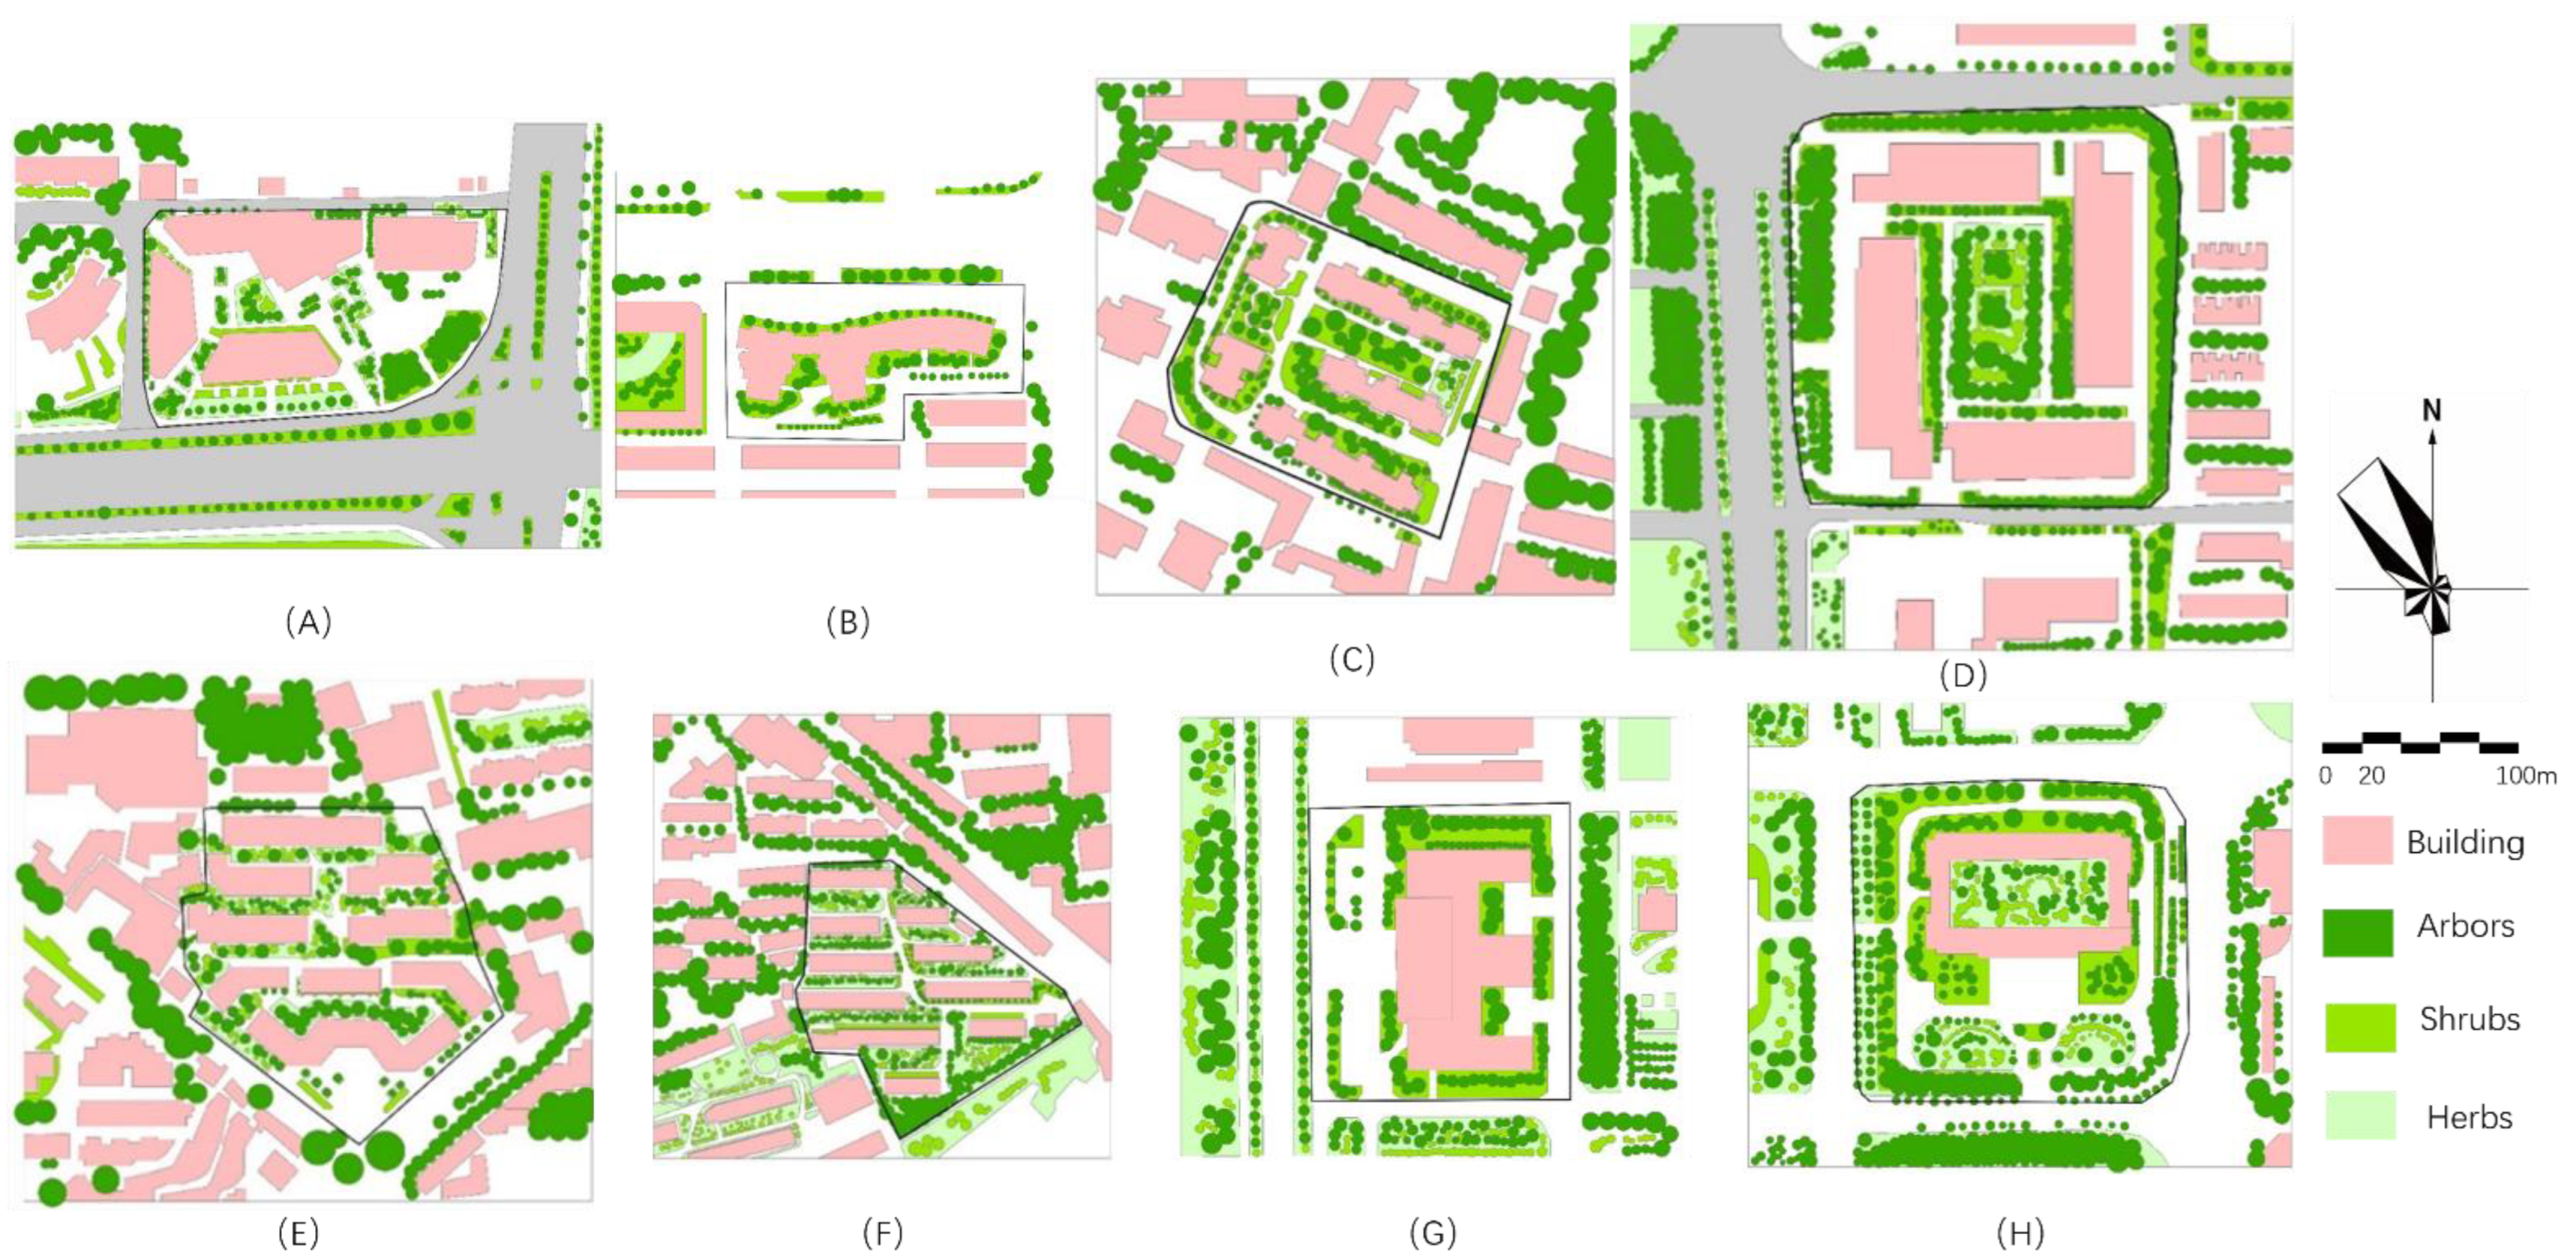
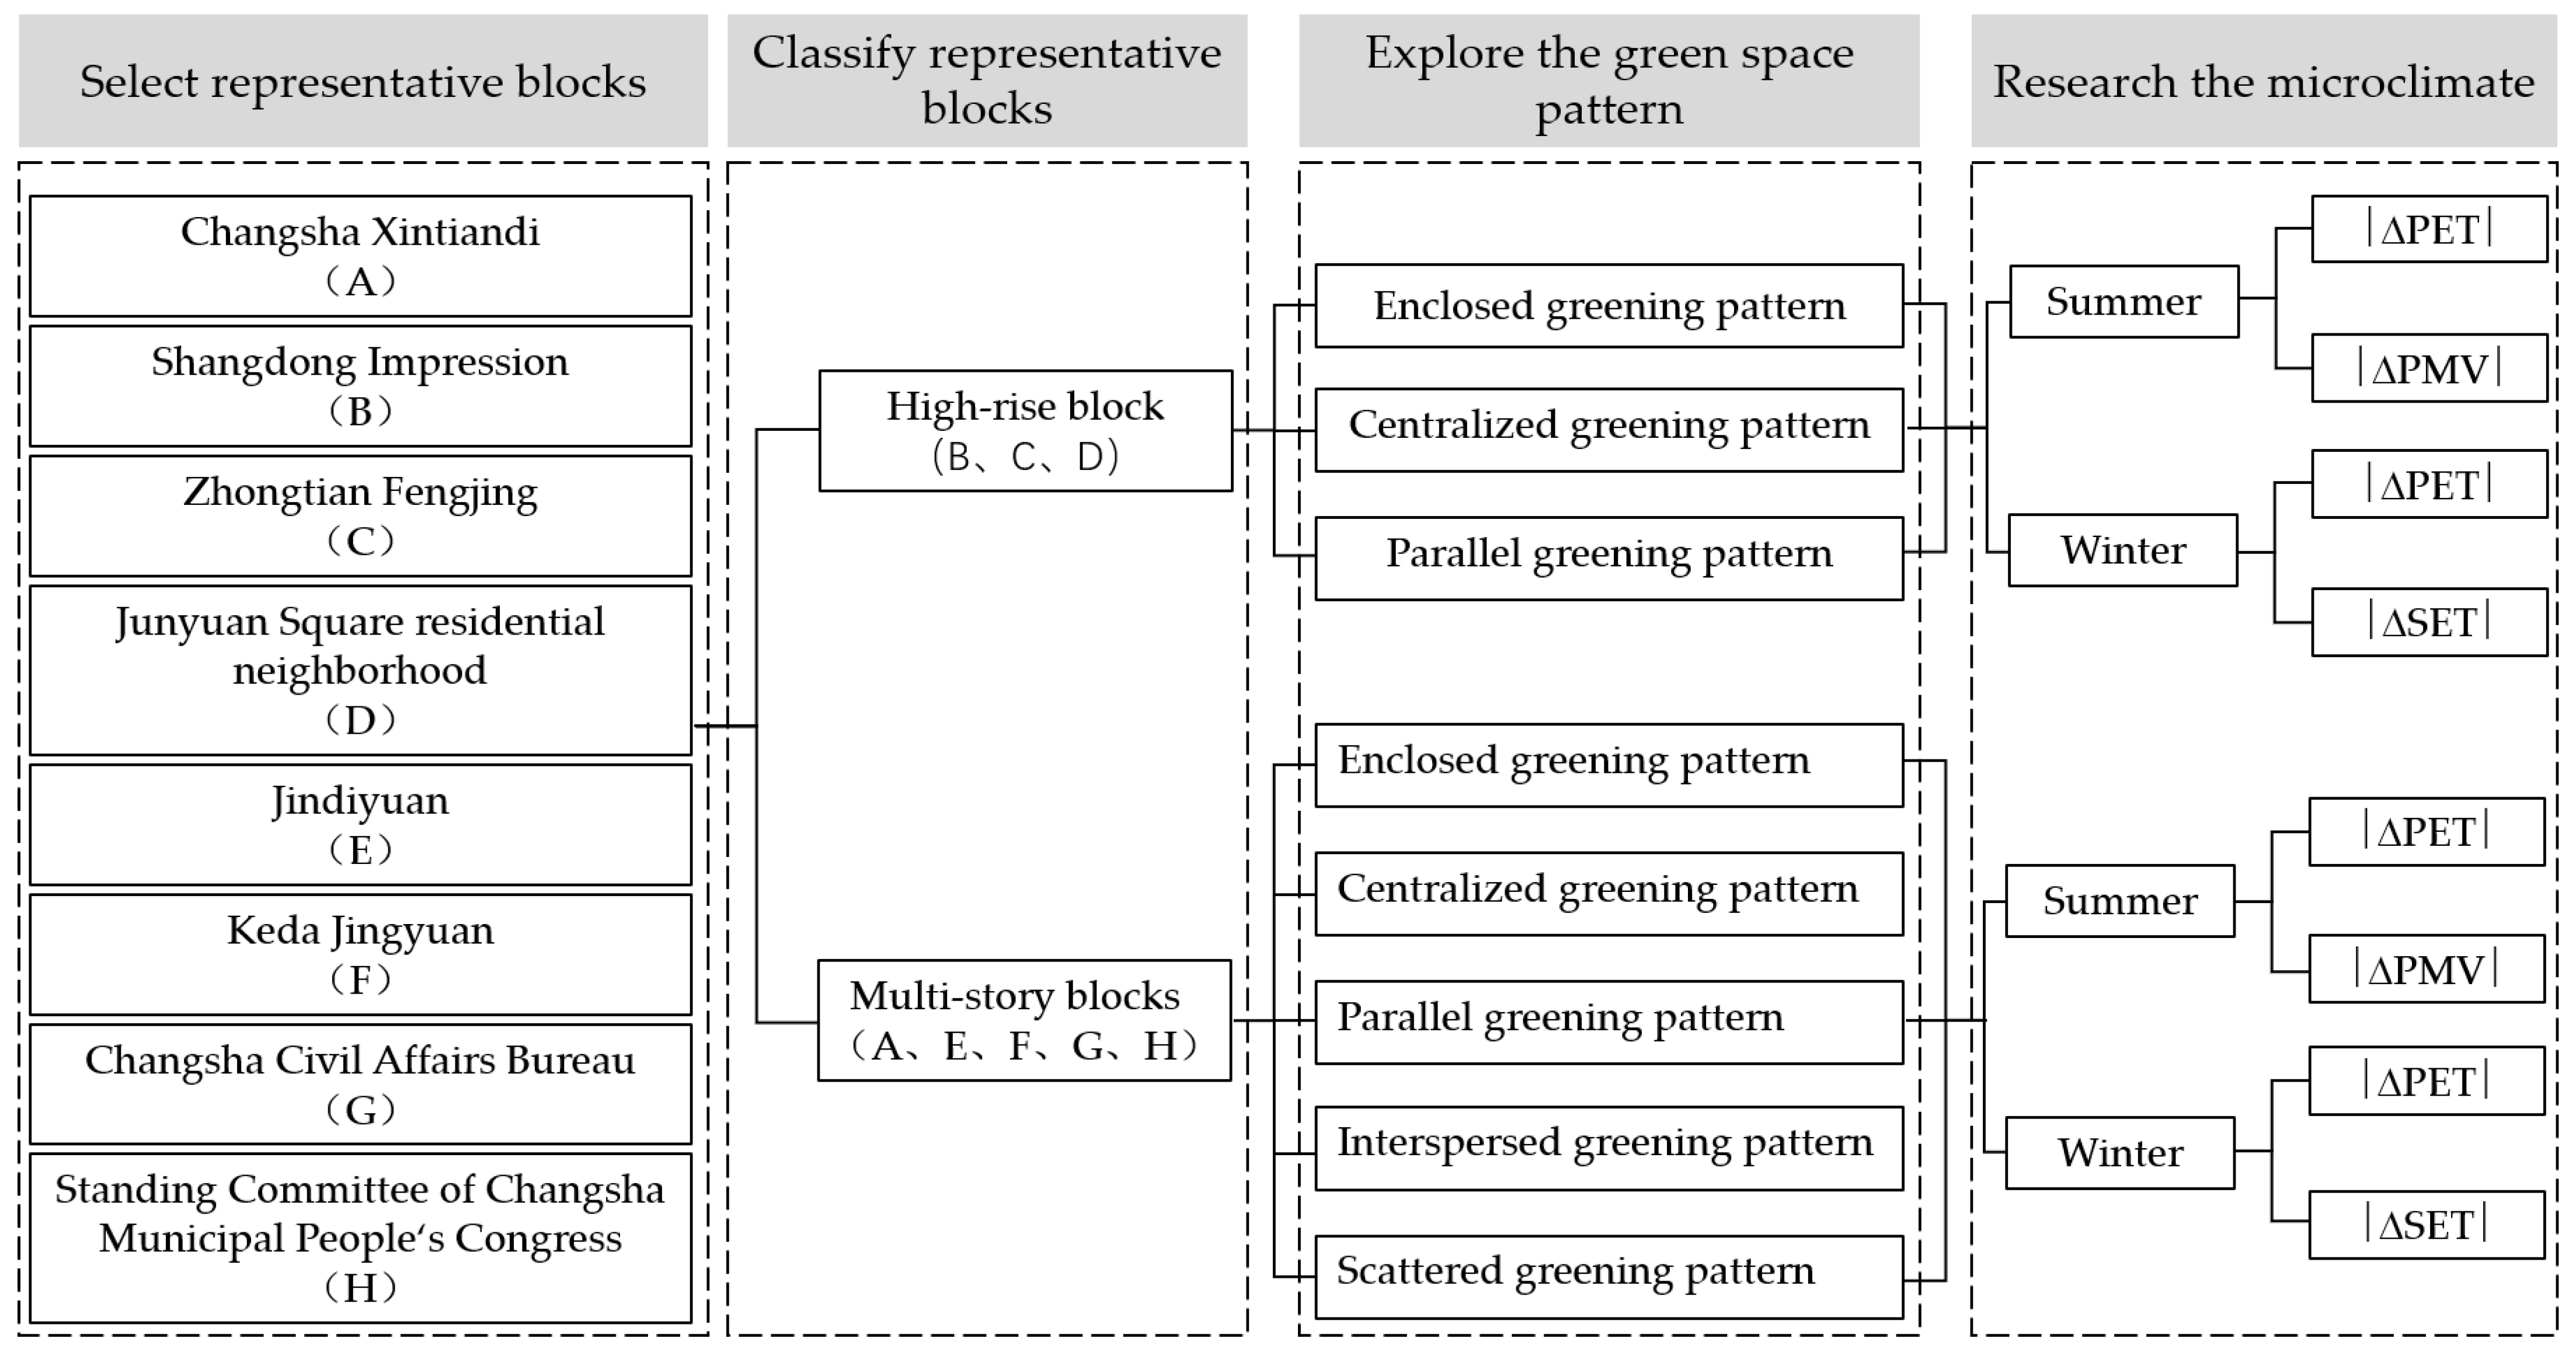
The subjects of the research were commercial blocks, business blocks, residential blocks, and office blocks (industrial blocks and comprehensive blocks had weak regularity and were not studied at this step), which included multistory buildings and high-rise buildings, and five types of green space patterns, that is, enclosed greening pattern, centralized greening pattern, parallel greening pattern, interspersed greening pattern, and scattered greening pattern. The selectedhigh-rise blocks were mainly composed of green space patterns such as enclosed greening pattern, centralized greening pattern and parallel greening pattern, while the blocks with multistory buildings mainly covered all five patterns mentioned above.
Blocks with High-Rise Buildings
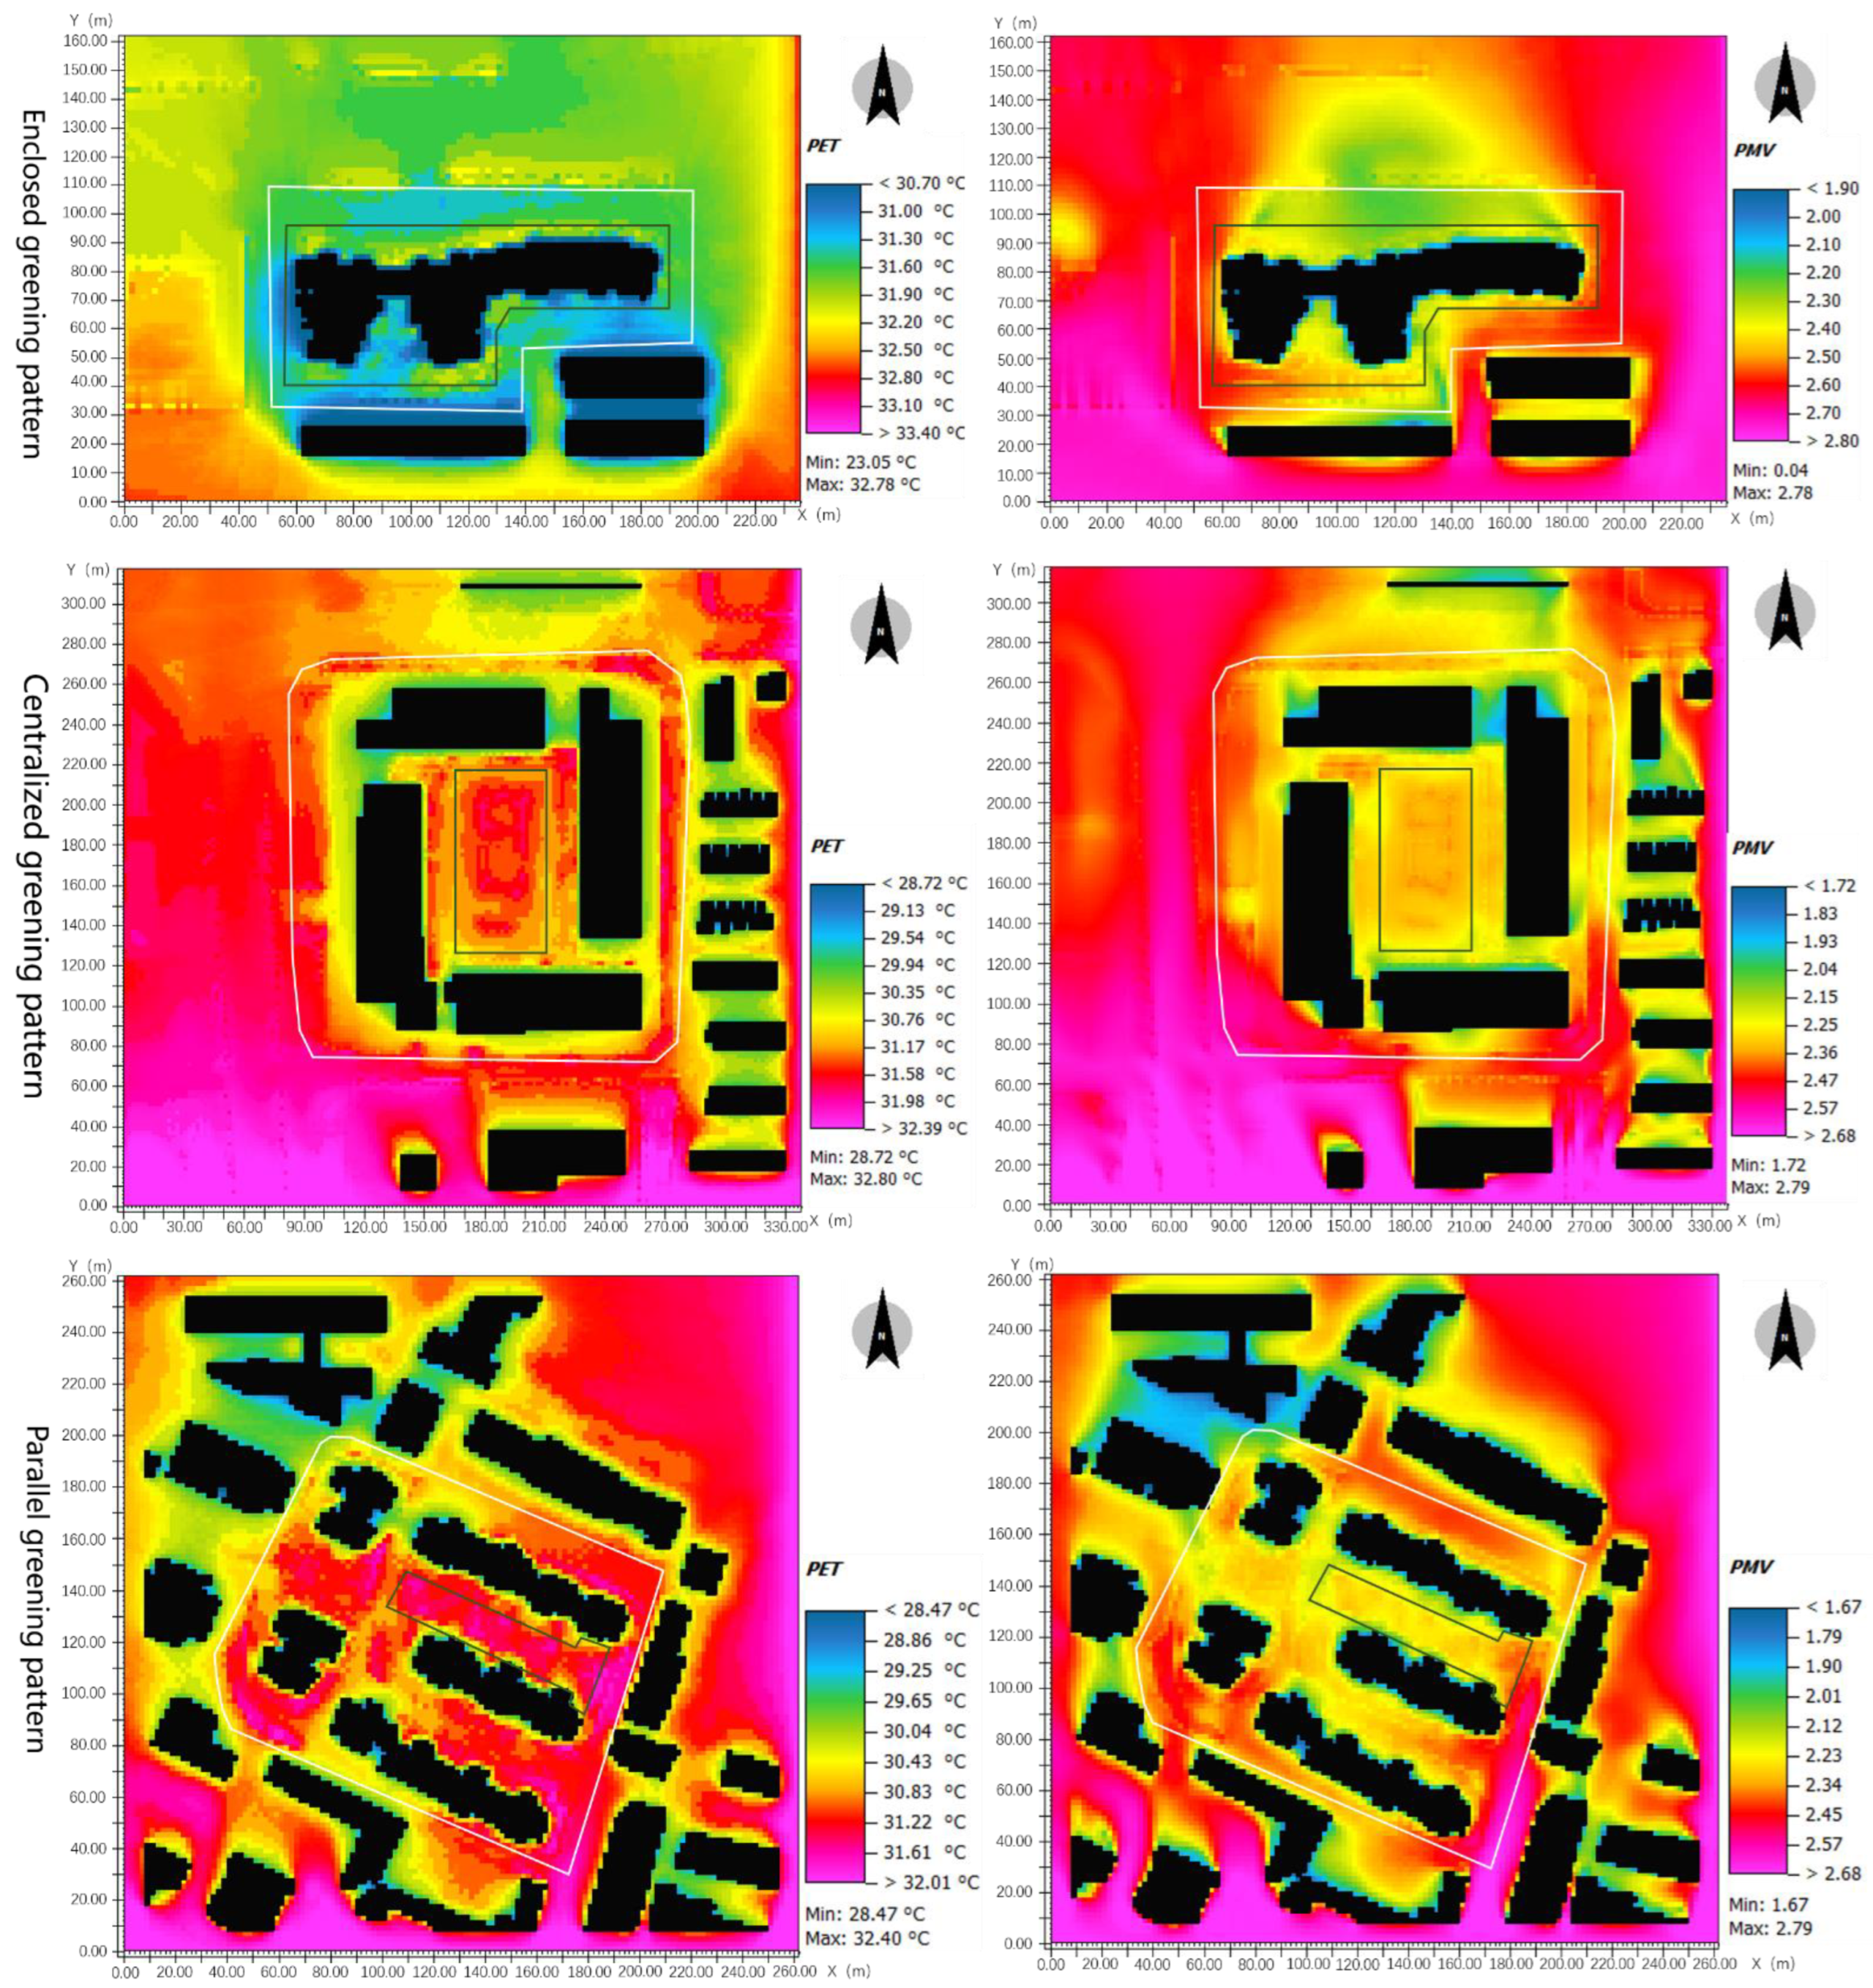
The surrounding green space of Shangdong Impression was selected for the study of enclosed greening pattern, the middle green space of Junyuan Square residential neighborhood was selected for the study of centralized greening pattern, and the northeast green space of Zhongtian Fengjing was selected for the study of parallel greening pattern. Each study area has a total green space area of approximately 2500 m
2, and a greening structure with a combination of arbors, shrubs, and herbs in a proportion of approximately 1:2:1. The simulation results of PET and PMV at 14:00 in summer are shown in
Figure 11, and the simulation results of PET and SET at 14:00 in winter are shown in
Figure 12.
As shown in the simulation results of thermal comfort in the enclosed greening blocks (high-rise residential areas) in
Figure 11, the best areas with thermal comfort in summer were in the dense green spaces around the buildings, which indicates that the greenery in the enclosed greening block fully played a role in improving the thermal comfort around the central building of the large block. For the green space concentration type of blocks (centralized greening pattern), the large green space was surrounded by buildings, and it was in a poorly ventilated area. Even if the central green space was more extensive, the thermal comfort of the enclosed area surrounded by buildings was worse than that of many outside the enclosed area. In the green parallel type of blocks, the thermal comfort was better in the areas with green space distribution around the buildings and relatively worse in the ones far away from the buildings. Researchers believe that this was also related to the fact that there were more trees around the buildings, while the green areas farther away from the buildings were dominated by shrubs and grasses. There have been many studies that indicate the better cooling effect of trees than shrubs and grasses [
77,
78].
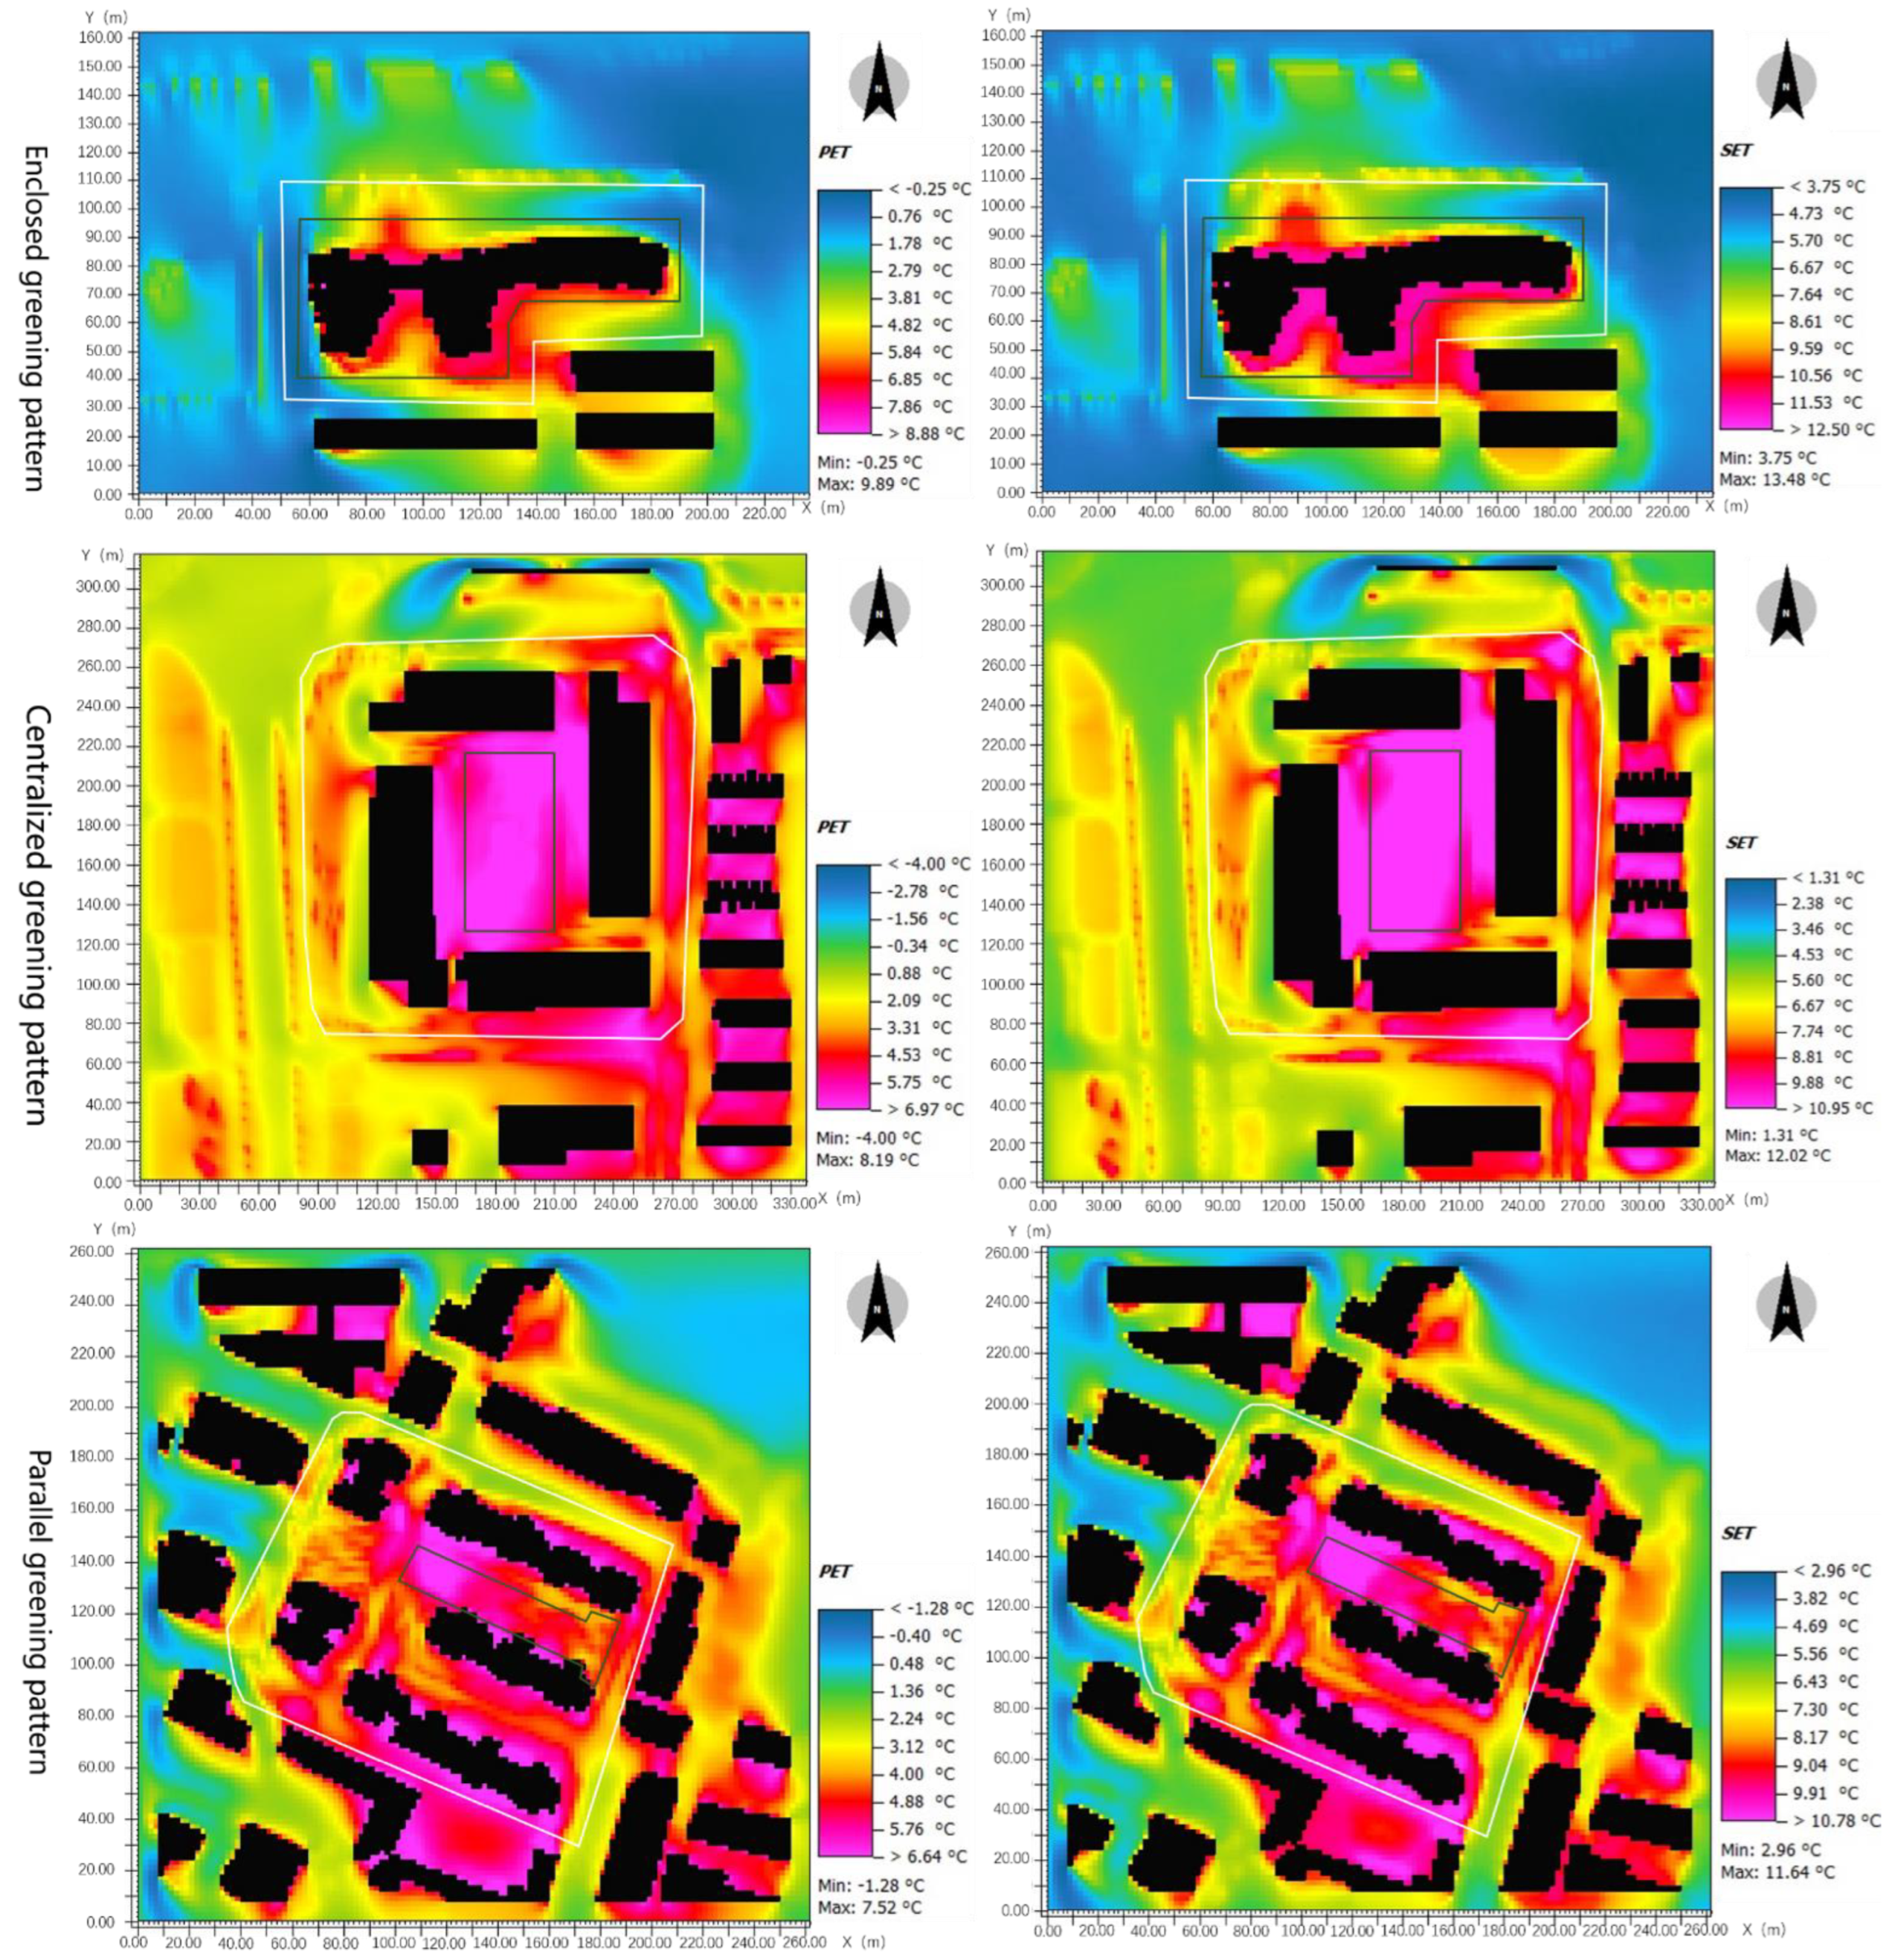
Figure 12 below shows the thermal comfort of high-rise residential buildings with three different green space layouts in winter based on two thermal comfort indicators, PET and SET. Due to the low temperature of that day, the higher the PET and SET values in the figure, the more thermal comfort there is in the area. In an enclosed greening block, the continuous green spaces surround the buildings, creating an area around the buildings with better thermal comfort. In a block with a concentration of green spaces (centralized greening pattern), the central green space was surrounded by buildings, resulting in cold breezes failing to blow easily into the central green area. Green space can create a significant warming effect in winter, so the area with the central green space forms excellent thermal comfort effects. In the blocks of the green space parallel type (parallel greening pattern), the green space and buildings are more evenly distributed throughout the area. The initial temperature, humidity, wind speed, and direction, and other conditions set in the three models are the same. The values of SET and PET of parallel greening block were more uniform and mainly distributed in the median quantile throughout the studied areas (enclosed by white lines), and the gap between the maximum and minimum values was relatively small.
The three high-rise blocks under study were not equal in size, but the total area of green space in each area was approximately 2500 m
2. After Bio-met was applied to calculate the thermal comfort in the studied area, the average values of thermal comfort in the three blocks with green coverage were obtained, and the results are shown in
Table 5. Based on this, the researchers attempted to make a general determination of which of these three different green space layouts would give more thermal comfort to just the people resting under the trees or on the grass from their perspective. By calculation, researchersfound that among the three different green space layouts, the overall thermal comfort in the area with green space in the parallel greening block is the best (the absolute values of the difference between the average PET and PMV of the green space area and the optimal values considered by scholars are 7.96 and 1.22, with a minimum gap). This layout, where the building blocks were distributed parallel to the green space and the green space was well distributed around the buildings, not only facilitated ventilation but also created a more continuous cold island effect in the whole areas. As researchers concluded in our analysis of
Figure 11, the thermal comfort of the entire area in the layout of the green space parallel type had a more uniform value, and the gap between the maximum and minimum values was small. In the green space concentration type, although the green space was enclosed by buildings and the thermal comfort of the central green space was not as good as that of the open area outside the enclosed area of the high-rise buildings; however, the large-scale green space in the center undoubtedly had a cold island effect. The absolute values of the difference between the average PET and PMV of the green area and the optimal values considered by scholars for this case are 8.39 and 1.33, which were not as good as the values of the parallel greening type, but slightly better than the ones in the enclosed greening type. In the green space enclosed blocks (enclosed greening pattern), the green space was in the shape of a belt around the building, with the characteristic of a narrow width of the whole circular green belt. Under this layout of green space, there were only areas with the best thermal comfort values immediately around the buildings. With the increasing distance of the green space from the building, the thermal comfort of it gradually became poorer [
79,
80].
Differences in the winter thermal comfort within the green space of three different layouts of high-rise residential areas were also compared. The average values of the PET and SET in the three different blocks were also calculated separately to support our comparison. When the average values were calculated, they were subtracted from the optimal PET and SET indicated in the relevant studies, and then the absolute values were calculated. The researchers illustrated the effectiveness of thermal comfort based on the difference values between the actual values and the optimal values. As shown in
Table 6 below, the best thermal comfort was found in the areas with green coverage in the centralized greening type (|ΔPET| = 11.26, |ΔSET| = 10.88). It is believed by the researchers that in the area enclosed by high-rise buildings, more cold air blowing around was blocked by the buildings. A green space acts as a good warming effect in winter in this area. In the enclosed greening type, the green space was enclosed around the building in the form of a belt. As shown in
Figure 12, thermal comfort was better in the green space closer to the building and becomes poorer as the distance between the green space and the building increases. For the green space parallel type (parallel greening pattern), the green space forms more well-ventilated areas between parallel buildings. Although green spaces have a warming effect in winter, well-ventilated areas are likely to be affected by cold winds, which leads to a reduction in thermal comfort.
Blocks with Multistory Buildings
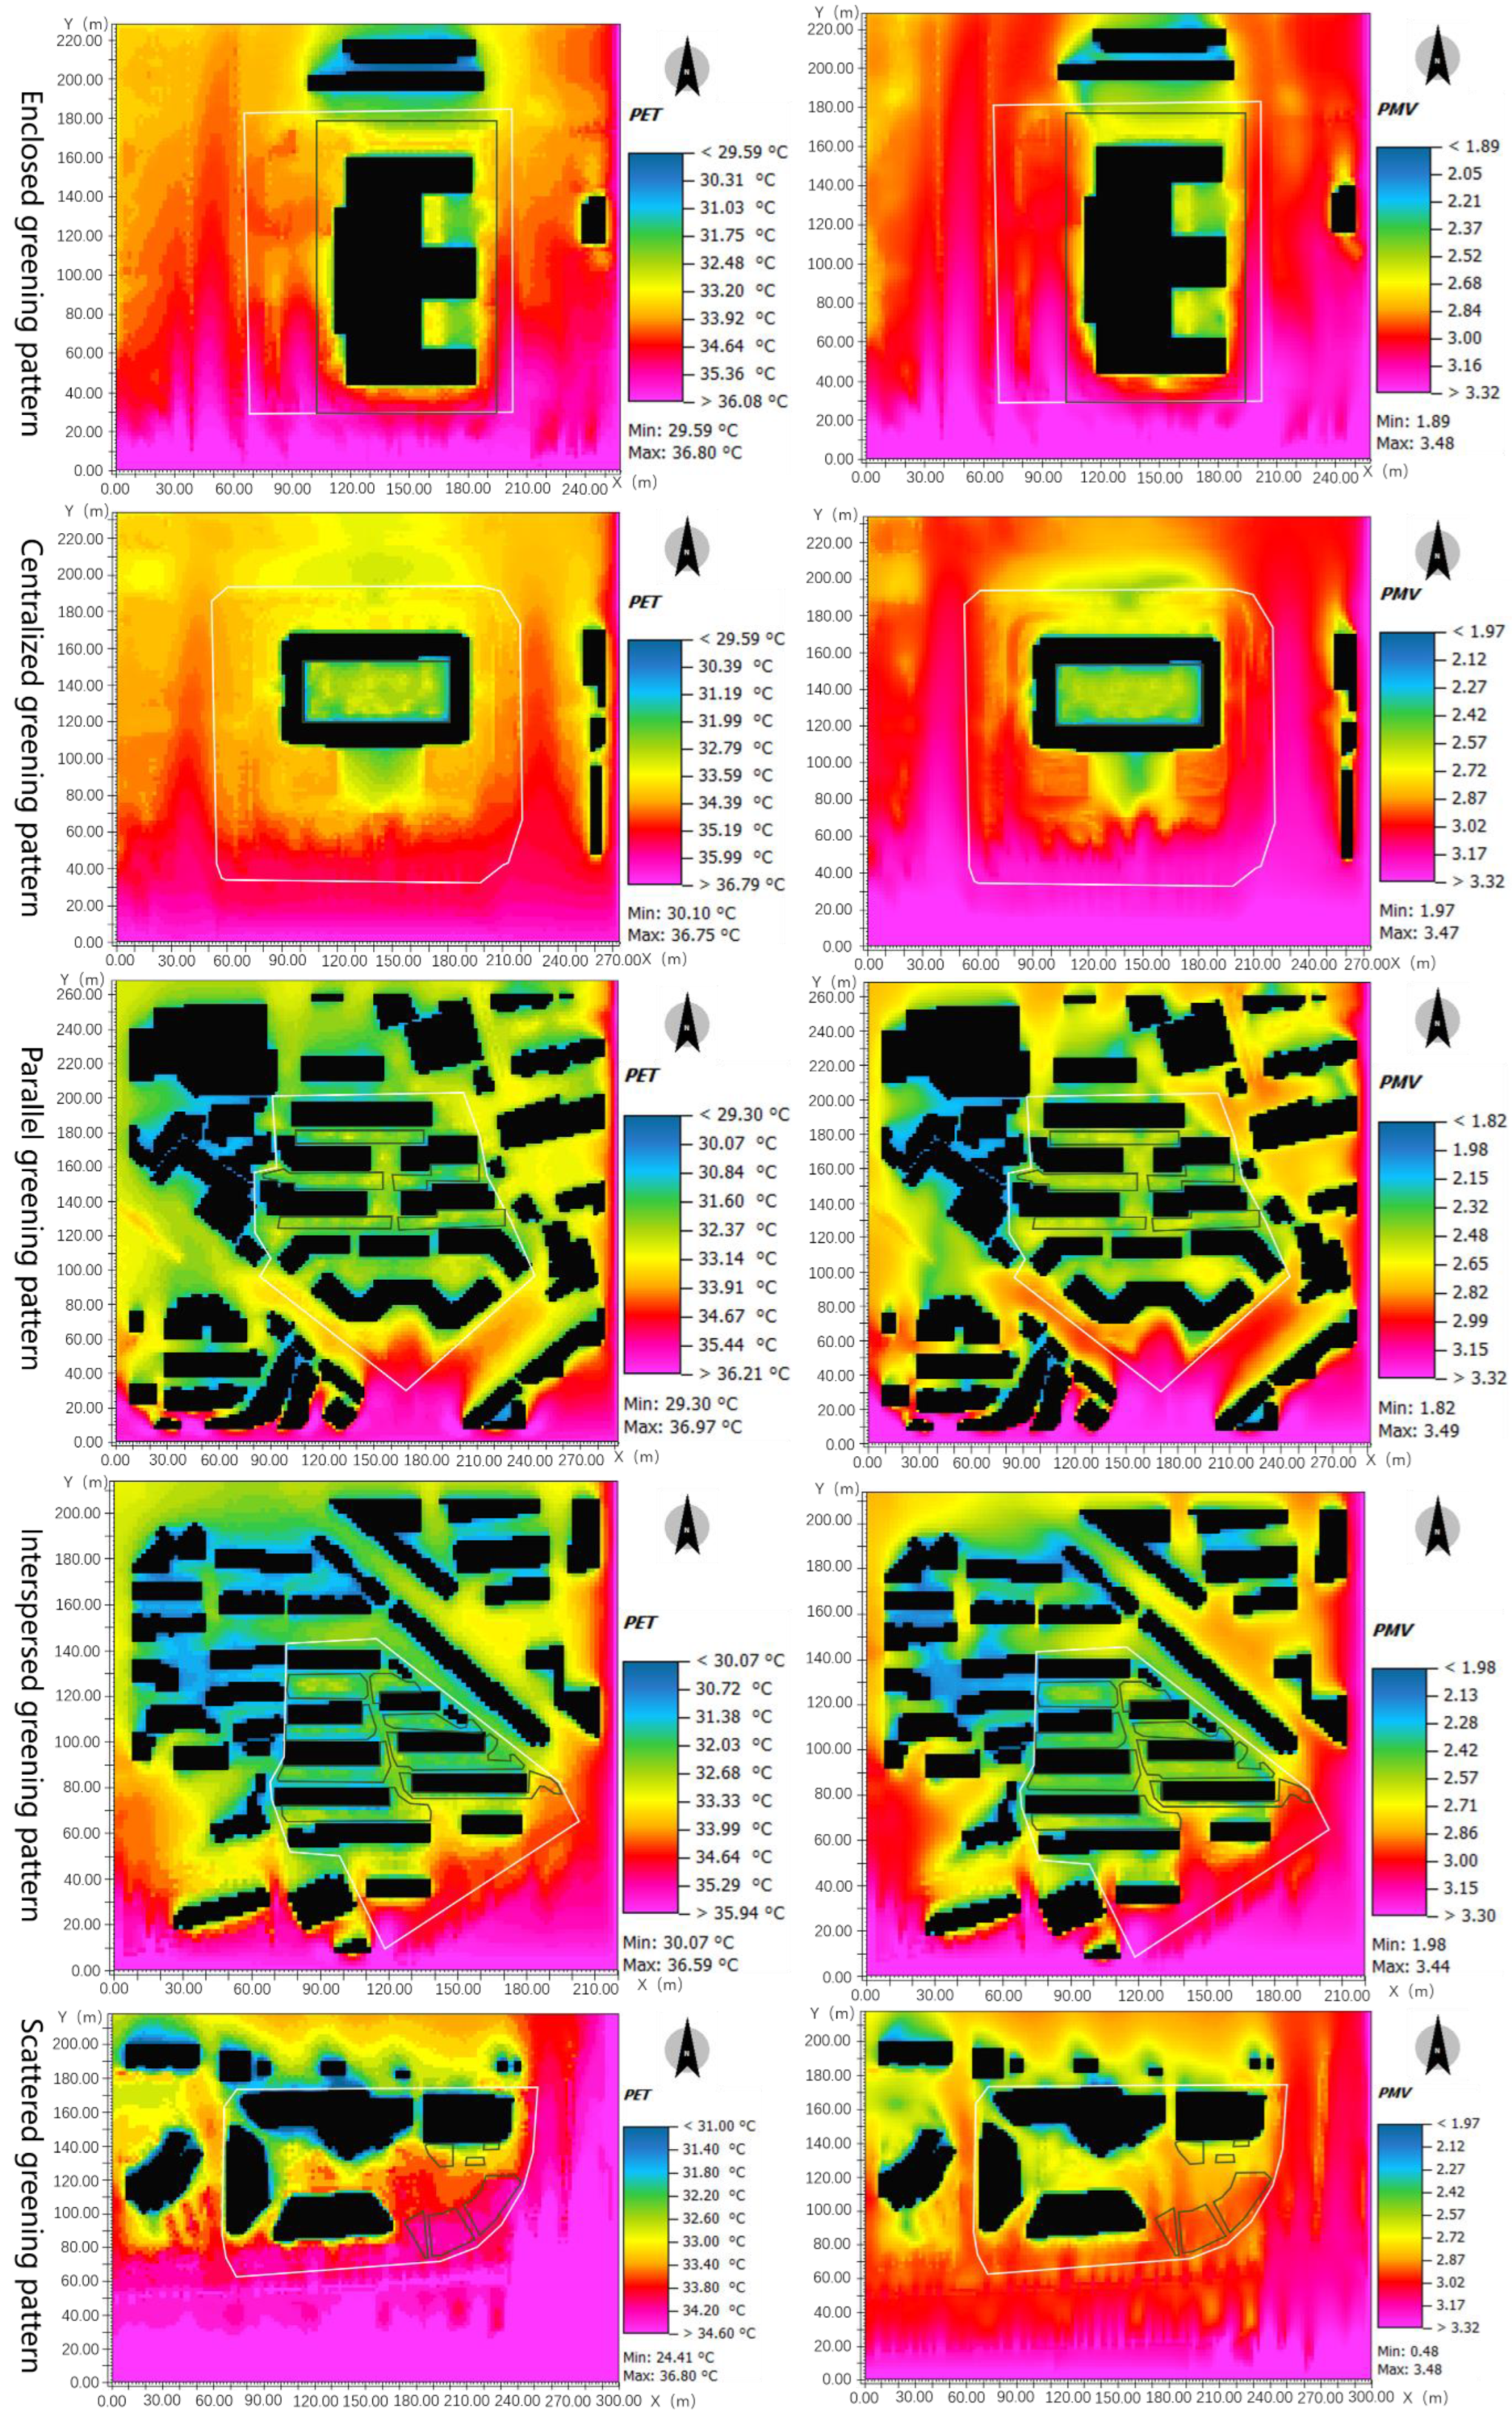
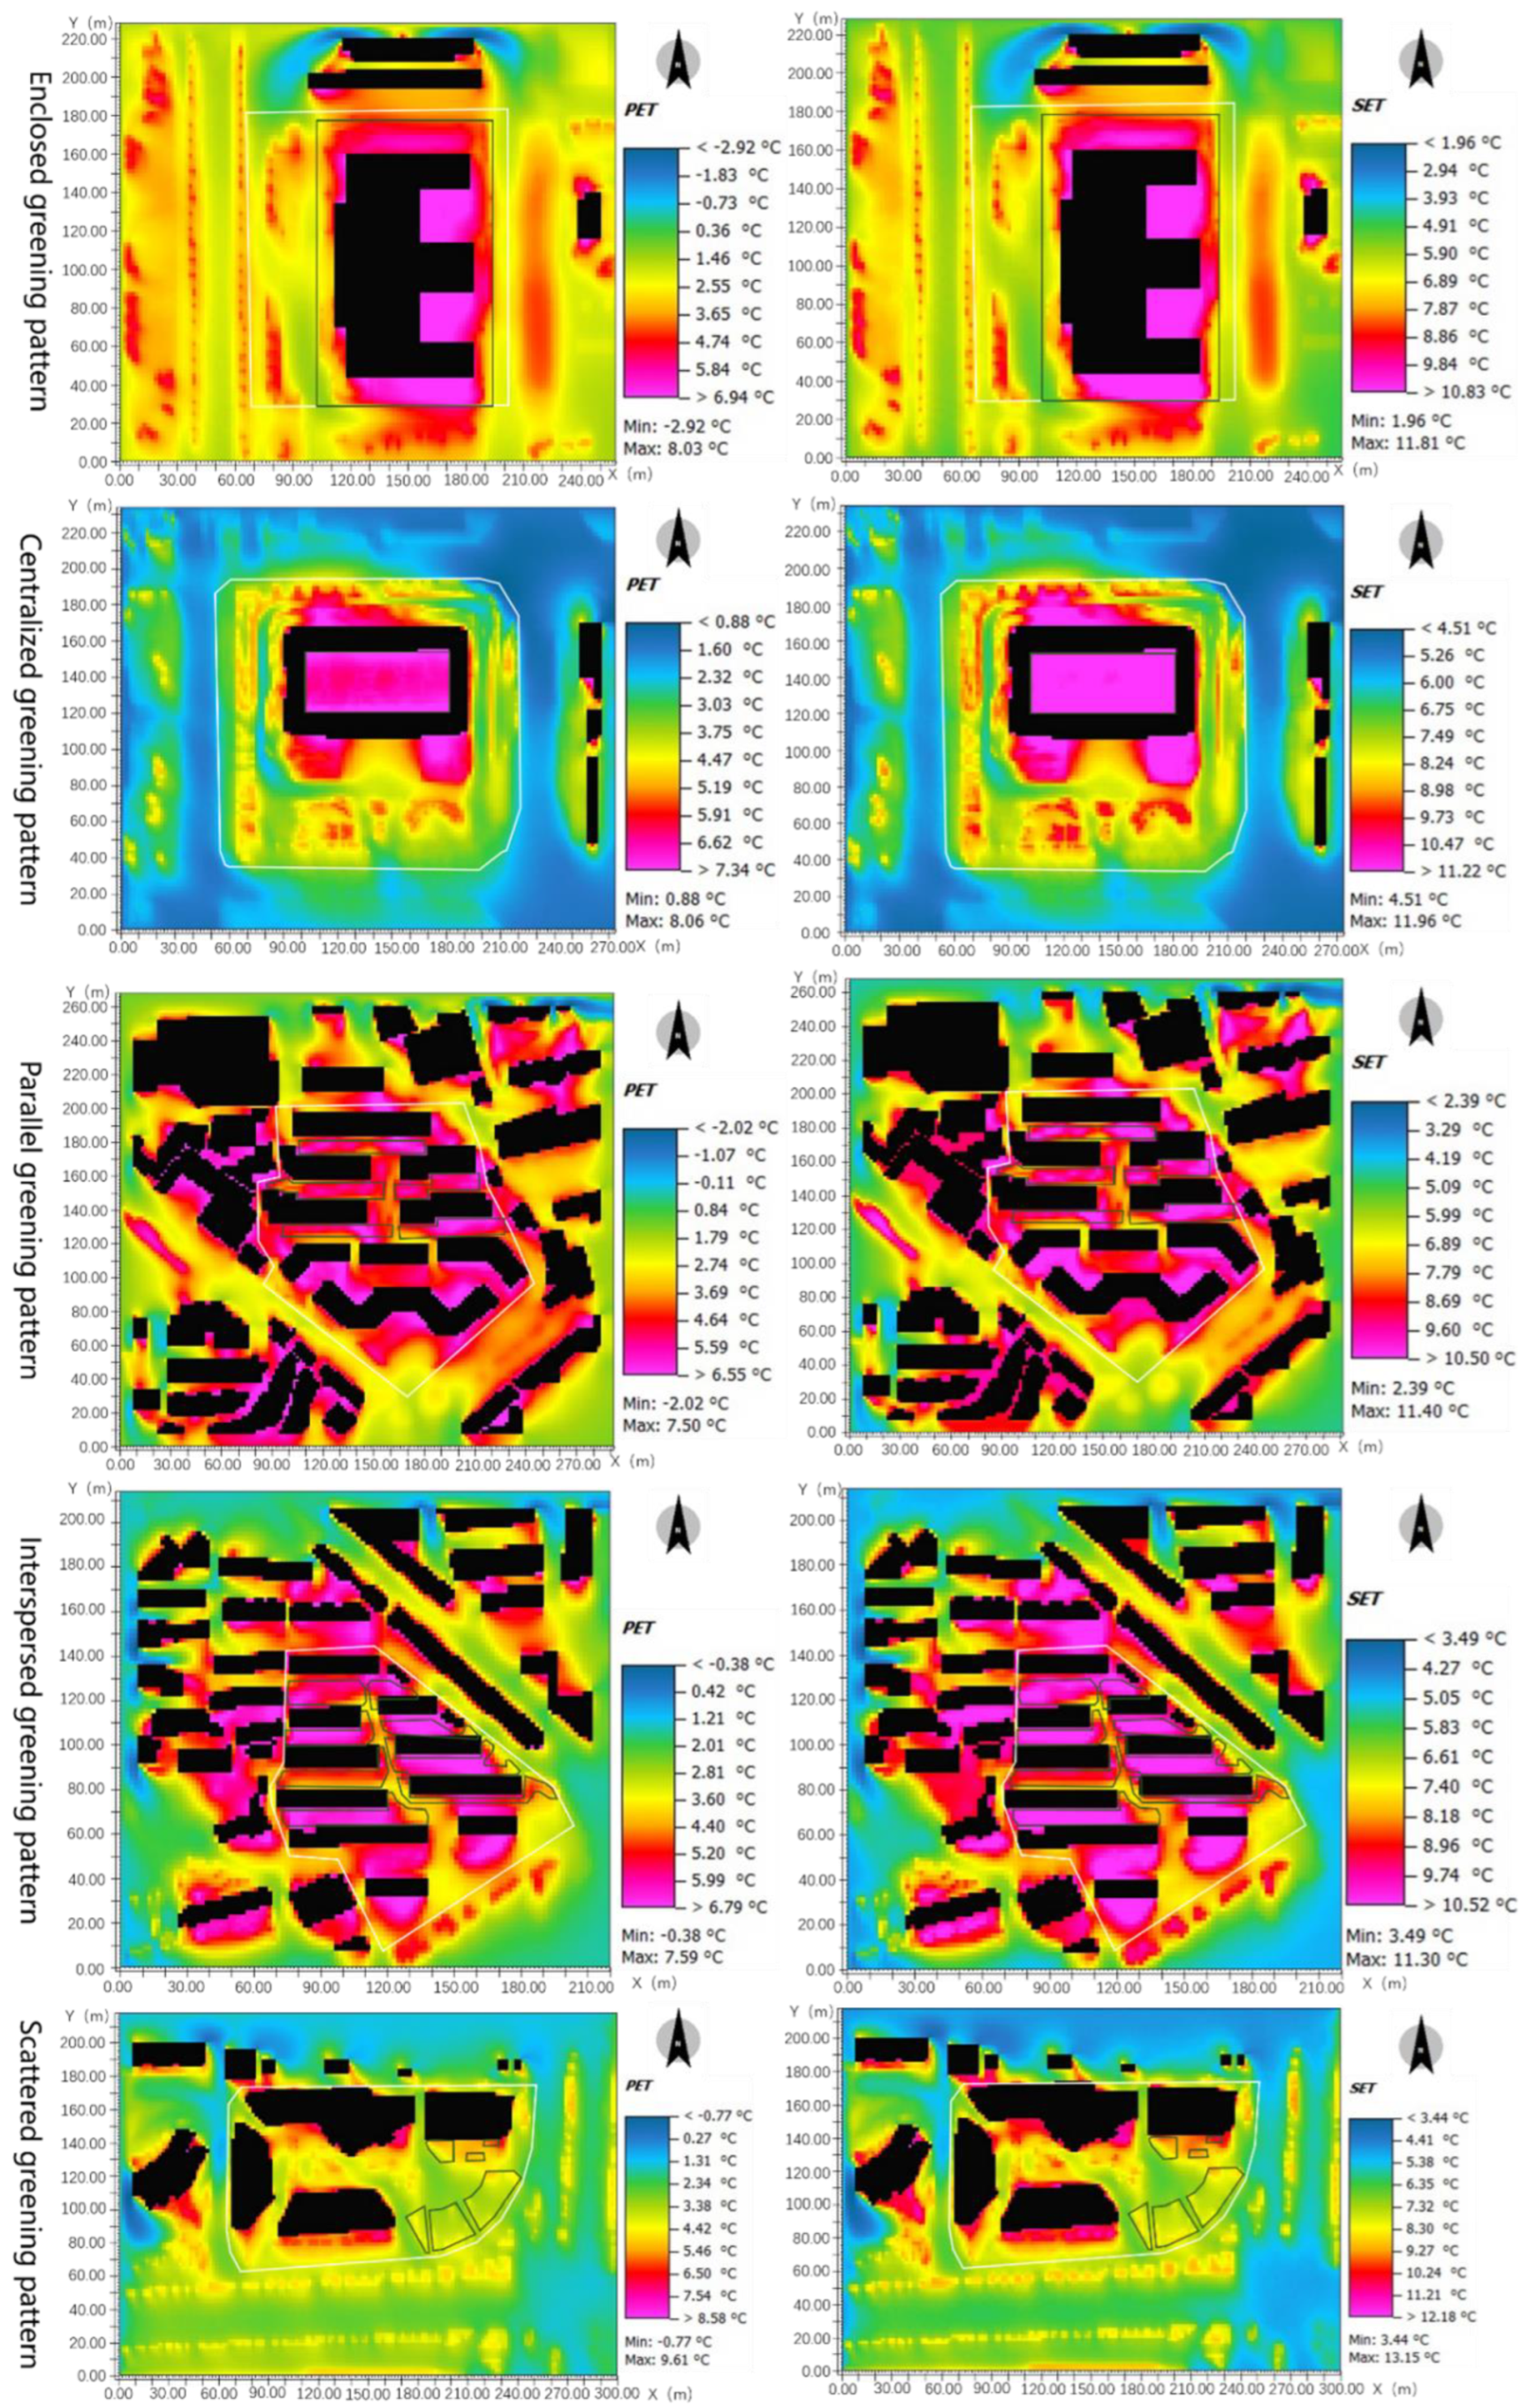
The green space around the building of the Changsha Civil Affairs Bureau was selected for the study of enclosed greening pattern, the green area around the building of the Standing Committee of Changsha Municipal People’s Congress was selected for the study of centralized greening pattern, the green space in the north of Jindiyuan was selected for the study of parallel greening pattern, the green space in the north of Keda Jingyuan was selected for the study of interspersed greening pattern, and the green space in the southeast of Changsha Xintiandi was selected for the study of scattered greening pattern. each green space has a total area of about 2800 m
2, and a greening structure with a combination of arbors, shrubs, and herbs in a proportion of about 2:2:1. The simulation results of PET and PMV at 14:00 in summer are shown in
Figure 13, and the simulation results of PET and SET at 14:00 in winter are shown in
Figure 14.
Figure 13 shows the thermal comfort in summer for blocks with five different green space patterns of multistory blocks. Similar to
Figure 11, the better thermal comfort in the enclosed greening types in
Figure 13 is in the area with dense green space around the building. In the centralized greening model in
Figure 11, the thermal comfort of the dense green space area was poor. In contrast, in the centralized greening model in
Figure 10, the thermal comfort of the central green space area enclosed by buildings is the best in the whole area. The researchers think that most of the surrounding high-rise buildings in
Figure 11 were very high, which makes a large amount of wind blowing toward the central green space blocked, and that the area enclosed by the high-rise buildings did not easily dissipate heat.
In the model of the centralized greening type in
Figure 13, most of the buildings around the green space were not high, which makes the green space form a good cold island effect in the central area, at the same time, the green space was more evenly distributed throughout the area in the enclosed greening type and the interspersed greening type. Compared to the other three green space patterns, the thermal comfort values in the models for the two green space patterns (the areas within the white lines in the various simulation result diagrams) were more uniform, with a smaller gap between the maximum and minimum values for the whole area. In the model of the dispersed greening type, the distribution of green space was more disorderly, and the overall characteristics present better thermal comfort in the areas with green spaces.
Figure 14 shows the results of the simulations for each model with the same meteorological parameters for the conditions of one winter day. Similar to
Figure 12, the best area for thermal comfort in the model of enclosed greening type in
Figure 14 is around buildings with a dense distribution of green space. In the model with a centralized green space, (centralized greening block) the thermal comfort of the large green space in the middle of the buildings was the best. The green space had a warming effect in the winter. The buildings could effectively block off the cold wind to a certain extent, so the thermal comfort of the central area enclosed by the buildings was better. The values of the PET and SET were more uniform in the parallel greening block and interspersed greening block. In the simulation result diagram, the red and purple colors were dominant in the studied area.
Table 7 shows that in the simulations with the meteorological conditions of one summer day, among the five models, the thermal comfort is optimal in the blocks of the green space parallel type, followed by the green space interspersed type, if only the areas covered by green space are considered. Obviously, the green space created a better green space cold island zone in the open area between the buildings, and in addition, the open area between the buildings is easy for ventilation and heat dissipation. The thermal comfort of the areas covered by green in the centralized green space block ranked third. In addition, the green areas within the enclosure of multistory buildings exert a certain cold island effect, creating a green area with better thermal comfort. In the enclosure-type green space, the thermal comfort effect was better in the green areas closer to the buildings, but as the distance between the green space and the buildings increased, it led to a significant decrease in the thermal comfort in the green spaces, which is believed to be one of the main reasons for the overall poor thermal comfort in this green space pattern. The green spaces in the dispersion type were relatively dispersed, which resulted in less interaction between two green spaces that were not connected together at a distance. The overall thermal comfort of all green space-covered areas was poor.
Table 8 reflects the simulations performed for the five high-rise blocks, only the thermal comfort of the area with green coverage is considered. The input meteorological parameters were those of a winter day and are identical in the five models. Although the area of each block is not equal, the area of green space within the blocks is equal. The smaller the value in the table, the smaller the gap between the value and the optimal one for thermal comfort. The table below reflects that the centralized greening block had the best thermal comfort compared to the other four types of green space layouts with green coverage (|ΔPET| = 11.04, |ΔSET| = 10.64), owing to the comfort zone created by building enclosure and green space warming. In the interspersed green space type, the green space in the area between the buildings was mainly distributed in the form of a belt and is dense, thus the thermal comfort of this area was better. The thermal comfort of the areas studied in the model for the interspersed green space type ranked second among the five models, with a |ΔPET| of 12.68 and a |ΔSET| of 12.9. The thermal comfort in the green space enclosure type was medium in all models, with a |ΔPET| of 12.98 and a |ΔSET| of 13.01. In the model, the thermal comfort of the area above the green space surrounded by three sides of the building is better, while the thermal comfort of the green space in other areas is relatively poor. In contrast to the green space interspersed type, the green space did not form a vertical and horizontal green zone in the central area of the model. If only the thermal comfort of the area with green coverage is considered, the green space parallel type is ranked fourth, with a |ΔPET| of 13.36 and a |ΔSET| of 13.54. The distribution of green spaces in the dispersion type is more dispersed. Because of the long distances between many different green plots, the interaction between them was also smaller. Among the five models, the dispersed green space type had the poorest thermal comfort, with a |ΔPET| of 14.56 and a |ΔSET| of 14.92.
3.3.2. Summary of Characteristics of Microclimate Environment of Green Space Patterns in Urban Blocks
This study classified the blocks within the second ring of Changsha into five different types based on the pattern of spatial layout between green spaces and buildings for the whole blocks or parts of the blocks. The blocks with larger areas and those with more complex green space layouts were divided into several areas, and each area was similarly divided into one of five types according to the layout of the green space and buildings within the different areas. Areas with the presence of green space had generally better thermal comfort in all models in winter and summer. Within the same type, differences in building height, road width and green space ratio and many other factors can lead to somewhat different characteristics of thermal comfort in the same type of blocks. It is believed that not some of the characteristics found in a single block are fully transferable to all blocks of the same type. Green spaces have a cooling effect in the summer and a warming effect in the winter, which leads to the same results found by many researchers [
22,
23,
24,
25,
26,
27,
28,
29,
30]. The large-scale green space can form an area with better thermal comfort in the whole block. For enclosed greening blocks, the green space around the central building with a larger footprint obviously has a stronger effect of increasing thermal comfort, however, as the distance of the green space from the building increases, the thermal comfort around it decreases more rapidly. In summer, for the high-rise blocks with centralized green space, the blocking was not conducive to ventilation. The central green space within the building enclosure failed to make this area a better one for thermal comfort. Similarly, in summer, if the central green areas were surrounded by multistory buildings in the enclosed greening pattern block, but they were not too high and the wind near the ground is less blocked off by the buildings. In the multistory block with concentrated green space, a cool island area with better thermal comfort is formed around the central green space. In winter, the combined effect of building enclosure and green space warming in centralized greening high-rise building blocks and centralized greening multistory building blocks created a central green area within the blocks with better thermal comfort compared to other areas. For the blocks with green space parallel or interspersed types, the green spaces were more evenly distributed within the blocks, and the gap between the maximum and minimum values of thermal comfort in these blocks is relatively small compared to other blocks. However, in winter, the parallel greening type and interspersed greening type were more susceptible to cold winds than the centralized greening block, where the strips of green space were located. These two types of blocks obviously cannot have a central area of green space with better thermal comfort than the surrounding area, as is the case with the centralized greening block type, which is formed by the enclosure of buildings. The green spaces of the dispersed greening type block were more dispersed and separated from each other, and the interaction between green spaces was weaker, which, in general, led to poor thermal comfort in winter and summer in this type of block.
To better explore the feelings of thermal comfort of people resting under the trees or on the grass, the thermal comfort in the green-covered areas was further studied. The green area sizes were similar across the studied areas, and the average values of the standard PET, PMV and SET for thermal comfort in the whole areas were compared, and the researchers believe that the results of this comparison are reliable. In summer, the values of |ΔPET| and |ΔPMV| in the areas where the green spaces were located in parallel greening type are the smallest. This also indicates that the areas where the green spaces are located have the best thermal comfort in parallel greening type among the counterparts of the five different types of blocks, undoubtedly due to the good ventilation and the interaction between the dispersed green spaces. In winter, the values of |ΔPET| and |ΔSET| in the centralized greening pattern block are the smallest, and the thermal comfort of the area where the green spaces are located is the best among five different types of block. Similar to the blocks of multistory residential buildings of the parallel greening type block, the thermal comfort in interspersed greening type block was better in summer (with smaller values for |ΔPET| and |ΔPMV| than these values of other models) and poorer in winter (with larger values for |ΔPET| and |ΔSET| than these values of other models). The researchers found that in the summer, the thermal comfort of the green areas in the interspersed greening pattern high rise building block was poorer than that in the parallel greening pattern high-rise building block. In winter, the former had better thermal comfort than the latter. Because the distances between buildings, road lengths, building heights and other factors vary between different blocks, the researchers think that the findings in this study cannot be used to prove that all such blocks meet this regulation. The green spaces in the parallel greening blocks are not staggered to form green zones among many buildings. The layout of the green spaces in parallel with the buildings was more conducive to ventilation and heat dissipation. In winter, green interspersed zones in interspersed greening type blocks undoubtedly contributed to blocking off cold winds, and the more closely arranged green spaces also contributed to temperature increase. Based on |ΔSET|, |ΔPET| and |ΔPMV|, it can be concluded that the areas with green coverage in the enclosed greening type blocks were ranked moderate in terms of thermal comfort in summer and winter compared to the other four types of blocks. Since it was found that most of the blocks with dispersed greening type were multistory building blocks, the researcher only studied the thermal comfort of the multistory building blocks with dispersed greening type and also found that the maximum values of |ΔPET| and |ΔSET| were in summer and winter for blocks with dispersed greening type among five different types of blocks, which also explains why this green space layout had the poorest thermal comfort.
3.4. Analysis of the Influence of Different Green Space Patterns on the Surrounding Thermal Comfort
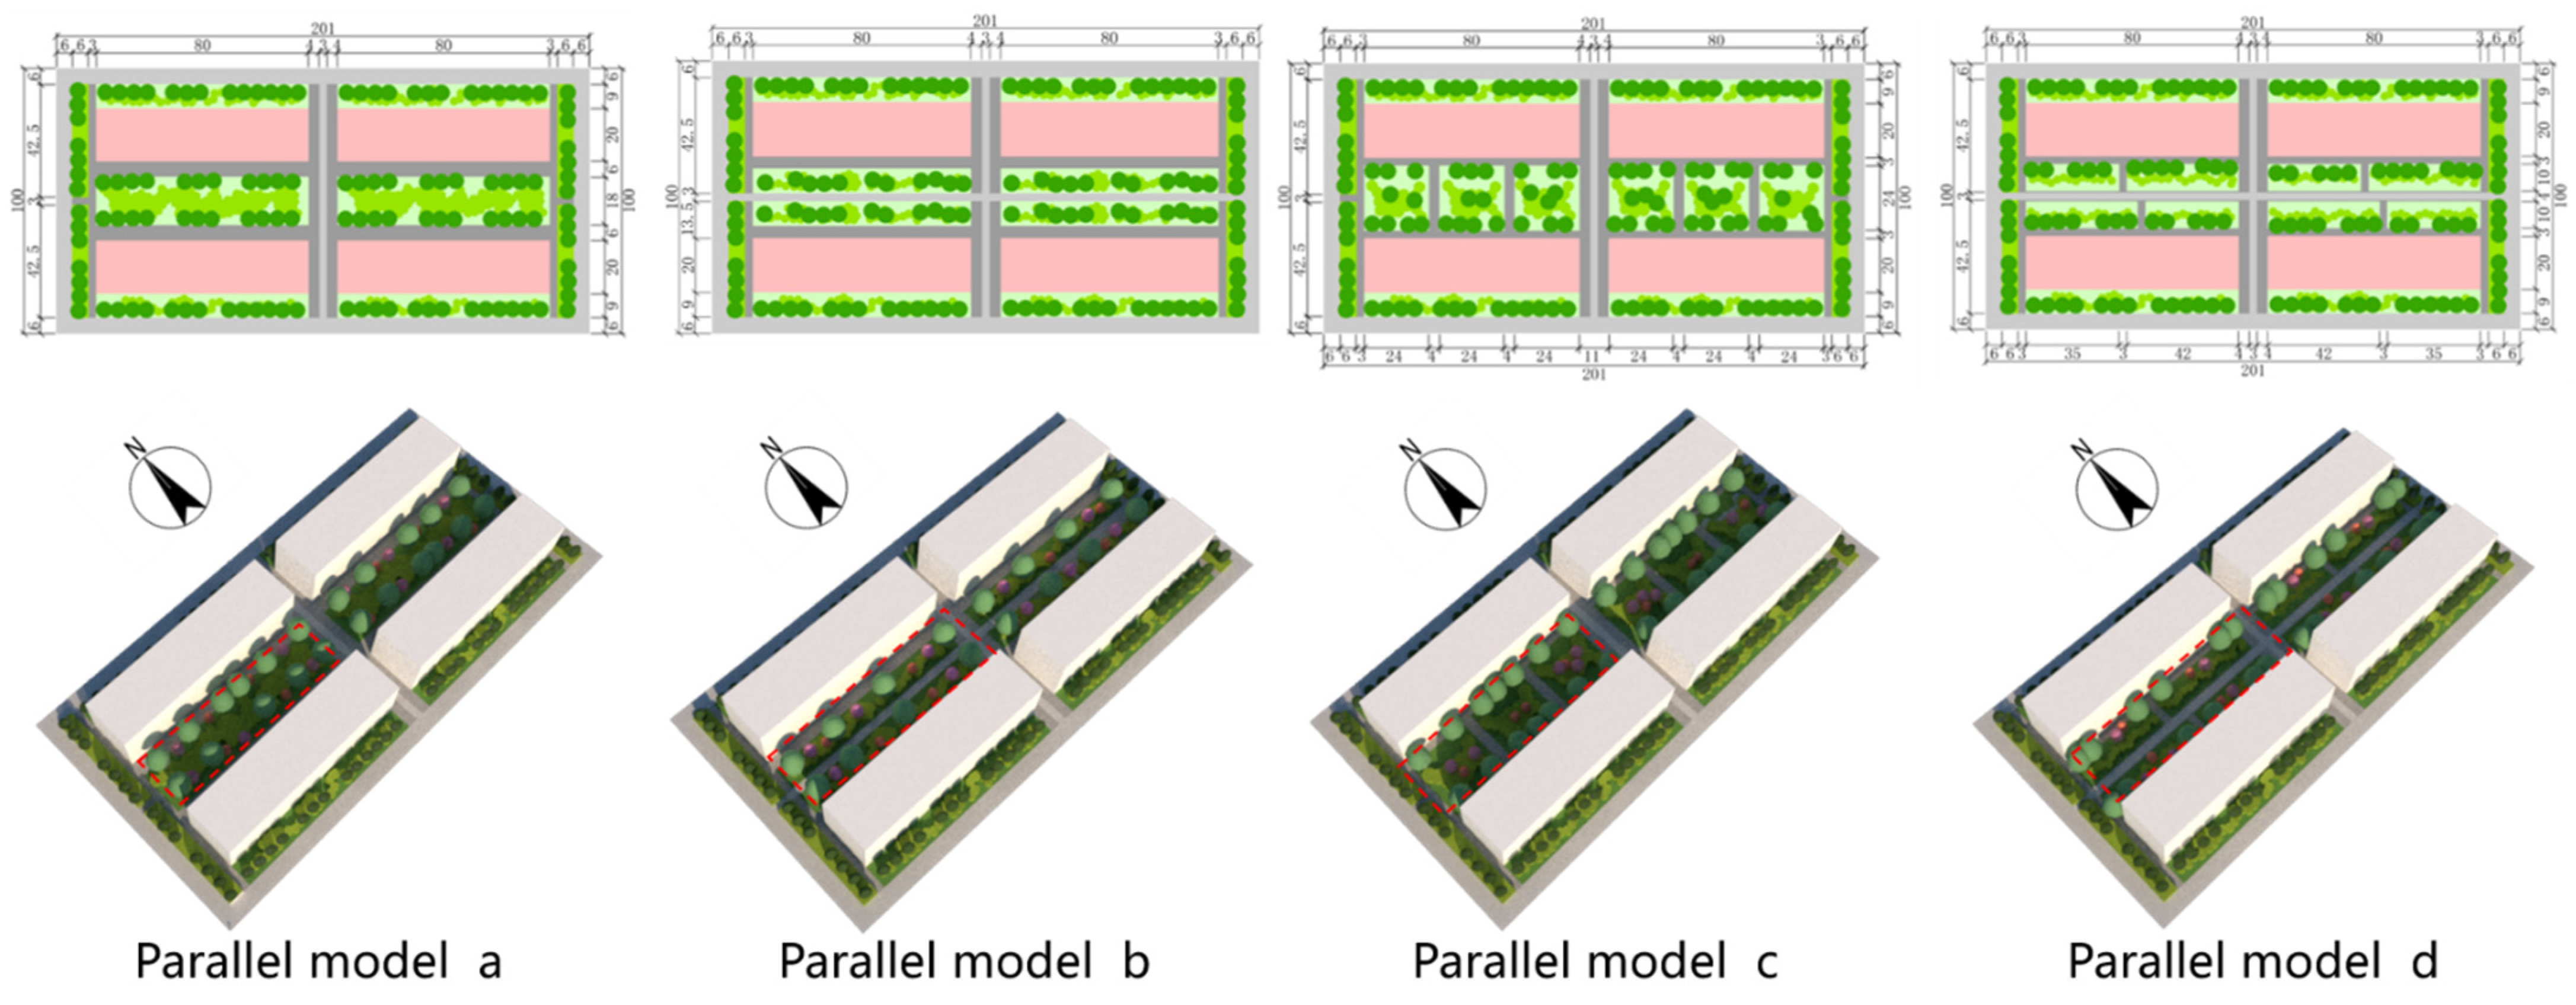
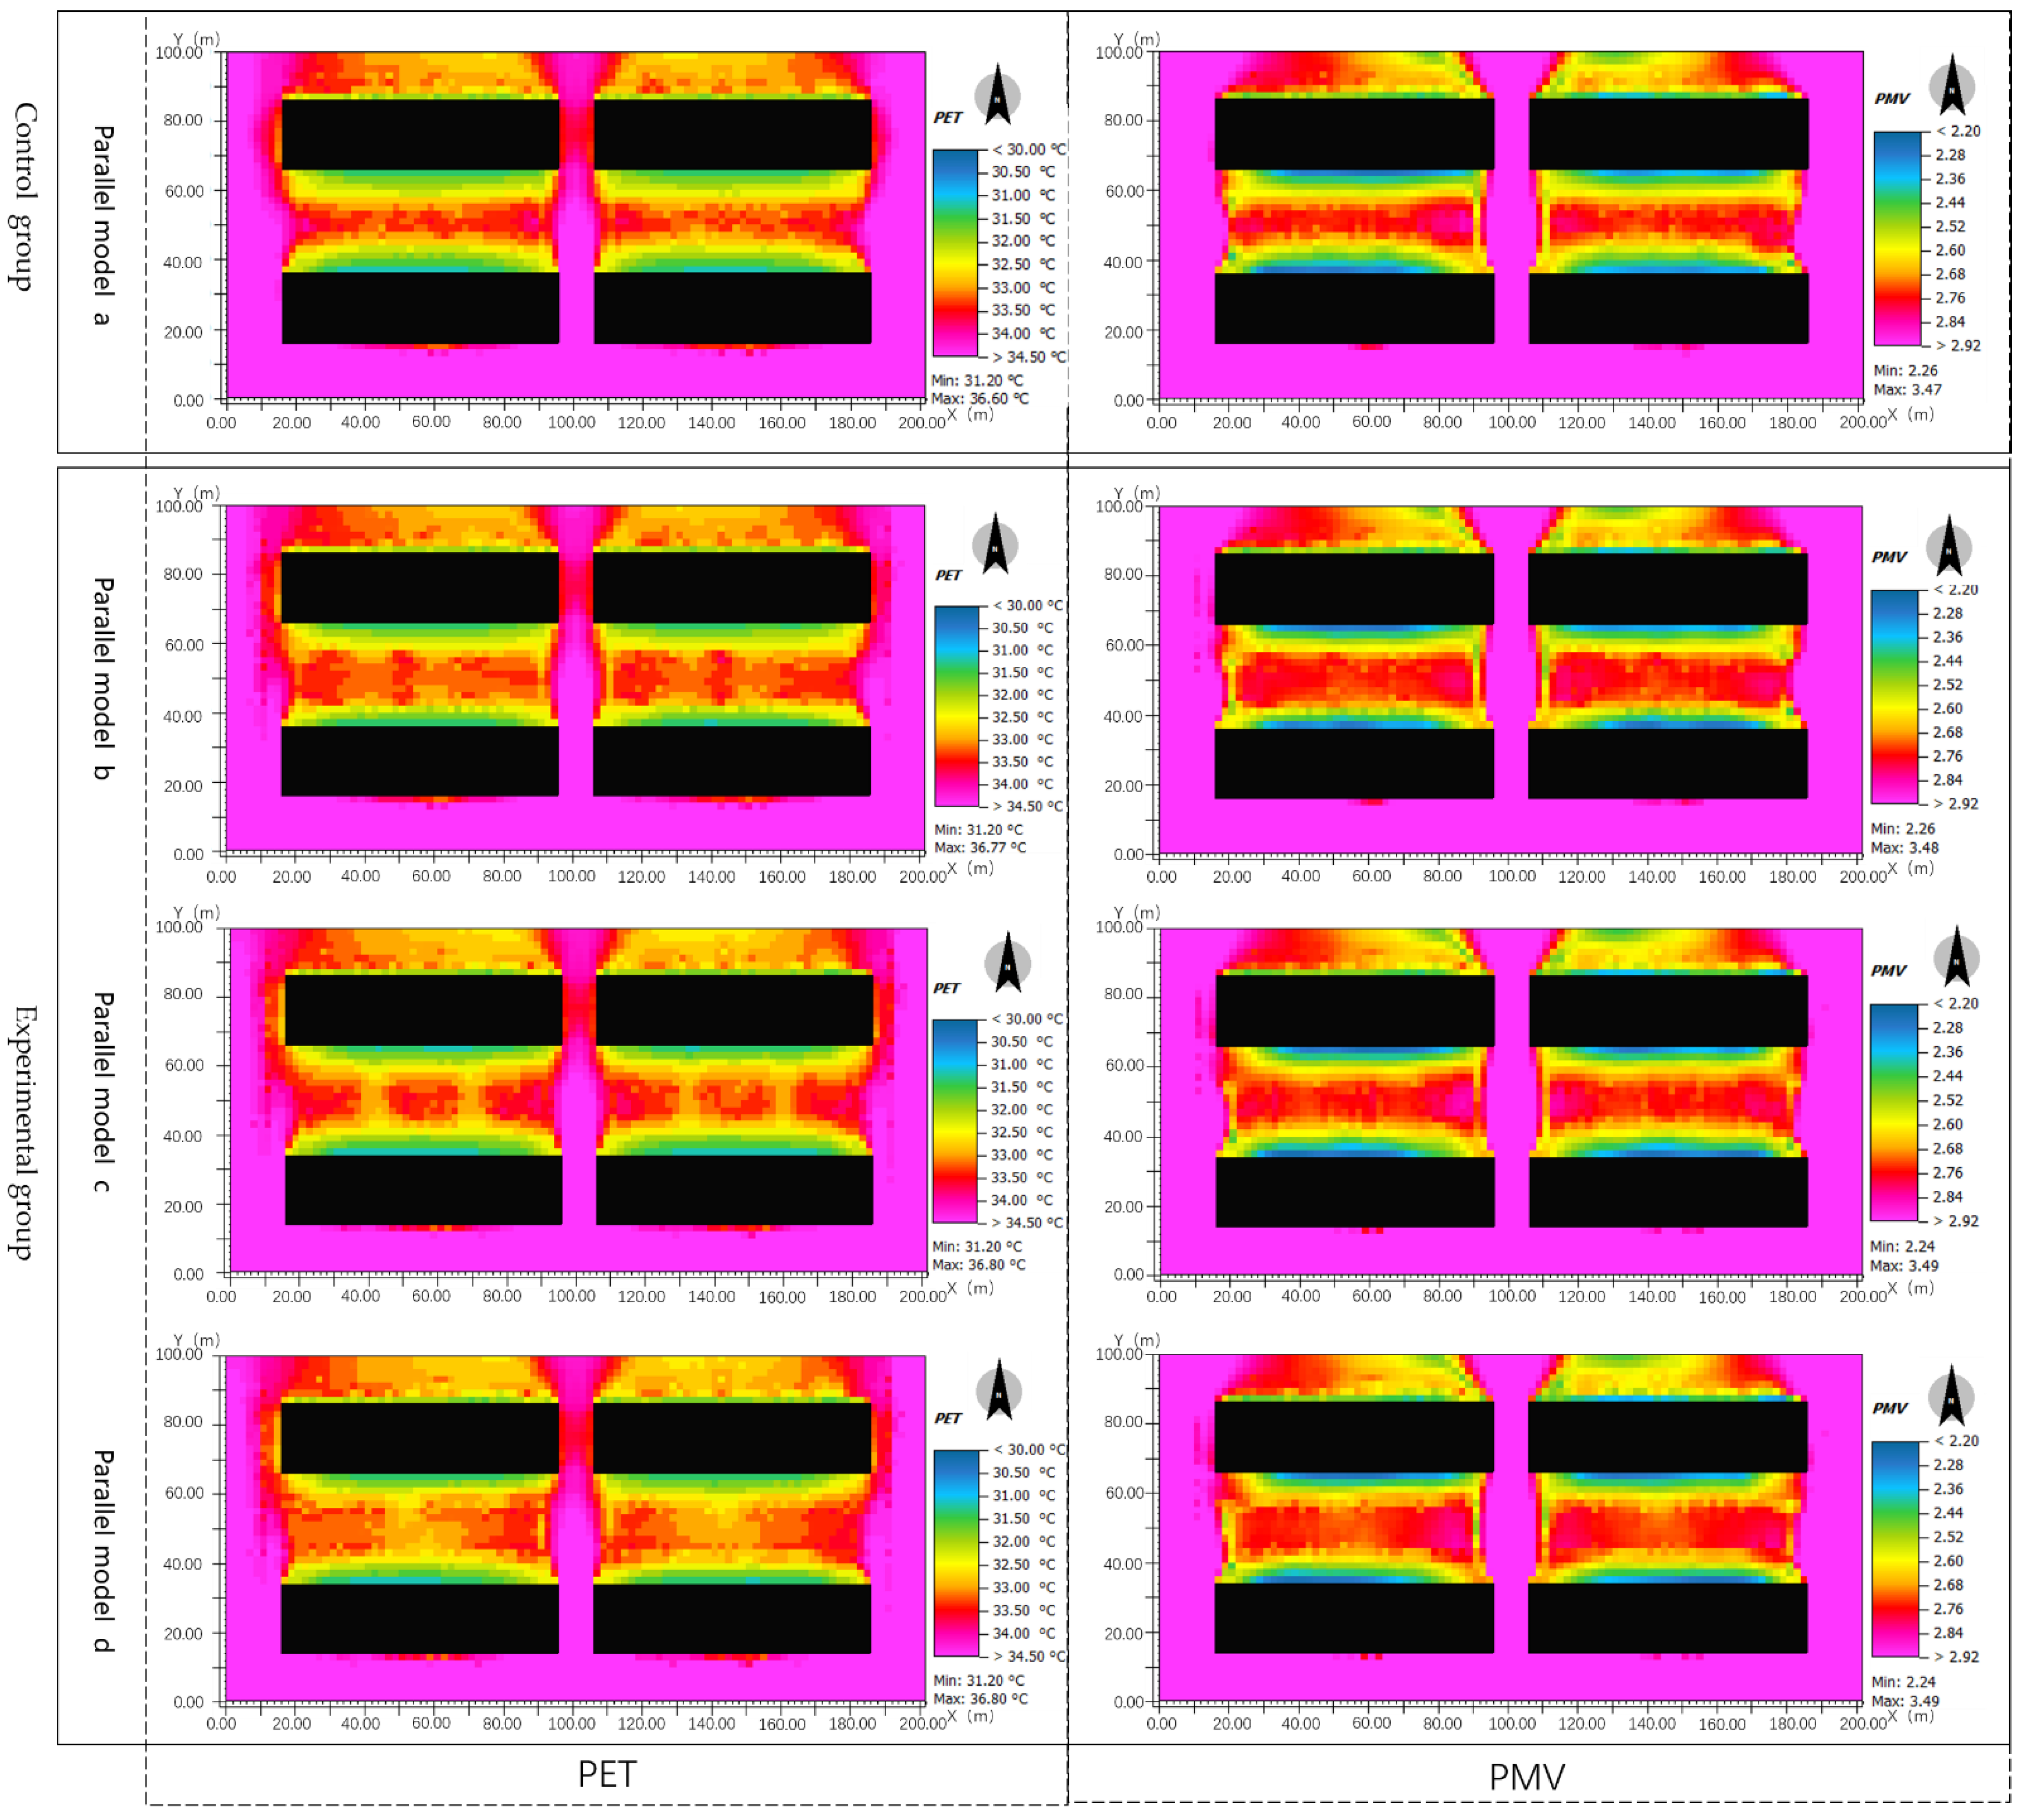
3.4.1. Analysis of the Influence of Different Parallel Greening Pattern on the Surrounding Thermal Comfort
Figure 15 below shows that among the four parallel greening models, the differences of overall thermal comfort values in the areas were small in the models with different green space layouts as the unique variable. For instance, the minimum PET values in the four models were all 31.2 °C. However, the maximum PET values in the four models ranged from 36.6 to 36.8 °C, whose difference was less than 0.2 °C. For comprehensive consideration, the layout in summer model a was a superior layout, and the maximum values of thermal comfort indices PET and PMV in the area were the lowest compared with those of other models. The areas with good thermal comfort (blue, green, yellow and orange areas shown in PET and PMV diagrams) as a result of green space cold island effect between buildings in the area are wider. Compared with the other three models, the blue, green, yellow and orange areas in PET and PMV diagrams of model b are narrower. Nonetheless, the maximum values of PET and PMV in the area were lower than those of models c and d. Model b was a model which provide relatively worse thermal comfort. The maximum values of PET and PMV in models c and d were the same, which were the highest among the four models. From the perspective of PET, the area with a PET at 31–31.5 °C in model c was wider compared with model d. Compared with model c, there was a larger yellow or orange area with a PET at 32.5–33 °C in the middle of model d. From the perspective of PMV, model c presented a larger, relatively comfortable area with PMV less than 2.68 compared with model d. Thus, model c provided relatively good thermal comfort.
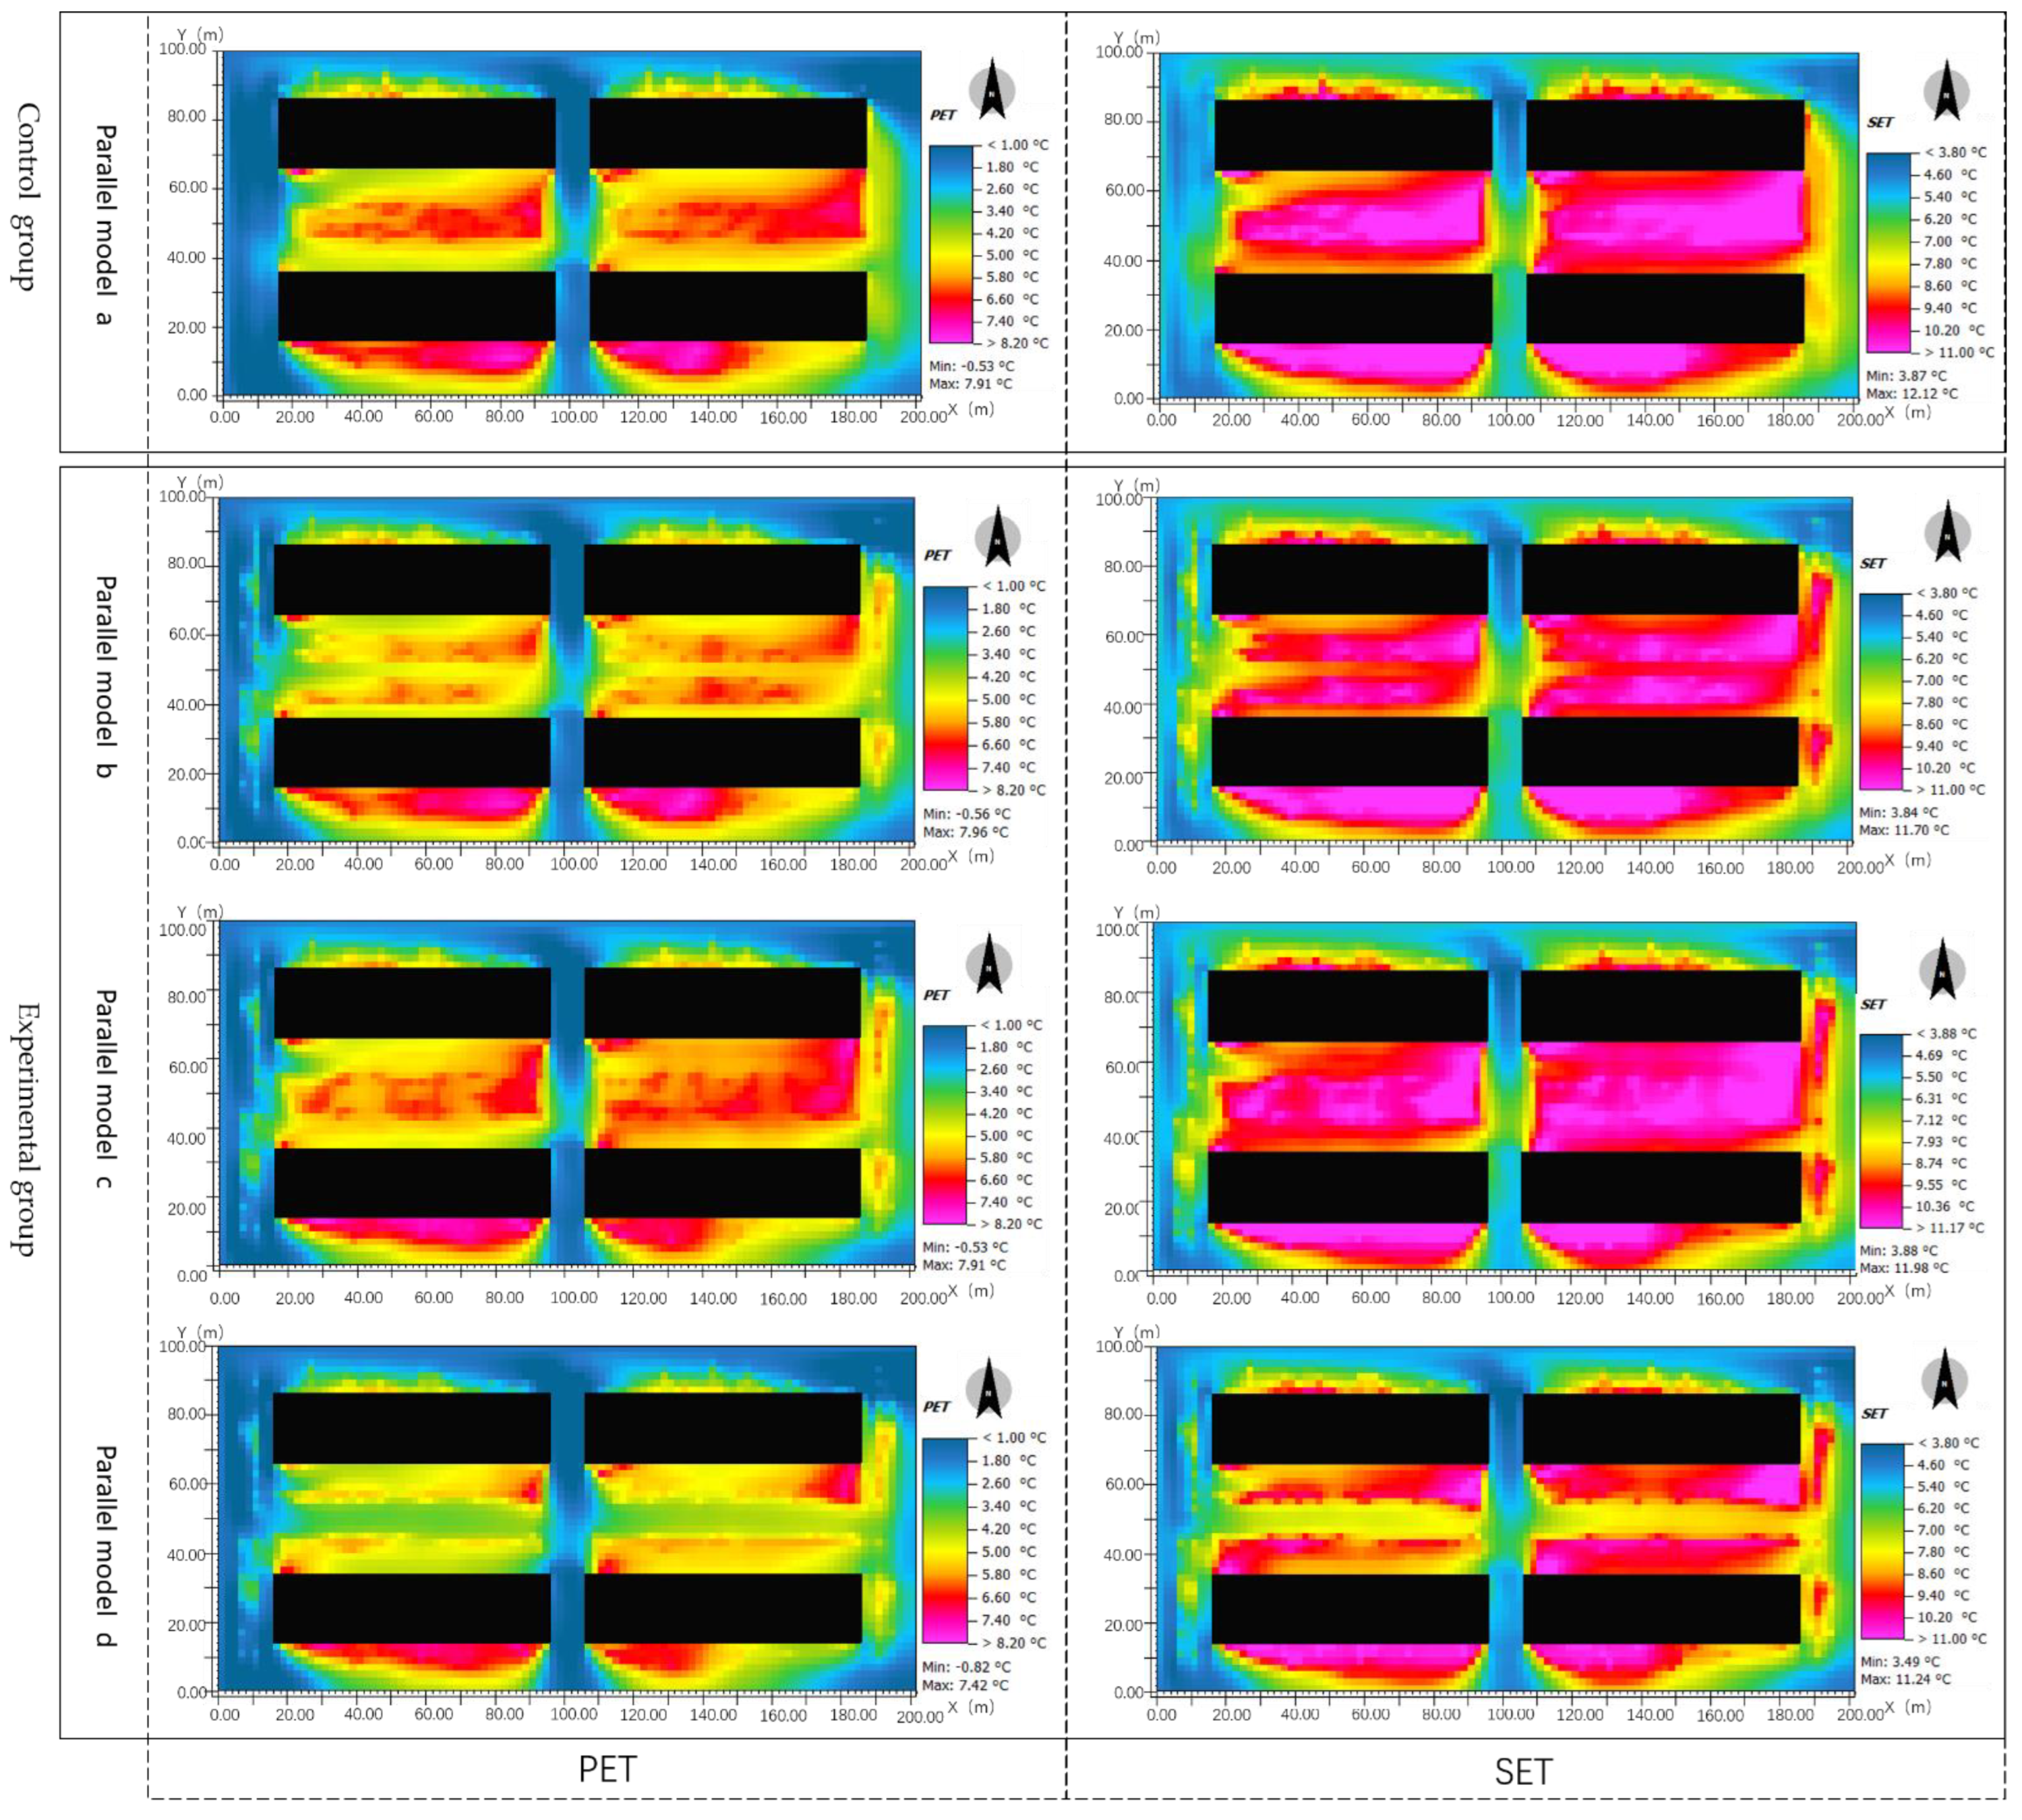
Figure 16 displays the thermal comfort simulation results of the four parallel greening models in winter. From the perspective of PET, models a and c provided good thermal comfort effect, where the yellow, orange, and red areas were wide. Moreover, a larger red area with a PET of approximately 6.6 °C appeared in the middle. In models a and c, the maximum PET values both ranked second (7.91 °C). The maximum PET value in model b was 7.96 °C, ranking first among the four models. Nevertheless, although there were large yellow and orange areas with good thermal comfort in model b, the red area with a PET at approximately 6.6 °C in model b was obviously smaller than those in models a and c. In model d, the maximum PET value (7.42 °C) was obviously lower than those of other three models, and the red area with a PET at approximately 6.6 °C was the smallest. From the perspective of SET, the maximum SET value in model c was 11.98 °C. Among the maximum values of the four models, it was second only to model a (12.12 °C). In model c, the superior area with SET was greater than 8.6 °C is the largest, which was obviously larger than those of other models. In model a, the maximum SET value (12.12 °C) was the largest among the four models, and there was also a large superior area with an SET greater than 8.6 °C, which was obviously smaller than that of model c yet. In model b, the superior area with a maximum SET value ranking third (11.70 °C) and which was greater than 8.6 °C was also obviously smaller than those in models a and c. The maximum SET value in model d ranked fourth among the four models (11.24 °C). In model d, the superior area with good thermal comfort and an SET greater than 8.6 °C was the smallest.
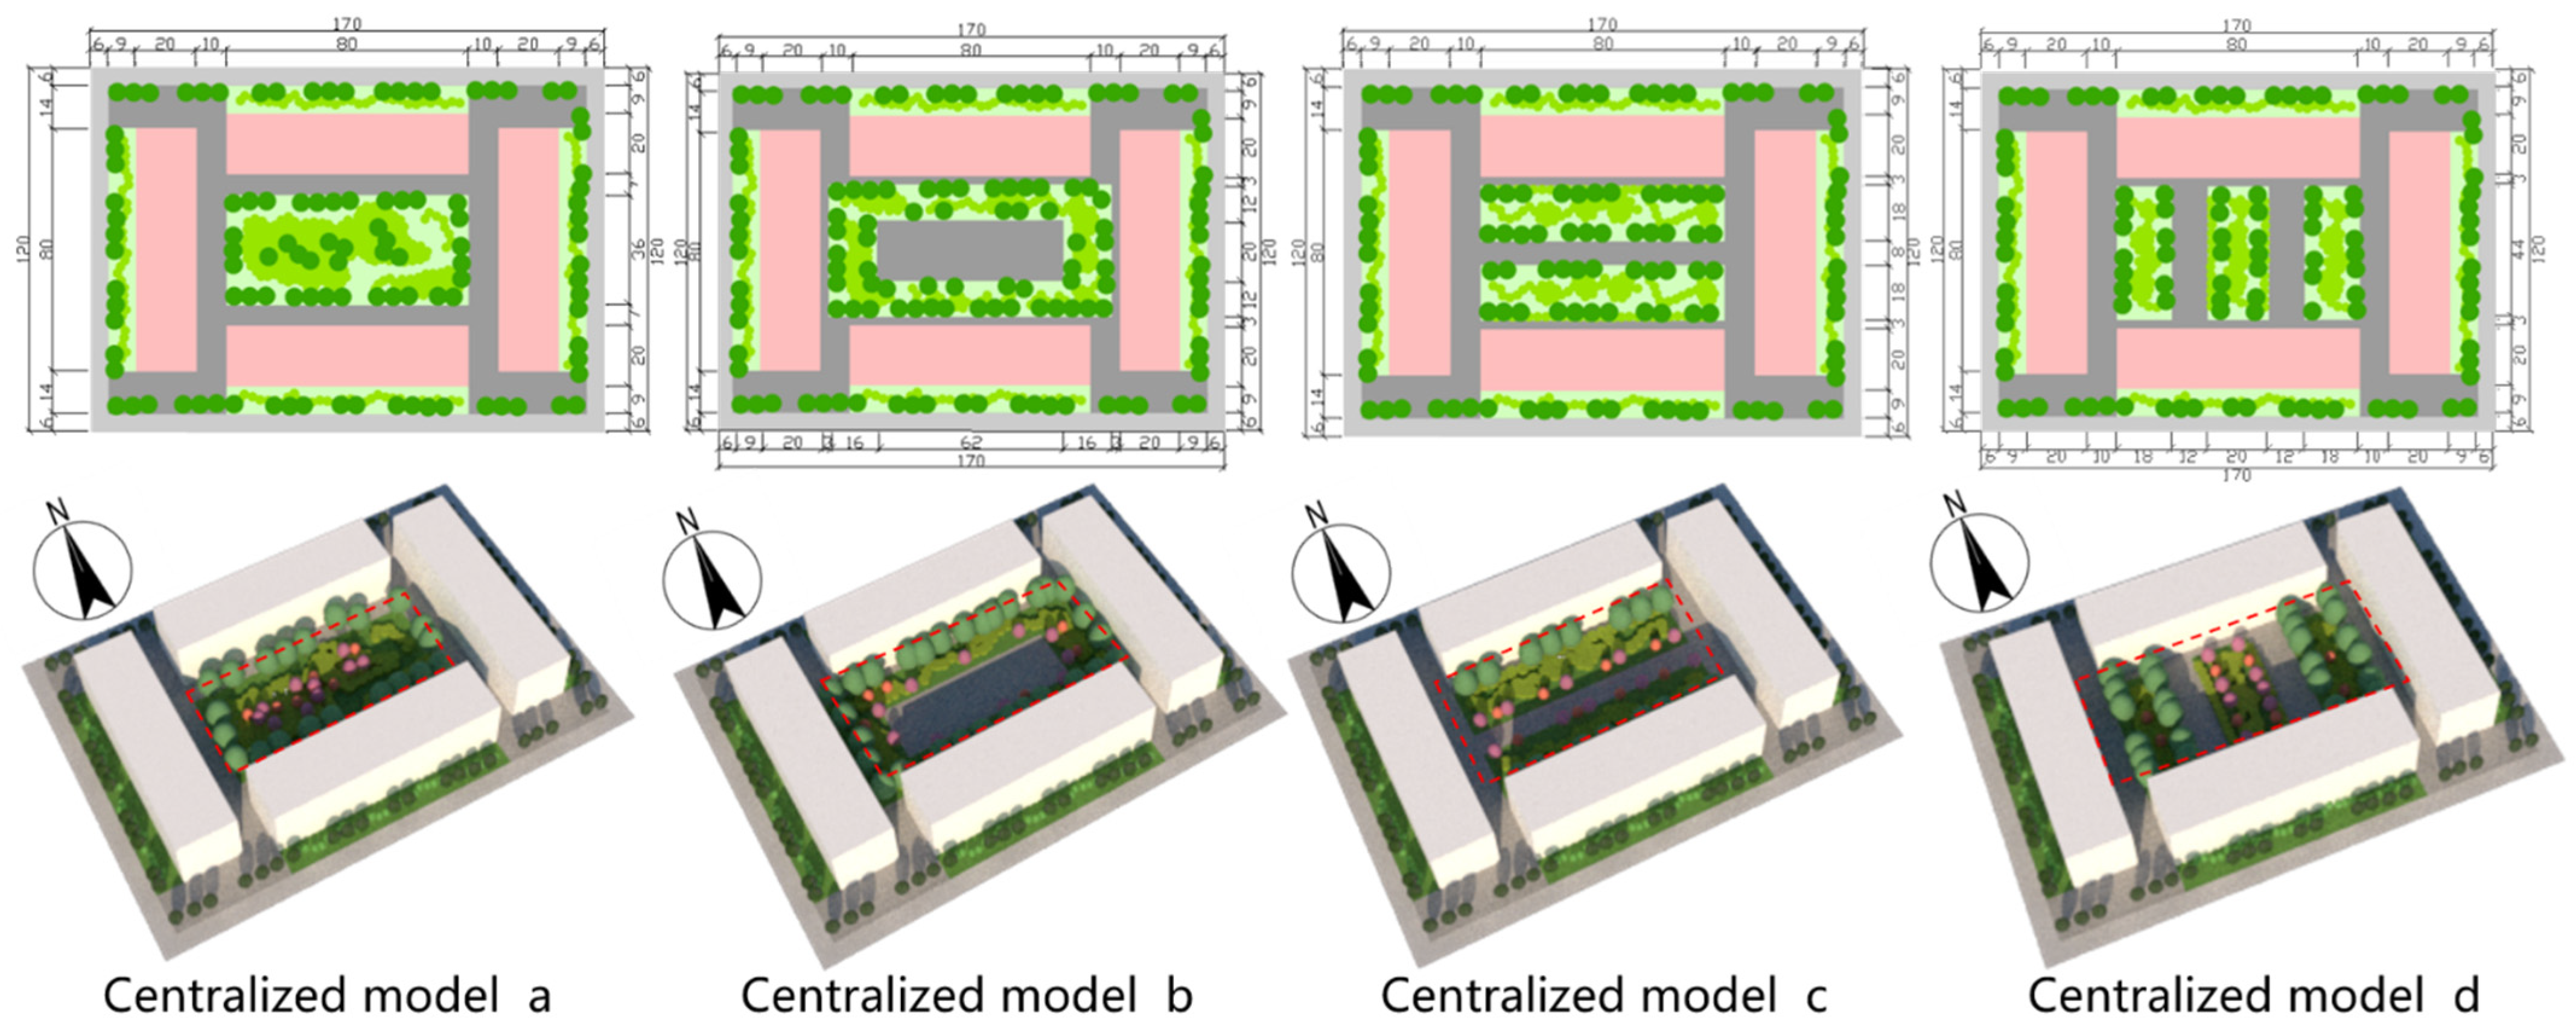
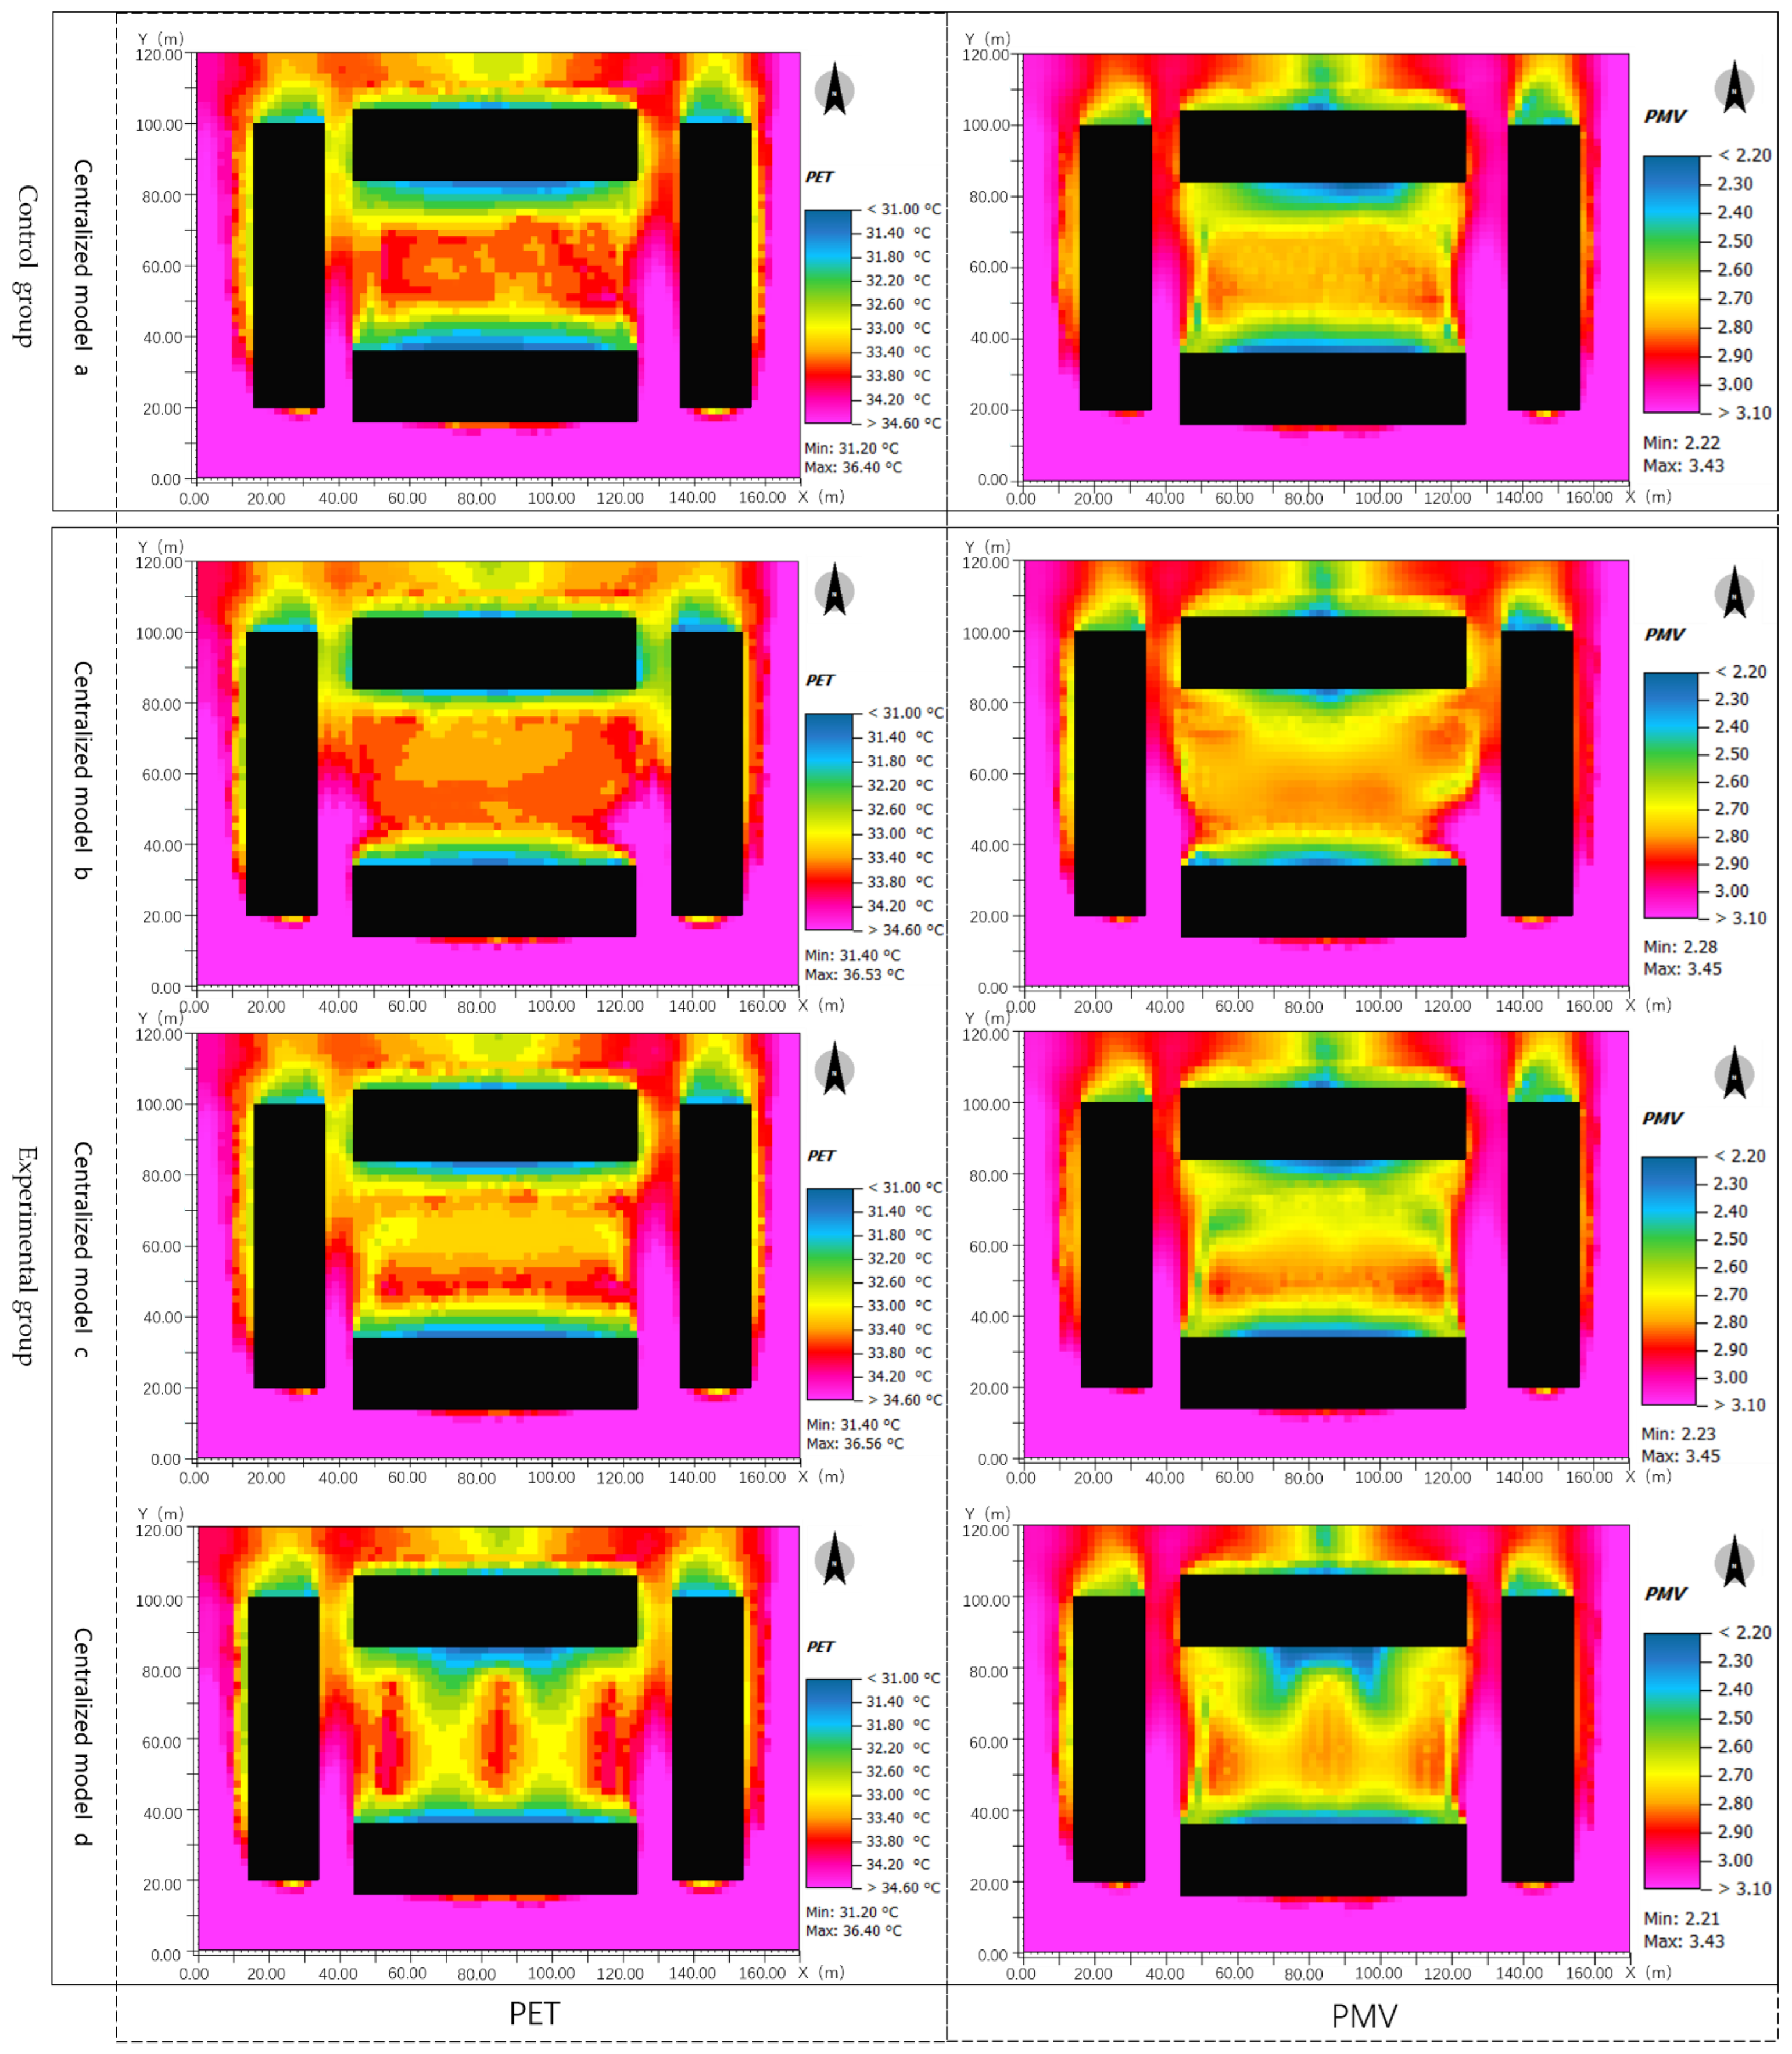
3.4.2. Analysis of the Influence of Different Centralized Greening Patterns on the Surrounding Thermal Comfort
After input of temperature, relative humidity, wind direction, wind speed, and other data in summer to simulate the four models, the centralized greening pattern models simulation results can be seen in
Figure 17. It was discovered that the maximum values for the PET and PMV in model d among different the green space concentration models were the lowest, and there was a large area with relatively good thermal comfort (PET less than 33.4 °C and a PMV less than 2.7). In model a, the maximum PET value was slightly higher than that in model d, and the maximum PMV value was the same as that in model d. In model a, there was also a large area with relatively good thermal comfort (PET less than 33.4 °C and PMV less than 2.7). In model c, the maximum PET value was higher than those of other models, and the maximum PMV value was higher than those of models a and d and equal to that of model b. In the model, the area with relatively good thermal comfort (PET less than 33.4 °C and PMV less than 2.7) was smaller than those of model a and b, but larger than that of model b. In model b, the maximum PET and PMV values were the largest among the four models, and the area with superior thermal comfort and PET less than 33.4 °C and PMV less than 2.7 was the smallest.
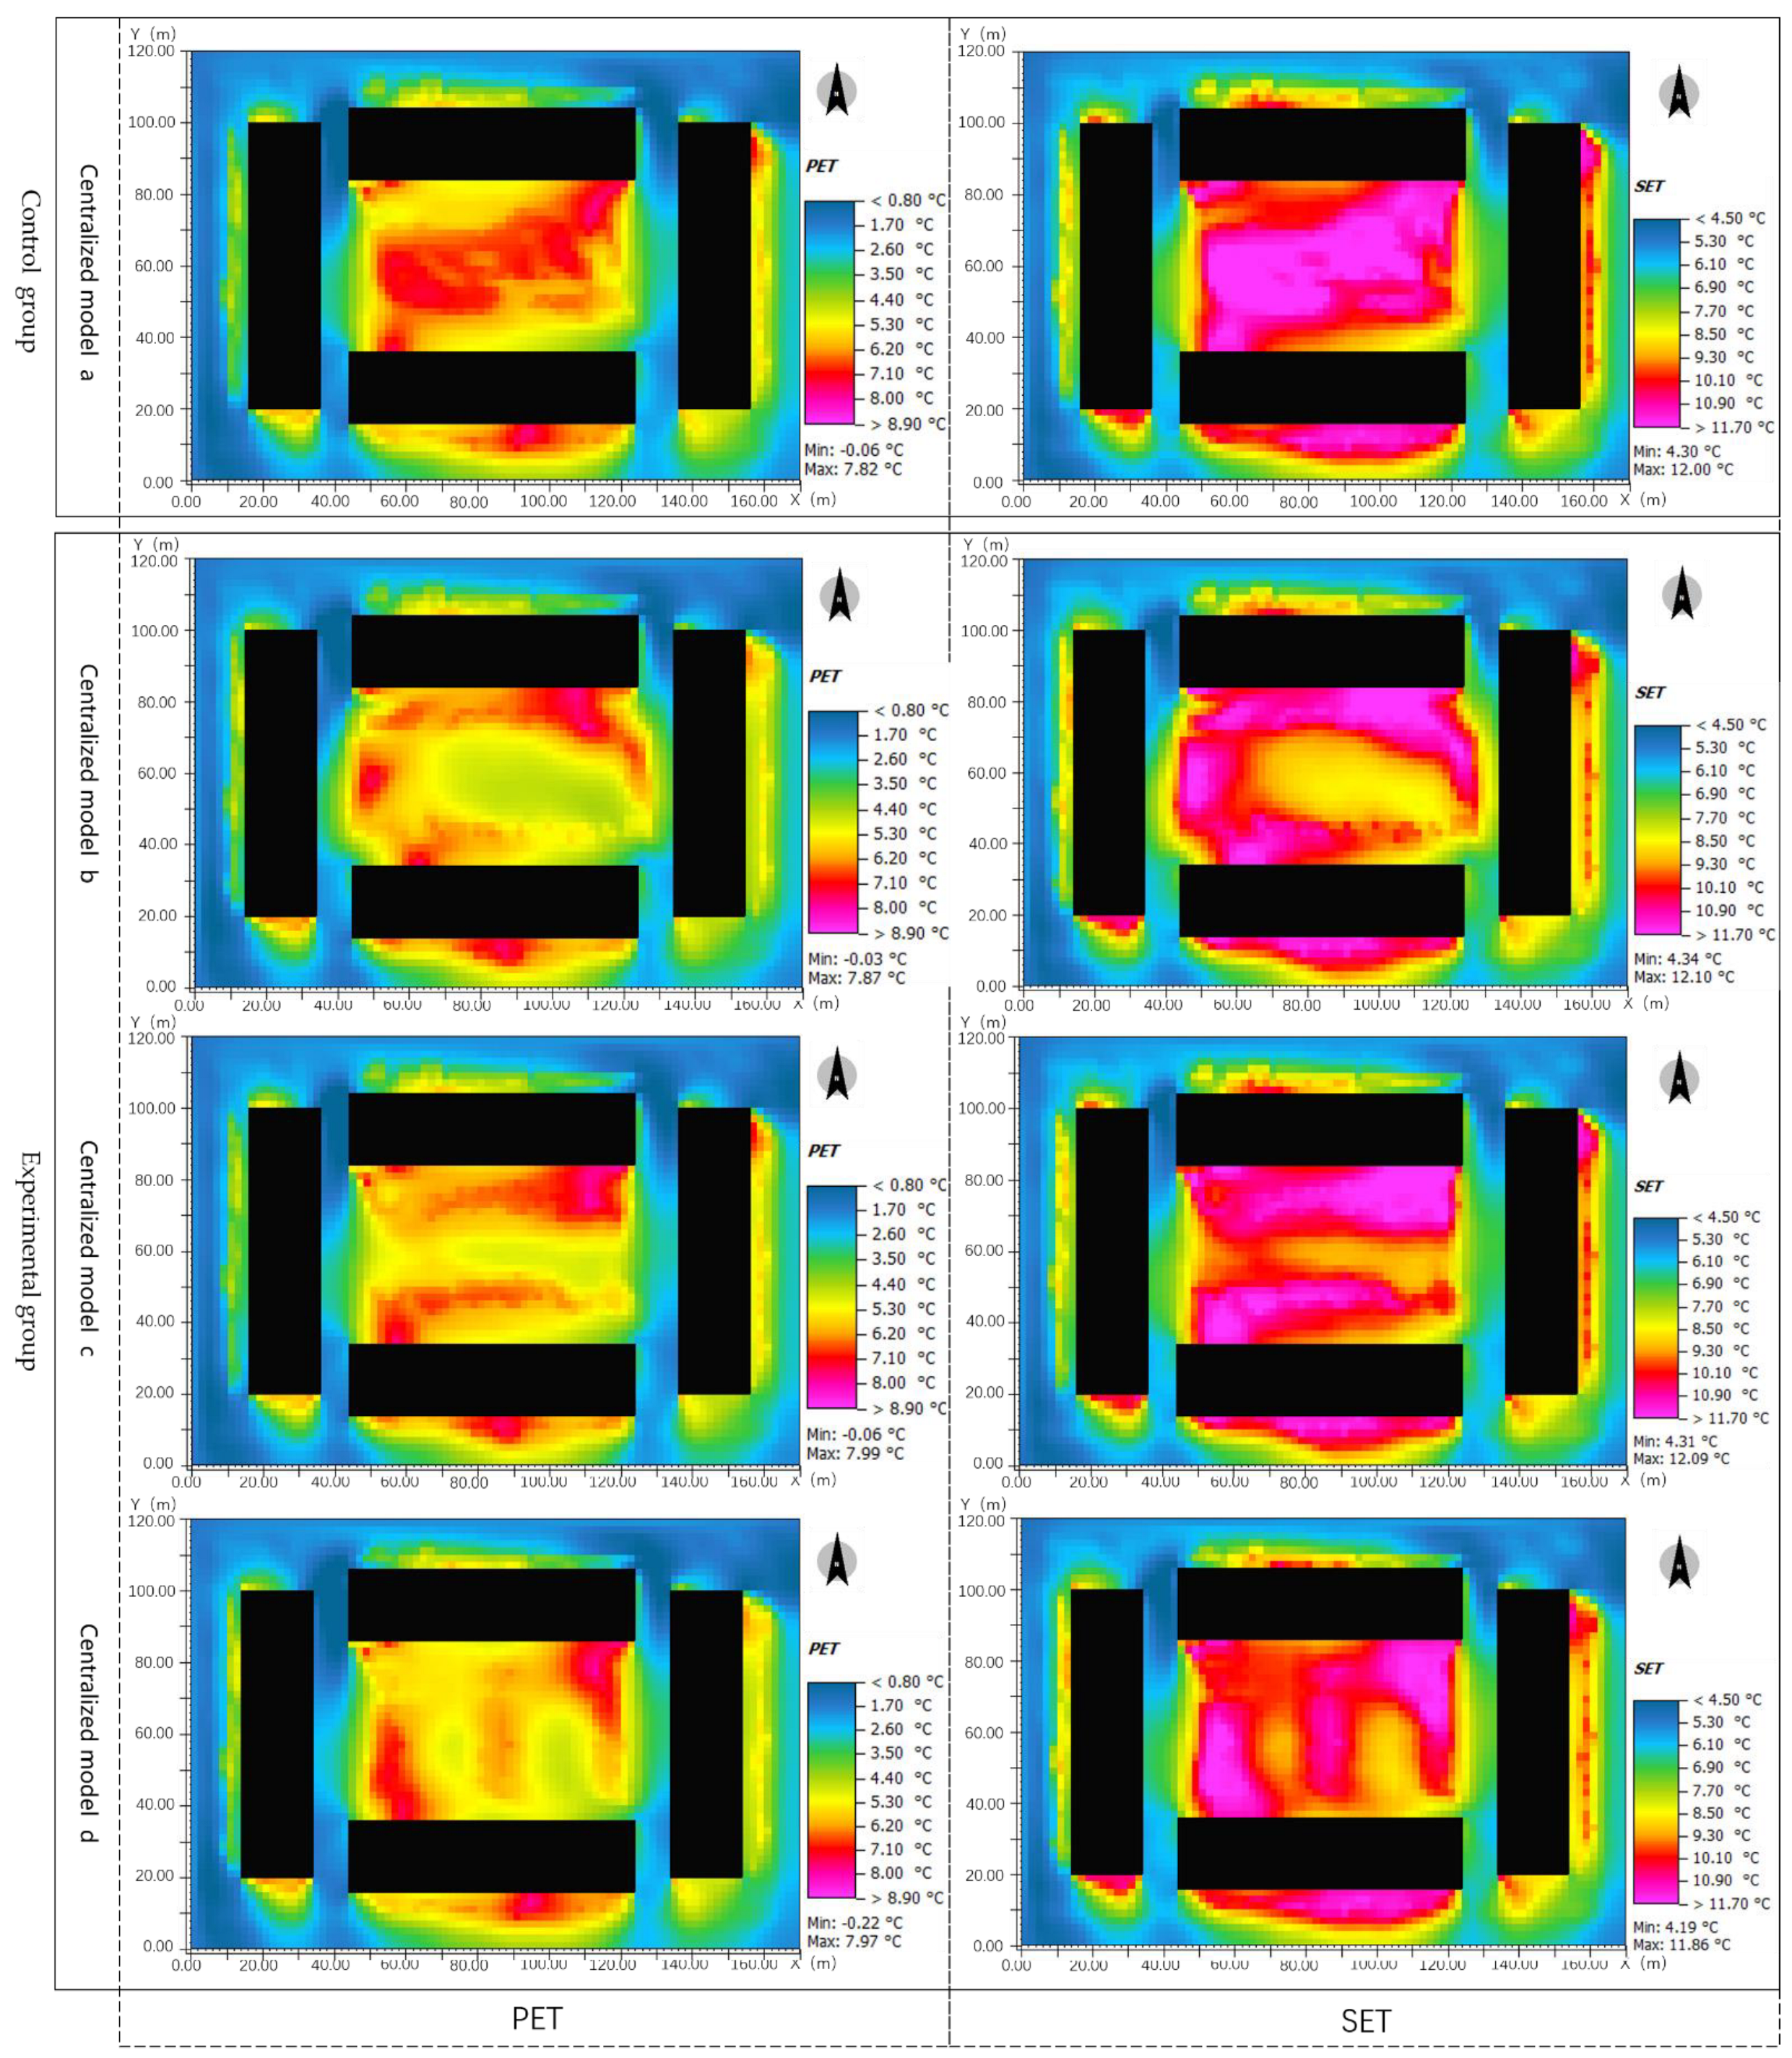
The
Figure 18 below shows the simulation results of the centralized greening pattern models in winter. The higher the PET and SET values, the better the thermal comfort. In model a, the maximum values of PET and SET were 7.82 and 12.00 °C respectively, and the maximum value of PET in model a was smaller than those in the other three models. The maximum SET value in model a was only superior to that of model d. The area with relatively good thermal comfort (PET greater than 6.2 °C or SET greater than 9.3 °C) in model a was obviously larger than those of the other three models. Therefore, generally speaking, model a was the one with the most ideal thermal comfort among the four models. In models c and d, the maximum PET values were 7.99 and 7.97 °C respectively, and the maximum SET values were 12.09 and 11.86 °C, respectively. The maximum PET and SET of model c were greater than those of model d. The researchers regard that upon comparing the areas with a PET greater than 6.2 °C or an SET greater than 9.3 °C in the two models, the areas with a PET greater than 6.2 °C or an SET greater than 9.3 °C in the two models were roughly the same, which, however, were obviously smaller than the corresponding area in model a. This means that both models c and d had a zone with good thermal comfort and the difference in the area size was very small. The maximum values of PET and SET in model b were 7.87 and 12.10 °C, respectively. The maximum SET value in this model was greater than the maximum PET values in other models. The maximum SET value in this model was less than those of models c and d. In model b, there was also an area with superior thermal comfort with a PET greater than 6.2 °C or an SET greater than 9.3 °C. In general, this area was smaller than the corresponding parts in other models. The thermal comfort in model d was also relatively worse.
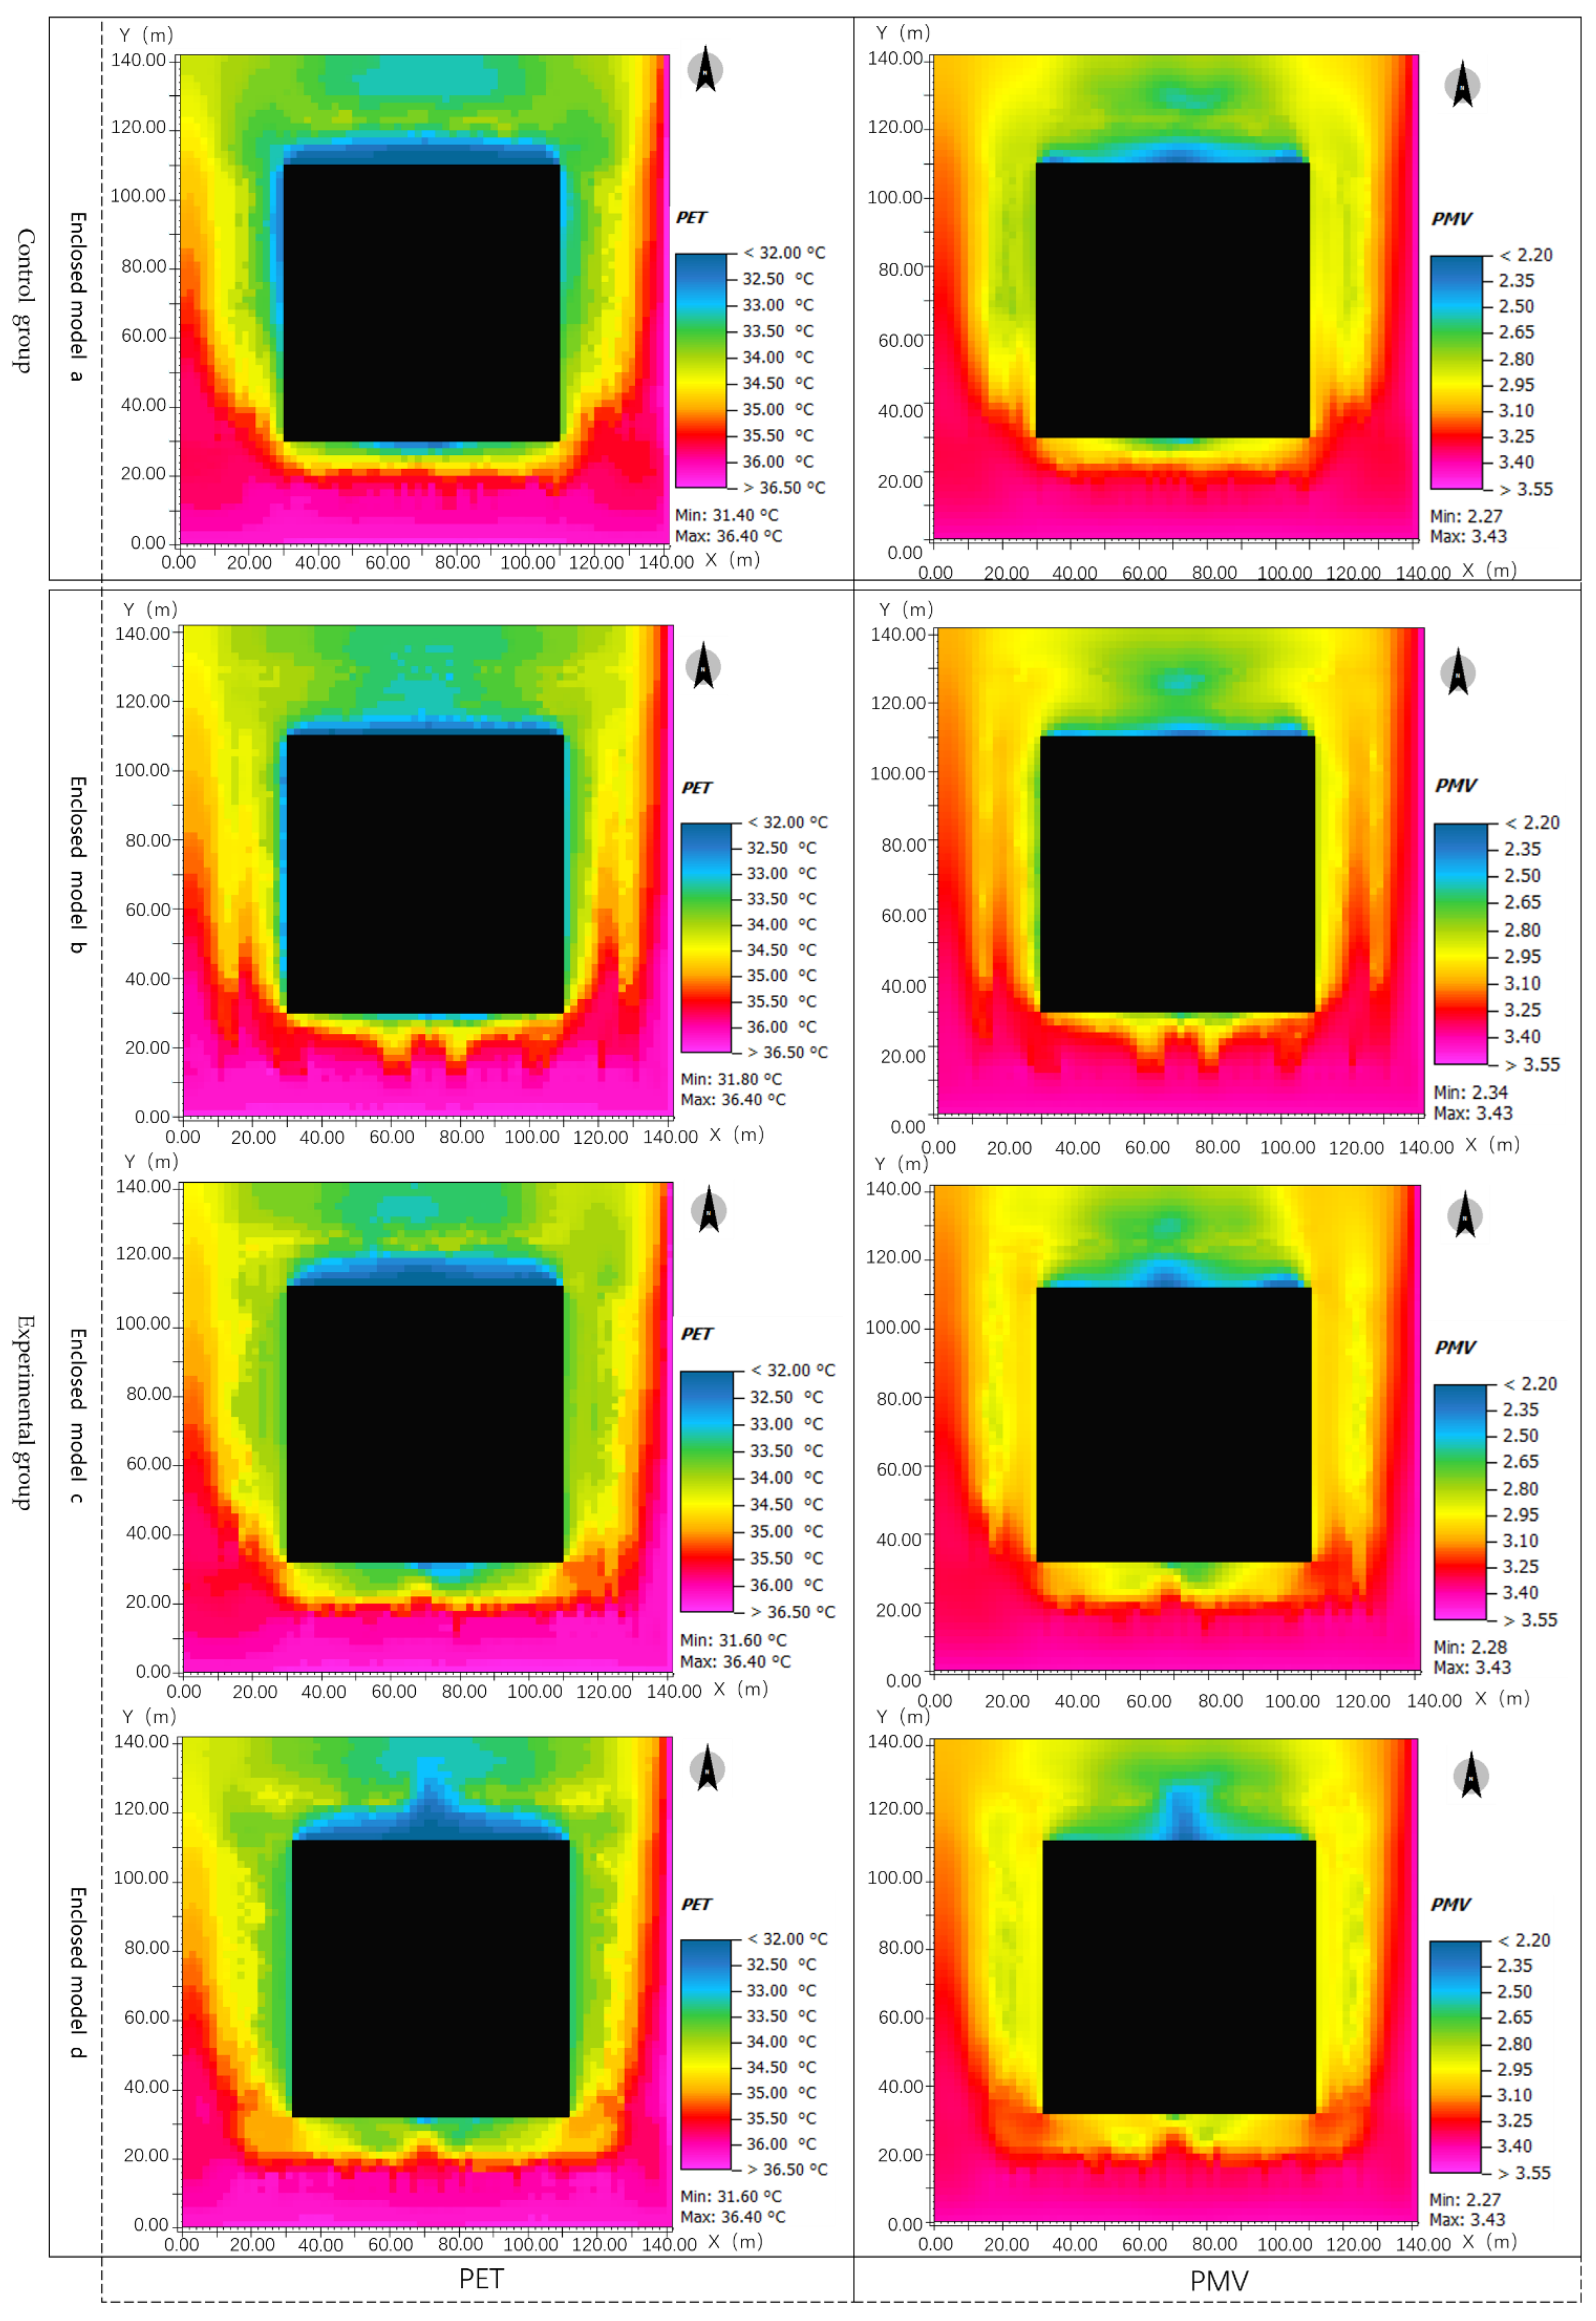
3.4.3. Analysis of the Influence of Different Centralized Greening Patterns on the Surrounding Thermal Comfort
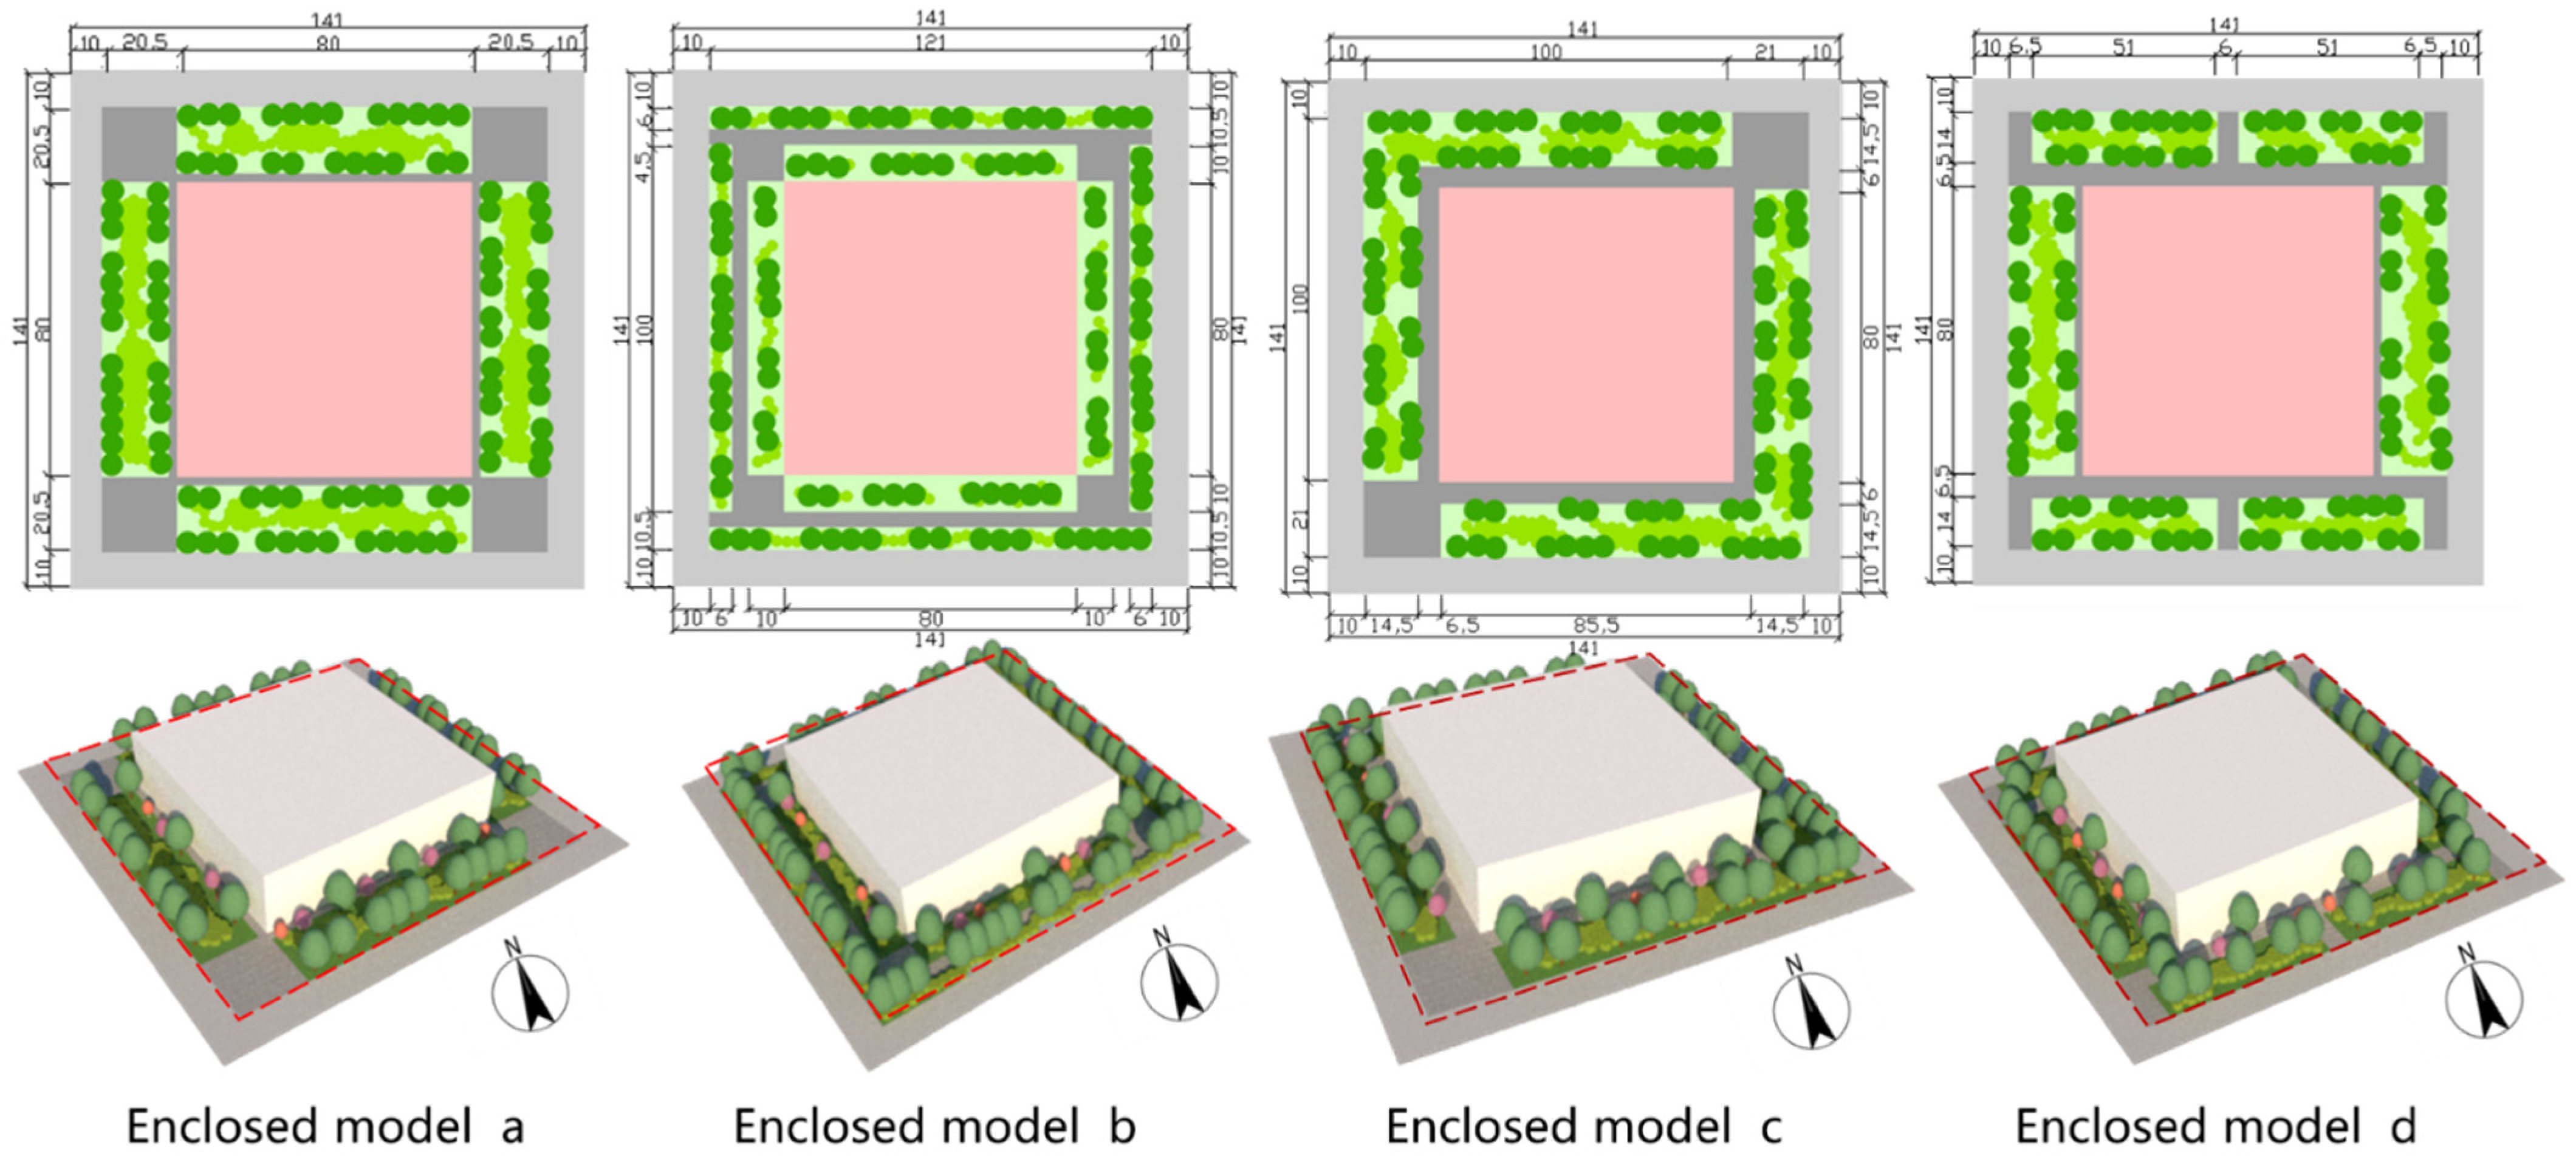
According to the simulation results of the enclosure greening models by the researchers in the
Figure 19, different green space layouts present significant differences in thermal comfort in the four models in the summer and winter. In summer, from the perspective of PET, the blue area with a PET less than 33 °C and the green area with a PET less than 34 °C in model d were larger than the other models. The minimum PET value in model d was 31.6 °C. The minimum PET value in model d was equal to that in model c, less than that in model b (31.8 °C), but greater than that in model a (31.4 °C). On the whole, model d provided a good layout. The green area with a PET less than 34 °C (relatively good thermal comfort) in model a was approximately the same as that of model d; nevertheless, the blue area with a PET less than 33 °C in model a was smaller than that of model d. The minimum PET value in model a was lower than those in the other three models. In general, researchers believe model a provided a slightly worse thermal comfort than model d. The green area in model c was smaller than that in model a. The blue area in model c was roughly the same as that in model a, but less than that in model d. The researchers believes the thermal comfort of model c is slightly worse than model a. Like other models, model b also had a relatively large green area (PET less than 34 °C). However, the blue area in model b (PET < 33 °C) is obviously smaller than the corresponding parts of the other three models. The minimum PET value in model b was the largest among the four models. Upon comprehensive consideration, the green space layout in model d presented relatively poor improvement for the thermal comfort.
From the perspective of thermal comfort index PMV, the PMV values in the four different models under the premise of the simulation of summer weather conditions indicate that in the four models, the green and blue areas of models a, c, and d were larger (PMV less than 2.8) and generally similar. This also demonstrates that the areas with relatively better thermal comfort in models a, c, and d were larger. In model b, the green and blue areas were smaller (PMV less than 2.8), and the thermal comfort was relatively poor for larger areas. From the perspective of the minimum PMV value in the research area, the minimum PMV values in models a and d were 2.27, which were lower than those of the other two models. The minimum PMV value in model b was slightly higher than those in models a and d. The minimum PMV value in model b was higher than those in the other three models.
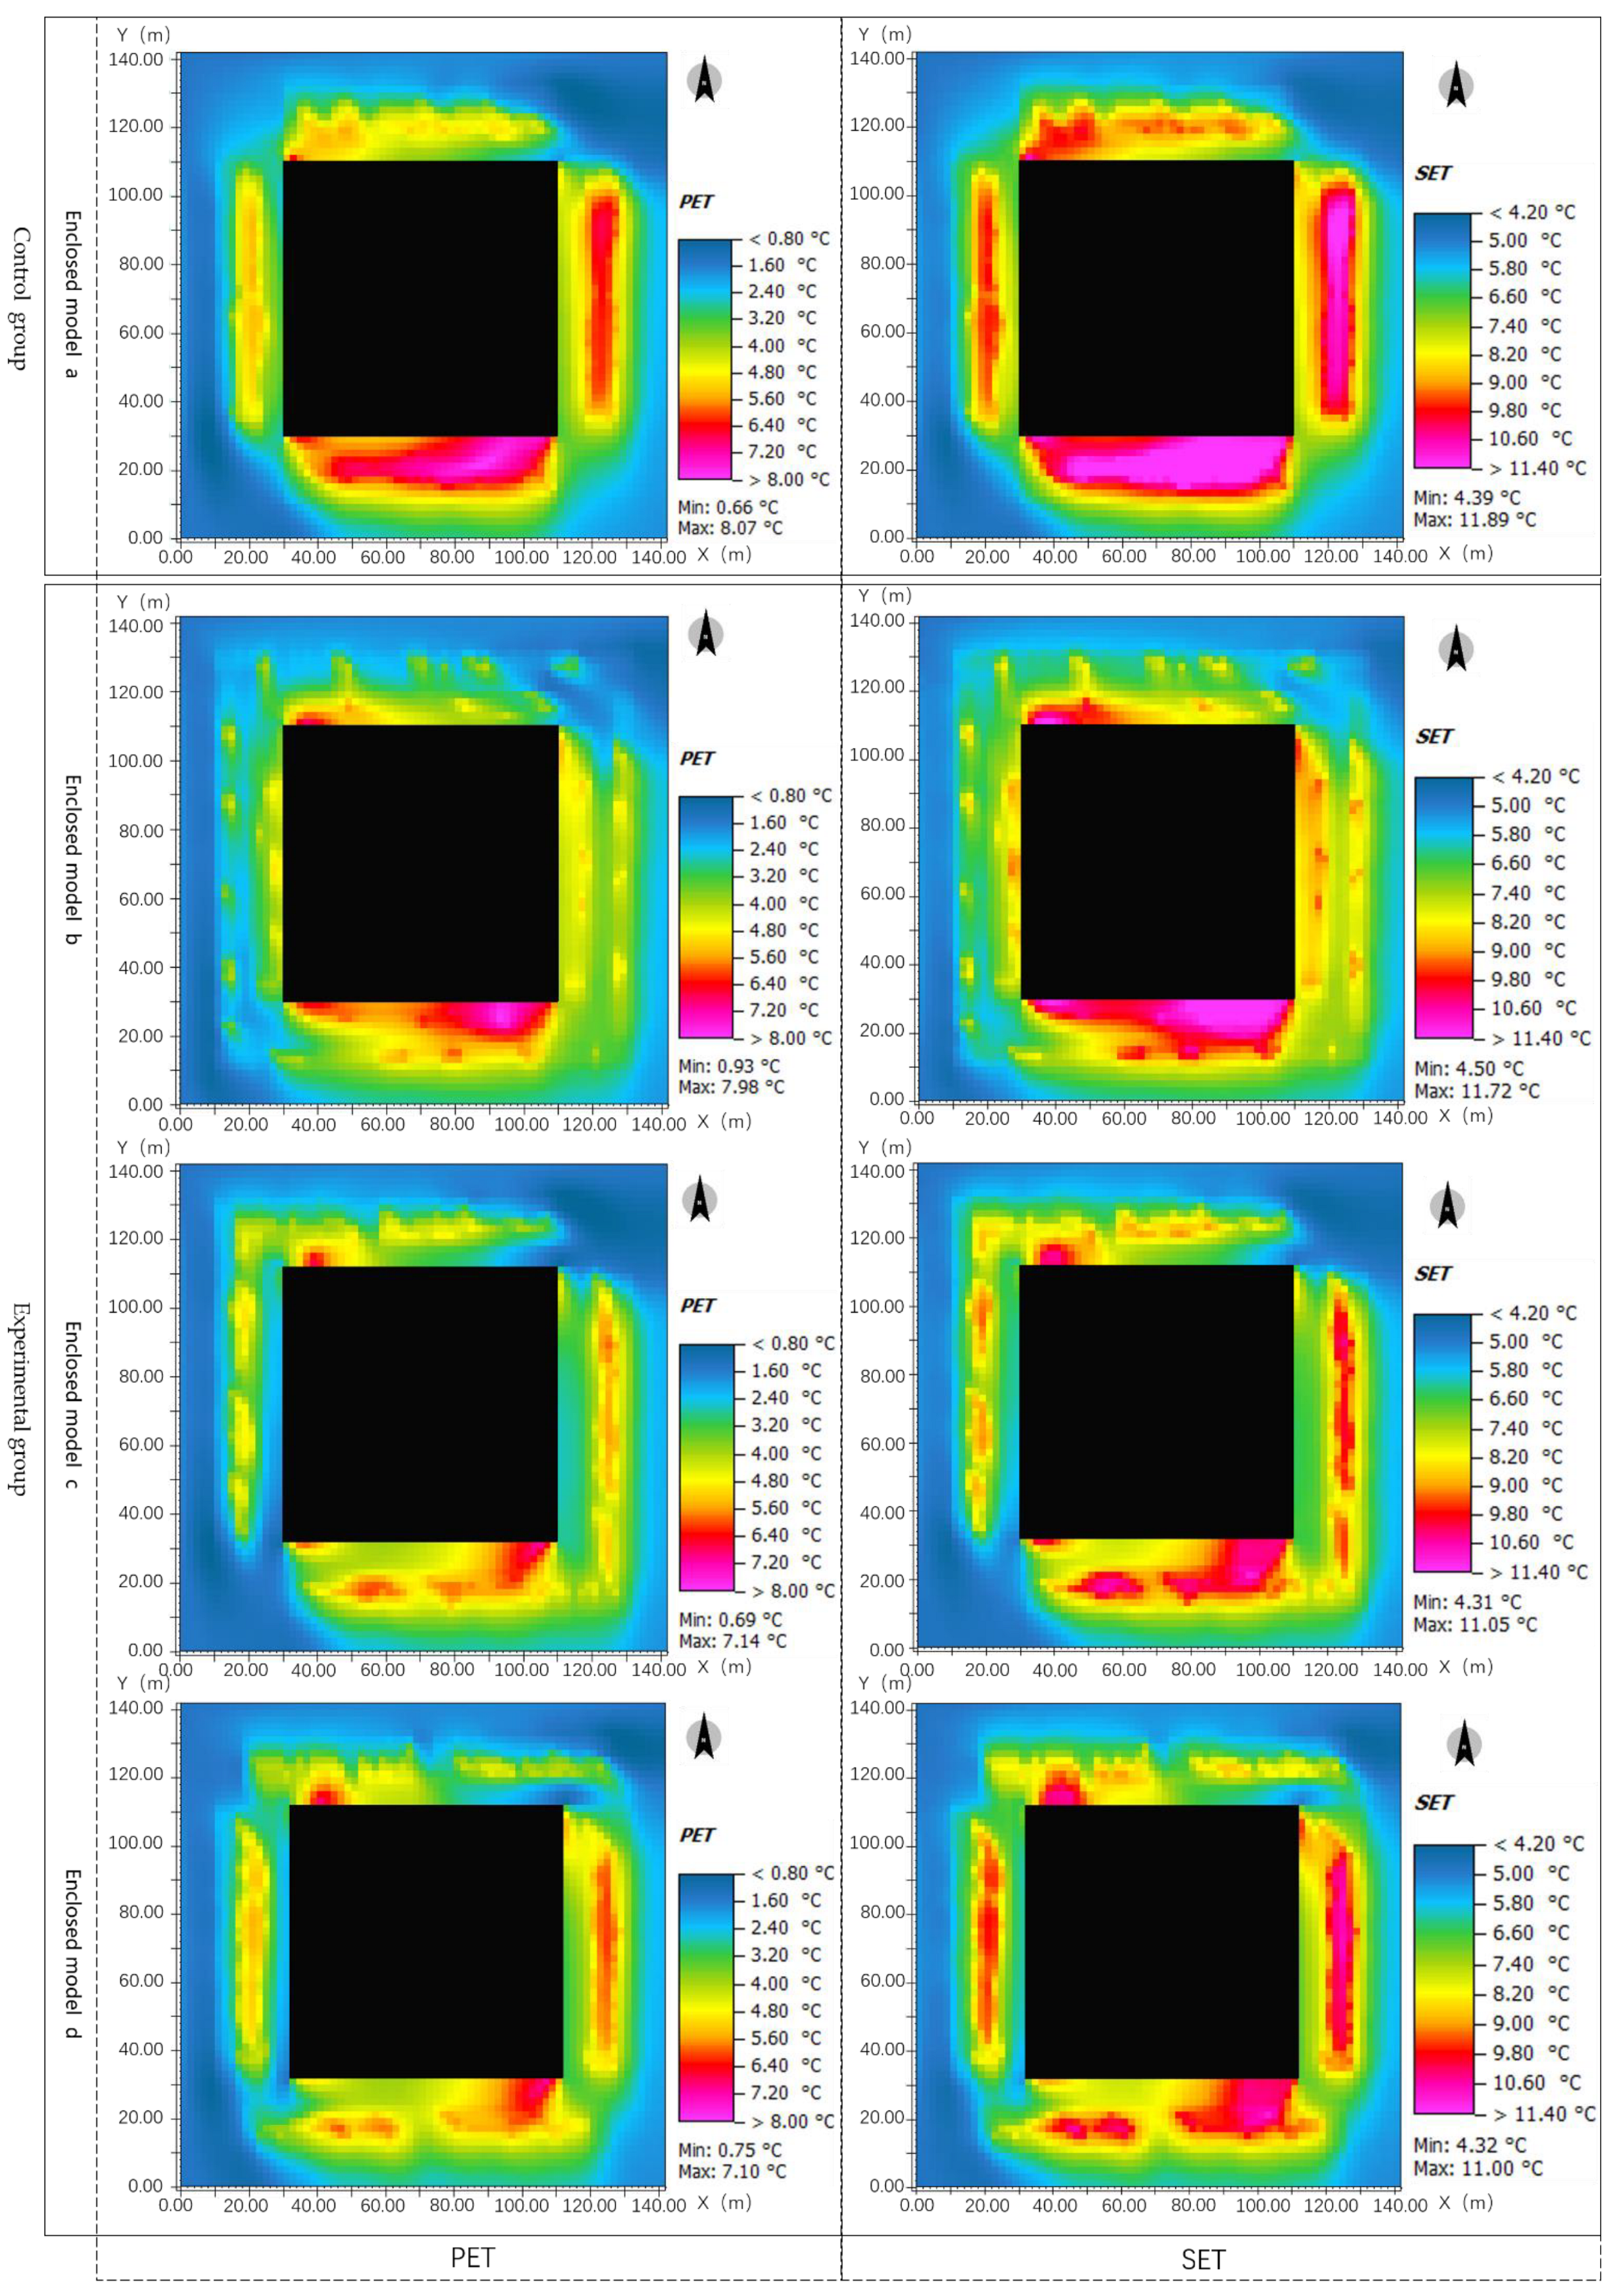
Figure 20 below shows the thermal comfort of each enclosed greening model in winter. After comparing the areas with a PET value greater than 4.8 °C in the figure, the area with a PET value greater than 4.8 °C (relatively good thermal comfort) in model a was the largest. The researchers regarded model a as a model that provided relatively good thermal comfort. In models b, c, and d, the areas with a PET greater than 4.8 °C presented little difference. Compared with models c and d, the main feature of model b was in that there was a larger area with a PET value greater than 6.4 on the south side of the building. There was an area with relatively better thermal comfort (PET between 4 and 5.6) next to the east side of the building. There was an area with a PET greater than 6.4 on the south side of each of models c and d and two areas with a PET between 4.8 and 5.6 on the east and west sides of and with a certain distance from the building. The maximum PET value in model a was as high as 8.07 °C. This was much higher than the maximum PET values (7.14 and 7.1 °C) in models c and d. The maximum PET value in model b was 7.98 °C, which was slightly lower than that in model a. The simulated SET values of the four different models at 16:00 on 15 December 2020 indicate that the yellow, red, and purple areas with better thermal comfort in model a were larger. The thermal comfort of model a was better than those of models b, c, and d. In model d, the area around the building with an SET greater than 9 °C was larger than those in models b and c. The researchers believe that this may be considered a superior choice for thermal comfort. However, model d was worse than model a under the consideration of thermal comfort for the whole area. In the south of the building in model b, there was a larger area with an SET greater than 9 °C. Although the area with an SET greater than 9 °C at the south of the building for model c was smaller than that for model b, there was a larger area with an SET greater than 9 °C on the right side of model c, except for model b. The maximum SET value in model a was 11.89 °C, which was much higher than those in the other three models. This value in model b was 11.72 °C, which was lower than that in model a. The maximum SET values in models c and d were 11.05 and 11 °C, respectively, which were significantly lower than those in models a and b. There were relatively small differences in the areas of the zones with relatively good thermal comfort (SET greater than 9 °C) in models b, c, and d. The distribution locations of zones with relatively good thermal comfort in the three models were obviously different.
3.5. Suggestions on the Optimization of Green Space Patterns in Urban Blocks
The researchers analyzed four models of green space layout in each of the three types: parallel greening pattern, centralized greening pattern, and enclosed greening pattern. It was found that differences in the green space layout led to significantly different thermal comfort levels in each area of the model, while other factors held constant. Among the four models of parallel greening pattern, the model with only two main green areas in between (separated by sidewalks) was found to produce good overall thermal comfort considering both the summer and winter thermal comfort simulations. In the summer and winter, a larger area with better thermal comfort was formed between the buildings parallel to each other, which was significantly better than the other areas. In both summer and winter, a large area of better thermal comfort was created between buildings that were parallel to each other, significantly better than that of other areas. The remaining three models had green spaces divided into a larger number of small plots and, overall, they were less thermally comfortable in comparison. In addition, the green space being relatively broad and divided into several parts by a narrow sidewalk in the middle in another model also had better thermal comfort. In the remaining two models, the green space was divided into more small plots and the green space was relatively narrow, then their thermal comfort was also relatively poor. In fact, the layout of greenery in a green space parallel type of block could be of a wide variety, and it was difficult for the researchers to generalize and simulate all forms of green space layouts. However, based on the simulation results of the four selected groups of models, the researchers suggest that when planning green spaces in the center of blocks in the parallel type of models in the future, more consideration should be given to planning a larger green space rather than more small green spaces in equal size, and a wider green space should be planned provided that the total area and length of the green space are equal. Based on the results of the study, the researchers believe that it was more likely to result in a green space layout with better overall thermal comfort.
Based on the observation of the centralized green space model, it could be seen that the green space within the area formed by the building envelope could produce better thermal comfort in summer and winter when the green space existed as a whole plot or when there were some walkways in the middle of the green space dividing it into several parts. The distribution of the better thermal comfort areas differed among the three models, but in general, the area sizes were similar. The thermal comfort of the model with a large area of impervious underlying surface in the middle of the central green space was poor. Therefore, the researchers suggest that the process of designing blocks or areas enclosed by buildings should try to avoid creating a large heat island area with impermeable underlying surfaces in the middle of the green space.
Based on the researchers’ simulation results for the four enclosed greening models, it can be seen that in the three models with extended green space widths around buildings, the differences in thermal comfort conditions between the three models within the studied area are minimal as long as the width of each green space patch remains constant, and the number of green space patches is increased or decreased by adding or reducing the number of sidewalks between green spaces. In the green space model, by providing longer sidewalks between two green spaces and parallel to them, the width of individual green spaces in the green space model is reduced, creating more green space patches, then the area was less thermally comfortable. This also shows that in the enclosed greening model, if the green space patches were too small, the small green space improved the thermal comfort of the surrounding area less, and the impervious underlying surface further deteriorates the thermal comfort of the area around the green space.
4. Conclusions
Today, since improving the urban microclimate in urbanized areas through large-scale demolition and renovation measures has proven to be challenging, it is important for city builders to consider how to adjust the microclimate under constrained circumstances. Finding suitable patterns in the limited green space can effectively improve the environmental quality of built-up urban areas. This paper, through research and analysis of the microclimate of green space patterns in urban blocks, proposed suggestions for the optimization and selection of green space patterns, which can greatly improve the microclimate without changing the combination form of buildings under limited conditions in the future. The researchers input summer and winter meteorological data for simulations and found that enclosed greening model with larger footprints undoubtedly contribute to improved thermal comfort around the buildings. However, as the distance between the green spaces and the buildings increased, the thermal comfort situation in the green spaces decreased rapidly. In the enclosed greening model, multiple green spaces with too narrow widths did not improve the thermal comfort of the surrounding area as much as a few wider and less numerous green spaces with equal total area. Therefore, when planning for enclosed green space, it is not advisable to set the green space area too small, because the improvement of thermal comfort of the surrounding area was not obvious with a small green space. In addition, a certain amount of green space was considered at a certain distance from the enclosed green space around the building to improve the thermal comfort of the area far away from the building. In the process of designing or renovating the thermal comfort of centralized greening blocks, researchers believe that a green concentration area with buildings closely spaced all around will have better thermal comfort in an area without very tall buildings, which helps to fully utilize the effect of buildings to block off cold winds and the warming effect of green spaces in winter. In summer, this type of layout also facilitates the cold island effect of the green space. The layout pattern of designing green space enclosures in high-rise residential areas may lead to poor ventilation, temperature and humidity and other conditions in the enclosed area, resulting in poor summer thermal comfort in the area. In addition, it is not advisable to build a large hard paved area in the middle of the central green space in a model with centralized greening, as this will create a heat island in the middle of the green space in summer, which will have a negative impact on the thermal comfort in this area. In the models with green space parallel and interspersed, as the green space was more uniformly dispersed in all parts of the studied area, the thermal comfort indexes take more intermediate values in the area. It was found that the parallel type of green space is more conducive to ventilation in summer, while the thermal comfort in the area covered by green space is better in general. In winter, if the central area of the green space interspersed type is more densely packed, it will be more able to take advantage of the warming effect of the green space in winter. In the comparison, the researchers found that the area with better thermal comfort in winter was relatively larger in the interspersed green space type. For the central green space in the green space parallel blocks, the researchers analyzed four models and found that, in general, one large green space produces a continuous and larger area with relatively better thermal comfort than many small green spaces. It was found that some of the dispersed greening blocks are the old ones that have not been well planned. The overall thermal comfort of the models of green space dispersion blocks was poor due to the long distances between green spaces, large differences in green space sizes, and more irregular shapes.
In this paper, the study and analysis of the green space patterns of the blocks in the 2nd ring of Changsha City—a typical city in Central China—can provide a reference basis for the layout of the comfortable pattern in limited green space in the future. However, due to the limitations of the research conditions, this article also has the following deficiencies, hoping that they can be solved in future studies. Firstly, when optimizing the layout of the pattern of green space, the selected conditions were limited to the same area, building height, building density, and greening rate. However, block area, building height, building density, and greening rate are also influencing factors of microclimate. Meanwhile, the effects of the water body, plant optimization configuration, roof greening, and other factors on microclimate were not studied during this time. In future studies, the single factor evaluation can be conducted aiming at the correlation among the effects of each factor on the pattern of green space. Secondly, due to the limitations of the simulation software, the green space patterns of the block in this study had the same ground elevation, and the complex topographic factors were not considered inside the block. The construction of microtopography is a common method in landscape design. The effect of microtopography on microclimate in green space can be studied in the future.


