Article

Effects of Harvesting Intensity on the Growth of Hydrilla verticillata and Water Quality

1
College of Urban and Environmental Sciences, Hubei Normal University, Huangshi 435002, China
2
Huangshi Main Laboratory of Biodiversity and Environmental Conservation in Lake Watersheds, Hubei Normal University, Huangshi 435002, China
3
School of Earth Sciences and Spatial Information Engineering, Hunan University of Science and Technology, Xiangtan 411201, China
*
Author to whom correspondence should be addressed.
Sustainability 2022, 14(22), 15390; https://doi.org/10.3390/su142215390
Submission received: 21 September 2022 / Revised: 2 November 2022 / Accepted: 16 November 2022 / Published: 18 November 2022
(This article belongs to the Special Issue Wetlands: Conservation, Management, Restoration and Policy)

Abstract

:
The effects of harvesting intensity on the growth of Hydrilla verticillata (L. fil.) Royle as well as water quality were studied in controlled experiments to provide a reference for managing submerged vegetation and purifying the water. The results showed that harvesting had a significant effect on the recovery of shoot growth and H. verticillata height. The harvested group recovered completely or mostly after two harvests, but the recovery time was significantly longer than the control group. The final biomasses of the harvested groups (15%, 30%, 45%, 60%, and 75% harvested) decreased to 66.61%, 49.13%, 43.95%, 43.77%, and 29.94% of the control group, respectively. The greater the harvesting intensity, the fewer the winter buds. Harvesting reduced the number of H. verticillata branches. Repeated harvesting at medium and low intensities during the rapid growth of H. verticillata effectively improved the water quality and inhibited the propagation and growth of phytoplankton. These results show that harvesting controlled the growth of H. verticillata, and that medium and low harvesting intensities were best when considering water quality.

1. Introduction

Submerged macrophytes are the main primary producers in shallow lake ecosystems where they help maintain the stability of the ecosystems [1]. Their growth and reproduction absorb large amounts of nutrients from the environment and provide space for microorganisms. In addition, submerged macrophytes improve the surrounding environment by secreting oxygen and organic acids [2]. Water quality has improved and the aquatic ecosystem has been restored by planting submerged plants in West Lake [3], Donghu [4], and Qinhu [5,6]. Submerged macrophytes have also been used as an ecological remediation measure to control eutrophic lakes, and reasonable harvesting of submerged macrophytes is an important part of management [7]. Reasonable harvesting of plants during growth can effectively reduce the concentrations of nutrients in lakes, thereby improving lake water quality [8,9]. At the same time, harvesting can effectively control secondary pollution and swamping in lakes caused by the excessive growth of submerged macrophytes [10].
Managing the harvesting of submerged macrophytes to control lake water quality has attracted the attention of researchers worldwide [11,12,13]. Harvesting has been used as an effective measure to manage submerged macrophytes in developed countries, such as the United States and the United Kingdom [14]. The harvesting and management technology for submerged macrophytes involves harvesting the pant at different harvesting intensities and transporting them to the shore through mechanized or manual labor [15]. Mechanical harvesting is a fast and efficient way to remove harmful macrophytes and improve water quality in shallow lakes [8]. However, the artificial harvesting of lake-submerged macrophytes only removes the top parts of the plants, and the harvesting effect lasts only for a short time but has a high labor cost. Additionally, the harvesting season must be carefully determined to avoid the growing season of the plants. Harvesting management of submerged macrophytes in different akes types should be flexible so that the appropriate harvesting method can be selected according to the need [16]. Different types of submerged macrophytes have different growth characteristics, different effects on bodies of water, and different optimal harvesting times and intensities. Previous research on three aquatic plant species showed that aquatic plants differ in their ability to absorb and control the effects of nitrogen and phosphorus, and they also have different optimal harvesting times. Increasing the number of harvests can make a significant difference in water quality and plant growth [17]. Harvesting will affect the competition among different species; thus, affecting the growth and reproduction of the aquatic plants. After the high-intensity harvesting of Potamogeton crispus L., the dominant benthic species changed from a clean species to a medium-polluting species. Over-intensive harvesting leads to higher nutrient levels in the water and increases the distribution and number of medium-polluting species [18]. The growth of P. crispus is inhibited under medium-intensity harvesting; thus, promoting the growth of Elodea nuttallii (Planch.) H. St. John, and improving its interspecicific competition position [19]. Harvesting at medium and low intensities from August to late September did not significantly affect the asexual reproduction of Myriophyllum spicatum L., indicating that it would not affect the long-distance expansion of their population, but high-intensity harvesting significantly inhibited the production of M. spicatum asexual propagules which would limit population expansion [20]. The greater the harvesting intensity of Myriophyllum aquaticum (Vell.) Verdc., the shorter the remaining main stem, the more restricted the growth, and the fewer new buds, resulting in a decrease in the number of branches and buds. Furthermore, plant heights were shorter and plants had fewer branches with higher harvesting intensities [7]. In addition, sustainable harvesting of submerged macrophytes helps manage phytoplankton biomass and reduces the accumulation of waste at the bottom of the lake [21].
Hydrilla verticillata (L. fil.) Royle is often used in ecological restoration projects, and recent research has focused on its growth characteristics, purification ability, and resistance to stress [22,23]. The effect of biosorption of heavy metals has also been studied [24], but less has been reported on harvesting. This study investigated the changes in H. verticillata growth indices as well as the environmental water quality characteristics before and after harvesting. This empirical study will serve as a reference for the development of submerged macrophytes management strategies.

2. Research Methods

2.1. Experimental Design

The H. verticillata seedlings used in the experiment were collected from the shallow lakes in the middle reaches of the Yangtze River Basin in China. The experiments were conducted outdoors on the water environment ecological restoration platform of Hubei Normal University from June to November 2018. The experiments were carried out in uncovered round translucent plastic vats (70 cm in height and 40 cm in diameter). Each vat was planted with 40 H. verticillata sprigs (10 ± 1 cm). Qingshan Lake sediment (total phosphorus: 1201.77 mg/kg, total nitrogen: 620.74 mg/kg, organic matter: 71.32 mg/kg) was used as the substrate, and the vat was slowly filled with lake water (mean water temperature: 25.24 °C, dissolved oxygen: 16.81 mg/L; specific conductance: 226.71 μS/cm; salinity: 0.34 psu; oxidation-reduction potential: 121.51_mV; hydrogen potential: 8.15) filtered of algae. The experimental harvesting intensities were 15%, 30%, 45%, 60%, and 75% of the plant height. A non-harvested group was maintained as the control group. Three parallel vats were set up for each treatment group, and a total of 18 plastic vats were used throughout the experiment (Figure 1).
The top branches of H. verticillata were planted to growth. When the coverage in the bucket reached 50%, the H. verticillata growth index was comprehensively assessed, and the H. verticillata was harvested by height according to the harvesting intensity. Any residual plant debris was removed after harvesting. Once the plant coverage in the vat returned to 50%, it recovered. The growth indices of H. verticillata were comprehensively assessed before the next harvesting; the number of H. verticillata winter buds was recorded at maturation and the biomass of H. verticillata was measured upon entering the dying stage. H. verticillata was harvested twice (6 August and 15 September 2018) and the relevant experimental data were recorded for analysis.

2.2. Determination of H. verticillata Growth Indices

Nine H. verticillata plants were selected from each vat, and their growth indices were determined separately. The initial plant height was measured before planting, and again every 5 d after harvesting. The number of branches was counted every 5 d. Finally, nine H. verticillata were randomly selected to count the number of winter buds. The number of dead plants was recorded every 10 days. The fresh and dry weights of H. verticillata were measured on 6 August, 15 September, and 16 December 2018.

2.3. Determination of Water Quality Indicators

The indicators included total nitrogen (TN), total phosphorus (TP), orthophosphate (PO43-P), the permanganate index (CODMn), chlorophyll a (Chl-a), colored dissolved organic matter (CDOM), and suspended solids (SS). Water quality was assessed before harvesting, and the indicators were measured again on day 30, 60, and 90 after harvest. The specific methods for determining the water quality indicators can be found in “Water and Wastewater Monitoring and Analysis Methods” (4th edition) (Table 1) [25].

2.4. Data Processing

The data were analyzed using SPSS 23.0 statistical software (SPSS Inc., Chicago, IL, USA). One-way analysis of variance (ANOVA) was performed to compare the groups. A p-value < 0.05 was considered significant, and p < 0.01 was considered extremely significantly different. The Shapiro-Wilk test and Levene’s test for normality and the chi-square hypothesis (p > 0.05) for the morphological and water quality data of H. verticillata were performed before the statistical analysis. If the assumptions of normality or the chi-square could not be met, the data were transformed and ANOVA was followed by Tukey’s multiple comparison test.

3. Results and Analysis

3.1. Changes in Growth Indicators

3.1.1. Branch Recovery and Biomass

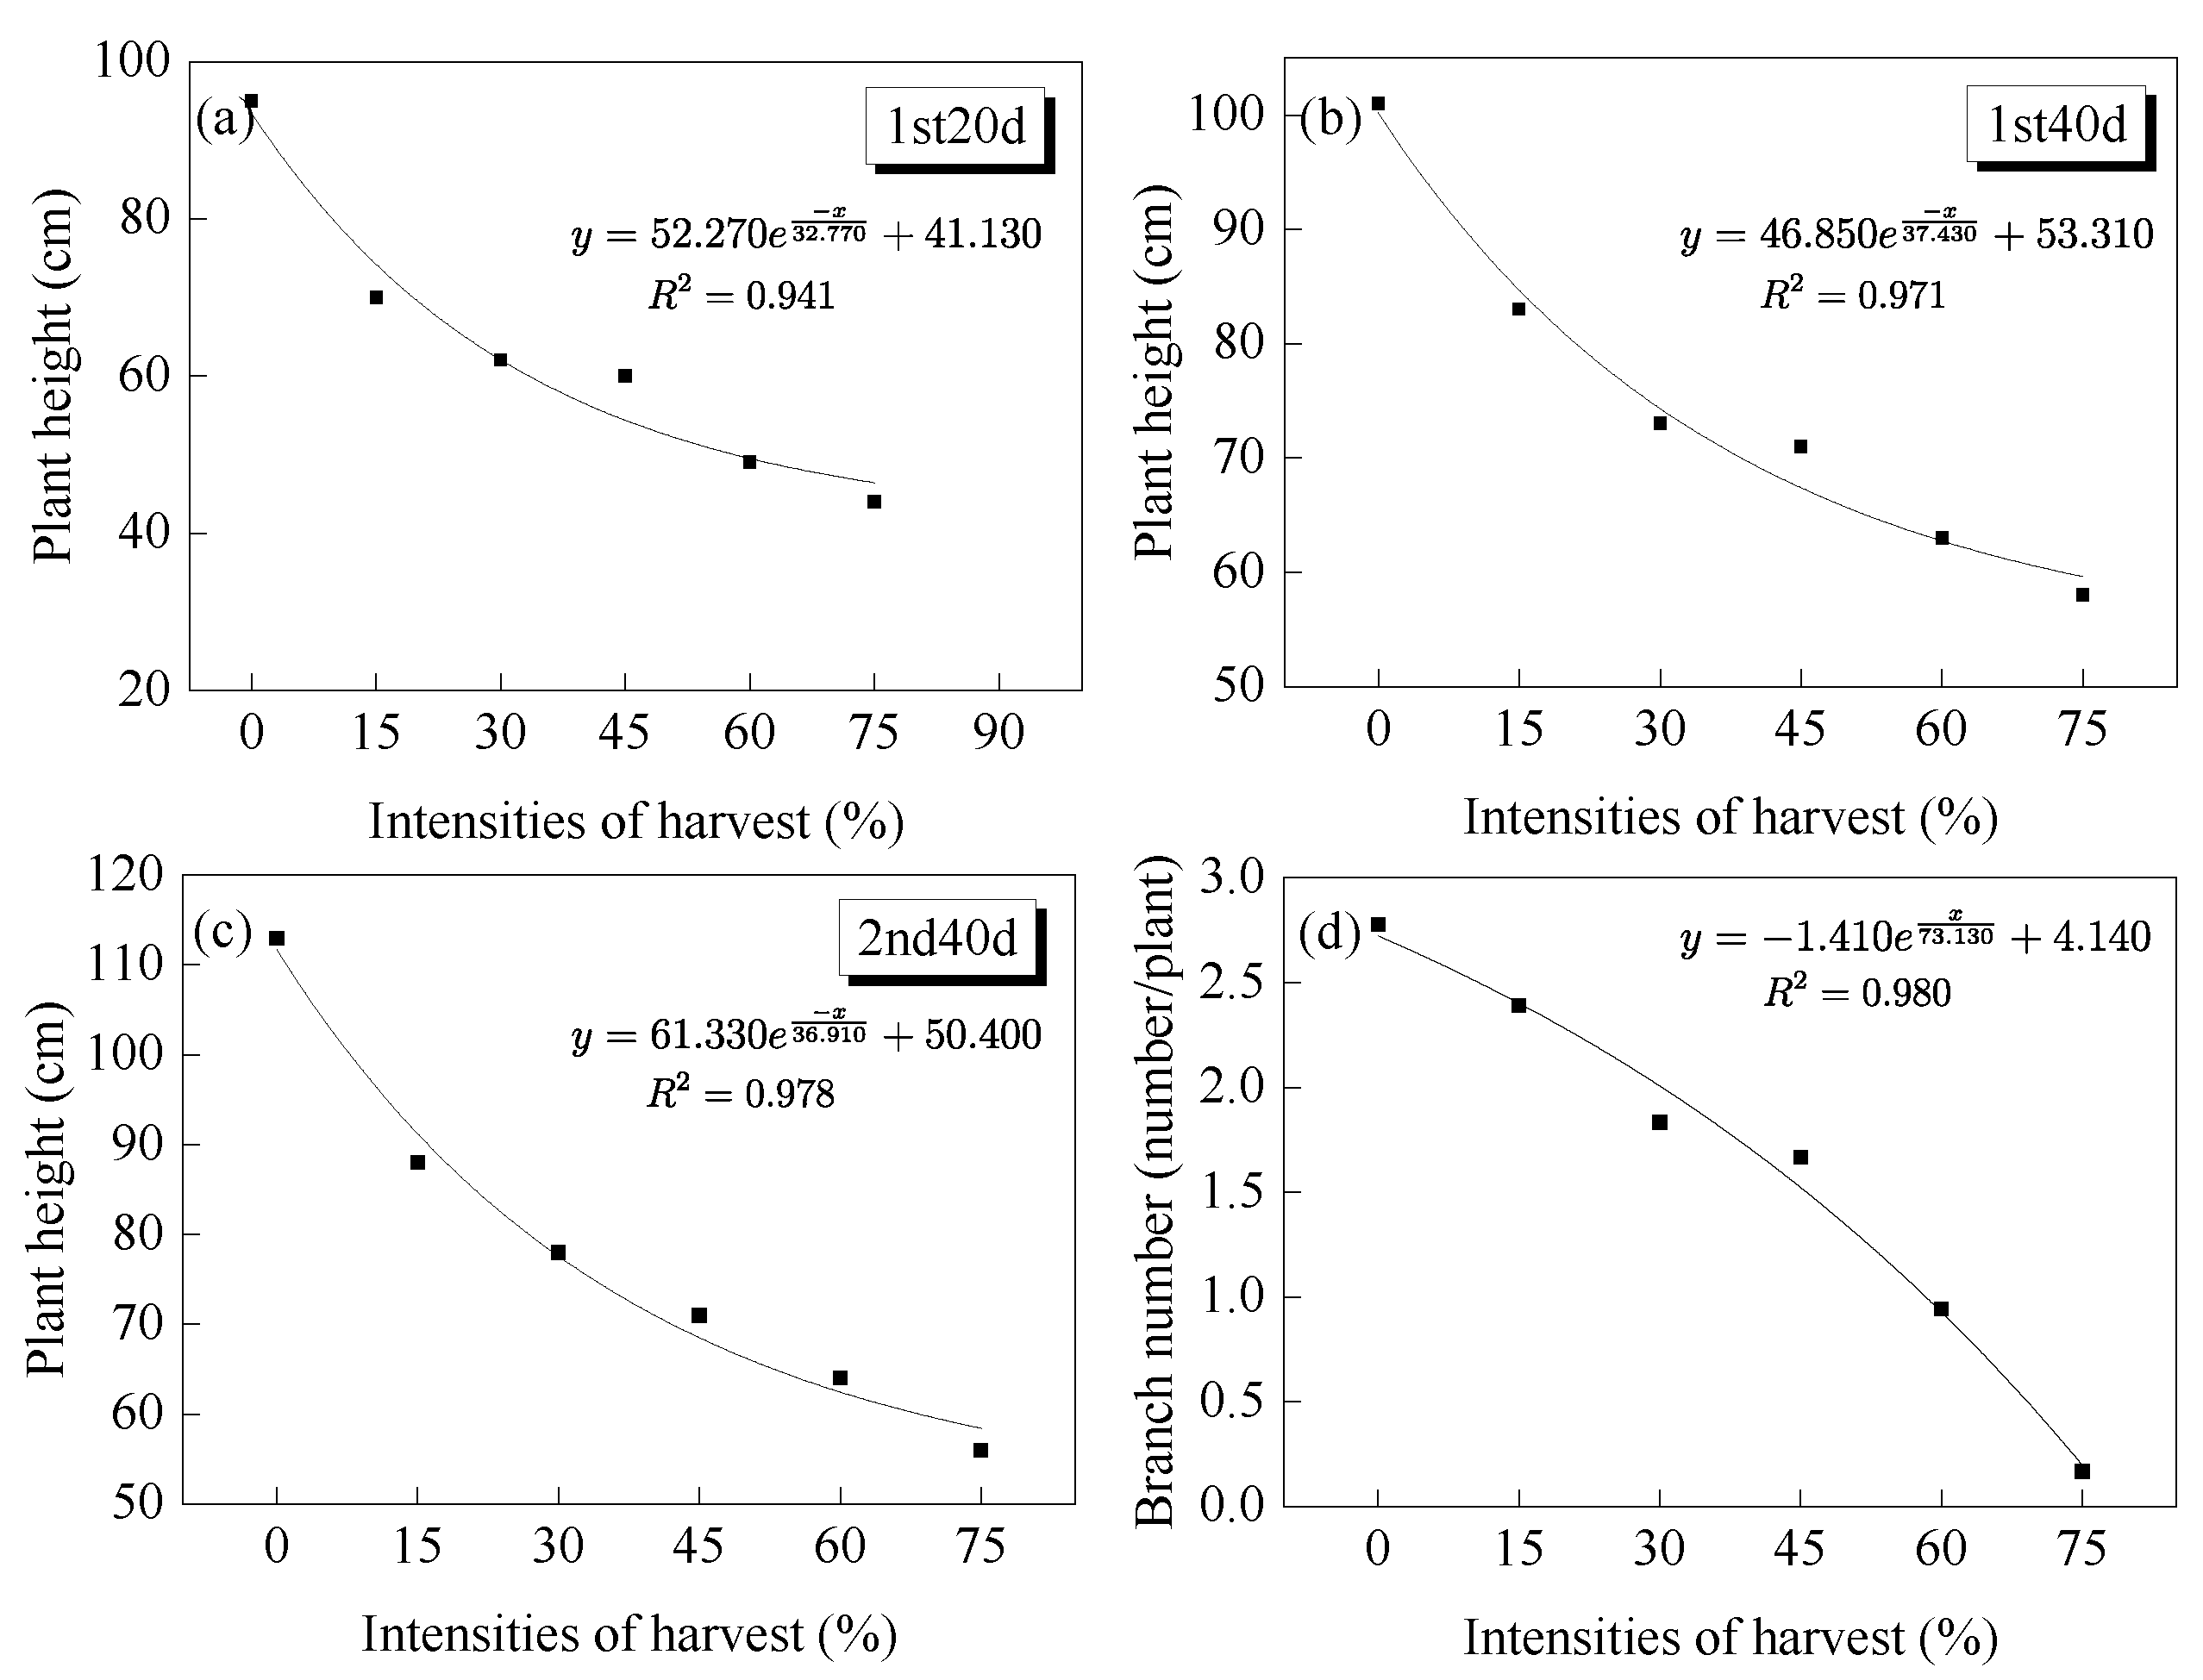
Harvesting compromised the growth of H. verticillata, with significant effects on biomass, plant height, and shoot recovery (Figure 2). The growth of H. verticillata branches was affected to different degrees at all harvesting intensities, and the main branches stopped growing, which led to the germination of new buds on side branches. On day 20 after the first harvest, the low-intensity group had recovered and exceeded its pre-harvest level, with recovery lengths of 19.85 cm and 20.70 cm, respectively, but no canopy had formed. The 45% intensity harvesting group displayed full branch recovery. However, branch recovery was significantly slower in the high-intensity harvesting group than in the medium and low-intensity harvesting groups, with recovery rates of 72% and 66% in the high-intensity harvesting group, respectively. On day 40 after the first harvest, the branches of the 15–60% harvesting groups had completely recovered to their pre-harvest levels, but the plant heights showed a decreasing trend with increasing harvesting intensity at 83, 73, 71, and 63 cm, respectively. The 75% harvesting group had a branch recovery rate of 97.74%. On day 40 after the second harvest, the final plant height of the control group was 113 cm, and a thick canopy had formed on the surface of the water. All H. verticillata branches in the 15% harvesting group had recovered to their pre-harvesting state, and plant height reached 88 cm, which was significantly different from the control group (p < 0.05), but no canopy had formed on the water surface. The recovery rate of the branches in the 30%, 45%, and 60% harvesting groups was 100%, but the plant heights decreased sequentially according to harvesting intensity and were 78, 71, and 64 cm, respectively. Notably, the recovery rate of branches in the 75% harvesting group was only 96.55% and plant height was 56 cm.
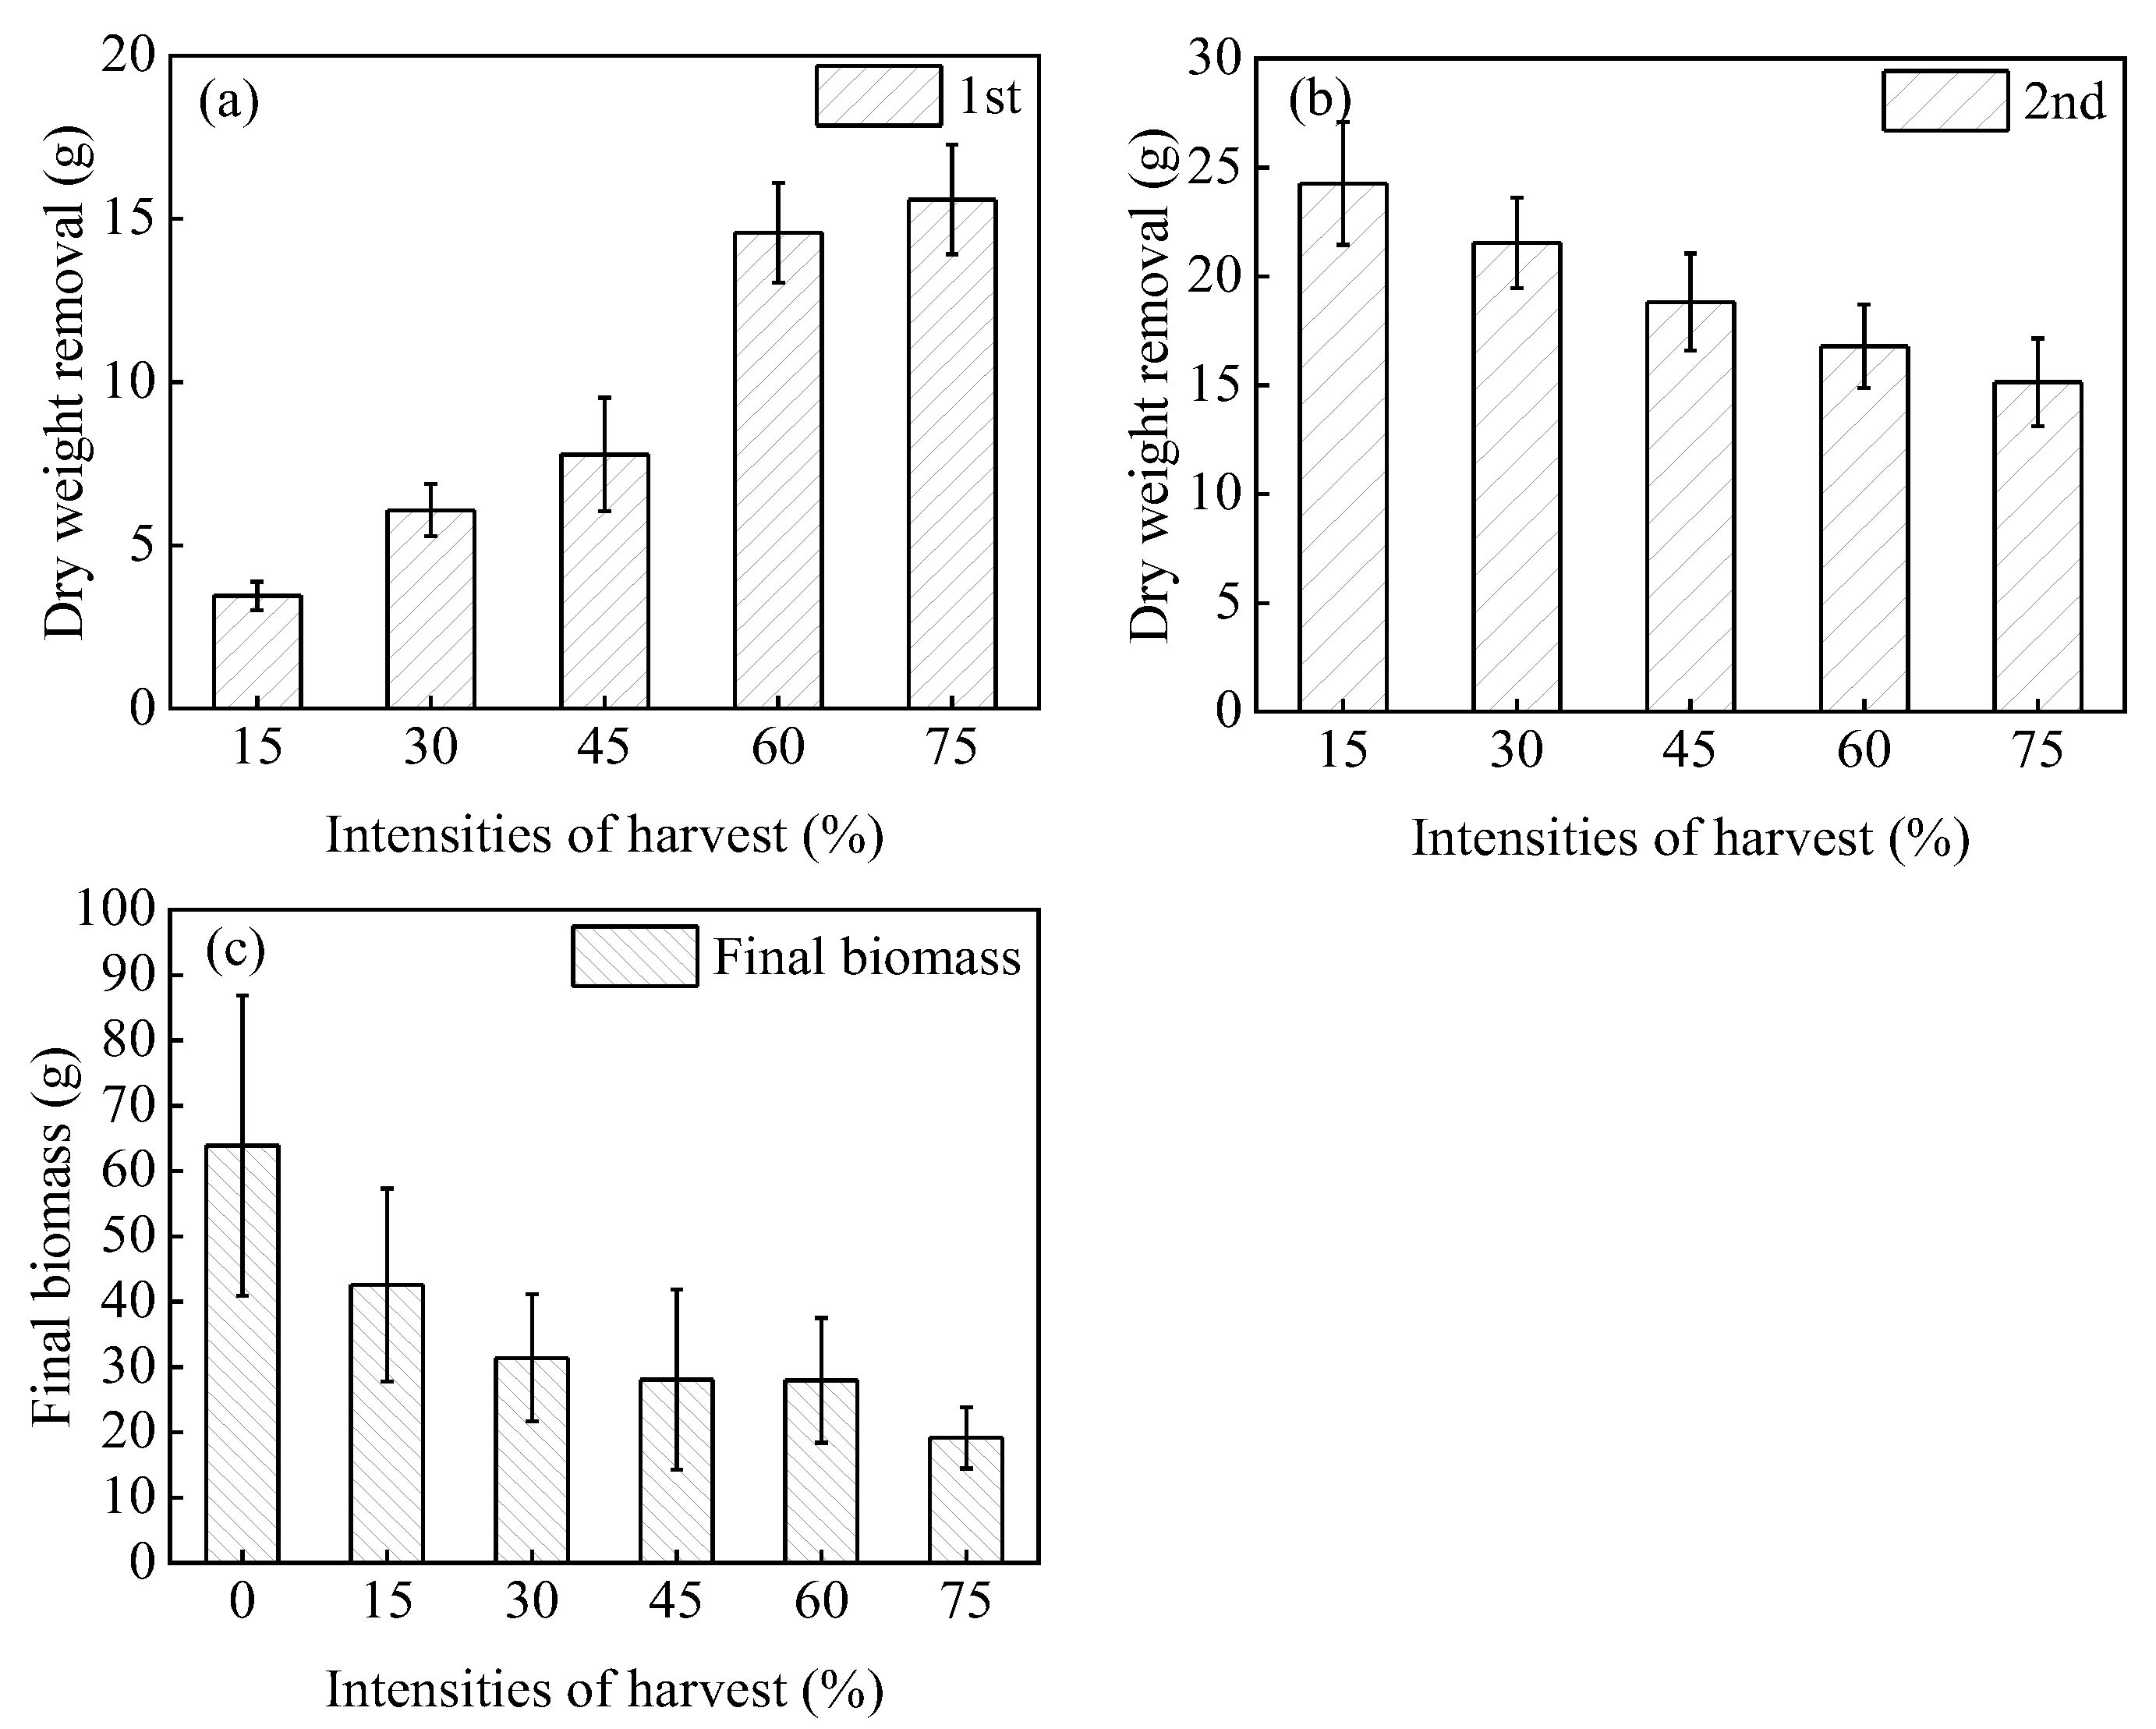
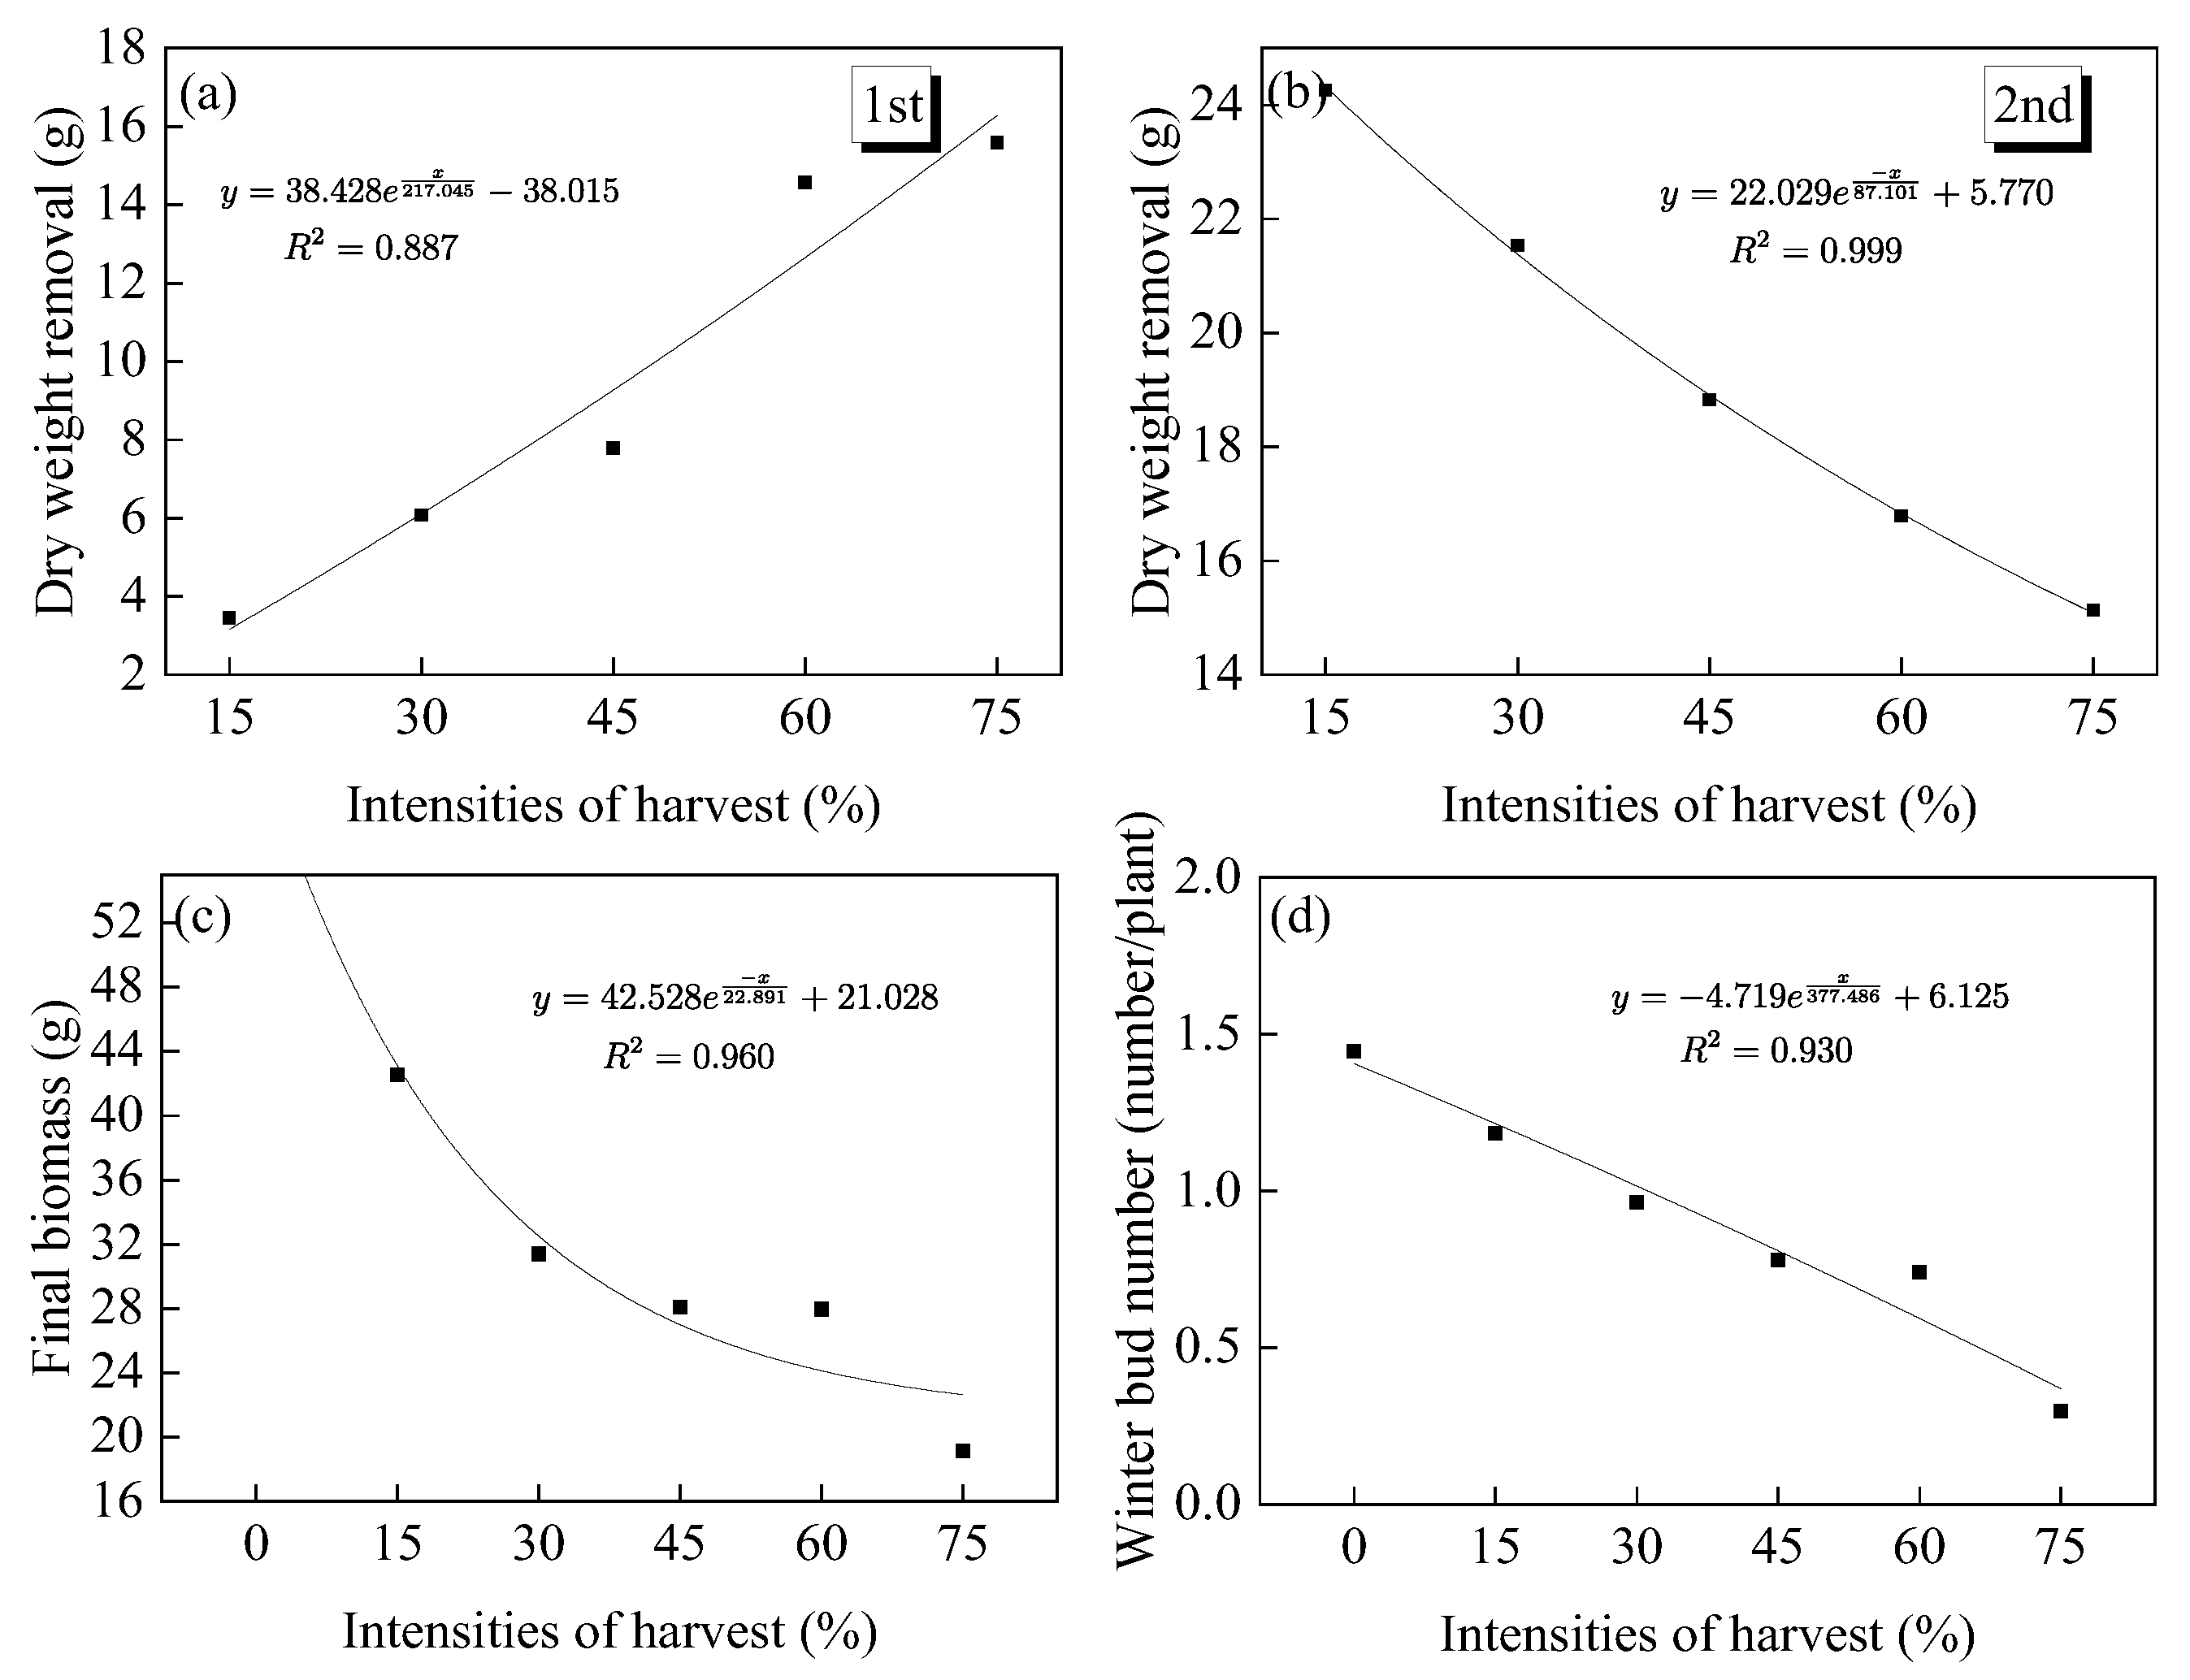
Significant differences were observed in the biomasses of the harvested groups and control group (p < 0.05) (Figure 3). By the end of the second harvest, the biomass (dry weight) of the 15% harvesting group had increased to 7.03 times its initial weight, while the biomasses of the 30–75% harvesting groups were significantly lower at only 3.54, 2.42, 1.15, and 0.97 times their initial weights, respectively. The increased biomasses in the harvesting groups were significantly less than that in the control group. The final H. verticillata biomass decreased significantly with increasing harvesting intensity, and the final biomass in the control group was the largest. The final biomasses of the 15–75% harvesting groups were 66.61%, 49.13%, 43.95%, 43.77%, and 29.94%of the control group, respectively.

3.1.2. Number of Branches

The number of H. verticillata branches differed under the different harvesting intensities (Figure 4). The number of branches in the control group was the highest, reaching 2.78 per plant, while the numbers of branches in the 15–75% harvesting groups were 2.39, 1.83, 1.67, 0.94, and 0.17 per plant, respectively. The greater the harvesting intensity, the fewer main stems remained and the fewer new buds sprouted, resulting in a decrease in the number of branch buds. Furthermore, re-germinated H. verticillata from the roots grew at a slow rate.

3.1.3. Number of Winter Buds

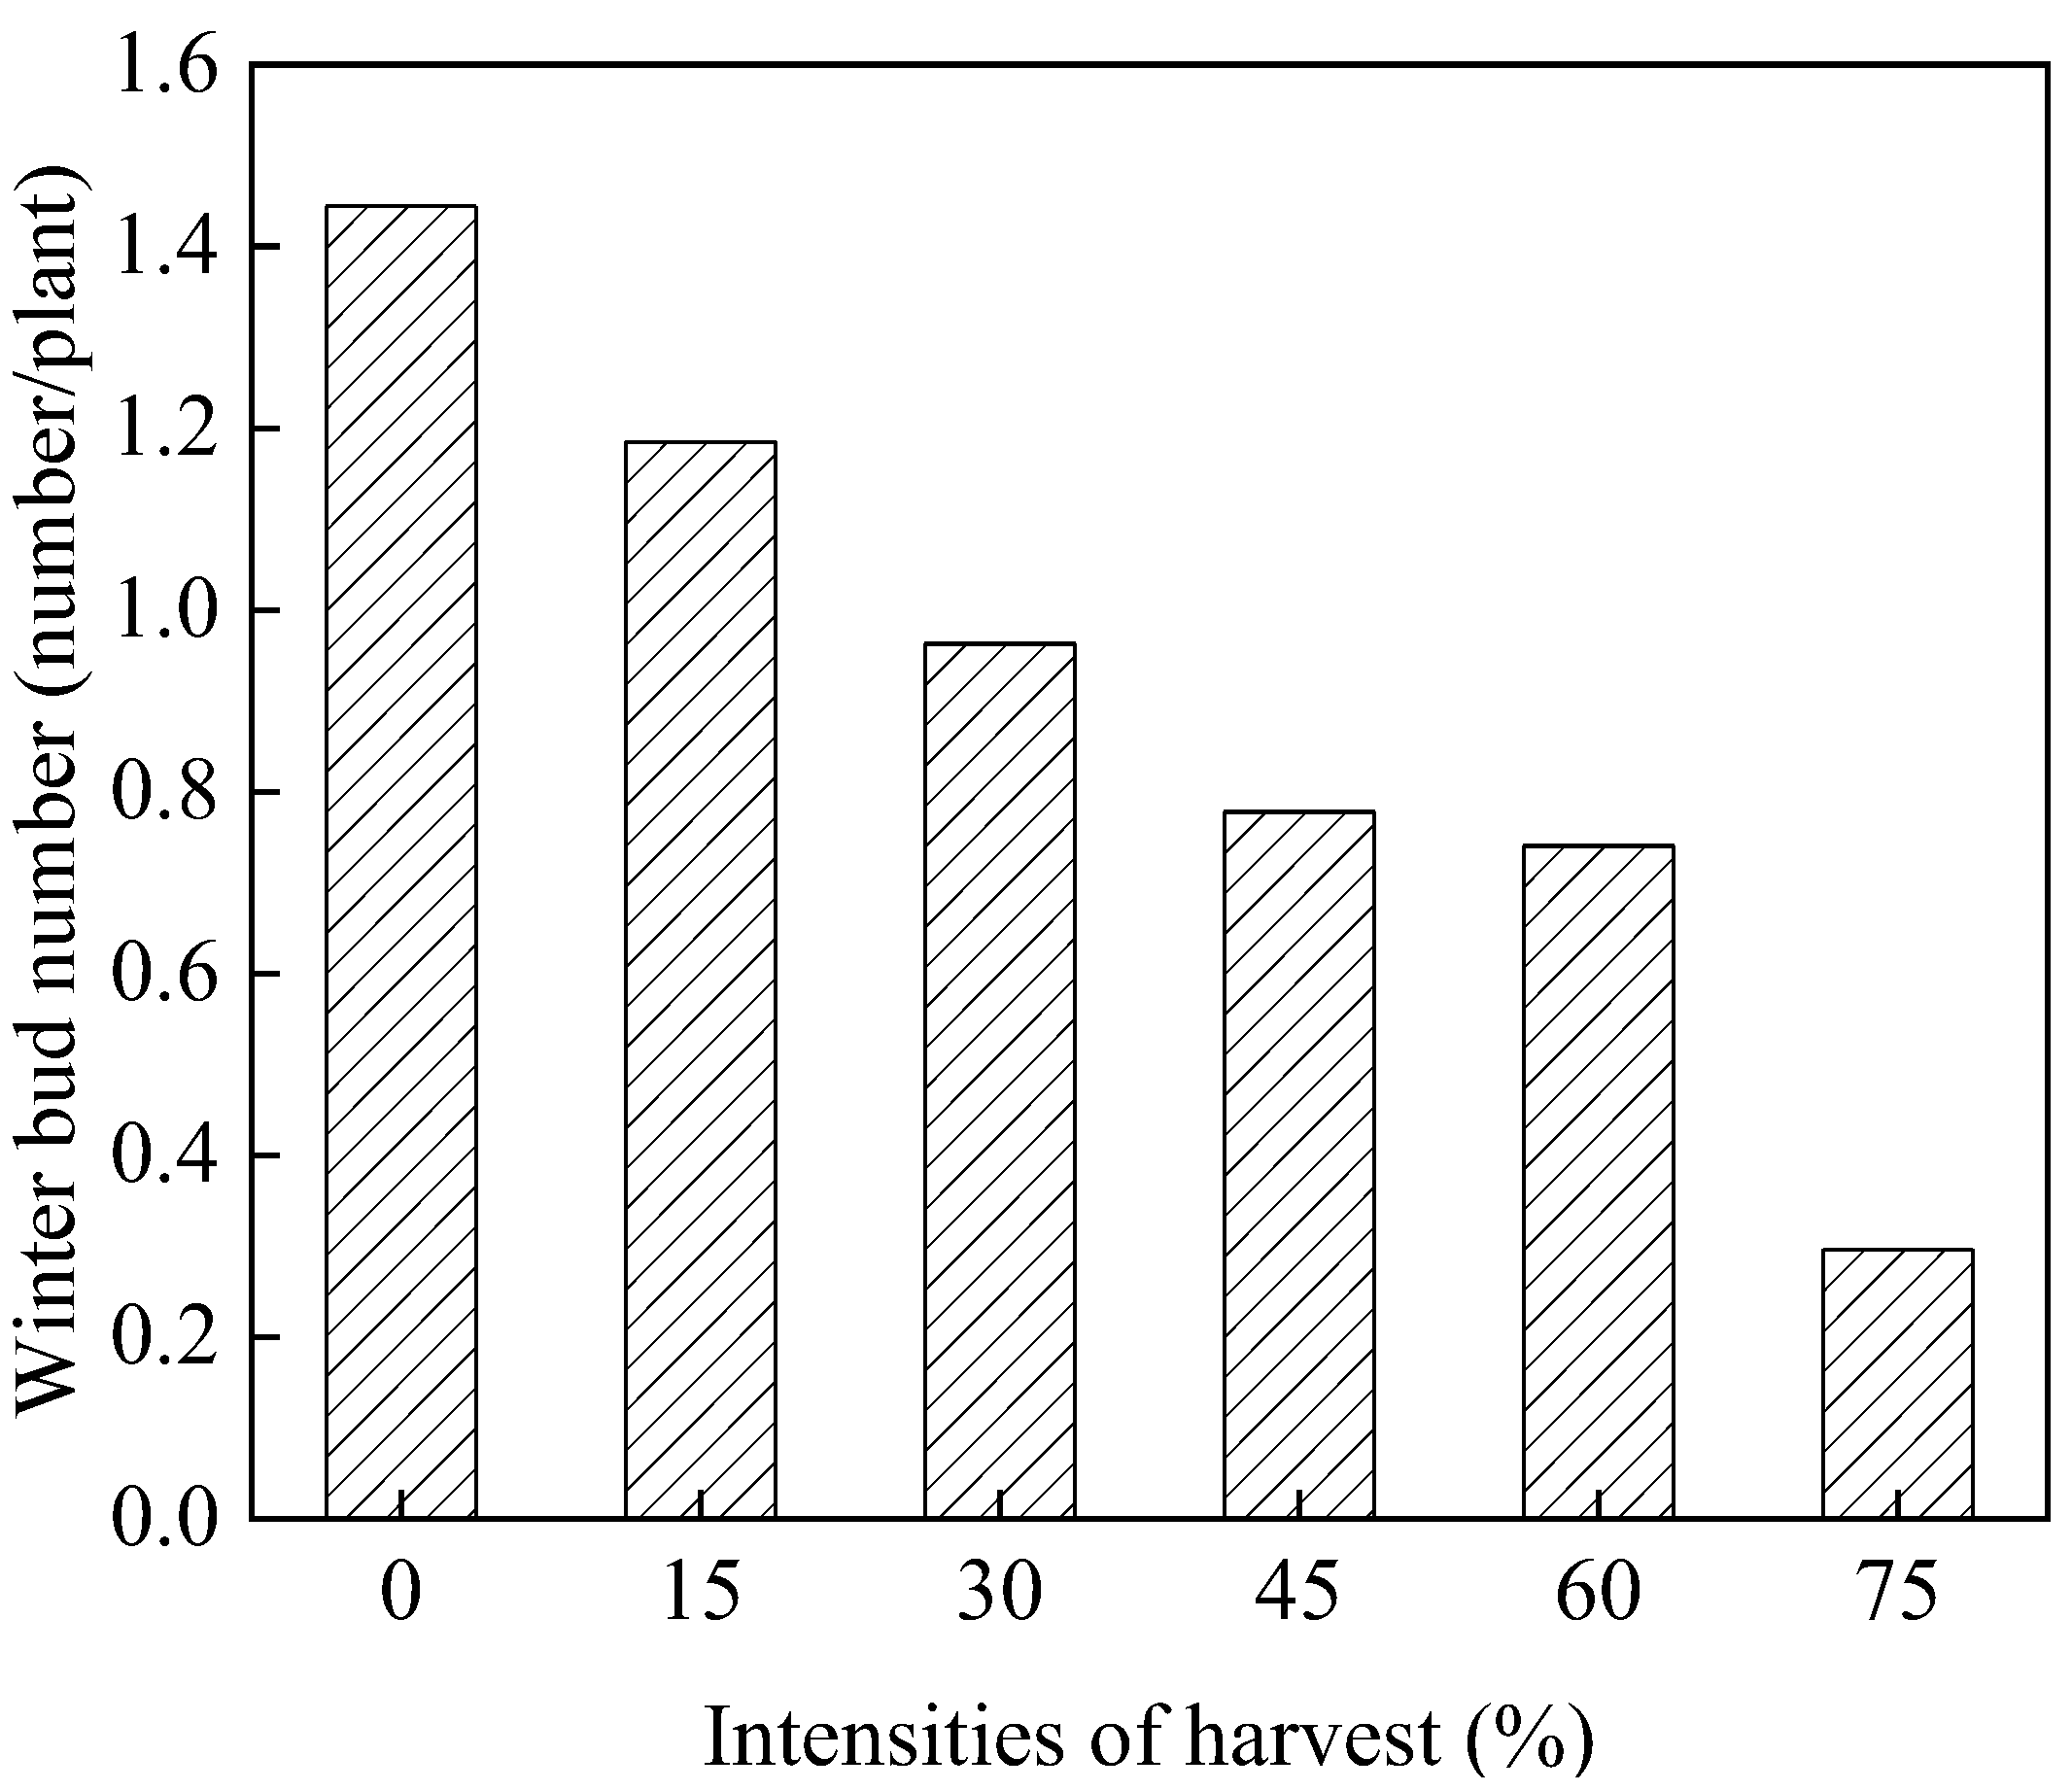
Harvesting affected the number of H. verticillata winter buds (Figure 5). By the end of the experiment, the control group had the largest number of winter buds at 1.44 per plant; while the 15–75% harvesting groups had 1.19, 0.96, 0.78, 0.74, and 0.30 per plant, respectively. The number of H. verticillata winter buds decreased significantly with increasing harvesting intensity, and the number of winter buds in the 75% harvested group was the lowest.

3.2. Changes in the Suspended Solids in Water

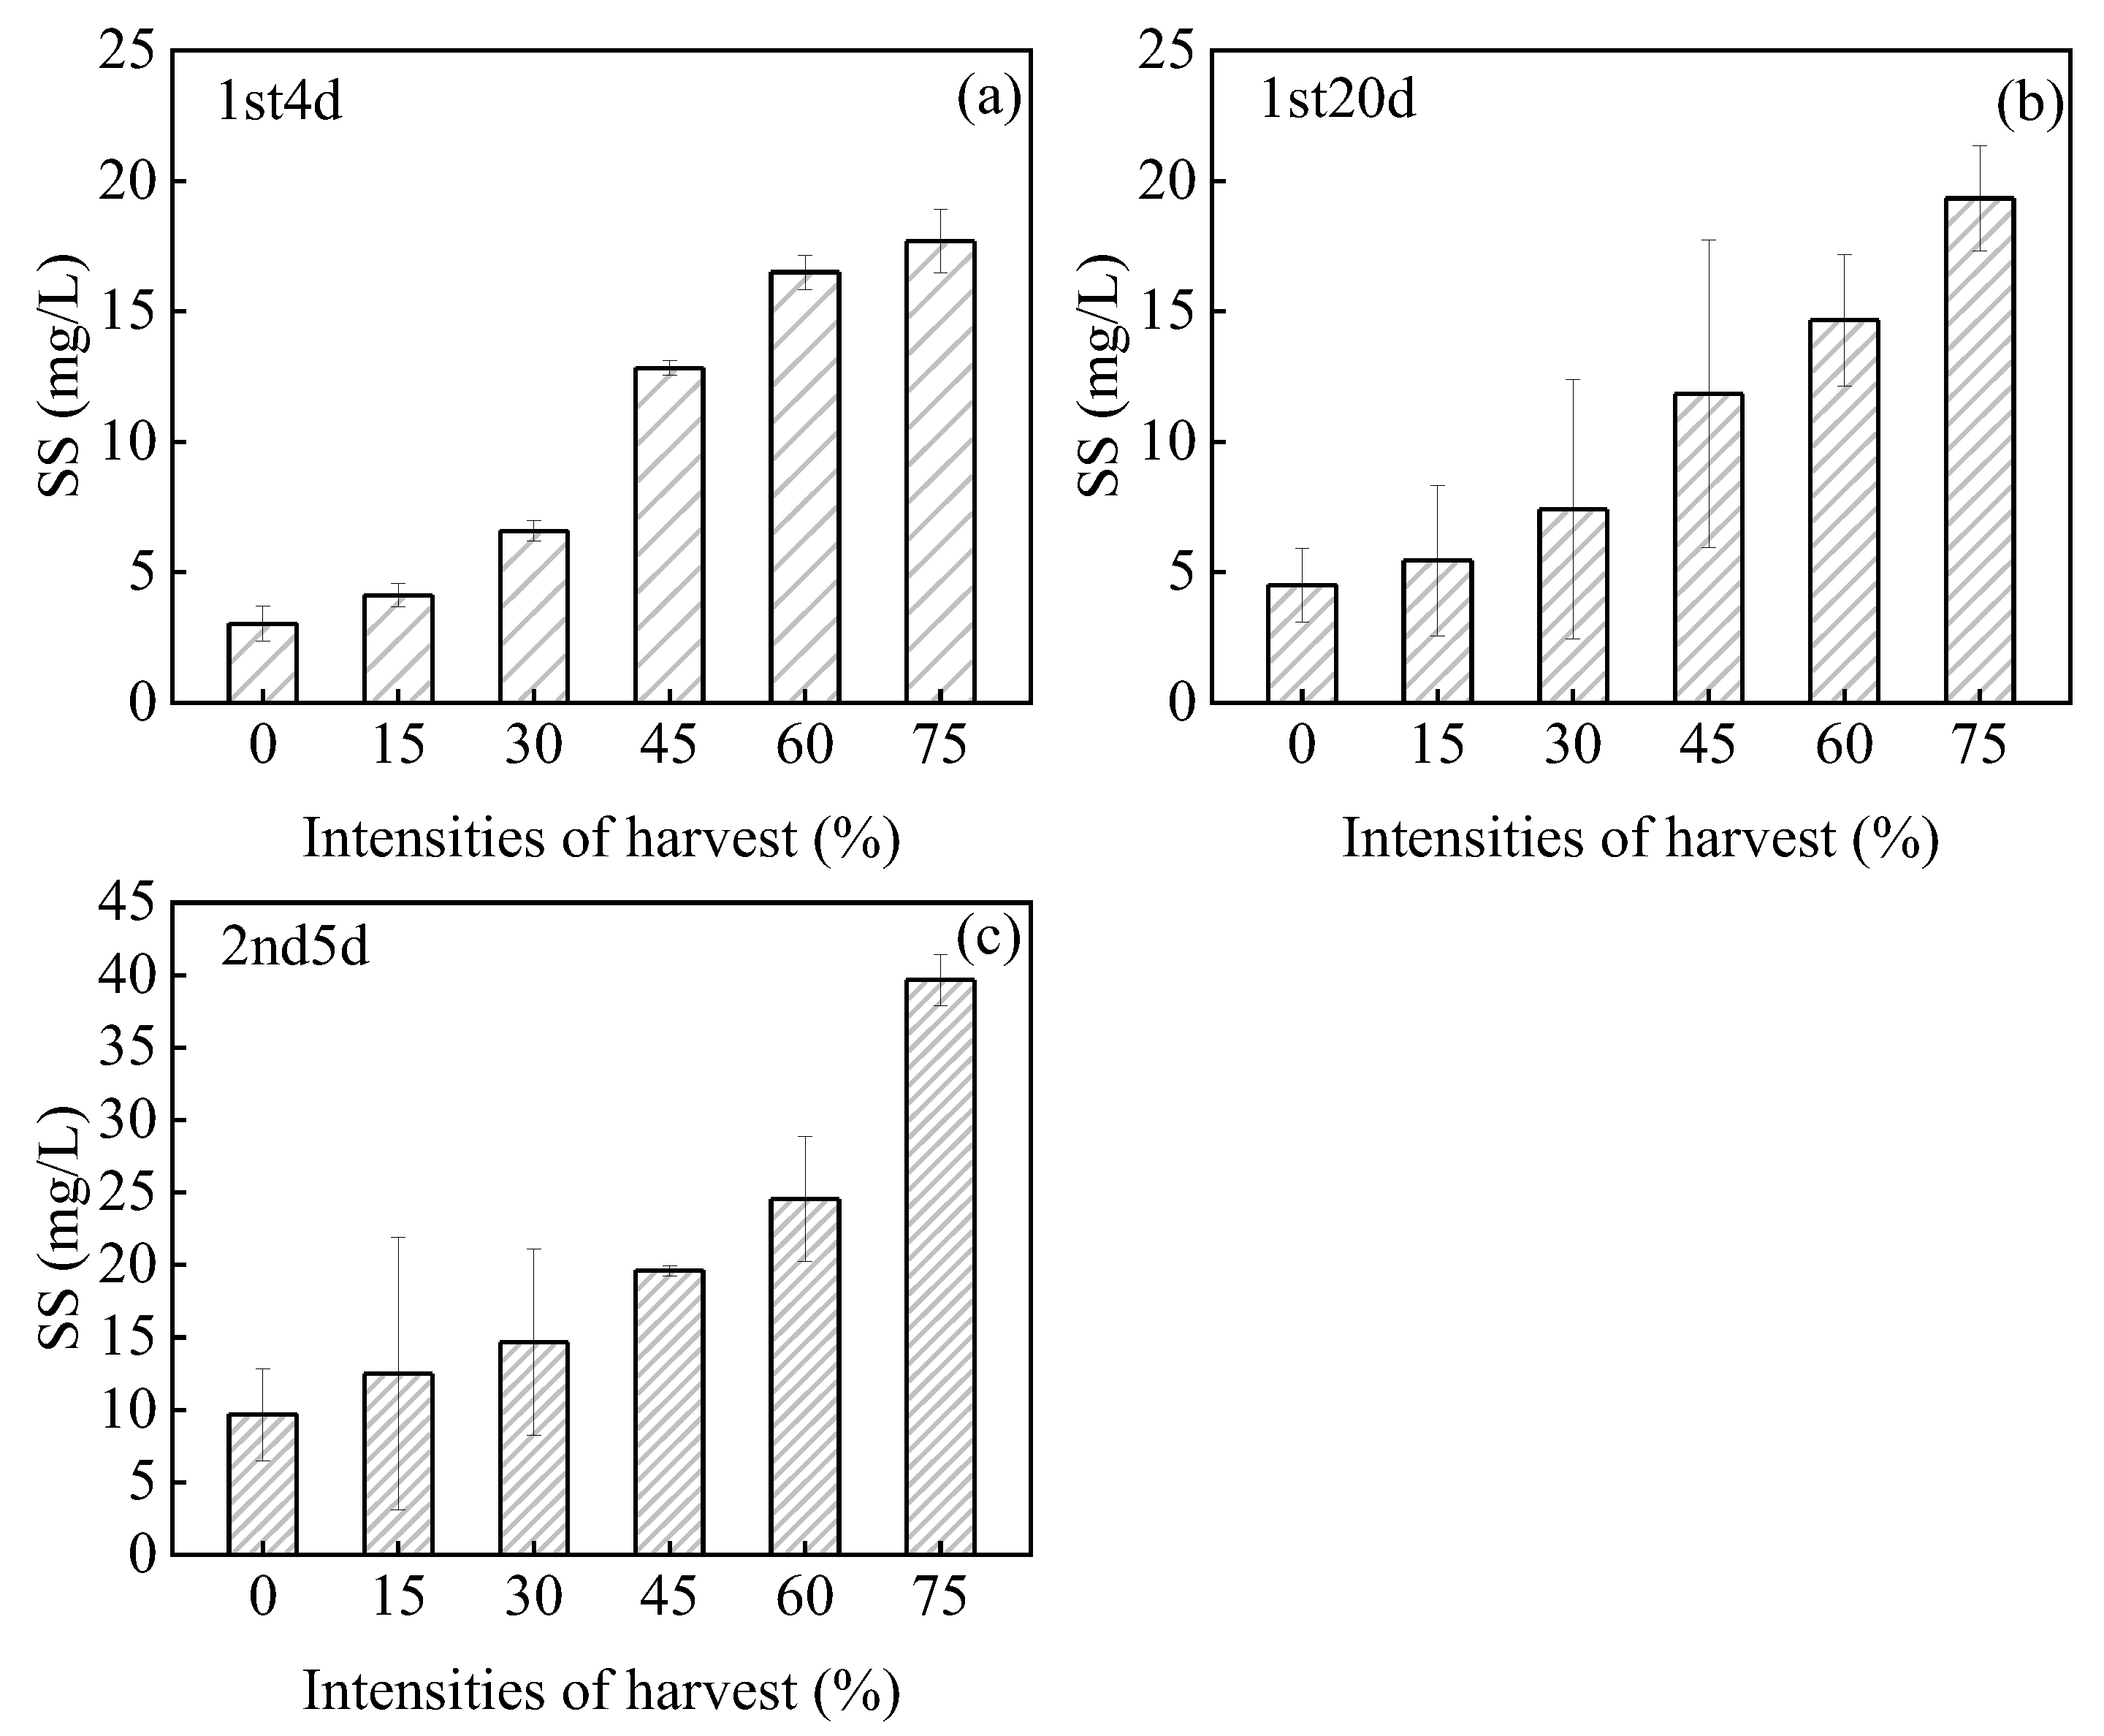
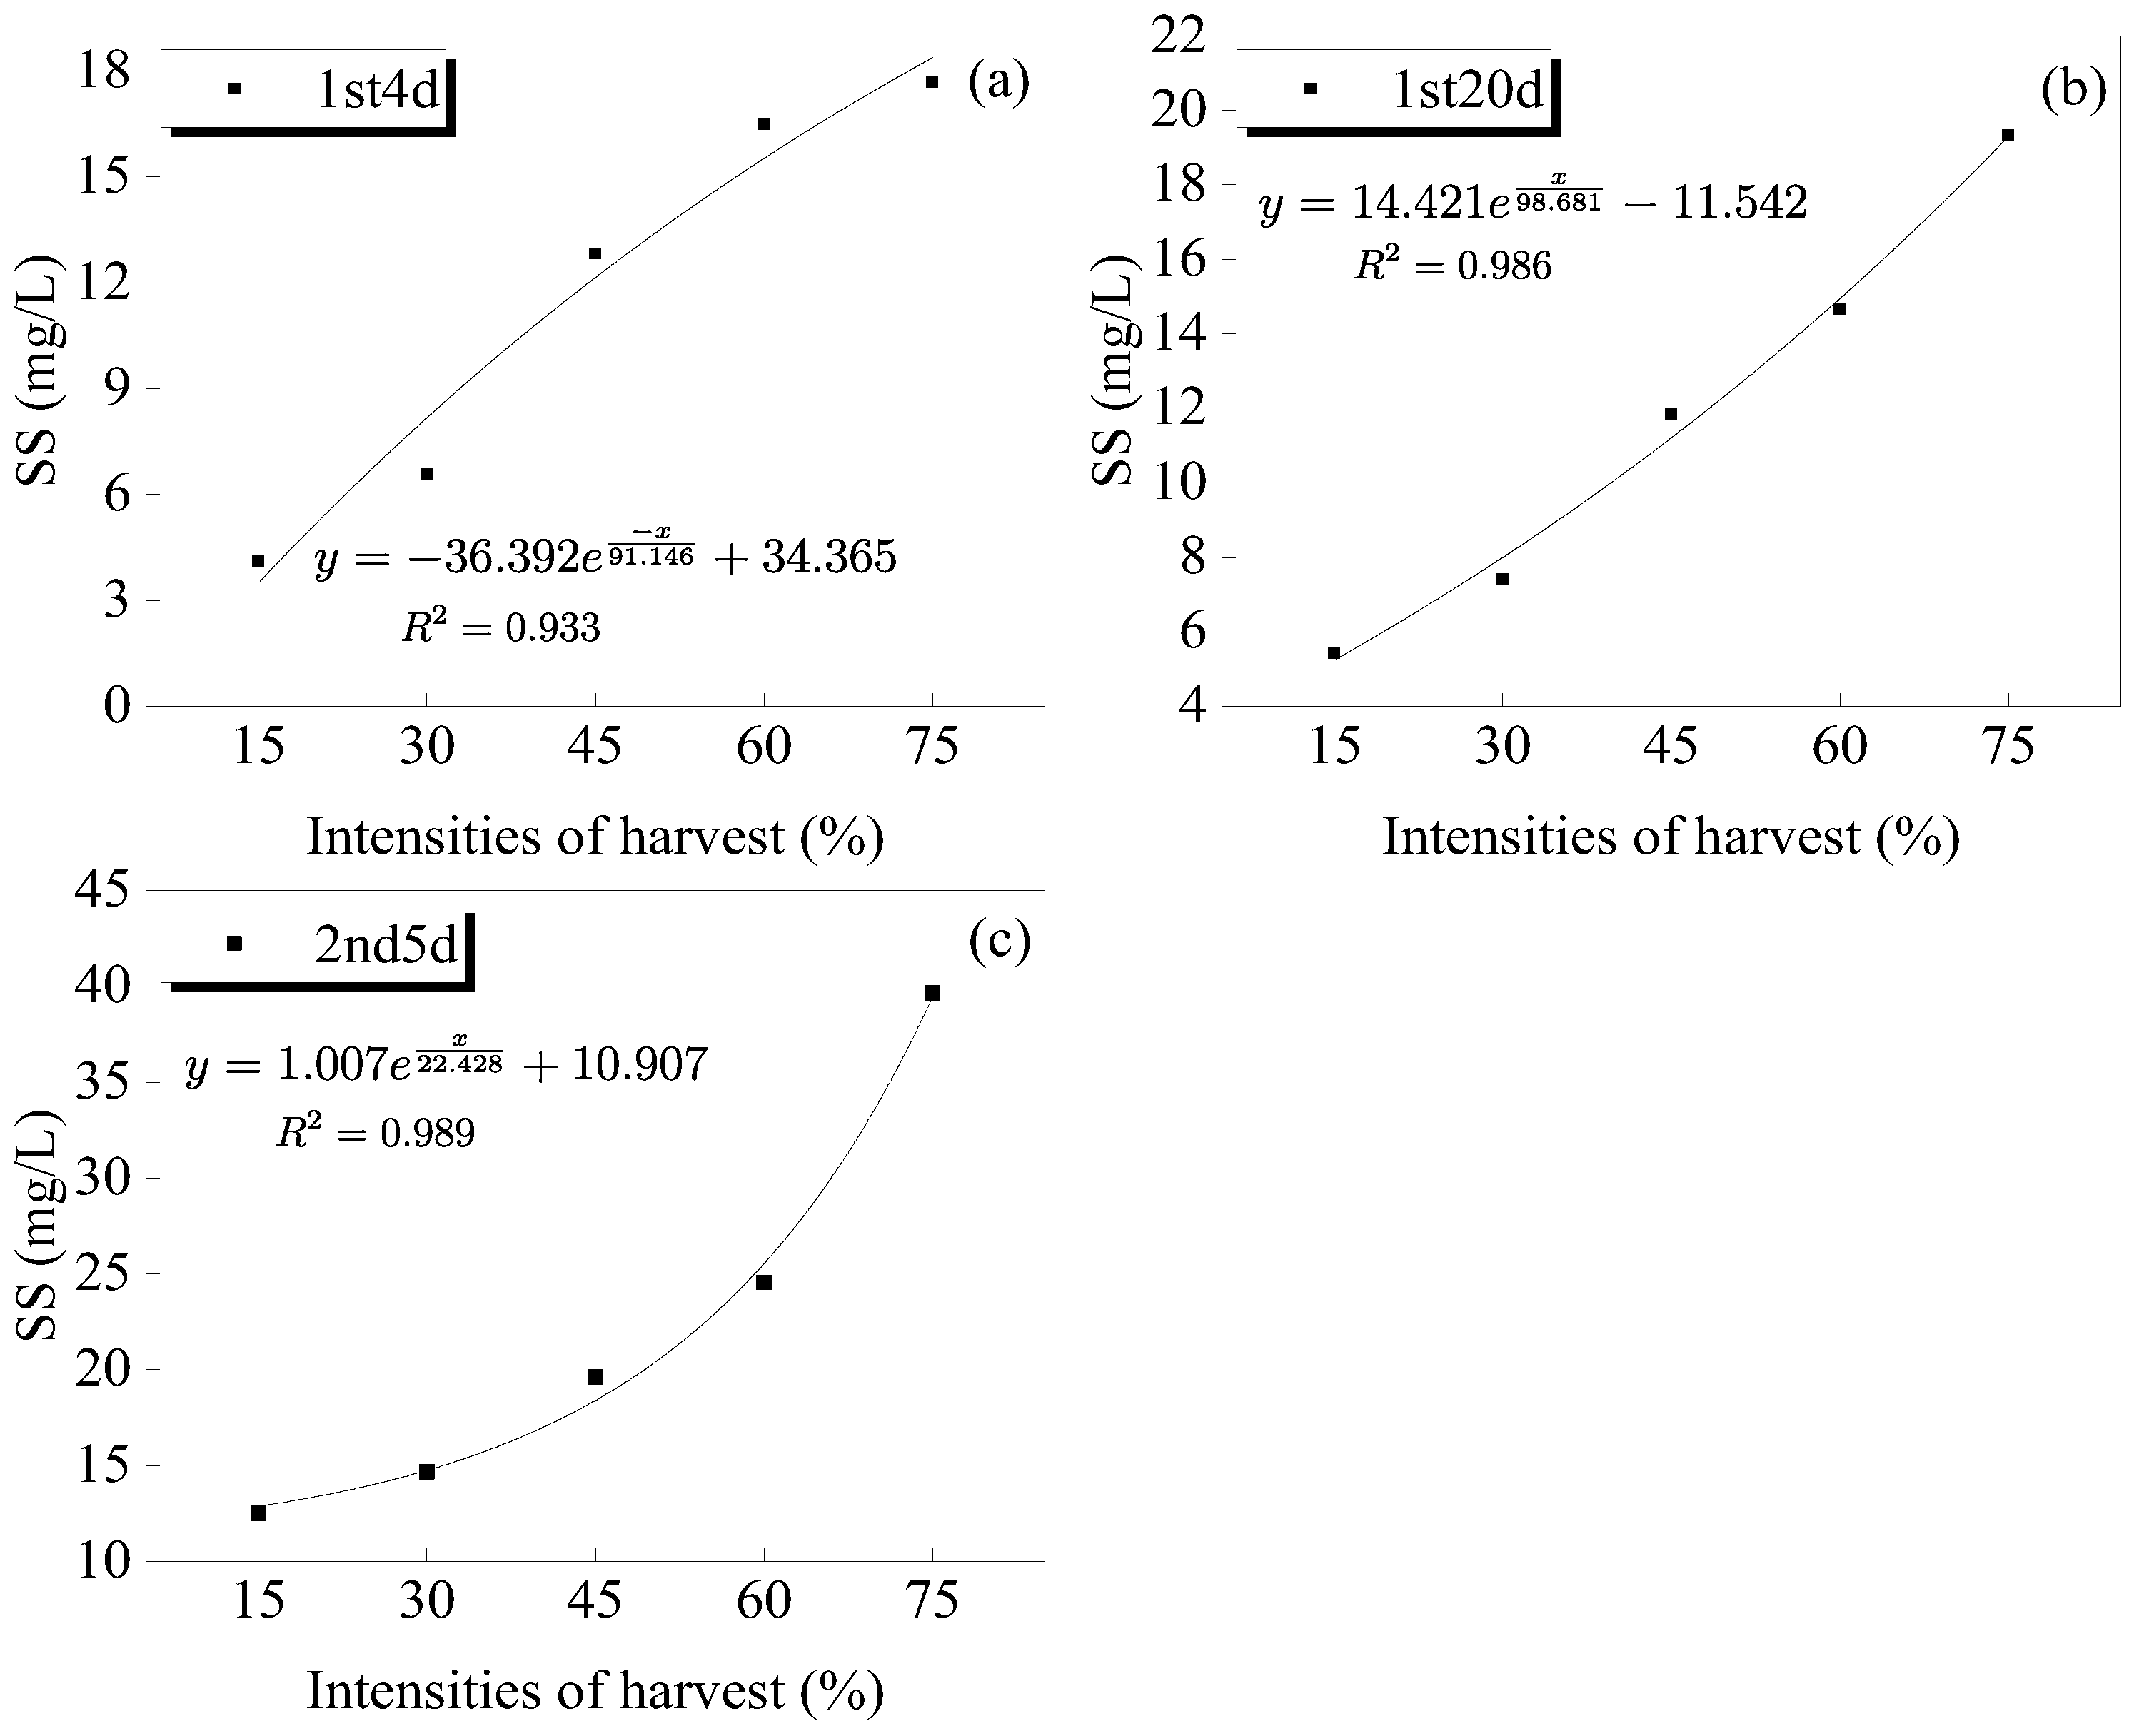
Harvesting H. verticillata had a significant effect on SS (Figure 6). Significantly fewer SS were detected in the control group than in the harvesting groups, and the greater the harvesting intensity, the greater the increase in SS. The SS concentration changed significantly during harvesting. The SS concentrations in the medium and high-intensity harvesting groups were higher than that in the low-intensity group, and the SS concentration in the harvesting groups increased with time after harvesting. The SS concentration increased significantly with the increase in the number of harvests over time. The increases in SS concentrations in the harvesting groups from the second harvest until the end of the experiment were significantly higher than those after the first harvest; the SS concentration in the high-intensity harvesting group was always higher than that of the low-intensity harvesting group; the SS concentration in the low-intensity harvesting group tended to decrease after harvesting.

3.3. Changes in the Water Nutrients

3.3.1. Total Nitrogen

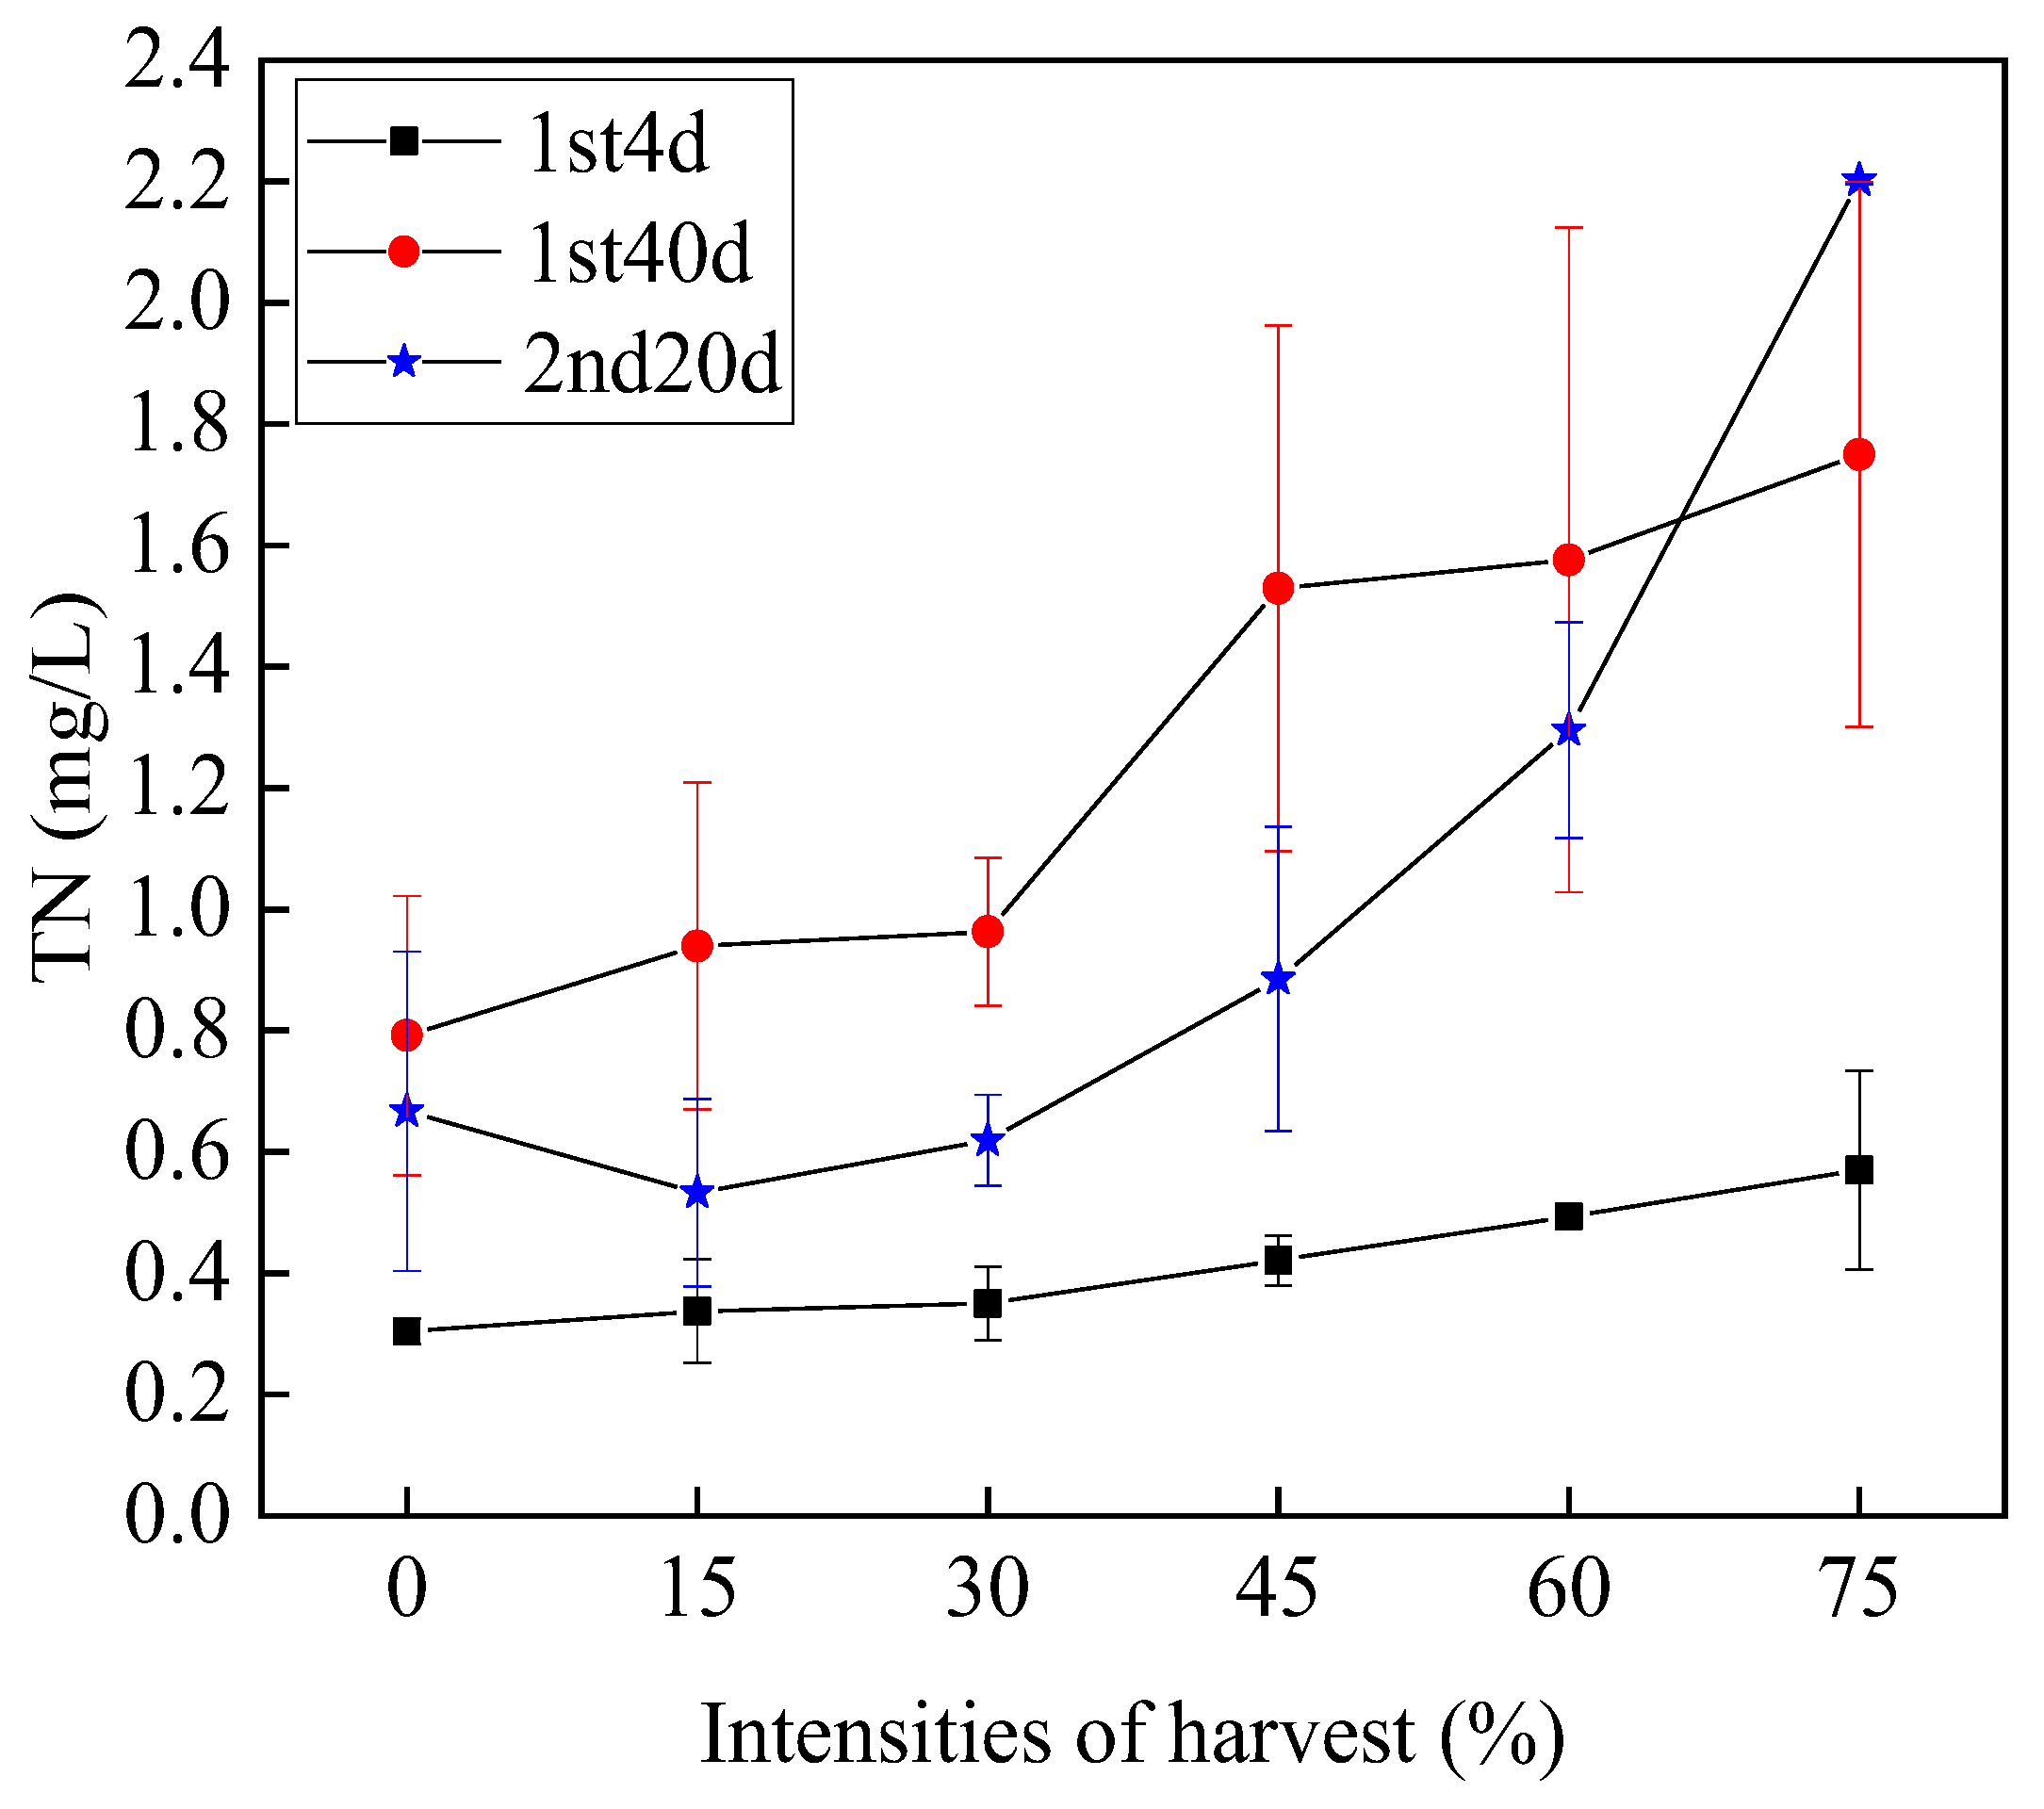
The different harvesting intensities had significant effects on the TN concentration (Figure 7). TN remained low in the control group and was lower than that in the harvesting groups throughout the experiment. The low-harvesting intensity groups (15% and 30%) had the lowest TN concentrations, and the medium and high-intensity harvesting groups (>45%) had significantly higher TN concentrations than the low-intensity harvest groups. After harvesting, the TN concentrations in the medium and low-intensity harvesting groups decreased slightly for some time. These results show that the higher the harvesting intensity, the higher the TN concentration, and the high-intensity harvesting group maintained the highest TN concentration.
On day 4 after the first harvest, the TN concentrations in the low-intensity harvesting groups were 0.34 and 0.35 mg/L, and the TN concentrations in the medium and high-intensity harvesting groups were 0.42, 0.49, and 0.57 mg/L, respectively. On day 40 after harvesting, the TN concentrations in all harvesting groups were significantly higher than those on day 4 after harvesting. The concentrations in the low-intensity harvesting groups were 0.94 and 0.96 mg/L, which were 2.7 times their initial concentrations, while the TN concentrations in the medium and high-intensity harvesting groups were 1.53, 1.58, and 1.75 mg/L, which increased by 3.6, 3.2 and 3.1 times, respectively. On day 20 after the second harvest, the TN concentrations in the medium and low-intensity harvesting groups were lower than the pre-harvest levels, with concentrations of 0.53, 0.62, and 0.89 mg/L, respectively, while the TN concentrations in the 60% and 75% intensity harvesting group were 1.30 and, 2.20 mg/L respectively, which was the highest of all of the groups.

3.3.2. Total Phosphorus

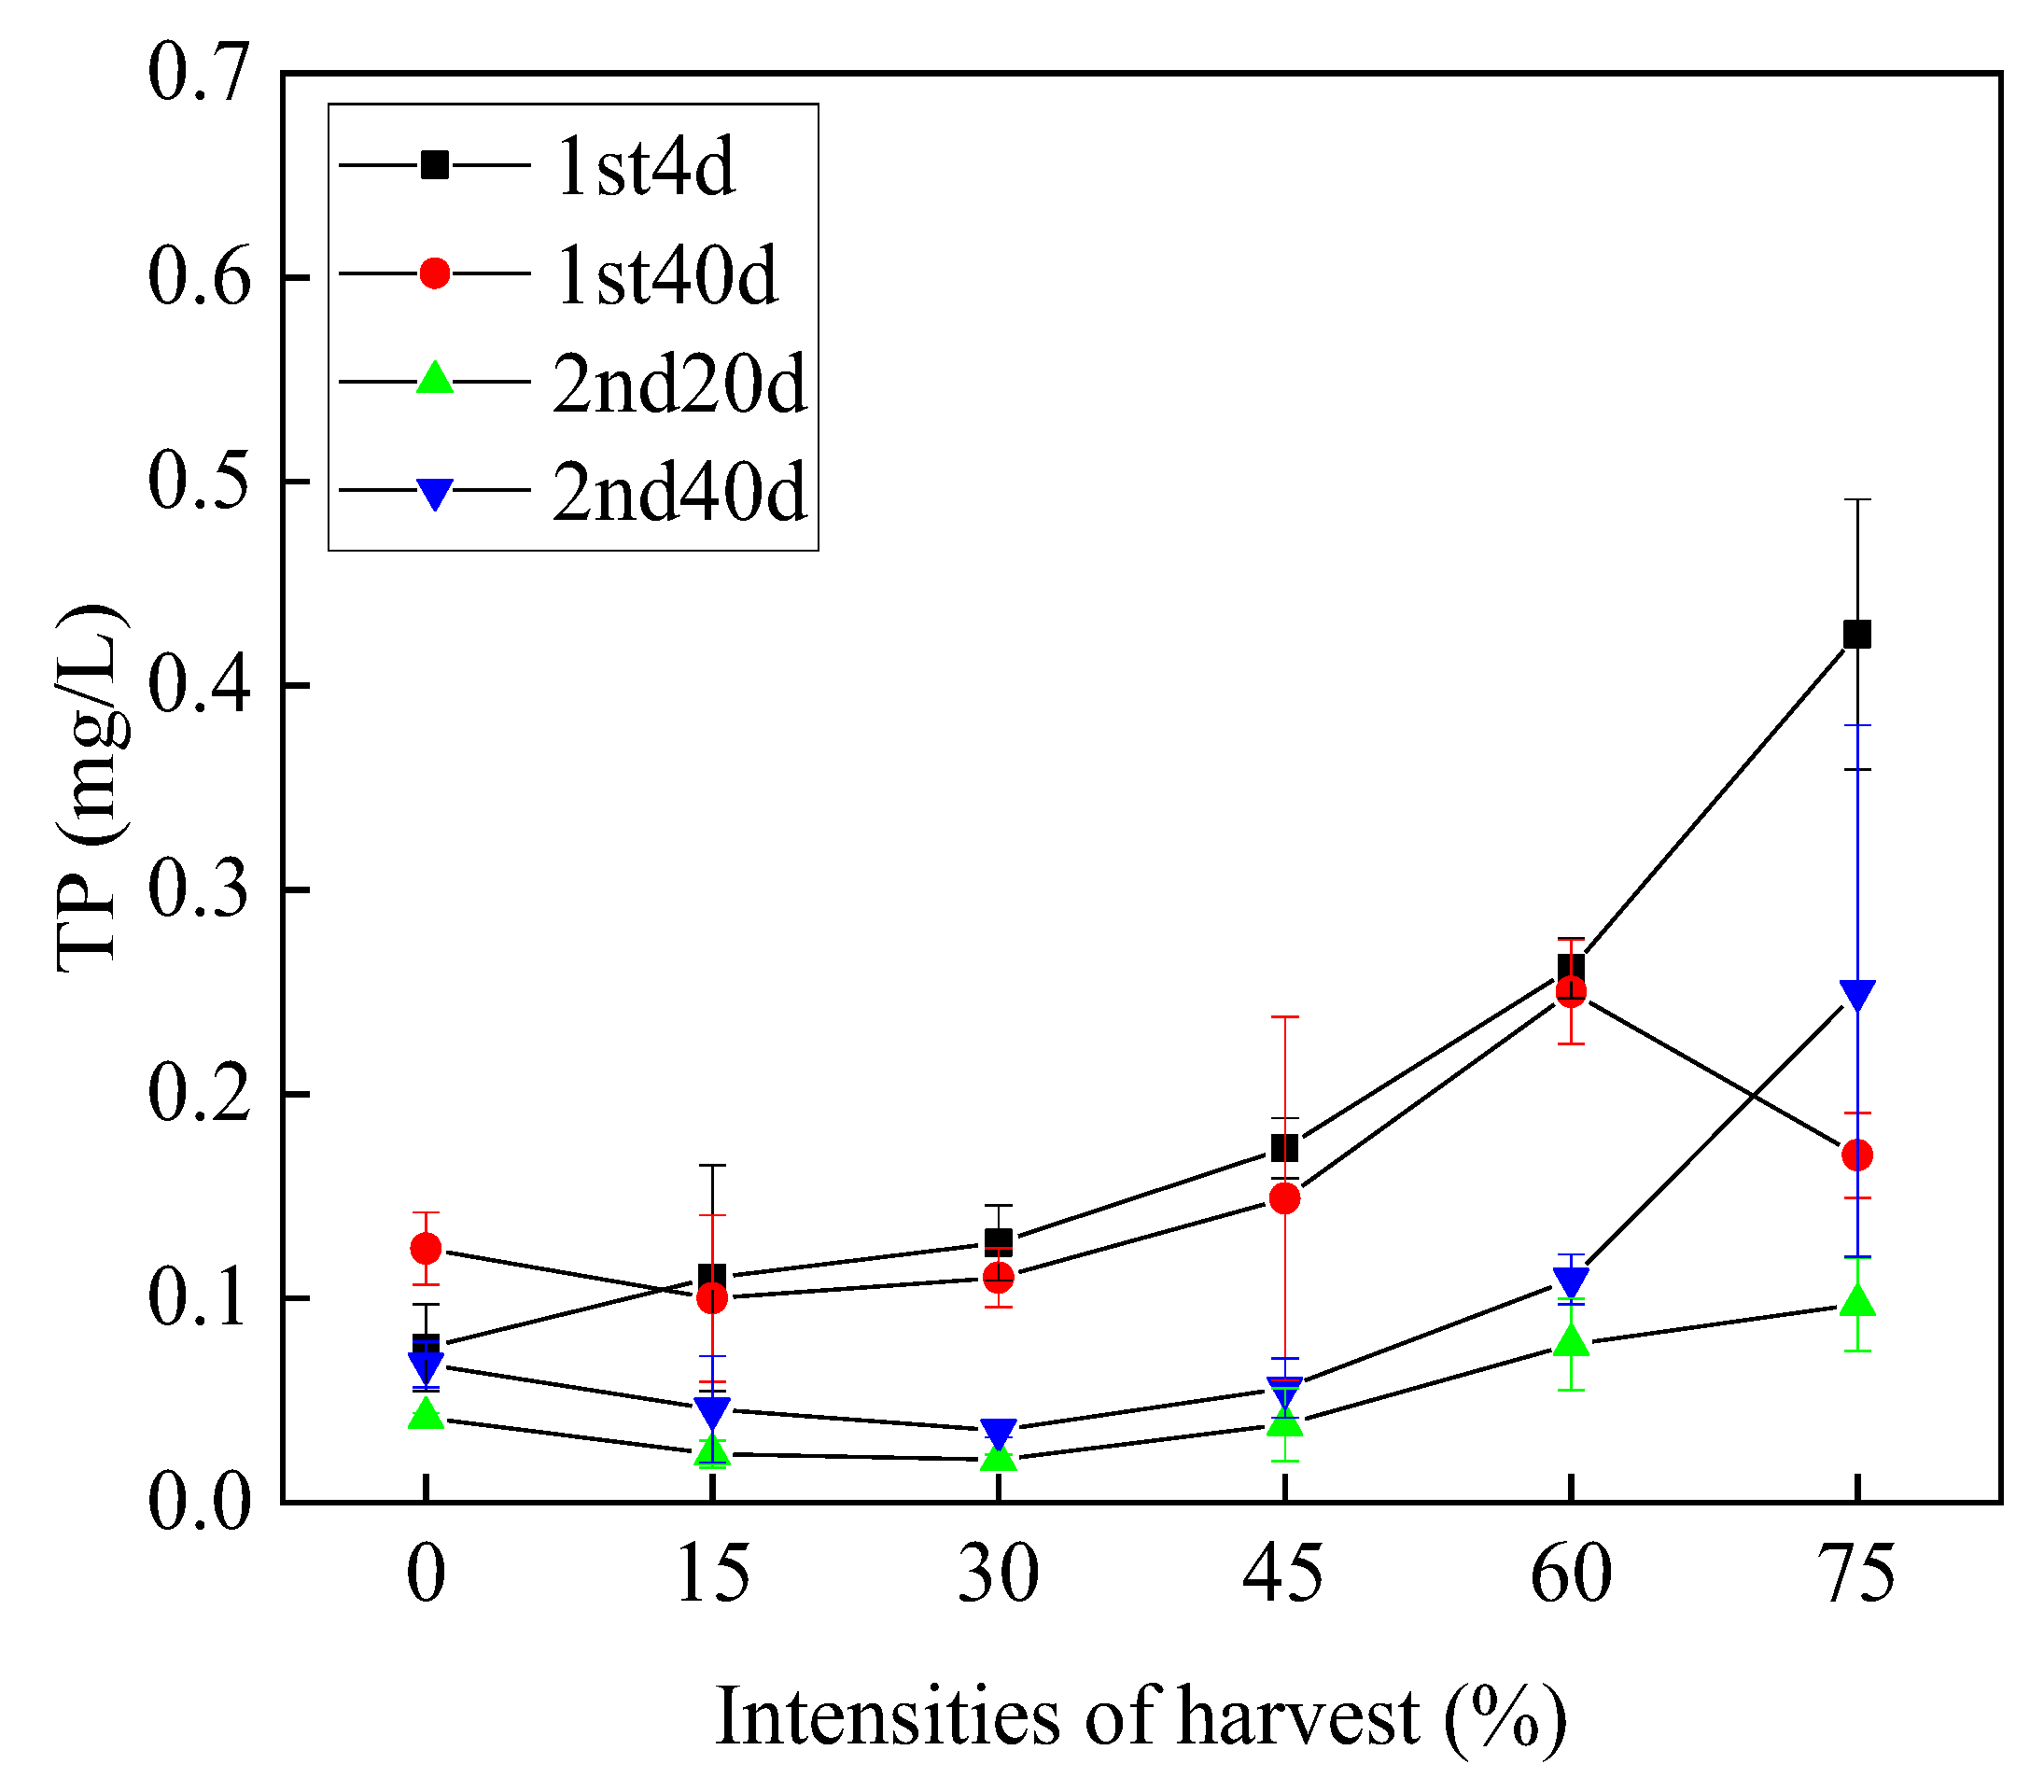
Harvesting H. verticillata had effects on the TP concentrations of the experimental water, and the changes in TP were different under the different harvesting intensities (Figure 8). After harvesting, the TP concentration in the control group was significantly lower than those in the groups. The greater the harvesting intensity, the higher the TP concentration in the water. Initially, harvesting caused a slight decrease in the TP concentration, but the TP concentration increased with increasing harvesting intensity and the effect became more pronounced over time. The TP concentrations in the medium and low-intensity harvesting groups were significantly lower than that in the high-intensity harvesting group. In the low-intensity harvesting group (≤30%), the rates of decrease in TP reached 83% and 84%, and the TP rate of decrease was lower in the medium and high-intensity harvesting groups.

3.3.3. Orthophosphate

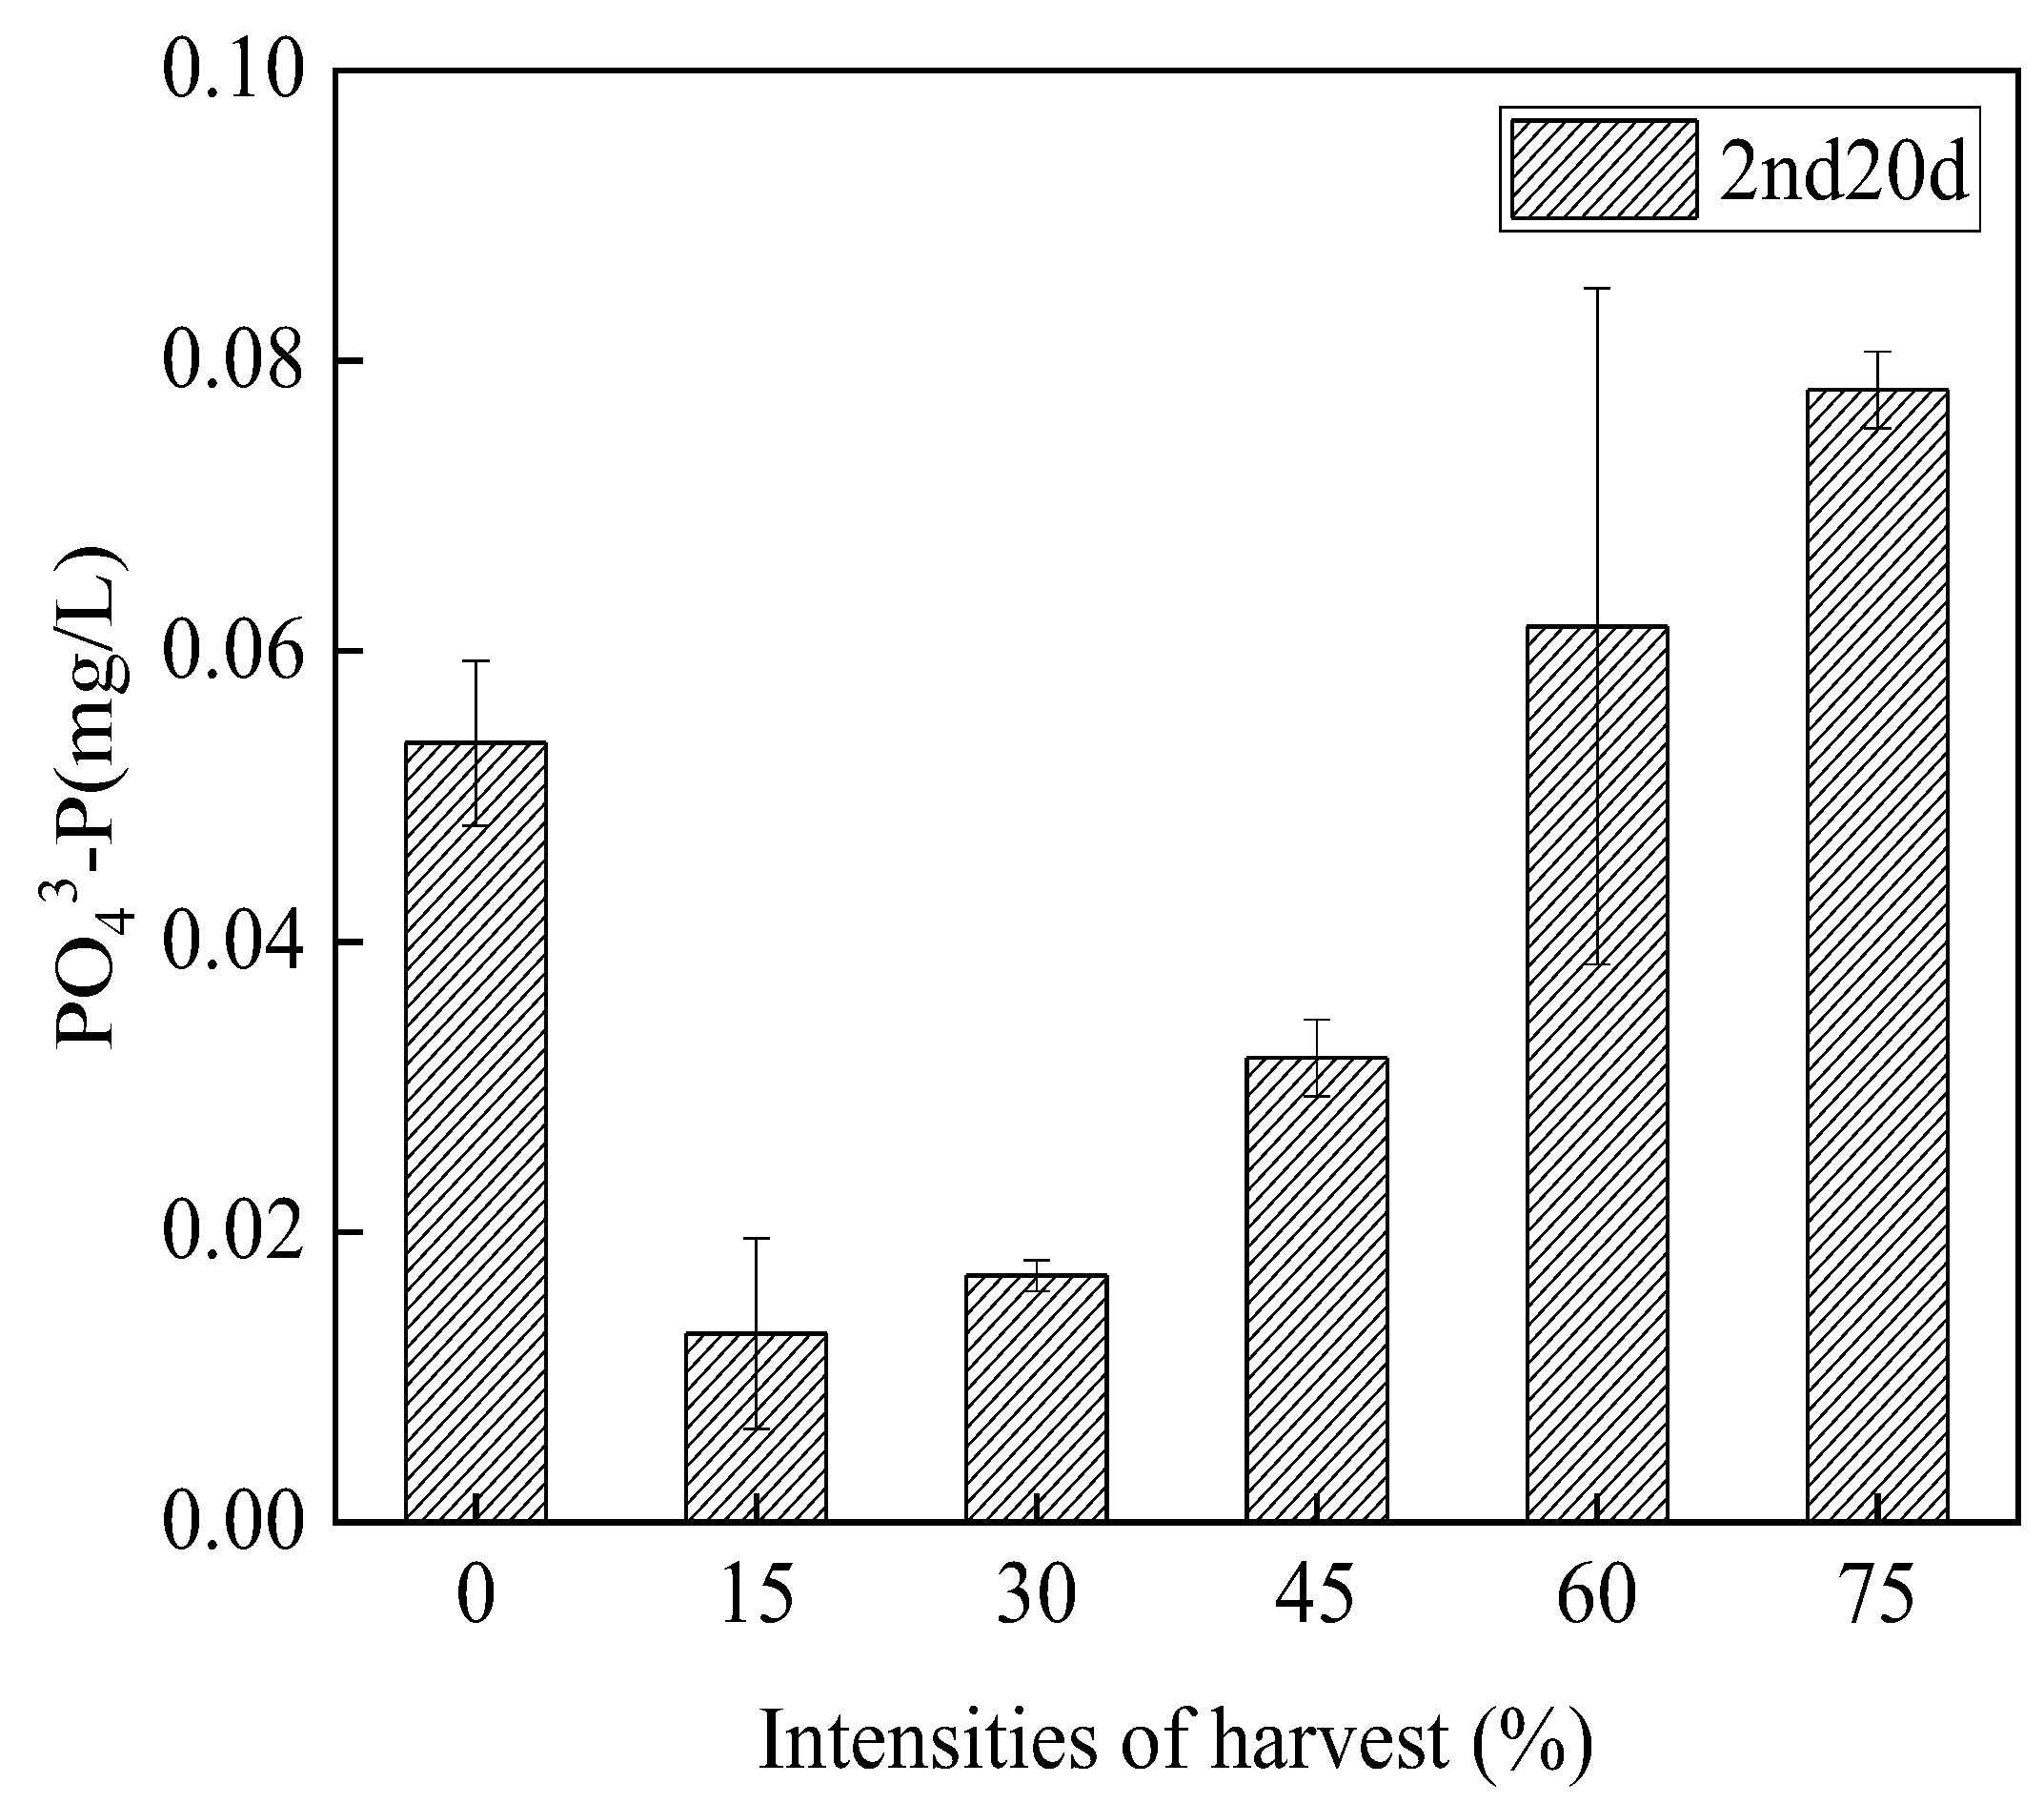
Different harvesting intensities had different effects on PO43-P concentration in the experimental water (Figure 9). The PO43-P concentration increased with increasing harvesting intensity, and the PO43-P concentrations in the medium and low-intensity harvesting groups were significantly lower than that in the high-intensity harvesting group, but lower than the control group. After the first harvest, the PO43-P concentration in the harvesting groups exhibited an upward trend and peaked on day 20 after harvesting. On day 20 after the second harvest, the change in PO43-P concentrations in the harvested groups exhibited the same trend as after the first harvest, and the PO43-P concentration in the harvesting groups peaked at a similar maximum value. After harvesting, the PO43-P concentration trended upward with harvesting intensity, i.e., higher harvesting intensities produced more of a change. The concentrations of PO43-P in the medium and low-intensity harvesting groups were always lower than that in the high-intensity harvesting group. By the end of the experiment, the PO43-P concentration in the 75% intensity harvesting group was 0.078 mg/L, while the concentrations in the other harvesting groups and the control group were significantly lower.

3.4. Changes in the Water Organic Matter

3.4.1. Permanganate Index (CODMn)

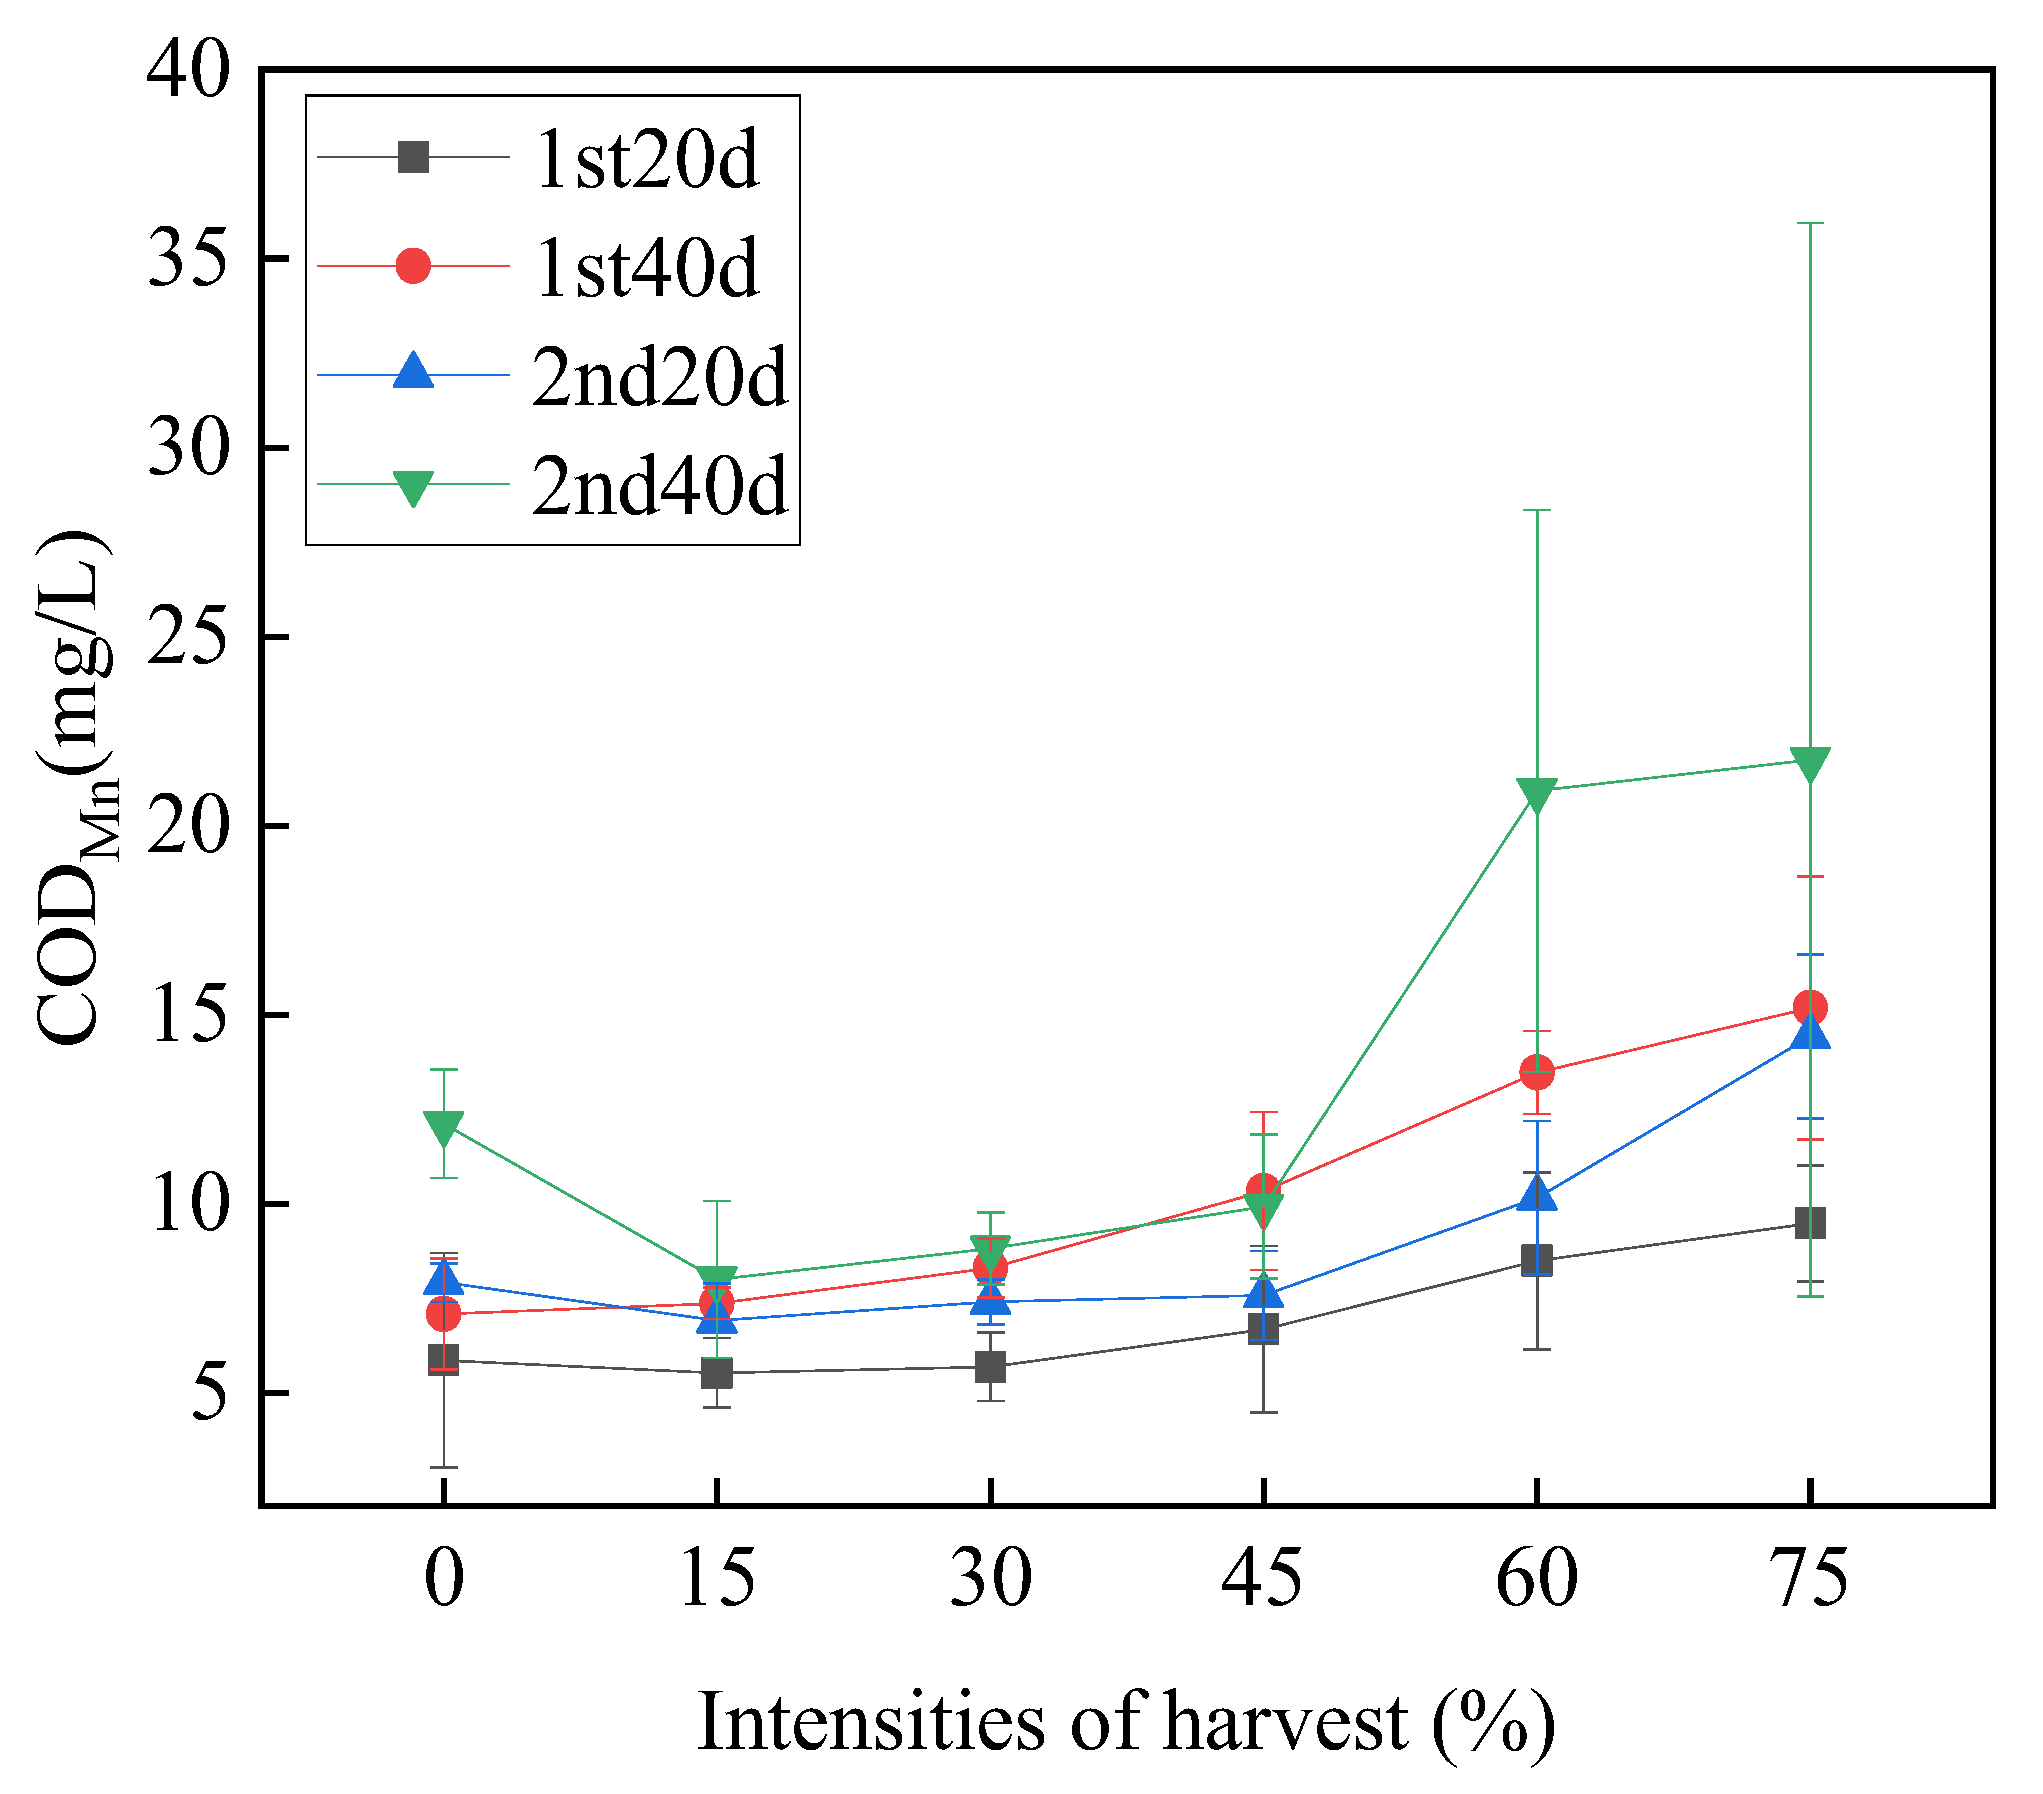
The CODMn index was significantly different under the different harvesting intensities (Figure 10). The change in the CODMn index in the low-intensity harvesting group was greater than that in the medium and high-intensity harvesting groups. The higher the harvesting intensity, the higher the CODMn index. The CODMn index decreased slightly after harvesting in the medium and low-intensity harvesting groups, but the CODMn index generally trended upward with harvesting time. After two harvests, the CODMn index of the high-intensity harvest group increased significantly and remained above 14 mg/L. The CODMn index of the medium and low-intensity harvesting groups tended to increase, but changed little overall. The CODMn index also changed with harvesting intensity. The CODMn index value of the low harvesting intensity group was always lower than that of the medium and high-intensity harvesting groups, and the higher the harvesting intensity, the higher the CODMn index.

3.4.2. Colored Dissolved Organic Matter

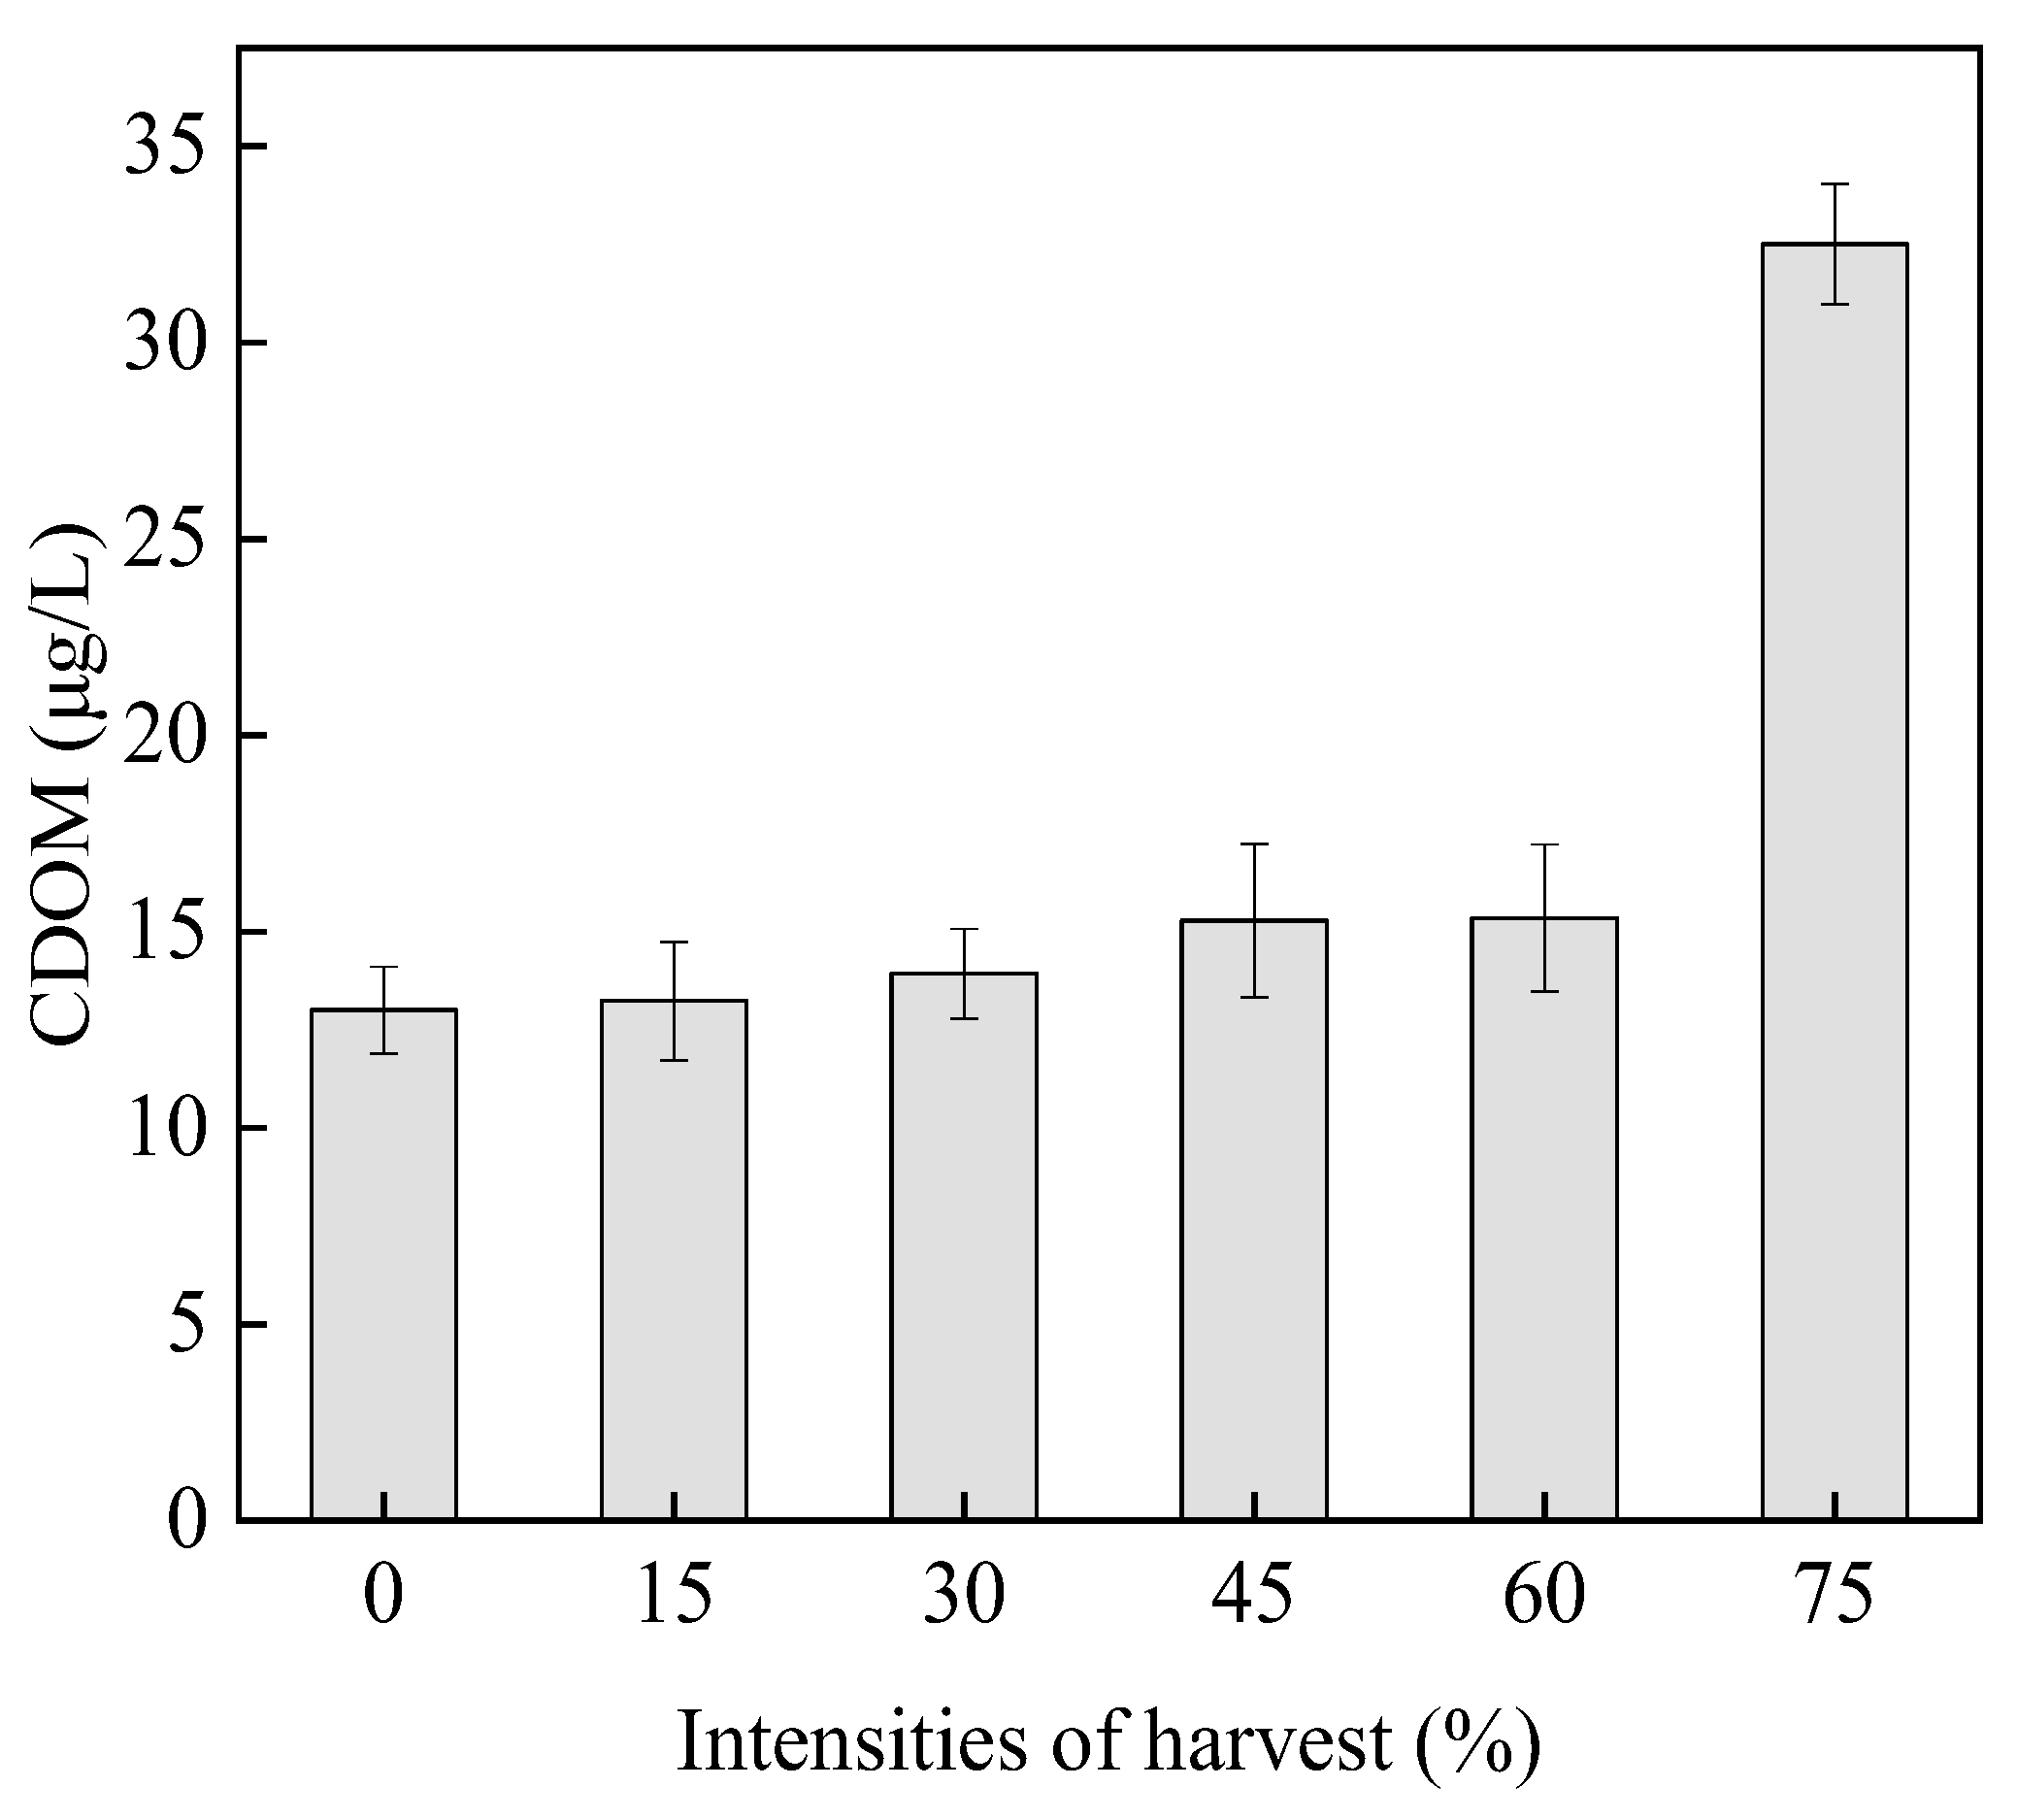
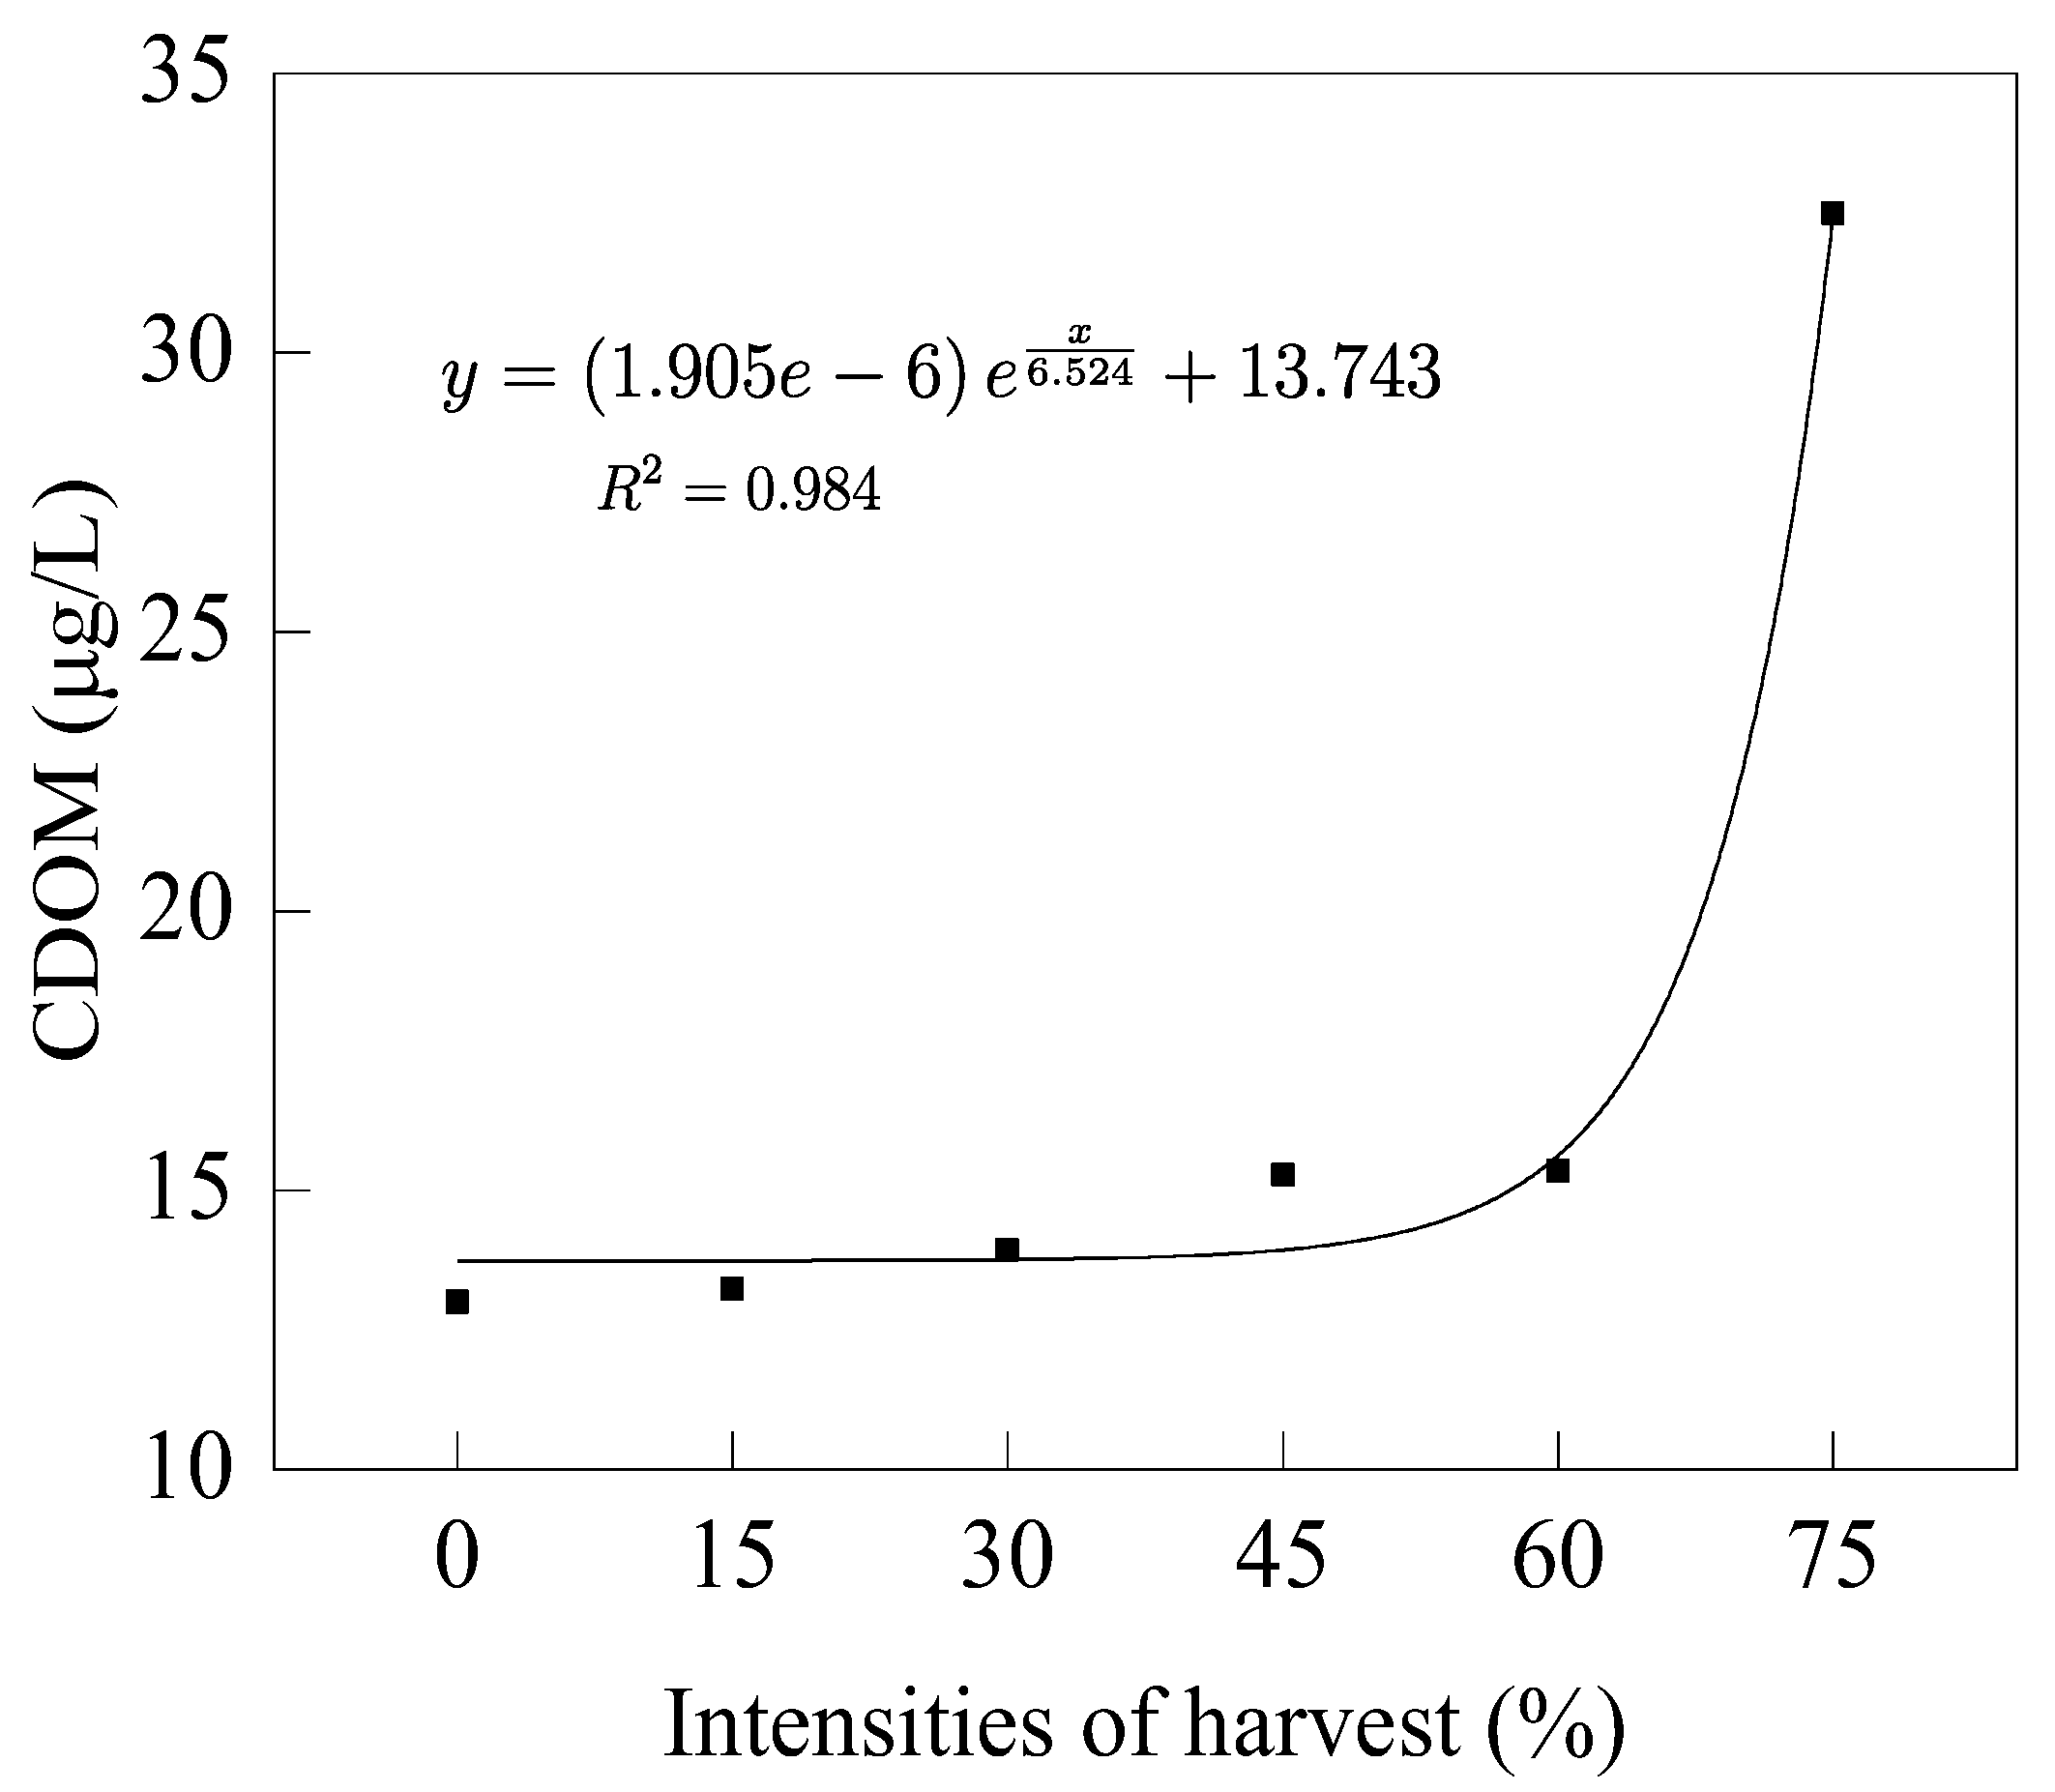
The CDOM concentration was significantly different under the different harvesting intensities. The CDOM concentrations in the medium and high-intensity harvesting groups were significantly higher than that in the low-intensity harvesting group (Figure 11). The CDOM concentration in the 75% intensity harvesting group was the highest, reaching 32.50 µg/L, whereas the CDOM concentrations of the 15%, 30%, 45%, and, 60% intensity harvesting groups were 13.23, 13.93, 15.28, and 15.35 μg/L, respectively, while the control group was only 13.00 µg/L. The CDOM concentrations in the harvesting groups increased by 2.1%, 7.2%, 17.5%, 18.1%, and 150.0%, respectively compared with the control group.

3.5. Chlorophyll a

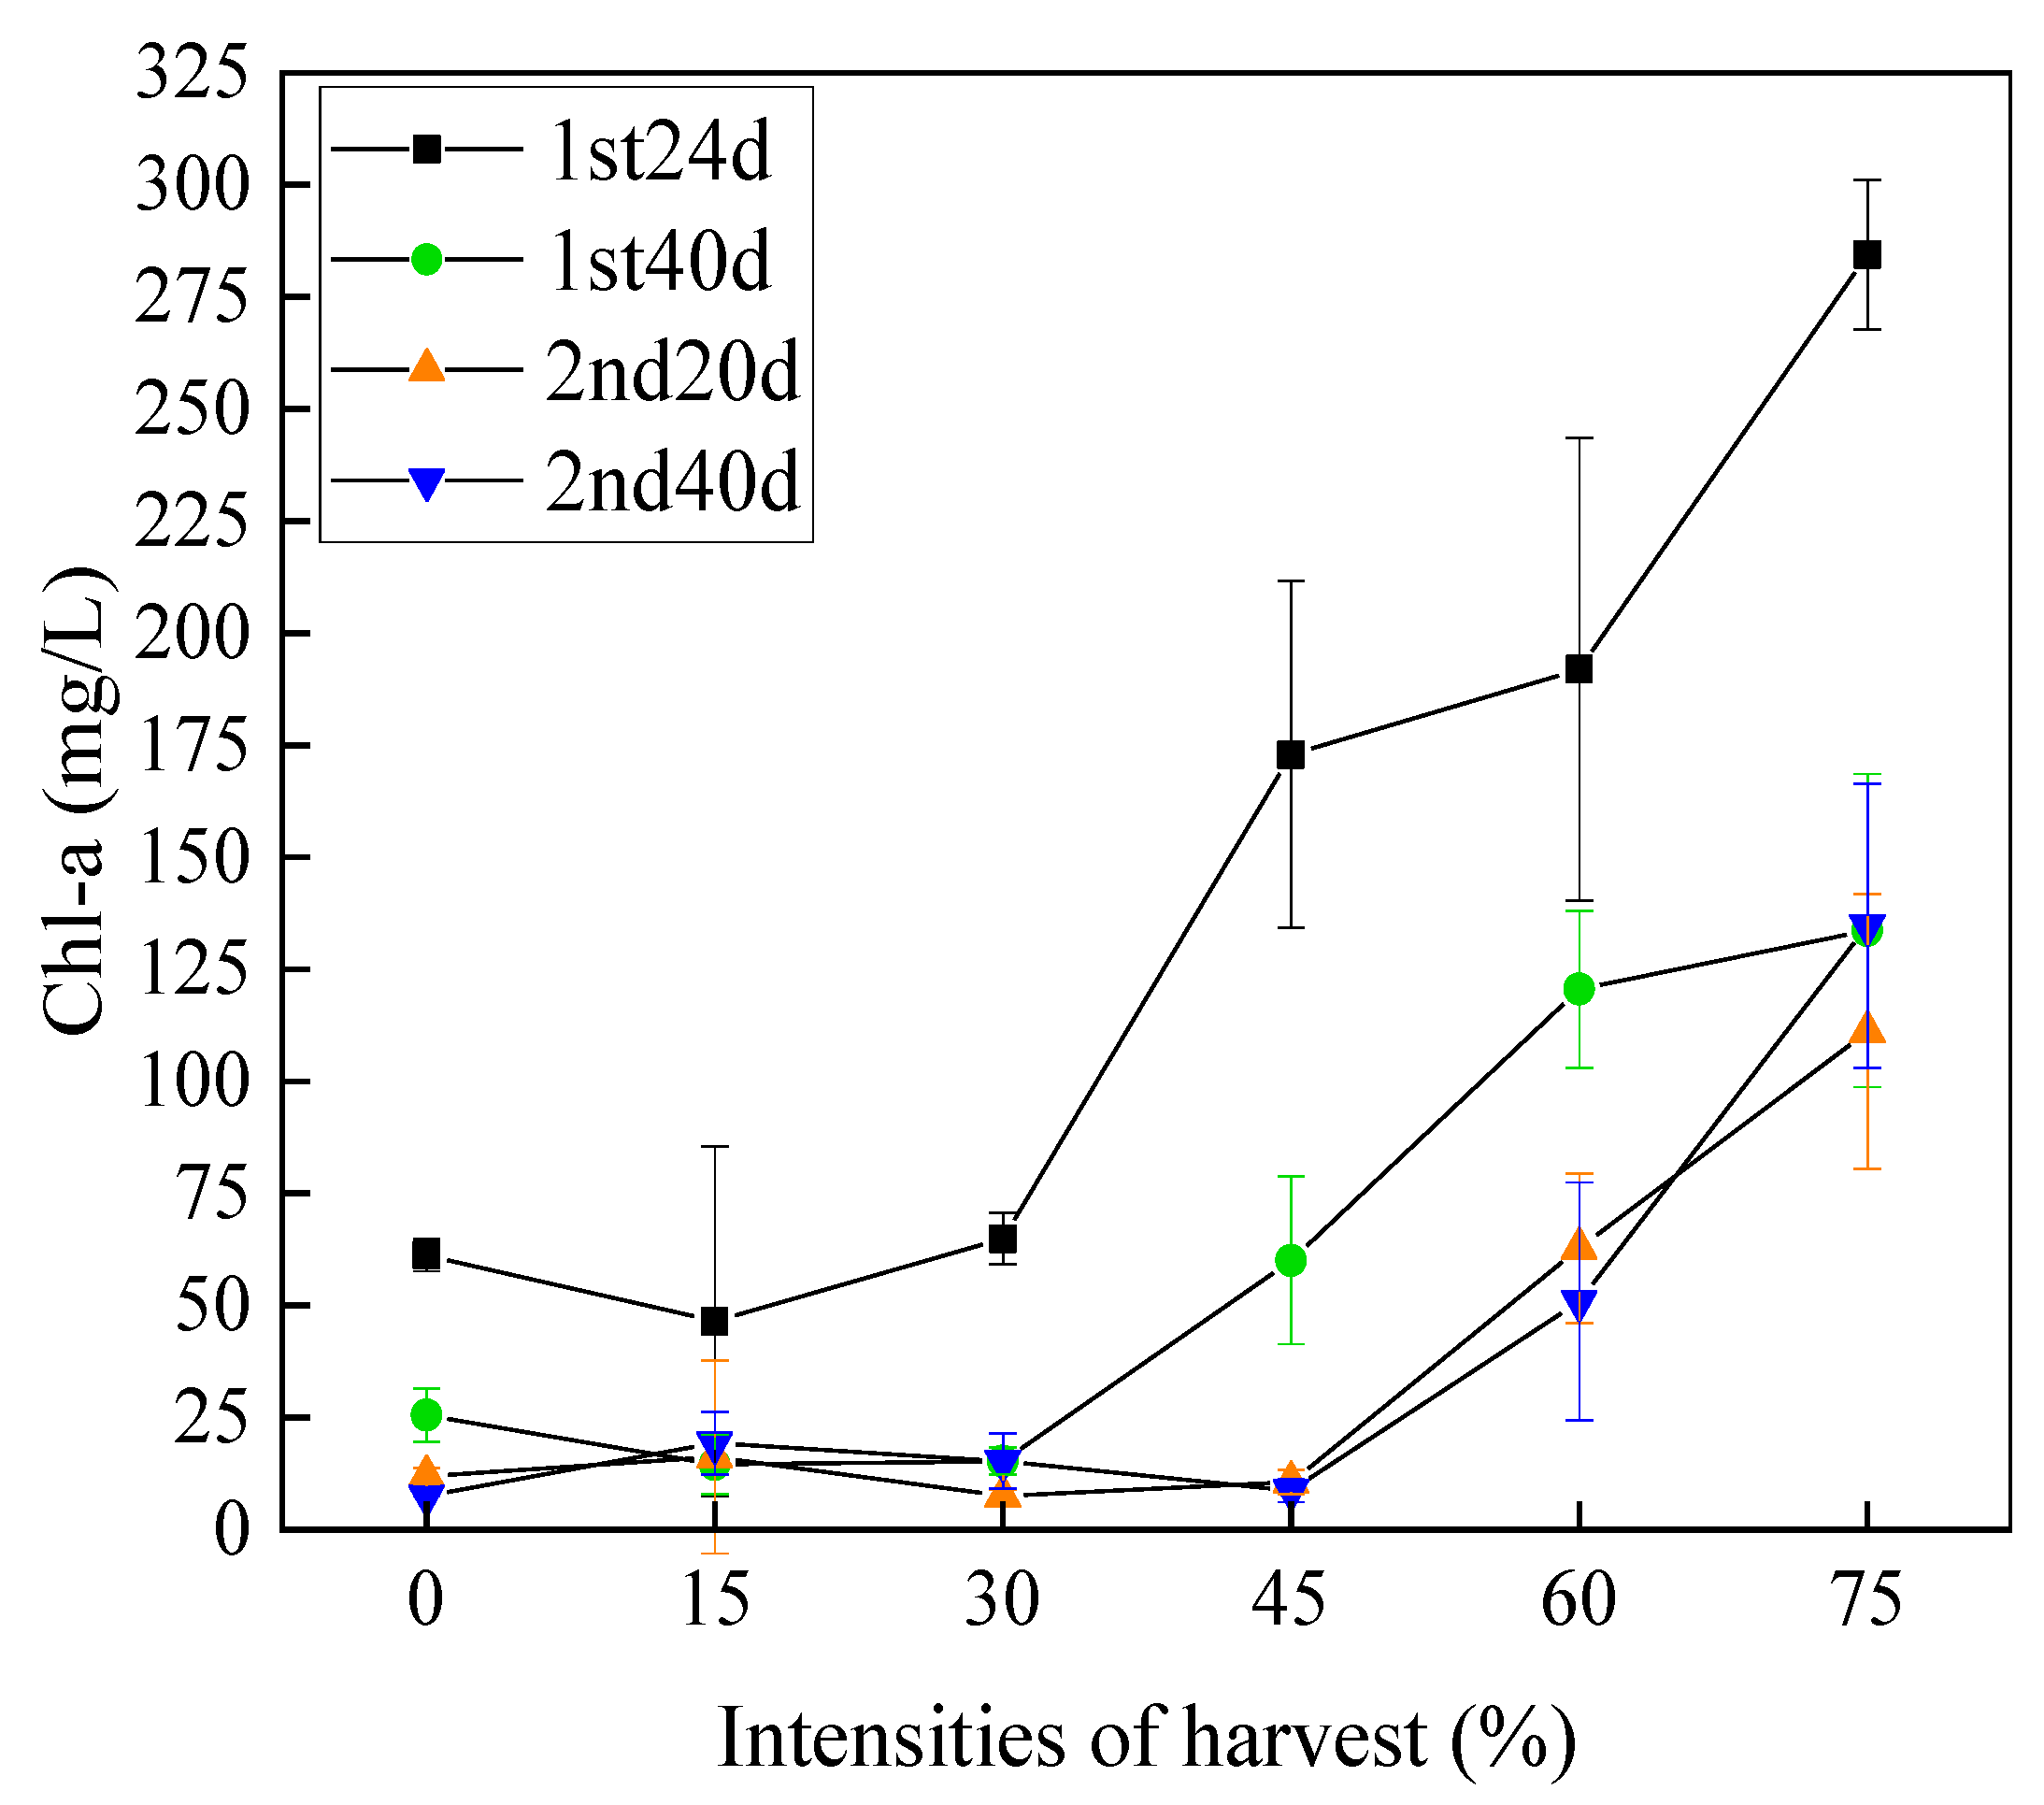
Harvesting H. verticillata resulted in a significantly fluctuating concentration of Chl-a in the experimental water (Figure 12). The Chl-a concentration increased initially after the first harvest, but decreased over time. In the low-intensity harvesting group, the Chl-a concentration remained low during the experimental period. The concentrations of Chl-a in the medium and high-intensity harvesting groups showed a periodic change of “low-high-low”, and were significantly different from those of the medium and low-intensity harvesting groups. After the second harvest, the Chl-a concentration in the high-intensity harvesting group remained at a consistently high level and was significantly higher than those in the medium and low-intensity harvesting groups. By the end of the experiment, the Chl-a concentrations in the water of the harvesting groups had increased by 2.56%, 2.03%, 1.15%, 6.76%, and 17.89%, respectively, compared with the control group.

4. Discussion

4.1. Effects of Harvesting on the Growth and Reproduction of H. verticillata

Harvesting intensity and harvest frequency will affect the growth and recovery of H. verticillata. A total of two harvests were carried out during the experiment. No death of H. verticillata occurred in any of the harvesting groups in the first harvest, but there were differences in the recovery ability of H. verticillata under the different harvesting intensities (Figure 13 and Figure 14). In our experiment, H. verticillata could recover or exceed the pre-harvest levels in a relatively short period of time under moderate and low-intensity harvesting, which was similar to the study by Zuo et al. [26]. In addition, the recovery of submerged plants after harvest is closely related to the growing season, climate, resources, growth characteristics, nutrient reserves and other factors [21,26,27]. The temperature of submerged plants changes slowly and stably. The influence of temperature on submerged plants is less than that on land plants, but its influence on the seasonal growth of submerged plants is still obvious. The study of Chen et al. showed that the growth of H. verticillata was vigorous at 25 and 35 °C, but was inhibited at low temperatures (5 °C) [28,29,30]. In our experiment, the recovery ability of H. verticillata was significantly decreased, and the recovery time was significantly prolonged after the second harvest. The reason may be that the first harvest was in early August and the second harvest was in mid-September. The difference in harvest time led to differences in water temperature, air temperature, and other factors, which affect the growth recovery of H. verticillata after the second harvest [20]. The choice of harvesting time had a significant effect on the growth and recovery of H. verticillata. When harvesting was conducted during a suitable growth period, with suitable water and air temperatures, H. verticillata was able to quickly recover to pre-harvest levels after harvesting. When harvesting was conducted during the slowly growing period of H. verticillata, or in the low-temperature season, environmental factors such as water temperatures have not reached the optimal combination [31], and high-intensity harvesting made it difficult or impossible for the growth of H. verticillata to recover.
No mass mortality of H. verticillata was observed under different harvesting intensities, but a significant effect on plant height and branch growth (Figure 13). branches accelerated and new apical branches were formed. When the harvesting intensity is high, H. verticillata mainly sprouted new branches from the base to replace the original main lotus to form new top branches [31], and the branches that sprout from the base after harvesting become the most vigorous parts [26]. Because harvesting causes damage to plant tissue and the harvested plant will not have the ability to transport nutrients from the stem, which promotes new branches of H. verticillata will mainly germinate from the base [32]. However, as H. verticillata is a canopy-submerged plant with rapid growth and most of its biomass is mainly allocated to photosynthetic tissues [33], a large number of branches and leaves are easy to form a large canopy on the water surface and have strong competition for light and space [34,35,36]. Therefore, harvesting effectively reduces the concentration of H. verticillata biomass on the surface of the water and plays a better purification and landscape effect. At the same time, the canopy can reduce the shade of light and promote the growth of submerged plants in the lower layer [37,38]. The final plant height was highest in the control group, reaching 113 cm, where a canopy formed on the water surface. However, no canopy was formed on the water surface in the harvesting group. No branches sprouted at the bases of the harvested plants in the control group and in the medium and low-intensity harvesting groups. The number of basal branches after two harvests was higher. in the high-intensity harvesting group than in the medium and low-intensity harvesting groups due to fewer remaining residual branches. These results indicated that harvesting intensity had an inhibitory effect on canopy formation and branch growth.
Medium and low-intensity harvesting did not have a significant effect on the regenerating ability of H. verticillata, and these lower harvesting levels were actually beneficial to the growth of H. verticillata (Figure 14). However, with the increase of harvesting intensity, the final biomass of H. verticillata decreased as harvesting intensity increased. In the three harvesting treatments, except for the first time in the high-intensity group, the maximum fresh weight of the other two occurred in the moderate and low-intensity harvesting groups, and the fresh and dry weights decreased with increasing harvesting intensity, which was similar to the study by Xu et al. [39]. At the end of the experiment, the H. verticillata biomass of all harvested groups exhibited overall decreases in final biomass. This was similar to the results of Yan et al. [18]. who reported that high-intensity harvesting inhibits plant biomass accumulation. However, in the study of Zuo et al., it was found that the relative growth rate of the dry mass of Myriophyllum spicatum L. showed a decreasing trend after continuous harvesting under different harvesting intensities, which may be related to continuous harvesting and the gradual decline of temperature [20].
Asexual reproduction is the main mode of reproduction, submerged plants can acquire nutrients through asexual reproduction, and population expansion in submerged macrophytes. As well, it plays an important role in population continuity [40]. But it is not the only mode. Vegetative reproduction is also a common reproductive mode in submerged macrophytes, but it is affected by factors such as water transparency and sediment [41]. The main ways of asexual propagation of H. verticillata are broken branches and winter buds [42,43,44]. In this study, H. verticillata mainly relied on the production of winter buds for asexual reproduction. The correlation coefficient between harvesting intensity and the number of winter buds was as high as 0.92. It is because harvesting reduced the number of stem nodes of H. verticillata, and H. verticillata invested most of its energy into plant recovery after harvesting, which reduced the formation of winter buds. This affected the number of new winter buds, while it did not directly result in the complete disappearance of all winter buds. So a certain intensity of harvesting would restrict the expansion of the H. verticillata population to a certain extent.

4.2. Effects of Harvesting H. verticillata on Water Quality

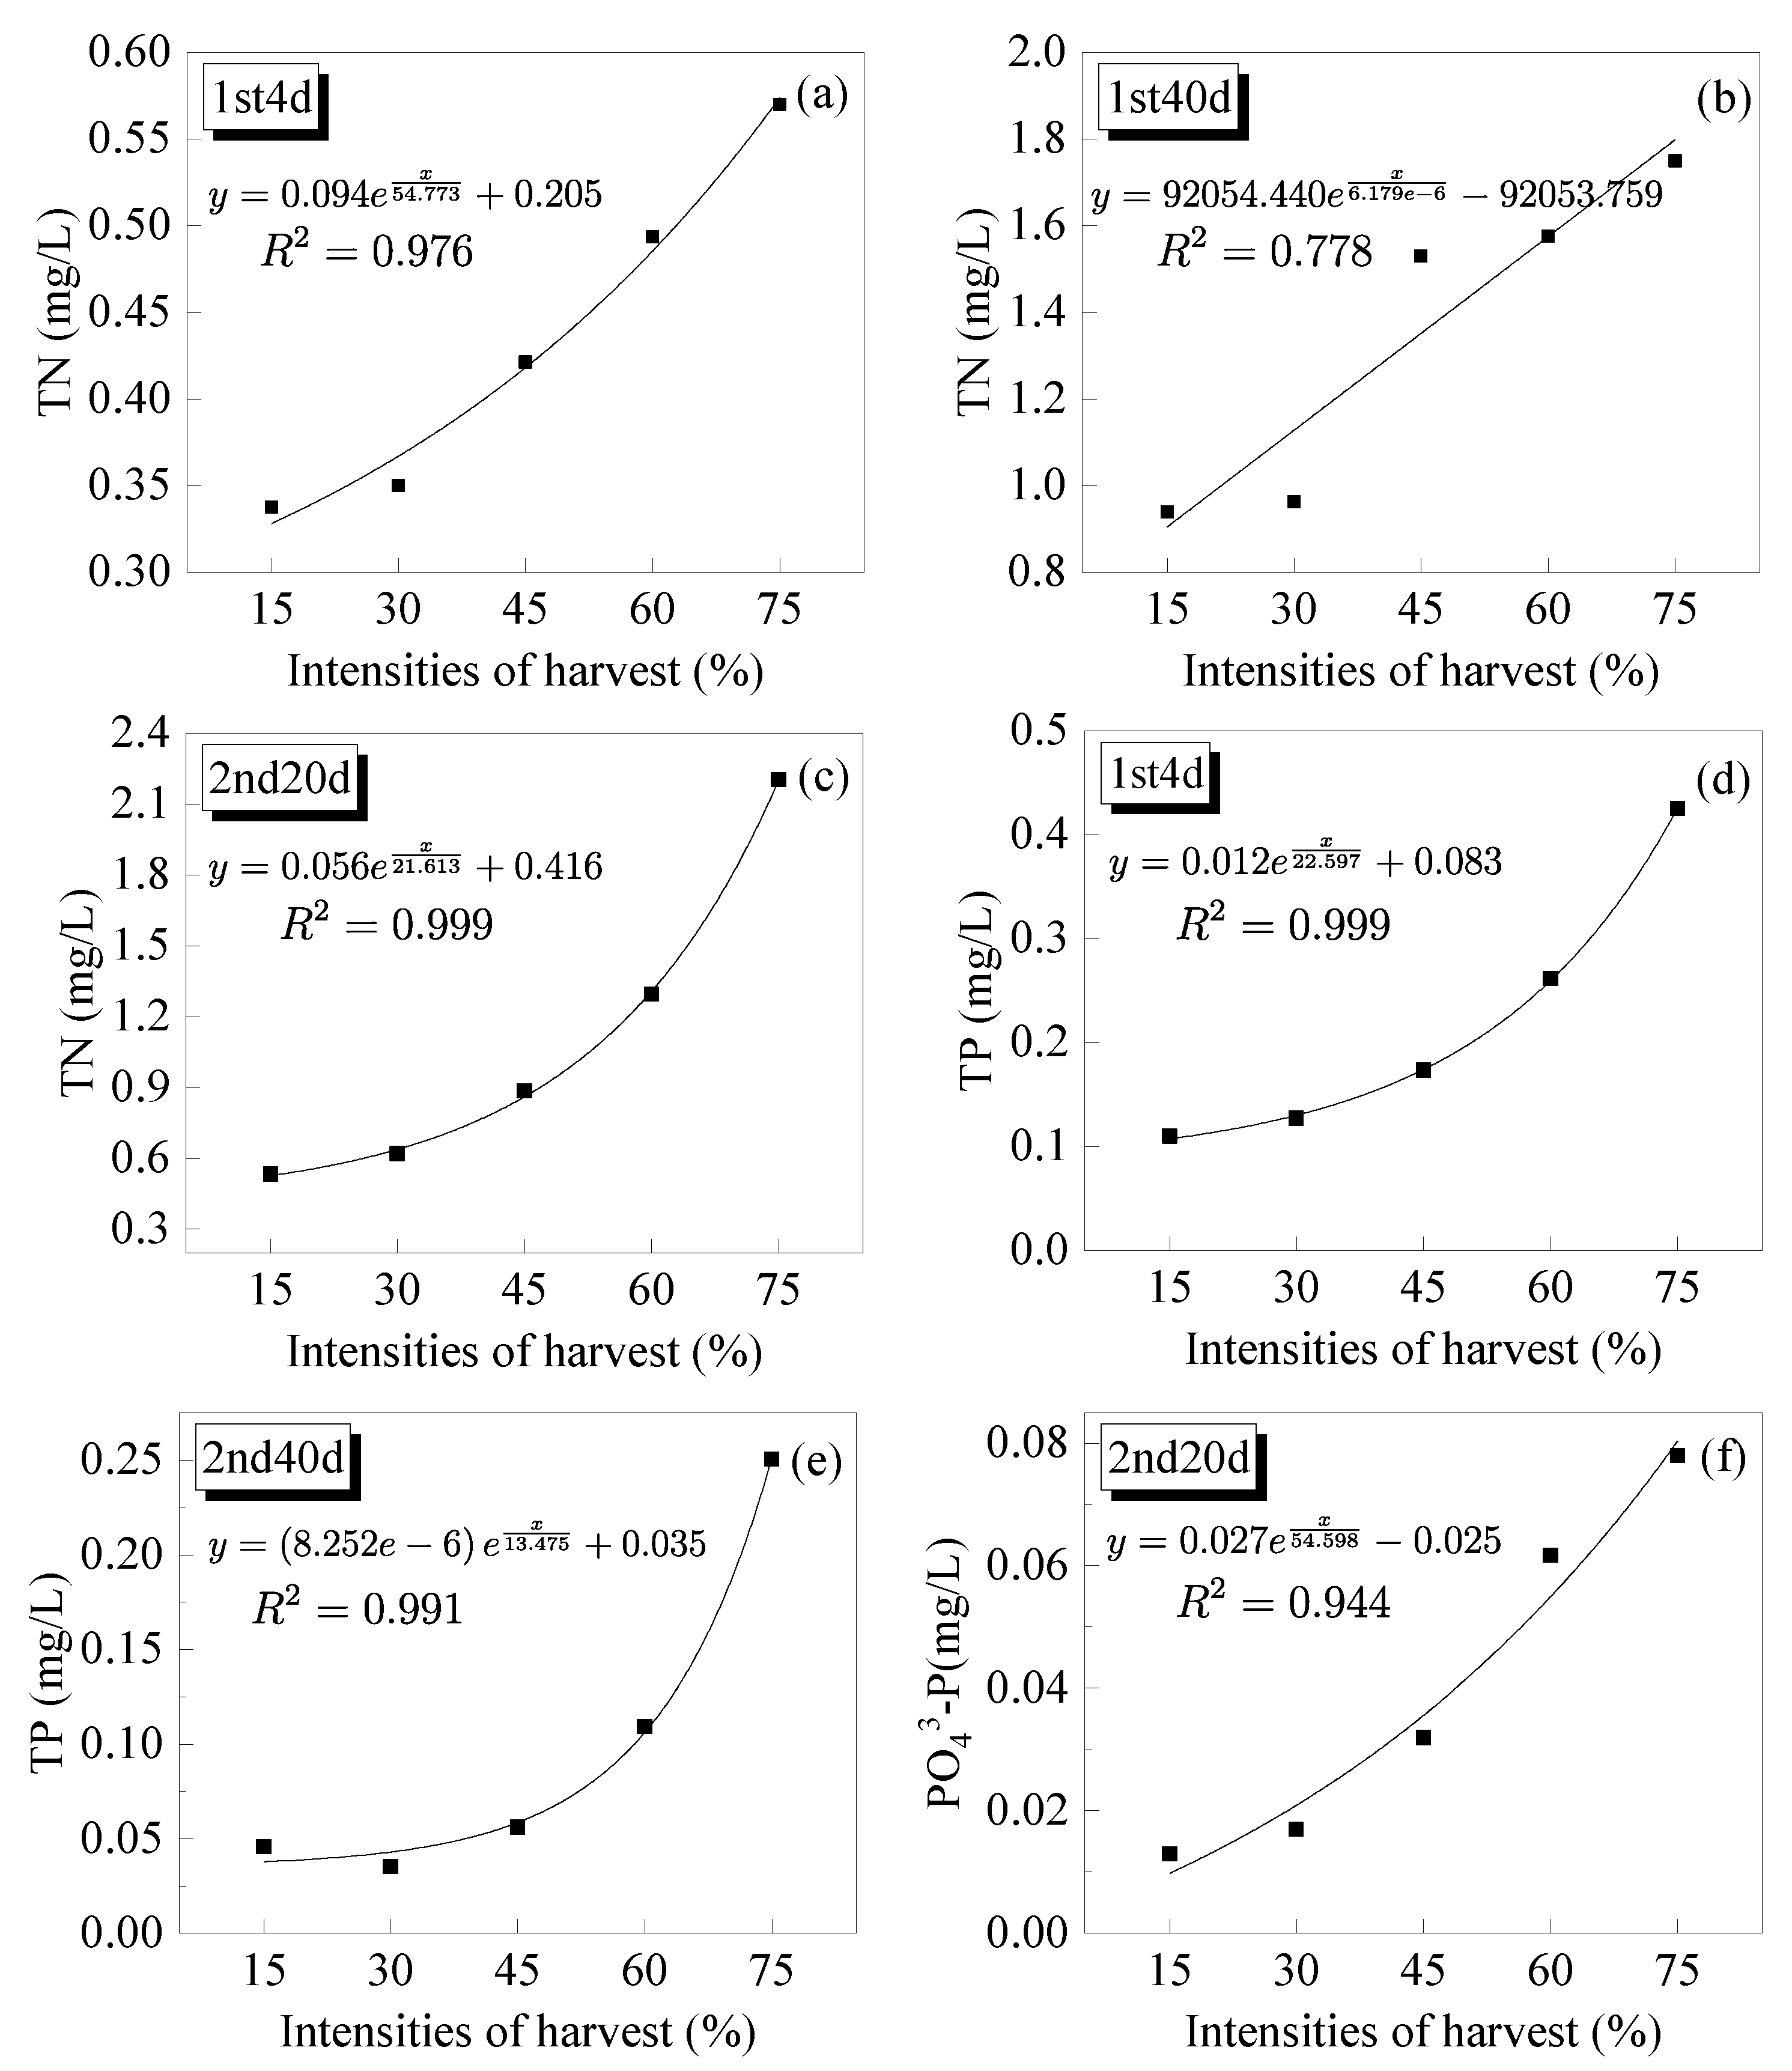
The effects of removing submerged macrophytes on SS occur mainly through the interception and adsorption of roots, leaves, and resistance to flow resistance, which reduces the flow velocity and promotes the SS to settle [45]. The harvesting disturbed the water body, causing the SS to adsorb on the H. verticillata leaves and that settled on the bottom to re-enter the water body. The greater the harvesting intensity, the greater the disturbance to the water body. The SS of each harvesting group decreased slightly with the passage of harvesting time, but by the end of the experiment, the increases in SS reflected the increases in harvesting intensity by the end of the experiment (Figure 15).
Excesses of nutrients such as nitrogen and phosphorus in the water, lead to deteriorated water quality, increased turbidity, and reduced light penetration, which can kill submerged macrophytes and further deteriorate the water quality. Nitrogen and phosphorus are essential nutrients for the growth of aquatic plants. Submerged macrophytes can remove large amounts of nitrogen and phosphorus from the water through assimilation, adsorption, and synergistic relationships with attached microorganisms [46]. It has been shown that most submerged macrophytes will greatly contribute to the removal of nitrogen and phosphorus from eutrophic lakes [47]. The study by Fu et al. [48]. showed that, among various species of aquatic plants, H. verticillata had the best pollutant-purifying effect towards pollutants in eutrophic bodies of water. Most submerged macrophytes contribute greatly to the removing nitrogen and phosphorus from eutrophic lakes [47]. This experiment showed that the harvesting of H. verticillata had a significant impact on the nitrogen, phosphorus, and other nutrients in the water body, which also significantly affected water quality (Figure 16), similar to the study by Zheng and Zhao [49,50]. Harvesting caused significant differences in the concentrations of TN, TP, and PO43-P in water. During the entire experiment, the greater the H. verticillata harvesting intensity, the higher the nutrient concentrations, but that is just the overall pattern. Restoring submerged macrophytes combined with effective harvest management can greatly improve water quality [51] In this experiment it was found that the nutrients in the harvesting groups increased rapidly and the turbidity of the water increased after harvesting. Then the nutrient contents decreased steadily and returned to lower levels, and water transparency increased. These significant changes were closely related to the release of nitrogen and phosphorus and the recovery of the growth of H. verticillata. After the harvesting of H. verticillata, the decay of the plant residues, stems, and leaves in the water body releases nitrogen, phosphorus, and other substances [50]. Thus, this release of nutrients had a strong effect on the water quality over a short time [52].
Aquatic plants affect light transmission through coverage, which regulates the temperatures at the bottom of the water body creating a temperature difference between the surface and bottom water. Lower temperatures will slow the release of nutrients [53,54]. Harvesting reduces the water surface coverage by H. verticillata, which increases the temperature at the bottom of the water body and accelerates the release of nutrients into the sediment. In our experiment, harvesting disturbs the H. verticillata and the water body, and the particles attached to the surface of the plants and in the sediment re-enter the water, which also significantly increases the concentrations of nitrogen, phosphorus, and other substances, and causes the water quality to degrade. This experiment also showed that low-intensity harvesting resulted in a smaller disturbance and facilitated the maintenance of good water quality. In addition, the amount of nitrogen and phosphorus removed by multiple low-intensity harvests was more than that taken away by one harvest. This finding shows that a lower harvesting intensity and a reasonable number of harvests result in the largest water quality improvement, similar to Verhofstad’s study [55]. Therefore, in the management of submerged plants, it is necessary to carry out reasonable and effective management of the intensity and frequency of harvesting, which will help improve water quality [49,51].
In addition to the adsorption of nutrients, H. verticillata also controlled algal growth (Figure 17). The Chl-a concentration in the water serves as a comprehensive index of the number of algae in a lake and is the main evaluation index for eutrophication. This experiment showed that the greater the H. verticillata harvesting intensity, the more algal blooms in the water, and the higher the Chl-a concentration. The Chl-a concentration only increased temporarily under low-intensity harvesting, and the increase was not obvious. Subsequently, the Chl-a concentration quickly stabilized and decreased below the pre-harvest levels. The Chl-a concentration under medium and high-intensity harvesting was significantly higher than in the control and low-intensity harvesting groups, and the high concentrations persisted for a long time and did not return to the pre-harvest levels. The first harvest was in August when the temperature was higher, which meant that the algae in the medium and high-intensity harvest groups flourished. Chl-a was well controlled by the second harvest, and water quality recovered well. However, when H. verticillata entered a slow growth period and the temperature was lower after the second harvest, the improvements in water quality following the harvest were weaker than after the first harvest. This further demonstrated that H. verticillata can improve water quality and inhibit algae when reasonably managed [39,54,56].
Harvesting of submerged macrophytes also affects the release of algae-inhibiting chemicals, thereby weakening the allelopathic effect of the plant. The greater the harvesting intensity, the faster the phytoplankton proliferated and the higher their concentration. This was reflected by the changes in CDOM, which was released in large amounts during the growth and death of phytoplankton. Additionally, the degradation of the remnants of the harvested H. verticillata released organic matter into the water, which further contributed to decreasing transparency and changes in water quality [57,58,59]. In our experiment, when H. verticillata was harvested in mid-summer, the concentrations of phytoplankton and CDOM in each harvesting group increased rapidly, but for a short time. The growth of H. verticillata slowed at the end of summer due to temperature and other factors, and the concentrations of phytoplankton and CDOM increased significantly under high-intensity harvesting, maintaining the higher concentrations for longer (Figure 18).
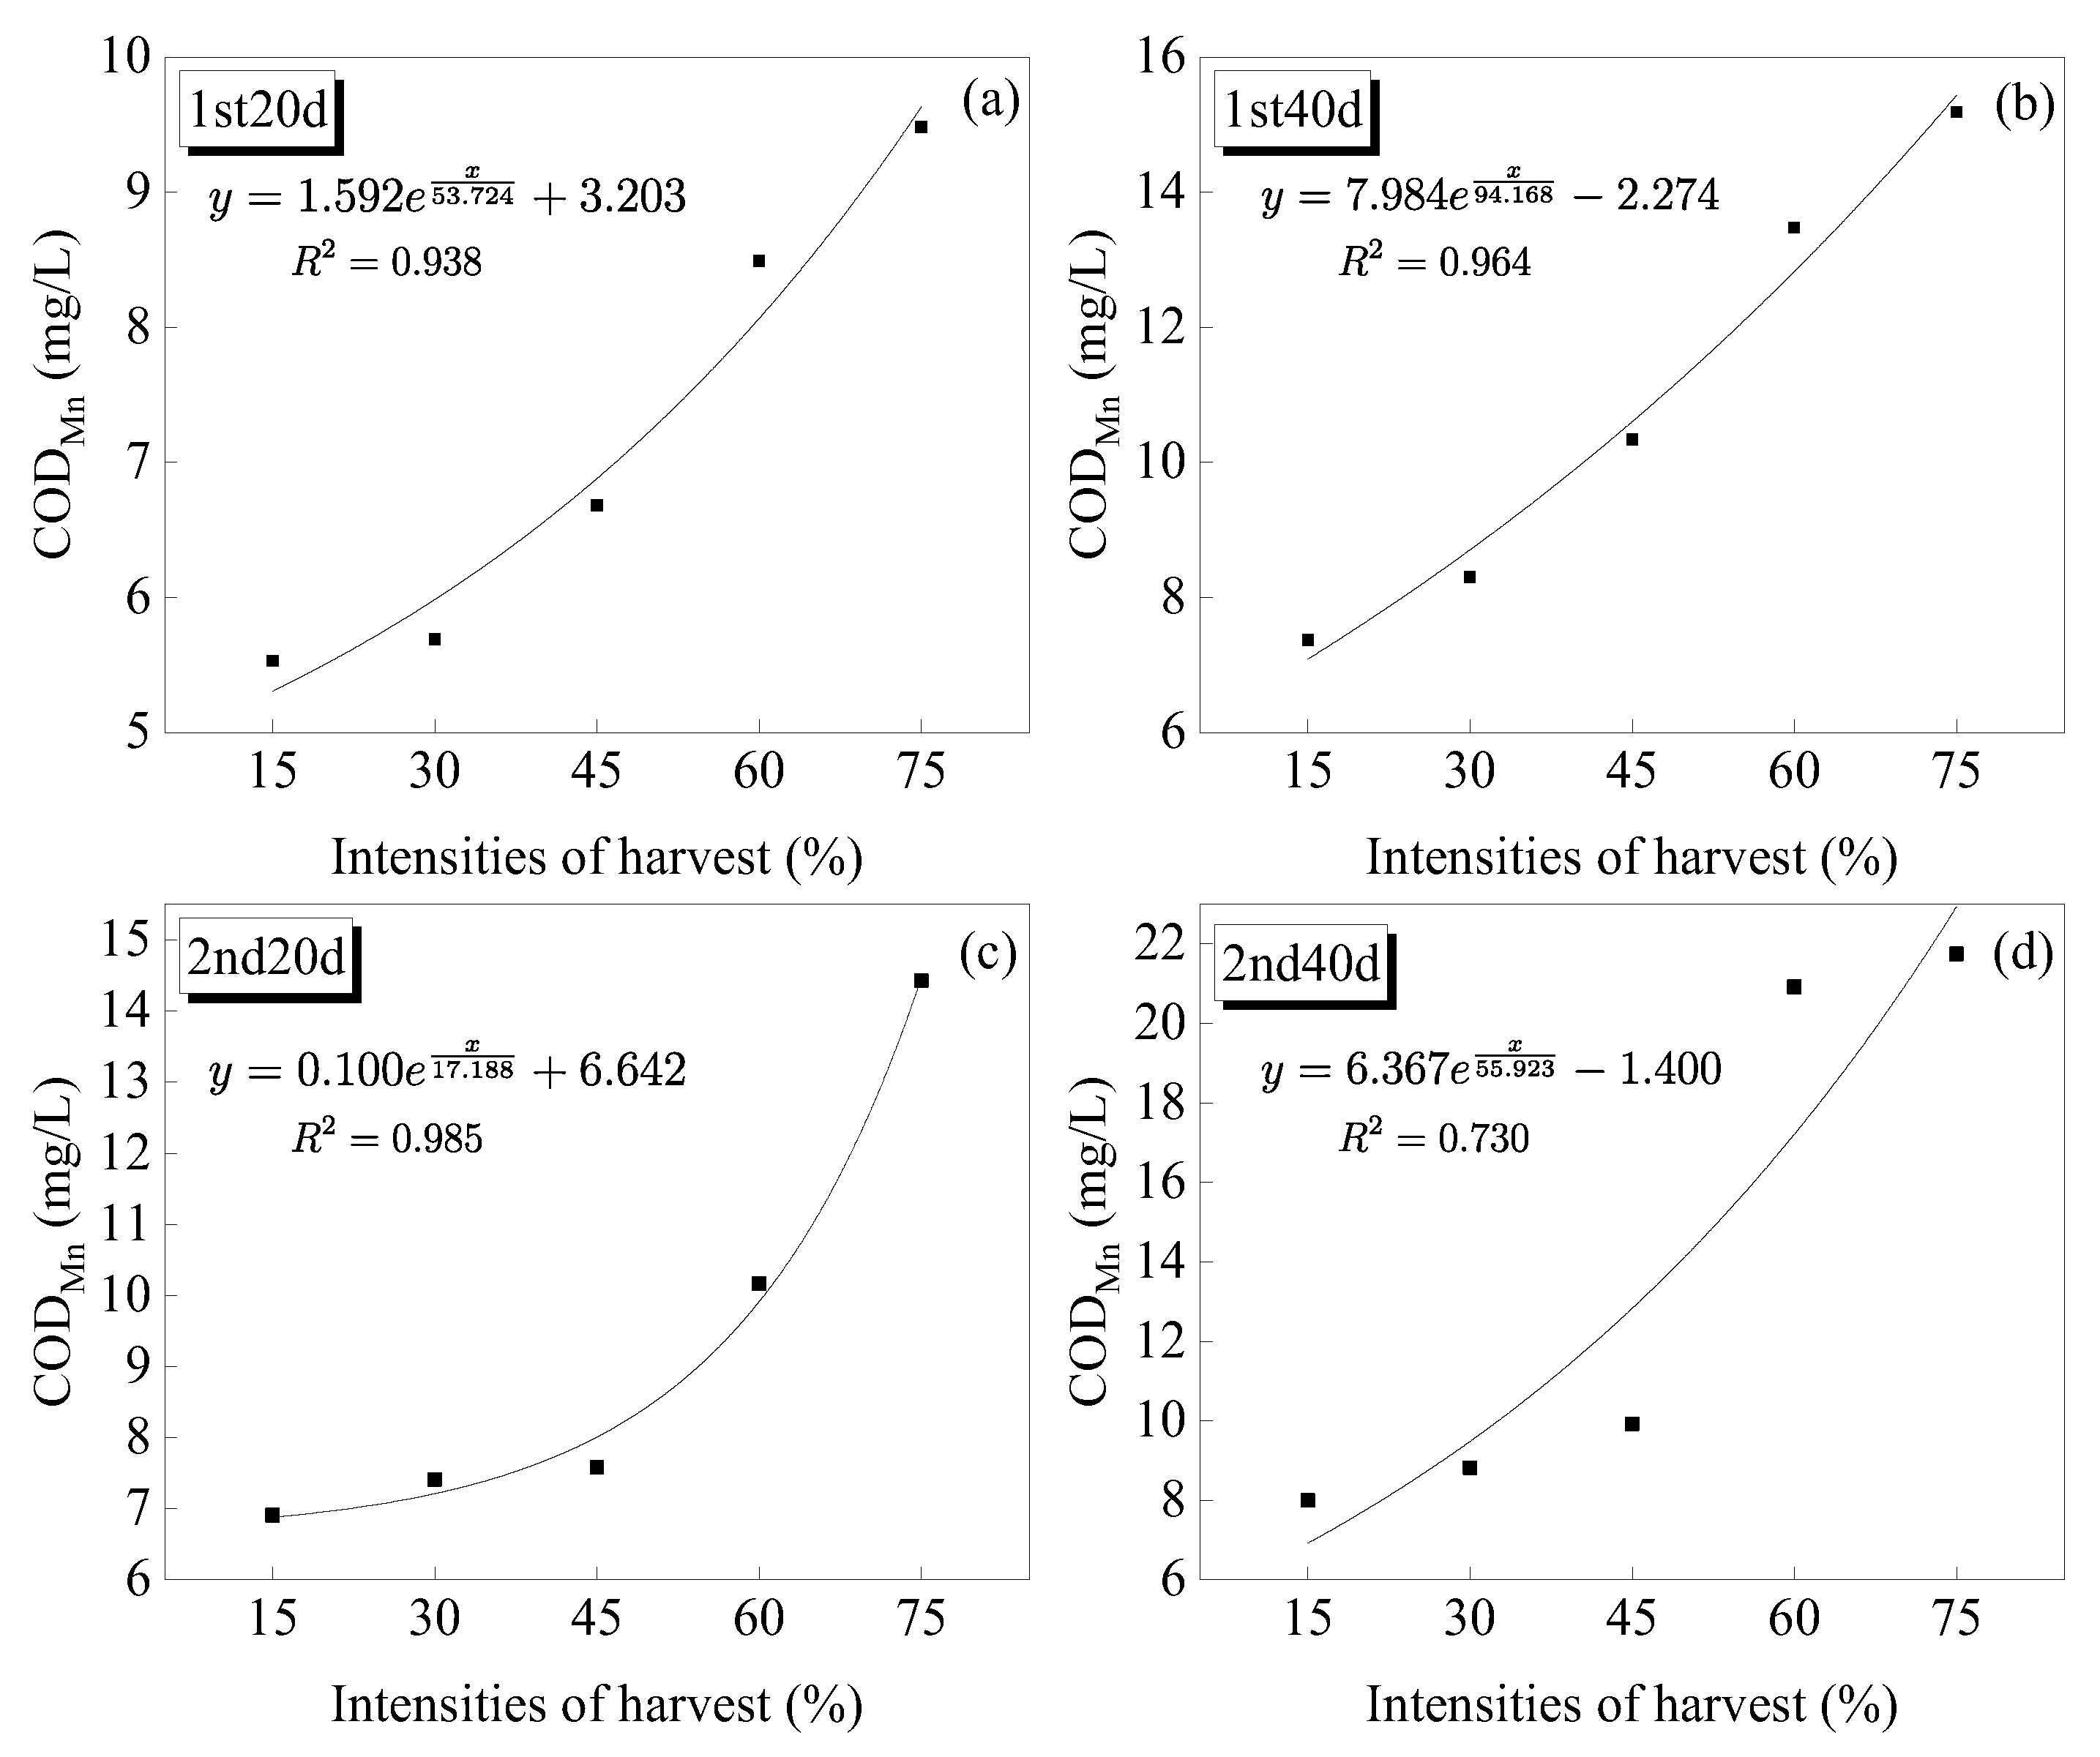
CODMn is an important water quality indicator. Harvesting facilitated algal blooms in the water, which produced large amounts of organic matter through photosynthesis, and was reflected in an immediate increase in the CODMn index, which was also affected by Chl-a. Harvesting increased the turbidity of the water, and the re-released organic matter promoted the consumption of potassium permanganate, which also resulted in the CODMn index being positively related to the harvesting intensity and the trends in algal growth, i.e., the greater the harvesting intensity, the higher the CODMn index (Figure 19). The CODMn index of the harvesting group was higher in September than in August, which may be related to factors such as algal reproduction, temperature conditions, and the growth recovery rate of H. verticillata.

5. Conclusions

The effects of different harvesting intensities on the growth of H. verticillata and the surrounding water quality were studied in harvesting experiments. The main conclusions were as follows:
(1)
Harvesting significantly affected the growth of H. verticillata, limiting the formation of the canopy. H. verticillata could recover quickly after harvesting at medium and low intensities but the recovery rate of H. verticillata was significantly slower after two high-intensity harvests.
(2)
Harvesting reduced the accumulation of H. verticillata biomass. Under medium and high-intensity harvesting, H. verticillata plant height and the number of branches decreased significantly, resulting in lower final biomass. This finding indicates that medium and high-intensity harvesting could effectively restrict the accumulation of H. verticillata biomass.
(3)
Harvesting had a significant effect on water quality. Low-intensity H. verticillata harvesting improved the water quality, while medium and high-intensity harvesting of H. verticillata significantly deteriorated the water quality.
(4)
Phytoplankton increased significantly in the high-intensity harvesting group, and the CDOM concentrations varied with the increase in phytoplankton. Medium and low-intensity harvesting effectively suppressed the growth and reproduction of phytoplankton and the CDOM concentration during the peak H. verticillata growth period.

Author Contributions

Conceptualization and methodology, X.W. and X.G.; experiment, M.Z. and X.Y.; software and figure images, N.W. and X.L.; data curation, Z.L. and M.Z.; writing, S.Z.; review and editing, X.W. and X.G. All authors have read and agreed to the published version of the manuscript.

Funding

This research was funded by the Science and Technology Research Project of Education Department of Hubei Province (No. Q20182502); Graduate Innovative Research Project Construction of Hubei Normal University (No. 20220454); College Students’ Innovative Entrepreneurial Training Plan Program (No. D202105061637055045, No. D202205122303594741).

Data Availability Statement

The datasets generated and analyzed during this study are available from the corresponding author upon request.

Conflicts of Interest

The authors declare no conflict of interest.

References

  1. Fu, Y.S.; He, H.; He, H.Y.; Ma, L.S.; Su, Y.L.; Liu, Z.W. Effect of addition of lanthanum-modified bentonite (Phoslock) in sediments on growth of Hydrilla verticillata under different water nutrient concentration. J. Lake Sci. 2021, 33, 388–396, (In Chinese with English abstract). [Google Scholar]
  2. Wang, J.J.; Xie, T.; Que, T.Y.; Zhang, S.W.; Qian, X.Q.; Lv, S.P. Dynamics in phosphorus and bacterial community structure as influenced by Vallisneria natans in sediment of Qinhu lake. Chin. J. Ecol. 2022, 10, 413, (In Chinese with English abstract). [Google Scholar]
  3. Bai, G.L.; Zhang, Y.; Yan, P.; Yan, W.H.; Kong, L.W.; Wang, L.; Wang, C.; Liu, Z.S.; Liu, B.Y.; Ma, J.M.; et al. Spatial and seasonal variation of water parameters, sediment properties, and submerged macrophytes after ecological restoration in a long-term (6 year) study in Hangzhou west lake in China: Submerged macrophyte distribution influenced by environmental variables. Water Res. 2020, 186, 116379. [Google Scholar] [PubMed]
  4. Qiu, D.R.; Wu, Z.B.; Liu, B.Y.; Deng, J.Q.; Fu, G.P.; He, F. The restoration of aquatic macrophytes for improving water quality in a hypertrophic shallow lake in Hubei Province, China. Ecol. Eng. 2001, 18, 147–156. [Google Scholar] [CrossRef]
  5. Gao, Y.M.; Yin, C.Y.; Zhao, Y.; Liu, Z.W.; Liu, P.P.; Zhen, W.; Hu, Y.H.; Yu, J.L.; Wang, Z.X.; Guan, B.H. Effects of Diversity, Coverage and Biomass of Submerged Macrophytes on Nutrient Concentrations, Water Clarity and Phytoplankton Biomass in Two Restored Shallow Lakes. Water 2020, 12, 1425. [Google Scholar] [CrossRef]
  6. Wang, J.J.; Xie, T.; Que, T.Y.; Zhang, S.W.; Qian, X.Q.; Lv, S.P. Dynamics of phosphorus concentration and bacterial community structure in sediment of Qinhu Lake as influenced by Vallisneria natans. Chin. J. Ecol. 2022, 41, 1787–1795, (In Chinese with English abstract). [Google Scholar]
  7. Yu, X.H.; Wu, X.D.; Ge, X.G.; Gui, Z.F.; Zhou, M.D.; Bian, L.L.; Liu, L. Effects of harvesting intensity on the growth and water quality of Myriophyllum aquaticum. J. Hydro. 2022, 43, 95–102, (In Chinese with English abstract). [Google Scholar]
  8. Yang, C.T.; Nan, J.; Li, J.H.; Yi, L.; Yu, J.; Wu, J.B.; Shen, X.B. The role of mechanical harvesting on the recession of aquatic vegetation under an extreme water level increase in a eutrophic shallow lake. Environ. Sci. Pollut. Res. 2021, 28, 61682–61695. [Google Scholar] [CrossRef]
  9. Alvarez, J.A.; Becares, E. The effect of vegetation harvest on the operation of a surface flow constructed wetland. Water SA 2008, 34, 645–650. [Google Scholar] [CrossRef] [Green Version]
  10. Xu, W.W.; Hu, W.P.; Deng, J.C.; Zhu, J.M.; Li, Q.Q.; Zhang, H.M. Influence of Harvesting Potamogeton crispus in A Submerged Macrophytes Community on the Growth of Submerged Aquatic Plants and Their Effects on Water Quality. J. Ecol. Environ. Sci. 2015, 24, 1222–1227. [Google Scholar]
  11. Pi, J.C.; Zhu, G.C.; Gong, T.T.; Lu, Y.Z. Dissolved organic matter derived from aquatic plants in constructed wetlands: Characteristics and disinfection byproducts formation. J. Environ. Chem. Eng. 2022, 10, 107991. [Google Scholar] [CrossRef]
  12. Huang, F.Y.; Huang, Y.B.; Jia, J.Z.; Li, Z.P.; Xu, J.F.; Ni, S.; Xiao, Y. Research and engineering application of bypass combined artificial wetlands system to improve river water quality. J. Water. Process. Eng. 2022, 48, 102905. [Google Scholar] [CrossRef]
  13. Paraskevi, M.; Annica, O.; Bjørg, G.H.; Torben, L.L.; Tenna, R. Investigating emergent macrophytes establishment rate and propagation towards constructed wetlands efficacy optimization. Knowl. Manag. Aquat. Ecosyst. 2021, 422, 23. [Google Scholar]
  14. Best, E.P.H. The Impact of Mechanical Harvesting Regimes on the Aquatic and Shore Vegetation in Water Courses of Agricultural Areas of the Netherlands. J. Plant Ecol. 1994, 112, 57–71. [Google Scholar] [CrossRef]
  15. King, D.L.; Burton, T.M. Efficacy of Weed Harvesting for Lake Restoration, 1st ed.; Inland Waters and Lake Restoration: Portland, OR, USA, 1980; pp. 8–12. [Google Scholar]
  16. Zuo, J.C. Several Ecological Problems in Manipulating Submersed Macrophytes by Harvest. Doctoral’s Thesis, University of Chinese Academy of Sciences, Beijing, China, 2006. (In Chinese with English abstract). [Google Scholar]
  17. Yu, H.B.; Yang, Z.J.; Xiao, R.L.; Zhang, S.N.; Liu, F.; Xiang, Z.X. Nitrogen and phosphorus uptake capacity of aquatic plants and harvesting management studies. Acta Pratacul. Sin. 2013, 22, 294–299. [Google Scholar]
  18. Yan, Y.T.; Gu, H.H.; Li, T.Y.; He, C.L.; Yang, Y.H.; Wang, S.; Huang, B.B. Ecological response of Potamogeton crispus management in reclaimed water river. Acta Sci. Circumstantiae 2022, 42, 59–68, (In Chinese with English abstract). [Google Scholar]
  19. Zuo, J.C.; He, F.; Ma, J.M.; Zhou, Q.H.; Zeng, L.; Kong, L.W.; Hu, S.H.; Wu, Z.B. Effects of moderate-intensity harvesting on interspecific competition between Potamogeton crispus and Elodea nuttallii. Chin. J. Ecol. 2014, 33, 2414–2419, (In Chinese with English abstract). [Google Scholar]
  20. Zuo, J.C.; Miao, F.P.; Wang, A.Y.; Zhao, A.F.; Wang, Z.L.; Wu, Z.B. Effects of apex cutting on regrowth of Myriophyllum spicatum cultured in buckets. Chin. J. Ecol. 2009, 28, 643–647, (In Chinese with English abstract). [Google Scholar]
  21. Kohzu, A.; Shimotori, K.; Imai, A. Effects of macrophyte harvesting on the water quality and bottom environment of Lake Biwa, Japan. Limnology 2019, 20, 83–92. [Google Scholar] [CrossRef]
  22. Li, G.X.; Li, Q.Z.; Xue, P.Y.; Yan, C.Z.; Gao, Y.J. Extended Langmuir Models for Cd2+ and Cu2+ Biosorption by Hydrilla verticillata. J. Agro-Environ. Sci. 2010, 29, 145–151, (In Chinese with English abstract). [Google Scholar]
  23. Yan, C.Z.; Zeng, A.Y.; Jin, X.C.; Zhao, J.Z.; Xu, Q.J.; Wang, X.M. Physiological effects of ammonia nitrogen concentrations on Hydrilla verticillata. Acta Ecol. Sin 2007, 27, 1050–1055, (In Chinese with English abstract). [Google Scholar]
  24. Bind, A.; Kushwaha, A.; Devi, G.; Goswami, S.; Sen, B.; Prakash, V. Biosorption valorization of floating and submerged macrophytes for heavy-metal removal in a multi-component system. Appl. Water Sci. 2019, 9, 1–9. [Google Scholar] [CrossRef]
  25. Editional Board of Water and Wastewater Monitoring and Analysis Methods; Ministry of Environmental Protection of the People’s Republic of China (Eds.) Analytical Methods for Water and Wastewater Monitoring, 4th ed.; China Environmental Science Press: Beijing, China, 2002; pp. 107–284. (In Chinese) [Google Scholar]
  26. Zuo, J.C.; Liang, W.; Xu, D.; He, F.; Zhou, Q.H.; Wu, Z.B. The Vegetative Recovery of Hydrilla verticillata Under Several Harvesting Strategies. J. Agro-Environ. Sci. 2011, 30, 1391–1397, (In Chinese with English abstract). [Google Scholar]
  27. Fulkerson, W.J.; Donaghy, D.J. Plant-soluble carbohydrate reserves and senescence—Key criteria for developing an effective grazing management system for ryegrass-based pastures: A review. Aust. J. Exp. Agric. 2001, 41, 261–275. [Google Scholar] [CrossRef]
  28. Wang, H.; Pang, Y.; Liu, S.B.; Ma, X. Research progress on influencing of environmental factors on the growth of submersed macrophytes. Acta Ecol. Sin. 2008, 28, 3958–3968, (In Chinese with English abstract). [Google Scholar]
  29. Li, Q. Influence Mechanism of Environment Factors on the Growth and Development of Submerged Macrophytes. Doctoral’s Thesis, Nanjing Normal University, Nanjing, China, 2007. (In Chinese with English abstract). [Google Scholar]
  30. Chen, W.Y.; Yuan, S.X.; Chen, Z.H. Influence of temperature on the growth of Hydrilla verticillata in the wastewater treatment. Meteorol. Environ. Res. 2011, 39, 4642–4644. [Google Scholar]
  31. Wu, X.D. The Effects of Water Levels and Harvesting on the Growth of Submerged Plants. Doctoral’s Thesis, Nanjing Normal University, Nanjing, China, 2012. (In Chinese with English abstract). [Google Scholar]
  32. Irhayyim, T.; Fehér, M.; Lelesz, J.; Bercsényi, M.; Bársony, P. Nutrient Removal Efficiency and Growth of Watercress (Nasturtium officinale) under Different Harvesting Regimes in Integrated Recirculating Aquaponic Systems for Rearing Common Carp (Cyprinus carpio L.). Water 2020, 12, 1419. [Google Scholar] [CrossRef]
  33. Van, T.K.; Wheeler, G.S.; Center, T.D. Competition between Hydrilla verticillata and Vallisneria americana as influenced by soil fertility. Aquat. Bot. 1999, 62, 225–233. [Google Scholar] [CrossRef]
  34. Denny, P. Sites of Nutrient Absorption in Aquatic Macrophytes. J. Ecol. 1972, 60, 819–829. [Google Scholar] [CrossRef]
  35. Li, K.Y.; Liu, Z.W.; Gu, B.H. Compensatory growth of a submerged macrophyte (Vallisneria spiralis) in response to partial leaf removal: Effects of sediment nutrient levels. Aquat. Ecol. 2010, 44, 701–707. [Google Scholar] [CrossRef]
  36. Gopal, B.; Goel, U. Competition and Allelopathy in Aquatic Plant Communities. Bot. Rev. 1993, 59, 155–210. [Google Scholar] [CrossRef]
  37. Wei, X.F. The influence of Megahbrama amblycephalato the competitive landscape of Vallisneria natans and Hydrilla verticillata. Doctoral’s Thesis, Huazhong Agricultural University, Wuhan, China, 2015. (In Chinese with English abstract). [Google Scholar]
  38. Barko, J.W.; Michael, S.R.; McFarland, D.G.; Chen, R.L. Interrelationships between the growth of Hydrilla verticillata (L.f.) Royle and sediment nutrient availability. Aquat. Bot. 1988, 32, 205–216. [Google Scholar] [CrossRef]
  39. Xu, Z.Q.; Liu, W.; Zhao, J.; Liu, Y.L. Purification and Influence of Submerged Macrophytes on Water Quality of Landscape Water Body Supplied by Reclaimed Water. J. Soil Water Conserv. 2012, 26, 214–219, (In Chinese with English abstract). [Google Scholar]
  40. Grace, J.B. The adaptive significance of clonal reproduction in angiosperms: An aquatic perspective. Aquat. Bot. 1993, 44, 159–180. [Google Scholar] [CrossRef]
  41. Cheng, N.N.; Zhu, W.; Zhang, J. Propagation and transplanting techniques for submerged macrophytes in heavily polluted water bodies. Water Resour. Prot. 2004, 20, 8–11. [Google Scholar]
  42. Yu, S.Q. Growth and reproductive strategies of Vallisneria natans and Hydrilla verticillata under eutrophic water. Doctoral’s Thesis, Wuhan University, Wuhan, China, 2019. (In Chinese with English abstract). [Google Scholar]
  43. Ge, X.G.; Wang, G.X.; Lu, Y.C. A study on the regenerative capacity of four submerged plant species with broken branches. J. Hydro. 2009, 30, 23–28. [Google Scholar]
  44. Cui, X.H.; Xiong, B.H.; Pu, Y.H.; Li, W.; Chen, J.K.; He, G.Q. Comparative study of regeneration and colonization ability in five submersed macrophytes. Acta Phytoecol. Sin. 2000, 24, 502–505. [Google Scholar]
  45. Ding, L.; Li, L.J.; Li, J.F.; Li, W.; Chen, D.Z.; Chen, X.Q. Experimental studies on purification of nitrogen, phosphorus and suspended solids in raw water from an artificial source lake by submerged macrophytes. J. Ecol. Environ. Sci. 2018, 27, 122–129. [Google Scholar]
  46. Li, J.H.; Yang, X.Y.; Wang, Z.F.; Shan, Y.; Zheng, Z. Comparison of four aquatic plant treatment systems for nutrient removal from eutrophied water. Bioresour. Technol. 2015, 179, 1–7. [Google Scholar] [CrossRef]
  47. Wang, S.R. The distribution pattern and ecological restoration technology of aquatic plants in a eutrophic water landscape belt. Water Supply 2022, 22, 860–873. [Google Scholar] [CrossRef]
  48. Fu, G.X.; Cao, W.Z.; Tao, J. Purification Effect of 12 Aquatic Plants on Eutrophic Water. Environ. Sci. Technol. 2021, 44, 308–315, (In Chinese with English abstract). [Google Scholar]
  49. Zhao, M.Y.; Xiong, J.Q.; Zheng, Y.C.; Ren, S.H.; Wang, X.C. Long-term effects of plant harvesting on pollutant removal in artificial wetlands. Technol. Water Treat. 2019, 45, 112–116. [Google Scholar]
  50. Zheng, Y.; Dzakpasu, M.; Wang, X.; Zhang, L.; Ngo, H.H.; Guo, W.; Zhao, Y. Molecular characterization of long-term impacts of macrophytes harvest management in constructed wetlands. Bioresour. Technol. 2018, 268, 514–522. [Google Scholar] [CrossRef] [PubMed]
  51. Chen, Q.J. Study on Water Improvement Effect on Polluted Water by Submerged Macrophytes. Master’s Thesis, Hohai University, Nanjing, China, 2005. (In Chinese with English abstract). [Google Scholar]
  52. Yao, J.; Yang, F.; Zhang, Y.M.; Zhu, Y.M.; Gao, Y.X.; Yin, J.; Du, C.; Ba, C.C.; Li, D.L. Research on the dissolved organic matter of Hydrilla verticillata’s leaf and stem decomposition. China Environ. Sci. 2017, 37, 4294–4303, (In Chinese with English abstract). [Google Scholar]
  53. Yu, Z.F.; Xu, D.P.; Wang, G.X.; Zhou, Y.F.; Wu, X.D.; Zhang, M.Y. Effects of decline phase of Vallisneria natans on phosphorus transportation between water and sediment. J. Lake Sci. 2016, 28, 94–104, (In Chinese with English abstract). [Google Scholar]
  54. Nakamura, K.; Kayaba, Y.; Nishihiro, J.; Takamura, N. Effects of submerged macrophytes on water quality and biota in large-scale experimental ponds. Landsc. Ecol. Eng. 2008, 4, 1–9. [Google Scholar] [CrossRef]
  55. Verhofstad, M.J.J.M.; Poelen, M.D.M.; Van Kempen, M.M.L.; Bakker, E.S.; Smolders, A.J.P. Finding the harvesting frequency to maximize nutrient removal in a constructed wetland dominated by submerged aquatic plants. Ecol. Eng. 2017, 106, 423–430. [Google Scholar] [CrossRef]
  56. Xiao, X.; Lou, L.P.; Li, H.; Chen, Y.X. Algal control ability of allelopathically active submerged macrophytes: A review. Chin. J. Appl. Ecol. 2009, 20, 705–712, (In Chinese with English abstract). [Google Scholar]
  57. Yao, Y.; He, F.; Hu, S.H.; Kong, L.W.; Liu, B.Y.; Zeng, L.; Zhang, L.P.; Wu, Z.B. Effects of allelopathy of submerged macrophytes on the phytoplankton community collected from the west part of the West Lake wetland in Hangzhou, China. Acta Ecol. Sin. 2016, 36, 971–978, (In Chinese with English abstract). [Google Scholar]
  58. Lv, J. Study on the Influential Factors of phytoplankton in Shallow Lakes and Restoration Assessment for Aquatic Ecosystem. Doctoral’s Thesis, Huazhong University of Science and Technology, Wuhan, China, 2012. (In Chinese with English abstract). [Google Scholar]
  59. Deng, P. Studies on Allelopathic Effects of Three Submerged Macrophytes on Phytoplankton. Doctoral’s Thesis, University of Chinese Academy of Sciences, Beijing, China, 2007. (In Chinese with English abstract). [Google Scholar]
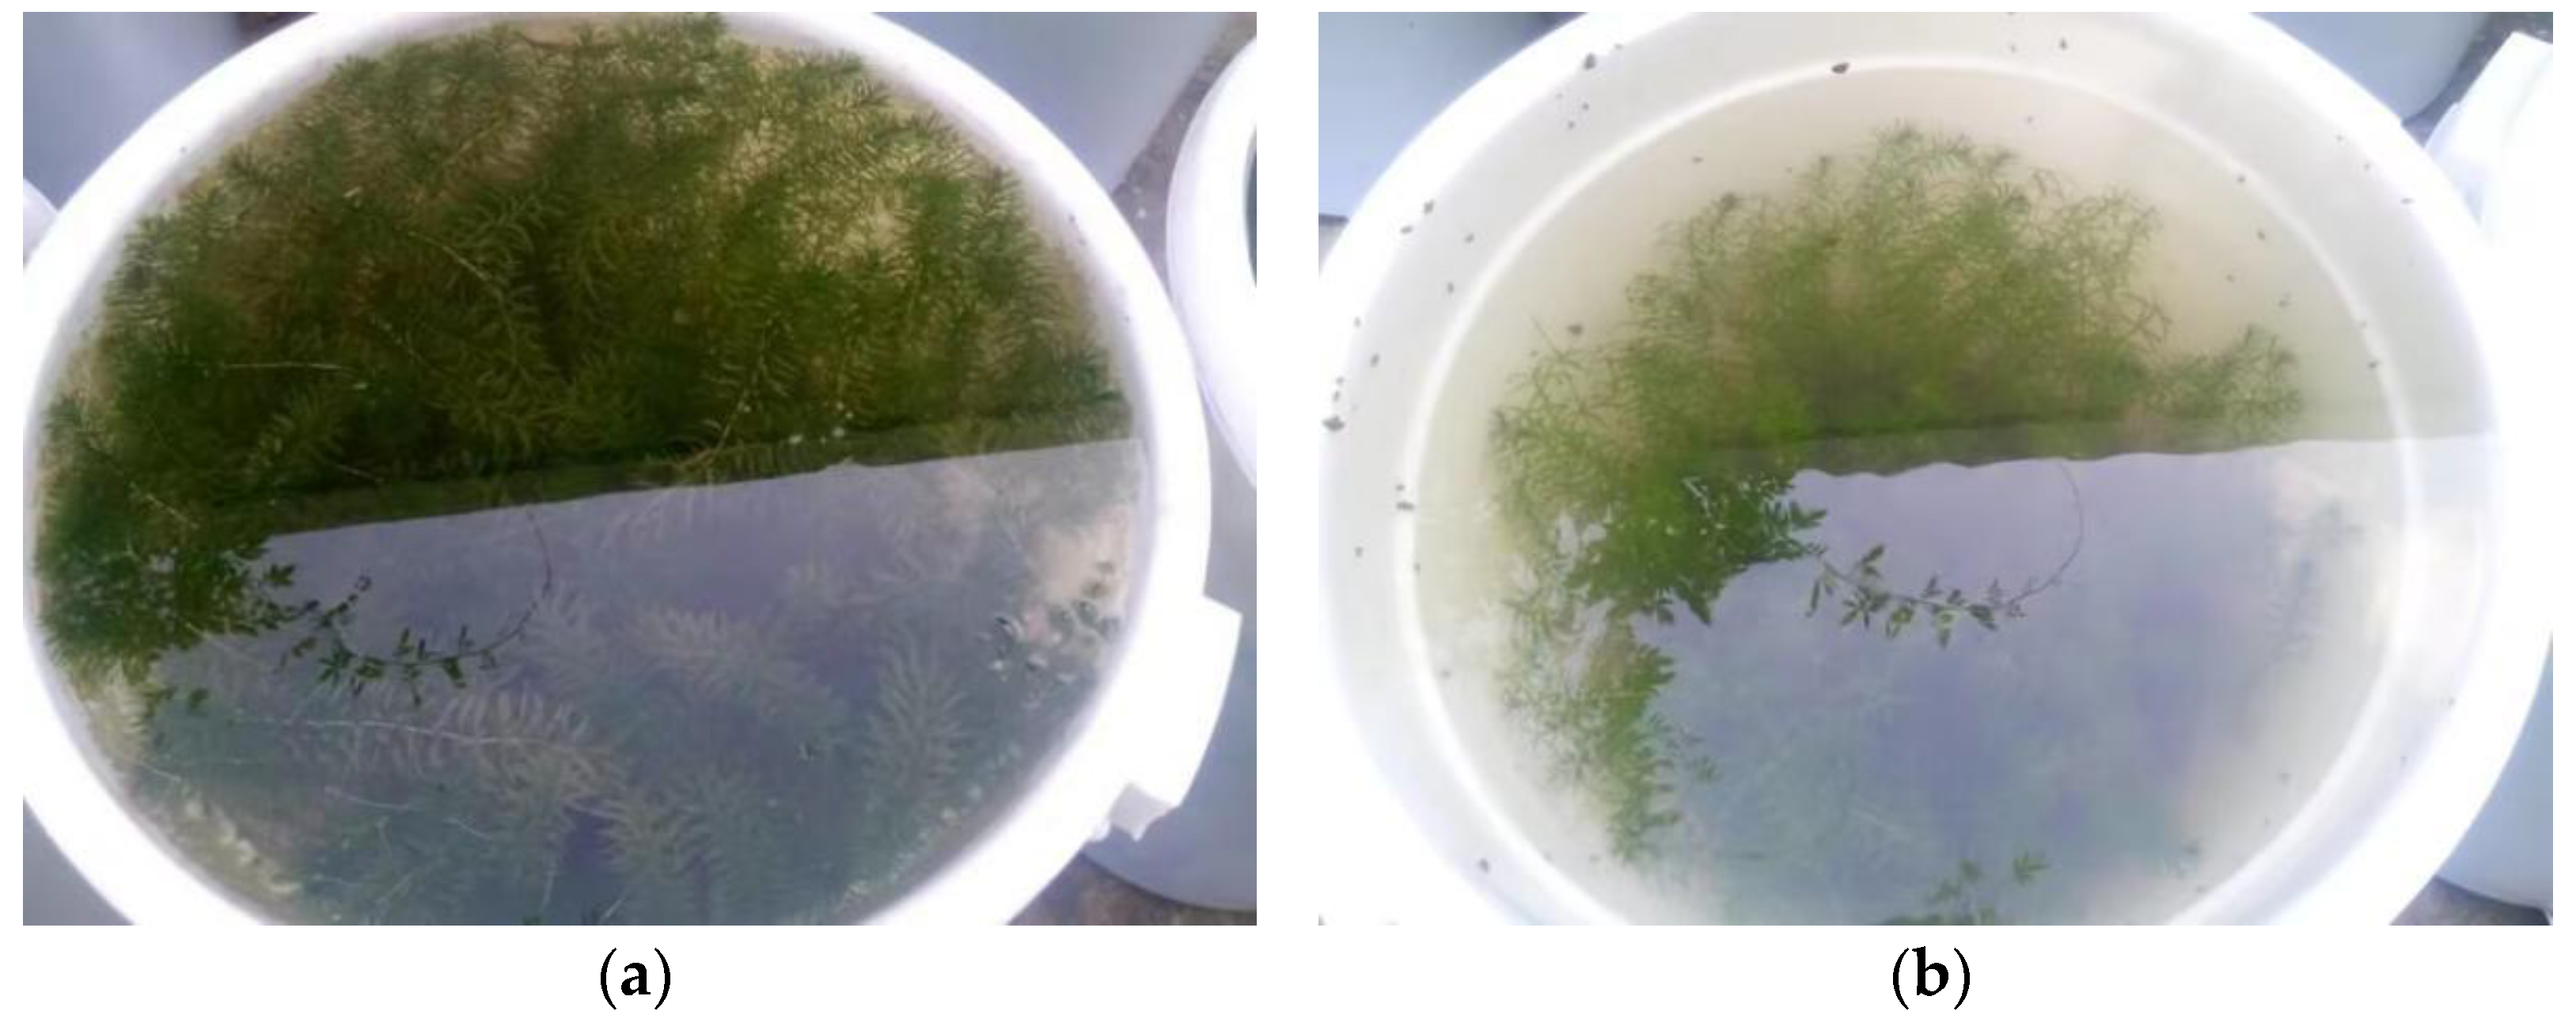
Figure 1. Diagram of the H. verticillata experimental growth process. (a,b) show H. verticillata at different harvesting intensities.
Sustainability 14 15390 g001
Figure 2. Branch recovery and the final H. verticillata plant height under different harvesting intensities. The bar graph represents plant height, the line graph represents the recovery rate of branches, and the error bars represent the standard deviations. (ac) indicates the H. verticillata rate of branch recovery and plant height under different harvesting intensities on day 20 and day 40 after the first harvest, and day 40 after the second harvest, respectively.
Sustainability 14 15390 g002
Figure 3. H. verticillata biomasses under different harvesting intensities. Error bars represent standard deviations. (a,b) denotes the H. verticillata dry weight removal under different harvesting intensities after the first and second harvests, respectively. (c) denotes the H. verticillata final biomass under different harvesting intensities after the first and second harvests.
Sustainability 14 15390 g003
Figure 4. The number of H. verticillata branches under the different harvesting intensities.
Sustainability 14 15390 g004
Figure 5. The number of H. verticillata winter buds under the different harvesting intensities.
Sustainability 14 15390 g005
Figure 6. Suspended solids (SS) concentrations in water under different H. verticillata harvesting intensities. Error bars represent standard deviations. (ac) indicates the suspended solids concentrations in the water under different harvesting intensities on day 4 and day 20 after the first harvest, and day 5 after the second harvest, respectively.
Sustainability 14 15390 g006
Figure 7. TN concentrations in water with H. verticillata harvested at different intensities. Error bars represent standard deviations.
Sustainability 14 15390 g007
Figure 8. TP concentrations with H. verticillata harvested at different intensities. Error bars represent standard deviations.
Sustainability 14 15390 g008
Figure 9. PO43-P concentrations in the water of H. verticillata harvested at different intensities. Error bars represent standard deviations.
Sustainability 14 15390 g009
Figure 10. CODMn index of the water with H. verticillata harvested under different intensities. Error bars represent standard deviations.
Sustainability 14 15390 g010
Figure 11. CDOM concentrations in water of H. verticillata harvested at different intensities. Error bars represent standard deviations.
Sustainability 14 15390 g011
Figure 12. Chl-a concentrations in water of H. verticillata harvested at different intensities. Error bars represent standard deviations.
Sustainability 14 15390 g012
Figure 13. Relationship of harvesting intensity with plant height and the number of branches. (a,b) (c) indicate relationship between harvesting intensity and H. verticillata plant height on day 20, day 40 after the first harvest, and day 40 after the second harvest, respectively. (d) indicates the relationship between harvesting intensity and H. verticillata number of branches.
Sustainability 14 15390 g013
Figure 14. Relationships of harvesting intensity with biomass and number of winter buds in H. verticillata. (a,b) indicates the relationship between harvesting intensity and H. verticillata dry weight removal after the first and second harvests. (c) indicates the relationship between harvesting intensity and H. verticillata final biomass. (d) indicates the relationship between harvesting intensity and H. verticillata winter bud number.
Sustainability 14 15390 g014
Figure 15. Relationship between harvesting intensity of H. verticillata and SS. (ac) indicate the relationship between harvesting intensity of H. verticillata and suspended solids on day 4 and day 20 after the first harvest, and day 5 after the second harvest, respectively.
Sustainability 14 15390 g015
Figure 16. Relationship between harvesting intensity of H. verticillata and TN, TP, and PO43-P in the water. (ac) indicates relationship between harvesting intensity of H. verticillata and TN in the water on day 4 and day 40 after the first harvest, and day 20 after the second harvest, respectively. (d,e) indicate the relationship between harvesting intensity of H. verticillata and TP in the water on day 4 after the first harvest, and day 40 after the second harvest. (f) indicates the relationship between harvesting intensity of H. verticillata and PO43-P in water on day 20 after the second harvest.
Sustainability 14 15390 g016
Figure 17. Relationship between harvesting intensity of H. verticillata and water Chl-a. (ad) indicate the relationship between harvesting intensity of H. verticillata and Chl-a on day 24 and day 40 after the first harvest, and day 20 and day 40 after the second harvest, respectively.
Sustainability 14 15390 g017
Figure 18. Relationship between harvesting intensity of H. verticillata and phytoplankton and CDOM.
Sustainability 14 15390 g018
Figure 19. Relationship between harvesting intensity of H. verticillata and the CODMn index. (ad) indicate the relationship between harvesting intensity of H. verticillata and the CODMn index on day 20 and day 40 after the first harvest, and day 20 and day 40 after the second harvest, respectively.
Sustainability 14 15390 g019
Table 1. Measurement methods for the water quality indicators.
Measurement IndicatorsMeasurement Methods
TNAlkaline potassium persulfate oxidation-UV spectro photo metric method
TPPotassium persulfate digestion method
PO43-PAmmonium molybdate spectrophotometry
CODMnAcidic method
Chl-a90% acetone extraction method
CDOMSpectral coefficient absorption method
SSGravimetric method
TN: total nitrogen; TP: total phosphorus; PO43-P: orthophosphate; CODMn: permanganate index; Chl-a: chlorophyll a; CDOM: chromophoric dissolved organic matter; SS: suspended matter.
Publisher’s Note: MDPI stays neutral with regard to jurisdictional claims in published maps and institutional affiliations.