Article

Analysis of Wind Turbine Distances Using a Novel Techno-Spatial Approach in Complex Wind Farm Terrains

1
Faculty of Mechanical Engineering, University of Prishtina “Hasan Prishtina”, 10 000 Prishtina, Kosovo
2
Faculty of Mechanical Engineering, University Ss Cyril and Methodius, 1000 Skopje, North Macedonia
*
Author to whom correspondence should be addressed.
Sustainability 2022, 14(20), 13688; https://doi.org/10.3390/su142013688
Submission received: 8 August 2022 / Revised: 23 September 2022 / Accepted: 26 September 2022 / Published: 21 October 2022

Abstract

:
Among the current challenges facing the energy sector is finding environmentally friendly and high-performance forms of energy generation. One such form of energy generation is from the wind. In addition to the fluctuations that cause changes in the generated energy, another factor that significantly affects the overall efficiency of wind farms is the distance between the turbines. In that context, a distance of at least three diameters (3D) onwards is necessary to enable a stable operation. This is more difficult to implement for mountainous terrain due to the terrain configuration’s influence, the turbine units’ positioning, and the mutual influence resulting from their position in the area under consideration. This work investigates the interdependence of the terrain features, the placement of ten turbines in different scenarios, and the impact on the overall efficiency of the wind farm. The place where the wind farm is considered is in Koznica, a mountainous area near Prishtina. An analysis has been carried out for two-diameter (2D), three-diameter (3D), and five-diameter (5D) turbine blade spacing for turbines with a rated power of 3.4 MW. The study considers placement in the following forms: Arc, I, L, M, and V. The results show that for 2D distance layout, the capacity factors for Arc, I, L, M, and V placements have the values: 32.9%, 29.8%, 31.1%, 30.6%, and 37.1%. For the 3D distance, according to these scenarios, the capacity factor values are: 29.9%, 30.8%, 30.4%, 29.3%, and 35.6%. For the longest distance, 5D, the capacity factor values are: 28.9%, 29.9%, 29.4%, 27.6%, and 30.6%. The value of the capacity factor for an optimal layout; is achieved at 39.3%.

1. Introduction

With the current energy crisis intensifying, the tendency for greater energy production from renewable sources has increased. Therefore, in addition to building power plants (whether wind, water, or solar), an essential point for consideration is their optimisation [1]. Wind turbines are usually organised in the form of wind farms [2]. The total power output from a wind farm is less than the theoretically calculated value for the same operating conditions [3] due to some negative phenomena affecting energy output. This effect depends on the terrain’s topography and the turbines’ placement [4]. The construction of a wind farm is a process that requires optimisation since it should be as cost-effective as possible. Optimising wind farms to increase the energy produced, among other things, means increasing distances between the turbines [5]. Complex reliefs have constant ups and downs, sometimes much more pronounced in certain terrain [6]. Therefore, in some specific cases, the change is observed in the intensity and direction of the spread of air masses [6]. In the context of implementing the optimisation of the placement of wind turbines, flat terrains are more suitable [7]. This situation becomes difficult in the case of complex terrains. Among others, one of the problems in complex terrain is the possible maintenance of the same elevation of turbines throughout the wind farm [8]. This relates to the imbalances in the terrain, expressed by the ruggedness index of the site, which causes changes in the wind speed and contributes to turbulence [9,10]. Due to the impossibility of accessing, in detail, the numerous information about topography and roughness to study this impact, different software tools have been developed [11]. Some are linear models, and some are in the form of three-dimensional simulations of the processes [12]. Despite providing almost the same results, the difference is in the appearance of the processes, figuratively [13]. WAsP software, a linear model for predicting capacity factor and energy yield, is used in this study. The energy output from a selected farm always depends on the wake effect because of the mutual interaction of wind turbines in the farm [14]. The wake effect was described through the expressions of N.O. Jensen in 1983 and has been continuously improved for different situations [15]. Analysis from [16] study shows the case of optimising the placement of 5 turbines in a specific terrain and the role played by the wake effect in each realised scenario. The study further shows significantly improved efficiency when optimising the location of the turbines on the study farm in Jordan. Another study undertaken in [17] for the same place, Jordan, shows a comparison of the study through the analysis carried out by GIS, to enable the exact location of the turbines to be defined. The basic reason for achieving this optimisation lies in the increase of the country’s GDP, because the farm under consideration has a considerable capacity. The paper [18] compares the main literature on experimental and theoretical studies regarding atmospheric boundary layers’ wind turbines’ interaction in specified terrains (in specified wind farms), and the impact on the feasibility of relevant wind farms. In [19], the authors show a very simple case study when using a VAWT that is placed on a flat and homogeneous ground. A further work [20] presents the analysis of the interaction process between all the turbines in a wind farm in the function of the wake effect. Furthermore, in the paper [21], the authors have come to the conclusion that the wake effect must also be considered to have a more accurate determination of the annual energy that can be produced by a wind farm. The role played by the placement of turbines in the wake effect is large and has a decisive role in forecasting [21]. This phenomenon should be considered during the optimisation of wind turbine placement. Based on the work [22], it can be concluded that the wind farm layout optimisation process can be defined as finding the turbine positions that maximise the expected power production. As shown in studies undertaken in [23,24], if the wind farm uses different capacities of wind turbines, which correspond with different diameters of swept area, it will improve the wind farm efficiency and layout optimisation, as well. The authors in the paper [25] describe the hybrid optimisation strategy used to minimise the LCOE according to the increase in the energy produced at the output. In all the reviewed papers, the wake effect, caused as a result of the proximity of the turbines or bad placement in the respective farms, was taken into account, but mostly the study was in flat terrain and placement at unique distances. Other studies carried out for non-flat terrains have been undertaken without considering the optimal placement that is a function of the elevation of each turbine. Therefore, a new configuration is proposed that (in addition to the distance) also takes into account the geodetic height, because in this way the wake effect will be minimised. The scenarios come with some limitations, such as the area under study and the potential for exploitation. Given that the conservation of distance and the actual energy at the output require accurate parameters, a specific type of turbine is considered. The research aims to create a methodology with an optimisation model for a wide range of wind farms, especially for those in mountainous regions, which are more complex in terms of terrain, and in Kosovo, there is only such terrain. The section that refers to the study’s methodology is dedicated to the experimental part of the study, as this is crucial in the research, because the testing is planned to be carried out in different cases, i.e., for different distances between wind turbines, from 2D, through 3D to 5D. This paper is organised according to the following parts. Initially, the data for the realised measurements are given. Then the terrain data. Further, the data for the scenarios considered for implementation in this location are shown and compared to the results, followed by the discussion, conclusion, and outlook for future work.

2. Methodology

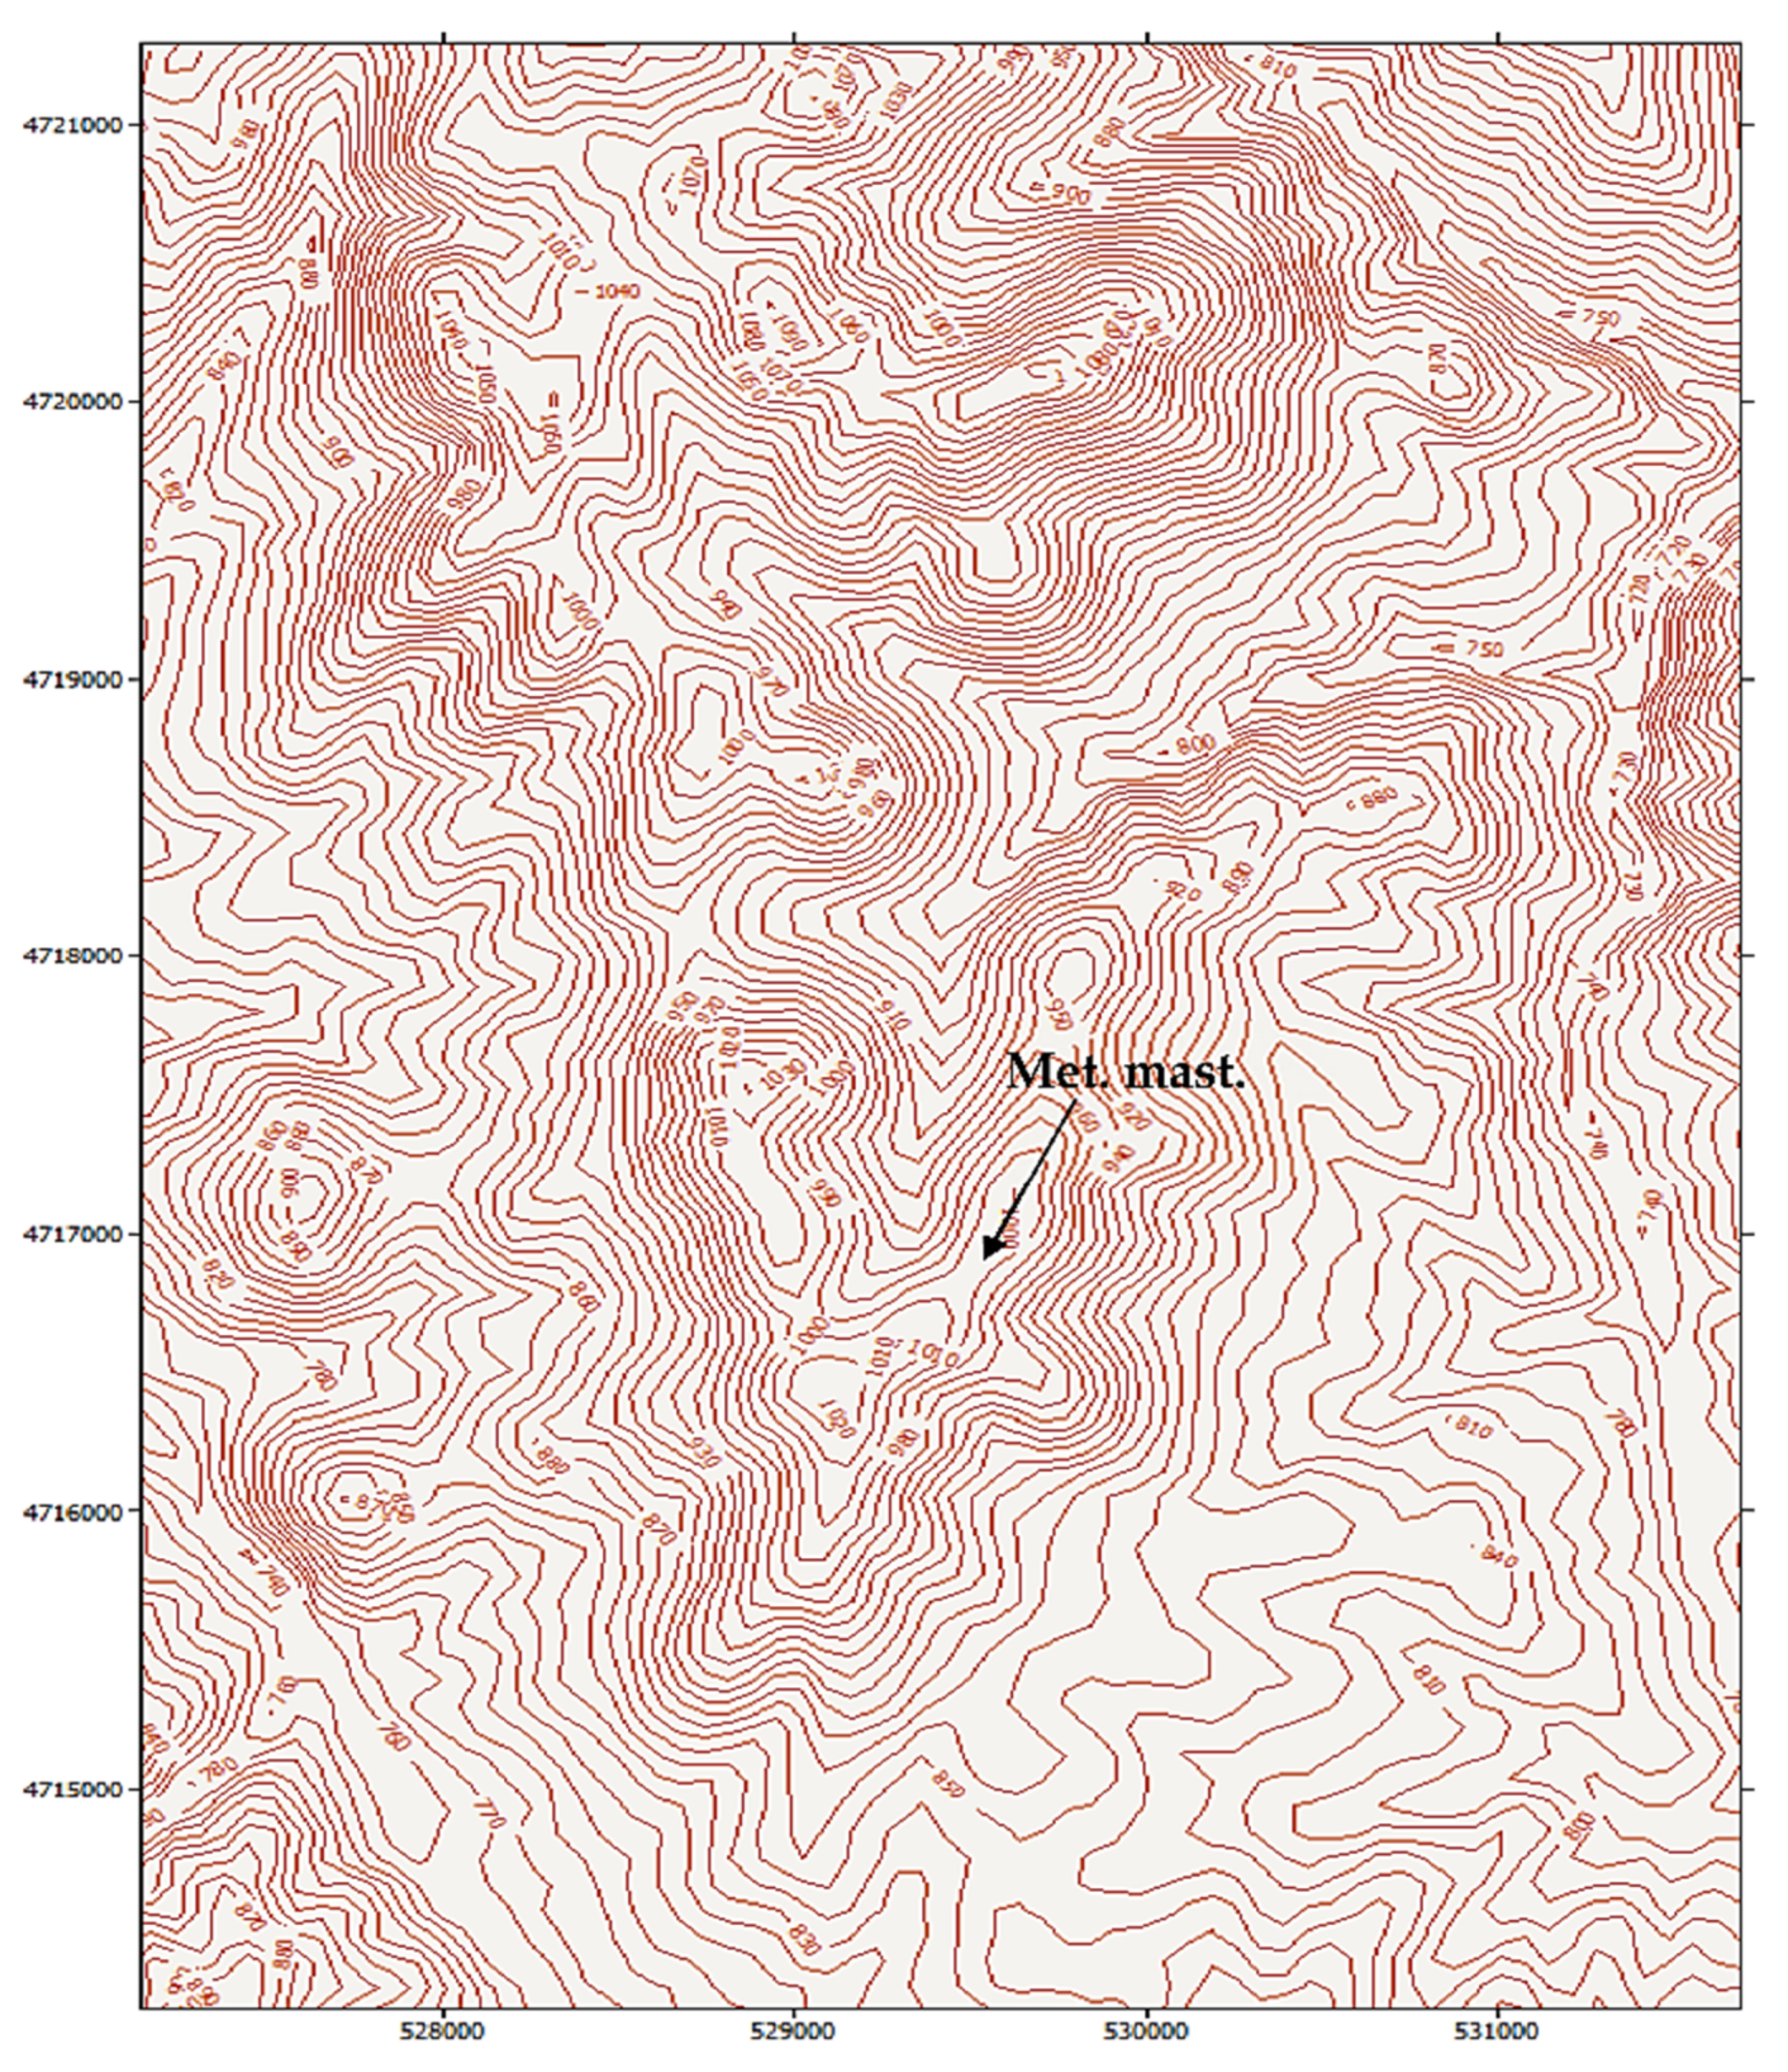
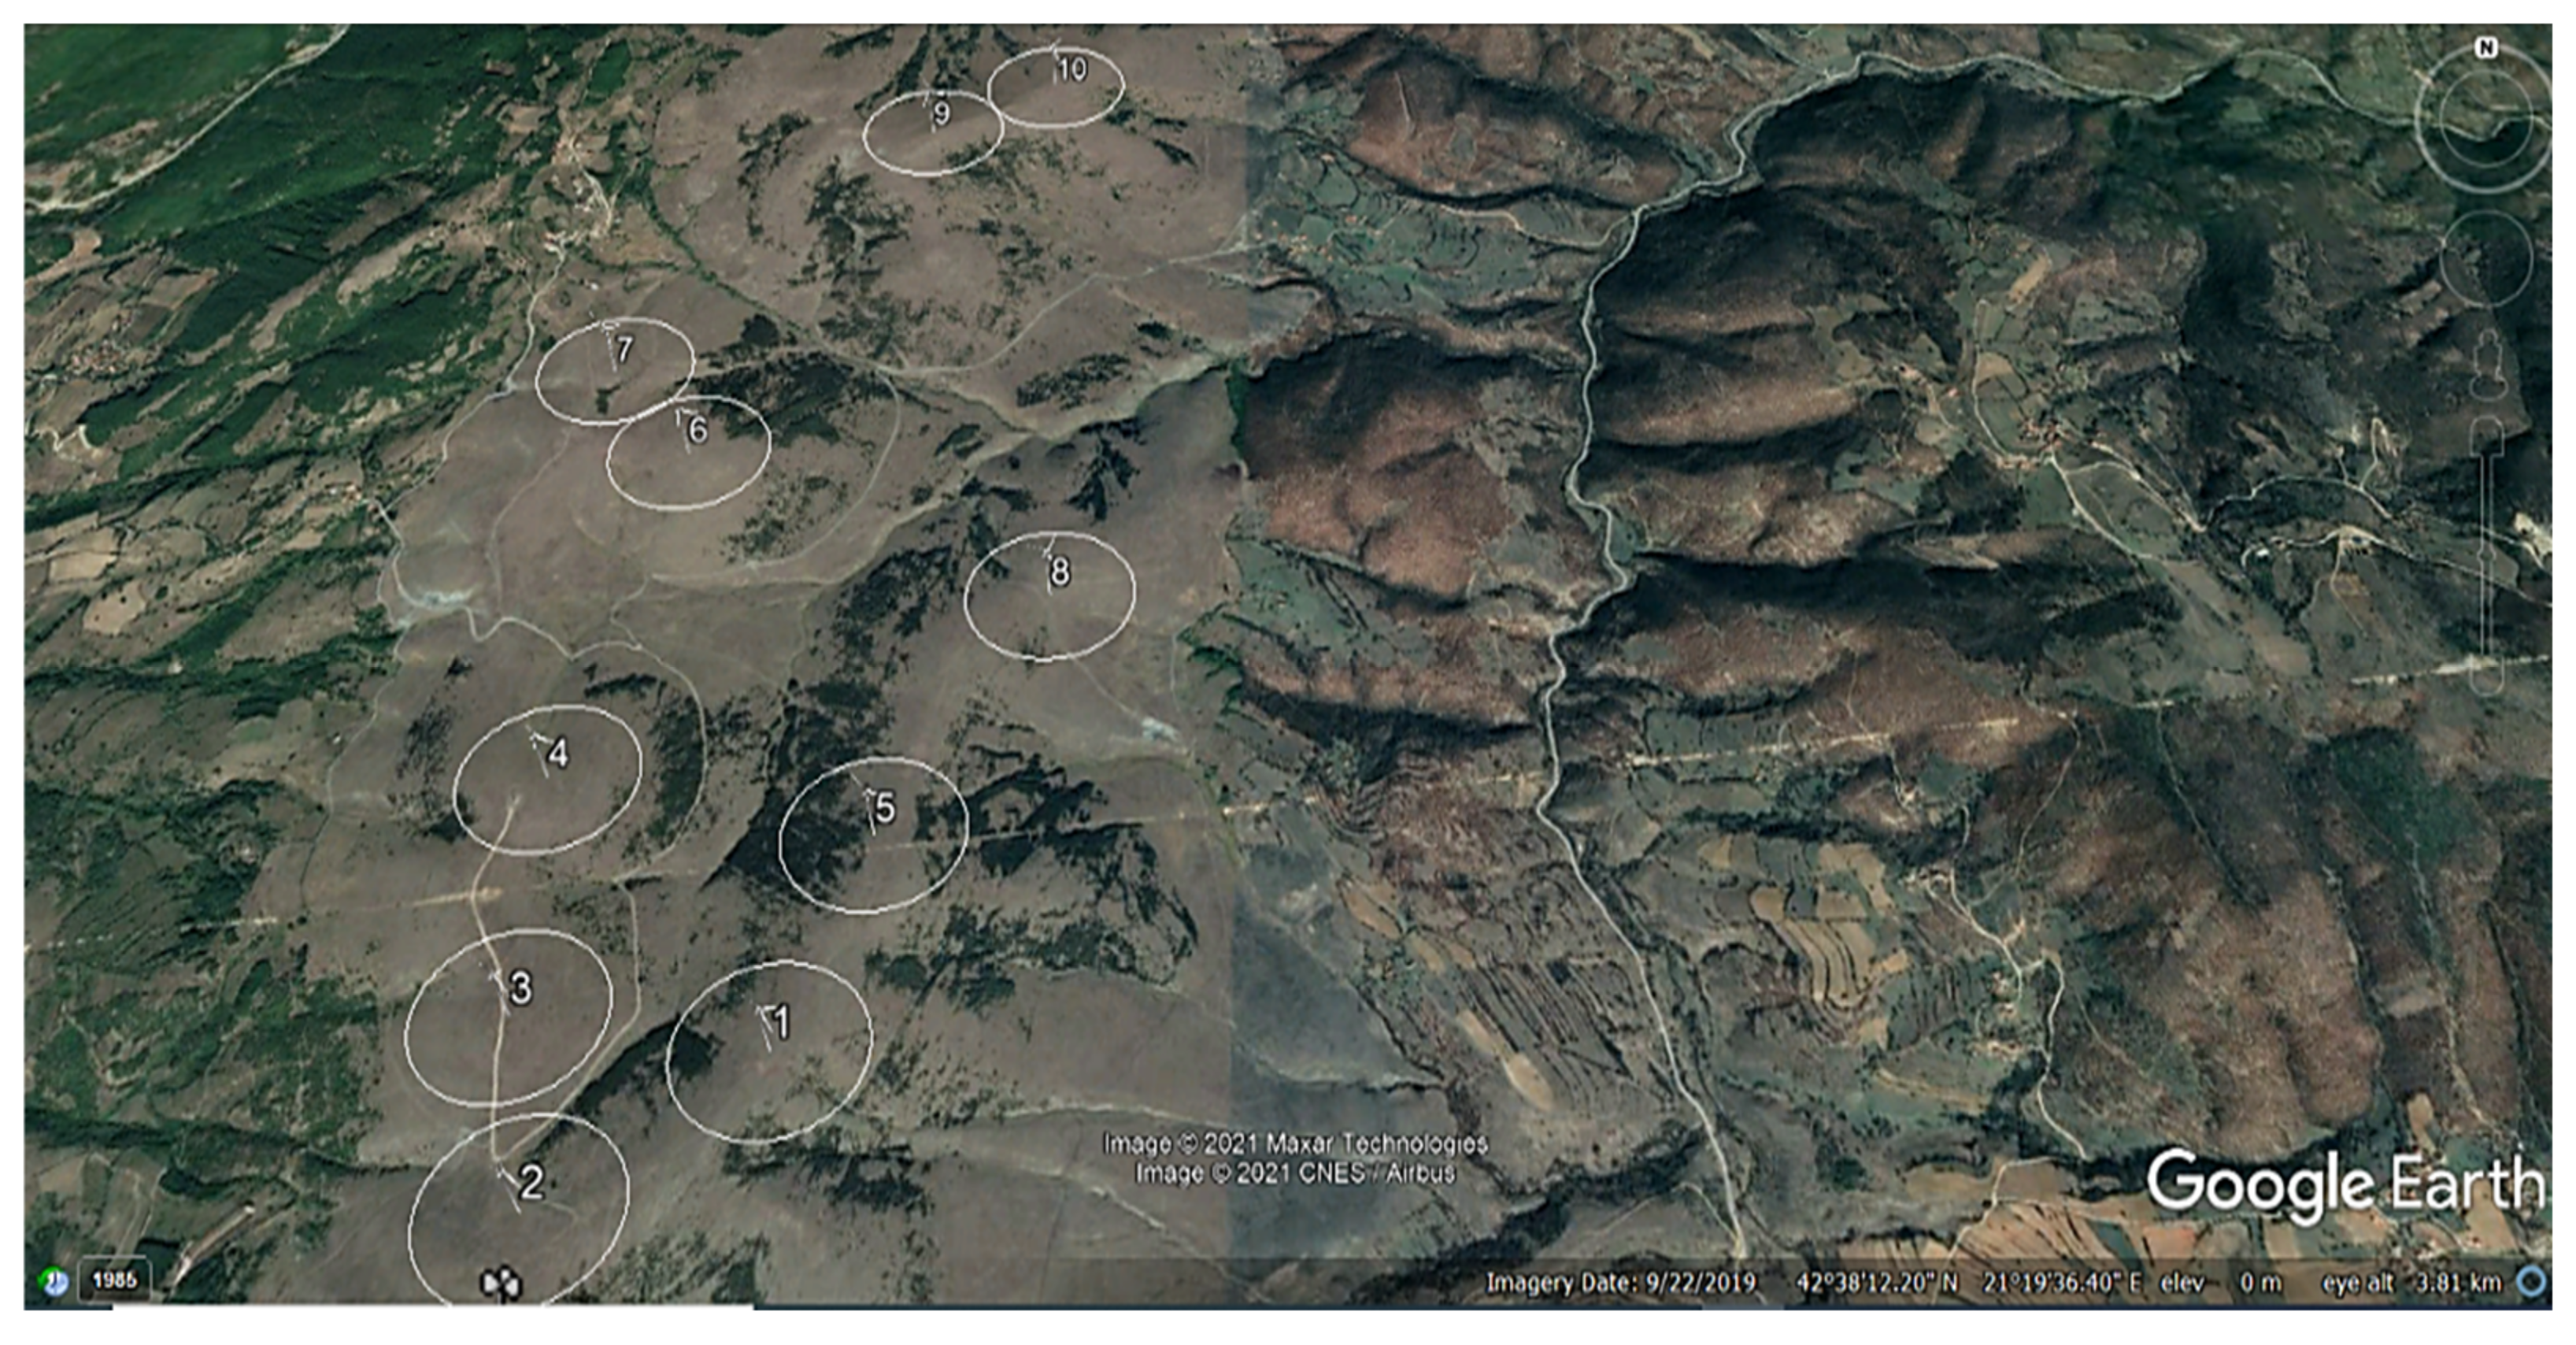
2.1. Description of the Site

In this study, the terrain considered for a possible wind farm is in Koznica (42°39′32″ N 21°22′30″ E). The target site can be characterised as moderately complex, in terms of terrain topography. The space provided for the construction of a WPP comprises the periphery of rounded hills. The altitude at the target location varies from 980 m to 1070 m. The ridges are rounded, so vortices typical of an escarpment are not expected to occur, as shown in Figure 1.
The terrain is mountainous and the number of turbines taken for the study is 10. The turbines taken for analysis have approximate capacities, and the farm’s maximum capacity is 35 MW. Measurements of speed, standard deviation, and wind direction were made at four heights, starting from 40, 60, 80, to 84 m. The measurements were made at these heights to observe the continuity and change of wind speed. These measurements also served to define wind shear.

2.2. Wind Data

In the place where the measurements were taken, it appears that there are several hours of calm wind. For approximately 6800 h per year, at the height of 84 m, the wind speed is more than 3 m/s. This is important because commercial turbines are set to this cut-in wind speed. Since the turbines taken into consideration have a measured height of over 84m, this means that the wind turbines will be in operation for 6500 h or more during the year. From the same measurements, it is shown that for around 450 h per year, the wind speed is greater than 11–12 m/s. This is also important because this is the optimal operating speed of wind turbines. Speeds higher than 20 or 25 m/s are very rare. This is a very important element, because it is the cut-off value in most commercial turbines.
For Koznica, a mountainous terrain, one-year wind-speed measurements from 2019–2020 were considered. There are no buildings on the micro-location considered. Measurements at the highest level, 84m, show a high potential of wind energy. Figure 2 gives the graphical presentation of the data for each month and their average value for the respective heights. Analysing wind-speed data from June to September shows that there is an almost constant wind-speed value in the summer months. The month with the highest speed, at all measurement heights, is February.

2.3. Wind Turbine Characteristics

To calculate the actual distances, and the annual energy production, it is necessary to know the working characteristics of wind turbines. The wind turbines considered, a total of 10, are of the type: General Electric, GE 3.4 MW [26]. The installed power of the considered turbine GE 3.4–137 is 3.40 MW. The diameter of the rotor in this turbine is 137 m [26]. The area of the rotor is equal to 14,741 m2 [26]. The wind turbine has 3 blades [26]. In addition to these characteristics, the power-curve data has also been considered, to calculate the annual energy that can be generated by the respective turbines.

2.4. WAsP

WAsP is the tool used throughout the analysis performed in this study. With this software, developed in Denmark, it will be possible to see the difference in the energy produced, because of the interaction of the fluid with the wind farm. This interaction in the case of small distances will be negative due to less energy being generated in the exit of a wind farm. In all other applications, this interaction will have a positive value, especially when dealing with uneven terrain [27]. The empirical formulation provided by Denmark Technical University, as well as harmonised throughout the WAsP software, is described figuratively, as well as analytically, below. Here, an experimentally derived expression of the wind-speed deficit is given and a rule showing how the wind-speed deficit is affected by the influencing factors, such as an increase in the wind speed. [27]. Recognising the existing potential of Koznica, initially, the next step is related to the installation of turbines. Since the software used is based on the Jensen model, the rules set by this model must be taken into account when installing the turbines [28]. To have stability of wind turbines’ interaction in a farm, they must be placed at a 3D distance and beyond [29]. The ideal placement would be from 10D distance onwards [30]. This is because of the wake effect and turbulence role [31]. As a model for describing the phenomenon of the wake effect, Jensen’s model predicts increasing the distance as much as possible [32]. In the case under consideration, Koznica, the results relate to the measurements of wind speed, direction, and standard deviation, obtained from field measurements, while the evaluation of the wake effect, the intensity of the turbulence, and the annual energy are calculated directly in the implicit form that the program enables [33]. The physical structure of the effect created in the wind turbine under the wake effect, as well as the wind-speed deficit, is shown in Figure 3. This is shown in general form but applies to each specific case.
The oscillation radius can be calculated using the formula below [35,36]:
r w ( x ) = χ x + r
where the turbine rotor is shown with r, the speed avoided by the turbine rotor is shown by we [37].
For a specified distance of x, the wind speed is calculated as below [37,38]:
w w ( x ) = w 0 1 r χ x + r 2 ( 1 1 c T )
where: w0 is the wind speed before reaching the turbine rotor, (m/s), then, behind the rotor, the wind speed is shown by w2, (m/s), the obtained radius–as a result of the wind speed change, is shown by rw, for a distance of x (m), with r showing the wind turbine radius, in m [37]. Then, the entrainment constant is shown by X, (/) [37]. CT shows the coefficient of wind-speed pressure, (/). ww is the wind speed in a distance of x, (m/s) [37]. α indicates the deviation angle of the wake-speed deficit during the passage through the rotor of the respective turbine [37].
The program used for analysis has considered the mutual-wake effect of wind turbines placed near each other [37]. This interaction is shown in Figure 4. The joint interaction area between two turbines is known as Aoverlap [37]. In the same form, the area of a wind turbine is marked as A1.
The change in wind speed due to the wake effect is calculated as follows [38,39]:
w 01 = w 0 1 1 C T D 0 D 0 + 2 χ X 01 2 A o v e r l a p A 1
where D0 is the rotor diameter (in m), and X01 is the distance between two wind turbines.
This type of mathematically described model is further used in the respective software, WAsP [40,41]. The results are further presented graphically in the form of maps, making the change and the role of the effect under discussion more understandable.
For the terrain under consideration, RIX is a quantity determined by the slope, the calculation of the radius and the number of radii [41]. Further, in the same form, ∆RIX is defined as the difference, expressed in percentage, between a respective country and the one taken as a reference. In this context, the met mast can be taken as a reference point or the comparison can be taken from the first turbine onwards. The ruggedness index and its orographic performance indicator, ΔRIX, are determined by the same software. The analytical expression for determining ΔRIX is given in Equation (4) as follows [41]:
Δ R I X = R I X W T G R I X M E T
RIX and ΔRIX are expressed in %.

3. Results and Discussion

Considering that the critical factor under analysis is the wind speed, in terms of intensity and main direction, then wind roses are presented for the main heights of 84, 80, 60, and 40 m. Since the heights 84m and 80 m have only a slight difference, only the model for the highest elevation, 84 m, is presented. Wind roses for all measurement heights are generated using one-year measurements, through the WAsP software.
-
For 84 m, 60 m and 40 m measurements, the wind roses are shown in Figure 5.
For all the wind rose measurement heights shown, it can be concluded that there is no main dominant direction, as shown in Figure 5. At all measurement heights, the most dominant directions are western and northern winds.
Throughout all the figures presented, the area under consideration for placing the turbines is indicated by a black circle. As mentioned above, and in field analysis, a very important element is the elevation of the terrain because it affects the speed and density of the air. This is described in Figure 6. From this Figure, it can be seen that along the whole terrain in which the analysis is performed, the elevation change is bigger for the 5D distance, and this is also related to changes in wind speed. The Koznica site area can be categorised as moderate complex terrain, with altitudes varying between 980 and 1070 m above sea level.
In addition, terrain inclination is a very important element. This is related to the fact that this is mountainous terrain, as shown in Figure 7. The slope of the terrain for Koznica can be seen to remain almost the same at the highest points. Figure 7 shows that in the lowlands along the terrain, the value of the terrain inclination is almost as much, 25.97 degrees (positive value).
In the study area, the essential parameters for calculation are analysed. Initially, the most critical terrain parameters, such as elevation, slope, and terrain inclination, are shown. Figure 8 shows the average wind speed in m/s for all-terrain under consideration at the highest measurement height: 84 m. Knowing the speed distribution, it can be concluded that there are enough data to optimise the placement of turbines on the wind farm.
The placement forms are discussed below and shown in Figure 9, for all three distances: 2D, 3D, and 5D. These show all the forms achieved, according to the mentioned models. Annual energy generated and capacity factor, achieved in each scenario by considering the wake losses caused in the respective scenario, are calculated. Then the layout, which indicates more considerable energy production, and the capacity factor, assists in finding the optimal form.
As shown in Figure 9, here are five considered forms of wind farm layout. This optimisation is undertaken in order to identify which structure will be optimal for their placement. All the models were developed along the mountainous terrain of Koznica. In this case, from the optimal sitting and all analysed scenarios, the difference is significant in output energy and capacity factor. During the optimisation strategy, it should be taken into account that the constraints considered are: the distance between the turbines, which should be at least 5D, and the geodetic points in the field, the highest of which should be followed for siting the turbines, assuming this is undertaken in the whole field, which is taken into consideration. The graphical representation in Figure 10 further illustrates the optimised wind farm layout. The V layout indicates the optimal shape based on the above description. In order to have a clearer view of the optimal layout of the turbines and the distance, these are also presented in Figure 10. The elements used for ultimately determining the optimal positions are: field knowledge in coordination with the use of WAsP software, according to the previously described wake-effect model.
The further placing of such positions on the power density map and their distribution along the territory—here indicated by a circle—is shown in Figure 10. The analysis continues by presenting the power density at the location considered. Considering the location of the turbines, as shown in Figure 11, it can be seen that the turbines in the optimal layout are located in places with the highest wind power density.
Taking into account the importance of the ruggedness of the terrain in a wind farm, then it is necessary to define its value along the entire terrain under consideration. Also, the performance indicator, along each specific location of the turbines in the farm, is considered. This is shown in Figure 12. For turbines 1 and 2, which are closer to the wind-speed met mast, the negative value of ΔRIX indicates that the terrain at the met mast is more complex than at these two turbines. The value of ΔRIX for other turbines, especially for turbine 10, shows that the terrains here are much more complex than the met mast.
Results that apply to the cases under consideration and the knowledge from practice give us indications for the final optimisation layout. The main conclusion that can be drawn, in the case of the analysis of the placement of turbines in the respective farm that belongs to the complex terrain, is that in addition to the distance, consideration should be given to component (z). This means that in addition to distance, it is also necessary to focus on maintaining the highest points, given that the higher speed is at higher heights. In this way, it can be concluded that applying the optimisation method in mountainous terrain, in addition to distance, requires finding higher points, which represent higher speeds.
Optimal placement, in this case, refers to the distance 5D or further and to maintaining the same height, as much as possible, along the terrain. As shown in Figure 13, here a capacity factor of 40% can be achieved, in the case of optimal placement. It can also be seen here that, in this case, there is less energy at the output and a lower capacity factor for the 5D-distance case, according to some scenarios. This is related to the fact that to realise that type of placement for such distances involves considering the many terrain reductions, i.e., there are slower speeds throughout the year and a kind of wake effect as a result of the differing marked terrains: the ups and downs. For all the layouts considered here, the most considerable annual energy output will be from layout V. Regardless of the distance, the smallest capacity factor achieved is in layout M, where the capacity factor is around 20%. The wake effect, in this case, is more pronounced because the changes in height above ground level are numerous. The average value of wake loss for the considered type of wind turbine is 4.73%. Of course, this represents the average value, and other values, as a function of position, are shown in detail in Figure 14. It can be seen that even in the optimisation scenario, the ninth turbine has a high loss value due to the wake effect.

4. Conclusions

This study deals with the idea of increasing wind farm efficiency. The layouts discussed were according to the form Arc, I, L, M, and V, at all distances and types of turbines obtained in the study. From the sitting options discussed, the form with the lowest efficiency is the one according to the letter M layout. This decrease appears since the shape of the turbine placement as the letter M increases wake losses. Regarding 2D distance, for Arc, I, L, M, and V layouts, the values are 84.607, 75.191, 80.644, 74.85, and 95.909 GWh/yr. For the same forms in the 3D distance, these values are 80.358, 83.922, 83.441, 78.241, and 96.931 GWh/yr. In the largest distance considered for the mentioned scenarios, the annual energy values are 82.464, 85.839, 85.017, 78.15, and 87.457 GWh/yr. The indicators used to find the optimised form are: comparing the annual energy results and the performance coefficient for the considered forms. Here, the layout according to the letter V has the highest annual energy and performance in all considered distances. Now, following the proposed optimisation method that, in addition to the distance, also considers the elevation, the optimal placement form represents a deformed V shape. In the case of the optimal sitting, the net annual energy production is 113.16 GWh/yr, and the capacity factor is 39.3%. Here, the turbines negatively affect each other with a double effect. One element to conclude in this case is that continually increasing the distance between turbines is not the best solution for optimising turbine placement. This case study, presented on this topic, is an example. The distance was also studied for all placement methods, with increases from 2D, in the first case, to the last case with a distance of 5D. Here, also, it can be concluded that increasing the distance when reducing the speed due to landings along the complex terrain, is not an efficient solution.

Author Contributions

Conceptualisation, B.H.; methodology, R.V.F.; software, B.H.; validation, B.H; formal analysis, I.K.S.; investigation, B.H.; resources, B.H.; data duration, B.H.; writing—original draft preparation, B.H.; writing—review and editing, R.V.F.; visualisation, I.K.S.; supervision, R.V.F. All authors have read and agreed to the published version of the manuscript.

Funding

This research received no external funding.

Conflicts of Interest

The authors declare no conflict of interest.

References

  1. Parada, L.; Herrera, C.; Flores, P.; Parada, V. Wind farm layout optimisation using a Gaussian-based wake model. Renew. Energy 2017, 107, 531–541. [Google Scholar] [CrossRef]
  2. Hoxha, B.; Filkoski, R.V. Fluid interaction in a complex terrain wind farm. Przegląd Elektrotechniczny 2022, 1, 10–13. [Google Scholar] [CrossRef]
  3. Al-Addous, M.; Jaradat, M.; Albatayneh, A.; Wellmann, J.; Al Hmidan, S. The Significance of Wind Turbines Layout Optimization on the Predicted Farm Energy Yield. Atmosphere 2020, 11, 117. [Google Scholar] [CrossRef] [Green Version]
  4. Dragusha, B.; Hoxha, B. Impact of field roughness and power losses, turbulence intensity on electricity production for an onshore wind farm. Int. J. Power Electron. Drive Syst. IJPEDS 2020, 11, 1519–1526. [Google Scholar] [CrossRef]
  5. Peña, A.; Réthoré, P.; Laan, M.P. On the application of the Jensen wake model using a turbulence-dependent wake decay coefficient: The Sexbierum case. Wind Energy 2016, 19, 763–776. [Google Scholar] [CrossRef] [Green Version]
  6. Hunt, J.C.R.; Tampieri, F.; Weng, W.S.; Carruthers, D.J. Air flow and turbulence over complex terrain: A colloquium and a computational workshop. J. Fluid Mech. 1991, 227, 667–688. [Google Scholar] [CrossRef]
  7. Wood, N. Wind Flow Over Complex Terrain: A Historical Perspective and the Prospect for Large-Eddy Modelling. Boundary-Layer Meteorol. 2000, 96, 11–32. [Google Scholar] [CrossRef]
  8. Robertson, A.; Sethuraman, L.; Jonkman, J.M. Assessment of Wind Parameter Sensitivity on Extreme and Fatigue Wind Turbine Loads. In Proceedings of the 2018 Wind Energy Symposium, Kissimmee, FL, USA, 8–12 January 2018. [Google Scholar] [CrossRef]
  9. Rinker, J.M. Calculating the sensitivity of wind turbine loads to wind inputs using response surfaces. J. Phys. Conf. Ser. 2016, 753, 32057. [Google Scholar] [CrossRef]
  10. Porté-Agel, F.; Lu, H.; Wu, Y.-T. Interaction between Large Wind Farms and the Atmospheric Boundary Layer. Procedia IUTAM 2014, 10, 307–318. [Google Scholar] [CrossRef]
  11. Cabezón, D.; Migoya, E.; Crespo, A. A semi-parabolic wake model for large offshore wind farms based on the open source CFD solver OpenFOAM. ITM Web Conf. 2014, 2, 06002. [Google Scholar] [CrossRef] [Green Version]
  12. Gao, X.; Yang, H.; Lu, L. Optimization of wind turbine layout position in a wind farm using a newly-developed two-dimensional wake model. Appl. Energy 2016, 174, 192–200. [Google Scholar] [CrossRef]
  13. Ho, L.-H.; Sun, H.; Tsai, T.-H. Research on 3D Painting in Virtual Reality to Improve Students’ Motivation of 3D Animation Learning. Sustainability 2019, 11, 1605. [Google Scholar] [CrossRef] [Green Version]
  14. Frandsen, S. Turbulence and Turbulence-Generated Structural Loading in Wind Turbine Clusters; DTU-National Laboratory for Sustainable Energy, National Laboratory, Information Service Department: Roskilde, Denmark, 2007. [Google Scholar]
  15. Hasager, C.B.; Rasmussen, L.; Peña, A.; Jensen, L.E.; Réthoré, P.-E. Wind Farm Wake: The Horns Rev Photo Case. Energies 2013, 6, 696–716. [Google Scholar] [CrossRef]
  16. Tseng, T.L.B.; Garcia Rosales, C.A.; Kwon, Y.J. OPTIMIZATION OF WIND TURBINE PLACEMENT LAYOUT ON NON-FLAT TERRAINS. Int. J. Ind. Eng. 2014, 21. [Google Scholar] [CrossRef]
  17. Gharaibeh, A.; Al-Shboul, D.; Al-Rawabdeh, A.; Jaradat, R. Establishing Regional Power Sustainability and Feasibility Using Wind Farm Land-Use Optimization. Land 2021, 10, 442. [Google Scholar] [CrossRef]
  18. Manolesos, M.; Gao, Z.; Bouris, D. Experimental investigation of the atmospheric boundary layer flow past a building model with openings. Build. Environ. 2018, 141, 166–181. [Google Scholar] [CrossRef] [Green Version]
  19. Piqué, A.; Miller, M.A.; Hultmark, M. Laboratory investigation of the near and intermediate wake of a wind turbine at very high Reynolds numbers. Exp. Fluids 2022, 63, 1–13. [Google Scholar] [CrossRef]
  20. Vermeer, L.J.; Sørensen, J.N.; Crespo, A. Wind turbine wake aerodynamics. Prog. Aerosp. Sci. 2003, 39, 467–510. [Google Scholar] [CrossRef]
  21. Latinopoulos, D.; Kechagia, K. A GIS-based multi-criteria evaluation for wind farm site selection. A regional scale application in Greece. Renew. Energy 2015, 78, 550–560. [Google Scholar] [CrossRef]
  22. Yeghikian, M.; Ahmadi, A.; Dashti, R.; Esmaeilion, F.; Mahmoudan, A.; Hoseinzadeh, S.; Garcia, D.A. Wind Farm Layout Optimization with Different Hub Heights in Manjil Wind Farm Using Particle Swarm Optimization. Appl. Sci. 2021, 11, 9746. [Google Scholar] [CrossRef]
  23. Johari, M.K.; Jalil, M.A.A.; Shariff, M.F.M. Comparison of horizontal axis wind turbine (HAWT) and vertical axis wind turbine (VAWT). Int. J. Eng. Technol. 2018, 7, 74–80. [Google Scholar] [CrossRef] [Green Version]
  24. Zhao, X.; Hu, T.; Zhang, L.; Liu, Z.; Wang, S.; Tian, W.; Yang, Z.; Guo, Y. Experimental study on the characteristics of wind turbine wake field considering yaw conditions. Energy Sci. Eng. 2021, 9, 2333–2341. [Google Scholar] [CrossRef]
  25. Yang, Q.; Li, H.; Li, T.; Zhou, X. Wind farm layout optimisation for levelized cost of energy minimisation with combined analytical wake model and hybrid optimisation strategy. Energy Convers. Manag. 2021, 248, 114778. [Google Scholar] [CrossRef]
  26. General Electric, 3.4 MW Wind Turbine, Catalogue. Available online: https://en.wind-turbine-models.com/turbines/1339-ge-general-electric-ge-3.4-137 (accessed on 7 March 2022).
  27. Yılmaz, U.; Balo, F.; Sua, L.S. Simulation Framework for Wind Energy Attributes with WAsP. Procedia Comput. Sci. 2019, 158, 458–465. [Google Scholar] [CrossRef]
  28. Kamdar, I.; Ali, S.; Taweekun, J.; Ali, H.M. Wind Farm Site Selection Using WAsP Tool for Application in the Tropical Region. Sustainability 2021, 13, 13718. [Google Scholar] [CrossRef]
  29. Worku, M.Y. Recent Advances in Energy Storage Systems for Renewable Source Grid Integration: A Comprehensive Review. Sustainability 2022, 14, 5985. [Google Scholar] [CrossRef]
  30. Liang, H.; Zuo, L.; Li, J.; Li, B.; He, Y.; Huang, Q. A wind turbine control method based on Jensen model. In Proceedings of the 2016 International Conference on Smart Grid and Clean Energy Technologies (ICSGCE), Chengdu, China, 19–22 October 2016; pp. 207–211. [Google Scholar] [CrossRef]
  31. Porté-Agel, F.; Wu, Y.-T.; Chen, C.-H. A Numerical Study of the Effects of Wind Direction on Turbine Wakes and Power Losses in a Large Wind Farm. Energies 2013, 6, 5297–5313. [Google Scholar] [CrossRef] [Green Version]
  32. Leahy, K.; Gallagher, C.; Bruton, K.; O’Donovan, P.; O’Sullivan, D.T. Automatically Identifying and Predicting Unplanned Wind Turbine Stoppages Using SCADA and Alarms System Data: Case Study and Results. J. Phys. Conf. Ser. 2017, 926, 012011. [Google Scholar] [CrossRef]
  33. Wu, Y.-K.; Wu, W.-C.; Zeng, J.-J. Key Issues on the Design of an Offshore Wind Farm Layout and Its Equivalent Model. Appl. Sci. 2019, 9, 1911. [Google Scholar] [CrossRef] [Green Version]
  34. Moskalenko, N.; Rudion, K.; Orths, A. Study of wake effects for offshore wind farm planning. In Proceedings of the 2010 Modern Electric Power Systems, Wroclaw, Poland, 20–22 September 2010; IEEE: Piscataway, NJ, USA, 2010; pp. 1–7. [Google Scholar]
  35. Wu, Y.-T.; Porté-Agel, F. Large-Eddy Simulation of Wind-Turbine Wakes: Evaluation of Turbine Parametrisations. Bound. Layer Meteorol. 2011, 138, 345–366. [Google Scholar] [CrossRef]
  36. Hameed, S.S.; Ramadoss, R.; Raju, K.; Shafiullah, G. A Framework-Based Wind Forecasting to Assess Wind Potential with Improved Grey Wolf Optimization and Support Vector Regression. Sustainability 2022, 14, 4235. [Google Scholar] [CrossRef]
  37. Do, M.H.; Njiri, J.G.; Soeffker, D. Structural load mitigation control for wind turbines: A new performance measure. Wind Energy 2020, 23, 1085–1098. [Google Scholar] [CrossRef] [Green Version]
  38. Papatzimos, A.K.; Thies, P.R.; Dawood, T. Offshore wind turbine fault alarm prediction. Wind Energy 2019, 22, 1779–1788. [Google Scholar] [CrossRef]
  39. Shakoor, R.; Hassan, M.Y.; Raheem, A.; Wu, Y.-K. Wake effect modeling: A review of wind farm layout optimisation using Jensen’s model. Renew. Sustain. Energy Rev. 2016, 58, 1048–1059. [Google Scholar] [CrossRef]
  40. Yildirir, V.; Rusu, E.; Onea, F. Wind Energy Assessments in the Northern Romanian Coastal Environment Based on 20 Years of Data Coming from Different Sources. Sustainability 2022, 14, 4249. [Google Scholar] [CrossRef]
  41. Bontekoning, M.P.C.; Perez-Moreno, S.S.; Ummels, B.C.; Zaaijer, M.B. Analysis of the reduced wake effect for available wind power calculation during curtailment. J. Phys. Conf. Ser. 2017, 854, 12004. [Google Scholar] [CrossRef]
Figure 1. Topographic map of the target region of the WPP in Koznica.
Sustainability 14 13688 g001
Figure 2. Wind data in different heights, in m/s.
Sustainability 14 13688 g002
Figure 3. Oscillations caused in a wind turbine rotor (Source: Modified from [34]).
Sustainability 14 13688 g003
Figure 4. WAsP model for wake effect (Source: www.wasp.dk/wasp/wake-effect-model, accessed on 7 August 2022).
Sustainability 14 13688 g004
Figure 5. Wind for Koznica at 84 m, 60 m and 40 m measurements, in degrees.
Sustainability 14 13688 g005
Figure 6. Koznica terrain elevation, in m.
Sustainability 14 13688 g006
Figure 7. Terrain inclination for Koznica, in degrees.
Sustainability 14 13688 g007
Figure 8. Mean wind speed for all sectors, in m/s.
Sustainability 14 13688 g008
Figure 9. Considered forms of turbine layout (ae).
Sustainability 14 13688 g009aSustainability 14 13688 g009bSustainability 14 13688 g009c
Figure 10. Layout optimisation presentation and 5D distance for each turbine.
Sustainability 14 13688 g010
Figure 11. Wind power density, W/m2.
Sustainability 14 13688 g011
Figure 12. RIX and ΔRIX for optimal position of wind turbines in Koznica farm, in %.
Sustainability 14 13688 g012
Figure 13. Comparison of layouts and optimised placement for wind turbines.
Sustainability 14 13688 g013
Figure 14. Wake effect for each turbine for optimised layout, in %.
Sustainability 14 13688 g014
Publisher’s Note: MDPI stays neutral with regard to jurisdictional claims in published maps and institutional affiliations.

