Abstract
Commercial buildings in Malaysia contribute to 35% of the total electricity demand. During the recent COVID-19 pandemic, the global economy faced a challenging situation that forced many businesses to shut down. However, fast-food restaurants with drive-through features managed to get through this pandemic phase without much effect from the economic impact. Since COVID-19, the operational guidelines have changed for restaurants. However, from an energy perspective, fast–food restaurants are high energy consumers in the retail sector. This paper analyses the load profile of fast-food restaurants and the potential strategies that can be adopted in a free-standing fast-food restaurant. From analysis, it is calculated that a total of RM 97,365.9 of utility savings can be obtained in a year. A total of 91,392.1 kg CO2, 881.8 kg SO2 and 385.5 kg CO pollutant emissions can be reduced. The BEI for the restaurant was reduced to 856.4 kWh/m2/year. By converting to energy-saving strategies, the return on investment was 27.3% and 3.7 years, which is a very short period of time and is attractive for businesses of this nature.
1. Introduction
The gradual increment of the population is directly proportional to the energy demand. In Malaysia, it is estimated that the energy demand will increase to up to 116 million tonnes of oil equivalent (mtoe) [1]. This means a direct impact on GHG emissions, due to the power plants in Malaysia being mainly based on fossil fuel sources, including coal, natural gas, and fuel oil.
The largest energy contributor is the building and construction sector, which now holds more than 36% of final energy usage, with a 39% contribution towards energy and process-related carbon dioxide (CO2) emission [2]. Surprisingly, it only occupies 2% of the earth’s land surface on which the majority of buildings are of a commercial type [3]. In Malaysia, one type of high-energy-intensity commercial building is in the retail sector, which represents approximately 35% of the total commercial buildings’ energy consumption [4]. Of all retail buildings, the fast-food restaurant with drive-through features has shown a growing trend in Malaysia [5,6]; one of the main reasons is due to a strategic business plan, which positions them to manage even during the unprecedented recent COVID-19 pandemic. However, these types of restaurants are major contributors to GHG emissions, due to the heavy usage of heating, cooling, refrigeration elements, kitchen heat load, and continuous volume-based operation. Thus, mitigating GHG emissions from this ever-growing industry offers the best means of controlling overall GHG emissions for Malaysia. In order to significantly minimalize GHG emissions, it is important to tap into the positive progress of the energy efficiency equipment.
Several studies have been conducted to identify the potential strategy for reducing energy consumption and pollutant emission in buildings.
Khosbakht et al. [7] performed studies on higher education buildings and established a benchmark by performing a comparison of multiple university campuses around the world. They based this on several statistical methods, breaking down the energy intensity based on the usage of the university buildings.
Habib et al. [8] analysed energy consumption and performed energy-saving strategies for industrial garment buildings: they found that electric motors consumed 45% of the total energy. The authors applied various energy-saving strategies to reduce the energy usage on motors, and performed a comparison using VSD and HEM. They concluded that HEM was a better choice from an economic standpoint.
The potential of LED lights and their results in reducing energy consumption compared with conventional lights in Research & Development (R&D) buildings were analysed by Birkha et al. [9]. With a significant impact on energy consumption, the LED payback was reported to be less than one year.
To understand energy consumption in hospitals, Saidur et al. examined the end-use energy in a Malaysian public hospital [10]. It was found that most of the energy consumption was from motors. Estimation of energy savings by using a mathematical approach for HEM and VSD for motors was performed. Emission reduction, bill savings, and payback period were also calculated.
The energy-saving strategies for governmental buildings were studied by Saleh et al. [11], who focused on behavioural changes such as changing the setpoint of the thermostat, changing the air-conditioning operation schedules, replacing fluorescent lights with LED and increasing airtightness, which resulted in a total energy consumption reduction of 38.5%.
Alajmi et al. showed that energy audits allowed building managers to identify the importance of new energy-efficient technology. By increasing the energy audits, the operational efficiencies were optimized, and the gap between the prediction model and the actual one was minimized [12].
An energy-efficient evaluation is the comparison of different structures of similar nature of output, which then identifies how much less energy the comparable structure utilises or optimises [13]. From the above reviews, it can be seen that there are no specific studies performed on fast-food restaurants and commercial buildings. It is important to understand the energy profile of these types of restaurants, as they are a booming trend and, because they are high energy intensity buildings, could represent a major energy-saving and GHG emission reduction resource, by tapping into energy-efficiency technologies. The main aim of the research is to investigate and analyse the load profile, breakdown of energy consumption, implementation of energy- saving strategies, cost savings, and emission reductions, and to understand the building energy index of the fast-food restaurant. It also aims to implement the available policies and to encourage policy makers to devise strategies for energy saving and emission reduction for these type of commercial buildings [7,8,14].
2. Methodology
2.1. Data Collection Procedure and Estimation of Energy Use and Energy Intensity
An audit was conducted by following a standard energy audit, which has been used by many researchers, as summarized in Table 1. Following a review of the methodology, the walk-through energy audit and mathematical estimation of energy-saving measures were adopted for this analysis.

Table 1.
Review of methodology used for energy-saving measures.
A walk-through energy audit was conducted in a fast-food restaurant in Malaysia with a gross floor area of 8202 square feet and a net floor area of 30,000 square feet. The ground floor of the building consists of a kitchen, indoor air-conditioned dining area, and an outdoor mechanically ventilated dining area. On the first floor, there are some distribution areas, such as an indoor air-conditioned dining area, an outdoor mechanically ventilated dining area, a children’s air-conditioned playroom, and an air-conditioned party room. The energy audit measured total energy consumption, type of energy supply, type of equipment, and energy consumption and usage behaviour.
2.2. Business Operating Hours
Since COVID-19, the operational guidelines have changed for restaurants. An interview with the crew and manager shows that fast-food restaurants operate for 20 h (from 6 am to 2 am) daily. In addition, an internal policy states that 8 h of deep cleaning and preventive maintenance task is only required to be performed twice a month. In total, the non-operational business hours in a year are calculated to be 1556 h/year. Hence, this translates into 7204 business h/year and 360.2 business operational days per year.
2.3. Equipment Operation Hours
The equipment operating hours differ from the business operating hours, due to the nature of the equipment and the frequency of its usage. For example, lights, fans, and air-conditioning systems will be operating throughout operational and maintenance tasks to provide illumination and ventilation for the working crew. Core equipment such as the freezer, chiller, multiplexer, ice machine, heat treatment machine, and water heater operate throughout operational and non-operational hours as needed, to ensure specific measures are in place such as the temperature of raw products, the temperature of hot water in the storage tank, the ice stock up and the maintenance of the quality of the product. Hence, the operation of the compressor for a walk-in cold room will cause a fluctuation in energy consumption due to the thermostat being cut off upon achieving the desired temperature. After a thorough analysis of the equipment operating hours, the data is presented in the following section.
2.4. Mathematical Formulation
Table 2, Table 3 and Table 4 show the details of the summary data, type, quantity, and running hours of energy-consuming equipment in the restaurant. Using the energy assessment data collected from the fast-food restaurant, the energy consumption by air-conditioning, lighting, and other equipment can be calculated using Equation (1) as below [14,15]:
where
AECa = UHy × Ca × LF × 0.001
- AEC = annual energy consumption (kWh) of equipment ‘a’ in MWh
- UHy = yearly usage hours of equipment ‘a’
- Ca = capacity of equipment ‘a’ in kW
- LF: load factor = 1.
Table 2.
Number and type of lights, capacity, and operating hours in 2021.
Table 2.
Number and type of lights, capacity, and operating hours in 2021.
| Equipment | Quantity | Power (W) | Operating Hours (h/year) |
|---|---|---|---|
| Compact Fluorescent Light (Double) | 84 | 36 | 7396 |
| Compact Fluorescent Light (External) | 49 | 48 | 3698 |
| Halogen Light (Single) | 92 | 20 | 7396 |
| Halogen Light (Double) | 28 | 40 | 7396 |
| Fluorescent (Single) | 4 | 32 | 377 |
| Fluorescent (Quadruple) | 58 | 72 | 7396 |
| High-Pressure Sodium Light | 11 | 250 | 3698 |
| Emergency Light | 52 | 8 | 7396 |
| K’ Light | 14 | 13 | 7396 |
Table 3.
Number of electric motors, capacity, and operating hours in 2021.
Table 3.
Number of electric motors, capacity, and operating hours in 2021.
| Equipment | Quantity | Power (W) | Operating Hours (h/year) |
|---|---|---|---|
| Water heater motor | 2 | 500 | 5453 |
| Water pump motor | 3 | 500 | 5453 |
| Hydrant pump motor | 1 | 8000 | 2 |
| Capture Jet Fan | 4 | 500 | 6059 |
| Dumbwaiter | 1 | 1700 | 5453 |
| Exhaust Fan | 1 | 9900 | 7231 |
| Grease Trap | 1 | 500 | 5453 |
| Fan | 14 | 69 | 5453 |
Table 4.
Amount of kitchen equipment, capacity, and operating hours in 2021.
Table 4.
Amount of kitchen equipment, capacity, and operating hours in 2021.
| Equipment | Quantity | Power (W) | Operating Hours (h/year) |
|---|---|---|---|
| Freezer | 1 | 8055.56 | 4356 |
| Cooler | 1 | 6590.91 | 4356 |
| Water Heater | 1 | 9000 | 3805 |
| Beverage Cell | 1 | 3200 | 7151 |
| Grill 1 | 1 | 1667.83 | 7151 |
| Grill 2 | 1 | 1468.20 | 7151 |
| Chicken Fryer 1 | 1 | 0.40 | 7151 |
| Chicken Fryer 2 | 1 | 0.40 | 7151 |
| Chicken Holding Cabinet | 2 | 121.87 | 7151 |
| Protein Fryer | 3 | 0.40 | 7151 |
| Fries Fryer | 3 | 0.40 | 7151 |
| Fries Bagging Station | 1 | 500.00 | 7151 |
| Ice Machine | 2 | 2555.86 | 5227 |
| Soda Factory | 1 | 446.84 | 8616 |
| Preparation Table | 1 | 5000 | 5785 |
| Rice Cooker | 3 | 250 | 3013 |
| Portable Chiller | 2 | 500 | 4356 |
| Portable Freezer | 2 | 500 | 4356 |
| Meat Freezer | 1 | 1188.71 | 4356 |
| Heat Treatment Machine | 2 | 4410.01 | 4356 |
| APD Machine | 1 | 500 | 8712 |
| Pie Counter | 1 | 250.00 | 3013 |
| Coffee Machine | 1 | 191.50 | 7151 |
| McFlurry | 1 | 500 | 5423 |
| Juice Dispenser | 1 | 500 | 7300 |
| Menu Board | 4 | 250 | 6059 |
| Filet Bun Toaster | 1 | 815.07 | 6059 |
| Bun Steamer | 1 | 1071.00 | 6059 |
| Universal Holding Cabinet | 2 | 2180.92 | 7151 |
| Air-Conditioning System | 1 | 51,838.40 | 6903 |
| Miscellaneous | - | 5940.58 | 7151 |
The load factor is set to one (1) with an assumption that the equipment is always operating at its maximum capacity.
From the data presented in Table 2, Table 3 and Table 4, it can be seen that the operating hours of each piece of equipment are defined by its usage. Even though this is a 20 h operating building with a business nature of a restaurant, the equipment operating hours are defined by its product mix and usage. Non-product mix-related energy consumption is based on the location and frequency of usage based on the walk-through audit.
Table 2 presents the lighting types installed in the restaurant. The operating hours of the lights are defined by their usage. For example, all lights operating at 7396 h/year are being used throughout the operational hours of the business. Compact fluorescent light (external) will only be used during the night, due to the presence of natural lighting for outdoor seating. A similar case applies to the High-Pressure Sodium Light which is used for streetlights, and so the operational hours are at night. Hence, the operating hours are justified accordingly. For Fluorescent light (Single), the operating hours are low, due to the location being in the prayer room, which is built to accommodate crew usage.
Table 3 shows the electric motor installed, its power and operating hours. The water heater motor, water pump motor, grease trap system, and fan operating hours are defined based on usage. The hydrant pump is placed as a part of the fire suppression system, which is in compliance with the local authority. Hence, the operating hours are justified by the per-year testing period of the system, to ensure its functionality. The exhaust fan and capture jet fan operate throughout the business operation.
Table 4 shows the core equipment which is being used in the restaurants kitchens, which is tabulated using its power and various operating hours. Freezers, chillers, and specific drinks equipment will have to operate for 24 h to keep the stored product at a specific temperature. However, the compressor cuts off when the desired temperature has been achieved. The equipment operation characteristic defines the operational hours accordingly.
It can be observed that the air-conditioning system contributes the highest power, to a total of 52 kW, followed by other kitchen equipment, which comprises 47 kW. Next in line are the other appliances, which consist of a freezer, cooler, water heater motor, hydrant pump motor, dumbwaiter, exhaust fan motor, grease trap motor, and ventilating fans, which adds up to 41 kW. Lighting is the last on the list. Based on the above-collected data, the following section will explain possible energy-saving initiatives and the working methodology of the equipment to reduce energy consumption.
2.5. Mathematical Formula of Energy Saving with the Introduction of Energy-Saving Options
The formula for energy saving from output power compared with the application of energy-efficient equipment such as light emitting diode (LED) lighting, latent heat energy storage (LHTES) air-conditioning systems, and LHTES water heaters are as stated below. Energy saving can be obtained by regulation, such as reducing the energy intensity compared to an average or base case [19,20,21,22,23,24,25,26,27]. The potential power reduction is calculated by using Equation (2) [9]:
where C = Potential power reduction, p0 = Initial equipment value, and p1 = Final equipment value.
Collected data are presented in Table 5.
Table 5.
Percentage of savings using LED.
Over the years, many energy-efficient or potential energy-efficient equivalent types of equipment have been available on the market. The implementation of LED has had tremendous impact in producing a lower environmental impact than the compact fluorescent (CFL) [11,28].
Annual energy saving by using LED can be calculated as in Equation (3):
where
AESLED = TEClighting × %ESLED
- TEClighting = total lighting energy consumption in MWh;
- %ESLED = percentage of energy saving due to LED.
Water heaters play an important role in restaurants, due to the usage of hot water for sanitation purposes. The traditional water heater uses 9 kW for heating 60 gallons of water occasionally. A better way to eliminate the demand for a water heater is by having an LHTES. The secondary heating element could be used as a backup with a lower power heating element [19,20,22,29,30].
The annual energy saving by using a solar thermal water heater is as in Equation (4) [10]:
where
AESinsulation = TECac × %ESheater
- %ESheater = % energy saving due to the solar thermal heater.
As per the finding from the energy evaluation, it is clear that the air-conditioning system utilizes the majority of the total building energy consumption. Since the application of LHTES is proven to achieve better energy efficiency, the technology is integrated into the existing air-conditioning system [19,20,21,22]. The annual air-conditioner energy saving due to switching to the LHTES air-conditioner system can be estimated by Equation (5):
where
AESHYB = TECac × %HYBac
- TECac = total air-conditioning energy consumption in MWh;
- %HYBac = total energy saving by using LHTES air-conditioning.
Collected data are presented in Table 6.
Table 6.
Amount of kitchen equipment, capacity, and operating hours in 2021.
A walk over the rooftop of the restaurant showed that a portion of the roof was covered with a metal-deck-type roofing system. This portion can be utilized for solar photovoltaic (PV) systems. The evaluation showed a potential of 59 solar panels that could be installed on the rooftop and in the gazebo area. With every panel contributing about 460 W, the total panel power output at peak would add up to 27.14 kWp.
It is important to note that the total full solar hours is assumed to be four (4) hours, which covers the complete area below the bell curve of solar irradiation. In this case, the theoretical solar output for a year is calculated by multiplying the total sum PV by four (4) full solar hours and 365 days (27.14 kW × 4 h × 365 days) which totals an output of 39,624.4 kWh.
Bill savings (RM) in regards to the total energy savings obtained can be calculated by using Equation (6) [15]:
where
BS = AES × CUTavg
- CUTavg = average commercial utility tariff (RM/kWh).
The tariff that is used for this type of fast-food restaurant is the low voltage commercial tariff as the first 200kWh is charged at RM 0.435 per kWh and 201kWh onwards is charged at RM 0.509 per kWh [31].
2.6. Economic Analysis of Energy-Saving Measures
The most important measures in economic analysis are the payback periods and the return on investment (ROI) [32]. The payback period and ROI for energy-saving initiatives can be calculated using Equations (7) and (8) below.
2.7. Emission Reduction Formulation Associated with Energy Saving
Electricity generation is fuelled by fossil fuel. Table 7 shows the fossil fuel emission for a unit of electricity generation using various fuels. Hence, the emissions produced can be estimated by using Equation (9) as below [9,33]:
where
- = total emission for a unit of electricity generation (ton);
- = the electricity production in the year i (kWh);
- = percentage of electricity generation in the year i of fuel type n;
- = the fossil fuel emission for a unit of electricity generation of fuel type n (ton).
Table 7.
Emission factor per unit of energy used for various fuels [9,33].
Table 7.
Emission factor per unit of energy used for various fuels [9,33].
| Type of Fuels | Emission Factors (kg/kWh) | ||
|---|---|---|---|
| CO2 | SO2 | CO | |
| Coal | 1.18 | 0.0139 | 0.002 |
| Petroleum | 0.85 | 0.0164 | 0.002 |
| Natural gas | 0.53 | 0.0005 | 0.005 |
| Hydro | 0 | 0 | 0 |
In Malaysia, the fuel to produce electricity is a mixture of coal, oil, natural gas, hydro and renewables which comprise solar farms, biogas and biomass plants where the percentage of contributions are 44.5%, 0.5%, 38.6%, 15.3% and 1.1% respectively in the year of 2019 [4,33,34].
The projected generation mix in Malaysia shows that a larger proportion of the power plants’ source remains as coal [35]. The growing trend of coal-fired power plants raises concern about the environment as they contribute to greenhouse gas pollutants. However, the supply side is bound to the demand side, which is more of a reason to ensure that the demand side is equipped with energy efficiency. Hence, emissions reduction is one of the significant issues for a sustainable environment in Malaysia.
2.8. Building Energy Index
Multiple building energy indexes (BEI) have been established globally. The following established formula will be used to suit the needs of the analysed building based on the Malaysia scenario [36,37,38,39]:
3. Results and Discussion
3.1. Energy Consumption and Annual Bills
As stated in Section 2.5, the tariff is used to calculate the energy bill. The total of 1–200 kWh tariff adds up to RM 87.00. Therefore, to ease the calculation method, and since all the bills are more than 200 kWh, the total bill calculation is taken by multiplying to a factor of RM 0.509 per kWh. Hence, the RM 87.00 is assumed to be a negligible sum for this purpose.
Figure 1 shows the energy consumption for lights used in fast-food restaurants. In order to suit the business needs and to have a cosy eating environment, the indoor lights are turned on throughout the day, even with the presence of natural lighting. Therefore, indoor lighting such as CFL, Halogen (single & double), ‘K’ Light, and Emergency light are turned on as long as there is a use for it. The external lights, such as CFL (external) and high-pressure sodium lights, are switched on during the absence of natural lighting. Since the usage of internal lighting is higher than the external, this justifies the energy consumption.
From the energy audited data collected at fast-food restaurants, the energy consumption and cost contribution for lights, other appliances, and kitchen equipment are presented in Figure 2, Figure 3, Figure 4 and Figure 5.
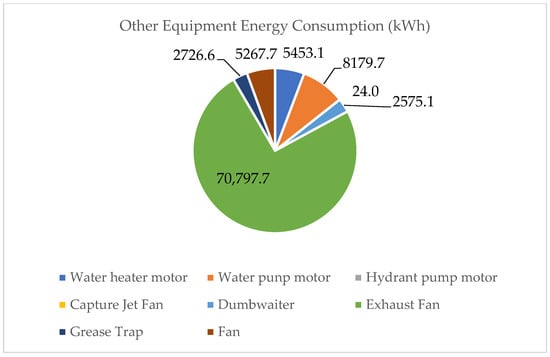
Figure 2.
Annual energy consumption for other appliances.
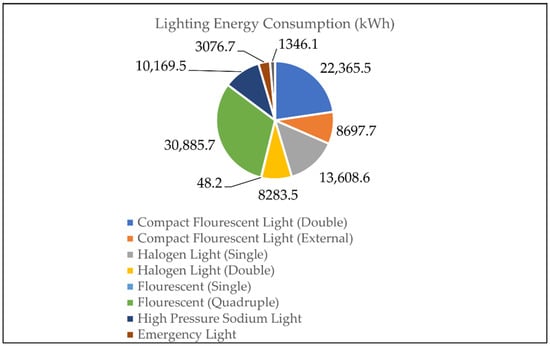
Figure 1.
Annual energy consumption for lights.
Figure 2 shows the energy consumption for other equipment that is indirectly essential for a fast-food operation. The water heater motor, water pump motor, dumbwaiter, and grease trap operate only when there is a demand. On the other hand, the exhaust fan and capture jet fan equipment operational hours are as long as the business hours. The hydrant pump motor is part of the fire suppression system. Hence, the usage is minimal for yearly testing and verification.
The annual energy consumption of kitchen core equipment is presented in Figure 3. As described above, the equipment operating characteristics influence the operation hours of the equipment directly. The air-conditioning system is part of the core kitchen equipment, as it is important to operate related equipment at a particular ambient temperature. Apart from the overall thermal transfer and rooftop thermal transfer, the air-conditioning capacity of the kitchen needs to cater to reasonable heat from the equipment. The temperature of the thermostat is set at between 24 °C and 26 °C. Even by doing this, it is observed that the compressor start-stop interval is small, due to a quick rise in temperature beyond the desired temperature, due to heat rejection from the equipment. Hence, the high energy usage from the air-conditioning system is observed.
Even though the business operation is for 20 h a day, it has to be noted that some core equipment will continue to operate for 24 h. This operation is to suit the needs of the business. For example, the freezer and chiller will continue to operate to maintain the temperature to ensure the food product remains frosted. Though the operation is beyond the business operation hours, the equipment operation hours seem to be less. This is because the freezer and chiller in a conditioned room are equipped with an appropriate seal door and stripe curtain, which ensure that the pressure difference is minimal. Hence, the temperature retention time is longer when the door is closed correctly. A similar case is applied to heat treatment machines, ice machines, juice dispensers, multiplexers, Milo machines, and water heaters.
Other than those stated above, the equipment operates only during business hours for food cooking purposes. Hence, the energy intensity is for that reason.
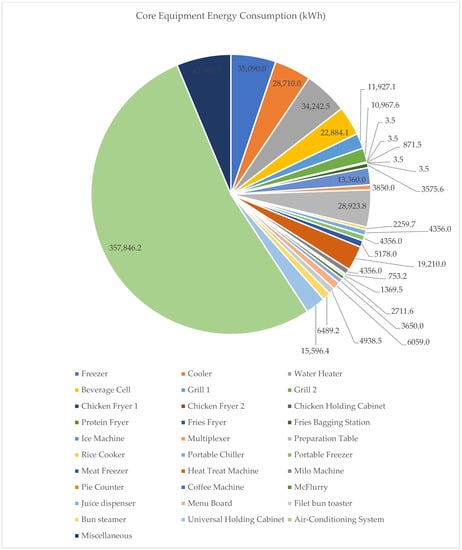
Figure 3.
Annual energy consumption for core equipment.
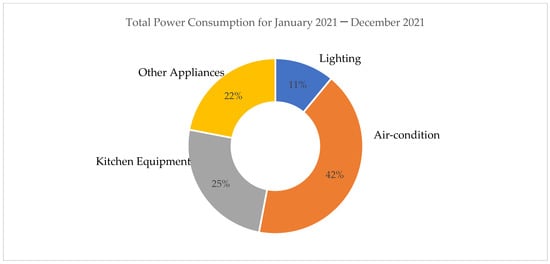
Figure 4.
Percentage of energy consumption by different types of appliances.
The total energy consumption in the restaurant over a year is presented in Figure 4, and was acquired from a walk-through energy audit conducted in 2021. The detailed energy breakdown of the appliances was then analysed and is shown in Figure 3.
From the audit, it can be perceived that the air-conditioning system contributes to the highest power consumption, a total of 42%, which is RM 182,143 per annum, followed by kitchen equipment at 25%, which corresponds to RM 112,051. Other appliances including a freezer, cooler, and water heater contribute to 22%, which equals RM 98,270. The lowest contribution of 11% comes from lighting, with a total of RM 50,127 per year. These compute the total energy consumption of 869,533.4 per year, billing RM 442,592.5 per annum.
In order to optimize energy usage, the restaurant management needs to identify, measure, and evaluate the contributors to the total energy consumption, whereby an energy-efficiency initiative can be established during peak and non-peak hours, on a daily basis. It is essential to have a walk-through energy audit as there is an absence of a building energy management system to address this issue. Every piece of installed equipment is precisely identified, and the building management needs to take note of the energy profile of specific equipment, which is the result of this research.
3.2. Energy, Cost Savings, and Payback Period Assessment by Using Energy-Efficient Equipment
With the advent of technology, the implication of potential energy-saving devices such as LED, LHTES air-conditioning systems, and water heaters, has shown tremendous changes in total power consumption. In addition, to utilize the space found on the metal-deck rooftop, a 27.14 kWp solar panel system has been mounted.
Lights are very important for restaurants, as the design of their temperature and illumination play a vital role in ensuring the proper appearance of the food, the correct eating ambiance, and the provision of cosiness. Hence, these lights are specifically chosen to suit the exact criteria of the above considerations, and not to change the design criteria. In Figure 5 and Table 8, conversion to LED has reduced the energy consumption to 58,109.4 kWh, equivalent to RM 30,086.7. This reduction contributes to an energy reduction of 40%. The biggest contributor to the percentage of savings is the ‘K’ Sign light, at 77% reduction by using LED. However, when observed overall, the power consumption for all conversion to LED has managed a reduction of above 50%.
By implementing the LHTES on the water heater and air-conditioning system, the energy consumption has been reduced to 11,414.2 kW and 268,382.6 kW per annum, respectively. Hence, the bill has been reduced to 5809.8 and RM 136,606.7 for the LHTES water heater and air-conditioning system, respectively. This contributes to a saving of approximately 67% and 25%, respectively [19,21,22].
The energy production of solar PV for a year is projected to be 39,624.4 kWh. This means a saving of RM 20,168.8.
From the cumulative implementation of all the above-mentioned energy-saving initiatives, there is a reduction in energy consumption of about 22% per annum, which results in total bill savings of RM 97,365.9 per annum.
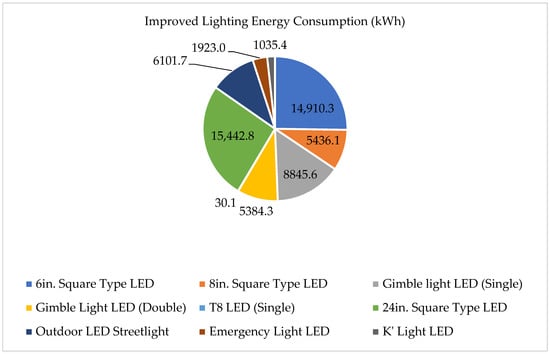
Figure 5.
Energy savings using energy-efficient lights.
Table 8.
Energy Savings Using RE & EE.
Table 8.
Energy Savings Using RE & EE.
| Description | RE & EE Energy Reduction (kWh) | Energy Bill (RM) |
|---|---|---|
| Solar Thermal Water Heater | 11,414.2 | 5809.8 |
| LHTES Air-Conditioning System | 268,382.6 | 136,606.7 |
| Solar PV 27.14 kWp | 39,624.4 | 20,168.8 |
From the analysis carried out due to the implementation, the power contribution in total is measured as presented in Figure 6. The air-conditioning systems’ power consumption has dropped to 2.4%. However, the kitchen equipment contributes to a larger proportion now, since there was no integration of technology due to the effect on food quality and safety. However, the total power consumption of kitchen equipment remains the same as in Table 4. Due to the reduction in cumulative electricity consumption, the percentage contributions from kitchen equipment and other appliances have an increment of 7.5% and 3%, respectively. The lightings contribution percentage has been reduced to about 2.3% of total energy. Another contributor to the reduction of utility is solar, which adds up to 5.8% of the total electricity bill. Since solar is not consuming electricity and is producing instead, the negative (−) symbol is used.
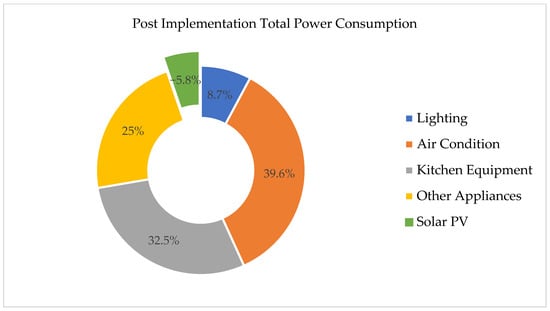
Figure 6.
Percentage of energy consumption at Post Implementation.
3.3. Payback and Return on Investment (ROI)
When analysing the individual payback and ROI for lighting, as in Table 9, the overall payback is less than four years. Some lighting computes to very high payback, such as T8 LED, outdoor LED, emergency light LED, and ‘K’ light LED. There are some identifiable reasons for this long payback. The T8 LED and outdoor LED are being used for a short period of time. For instance, the outdoor LED operates only after dark, which is about 12 operating hours daily. The T8 LED is being used for only about 454 h a year. This usage has resulted in a longer payback period since the savings could not be optimized due to the shorter operating hours. On the other hand, although the emergency LED and ‘K’ sign are operating for longer hours, they still give a very low wattage. However, in totality, the payback is still less than five years.
Table 9.
Payback period by replacing LED.
The air-conditioning and water heater give an attractive payback and ROI as shown in Table 10: 1.3 years and 77.5% ROI for the water heater, and 3.5 years and 28.5% for the air-conditioning. A comparison of solar panel prices from 2019 to 2022 has been analysed, and it has been observed that the price of solar panels is lower from year to year in the Malaysia case scenario. In addition, the Malaysian government has introduced tax incentives that reduce the taxation of green products. Table 11 shows a comparison of payback and ROI with and without the tax incentives reduction of 48%, and its impact on the payback period [25]. The two types of tax incentives provided by the government of Malaysia are capital allowance (CA), applicable for any capital expenditure of the company, and the investment tax allowance (ITA), which is an additional tax allowance introduced and applicable only for green procurement.
Table 10.
Payback period by replacing energy-efficient equipment.
Table 11.
Payback period of Solar Photovoltaic of 19.1 kWp.
Table 11 presents the payback and ROI, which have been calculated with and without both of these tax incentives for the solar PV system. The payback and ROI are calculated to be highest for 2019, which is 9.1 years and 10.9%, and lowest at 6.3 years and 15.9% for 2022, as presented in Table 11. From the historical evidence of prices gathered for solar panels, it is predicted that the price will keep reducing over time. This positive sign will result in increasing penetration of alternative energy generation for building usages in Malaysia [40,41].
The total energy-saving initiative is contributed to by each and every piece of equipment, which results in the reduction of the utility bill. Therefore, for any sector, it is of utmost importance to evaluate the cumulative payback and ROI, since they could produce attractive savings in monthly billing. The cumulative payback and ROI are 3.7 years and 27.3%, respectively, as shown in Table 12.
Table 12.
Cumulative Payback & ROI.
3.4. Building Energy Index
In Malaysia, the performance of a commercial building is measured by using the building energy index (BEI). BEI is described as the energy consumption per annum per sqm of the building, commonly referred to as MS 1525:2014 [36,37]. This states that the energy-efficient commercial building needs to have an improved BEI of less or equal to 135 kWh/m2/year. Many studies have been conducted for multiple commercial buildings such as institutions, hospitals, offices, and large governmental buildings, using the mathematical equation as shown in Equation (10) [30,33,36,37]. Since no BEI measurement has been analysed for an operational restaurant building, this research measures the concentric BEI among fast-food restaurant buildings without and with renewable energy and energy-efficient implementation.
In this research, the BEI value for a 20-h fast-food restaurant without any energy-efficient implementation is found to be 1097.9 kWh/m2/year. At post-implementation of energy-efficient equipment, the BEI value is calculated to be 856.4 kWh/m2/year. Hence, the improved BEI shows a reduction of 22%
3.5. Impact on Emission Reduction with Energy Efficient Equipment
The introduction of energy-efficient devices and the addition of renewable generation not only save energy but also contribute to the decline in pollutants from the building. The three parameters which raise concern for the rising of sea levels due to an increase in ground temperature are SO2, CO, and CO2. Hence, the reduction of these pollutants will be presented in this section.
The emission reduction is calculated using Equation (9), Malaysia energy mix data, and the energy-saving data from Table 10, Table 11 and Table 12.
Figure 7 presents the emission reduction amount per annum of each piece of equipment. The biggest reduction in pollutant emission is contributed by the air-conditioning system, and is related to its functioning capacity. As it consists of 42% of total energy consumption and uses an energy-efficient system, a total of 33.42 kg of CO2, 355.3 kg of SO2, and 155.3 kg of CO have been omitted.
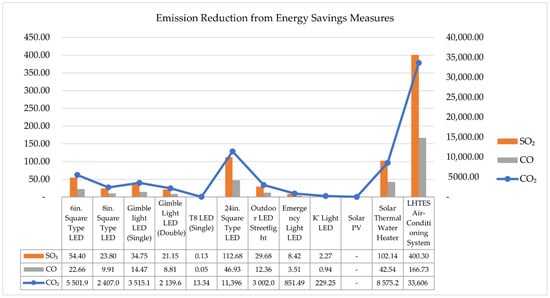
Figure 7.
Emission Reduction from Post-Implementation.
The installation of renewable energy (solar) will substitute the usage of fossil fuel-generated power, and the capacity is variable based on space availability. For the studied site, a total of 29,074.7 kg of CO2, 271.5 kg of SO2, and 118.9 kg of CO pollutants can be omitted by applying Solar PV and a Solar Thermal Water Heater.
From energy reduction obtained by using energy-efficient equipment, a total of 91,392.1 kg CO2, 881.8 kg SO2, and 385.5 kg of CO have been omitted.
4. Conclusions
Fast-food restaurants are some of the rapidly growing businesses in Malaysia. Despite economic challenges during the recent COVID-19 pandemic, they have managed to perform throughout and remain unshakable. The post-COVID situation in Malaysia has changed the operational guideline for fast-food restaurants, especially the operating hours. However, from an energy perspective, they are still some of the high-energy-intensity buildings with a small footprint.
It is understood that a fast-food restaurant adopts very stringent criteria in ensuring the outlook of the restaurant, which goes beyond selling food alone. It emphasizes the specific ambiance, to make a safe, delicious feel-good moment for its guests.
The analysis was conducted to identify the potential of energy-saving strategies which could be implemented without affecting the business needs. From this, it was found that the fast-food restaurant consumed approximately 869 MWh of energy per annum. The energy intensity of the restaurant was found to be 1097.9 kWh/m2/year. A total of 22% (i.e., from 1097.9 kWh/m2/year to 856.4 kWh/m2/year) of energy intensity was reduced by using various energy-saving strategies. The building energy index is not compatible with a commercial building, as the energy consumption is high and the operational hours are long. Hence, a reference-based building index is proposed. For this case study, by using energy-efficient equipment, approximately 91,392.1 kg CO2, 881.8 kg SO2, and 385.5 kg CO was reduced. The total energy bill savings obtained was RM 97,365.9.
Cumulative payback and ROI were considered the totality of energy, were measured from all implementations of energy-efficient fittings, and were 3.7 years and 27.3%, respectively.
Author Contributions
Conceptualization, M.K.G., M.H., C.T. and A.H.A.B.; methodology, M.K.G. and M.H.; resources, M.K.G. and V.P.; writing—original draft preparation, M.K.G.; writing—review and editing, M.H. and V.P.; visualization, M.K.G. and M.H.; supervision, M.H., C.T. and A.H.A.B.; project administration, M.H. and C.T.; funding acquisition, A.H.A.B. All authors have read and agreed to the published version of the manuscript.
Funding
This research received no external funding.
Institutional Review Board Statement
Not applicable.
Informed Consent Statement
Not applicable.
Data Availability Statement
Not applicable.
Acknowledgments
The authors would like to sincerely acknowledge and thank the University of Malaya and Gerbang Alaf Restaurants Sdn. Bhd. for the support provided in performing this study.
Conflicts of Interest
The authors declare no conflict of interest.
Nomenclature
| AEC | Annual Energy Consumption |
| BEI | Building Energy Index |
| CFL | Compact Florescent Light |
| GHG | Greenhouse Gas |
| HEM | High Efficiency Motor |
| kgCO | Kilogram of carbon monoxide equivalent |
| kgCO2 | Kilogram of carbon dioxide equivalent |
| kgSO2 | Kilogram of sulfur dioxide equivalent |
| kW | kilo Watt |
| kWh | kilo Watt hour |
| LED | Light Emitting Diode |
| LF | Load Factor |
| LHTES | Latent Heat Energy Storage |
| Mtoe | Million tonnes oil equivalent |
| MWh | Mega Watt hour |
| PV | Photovoltaic |
| RM | Ringgit Malaysia |
| ROI | Return On Investment |
| TEC | Total Energy Consumption |
| VSD | Variable Speed Drive |
References
- Mel Keytingan, M.S.; Nor Azuana, R.; Lilik, J.A. Energy consumption prediction by using machine learning for smart building: Case study in Malaysia. Dev. Built Environ. 2021, 5, 100037. [Google Scholar]
- Wei, Q.; Li, Q.; Yang, Y.; Zhang, L.; Xie, W. A summary of the research on building load forecasting model of colleges and universities in North China based on energy consumption behavior: A case in North China. Energy Rep. 2022, 8, 1446–1462. [Google Scholar] [CrossRef]
- Ali Muslim, S.; Caroline, H. Net-zero energy design and energy sharing potential of Retail—Greenhouse complex. J. Build. Eng. 2019, 24, 100736. [Google Scholar]
- Energy Commission Malaysia. Malaysia Energy Statistics Handbook 2020; Energy Commission: Putrajaya, Malaysia, 2021.
- Malaysia Investment Development Authority. Food Industry in Malaysia; Malaysia Investment Development Authority: Lumpur, Malaysia, 2018; p. 4.
- JLL Property Services Sdn. Bhd. Property Market Trend Analysis; JLL Property Services Sdn. Bhd: Kuala Lumpur, Malaysia, 2019; pp. 1–22. [Google Scholar]
- Maryam, K.; Zhonghua, G.; Karine, D. Energy use characteristics and benchmarking for higher education buildings. Energy Build. 2018, 164, 61–76. [Google Scholar]
- Habib, M.A.; Hasanuzzaman, M.; Hosenuzzaman, M.; Salman, A.; Mehadi, M.R. Energy consumption, energy saving and emission reduction of a garment industrial building in Bangladesh. Energy 2016, 112, 91–100. [Google Scholar] [CrossRef]
- Siti Birkha Mohd, A.; Hasanuzzaman, M.; Rahim, N.A.; Mamun, M.A.A.; Obaidellah, U.H. Analysis of energy consumption and potential energy savings of an institutional building in Malaysia. Alex. Eng. J. 2021, 60, 805–820. [Google Scholar] [CrossRef]
- Saidur, R.; Hasanuzzaman, M.; Yogeswaran, S.; Mohammed, H.; Hossain, M. An end-use energy analysis in a Malaysian public hospital. Energy 2010, 35, 4780–4785. [Google Scholar] [CrossRef]
- Saleh, N.J.A.-S.; Ramaswamy, M.; Al-Rashdi, H.; Al-Mamari, M.; Al-Abri, M. Energy Management Strategies for a Governmental Building in Oman. Energy Procedia 2017, 141, 206–210. [Google Scholar]
- Ali, A. Energy audit of an educational building in a hot summer climate. Energy Build. 2012, 47, 122–130. [Google Scholar]
- Saidur, R.; Mekhilef, S. Energy use, energy savings and emission analysis in the Malaysian rubber producing industries. Appl. Energy 2010, 87, 2746–2758. [Google Scholar] [CrossRef]
- Saidur, R.; Hasanuzzaman, M.; Mahlia, T.; Rahim, N.; Mohammed, H. Chillers energy consumption, energy savings and emission analysis in an institutional buildings. Energy 2011, 36, 5233–5238. [Google Scholar] [CrossRef]
- Hasanuzzaman, M.; Rahim, N.; Saidur, R.; Kazi, S. Energy savings and emissions reductions for rewinding and replacement of industrial motor. Energy 2011, 36, 233–240. [Google Scholar] [CrossRef]
- Saidur, R. Energy consumption, energy savings, and emission analysis in Malaysian office buildings. Energy Policy 2009, 37, 4104–4113. [Google Scholar] [CrossRef]
- Sher, F.; Kawai, A.; Güleç, F.; Sadiq, H. Sustainable energy saving alternatives in small buildings. Sustain. Energy Technol. Assess. 2019, 32, 92–99. [Google Scholar] [CrossRef]
- Alireza, A.; Asieh, B.; Hadi, A.M. Energy-efficiency technologies in the building envelope: Life cycle and adaptation assessment. J. Build. Eng. 2019, 21, 55–63. [Google Scholar]
- Zhang, S.; Ocłoń, P.; Klemeš, J.J.; Michorczyk, P.; Pielichowska, K.; Pielichowski, K. Renewable energy systems for building heating, cooling and electricity production with thermal energy storage. Renew. Sustain. Energy Rev. 2022, 165, 112560. [Google Scholar] [CrossRef]
- Rathore, P.K.S.; Gupta, N.K.; Yadav, D.; Shukla, S.K.; Kaul, S. Thermal performance of the building envelope integrated with phase change material for thermal energy storage: An updated review. Sustain. Cities Soc. 2022, 79, 103690. [Google Scholar] [CrossRef]
- Javid, B.; Ali, H.-F. Performance evaluation of the solar-driven multi-ejector refrigeration cycle without an auxiliary heat source. Appl. Therm. Eng. 2022, 217, 119214. [Google Scholar]
- Parameshwaran, R.; Kalaiselvam, S.; Harikrishnan, S.; Elayaperumal, A. Sustainable thermal energy storage technologies for buildings: A review. Renew. Sustain. Energy Rev. 2012, 16, 2394–2433. [Google Scholar] [CrossRef]
- Jiang, W.; Hu, H.; Tang, X.; Liu, G.; Guo, W.; Jin, Y.; Li, D. Protective energy-saving retrofits of rammed earth heritage buildings using multi-objective optimization. Case Stud. Therm. Eng. 2022, 38, 102343. [Google Scholar] [CrossRef]
- Chenxi, H.; Ruoyi, X.; Xi, M. A systemic review to improve the intermittent operation efficiency of air-conditioning and heating system. J. Build. Eng. 2022, 60, 105136. [Google Scholar]
- Pérez, B.P.; Gutiérrez, M.Á.; Carrillo, J.A.E.; Lissén, J.M.S. Performance of Solar-driven Ejector Refrigeration System (SERS) as pre-cooling system for air handling units in warm climates. Energy 2022, 238, 121647. [Google Scholar] [CrossRef]
- Cheng, Y.; Wang, M.; Yu, J. Thermodynamic analysis of a novel solar-driven booster-assisted ejector refrigeration cycle. Sol. Energy 2021, 218, 85–94. [Google Scholar] [CrossRef]
- Azis, S.S.A. Improving present-day energy savings among green building sector in Malaysia using benefit transfer approach: Cooling and lighting loads. Renew. Sustain. Energy Rev. 2021, 137, 110570. [Google Scholar] [CrossRef]
- Al Rashdi, S.A.; Sudhir, C.V.; Basha, J.S.; Saleel, C.A.; Soudagar ME, M.; Yusuf, A.A.; El-Shafay, A.S.; Afzal, A. A case study on the electrical energy auditing and saving techniques in an educational institution (IMCO, Sohar, Oman). Case Stud. Therm. Eng. 2022, 31, 101820. [Google Scholar] [CrossRef]
- Saleh, N.A.-S. Pragmatic retrofitting strategies for improving thermal, energy, and economic performance of an institutional building in a cooling-dominated climate. J. Build. Eng. 2021, 44, 103326. [Google Scholar]
- Merabtine, A.; Maalouf, C.; Hawila AA, W.; Martaj, N.; Polidori, G. Building energy audit, thermal comfort, and IAQ assessment of a school building: A case study. Build. Environ. 2018, 145, 62–76. [Google Scholar] [CrossRef]
- Energy Commission. Electricity Tariff Review in Peninsular Malaysia for Regulatory Period 2 (RP2: 2018–2020) under Incentive-Based Regulation (IBR) Mechanism; Energy Comission: Putrajaya, Malaysia, 2018; pp. 1–42.
- Rentao, D.; Jiuping, X.; Bo, L. ROI-based study on impact factors of distributed PV projects by LSSVM-PSO. Energy 2017, 124, 336–349. [Google Scholar]
- Ali, S.B.M.; Mehdipoor, A.; Johari, N.S.; Hasanuzzaman; Rahim, N.A. Modeling and Performance Analysis for High-Rise Building Using ArchiCAD: Initiatives towards Energy-Efficient Building. Sustainability 2022, 14, 9780. [Google Scholar] [CrossRef]
- Energy Commission Malaysia. National Energy Balance 2019; Energy Commission Malaysia: Putrajaya, Malaysia, 2022; p. 56.
- Energy Commission. Peninsular Malaysia Electricity Supply Industry Outlook 2019; Energy Comission: Putrajaya, Malaysia, 2019; p. 38.
- Malaysia Green Technology Corporation; Sustainable Energy Development Authority (SEDA) Malaysia. Method to Identify Building Energy Index (BEI), NET BEI, GFA, NFA, ACA; Building Consumption Input System: Bandar Baru Bangi, Malaysia, 2013; pp. 1–7.
- Energy Commission Malaysia. National Building Energy Intensity (BEI) Labelling for Government Building; Energy Commission Malaysia: Putrajaya, Malaysia, 2019.
- Nur Kamaliah, M.; Sakhiah Abdul, K. Challenges and way forward towards best practices of energy efficient building in Malaysia. Energy 2022, 259, 124839. [Google Scholar]
- Dahlan, N.Y.; Mohamed, H.; Kamaluddin, K.A.; Abd Rahman, N.M.; Reimann, G.; Chia, J.; Ilham, N.I. Energy Star based benchmarking model for Malaysian Government hospitals—A qualitative and quantitative approach to assess energy performances. J. Build. Eng. 2022, 45, 103460. [Google Scholar] [CrossRef]
- Koerner, S.A.; Siew, W.S.; Salema, A.A.; Balan, P.; Mekhilef, S.; Thavamoney, N. Energy policies shaping the solar photovoltaics business models in Malaysia with some insights on COVID-19 pandemic effect. Energy Policy 2022, 164, 112918. [Google Scholar] [CrossRef]
- Sandberg, N.H.; Næss, J.; Brattebø, H.; Andresen, I.; Gustavsen, A. Large potentials for energy saving and greenhouse gas emission reductions from large-scale deployment of zero emission building technologies in a national building stock. Energy Policy 2021, 152, 112114. [Google Scholar] [CrossRef]
Publisher’s Note: MDPI stays neutral with regard to jurisdictional claims in published maps and institutional affiliations. |
© 2022 by the authors. Licensee MDPI, Basel, Switzerland. This article is an open access article distributed under the terms and conditions of the Creative Commons Attribution (CC BY) license (https://creativecommons.org/licenses/by/4.0/).