
Evaluation Study on a Novel Structure CCHP System with a New Comprehensive Index Using Improved ALO Algorithm

 ,
,  ,
,
Abstract
1. Introduction
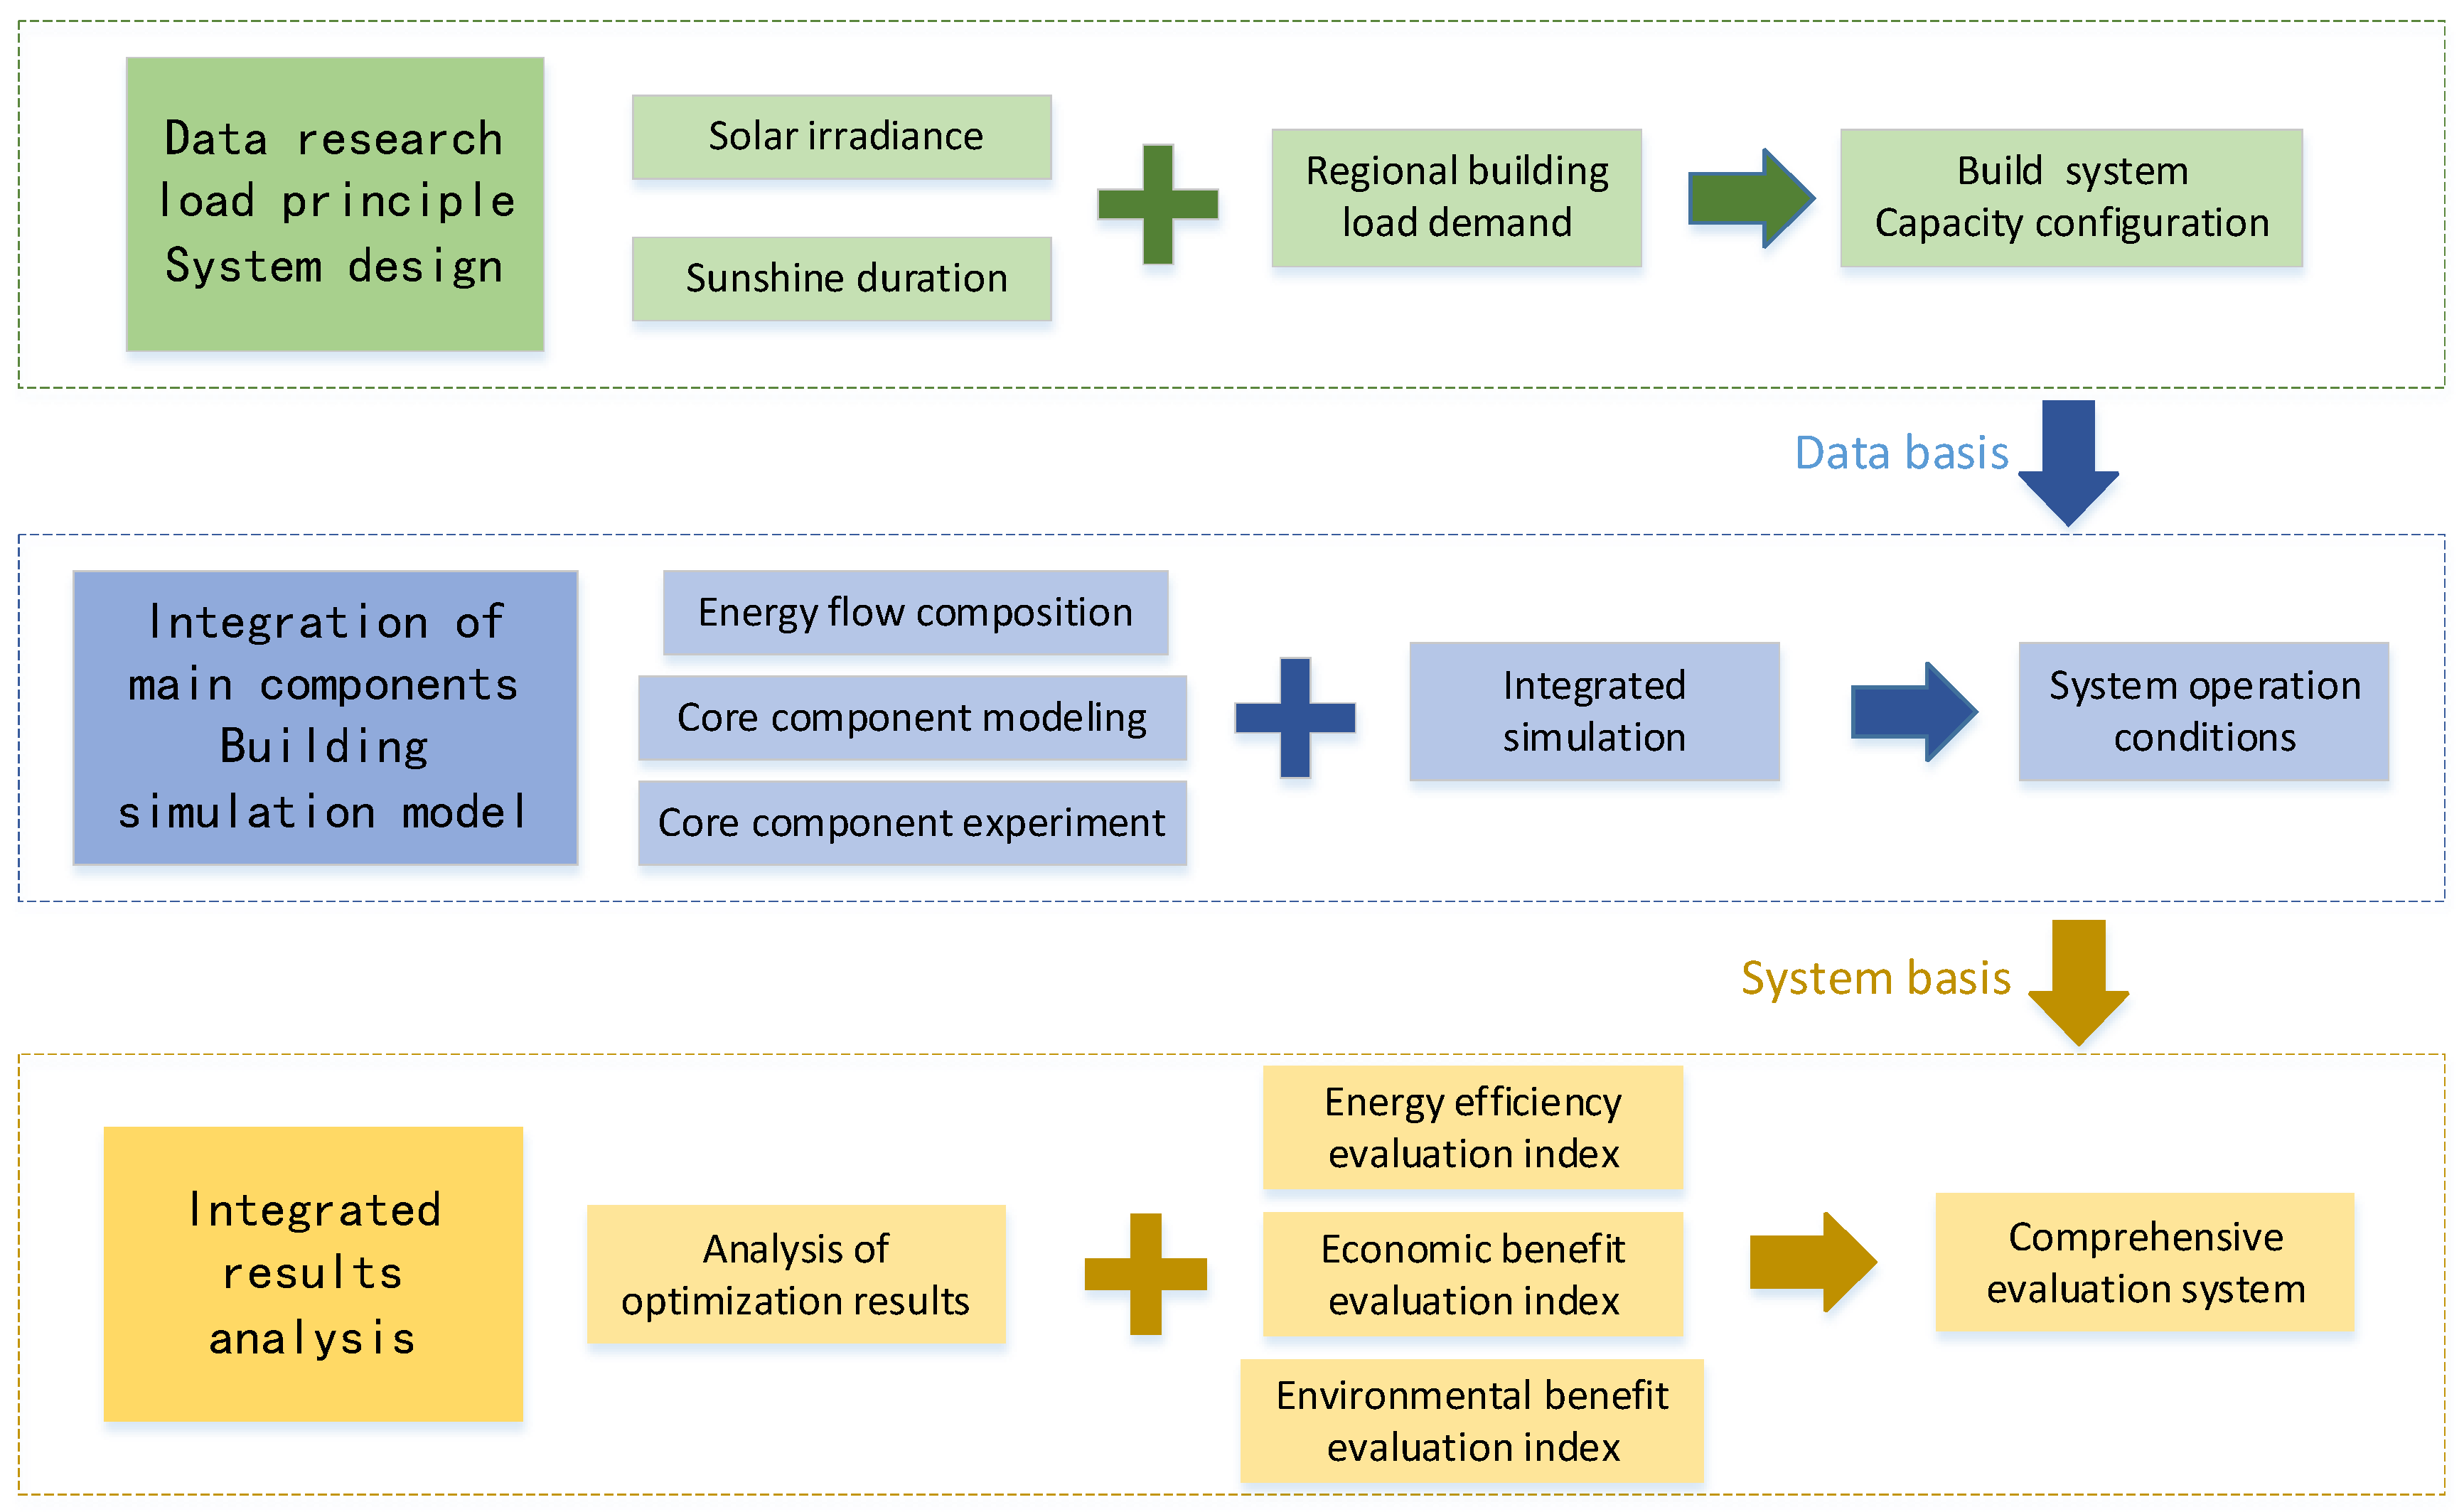
- 1.
- The photovoltaic power generation model is established according to the meteorological data of solar irradiance and sunshine hours in the Huai’an area, and the photovoltaic power generation curve is obtained. Combined with a chemical enterprise’s cooling, heating, and power load demand curve, the input data of the cooling, heating, and electricity demand are formed.
- 2.
- A novel CCHP model is constructed, and the overall equipment model is established. The essential parts are finely modeled, and the capacity of the equipment is configured. Considering the annual operation of the system, the operating condition curve is output.
- 3.
- A comprehensive evaluation system is established and used as the objective function. The intelligent optimization algorithm is used to optimize the equipment capacity configuration to flexibly adjust the optimal equipment capacity in the system’s operation.
2. Methods
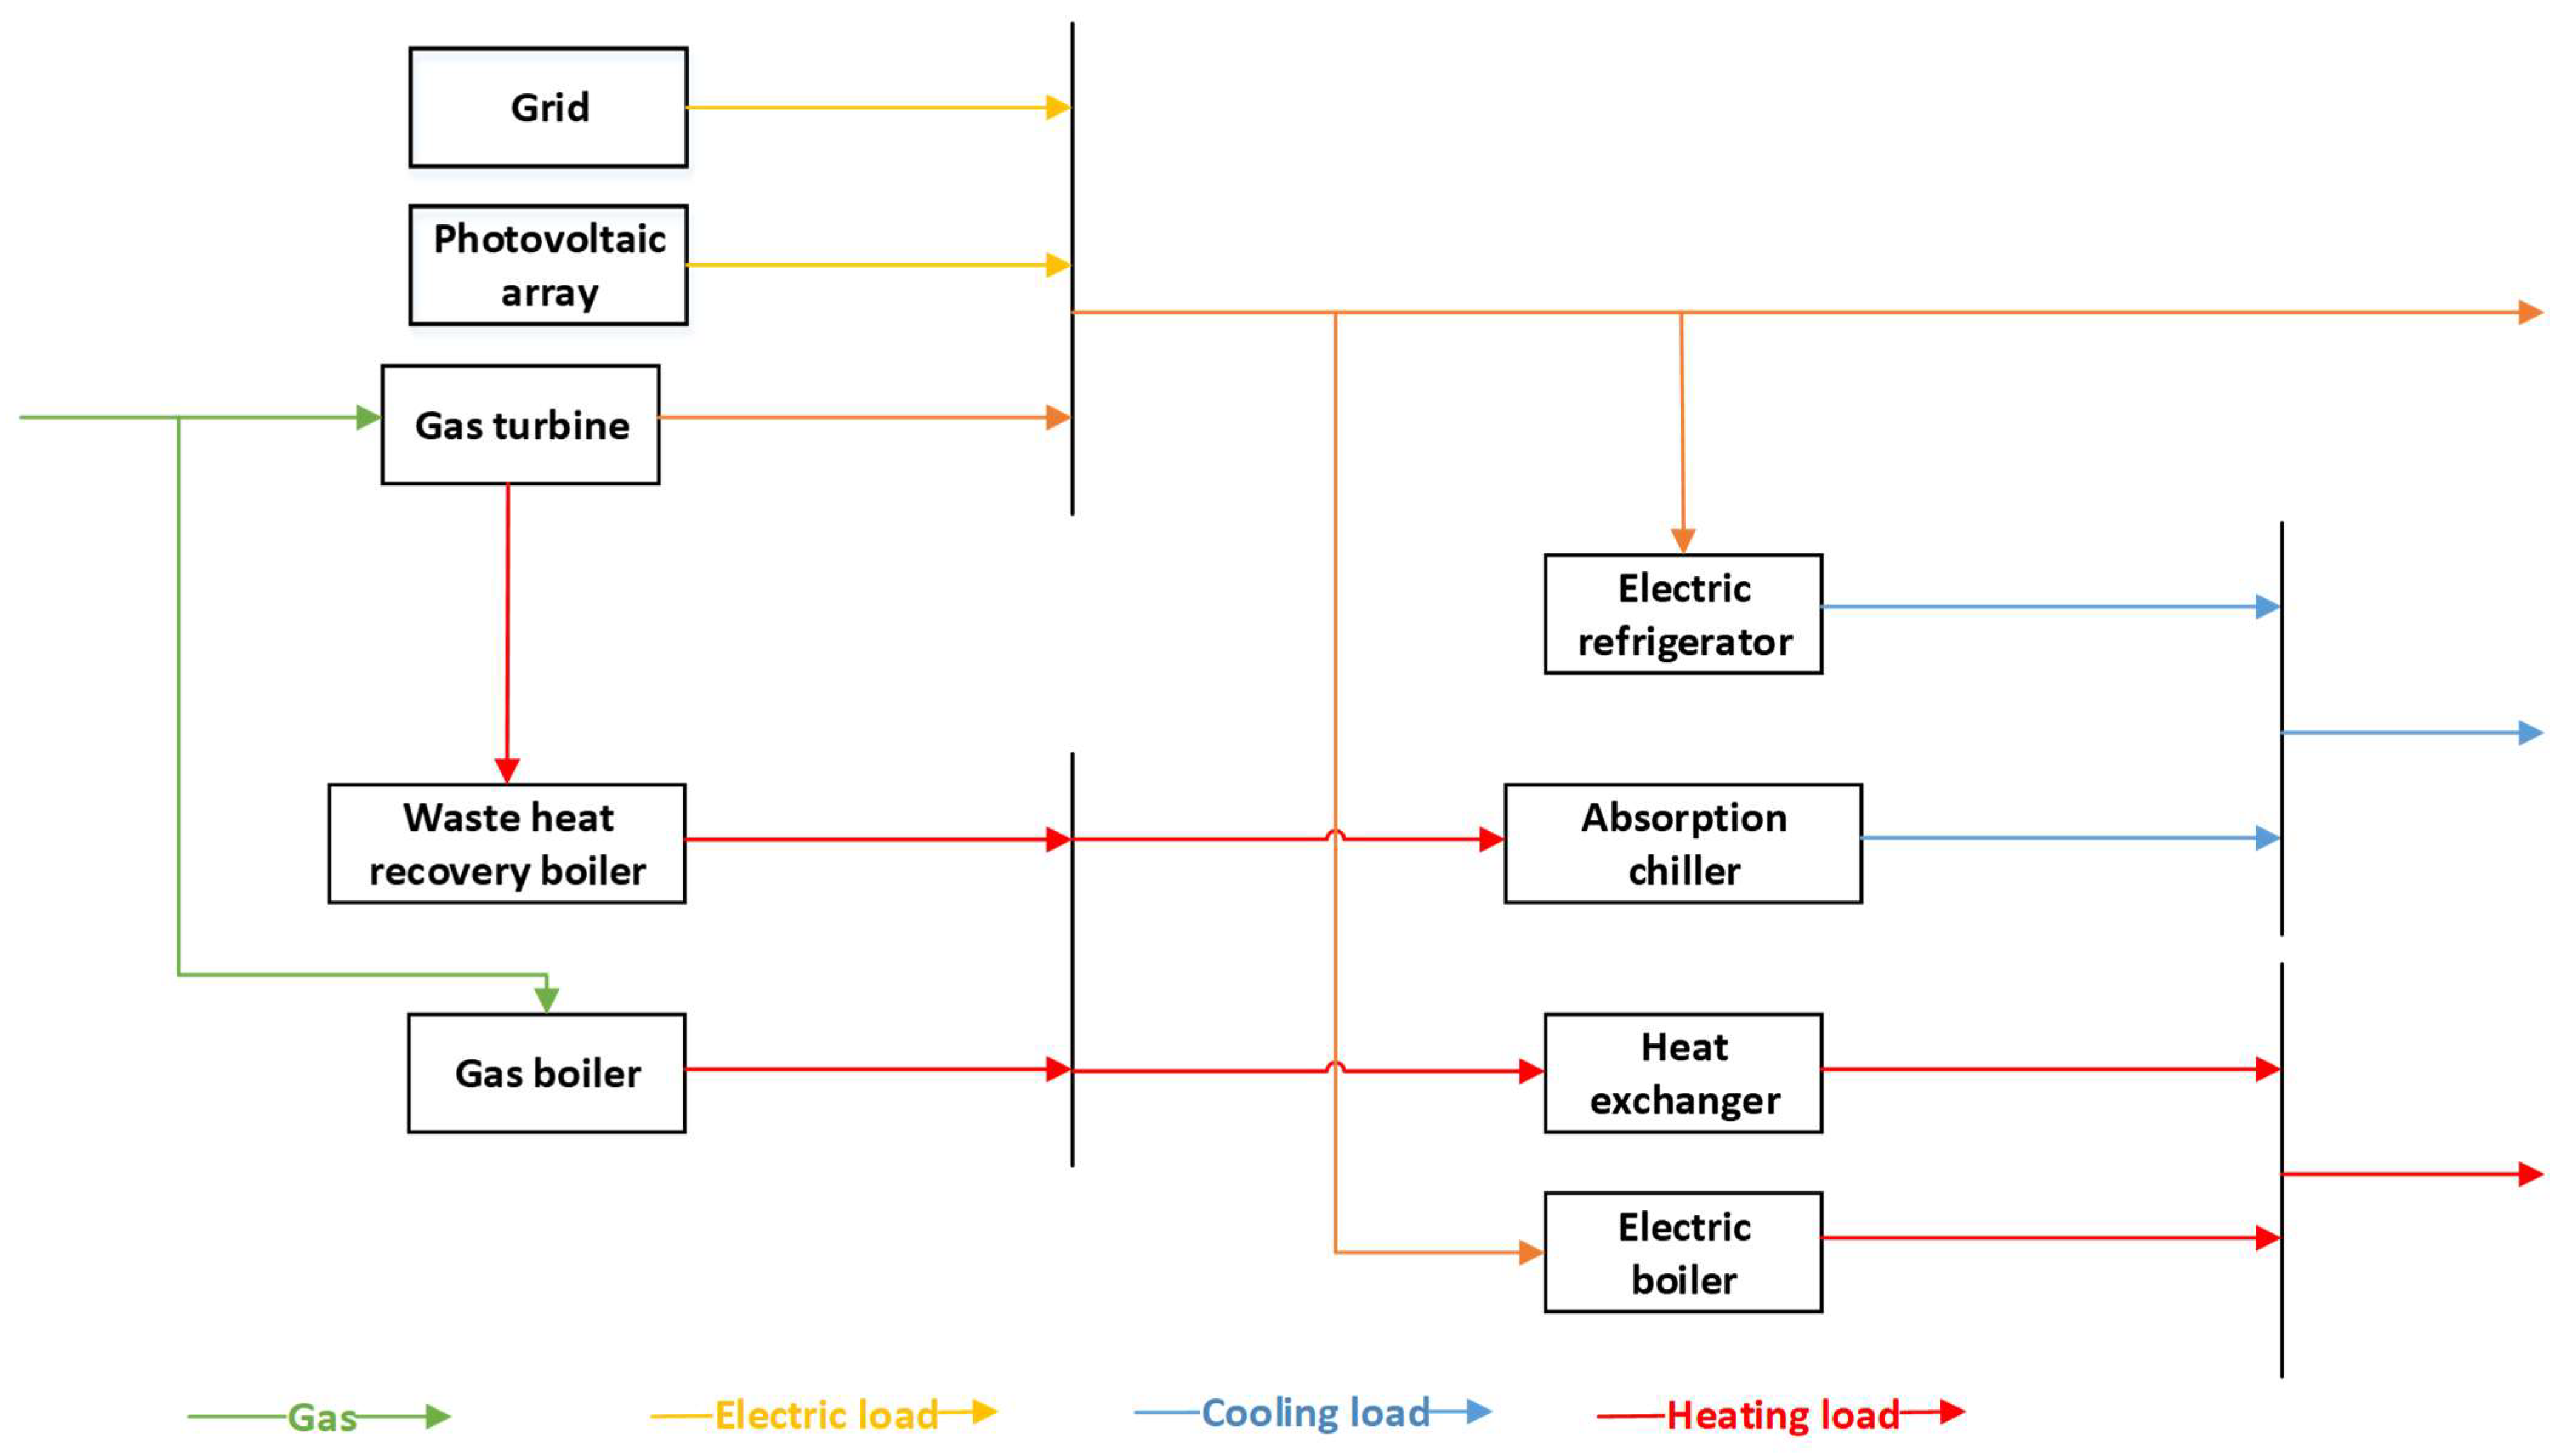
2.1. Energy Flow in CCHP System
2.2. Structure of CCHP System
2.2.1. Gas Turbine (GT)
2.2.2. Gas Boiler (GB)
2.2.3. Electric Refrigerator (EC)
2.2.4. Waste Heat Lithium Bromide Absorption Chiller (AC.W)
2.2.5. Steam Dual-Effect Lithium Bromide Absorption Chiller (AC.S)
2.2.6. Waste Heat Recovery Boiler (WHRB)
2.2.7. Photovoltaic Array (PV)
2.2.8. Electric Boiler (EB)
2.2.9. Heat Exchanger (HEX)
3. Capacity Configuration Optimization Model
3.1. System Capacity Configuration Aiming at Demand
3.2. Comprehensive Evaluation System
3.2.1. Annual Cost
- (1)
- Investment Cost
- (2)
- Operation Cost
- (3)
- Maintenance Cost
3.2.2. Primary Energy Ratio
3.2.3. Carbon Dioxide Emissions
3.2.4. Comprehensive Evaluation Index
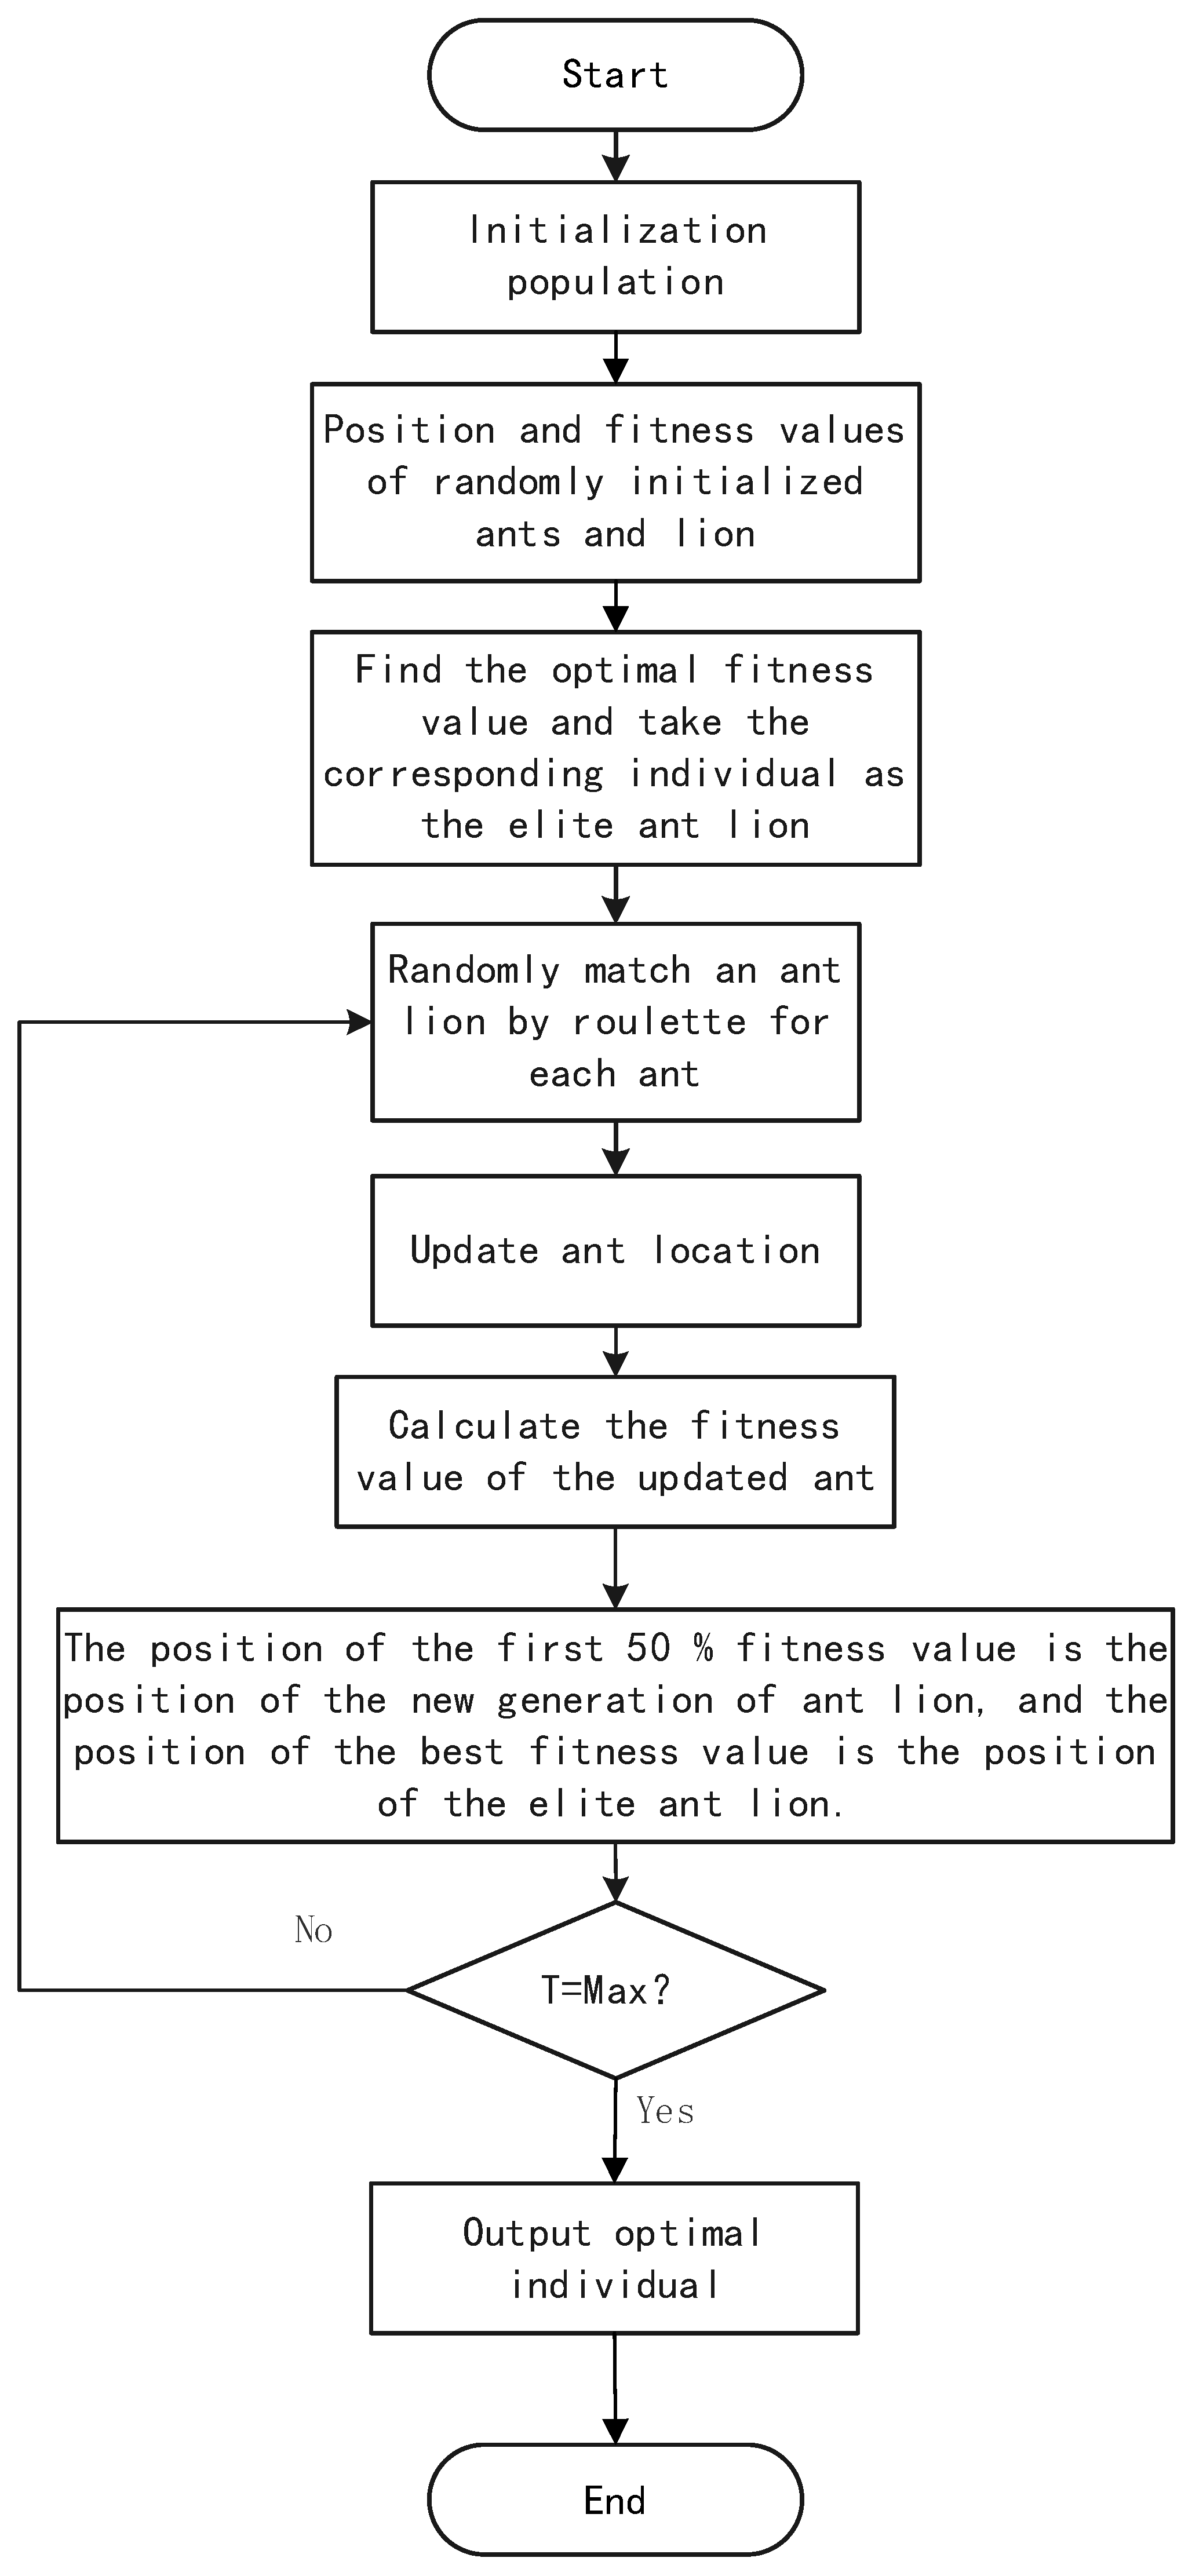
3.3. Improved Ant Lion Intelligent Optimization Algorithm
3.3.1. Ant Lion Intelligent Optimization Algorithm
3.3.2. Improved Ant Lion Intelligent Optimization Algorithm
Continuous Contraction Boundary
Increasing Weight Coefficient
Improved Ant Lion Intelligent Optimization Algorithm
3.4. Model Verification
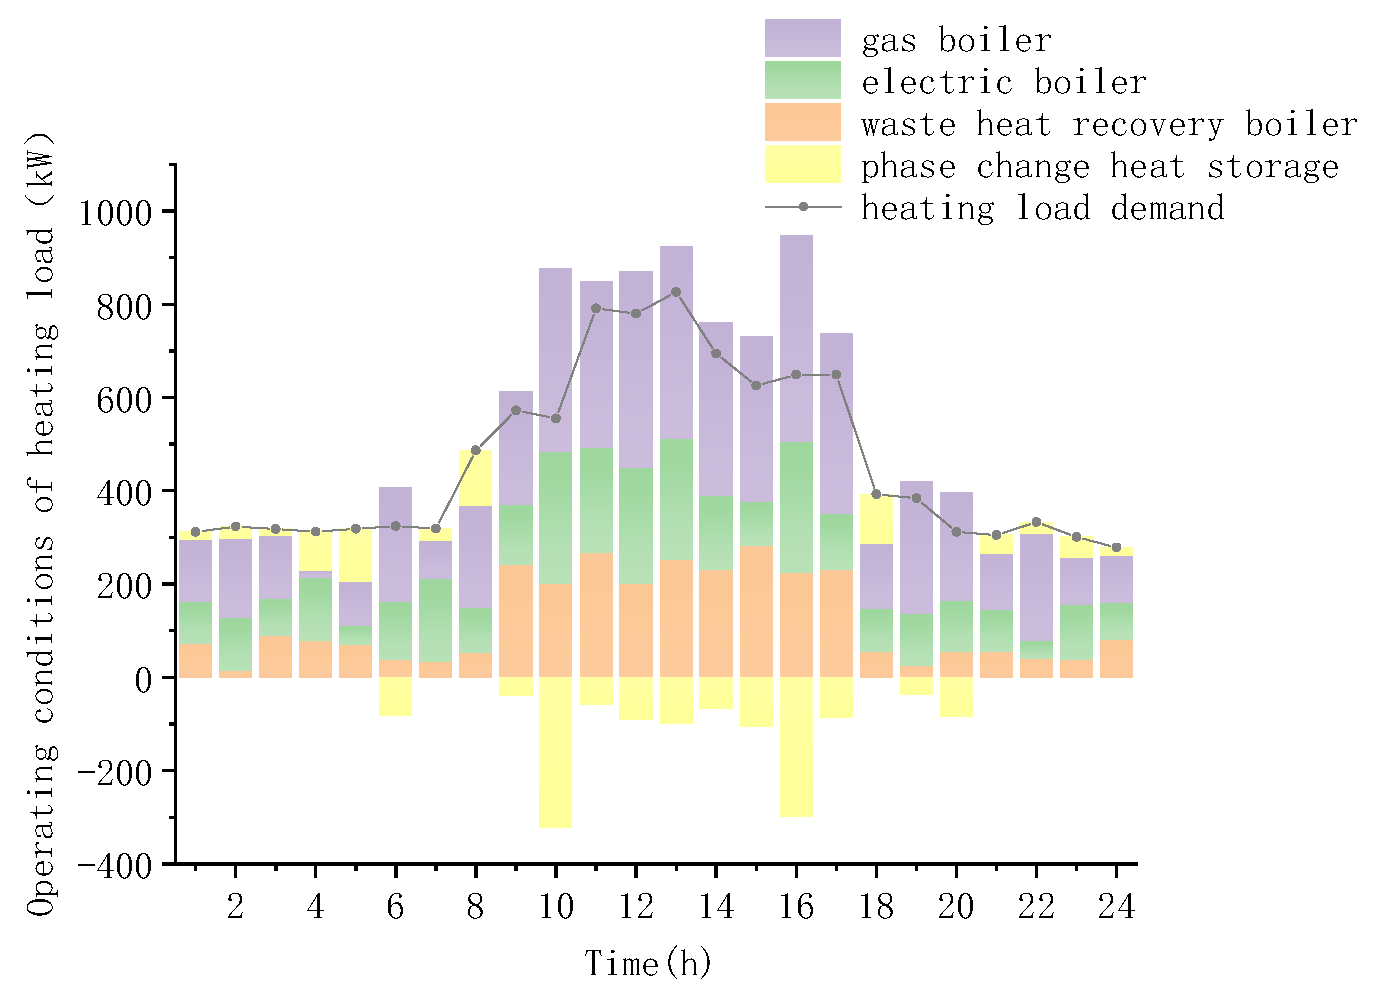
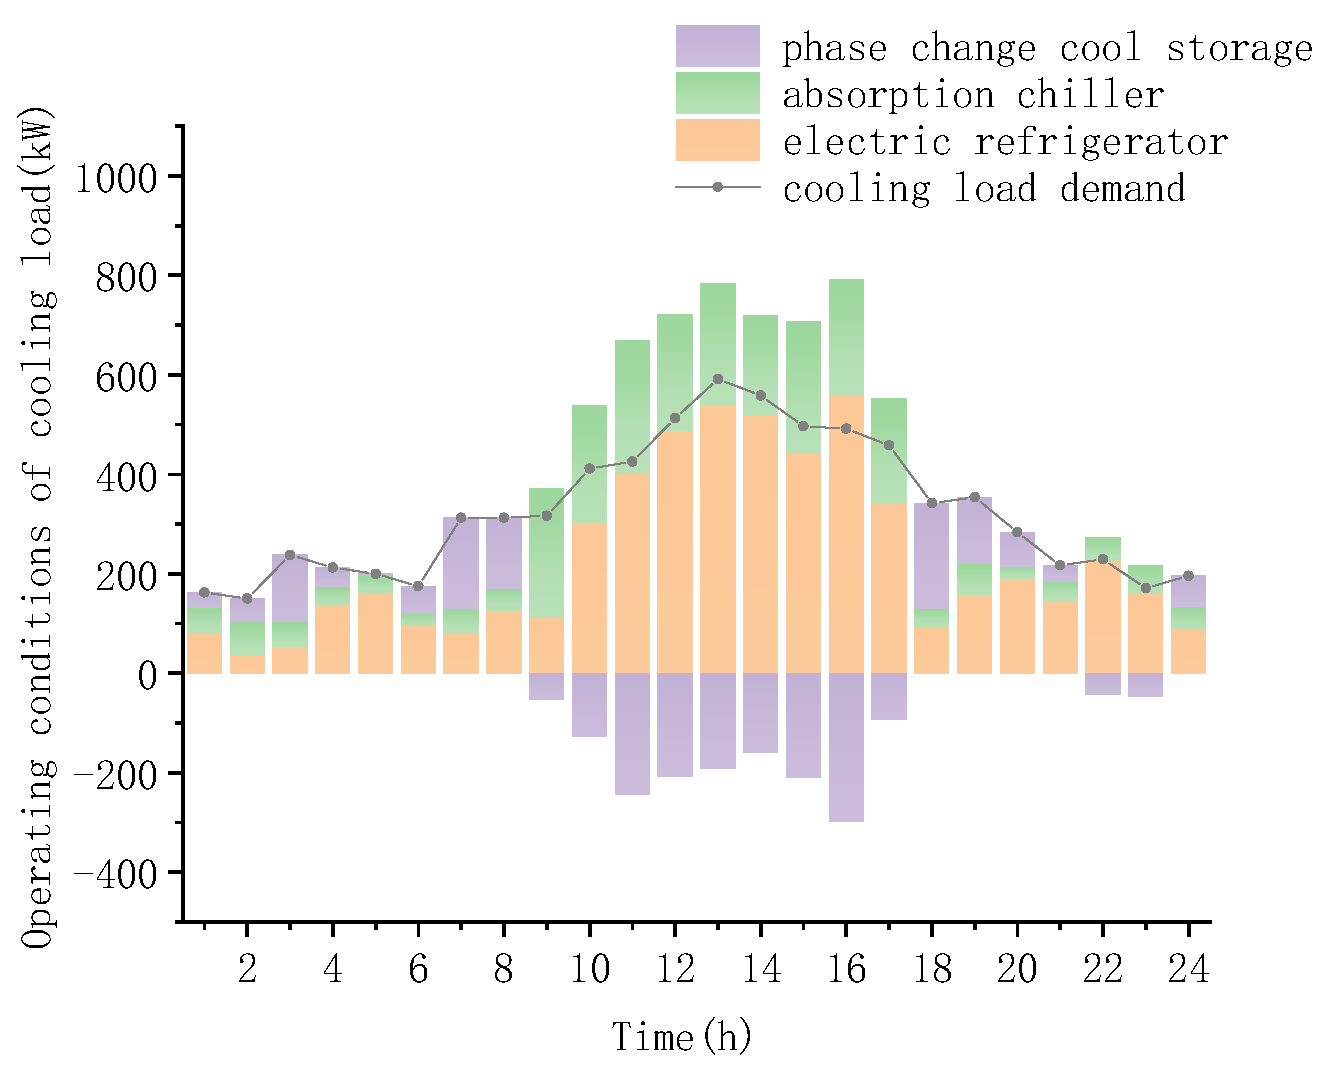
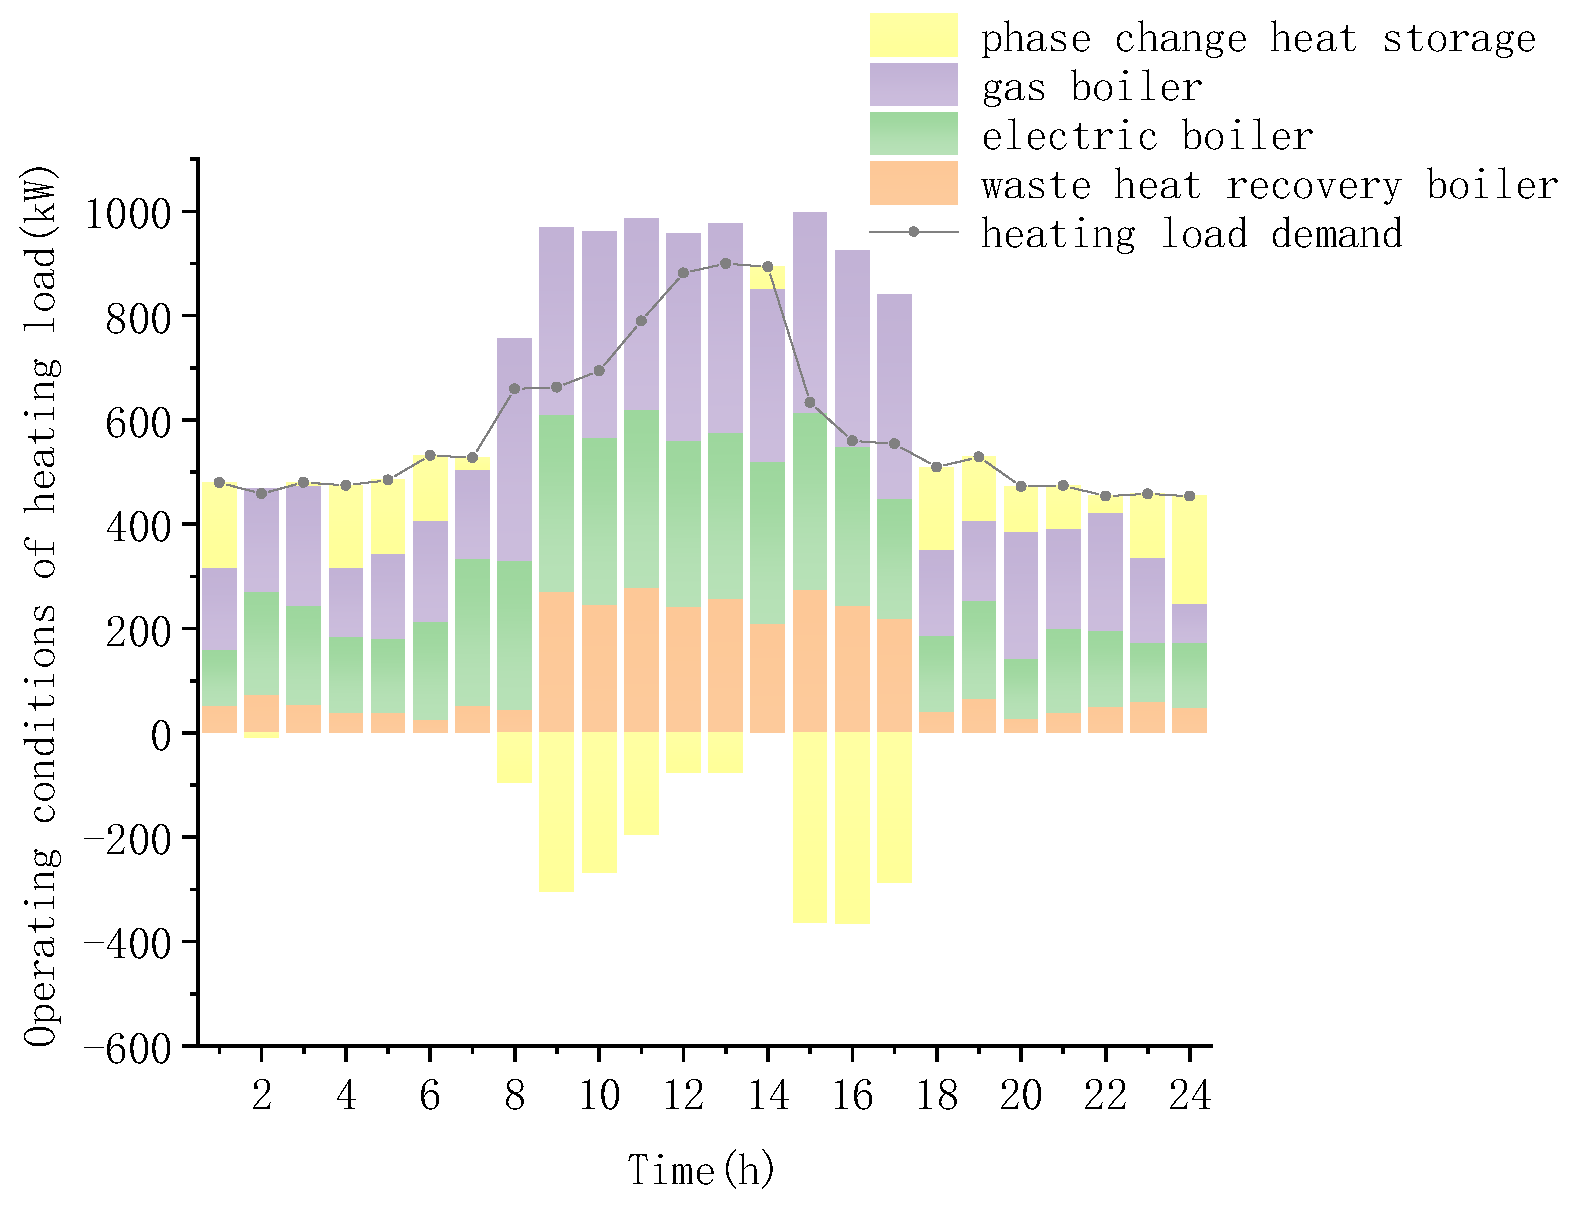
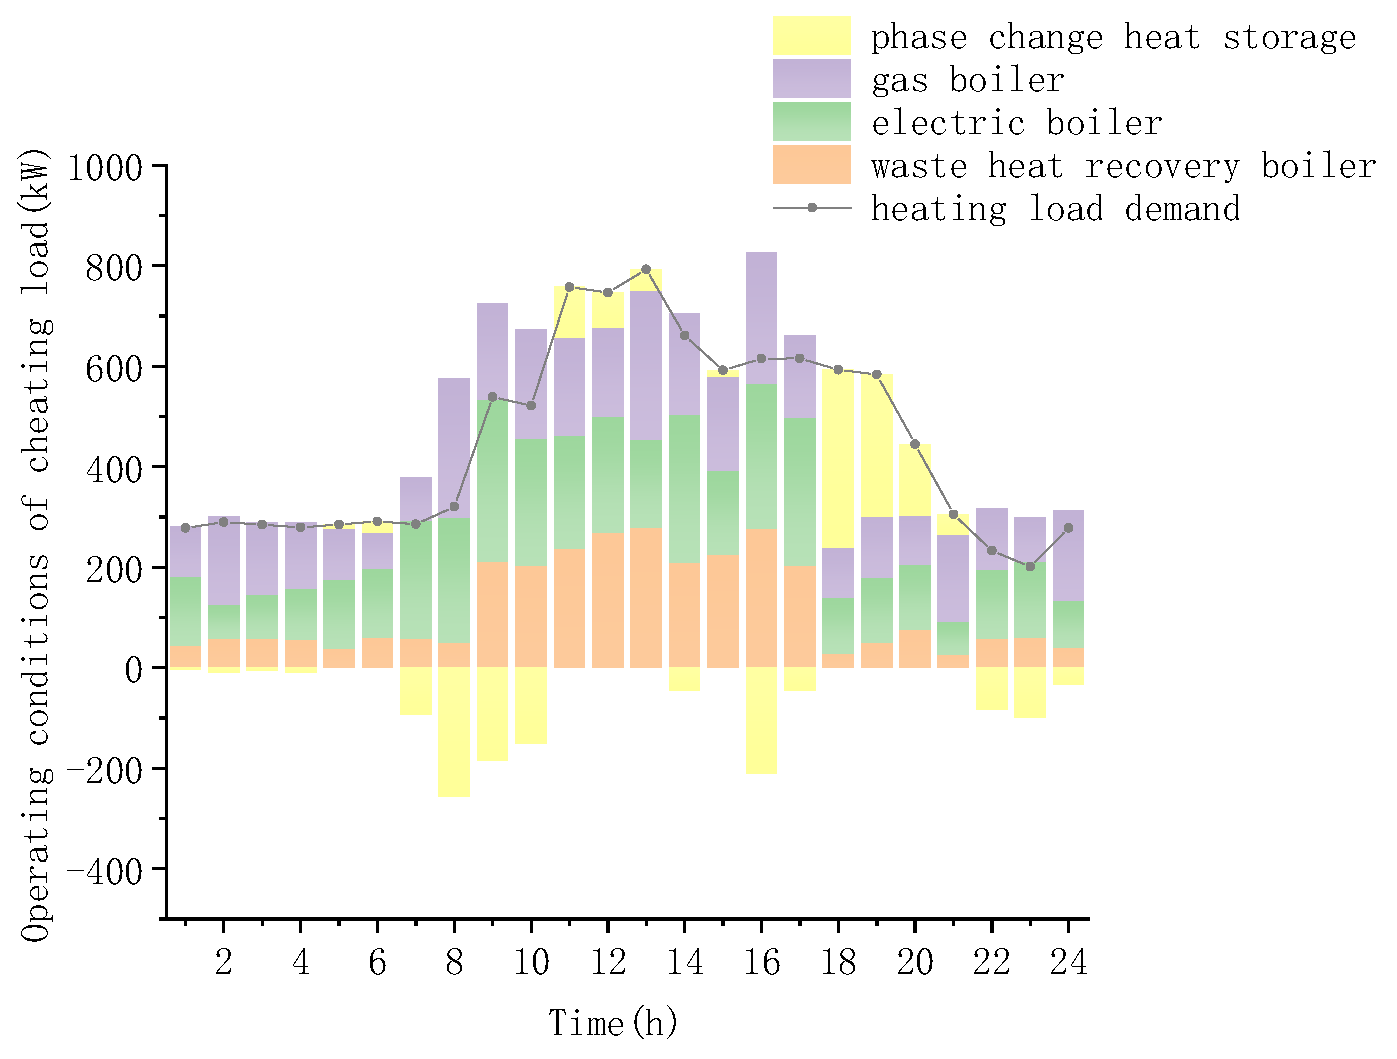
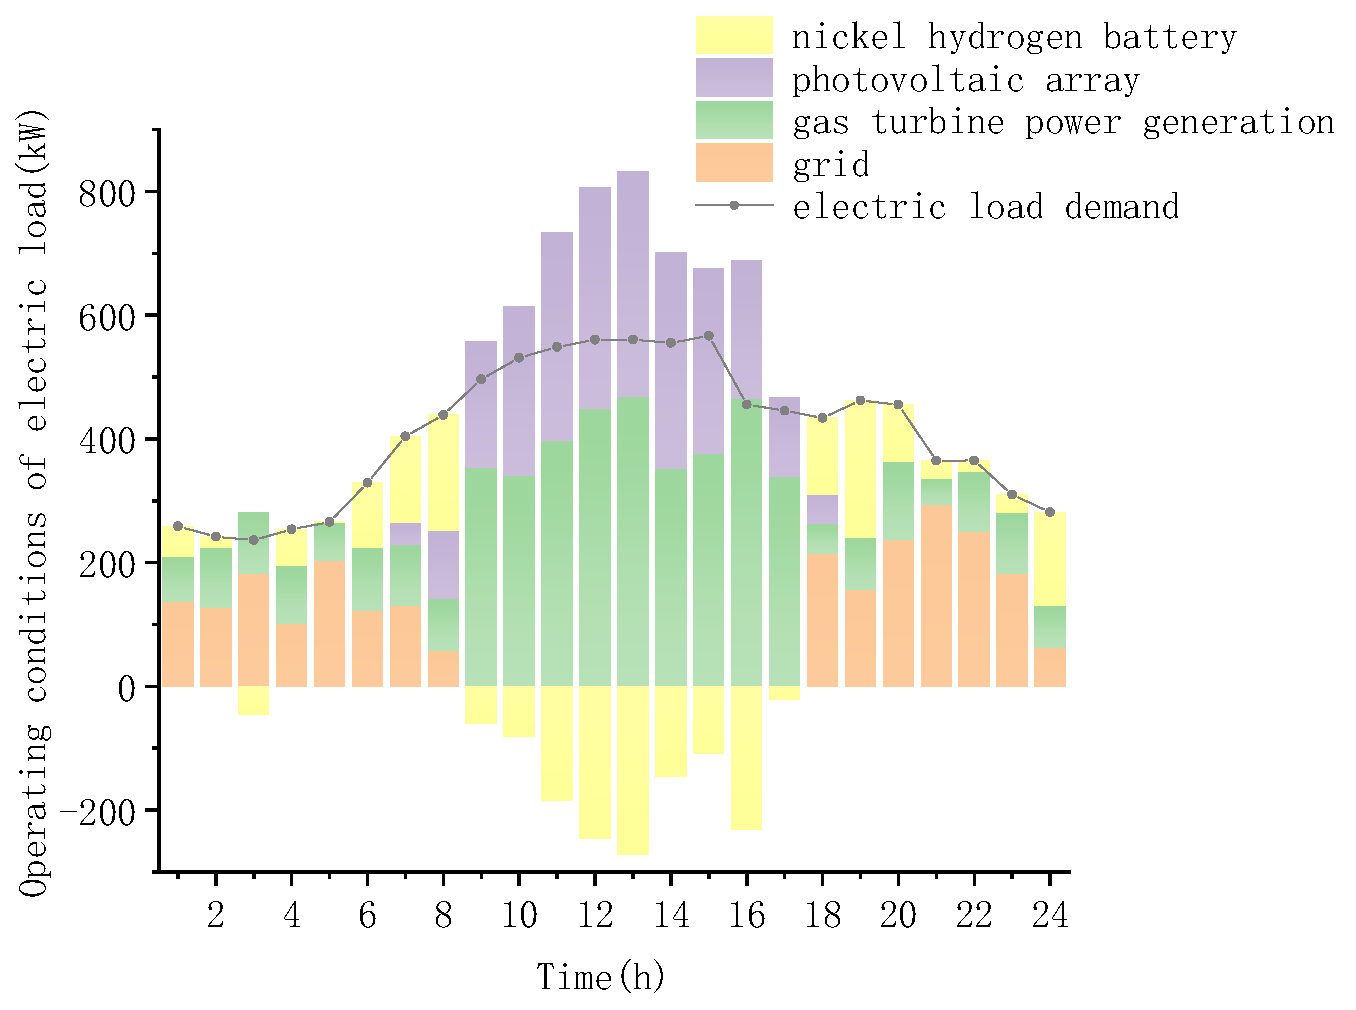
4. Results
5. Conclusions
- (1)
- The annual operating conditions of the new energy system proposed in this paper are excellent, and the annual cost index is the lowest at CNY 5.155 million on typical summer days. The minimum carbon dioxide emissions are 119030.11 kg, and the highest primary energy utilization rate was 75.87% on typical winter days. The minimum annual cost index is CNY 5859 million. The minimum carbon dioxide emissions are 142854.91 kg. At the same time, the highest primary energy utilization rate was 71.86% on the typical days of the transition season. The minimum annual cost index is CNY 5335 million. The minimum carbon dioxide emissions are 120724.29 kg, and the highest primary energy utilization rate was 74.9%.
- (2)
- The comprehensive evaluation system adopted in this paper is composed of annual cost, primary energy utilization rate, and carbon dioxide emissions. The coupling adopts the method of adding weights. The selection of weights considers the contribution of each index. When applied to the research object, the optimal comprehensive index can reach 0.814.
- (3)
- The modelling and simulation results show that the ant lion optimization algorithm can improve the rationality of the capacity allocation of the system equipment. Compared with the typical CCHP system, the performance of the CCHP system with structural optimization is better. The summer performance is the best for the system’s annual operation. Specifically, in terms of annual cost, the annual cost savings of the new structural system are up to 13%. The unique structural system has a maximum reduction of 36.39% in carbon dioxide emissions. In terms of primary energy utilization, the primary energy utilization rate of the new structural system increases by up to 18%. The overall comprehensive evaluation system is up to 0.814.
Author Contributions
Funding
Institutional Review Board Statement
Informed Consent Statement
Data Availability Statement
Conflicts of Interest
Nomenclature
| GT | Gas Turbine |
| EC | Electric Refrigerator |
| AC.W | Waste heat lithium bromide absorption chiller |
| AC.S | Steam dual-effect lithium bromide absorption chiller |
| WHRB | Waste Heat Recovery Boiler |
| PV | Photovoltaic Array |
| EB | Electric Boiler |
| HEX | Heat Exchanger |
| ATC | Annual Cost |
| PER | Primary Energy Ratio |
| CDE | Carbon Dioxide Emissions |
| HEL | Comprehensive Evaluation Index |
References
- Sun, S.; Yu, C.; Sun, T.; Li, X.; Wei, Y.; Tan, J.; Zhang, J. Research Progress of CCHP Distributed Energy System. Water Conserv. Electr. Power Mach. 2019, 41, 7. [Google Scholar]
- Meng, X.; Nan, Z.; Li, B.; Feng, H. Design and Energy Analysis of CCHP System Based on Natural Gas Internal Combustion Engine Generator Set. Energy Conserv. 2019, 38, 4. [Google Scholar]
- Li, Z.; Li, W.; Zhao, J.; Shan, D. Parameter optimization and comprehensive analysis of biomass-driven ORC triple supply system. Acta Energ. Sol. Sin. 2020, 41, 7. [Google Scholar]
- Zhang, X.; Ge, L.; Gao, B.; Zhang, S. Joint Optimization and Ideal Fuzzy Decision Method of CCHP and Distributed Photovoltaic System. J. Henan Polytech. Univ. Nat. Sci. 2020, 39, 7. [Google Scholar]
- Wei, Z.; Gen, Y.; Chi, F.; Sun, K. Photovoltaic Capacity Configuration of CCHP System Based on Niche and Fuzzy Ideal Decision. J. Yanshan Univ. 2019, 43, 8. [Google Scholar]
- Ji, J.; Xia, X.; Ni, W.; Teng, K.; Miao, C.; Wang, Y.; Roskilly, T. An Experimental and Simulation Study on Optimisation of the Operation of a Distributed Power Generation System with Energy Storage—Meeting Dynamic Household Electricity Demand. Energies 2019, 12, 1091. [Google Scholar] [CrossRef]
- Zhang, T.; Hu, Z.; Zhang, D. Capacity Configuration Optimization of Building Integrated Energy System. Electr. Power Constr. 2019, 40, 3–11. [Google Scholar]
- Li, W.; Guan, Y.; Chen, C.; Cai, L.; Yang, Y. Study on Capacity Configuration Optimization of CCHP System in Office Building. In Proceedings of the Conference Paper Report of Heating Engineering Construction and Efficient Operation Seminar, Zhejiang, China, 25–27 October 2017. [Google Scholar]
- Xu, J.; Yao, Y.; Yousefi, N. Optimal prime mover size determination of a CCHP system based on 4E analysis. Energy Rep. 2021, 7, 4376–4387. [Google Scholar] [CrossRef]
- Wu, D.; Han, Z.; Liu, Z.; Zhang, H. Study on configuration optimization and economic feasibility analysis for combined cooling, heating and power system. Energy Convers. Manag. 2019, 190, 91–104. [Google Scholar] [CrossRef]
- Wang, M.; Zhao, X.; Heidari, A.A.; Chen, H. Evaluation of constraint in photovoltaic models by exploiting an enhanced ant lion optimizer. Sol. Energy 2020, 211, 503–521. [Google Scholar] [CrossRef]
- Wang, M.; Heidari, A.A.; Chen, M.; Chen, H.; Zhao, X.; Cai, X. Exploratory differential ant lion-based optimization. Expert Syst. Appl. 2020, 159, 113548. [Google Scholar] [CrossRef]
- Rani, R.; Garg, R. Pareto based ant lion optimizer for energy efficient scheduling in cloud environment. Appl. Soft Comput. 2021, 113, 107943. [Google Scholar] [CrossRef]
- Li, Q.; Li, D.; Zhao, K.; Wang, L.; Wang, K. State of health estimation of lithium-ion battery based on improved ant lion optimization and support vector regression. J. Energy Storage 2022, 50, 104215. [Google Scholar] [CrossRef]
- Chen, P.; Sun, K.; Zhang, C.; Sun, B. A Feasible Zone Analysis Method with Global Partial Load Scanning for Solving Power Flow Coupling Models of CCHP Systems. J. Mod. Power Syst. Clean Energy 2022, 10, 7. [Google Scholar] [CrossRef]
- Mianaei, P.K.; Aliahmadi, M.; Faghri, S.; Ensaf, M.; Ghasemi, A.; Abdoos, A.A. Chance-Constrained Programming for Optimal Scheduling of Combined Cooling, heating, and Power-based Microgrid Coupled with Flexible Technologies. Sustain. Cities Soc. 2021, 77, 103502. [Google Scholar] [CrossRef]
- Cao, Y.; Wang, Q.; Wang, Z.; Jermsittiparsert, K.; Shafiee, M. A new optimized configuration for capacity and operation improvement of CCHP system based on developed owl search algorithm. Energy Rep. 2020, 6, 315–324. [Google Scholar] [CrossRef]
- Wang, A.; Wang, S.; Ebrahimi-Moghadam, A.; Farzaneh-Gord, M.; Moghadam, A.J. Techno-economic and techno-environmental assessment and multi-objective optimization of a new CCHP system based on waste heat recovery from regenerative Brayton cycle. Energy 2022, 241, 122521. [Google Scholar] [CrossRef]
- Lu, C.; Wang, J.; Yan, R. Multi-objective optimization of combined cooling, heating and power system considering the collaboration of thermal energy storage with load uncertainties. J. Energy Storage 2021, 40, 102819. [Google Scholar] [CrossRef]
- Wang, Z.; Cai, W.; Tao, H.; Wu, D.; Meng, J. Research on capacity and strategy optimization of combined cooling, heating and power systems with solar photovoltaic and multiple energy storage. Energy Convers. Manag. 2022, 268, 115965. [Google Scholar] [CrossRef]
- Ji, J.; Ding, Z.; Xia, X.; Wang, Y.; Huang, H.; Zhang, C.; Peng, T.; Wang, X.; Nazir, M.S.; Zhang, Y.; et al. System Design and Optimisation Study on a Novel CCHP System Integrated with a Hybrid Energy Storage System and an ORC. Complexity 2020, 2020, 1278751. [Google Scholar] [CrossRef]
- Zhang, D.; Ma, Y.; Liu, J.; Jiang, S.; Chen, Y.; Wang, L.; Zhang, Y.; Li, M. Stochastic Optimization Method for Energy Storage System Configuration Considering Self-Regulation of the State of Charge. Sustainability 2022, 14, 553. [Google Scholar] [CrossRef]
- Yang, X.; Liu, K.; Leng, Z.; Liu, T.; Zhang, L.; Mei, L. Multi-dimensions analysis of solar hybrid CCHP systems with redundant design. Energy 2022, 253, 124003. [Google Scholar] [CrossRef]
- Melo, F.M.; Magnani, F.S.; Carvalho, M. A decision-making method to choose optimal systems considering financial and environmental aspects: Application in hybrid CCHP systems. Energy 2022, 250, 123816. [Google Scholar] [CrossRef]
- Yan, R.; Wang, J.; Wang, J.; Tian, L.; Tang, S.; Wang, Y.; Zhang, J.; Cheng, Y.; Li, Y. A two-stage stochastic-robust optimization for a hybrid renewable energy CCHP system considering multiple scenario-interval uncertainties. Energy 2022, 247, 123498. [Google Scholar] [CrossRef]
- Zhang, Y.; Sun, H.; Tan, J.; Li, Z.; Hou, W.; Guo, Y. Capacity configuration optimization of multi-energy system integrating wind turbine/photovoltaic/hydrogen/battery. Energy 2022, 252, 124046. [Google Scholar] [CrossRef]
- Mehregan, M.; Abbasi, M.; Khalilian, P.; Hashemian, S.M.; Madadi, A. Energy, economic, environmental investigations and optimization of a combined cooling, heating and power system with hybrid prime mover of gas engine and flat plate solar collector. Energy Convers. Manag. 2022, 251, 115018. [Google Scholar] [CrossRef]
- Mirjalili, S. The Ant Lion Optimizer. Adv. Eng. Softw. 2015, 83, 80–98. [Google Scholar] [CrossRef]
- Li, Z.; Wu, W.; Lin, Z. An image enhancement method using improved ant-lion optimization algorithm. Appl. Res. Comput. 2018, 35, 4. [Google Scholar]


| Operating and Design Conditions | This Work | Ref. [15] | Error% |
|---|---|---|---|
| Recovery efficiency of Waste Heat Boiler (%) | 0.8 | 0.8 | - |
| Power generation efficiency of Gas Turbine (%) | 0.3 | 0.3 | - |
| CO2 emission (kg/kWh) | 0.22 | 0.22 | - |
| COP of Absorption Chiller | 1.3 | 1.3 | - |
| System performance | |||
| Equipment output of Waste Heat Boiler (kW) | 325.2 | 326.8 | 0.49 |
| Equipment output of Gas Turbine (kW) | 1759 | 175.1 | 0.46 |
| Equipment output of Absorption Chiller (kW) | 559.2 | 558.5 | 0.13 |
| Month | 1H | 2H | 3H | 4H | 5H | 6H | 7H | 8H | 9H | 10H | 11H | 12H |
| 1 | 0 | 0 | 0 | 0 | 0 | 0 | 3 | 109 | 205 | 268 | 314 | 300 |
| 2 | 0 | 0 | 0 | 0 | 0 | 0 | 33 | 119 | 227 | 296 | 360 | 374 |
| 3 | 0 | 0 | 0 | 0 | 0 | 3 | 65 | 149 | 223 | 279 | 326 | 335 |
| 4 | 0 | 0 | 0 | 0 | 0 | 36 | 110 | 202 | 272 | 336 | 358 | 364 |
| 5 | 0 | 0 | 0 | 0 | 5 | 57 | 135 | 216 | 298 | 340 | 364 | 350 |
| 6 | 0 | 0 | 0 | 0 | 13 | 49 | 109 | 187 | 252 | 308 | 319 | 289 |
| 7 | 0 | 0 | 0 | 0 | 3 | 42 | 107 | 174 | 245 | 282 | 307 | 320 |
| 8 | 0 | 0 | 0 | 0 | 0 | 32 | 88 | 155 | 227 | 281 | 306 | 307 |
| 9 | 0 | 0 | 0 | 0 | 0 | 28 | 107 | 203 | 274 | 323 | 350 | 353 |
| 10 | 0 | 0 | 0 | 0 | 0 | 3 | 84 | 163 | 235 | 290 | 305 | 312 |
| 11 | 0 | 0 | 0 | 0 | 0 | 0 | 54 | 146 | 220 | 266 | 291 | 257 |
| 12 | 0 | 0 | 0 | 0 | 0 | 0 | 17 | 112 | 193 | 285 | 306 | 312 |
| Month | 13H | 14H | 15H | 16H | 17H | 18H | 19H | 20H | 21H | 22H | 23H | 24H |
| 1 | 282 | 230 | 142 | 51 | 0 | 0 | 0 | 0 | 0 | 0 | 0 | 0 |
| 2 | 343 | 279 | 197 | 97 | 4 | 0 | 0 | 0 | 0 | 0 | 0 | 0 |
| 3 | 291 | 236 | 151 | 77 | 20 | 0 | 0 | 0 | 0 | 0 | 0 | 0 |
| 4 | 350 | 299 | 223 | 128 | 46 | 0 | 0 | 0 | 0 | 0 | 0 | 0 |
| 5 | 327 | 288 | 211 | 135 | 56 | 6 | 0 | 0 | 0 | 0 | 0 | 0 |
| 6 | 272 | 218 | 162 | 109 | 49 | 15 | 0 | 0 | 0 | 0 | 0 | 0 |
| 7 | 297 | 242 | 187 | 115 | 57 | 15 | 0 | 0 | 0 | 0 | 0 | 0 |
| 8 | 288 | 251 | 179 | 104 | 47 | 3 | 0 | 0 | 0 | 0 | 0 | 0 |
| 9 | 330 | 261 | 188 | 99 | 21 | 0 | 0 | 0 | 0 | 0 | 0 | 0 |
| 10 | 292 | 217 | 141 | 58 | 1 | 0 | 0 | 0 | 0 | 0 | 0 | 0 |
| 11 | 239 | 180 | 103 | 17 | 0 | 0 | 0 | 0 | 0 | 0 | 0 | 0 |
| 12 | 282 | 202 | 108 | 7 | 0 | 0 | 0 | 0 | 0 | 0 | 0 | 0 |
Publisher’s Note: MDPI stays neutral with regard to jurisdictional claims in published maps and institutional affiliations. |
© 2022 by the authors. Licensee MDPI, Basel, Switzerland. This article is an open access article distributed under the terms and conditions of the Creative Commons Attribution (CC BY) license (https://creativecommons.org/licenses/by/4.0/).
Share and Cite
Ji, J.; Wang, F.; Zhou, M.; Guo, R.; Ji, R.; Huang, H.; Zhang, J.; Nazir, M.S.; Peng, T.; Zhang, C.; et al. Evaluation Study on a Novel Structure CCHP System with a New Comprehensive Index Using Improved ALO Algorithm. Sustainability 2022, 14, 15419. https://doi.org/10.3390/su142215419
Ji J, Wang F, Zhou M, Guo R, Ji R, Huang H, Zhang J, Nazir MS, Peng T, Zhang C, et al. Evaluation Study on a Novel Structure CCHP System with a New Comprehensive Index Using Improved ALO Algorithm. Sustainability. 2022; 14(22):15419. https://doi.org/10.3390/su142215419
Chicago/Turabian StyleJi, Jie, Fucheng Wang, Mengxiong Zhou, Renwei Guo, Rundong Ji, Hui Huang, Jiayu Zhang, Muhammad Shahzad Nazir, Tian Peng, Chu Zhang, and et al. 2022. "Evaluation Study on a Novel Structure CCHP System with a New Comprehensive Index Using Improved ALO Algorithm" Sustainability 14, no. 22: 15419. https://doi.org/10.3390/su142215419
APA StyleJi, J., Wang, F., Zhou, M., Guo, R., Ji, R., Huang, H., Zhang, J., Nazir, M. S., Peng, T., Zhang, C., Huang, J., & Wang, Y. (2022). Evaluation Study on a Novel Structure CCHP System with a New Comprehensive Index Using Improved ALO Algorithm. Sustainability, 14(22), 15419. https://doi.org/10.3390/su142215419