Abstract
As one of the largest energy consumers in the world, China’s total electricity consumption has increased by 416.33% during the sample years of 2001 to 2019. In 2019, the top five provinces in terms of power use were all located on the eastern coast. They have contributed 38.39% of the total consumption, causing a power shortage of 594.5 billion kWh in the provinces, while the power generation in the central and western regions have far exceeded their electricity consumption. In order to alleviate the problem of the mismatch between the power resource centers and the load centers in China, ultra-high voltage (UHV) projects, as one of the most important projects in recent years, have bridged the resource gap between the regions and have improved the allocation efficiency of the power resources. Although the cross-provincial transmission of electricity opens the pathway for the consumption of resources, the causal effects of the project on the regions along the line have not been accurately analyzed. Firstly, by constructing a quasi-natural experiment, this paper uses county-level panel data during the period of 2000 to 2019 to analyze the economic benefits that are generated by the inter-regional power transmission project. Secondly, the pathways of the economic effects of UHV are also verified. Finally, this paper also analyzes the heterogeneous effect of power-resource-rich provinces in the construction of the project. Through the pathways of local enterprise dynamics, employment level, and industrial structure, the findings prove that cross-regional power transmission has significantly enhanced the economic growth of the related regions and has played an especially positive role for the power exporting provinces. This paper provides empirical evidence for the effect of optimal resource allocation and the infrastructure development of developing countries and supplies a policy reference for developing countries’ resource allocation optimization strategies.
1. Introduction
With more than three quarters of coal, wind, solar, and hydro resources being distributed in the western region, and over 70% of power consumption being concentrated in the eastern and central part, the distribution of China’s power resources and load are mismatched or even reversed [1,2]. In addition, the distance of 1000 km to 4000 km from the energy-rich areas to the power demand centers in China has resulted in the dilemma of high power-supply costs, difficulties in wind and solar power consumption, severe transmission losses, and bloated power investments in the Chinese power industry [3]. In order to alleviate the reversed distribution of energy resources and demand, large-scale and long-distance coal transmission has long been considered to be the main method to reallocate the energy supply and demand in China [4]. However, the transportation by car or train has great disadvantages in the perspectives of spatial accessibility, supply timeliness, and transmission stability, which produces a series of negative externality effects on society by raising the cost of electricity, inhibiting the efficiency of energy utilization, and exacerbating the degree of air pollution [5,6]. Therefore, how to coordinate and optimize the allocation of the power resources and the load distribution has become a key issue for the low-carbon and sustainable development of the power industry and the economy [7,8].
One better solution to alleviate the dilemma of mismatching is to build a so-called “power highway”, which is used as a metaphor for an ultra-high voltage (UHV) power grid [9,10], which has been recently considered to be an infrastructure constructed to resolve the problems of power development which is constrained by the coal transportation capacity. Specifically, the UHV power transmission project is based on the development of the extra-high voltage (EHV) transmission of an alternating current (AC) of 1000 KV, a direct current (DC) of ±800 KV, and the above voltage level transmission network [11]. Compared to the traditional transmission technology, the capacity of UHV transmission can be enlarged by 3 times, the transmission distance can be extended by 2.5 times, the transmission loss can be reduced by 45%, the width of the unit capacity line corridor can be reduced by 30%, and the construction cost for the unit capacity can be reduced by 28%; all of these factors help to allocate the electricity energy in a safer, more efficient, and more environmentally friendly way. According to the calculation by the State Grid Corporation of China, 60% of the land resources would be saved by using the 1000 KV transmission lines instead of the 500 KV lines if the same volume of electricity is transferred, which means that the adoption of UHV transmission technology will effectively extend the transmission distance, increase the transmission capacity, reduce the transmission losses, lower the transmission costs, and achieve a wider range of optimal resource allocation [12,13].
By 2020, the State Grid Corporation of China and the China Southern Power Grid, which are the largest power grids in China, have completed the construction of 30 transmission projects of UHV, with five projects approved and under construction. The total length of the UHV lines in operation has reached 48,000 km, with a transmission capacity of 140 million kilowatts across the provinces and regions, and a cumulative power transmission capacity of over 2.5 trillion kilowatt-hours, achieving a huge leap from the “initial connection” to “linking into a network”.
The potential impacts of UHV transmission projects on the economy and the industry of the relevant areas are mainly reflected in the following two aspects. First of all, UHV is a win-win link between the western provinces and the eastern coastal areas. UHV transmission helps the less developed areas, the ethnic areas, and the border areas in the west to break the bottleneck of development and turn resource advantages into economic advantages [10]. The maturity of UHV transmission technology tends to provide an effective means for the resource-rich regions to develop diversified industries, to extend industrial chains, and to develop value-added industries. For example, the construction of large coal power bases and wind power bases in the western and northern regions not only promotes the rational development and utilization of coal and wind resources, but more importantly, it extends the coal development and utilization industry chain, promotes the output of high value-added power products and the development of power-related industries, increases the local tax revenue, drives employment, and strongly promotes the economic development of western China. Accordingly, the function of UHV is usually compared to the enhancement of “blood-making” in the less developed areas. For the eastern region, as the price of electricity that is sent from the west is lower than the feed-in tariff of local power plants that are built in the eastern provinces, the reduced costs for energy consumption in the east and central regions helps to maintain the price advantage of local products in both the domestic market and international competition, and promotes the development of advantageous industries [14,15,16,17]. Moreover, the development of UHV and a smart grid will also promote the development of electric vehicles, which gives full play to the environmental benefits of clean energy and solves the effect of urban environmental pollution [18]. As a landmark technology achievement of China’s energy revolution, and a major breakthrough in the development of advanced productivity, the UHV transmission project has become a “national weapon” to promote the energy production and consumption revolution and to coordinate the sustainable development of energy and the economy [19,20].
Secondly, the construction of UHV AC/DC demonstration projects has promoted the development of China’s power equipment industry [21,22]. The medium and long-term economic benefits of the UHV power grid are significant, which will strongly drive the power supply, the electrical equipment, the raw materials, and other upstream and downstream industries, promote the transformation and upgrade of the manufacturing industry, and cultivate new growth points. By relying on the UHV project, the domestic power equipment manufacturing industries have been achieving breakthroughs in UHV AC and DC power transmission technology based on independent research and development, and have mastered a large number of core technologies with independent intellectual property rights, breaking the monopoly of multinational enterprises and competitive restrictions [21]. The success of UHV projects has led to the extension of the transmission and the distribution industry chain, both upstream and downstream, leading to the transformation and upgrade of industrial technology. Through the UHV project, a unique advantage in international competition has been formed, and the international influence has been significantly enhanced, which has strongly promoted the domestic enterprises to lay a solid foundation for the sustainable development of the electric manufacturing industry [22,23,24]. UHV is not only a new power transmission technology, but also a new resource allocation platform and a new low-carbon development path [25,26].
Theoretically, breaking down the barriers to the flow of resources is conducive to the optimal allocation of resources, thereby promoting economic growth [25]. With the consideration of the cost, the economic benefits of the project construction have become the focus of studies. The inter-regional transmission of electricity tends to bring higher social welfare to the areas along the route, and the resource advantages in the western region of China would be transformed into economic growth through resource exports. Could the theoretical hypothesis be confirmed by the empirical experience in China? An affirmative answer to this question may give more impetus to energy production and industry development in the western resource-exporting regions, and an empirical analysis could be conducted in order to produce supplementary evidence. The marginal contribution of our research mainly includes the following three aspects.
Firstly, although academic studies have made efforts to confirm the economic impact of new infrastructure projects, owing to the inevitable omission of variables, the reverse causality, and other endogenous problems, conventional regression analyses only corroborate the correlation between the engineering projects and economic development, but not the causality. In this paper, by constructing quasi-natural experiments, the causal effect of the power transmission across the regions on regional development has been analyzed. Secondly, based on the assessment of the economic effects that are generated by the construction of UHV projects, this paper has further explored the possible pathway in which the UHV connection affects the economic development and employment, which gives new points of view in terms of regional economic enhancement. Thirdly, the heterogeneity of the power exporter and importer have also been analyzed, which enhances the guiding significance of the findings.
The subsequent parts of this paper are organized as follows: Section 2 is a literature review; Section 3 presents the data, the variables, the statistical facts, and the methodology; Section 4 is the empirical results and the analysis; and Section 5 is the conclusions and policy implications that have been proposed according to the empirical findings.
2. Literature Reviews
2.1. Economic Effect of UHV Power Transmission
With the continuous construction of China’s ecological civilization, the goals of “carbon peaking” and “carbon neutral” have become keynotes of China’s economic development for the coming decades [27,28]. While the electricity sector accounts for about 40% of the total domestic energy emissions, the decarbonization of electricity is crucial for China to achieve low-carbon development. Furthermore, expanding regional power grids and building UHV transmission projects are the major strategic methods to decarbonizes electricity [28]. Studies have proposed evidence for the effects of UHV transmission projects from different perspectives. For example, Li et al. studied the impacts of interregional transmission grids on electricity decarbonization in terms of the energy structure, the economic efficiency, and the environment, and concluded that cross-regional UHV transmission would reduce carbon emissions and promote power generation efficiency under an appropriate dispatch mechanism [29]. Li et al. quantitatively analyzed the economic and environmental impacts of transmission on power importing provinces based on a computable general equilibrium (CGE) model, and the results of the study illustrated that carbon emissions in power importing provinces showed a significant downward trend [30]. From the study by Brown and Botterud in the United States, the construction of interstate and cross-regional power transmission projects have significantly reduced the decarbonization cost [31]. Wang et al. proposed a calculation model for the cost of a regional power system power supply based on the peak carbon target from a life-cycle perspective, and the path to achieve low-carbon transition in the power industry was also confirmed from an economic perspective [32]. This optimal allocation of resources, and the promotion of equity, are not only reflected in the connectivity effect within countries, but also in the flow of resources across borders [33,34,35,36].
2.2. The Role of Differences-in-Differences Model in Policy Evaluation
The differences-in-differences method (DID) was first invoked in economics in the late 1970s [37]. As it is an effective method, the DID model is favored by researchers and is widely used to analyze policy effects. For example, Zheng et al. constructed a multi-stage dynamic DID model based on the panel data of the Xin’an River Basin in China from 2009 to 2018 in order to systematically study the impact of ecological compensation mechanisms on industrial structure upgrading [38]. The results indicate that the industrial structure in the ecological compensation pilot areas tends to be reasonable and advanced, and the study provides reference suggestions for the ecological industrial structure construction policy. Taking Vietnam as an example, Trinh et al. found that stock liquidity affects the expected default frequency of U.S. firms in the context of emerging markets through a DID model, which leads to the conclusion that stock market liquidity promotes the sustainable development of the emerging stock market [39]. Miller and Hyodo examined the impact of the Panama Canal expansion on Latin American and Caribbean ports using a DID approach based on data from 100 major ports and formal ports within three regions in Central and South America, and the estimated results showed a significant increase in the average port output [40]. Yan et al. selected 11 communities in the Xiqing district of Tianjin city as a study case. Based on the drainage network data and information from 2010 to 2020, the DID model was used in order to evaluate the effect of urban flood management after the application of the data management model in 2016 [41]. The empirical results have shown that the implementation of the data governance model had a positive effect on reducing the vulnerability of urban drainage networks. Moreover, the DID method has also been employed to study the impacts of policies on micro-data research, such as the enterprises study [42].
Using panel data from all 2718 county-level administrative regions in China between 2000 and 2019, this study develops a quasi-natural test with treatment and control groups in order to evaluate the economic impacts (GDP and GDP per capita) that are caused by the construction of the UHV project on the regions along the routes, and to examine the path and heterogeneity of the impacts. By applying the DID model, this study tries to find the causal effects of the infrastructure on the economy; the underlying mechanisms are also explored. Given the global energy transition, this paper provides an addition to the literature.
3. Methodology and Data
3.1. Data and Variables
This paper selects the economic data of county-level administrative regions in China during the period of 2000 to 2019 as a research sample and uses the time of service of the UHV transmission lines during that period as an exogenous policy shock to construct a quasi-natural experiment in order to analyze the economic impact of the opening of UHV lines on the regions involved; the data used for the study mainly involve two dimensions.
- (1)
- County-level data
Compared with the provincial and city-level data, economic data from the county level are more helpful in portraying the policy effects that are brought about by exogenous shocks and provide a richer research perspective. This paper selects the annual economic data of 2718 county-level administrative regions in China from 2000 to 2019 as the study sample, covering 31 provinces, autonomous regions, and municipalities directly under the central government (excluding county-level regions with missing data). The source of data is the China Statistical Yearbook (County-Level), and the indicators that were selected for this paper’s study include the following: gdp-gross regional product, gdp_per-per capita gross regional product, popu-population, area_farm-arable land area, finance-local fiscal revenue, constru-revenue of construction, K-fixed asset investment in the baseline regression, firm-the number of industrial companies, labor-the number of people employed, gdp_ter-the gross regional product of tertiary industry, and structure-the ratio of gdp_ter to gdp. The descriptive statistics of the main variables are listed in Table 1.

Table 1.
Descriptive statistics of the main variables.
- (2)
- UHV transmission project data
From the viewpoint of data availability, excluding Hong Kong, Macau, Taiwan, and Tibet, we identified the treated group by tracing where UHV projects are in operation, which includes the following 21 provinces and municipalities: Shanxi, Henan, Hubei, Yunnan, Guangdong, Sichuan, Shanghai, Jiangsu, Anhui, Zhejiang, Xinjiang, Fujian, Inner Mongolia, Hebei, Beijing, Tianjin, Shandong, Ningxia, Gansu, Hunan, and Shaanxi. The remaining 10 provinces and municipalities are included in the control group. Considering that the UHV DC transmission line is a “point-to-point” power transmission, and the converter station is set in the middle of the AC line, the provincial administrative regions where the terminals of the DC lines and both the terminal converter stations of the AC lines are identified as the treated group. The details of the UHV lines are listed in Table 2.
Table 2.
The connecting time of UHV transmission projects during the sample period.
3.2. Methodology
The difference-in-difference (DID) model is widely applied in the effect evaluation of exogenous shocks by dividing samples into a treated group that is affected by the shock and a control group that is not affected to form a quasi-experiment. The advantage of this approach is that the endogeneity problem can be largely avoided; policies are generally exogenous to microeconomic agents and, thus, there is no reverse causality. Moreover, the use of fixed-effects estimation also alleviates the problem of omitted variable bias to some extent. The difficulty lies in the need to satisfy a series of assumptions, such as parallel trend tests.
In the DID model, , which means that the coefficient of is the average treatment effect of the UHV transmission lines.
We then set and , and the specified equation should be expressed as follows:
where denotes the GDP and per capita GDP as explanatory variables in our study; is the vector of control variables, including population, arable land area, local fiscal revenue, revenue of construction, and fixed asset investment; , , and denote the year fixed effect, individual effect of a county, and year–province interaction, respectively; and is the usual idiosyncratic error term. In addition, the coefficient of , captures the effect of UHV service on the economic development, and a positive value of indicates a promoting effect of the project on the treated groups.
4. Results and Discussion
4.1. The Economic Effect of UHV
The results of baseline regression by using OLS are listed in Table 3. Among them, columns (1) and (5) only include the regression coefficients of the exogenous shock Dit; columns (2), (3), (6), and (7) include the population total, the fixed asset investment, the local fiscal revenue, the arable land area, and the revenue of construction as control variables in this order to minimize the errors that are caused by the omitted variables; columns (4) and (7) include the control variables, controlling for the double fixed effects of the year and the province. The fixed effects of the county-level administrative units and year have been controlled in the above regressions.
Table 3.
The causal effect of UHV on economic development.
The estimation results in columns (1) and (5) show that the mean treatment effect Dit coefficient is significantly positive at the 1% level. From the estimation results in column (2), the coefficient of the average treatment effect Dit increases slightly with the further inclusion of control variables and remains significantly positive at the 1% level of significance. This indicates that, regardless of whether the total gdp or gdp_per is selected as the study object, the construction of the UHV projects has a significant positive impact on the economic level of the county. From the estimated coefficients of the control variables, the higher the fixed asset investment, local fiscal revenue, and construction industry, the higher the GDP of the county, which indicates that the increased local investment in infrastructure construction helps to improve the economic level. In contrast, the arable land area and the economic growth show a significant negative relationship (columns (4) and (7)), but the coefficients are small, indicating that arable land area affects the economic growth, but is not the main cause.
4.2. Parallel Trend Test and Dynamic Effect Estimation
Figure 1 shows the dynamic impact of UHV on the gdp and the gdp_per. As can be seen from Figure 1 the sample data are consistent with the parallel trend hypothesis, indicating a reasonable model setup. Figure 1 shows the dynamic effects of the relative effects of the UHV transmission project on the gdp and the gdp_per of the experimental and control groups. The coefficients of the dummy variables in each period are not significantly different from 0 in the six years before the treatment, indicating that the parallel trend hypothesis has been met. After the implementation of the policy, the gdp and the gdp_per show a significant increase, indicating that there is an immediate effect of UHV connectivity on the sample areas in the treatment group, and this treatment effect also increases year by year. A sustained effect can still be observed five years after the completion of the project, indicating that the economic benefits that are brought by the construction of UHV are long lasting.
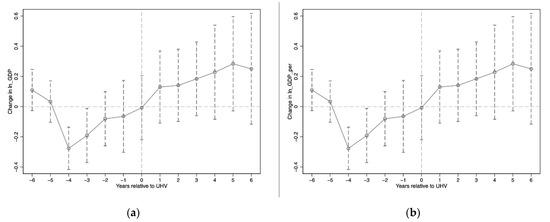
Figure 1.
The impact of UHV connection on GDP and GDP per capita. Notes: (a,b) represent the impact of UHV connection on GDP and GDP per capita respectively.
4.3. Mechanism Analysis
Combined with empirical studies, we illustrate that the GDP and the GDP per capita of the county-level administrative regions that enter the cross-provincial power transmission network through the UHV project are significantly affected by the completion of the project construction. In order to analyze the realization path of the treatment effect, we have explored the possible mechanisms and have concluded that the construction of the UHV project could potentially realize its impact on the economy of the areas along the route by increasing the following three aspects: the number of enterprises, the amount of employment, and the industrial structure of the areas along the route. We selected a total of four proxy variables, including the number of local enterprises, the amount of employment, the GDP of three industries, and the industrial structure, in order to examine the impact of regional UHV project construction on the local economic development, and the results of the mechanism analysis are listed in Table 4.
Table 4.
The results of mechanism analysis.
(1) The number of enterprises. The medium and long-term economic benefits of UHV power grids are significant, which strongly drives upstream and downstream industries, such as power supply, electrical equipment, and energy-using equipment, and raw materials promote the transformation and upgrade of the equipment manufacturing industry, cultivate new growth points, and form new dynamic energy. The estimation results in columns (1) and (2) of Table 4 show that the construction of UHV projects has increased the number of enterprises in the county. This indicates that the construction of UHV projects provides an opportunity for the vitality of enterprises to burst out, increasing the number of enterprises, improving the market vitality, and guiding more market investment to these enterprises through policies, thus fostering long-term economic growth;
(2) Employment. The employment of the working population is the source of the economy, the basis of peoples’ livelihoods, and the foundation of society. The rate of economic growth has an important impact on employment growth. Table 4 shows that the construction of UHV projects brings more employment opportunities, thus increasing the number of employed people in the county;
(3) The GDP of tertiary industry and industrial structure. The adjustment of the industrial structure in the process of industrialization in China is closely related to the regional economic growth, and the upgrade of leading industries is the main driving force for the upgrade of the overall industrial structure in the region. The technological progress promotes the continuous development of the industrial structure to an advanced level, and the maturity of UHV transmission technology will develop diversified industries, extend the industrial chains, and develop value-added industries for the resource-rich regions. In columns (5) and (6) of Table 4, the estimation results show that the construction of UHV projects improves the proportion of the tertiary industry GDP, since promoting the upgrade of the industrial structure and the adjustment and optimization of the industrial structure are conducive to the development of the regional economy.
4.4. Heterogeneity Discussion
Studies have shown that the economic impact of the resources that are generated on the production side versus the consumption side is asymmetric. For electricity as a production input factor, most of the literature argues that the inter-regional transmission of electricity tends to generate higher economic value for the input location, thus raising the question that the inter-regional transmission of electricity may widen the economic gap between the east and the west of China. In order to further analyze the economic impact of UHV as a highway for power transmission on the output provinces, this paper adds a third differential, setting the exporting provinces as one and the other provinces as zero, in order to discuss the economic impact of UHV on the power output provinces. The results of the study have shown that the coefficient of the treatment effect is significantly positive, indicating that the construction of UHV has a greater economic stimulation effect on the power exporting provinces, indicating that UHV improves the economic strength of the western power resource provinces and provides effective assistance in converting the power resources into economic advantages. The analysis of the results of the heterogeneity on the power exporting provinces are listed in Table 5.
Table 5.
Heterogeneity discussion on the power exporting provinces.
4.5. Discussion
The study is conducted step by step as follows and the results of the regressions could be summarized in four aspects.
Firstly, after controlling for the year and the province fixed effects and control variables, the coefficient of the average treatment effect Dit remains positive at the 1% significance level, indicating that the construction of UHV projects has a significant positive impact on the economic level of counties, including the gross regional product and the gross regional product per capita.
After that, through the parallel trend hypothesis, it can be found that the gross regional product and the per capita gross regional product grow significantly after the construction of the UHV project, and the economic promotion effect on the county is not only immediate but also far-reaching.
Furthermore, from the perspective of promoting local economic development, a total of four proxy variables, namely, the number of local enterprises, the amount of employment, the GDP of three industries, and the industrial structure are selected to analyze the mechanism of the economic effects and are empirically confirmed as the pathways.
Finally, in order to explore the regional heterogeneity across western and eastern China, the model of difference-in-difference-in-difference (DDD) is conducted. Through the estimation, it is empirically confirmed that the inter-regional transmission of electricity has a greater economic stimulating effect on the power exporting regions.
5. Conclusions and Policy Implications
5.1. Conclusions
Based on the panel data of 2718 county-level administrative regions in China from 2000 to 2019, this paper constructed a quasi-natural experiment with treatment and control groups in order to evaluate the economic effects (the GDP and the GDP per capita) that are generated by UHV project construction. On the basis of the results, the mechanism and heterogeneity of the effects were further explored, and the main conclusions can be summarized as follows:
- (1)
- The economic development of the regions along the UHV project is confirmed by the empirical data. This indicates that at this stage in China, the optimal allocation of the energy resources is beneficial to economic growth on a national scale;
- (2)
- The UHV projects have both immediate and far-reaching impacts on economic development. This shows that the construction and the integration of energy infrastructure access has a significant and far-reaching impact on national development. Therefore, when assessing the economic benefits of infrastructure development, a long-term economic perspective is recommended to be considered;
- (3)
- Enterprise development, employment enhancement, and economic structure changes are possible pathways of the economic effects of UHV projects. This shows that the construction of UHV provides sustainable power for the economic development of the regions along the route and reflects the organic role of infrastructure construction;
- (4)
- The economic stimulus to the power exporting provinces is greater, which means that the UHV construction is inductive to the western regions that are richer in power resources in converting their resource endowments into economic advantages and, thus, can promote economic development.
The data in Table 1 is selected from the China Statistical Yearbook (County-Level); the information in Table 2 is originally from the government’s documents and was collected and organized by the authors. The data in Table 3, Table 4 and Table 5 and Figure 1 are the regression results that were estimated through the method of OLS by using Stata 16.
5.2. Policy Implications
The results provide important implications for policy makers in developing countries. In short, we have offered the following four policy recommendations:
- (1)
- Economic and social development in developing countries could be promoted through infrastructure construction, which consists of different fields, such as energy, transportation, and communication. The UHV project, which is the subject of this paper, is just one example;
- (2)
- When assessing the economic benefits of infrastructure construction, developing countries are advised to consider the long-term economic perspective, to pay attention to the long-term planning of infrastructure construction, and to increase the financial support for the infrastructure construction in order to promote its steady development;
- (3)
- When developing countries have a territorial resource mismatch, cross-regional resource transfer is a necessary measure to alleviate inter-regional resource supply and demand conflicts. Through efficient energy-saving and labor-saving technological innovations, cross-regional resource transfer will enable the resource-rich regions to gain new economic growth points;
- (4)
- This paper provides quantitative support for post-pandemic China to vigorously develop new infrastructure construction. By allowing the infrastructure development to accelerate upgrading, integration, and innovative optimization, economic development could be stimulated and the problems of unemployment under the shadow of the epidemic could be alleviated to some extent, which is an example for many developing countries with slow economic growth after the epidemic of COVID-19.
5.3. Further Work and Limitations
The limitations of this study are as follows. Firstly, the data quality is yet to be improved, owing to some missing data. If data with more detail are available later, it will further verify the validity of the conclusions in this paper. Secondly, the study has examined the economic effect of the UHV project using the GDP or the GDP per capita as the measurement index. Given the complexity of economic development, more variables could be added as explanatory variables in order to analyze other economic outputs. Considering these limitations, we hope that future work will also collect more comprehensive and well-developed data for further research. In addition, in order to explore more specific economic effects on infrastructure, more details on micro-level mechanisms and evidence could also be discussed.
Author Contributions
Conceptualization, H.Y., Y.W. and Y.Y.; Methodology, Y.W., C.S. and H.Y.; Software, J.L. and Y.L.; Validation, H.Y., T.L. and Y.Y.; Formal Analysis, C.S. and Y.L.; Investigation, H.Y.; Resources, Y.Y.; Data Curation, C.S.; Writing—Original Draft Preparation, H.Y. and Y.W.; Writing—Review and Editing, Y.W. and Y.Y.; Visualization, Y.Y.; Supervision, H.Y.; Project Administration, H.Y.; Funding Acquisition, H.Y. All authors have read and agreed to the published version of the manuscript.
Funding
This research received no external funding.
Institutional Review Board Statement
Not applicable.
Informed Consent Statement
Not applicable.
Data Availability Statement
Not applicable.
Acknowledgments
This paper is supported by the work team of Yunnan Power Grid Co. Ltd. and the School of Finance in Yunnan University of Finance and Economics.
Conflicts of Interest
We declare no conflict of interest.
References
- Han, M.; Xiong, J.; Wang, S.; Yang, Y. Chinese photovoltaic poverty alleviation: Geographic distribution, economic benefits and emission mitigation. Energy Policy 2020, 144, 111685. [Google Scholar] [CrossRef]
- Cong, R.; Lo, A.Y.; Yu, W. The distribution and regional determinants of nationally financed emissions-reduction projects in China. Energy Policy 2021, 152, 112215. [Google Scholar] [CrossRef]
- Hu, Y.; Cheng, H. Displacement efficiency of alternative energy and trans-provincial imported electricity in China. Nat. Commun. 2017, 8, 14590. [Google Scholar] [CrossRef] [PubMed]
- Pasaribu, D.; Lahiri-Dutt, K. Coal reliance, human development, and gender equality: At what scale should we look for a relationship? Energy Res. Soc. Sci. 2022, 90, 102612. [Google Scholar] [CrossRef]
- Ai, H.; Guan, M.; Feng, W.; Li, K. Influence of classified coal consumption on PM2.5 pollution: Analysis based on the panel cointegration and error-correction model. Energy 2021, 215, 119108. [Google Scholar] [CrossRef]
- Wang, W.; Yang, F.; Guo, Y.; Chen, B.; Zou, X.; Zhou, S.; Li, J. The effects of the Promoting the Big and Quashing the Small Policy on pollutants from a coal power supply chain perspective. J. Environ. Manag. 2022, 313, 114960. [Google Scholar] [CrossRef] [PubMed]
- Fang, T.; Fang, D.; Yu, B. Carbon emission efficiency of thermal power generation in China: Empirical evidence from the micro-perspective of power plants. Energy Policy 2022, 165, 112955. [Google Scholar] [CrossRef]
- Ahmadi, B.; Ceylan, O.; Ozdemir, A. A multi-objective optimization evaluation framework for integration of distributed energy resources. J. Energy Storage 2021, 41, 103005. [Google Scholar] [CrossRef]
- Liu, Z. Construction of UHV Power Grids in China; Ultra-High Voltage Ac/dc Grids; Academic Press: Cambridge, MA, USA, 2015; pp. 533–585. [Google Scholar]
- Wang, Y.; Yan, W.; Zhuang, S.; Li, J. Does grid-connected clean power promote regional energy efficiency? An empirical analysis based on the upgrading grid infrastructure across China. J. Clean. Prod. 2018, 186, 736–747. [Google Scholar] [CrossRef]
- Liu, Z. Characteristics of UHV AC Transmission System; Ultra-High Voltage Ac/dc Grids; Academic Press: Cambridge, MA, USA, 2015; pp. 35–93. [Google Scholar]
- Wang, Y.; Li, M.; Wang, L.; Wang, H.; Zeng, M.; Zeng, B.; Qiu, F.; Sun, C. Can remotely delivered electricity really alleviate smog? An assessment of China’s use of ultra-high voltage transmission for air pollution prevention and control. J. Clean. Prod. 2019, 242, 118430. [Google Scholar] [CrossRef]
- Li, F.; Xiao, X.; Xie, W.; Ma, D.; Song, Z.; Liu, K. Estimating air pollution transfer by interprovincial electricity transmissions: The case study of the Yangtze River Delta Region of China. J. Clean. Prod. 2018, 183, 56–66. [Google Scholar] [CrossRef]
- Tan, X.; Lin, S.; Liu, Y.-L.; Xie, B.-C. Has the inter-regional transmission grid promoted clean power development? A quantitative assessment on China’s electricity sector. J. Clean. Prod. 2020, 269, 122370. [Google Scholar] [CrossRef]
- Pei, W.; Chen, Y.; Sheng, K.; Deng, W.; Du, Y.; Qi, Z.; Kong, L. Temporal-spatial analysis and improvement measures of Chinese power system for wind power curtailment problem. Renew. Sustain. Energy Rev. 2015, 49, 148–168. [Google Scholar] [CrossRef]
- Ma, C.; Liu, L. Optimal capacity configuration of hydro-wind-PV hybrid system and its coordinative operation rules considering the UHV transmission and reservoir operation requirements. Renew. Energy 2022, 198, 637–653. [Google Scholar] [CrossRef]
- Xu, J.-H.; Yi, B.-W.; Fan, Y. Economic viability and regulation effects of infrastructure investments for inter-regional electricity transmission and trade in China. Energy Econ. 2020, 91, 104890. [Google Scholar] [CrossRef]
- Li, J.; Wang, Z.; Zhou, S.; Lu, B.; Dai, W.; Bao, H. Optimal planning energy storage for promoting renewable power consumption in the urgent situation of UHV systems. Int. J. Electr. Power Energy Syst. 2022, 143, 108453. [Google Scholar] [CrossRef]
- Liu, Z. UHV Engineering Practices in China; Ultra-High Voltage Ac/dc Grids; Academic Press: Cambridge, MA, USA, 2015; pp. 587–682. [Google Scholar]
- Wu, W.P.; Wu, K.X.; Zeng, W.K.; Yang, P.C. Optimization of long-distance and large-scale transmission of renewable hydrogen in China: Pipelines vs. UHV. Int. J. Hydrog. Energy Pergamon 2022, 47, 24635–24650. [Google Scholar] [CrossRef]
- UHV AC. Transmission Lines; UHV Transmission Technology; Academic Press: Cambridge, MA, USA, 2018; pp. 295–359. [Google Scholar]
- Power Grid Development and Its Comprehensive Social and Economic Benefits. Non-Fossil Energy Development in China; Academic Press: Cambridge, MA, USA, 2019; pp. 197–223.
- Tan, X.; Lin, S.; Liu, Y.-L.; Xie, B.-C. Has the inter-regional transmission expansion promoted the low-carbon transition of China’s power sector? Comput. Ind. Eng. 2022, 168, 108059. [Google Scholar] [CrossRef]
- Zhang, Q.; Chen, W. Modeling China’s interprovincial electricity transmission under low carbon transition. Appl. Energy 2020, 279, 115571. [Google Scholar] [CrossRef]
- Fan, H.; Gao, X.; Zhang, L. How China’s accession to the WTO affects global welfare? China Econ. Rev. 2021, 69, 101688. [Google Scholar] [CrossRef]
- Yu, X.; Wu, Z.; Wang, Q.; Sang, X.; Zhou, D. Exploring the investment strategy of power enterprises under the nationwide carbon emissions trading mechanism: A scenario-based system dynamics approach. Energy Policy 2020, 140, 111409. [Google Scholar] [CrossRef]
- Tang, B.; Li, R.; Yu, B.; An, R.; Wei, Y.-M. How to peak carbon emissions in China’s power sector: A regional perspective. Energy Policy 2018, 120, 365–381. [Google Scholar] [CrossRef]
- Lin, J.; Kahrl, F.; Liu, X. A regional analysis of excess capacity in China’s power systems. Resour. Conserv. Recycl. 2017, 129, 93–101. [Google Scholar] [CrossRef]
- Li, Y.; Lukszo, Z.; Weijnen, M. The impact of inter-regional transmission grid expansion on China’s power sector decarbonization. Appl. Energy 2016, 183, 853–873. [Google Scholar] [CrossRef]
- Li, T.; Liu, P.; Li, Z. Quantifying cross-provincial power transmission barriers in China, based on a computable general equilibrium approach. Energy Procedia 2019, 158, 465–470. [Google Scholar] [CrossRef]
- Brown, P.R.; Botterud, A. The Value of Inter-Regional Coordination and Transmission in Decarbonizing the US Electricity System. Joule 2021, 5, 115–134. [Google Scholar] [CrossRef]
- Wang, J.; Cang, M.; Zhai, X.; Wu, S.; Cheng, X.; Zhu, L. Research on power-supply cost of regional power system under carbon-peak target. Glob. Energy Interconnect. 2022, 5, 31–43. [Google Scholar] [CrossRef]
- Niftiyev, I. China’s Interests in the Industrialization of the South Caucasus: Comparative Analysis of Labor Productivity in the Manufacturing Sector. Econ. Soc. Chang. Facts Trends Forecast 2022, 15, 205–222. [Google Scholar] [CrossRef]
- Niftiyev, I. Dutch Disease Symptoms in Azerbaijan Economy. J. Econ. Coop. Dev. 2020, 41, 33–67. [Google Scholar]
- Sadik-Zada, E.R. Addressing the growth and employment effects of the extractive industries: White and black box illustrations from Kazakhstan. Post-Communist Econ. 2021, 33, 402–434. [Google Scholar] [CrossRef]
- Sadik-Zada, E.R.; Loewenstein, W.; Hasanli, Y. Production linkages and dynamic fiscal employment effects of the extractive industries: Input-output and nonlinear ARDL analyses of Azerbaijani economy. Miner. Econ. 2021, 34, 3–18. [Google Scholar] [CrossRef]
- Ashenfelter, O. Estimating the Effect of Training Programs on Earnings. Rev. Econ. Stat. 1978, 60, 47. [Google Scholar] [CrossRef]
- Zheng, Q.; Wan, L.; Wang, S.; Wang, C.; Fang, W. Does ecological compensation have a spillover effect on industrial structure upgrading? Evidence from China based on a multi-stage dynamic DID approach. J. Environ. Manag. 2021, 294, 112934. [Google Scholar] [CrossRef] [PubMed]
- Trinh, H.H.; Nguyen, C.P.; Hao, W.; Wongchoti, U. Does stock liquidity affect bankruptcy risk? DID analysis from Vietnam. Pac. Basin Financ. J. 2021, 69, 101634. [Google Scholar] [CrossRef]
- Miller, K.; Hyodo, T. Impact of the Panama Canal expansion on Latin American and Caribbean ports: Difference in difference (DID) method. J. Shipp. Trade 2021, 6, 1–23. [Google Scholar] [CrossRef]
- Yan, C.; Chen, W.; Yang, Y.; Dong, J.; Qiao, R. Empirical Study on Urban Waterlogging Data Governance Model Based on DID. In IOP Conference Series: Earth and Environmental Science; IOP Publishing: Bristol, UK, 2021; Volume 781. [Google Scholar]
- Zhou, G.; Liu, C.; Luo, S. Resource Allocation Effect of Green Credit Policy: Based on DID Model. Mathematics 2021, 9, 159. [Google Scholar] [CrossRef]

Publisher’s Note: MDPI stays neutral with regard to jurisdictional claims in published maps and institutional affiliations. |
© 2022 by the authors. Licensee MDPI, Basel, Switzerland. This article is an open access article distributed under the terms and conditions of the Creative Commons Attribution (CC BY) license (https://creativecommons.org/licenses/by/4.0/).