Abstract
In practical engineering, concrete is often under continuous stress conditions and there are limitations in considering the effect of wet–dry cycles alone on the strength deterioration of concrete. In order to study the deterioration of concrete strength under the coupling of load and wet-dry cycles, concrete specimens were loaded with 0%, 10%, 20%, and 35% stress levels and coupled to undergo one, three, and seven wet–dry cycles. The strength deterioration of the concrete was obtained by uniaxial compression and the regression equation was established. The strength deterioration mechanism of the concrete under the coupled conditions was analyzed and revealed through an AE acoustic emission technique and nuclear magnetic resonance technique. The results of the study show that, with the same number of wet–dry cycles, there are two thresholds of a and b for the uniaxial compressive strength of concrete with the stress level, and with the progression of wet–dry cycles, the length of the interval from a to b gradually shortens until it reaches 0. The cumulative AE energy of concrete decreases with the progression of wet–dry cycles; using the initiating crack stress as the threshold, the calm phase of concrete acoustic emission, the fluctuating phase, and the NMR T2 spectral peak area show different patterns of variation with the increase in the number of wet–dry cycles.
1. Introduction
In engineering applications, the study of the mechanical properties of concrete structures under natural conditions plays a vital role in effectively predicting the life cycle of buildings. The factors affecting the mechanical properties of concrete include carbonation [,,], freeze–thaw cycles [,,], wet–dry cycles (chloride salts [,,], as well as sulphate [,]), and the effects of different forms of loading [,,,,], where the effects of wet–dry cycles of different salt solutions on the mechanical properties of concrete have become the focus of a wide range of scholars.
As concrete is made of rocks that experience natural effects, making its chemical composition not yet stable, an in-depth study of the role of different salt solutions for wet–dry cycles on the impact of the concrete structure is of great significance. For example, Su [] argued that the mass fraction of the salt solution is directly proportional to the degree of concrete damage, and with the progression of wet–dry cycles, the quality of concrete first increased and then decreased. Wang [] used SEM technology to explain the mechanism of concrete deterioration due to the crystalline swelling effect of Na2SO4·10H2O from a microscopic perspective, followed by Jiang [], through regression analysis, who established the wet–dry cycle conditions of a sulphate solution using a stress–strain equation for damaged concrete under wet–dry cycles of a sulphate solution. Although there are many saline areas in China, the concentration of salt solutions subjected to wet–dry cycles in most areas of buildings is very low or even negligible, and it is equally important to study the effect of water on the wet–dry cycles of concrete. However, in practical engineering, concrete is often in distinctive low stress situations, and the single factor consideration of wet–dry cycling makes the prediction of concrete durability somewhat limited, and it is not conducive to accurately deriving the service life of buildings. Combined with the current research, the summary of the coupling of wet–dry cycles and continuous loading on the concrete deterioration law is not extensive enough; Wang [] completed a similar exploration of CFRP reinforced beams, and revealed the method of damage from the surface layer to the internal bond development; however, for concrete material, the coupling effect related to the deterioration mechanism has not yet been explored.
This paper uses a rock rheological perturbation effect instrument as a continuous load system, and utilizes natural immersion at room temperature and natural drying to simulate wet–dry cycles. The effect of different loads coupled with wet–dry cycles on the deterioration process of concrete strength is analyzed, and the deterioration mechanism of concrete is analyzed according to acoustic emission and nuclear magnetic resonance techniques. The results of the research can be invoked as a reference for the accurate prediction of the service life of concrete structures under combined dry, wet, and continuous loading, as well as for protective measures.
2. Materials and Methods
2.1. Material Composition
The concrete mixes are shown in Table 1. Also, the individual materials are described as follows.

Table 1.
Mix proportion of concrete kg/m3.
Cement: M32.5 masonry cement (cement from Huainan Shunyue Cement Co., Ltd., Huainan, China) is used.
Granite gravel: Particle size 5–15 mm, density 2.63 g/cm3.
Sand: Huaihe River sand, maximum particle size 4.75 mm, fineness modulus 2.4, density 2.41 g/cm3.
Water: Laboratory tap water.
A PVC pipe with an outer diameter of 15 mm and a length of 200 mm was inserted into the bottom center of a standard concrete mold, as shown in Figure 1a. Cement was poured into this mold, then the PVC pipe was pulled out promptly within 6 h after fabrication. Finally, the molds were removed after 24 h and placed in saturated calcium hydroxide solution for 28 d. The details are shown in Figure 1b.
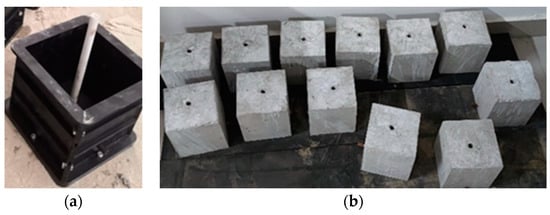
Figure 1.
Concrete preparation, including the (a) mold and (b) concrete specimens.
Three standard cubic specimens (150 mm×150 mm× 150 mm) were prepared for determining the compressive strength of concrete in standard curing for 28 d. The uniaxial compressive strength result was 17.7 MPa. Sixteen hollow concrete specimens were prepared, three of which were used to determine the compressive strength of the hollow concrete (17.7 MPa), one served as a control group, and 12 experienced the effects of different coupling conditions. In order to reduce the interference of the creep effect on the deterioration process, this test only discussed the first few wet-–dry cycles.
2.2. Design of the Degradation Process by Coupled Load-Holding and Wet–Dry Cycles
In order to reduce the fluctuation of the continuous pressure load, this test adopted the mechanical loading method using the RRTS-II Rock Rheology and Disturbance Effect Tester [,] as the loading device. When loading, firstly, the hydraulic oil was delivered into the small cylinder and then the big cylinder through the hydraulic pump, then the piston rod in the big cylinder contacted the concrete and provided the compressive stress, and finally the small cylinder maintained the pressure in the big cylinder through the pipeline, thus constituting a pressure stabilization system, as shown in Figure 2. Loading was done using gears and hydraulic secondary expansion, with an expansion ratio of up to 60–100 times or so (the expansion ratio of this test device is 72); the expansion ratio K can be expressed as follows:
where d1 and d2 are the diameters of the large and small gears, respectively, and φ1 and φ2 are the diameters of the pistons of the large and small cylinders, respectively.
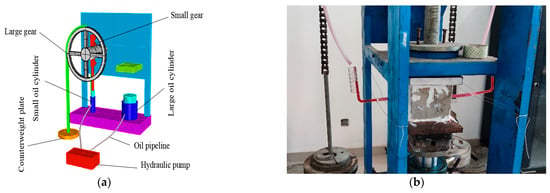
Figure 2.
Testing machine used for the rock rheological perturbation effect, including the (a) schematic and (b) actual test.
Define the load level λc as the ratio of the actual loading stress ƒ to the mean uniaxial compressive strength of the specimen ƒc, which can be expressed as follows:
The concrete water absorption system is based on the principle of the linker. Two rubber tubes (13 mm outer diameter) are glued to the two ends of the concrete central aperture, and the joints are filled with glass glue (left for 24 h) to ensure the sealing of the water absorption system. After 10 min of applying load to the concrete in order to reach a predetermined value, two L-shaped (6 mm inner diameter) glass tubes were inserted into the rubber tubes. Then, water was injected from the inlet pipe, and after 24 h of water absorption, the blower was used to dry naturally for 24 h. After 24 h of the water absorption process, the concrete surface showed obvious water stains, and the initial water absorption rate of concrete was approximated after 24 h and 48 h of air drying time, respectively. Therefore, it is considered that the concrete reached the natural drying state after 24 h of air drying
The degradation coupling conditions of this test are shown in Table 2, and at the end of the degradation process, four standard cylindrical specimens with a diameter of 50 mm and a height of 100 mm were removed from each hollow concrete specimen. One of them was soaked in water until saturation for NMR testing, and the remaining three were dried in an oven at 106 °C for 48 h for uniaxial compressive strength testing, while the average moisture content was 2% in the natural drying state and 6% in the saturated state.

Table 2.
Coupling conditions to which the concrete was subjected.
As shown in Figure 3 and Figure 4, Figure. 3 shows the concrete undergoing the process of coupled action of continuous loading and wet-dry cycles. Figure 4 shows the location of each concrete specimen coring (Φ50 mm × 100 mm), and the overall coring.
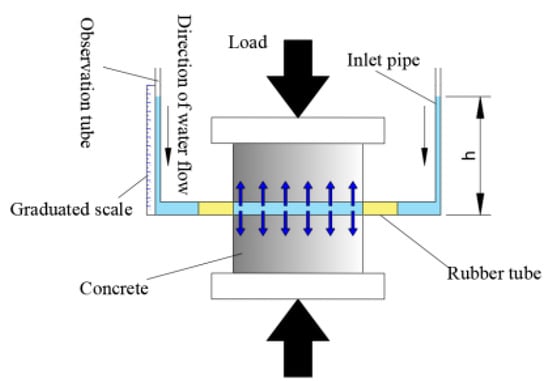
Figure 3.
Concrete loading and water absorption processes.
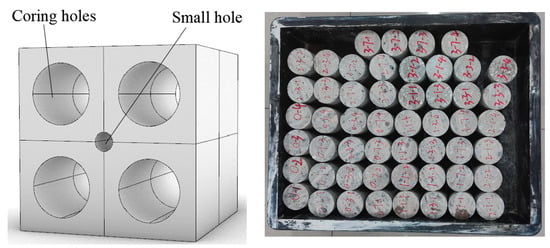
Figure 4.
Concrete coring.
2.3. Nuclear Magnetic Resonance Test
One specimen was taken from each of the 12 groups with different coupling conditions and one control group, and then immersed in water for 48 h (the difference between the masses after 24 h and 48 h was less than 0.1 g; the specimens after 48 h of immersion in water were considered as saturated specimens). To prevent moisture dissipation, the specimens were removed from the water, immediately wrapped tightly with plastic wrap, and then put into the NMR analyzer one by one for the T2 spectrum testing.
2.4. Uniaxial Compression and Acoustic Emission Tests
A uniaxial compression test with a loading rate of 0.01 mm/s was performed on the remaining three specimens of 12 groups with different coupling condition degradation groups and one control group. The AE system was also used for real-time monitoring during the loading process, with the acquisition threshold set to 40 dB and the acquisition frequency set to 3.5 MHz
3. Deterioration Law and Analysis of Concrete Strength Parameters
3.1. Strength Law after Concrete Deterioration
The uniaxial compressive strength and modulus of elasticity of the concrete under the influence of different deterioration conditions are shown in Table 3.

Table 3.
Uniaxial compressive strength and modulus of elasticity of concrete after deterioration.
To determine whether the effect of stress level and the number of wet–dry cycles on the uniaxial compressive strength of concrete is significant, based on Table 3, a two-factor ANOVA was performed using origin software, as shown in Table 4. It was found that the p-values of the stress level, the number of wet–dry cycles, and the interaction between the two factors were all less than 0.05. It can be concluded that both the stress level and number of wet–dry cycles had a significant effect on the uniaxial compressive strength of concrete.

Table 4.
Results of two-way ANOVA.
Based on the data in Table 3, the effects of the coupled condition on the deterioration of concrete are discussed in terms of the number of wet–dry cycles and stress levels, respectively, as shown in Figure 5
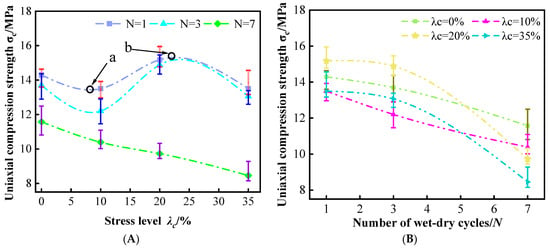
Figure 5.
Variation of specimen σc under different deterioration conditions, including (A) different stress levels and (B) different number of wet–dry cycles.
As shown in Figure 5A, the effect of different stress levels on concrete uniaxial compressive strength deterioration also differed when the number of wet–dry cycles was the same. There were two thresholds of a and b for the effect of the stress level on the uniaxial strength deterioration of concrete in both the first and third wet–dry cycles, where the stress level was 0% for interval a and 35% for interval b, and the uniaxial compressive strength of the concrete was negatively correlated with the stress level. However, in the interval from a to b, the uniaxial compressive strength of concrete increased with the increase in stress level, and at the same time, the length of the interval in the range from a to b gradually decreased with the increase in the number of wet–dry cycles.
The analysis showed that, as the stress level increased, the pores inside the concrete first closed and then ruptured to develop cracks. When the stress level was in the interval of 0% to a, the pores started to close and the pore size kept shrinking. According to the literature [,], the height of capillary water absorption inside the concrete is inversely proportional to the capillary pore size. Therefore, as the stress level increases, the water invades deeper into the concrete, increasing the contact area between the particles and the water. Then, the bond between the particles is weakened, making the uniaxial compressive strength of concrete decreasing. In the stress level in the interval a to b, the pore closure, to a certain extent, made the pore diameter smaller than the capillary pore diameter, thus gradually blocking the water to the internal erosion. Therefore, in this interval, the uniaxial compressive strength of concrete was positively related to the stress level. When the stress level was at b to 35%, the pores inside the concrete gradually expanded and converged into cracks under the stress. This led to an increase in the contact area between the internal particles of the concrete and water, making its uniaxial compressive strength decrease with the increasing stress level. In addition, this analysis could be verified at different numbers of wet–dry cycles affecting the length of interval from a to b. After different times of wet–dry cycle deterioration, the uniaxial compressive strength of concrete decreased, resulting in a corresponding decrease in the initiating crack stress and a corresponding decrease in threshold b.
As shown in Figure 5B, the overall concrete uniaxial compressive strength decreased with the increase in the number of wet–dry cycles. However, the decreasing trend of uniaxial compressive strength varied under different stress levels. At a stress level λc of 0%, the uniaxial compressive strength of concrete decreased approximately linearly. Nevertheless, at a stress level λc of 10%, the uniaxial compressive strength of the concrete decreased in a concave curve. This is because the bond between the particles inside the concrete was weakened by the external load when a continuous load with a stress level λc of 10% was applied to the concrete. At this time s, the first few wet–dry cycles of concrete deterioration increased. However, with the increase in the number of wet–dry cycles, the bond between the internal particles of concrete was reduced. Thus, the concrete uniaxial compressive strength tended to stabilize. At stress levels λc of 20% and 35%, the uniaxial compressive strength of concrete showed a convex non-linear decreasing trend. This was because for the stress level at this stage, the concrete internal cracks started to develop, while water intrusion at the cracks dissolved the cement between the particles. At the same time, with the increase in the number of wet–dry cycles, the repeated dissolution of water on the particles at the concrete fissured. This led to the development of more cracks, which in turn accelerated the rate of concrete strength decline.
3.2. Regression Analysis of Uniaxial Compressive Strength of Concrete
To analyze the variation of the uniaxial compressive strength of concrete under the action of different coupling conditions we used non-linear surface fitting of the uniaxial compressive strength of concrete, with the stress level and number of wet–dry cycles as independent variables in the software origin. After several fitting comparisons, the uniaxial compressive strength RationalTaylor nonlinear surface regression model was obtained, as shown in Equation (3).
where z is the uniaxial compressive strength of concrete after deterioration, x is the number of wet–dry cycles, and y is the stress level.
As shown in Figure 6, a visualization model was constructed to analyze the variation of the uniaxial compressive strength of concrete after the action of different coupling conditions. Overall, the relationship between the stress level and the uniaxial compressive strength of concrete tended to be gradually negative from the threshold fluctuations as the number of wet–dry cycles increased. Overall, with the increase in the number of wet–dry cycles, the relationship between the stress level and uniaxial compressive strength of concrete fluctuated from a threshold value then gradually tended to have a negative correlation.
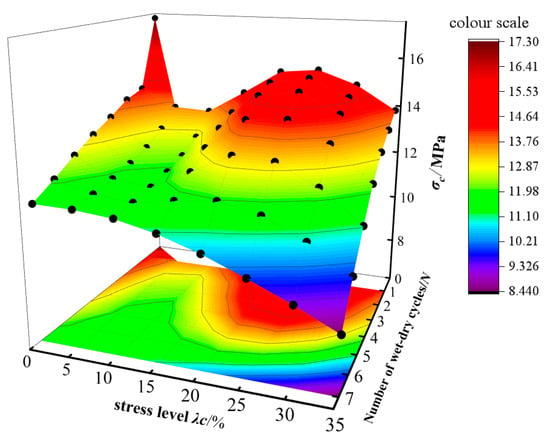
Figure 6.
Strength deterioration pattern of the coupled concrete.
3.3. Analysis of Concrete Damage Evolution
Numerous studies have shown that the damage variable D of concrete under external loading should satisfy the Weibull distribution, whose expression is as follows:
where ξ is the strain, m is the shape parameter, and a is the material parameter. According to the summary of Wu [], the larger the value of m, the more elastic or brittle the material tends to be, and the smaller the value of m, the more plastic the material tends to be.
Also according to the literature [], parameters m and a are related to the material properties as follows:
where E is the initial modulus of elasticity of the concrete, E0 is the cut-line modulus of the concrete past the peak load point after deterioration, and ξmax is the strain corresponding to the maximum stress value of the concrete after deterioration.
To facilitate a comparison of the concrete damage curves under different deterioration conditions, define ξ/ξ max = x and substitute into Equation (4), i.e.,
We then completed an analysis of the initial damage to the concrete after the action of different coupling conditions and the damage during uniaxial compression. For reasons of space, the damage curves for concrete subjected to seven wet–dry cycles and after a stress level of 35% deterioration were compared separately in this paper. The relevant parameters of the damaged specimens are shown in Table 5.

Table 5.
Selected concrete damage related parameters.
As shown in Figure 7a, the growth rate of the concrete damage variable D at the initial stage was proportional to the stress level, until the strain was less than the peak strain. For both, after the strain ratio was greater than 0.75, the damage variable D tended to level off. The degree of deterioration of concrete deepened with the increase in the stress level of the load applied after the action of multiple wet–dry cyclic processes.
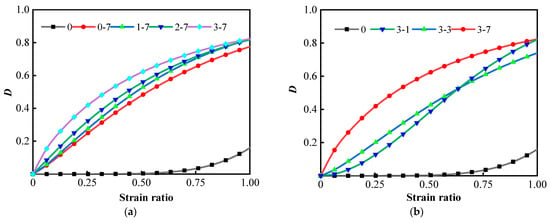
Figure 7.
Evolution of some concrete damage, including (a) N = 7 and (b) λc = 35%.
As shown in Figure 7b, at a stress level λc of 35%, the damage curve of the first wet–dry cycle concrete was first below the third and then rose above the third wet–dry cycle. The analysis showed that in the concrete curing process, there are some silicate components without a hydration reaction. Therefore, in the process of the wet–dry cycle, the internal joint weakness of the concrete will be destroyed by water erosion. However, the strong joint cannot be eroded by water, and thus the hydration reaction was carried out to strengthen the particles’ association with each other. For the first and third wet–dry cycle damage curves, the early stage of the damage curve depended on the damage at the weak internal concrete joint [,], while the later stage depended on the hydration reaction at the strong internal concrete joint. As the number of wet–dry cycles increased, the damage variable D gradually increased from slow to rapid in the initial stage. This indicates that the concrete was more deeply affected by the deterioration. Summarizing the relevant literature [,] and as described in Figure 7, under coupled action conditions, the number of wet–dry cycles determined the lower limit of concrete deterioration, while the upper limit of concrete deterioration depended on the stress level of the sustained load.
4. Analysis of the Deterioration Mechanism of Concrete
4.1. Analysis of Concrete Acoustic Emission Energy Characteristics
The stress–strain curves reflect the macroscopic damage evolution of concrete. In addition, the study of the accompanying AE test parameters further analyzed the detailed information of the concrete specimens at different stages from a microscopic point of view. Concrete in the uniaxial compression process went through the compression dense stage, elastic stage, plastic stage, and post-peak stage. The corresponding acoustic emission detection went through three periods of calm, rising, and fluctuating phases, as shown in Figure 8a. The three periods of acoustic emission of concrete without the action of coupling conditions could correspond well to the four stages of the uniaxial compression process. According to the literature [], it is known that the “cracking stress” of concrete is around 3 MPa. The corresponding stress level is between 10% and 20%. To visually compare the degree of deterioration effect of different coupling conditions on concrete, the stresses, AE energy release rates, and cumulative AE energy versus time for concrete under the action of coupled conditions with different stress levels experiencing seven wet–dry cycles, and stress levels of 35% experiencing different numbers of wet–dry cycles, are given, respectively.
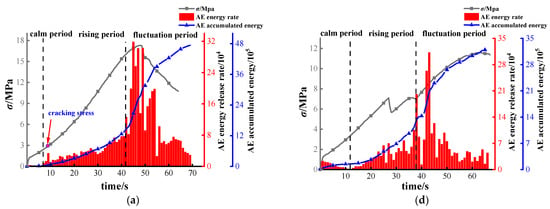
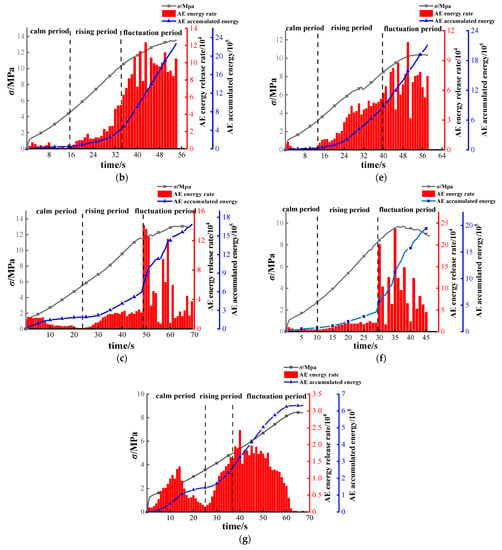
Figure 8.
Concrete AE energy release rate, AE cumulative energy and stress versus time, including (a) λc = 0% N = 0, (b) λc = 35% N = 1, (c) λc = 35% N = 3, (d) λc = 0% N = 7, (e) λc = 10% N = 7, (f) λc = 20% N = 7, and (g) λc = 35% N = 7.
Comparing plots (b), (c), and (d) in Figure 8, the cumulative AE energy of the acoustic emission during the uniaxial compression test of concrete with increasing number of wet–dry cycles when the stress levels λc were all 35% decreased with increasing number of wet–dry cycles. The analysis suggested that the erosive action of water weakened or destroyed the concrete joint weaknesses. The drying process was then accompanied by the creation of secondary pores [] within the concrete. Therefore, as the number of wet–dry cycles increased, secondary pore space was also created, thus increasing the extent of water erosion. These factors led to a continuous decrease in the concrete strength, an increasing growth rate of cumulative energy in the calm phase, an overall advance in the fluctuating phase, and a continuous advance in the maximum point of cumulative AE energy release rate. All of these phenomena indicate that the internal particles of concrete are more severely exploited by the wet–dry cyclic process, and the specimens gradually changed from brittle to plastic.
In the uniaxial compression process, the pores inside the concrete gradually closed with the increase in stress. When the stress reached the “cracking stress”, the closed pores began to rupture and converge to develop cracks. Comparing (d), (e), (f) and (g) in Figure 8, the cumulative AE energy of the concrete decayed with the increasing stress level at seven wet–dry cycles. Plots (e) and (f) reflect the stages where the stress level was less than the cracking stress. Plots (d) and (g) reflect the stages where the stress level was greater than the cracking stress. A comparison of the two plots for each stress level phase shows that the cumulative AE energy share of both the calm phase and the rising phase of the specimen increased as the stress level increased. Although the laws are similar, the deterioration mechanisms are different. When the stress level is less than the initiating crack stress, the pore radius inside the concrete will keep decreasing. Because the depth of capillary action is inversely proportional to the radius of the capillary pores, the depth of water intrusion into the concrete specimen increases. This led to an increase in the dissolution effect of water on the micro-particles. The deterioration of concrete by this mechanism did not manifest itself in the first few wet–dry cycling processes, but was postponed over several wet–dry cycling processes. This was a result of the secondary cracking caused by each wet–dry cycling process. When the stress level approached the crack initiation stress, the fracture gradually closed to a size smaller than the capillary pore, thus reducing the water infiltration. Then, as the stress level as greater than the initiating crack stress [,], concrete cracks gradually developed and increased the contact surface of the water and micro particles. This deterioration mechanism on concrete often manifested itself during the first few wet–dry cycles. After several cycles, the crack surface was not spalled with micro particles. After this stage, the deterioration effect of wet–dry cycles on the concrete is not obvious. The above mechanism can be verified with the conclusions of Section 3.2.
4.2. Nuclear Magnetic Resonance T2 Spectroscopy
Nuclear magnetic resonance (NMR) instrumentation utilizes the phenomenon of NMR generated by hydrogen nuclei in the presence of an applied magnetic field. The porosity of the specimen as well as the pore distribution were analyzed by measuring the transverse relaxation time (T2) cutoff value of the saturated specimen. Among them, the size of the total peak area of the T2 spectrum was related to the porosity of the specimen, and the position where the peak was located was related to the percentage of the pore size of the pore. The peak areas of each specimen after the action of different degradation parts are given in Table 6, and draw Figure 9, for example.

Table 6.
Peak areas of the T2 spectra of concrete under different conditions.
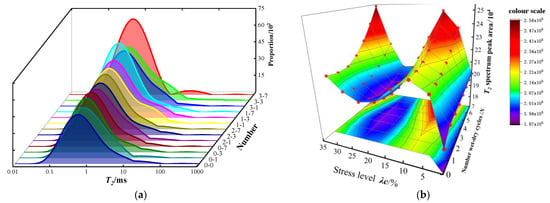
Figure 9.
T2 spectra of the specimens under different conditions, including the (a) T2 spectrum distribution curve and (b) T2 spectrum peak area.
Combining Table 4 and Figure 9, the total peak area of the T2 spectrum increased with the number of wet–dry cycles at stress levels λc of 0 and 10%. Where the stress level λc was 0, the peak area of the T2 spectrum increased by 0.62% for the third wet–dry cycle compared to the first one. The seventh wet–dry cycle increased by 2.78% compared with the first one, and the overall pattern increased linearly. At a stress level λc of 10%, the T2 spectral area increased by 1.50% in the third wet–dry cycle compared with the first. The seventh wet–dry cycle increased by 14.31% compared with the first one, with a parabolic progression in the overall pattern. The analysis concluded that when the stress level was less than the “cracking stress” stage, the depth of water infiltration into the concrete became deeper due to the capillary effect. Therefore, the dissolution effect on the micro-particles was more obvious, which led to a greater degree of degradation for a stress level of 10% than for a stress level of 0 in the wet–dry cycles. At stress levels λc of 20% and 35%, the T2 spectral peak area decreased first and then increased with the increase in the wet–dry cycles. When the stress level λc was 20%, the T2 spectrum area decreased by 2.25% after three wet–dry cycles compared with once, and increased by 0.62% after seven wet–dry cycles compared with once. At a stress level λc of 35%, the T2 spectrum area decreased by 0.46% after three wet–dry cycles compared with once, and increased by 18.50% after seven wet–dry cycles compared with once.
After the analysis, the regenerative pore generation inside the concrete is shown in Figure 10. Under the condition of continuous loading, the internal edge pores were subjected to certain stress concentration. At this time and then after the impact of the wet–dry cycles on the edge pores, the strength here was reduced, and then under the action of continuous loading, the fissures were continuously expanded. There was an increase the contact area between the wet–dry cycle and the concrete internal particles. At the same time, the pores in the concrete developed and converge into cracks when the stress level was greater than the “crack initiation stress” stage. However, during the drying process, the water left the concrete in the gas and liquid phase [], and some of the dissolved material was left in the cracks, which led to the phenomenon that the T2 peak area of concrete at this stress level first decreased and then increased.
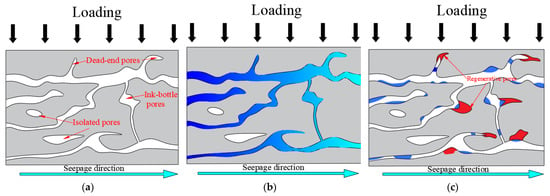
Figure 10.
Concrete pore regeneration process: (a) initial diagram, (b) saturation diagram, and (c) naturally drying diagram.
5. Conclusions
- (1)
- For the same number of wet–dry cycles, there are two thresholds for the effect of stress level on the uniaxial compressive strength of concrete a and b. The uniaxial compressive strength of concrete decreases with increasing the stress level in the interval from 0% to a. The stress level increases with increasing the load. In the interval from a to b, the concrete uniaxial compressive strength increases with the increase in load. In the interval b to 35%, the concrete uniaxial compressive strength again decreases with the increasing stress level. Meanwhile, the length of the interval from a to b decreases until it becomes zero, as the number of wet–dry cycles increases.
- (2)
- The RationalTaylor regression model is used to better describe the variation of the uniaxial compression strength of concrete under the coupling conditions of different stress levels and the number of wet–dry cycles.
- (3)
- Concrete AE evolution can be divided into three phases: calm phase, rising phase, and fluctuating phase. In the process of wet–dry cycle progression, the cumulative AE energy release percentage in the concrete calm phase stage increases continuously, and the fluctuation phase stage will gradually advance. Taking the crack initiation stress as the threshold, the concrete calm phase as well as the fluctuation phase change with an increment of the stress level in the phase greater than or less than the crack initiation stress, and the same law as for the wet–dry cycle progression.
- (4)
- When the stress level is less than the cracking stress, the T2 peak area of concrete increases with the progression of wet–dry cycles. However, when the stress level is greater than the cracking stress, the T2 peak area decreases and then increases with the progression of the wet–dry cycles.
Author Contributions
L.W. and M.G. conceived and designed the theoretical framework; L.W. performed the experiment and collected the data; L.W. and J.Z. performed co-writing and revising of the manuscripts. All authors have read and agreed to the published version of the manuscript.
Funding
This work was supported by Innovation Fund for Graduate Students of Anhui University of Science and Technology (2021CX2015).
Institutional Review Board Statement
Not applicable.
Informed Consent Statement
Not applicable.
Data Availability Statement
The data presented in this study are available upon request from the corresponding author.
Acknowledgments
The authors would like to thank the project (2021CX2015) of the Anhui University of Science and Technology Graduate Innovation Fund.
Conflicts of Interest
The authors declare that they have no known competing financial interest or personal relationship that could have appeared to influence the work reported in this paper.
References
- Tong, Y.Y.; Ye, L.; Ma, C. Mechanism Investigations of Realkalization for Carbonated Reinforced Concrete Based on Real Time Raman Spectroscopy Analysis. J. Build. Mater. 2017, 20, 894–901. (In Chinese) [Google Scholar] [CrossRef]
- Jiang, C.; Gu, X.L. Discussion of “Assessing concrete carbonation resistance through air permeability measurements” by R. Neves et al. [Construction and Building Materials 82(2015): 304–309]. Constr. Build. Mater. 2016, 102, 913915. [Google Scholar] [CrossRef]
- Ramesh, B.A.; Kondraivendhan, B. Effect of Accelerated Carbonation on the Performance of Concrete Containing Natural Zeolite. J. Mater. Civ. Eng. 2020, 32, 04020037. [Google Scholar] [CrossRef]
- Jiang, W.Q.; Liu, Q.F. Chloride Transport in Concrete Subjected to Freeze-Thaw Cycles-A Short Review. J. Chin. Ceram. Soc. 2020, 48, 258–272. (In Chinese) [Google Scholar] [CrossRef]
- Cao, D.F.; Ge, W.J.; Wang, B.Y.; Tu, Y.M. Study on the flexural behaviors of RC beams after freeze-thaw cycles. Int. J. Civ. Eng. 2015, 13, 92–101. (In Chinese) [Google Scholar] [CrossRef]
- Zhang, S.; Zhao, B. Research on the performance of concrete materials under the condition of freeze-thaw cycles. Eur. J. Environ. Civ. Eng. 2013, 17, 860–871. [Google Scholar] [CrossRef]
- Li, D.W.; Li, L.Y.; Wang, X.F. Chloride diffusion model for concrete in marine environment with considering binding effect. Mar. Struct. 2019, 66, 44–51. [Google Scholar] [CrossRef]
- Yang, C.C. On the relationship between pore structure and chloride diffusivity from accelerated chloride migration test in cement-based materials. Cem. Concr. Res. 2006, 36, 1304–1311. [Google Scholar] [CrossRef]
- Song, H.W.; Lee, C.H.; Ann, K.Y. Factors influencing chloride transport in concrete structures exposed to marine environments. Cem. Concr. Compos. 2008, 30, 113–121. [Google Scholar] [CrossRef]
- Chen, J.; Jiang, M.; Zhu, J. Damage evolution in cement mortar due to erosion of sulphate. Corros. Sci. 2008, 50, 2478. [Google Scholar] [CrossRef]
- Liu, K.W.; Cheng, W.W.; Sun, D.S.; Wang, A.G.; Zhang, G.Z. Effects of pH Value of Sulfate Solution on Calcium Leaching and Products of Cement Mortars. J. Build. Mater. 2019, 22, 179–185. (In Chinese) [Google Scholar] [CrossRef]
- Zhang, J.; Yang, K.; He, X.; Wei, Z.; Zhao, X.; Fang, J. Experimental Study on Strength Development and Engineering Performance of Coal-Based Solid Waste Paste Filling Material. Metals 2022, 12, 1155. [Google Scholar] [CrossRef]
- Huang, W.; Guo, Y.; Shen, A.; Li, Y.; Song, P. Numerical simulation of internal stress in pavement concrete under rolling fatigue load. Int. J. Pavement Eng. 2022, 23, 1306–1315. [Google Scholar] [CrossRef]
- Wang, J.; Su, H.; Du, J.S. Influence of coupled effects between flexural tensile stress and carbonation time on the carbonation depth of concrete. Constr. Build. Mater. 2018, 190, 439–451. [Google Scholar] [CrossRef]
- Wang, C.; Wu, H.; Li, C. Hysteresis and damping properties of steel and polypropylene fiber reinforced recycled aggregate concrete under uniaxial low-cycle loadings. Constr. Build. Mater. 2022, 319, 126191. [Google Scholar] [CrossRef]
- Yu, H.F.; Sun, W.; Zhang, L.P.; Guo, L.P.; Li, M.D. Durability of concrete subjected to the combined actions of flexural stress, freeze-thaw cycles and bittern solutions. J. Wuhan Univ. Technol.-Mater. Sci. Ed. 2008, 23, 893–900. [Google Scholar] [CrossRef]
- Su, X.P.; Wang, Q. Experiment of the Concrete Performance the Condition of Multiple Salts and Wet-dry Cycles. J. Jilin Univ. 2013, 43, 851–857. (In Chinese) [Google Scholar]
- Wang, H.L.; Dong, Y.S.; Sun, X.Y.; Jin, W.L. Damage mechanism of concrete deteriorated by sulfate attack in wet-dry cycle environment. J. Zhejiang Univ. 2012, 46, 1255–1261. (In Chinese) [Google Scholar] [CrossRef]
- Jiang, L.; Niu, D.T. Study of constitutive relation of concrete under sulfate attack and drying-wetting cycles. J. China Univ. Min. Technol. 2017, 46, 66–73. (In Chinese) [Google Scholar] [CrossRef]
- Wang, S.Y.; Ding, L.; Hong, L. Durability study of high strength concrete beams strengthened with CFRP under sustained load and wet-dry cycle conditions. Build. Struct. 2017, 47, 78–83. (In Chinese) [Google Scholar] [CrossRef]
- Gao, Y.F.; Ma, P.P.; Huang, W.P.; Li, X.B.; Cui, X.H. RRTS-II testing machine for rock rheological perturbation effect. Chin. J. Rock Mech. Eng. 2011, 30, 238–243. (In Chinese) [Google Scholar]
- Cui, X.H.; Gao, Y.F.; Li, J.L. Research and Development of Rock Creep Experimental System under the Disturbing Load. J. Shandong Univ. Sci. Technol. 2006, 25, 36–38. (In Chinese) [Google Scholar] [CrossRef]
- Zhou, C.Y.; Wei, J.X.; Yu, Q.J.; Yin, S.H.; Zhuang, Z.H.; Lei, Z.H. Water Absorption Characteristics of Autoclaved Aerated Concrete. J. Wuhan Univ. Tech. 2007, 4, 22–26. (In Chinese) [Google Scholar] [CrossRef]
- Zeng, X.H.; Deng, D.H.; Xie, Y.J. Capillary Water Absorption Behavior of CA Mortar. J. Southwest Jiaotong Univ. 2011, 46, 211–216. (In Chinese) [Google Scholar] [CrossRef]
- Wu, Z.; Zhang, C.J. Study of rock damage model and its mechanical properties under unidirectional load. Chin. J. Rock Mech. Eng. 1996, 55–61. Available online: https://kns.cnki.net/kcms/detail/detail.aspx?FileName=YSLX601.007&DbName=CJFQ1996 (accessed on 14 September 2022).
- Zuo, S.H.; Xiao, J.; Yuan, Q. Comparative study on the new-old mortar interface deterioration after wet-dry cycles and heat-cool cycles. Constr. Build. Mater. 2020, 244, 118374. [Google Scholar] [CrossRef]
- Lv, Y.J.; Zhang, W.H.; Wu, F.; Li, H.; Zhang, Y.S.; Xu, G.D. Influence of Initial Damage Degree on the Degradation of Concrete Under Sulfate Attack and Wetting Drying Cycles. Int. J. Concr. Struct. Mater. 2020, 14, 47. [Google Scholar] [CrossRef]
- Zhu, J.; Yu, R.; Han, S.; Tong, Y.; Zhang, H.; Zhen, Z. Strength Deterioration of Mudstone with Different Initial Dry Densities under Wet-dry Cycles. J. China Railw. Soc. 2021, 43, 109–117. (In Chinese) [Google Scholar]
- Zhu, J.H.; Han, S.X.; Tong, Y.M.; Li, Y.; Yu, R.G.; Zhang, H.Y. Effect of Wet-dry Cycles on the Deterioration of Sandstone with Various Initial Dry Densities. J. South China Univ. Technol. (In Chinese). Available online: http://www.baidu.com/link?url=171VjgLuBjaYdBUERZWUq6sB_gSBpaaGH52tIPvGHlpPz49sgboULPF2Qy8zupm6cEKVC0mEDAecc9PkNuVpFYsSMiP-seE2wxeTfdyjhmI9SDL6PhwgSbhpxOcBkqbr&wd=&eqid=ad740e3b0000415900000003634e33f6 (accessed on 14 September 2022).
- Li, P.F.; Zhao, X.G.; Cai, M.F. Discussion on approaches to identifying cracking initiation stress of rocks under compression condition: A case study of Tianhu granodiorite in Xinjiang Autonomous Region. Rock Soil Mech. 2015, 36, 2323–2331. (In Chinese) [Google Scholar] [CrossRef]
- Khanlari, G.; Abdilor, Y. Influence of wet–dry, freeze–thaw, and heat–cool cycles on the physical and mechanical properties of Upper Red sandstones in central Iran. Bull. Eng. Geol. Environ. 2015, 74, 1287–1300. [Google Scholar] [CrossRef]
- Wang, L.Z.; Gao, M.Z.; Yang, D.C.; Wang, P. Capillary Water Absorption Properties of Concrete under Continuous Loading Coupled with Wet-Dry Cycle. J. Bull. Chin. Ceram. Soc. 2022, 41, 1998–2006. [Google Scholar] [CrossRef]
- Ma, Z.; Shen, J.; Wang, C.; Wu, H. Characterization of sustainable mortar containing high-quality recycled manufactured sand crushed from recycled coarse aggregate. Cem. Concr. Compos. 2022, 132, 104629. [Google Scholar] [CrossRef]
Publisher’s Note: MDPI stays neutral with regard to jurisdictional claims in published maps and institutional affiliations. |
© 2022 by the authors. Licensee MDPI, Basel, Switzerland. This article is an open access article distributed under the terms and conditions of the Creative Commons Attribution (CC BY) license (https://creativecommons.org/licenses/by/4.0/).