Article

Decomposition Analysis of Regional Embodied Carbon Flow and Driving Factors—Taking Shanghai as an Example

1
State Grid Shanghai Economic Research Institute, Shanghai 200233, China
2
School of Management and Economics, Beijing Institute of Technology, Beijing 100081, China
3
State Grid Talents Exchange and Service Co., Ltd., Beijing 100053, China
4
State Grid Xinjiang Electric Power Co., Ltd., Xinjiang 830002, China
*
Author to whom correspondence should be addressed.
Sustainability 2022, 14(17), 11109; https://doi.org/10.3390/su141711109
Submission received: 2 August 2022 / Revised: 30 August 2022 / Accepted: 1 September 2022 / Published: 5 September 2022
(This article belongs to the Special Issue Environmental Impact Assessment and Green Energy Economy)

Abstract

:
Developing localized climate mitigation strategies requires understanding how national consumption drives local carbon dioxide (CO2) emissions from a sectoral perspective. Exploring the carbon footprint considering inter-provincial trade is vitally important; however, few studies have explored the production side of embodied carbon emissions and the drivers of embodied carbon. Here, we use the multi-regional input–output model to calculate the flow of embodied carbon between provincial departments on Shanghai’s production side in 2012, 2015, and 2017. We also establish a decomposition method for the embodied carbon index with small data demand. Our results show that from 2012 to 2017, the outflow increased and went to tertiary industries in neighboring and economically developed provinces. Among them, the activity effect drove the increase in carbon emissions, and the technique effect drove the reduction in embodied carbon. Surprisingly, we found that the low efficiency of the energy utilization of metal products and the unreasonable structure of other services increased embodied carbon emissions from 2012 to 2015. Sectors with high exogenous embodied carbon emissions are critical areas in which collaborative mitigation efforts between Shanghai and downstream provinces drive these emissions. Shanghai should avoid falling into the “low-carbon trap” of developing countries. It should continue to adjust its industrial structure and increase the use of low-carbon energy to achieve carbon reduction.

1. Introduction

China, the world’s largest greenhouse gas (GHG)-emitting nation, has long been a primary producer of various industrial and consumer products [1]. However, extensive, decades-long development in China has led to various consequences, such as inefficient energy use, high energy intensity, and an unreasonable energy structure. The vast energy demand and inefficient use have produced large amounts of carbon dioxide (CO2) and local air pollutant (LAP) emissions that far exceed the maximum environmental capacity, consequently leading to regional air pollution issues and exacerbating global warming and climate change. In response to these challenges, faced during the urbanization process, at the general debate of the 75th session of the United Nations General Assembly, China solemnly announced: “China will enhance its independent national contribution, adopt more powerful policies and measures, strive to reach the peak of CO2 emissions by 2030, and strive to achieve carbon neutrality by 2060.”
In 2021, with a GDP of CNY 4321.4 billion, Shanghai ranked first in China and presently is China’s economic, financial, trade, and scientific and technological innovation center. Shanghai has also played a significant role as a central hub for international trade. In 2021, Shanghai’s port completed an annual cargo throughput of 769.7 million tons, ranking second globally. However, because of its lack of mineral resources, it needs to transfer many energy products from other parts of the country and a large number of carbon emissions through domestic trade. Previous carbon emission accounting for Shanghai mainly focused on direct carbon emissions and ignored the embodied carbon emissions, but the embodied carbon flowing from Shanghai to other provinces and cities has increased rapidly. As a national low-carbon city pilot, the progress of Shanghai’s emission-reduction work is directly related to the direction and effectiveness of China’s emission-reduction work. On this basis, this study explores the carbon emissions caused by provinces in Shanghai and the driving factors of Shanghai’s production-side carbon emissions, providing support for scientific and accurate regional decarbonization.
The existing literature shows that an increasing number of scholars have adopted the multi-regional input–output (MRIO) model to solve problems related to the calculation of carbon emission transfer. The single region input–output (SRIO) model was first built by Leontief [2]. It was later extended to multiple regions and widely used in environmental impact assessment (EIA) [3,4]. Many scholars have combined the MRIO model with the actual situation in China to solve environmental problems. Guo et al. [5] and Zhang et al. [6] used the MRIO model to calculate and analyze China’s inter-provincial carbon emission input–output, the carbon footprint of residents’ consumption in eight regions of China, and the carbon emissions of various departments in eight regions, revealing significant regional differences [5,6]. Su and Ang [7,8] explored the spatial agglomeration of carbon emission transfer by calculating the carbon emission transfer between major regions in China in 2002, and they optimized the inter-regional carbon emission transfer at the mechanism level [7,8]. Sun et al. [9] calculated the carbon transfer between Indian economic sectors from 1995 to 2009, according to the SRIO model. The study found that con (building) had the largest emissions, and egw (electricity, natural gas, water supply) accounted for 60% of the secondary industry’s CO2 emissions [9]. Based on the MRIO model, Chen et al. [10] compiled China’s interregional input–output table in 2012, calculated the trans-provincial carbon emission transfer, and analyzed trans-provincial carbon equity from the perspective of the carbon Gini coefficient [10]. Wang and Hu [11] used a carbon transfer measurement model for inter-regional bilateral trade to calculate the carbon emissions caused by China’s inter-provincial demand and exports in 2007, 2010, and 2012. Research shows that cooperation and the promotion of emission reduction technologies can effectively inhibit carbon emission transfer across provinces [11]. Han et al. [12] discussed the carbon emissions of Chinese provinces and other economies from a multi-regional perspective based on nested input–output analysis (IOA) [12]. Based on the MRIO model, Wang et al. [13] analyzed the carbon neutralization-oriented carbon emission reduction model by studying carbon emissions and transfer on the consumption side on the provincial and industrial levels in China [13]. Liu et al. [14] proposed a calculation method for embodied carbon transfer in the value chain based on the balance formula of the input–output table. They found that China’s cross-regional value chain embodied carbon transfer, and its net value showed an upward trend [14].
The embodied carbon flow calculated using the MRIO model reveals the impact of regional trade on carbon emission responsibility under different accounting principles. By decomposing the driving factors, we can have a clearer understanding of the composition of carbon emissions, which is conducive to the effective deployment of regional emission reduction. Regarding the decomposition of carbon emission transfer drivers, the popular academic methods include structural decomposition and logarithmic mean Divisia index (LMDI) decomposition, which have been widely used in various research scenarios. Based on the input–output model, Qian and Yang [15] and Jiang [16] used the structural decomposition method to decompose carbon emissions in the international trade of East Asia and BRIC countries [15,16]. Guo [17], Du and Sun [18], and Huang et al. [19] applied the LMDI method to decompose total, export, and inter-provincial trade carbon emissions [17,18,19]. However, the structural decomposition method requires a large amount of data, and there are interactive items in the decomposition process. Problems exist, such as inconsistent measurement results, the weak comparability of factor weights, and the complex decomposition of the interaction effects. LDMI decomposition requires a small amount of data, which can overcome the cross-term problem, and has been widely used worldwide. In summary, most existing studies use the MRIO model to calculate the international and domestic carbon emission transfer and different methods to decompose the driving factors. They analyze the inter-provincial carbon equity from multiple perspectives and propose corresponding carbon emission reduction suggestions.
Based on 2012, 2015, and 2017 data, this study uses the MRIO model to calculate the transfer of carbon emissions between provinces and employs the LMDI method to decompose the driving factors affecting the embodied carbon emissions on the production side of Shanghai. The contribution of this study is as follows: First, the embodied carbon on the production side of Shanghai is analyzed for the first time. Unexpectedly, much of Shanghai’s emissions come from the demand of other places, and the carbon emissions flowing into the tertiary industry show an increasing yearly trend. Second, we use a new embodied carbon decomposition method with small data demand rather than the traditional decomposition of direct carbon emissions. The results showed that the activity effect was the main driving factor for the increase in embodied carbon emissions, and the technique effect was the driving factor for the decrease in embodied carbon emissions. Finally, we found that electricity and hot water production and supply is a sector with high emission intensity. Regarding metal products, due to low energy efficiency, the technique effect resulted in an increase in embodied carbon emissions and other services owing to an unreasonable economic structure; its structural effect also resulted in an increase in embodied carbon emissions, which may provide a basis for carbon reduction in other cities worldwide.

2. Materials and Methods

2.1. Emission Embodied in Provincial Trade

In 1936, American economist Wassily Leontief proposed a “top-down” macroeconomic analysis method called input–output analysis (IOA) [2]. This analysis method mainly reflects the regional industrial production relationship by compiling input–output tables and mathematical models and studying the production capacity differences between regions. The IOA method relies on the input–output table, which reflects the mutual flow of money between different economic sectors, thus revealing the distribution of sector output and the composition of sector input. Using the relationship between rows and columns, IOA can comprehensively and objectively reflect the interdependence of mutual input and consumption between departments. Compared with other analysis methods, the advantage of the input–output analysis method is that it can quantitatively determine all local changes’ impacts on the economic system by studying the chaotic input–output relationship between the various parts.
Input–output models are divided into single-region input–output (SRIO) and multi-region input–output (MRIO) models. The MRIO model distinguishes the uses of imported products (intermediate input and final demand) and describes, in detail, the product flow in multilateral trade, distinguishing the source of imported products. It uses the carbon emission intensity of the source of products, which can estimate the hidden carbon emissions of each region accurately. Measuring the trade-embodied carbon emissions of various regions based on MRIO helps to deepen our understanding of the impact of trade on carbon emissions, clarify the pressure of each province under the guidance of carbon neutrality, and promote the rational allocation of emission reduction responsibilities. It provides an important theoretical basis for analyzing each province’s production-side carbon emission reduction model and realizing the 2060 national carbon neutrality goal.
Assuming that m regions exist in the MRIO model and that each region contains n departments, the row balance of the MRIO model can be expressed using Equation (1).
x = A x + y
where x is the m n × 1 matrix representing the total output; x i r is the total output of sector i in region r ; A is the m n × m n matrix representing the direct consumption coefficient; a i j r s is calculated by a i j r s = z i j r s / x j s ; z i j r s (i, j = 1,2,…, n) is the input from sector i of region r to sector j of region s ; and y is the m n × 1 matrix representing the final requirement. The above equation can be rewritten as Equation (2).
x = ( I A ) 1 × y
where I is the identity matrix, L = ( I A ) 1 is called the Leontief inverse matrix, which reflects the complete (direct and indirect) demand of the production unit’s final product for the total product, and y is the diagonal matrix formed by the final demand. Based on the MRIO model, the embodied carbon emissions on the production side of each region can be expressed using Equation (3).
C = e × ( I A ) 1 × y
where C is the embodied carbon on the production side, and e is the diagonal matrix representing the direct carbon emission intensity.
In addition, the matrix form of input and output is shown in Table A1 to help you understand the calculation process further.

2.2. Index Decomposition Analysis (IDA)

Two main technical methods exist for carbon emission decomposition: structural decomposition analysis (SDA) and index decomposition analysis (IDA). The IDA method uses the total data from departments and industries to analyze the changes in energy intensity, energy structure, economic scale, industrial structure, and other factors, which eases time series analysis and cross-regional and inter-city comparisons [20]. In addition, the IDA has lower data requirements, which eases interpreting the decomposition results. The embodied carbon emissions of interregional trade can be decomposed into three driving forces: activity effect ( Δ C a c t ), structure effect ( Δ C s t r ), and technique effect ( Δ C t e c ) [21]. Changes in total embodied carbon emissions in trade ( Δ C ) can be calculated using Equation (4).
Δ C = C T C 0 = Δ C a c t + Δ C s t r + Δ C t e c
where superscripts 0 and T represent the base and terminal years, respectively. Activity effect represents the contribution of total output value change, structure effect represents the contribution of production structure change, and technique effect represents the contribution of domestic emission intensity change as well as input–output coefficient change. According to the Kaya identity, the total CO2 emissions for all sectors embodied in trade can be calculated using Equation (5).
C = i Q Q i Q C i Q i = i Q × S i × T i
where Q represents the total value and refers to the activity effect; Q i represents the value of sector i ; C i represents CO2 emissions from sector i ; S i represents the share of the value of sector i in the total value, which refers to the structure effect; and T i represents the technical level of sector i and refers to the technique effect.
LMDI [22,23] is a type of IDA. Because LMDI decomposition has no residual error and effectively solves the problem of “0” value, it is widely used in carbon emission research. LMDI addition decomposition reflects the change in value of each driving factor under the change in value of total CO2, and multiplication decomposition reflects the unit contribution rate of each driving factor to CO2 emissions. The formulas for the three drivers have a similar structure, as follows:
Δ C a c t = i w i ln ( Q T Q 0 ) Δ C s t r = i w i ln ( S i T S i 0 ) Δ C t e c = i w i ln ( T i T T i 0 ) w i = C i T C i 0 ln C i T ln C i 0

2.3. Data

This study adopted interregional input–output tables for 42 sectors in 31 provinces, municipalities, and autonomous regions in China in 2012, 2015, and 2017. The yearly energy consumption data for each sector and region were obtained from the official data released by carbon emission accounts and datasets (CEADs) (https://www.ceads.net (accessed on 10 May 2020)). According to the existing literature, the 42 sectors in the input–output tables were merged into 20 sectors, including agriculture (01); mining and extraction of energy-producing products (02–03); mining and extraction of non-energy-producing products (04–05); light industry (06–10); petrochemical (11); chemical (12); nonmetal products (13); metallurgy (14); metal products (15); general and special purpose machinery (16–17); transport equipment (18); electrical equipment (19); computer, electronic, and optical products (20–21); other manufacturing (22,24); public utility (23,26–27); electricity and hot water production and supply (25); construction (28); wholesale, retail trade, and catering services (29,31); transport and telecommunication services (30,32); and other services (33–42). The specific setting is shown in Table A2.

3. Results

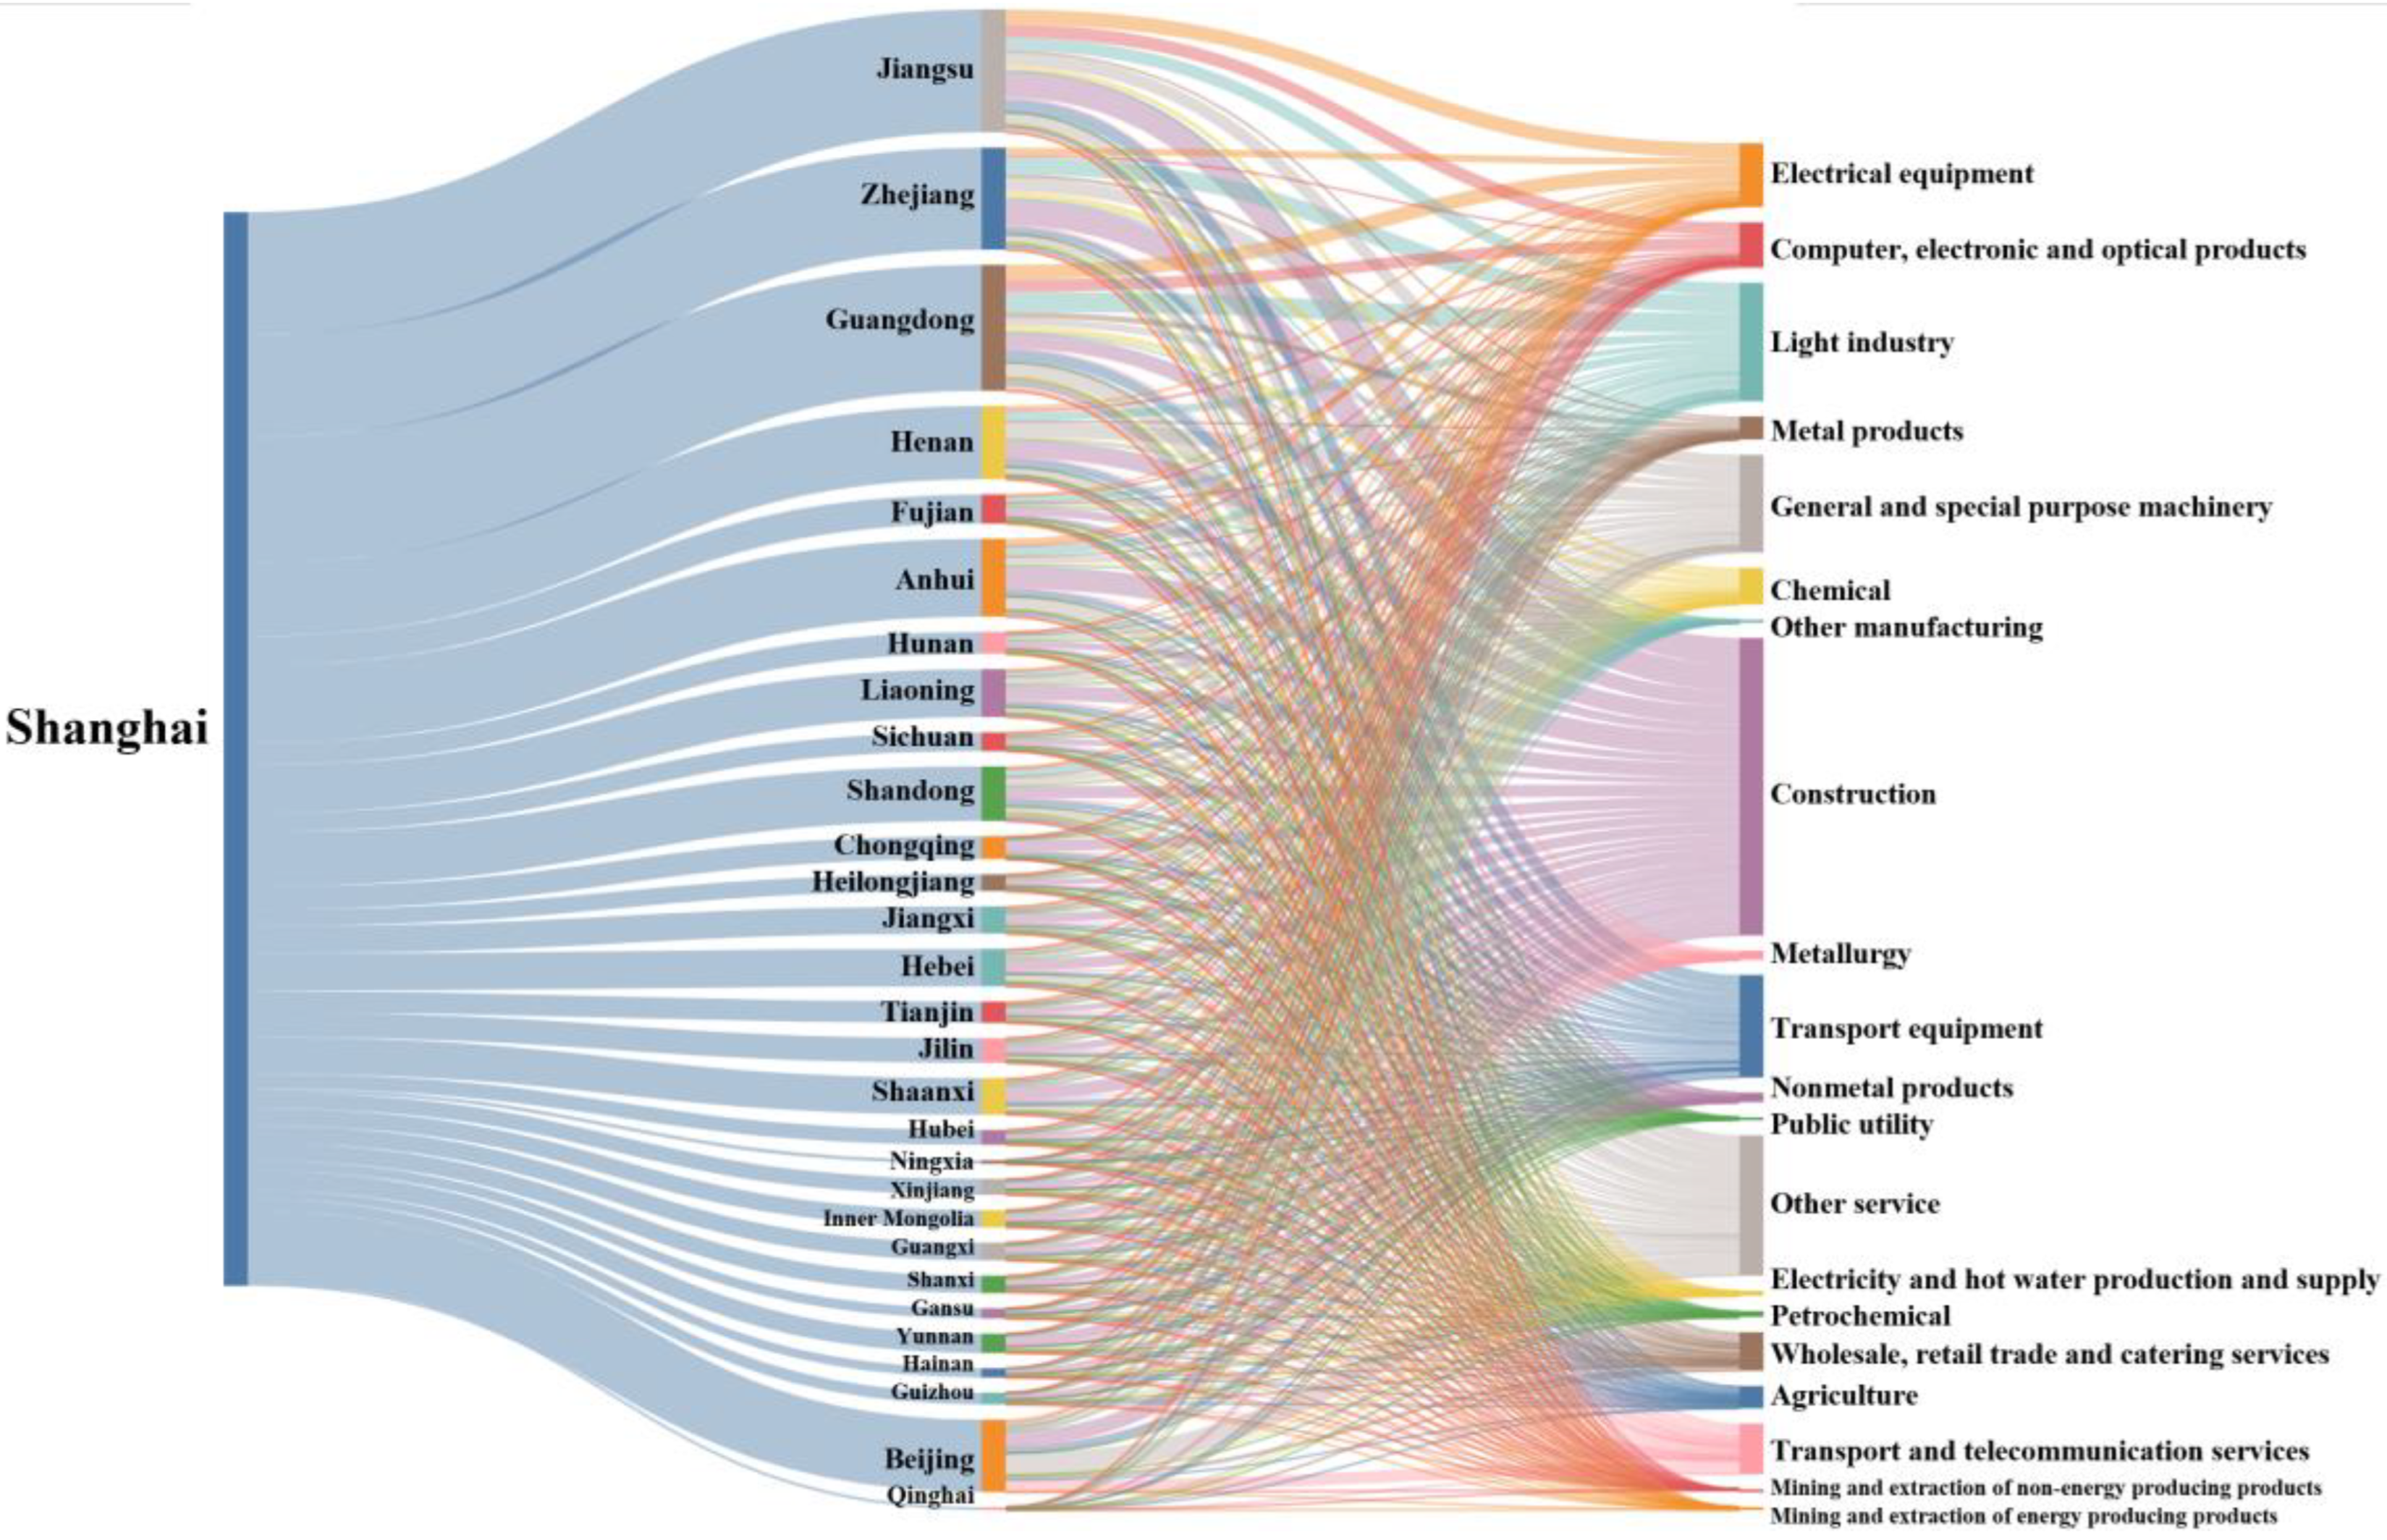
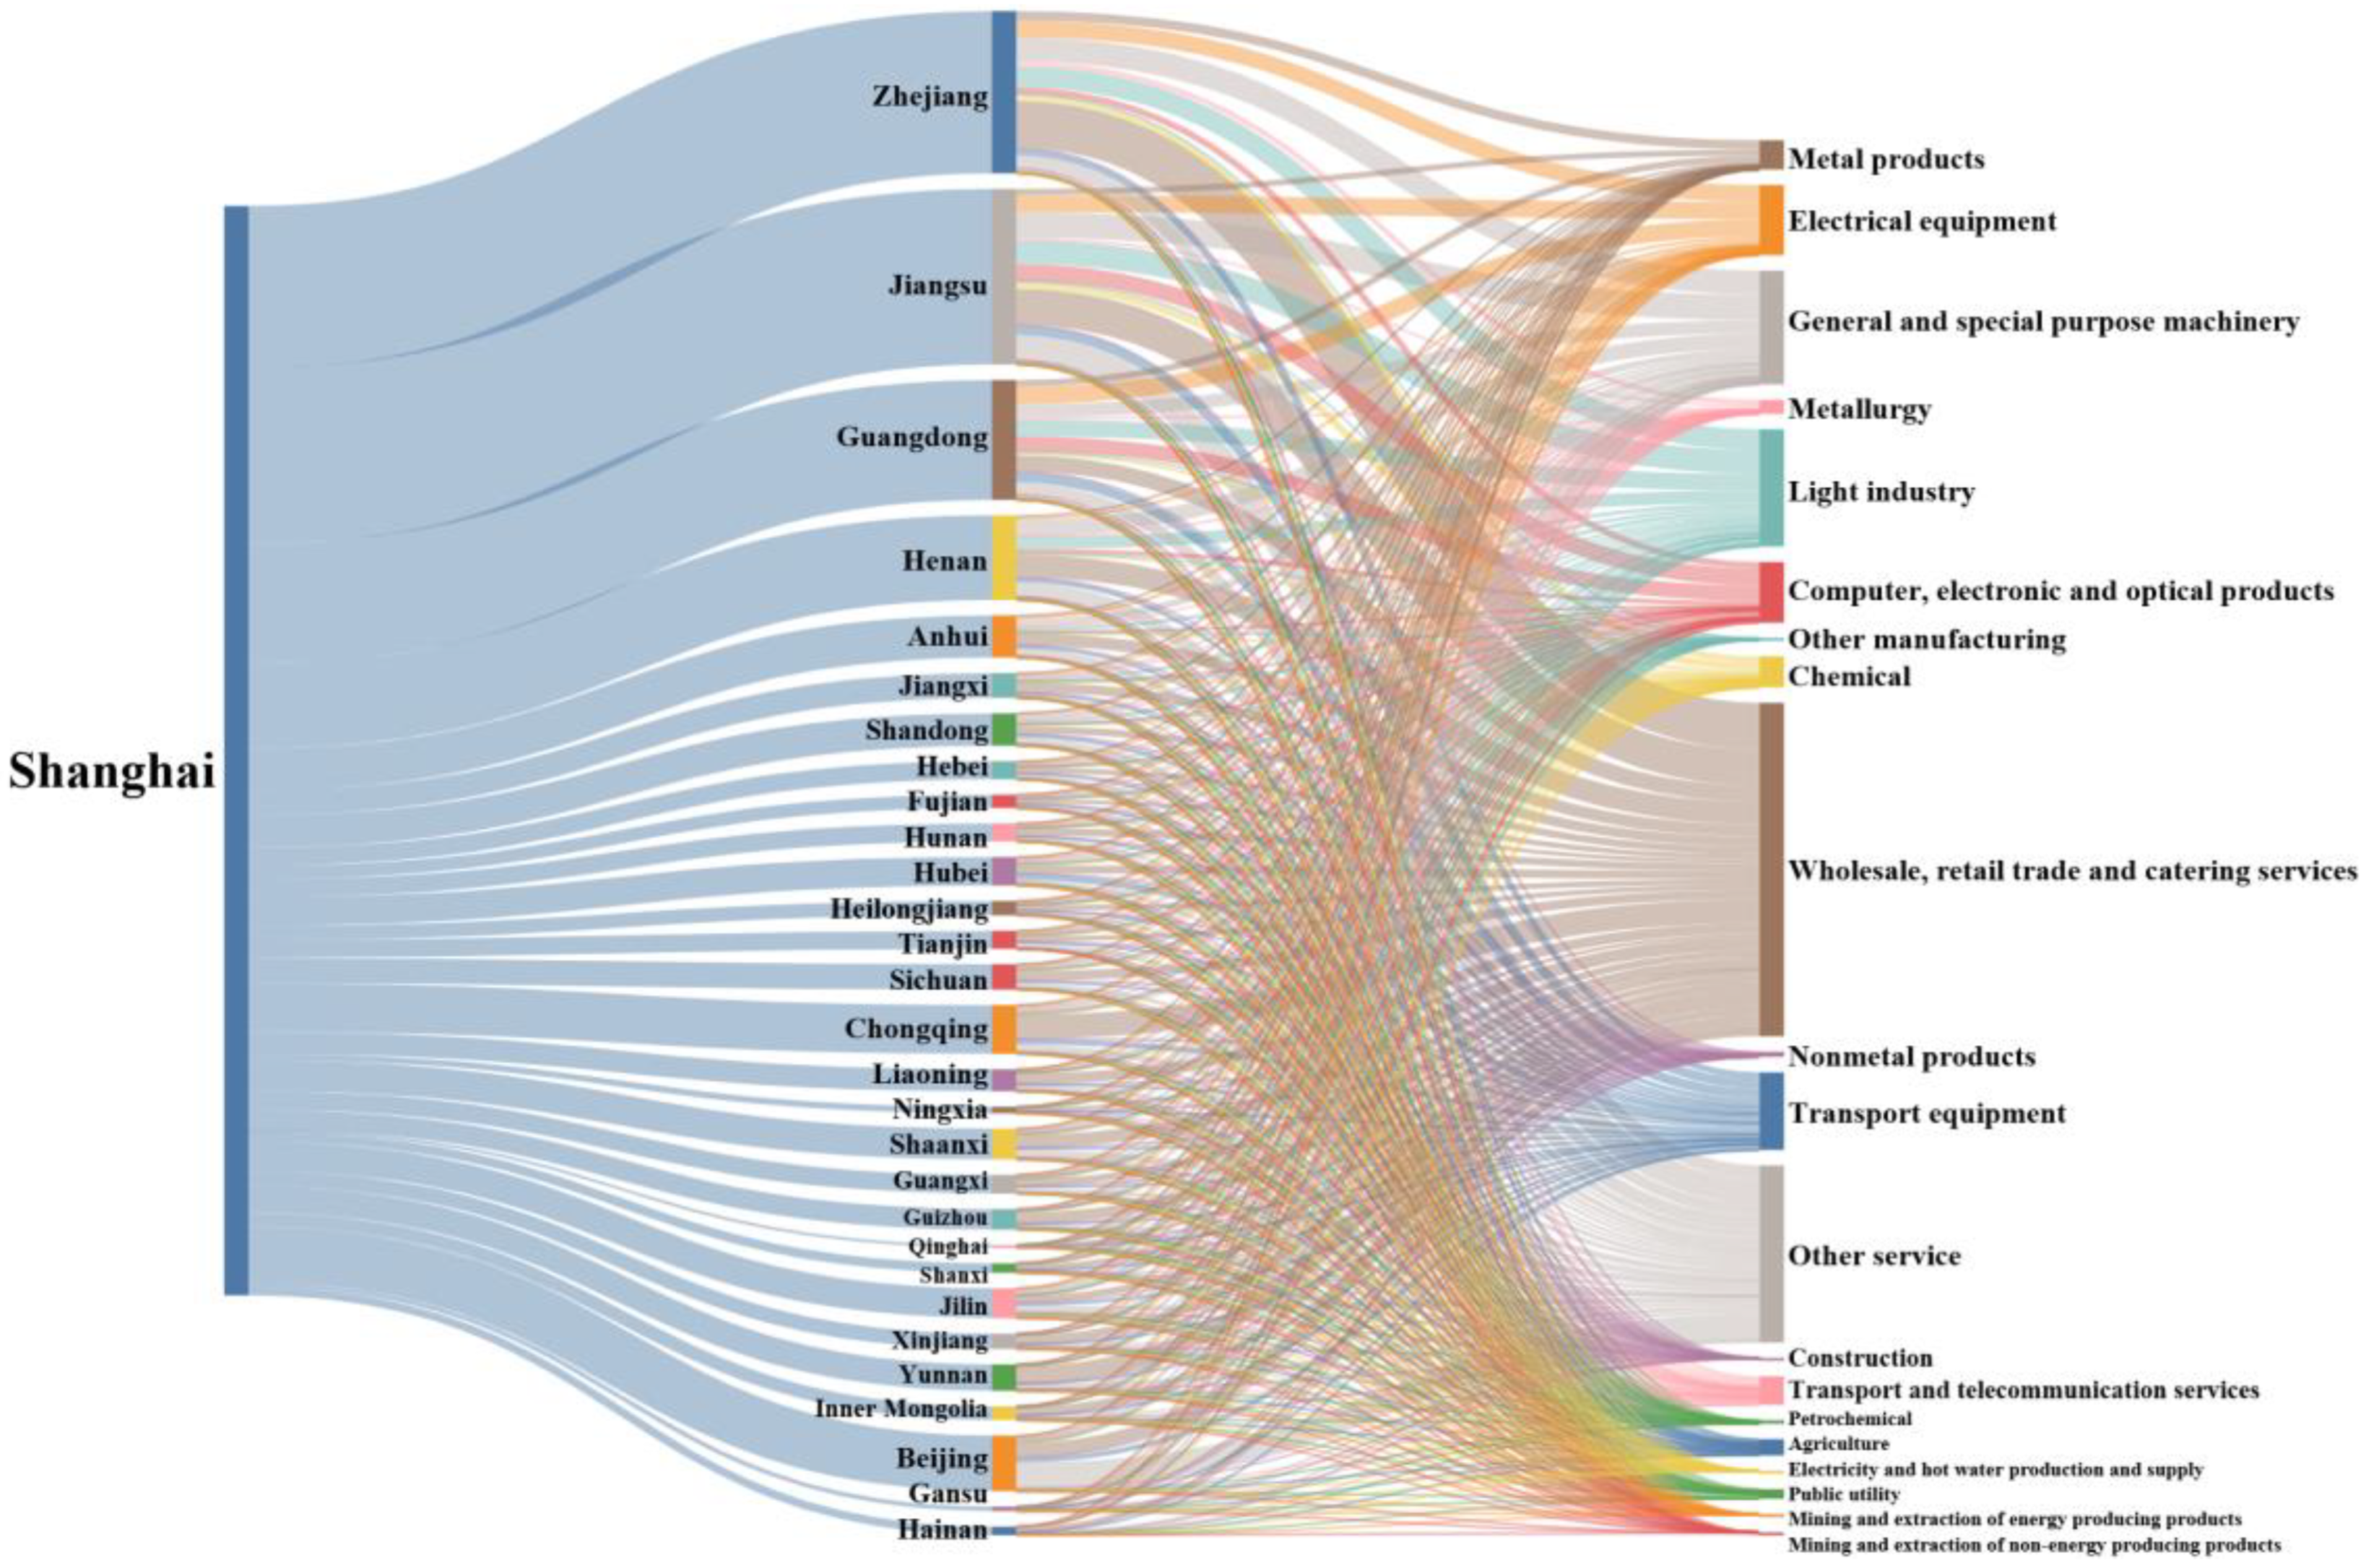
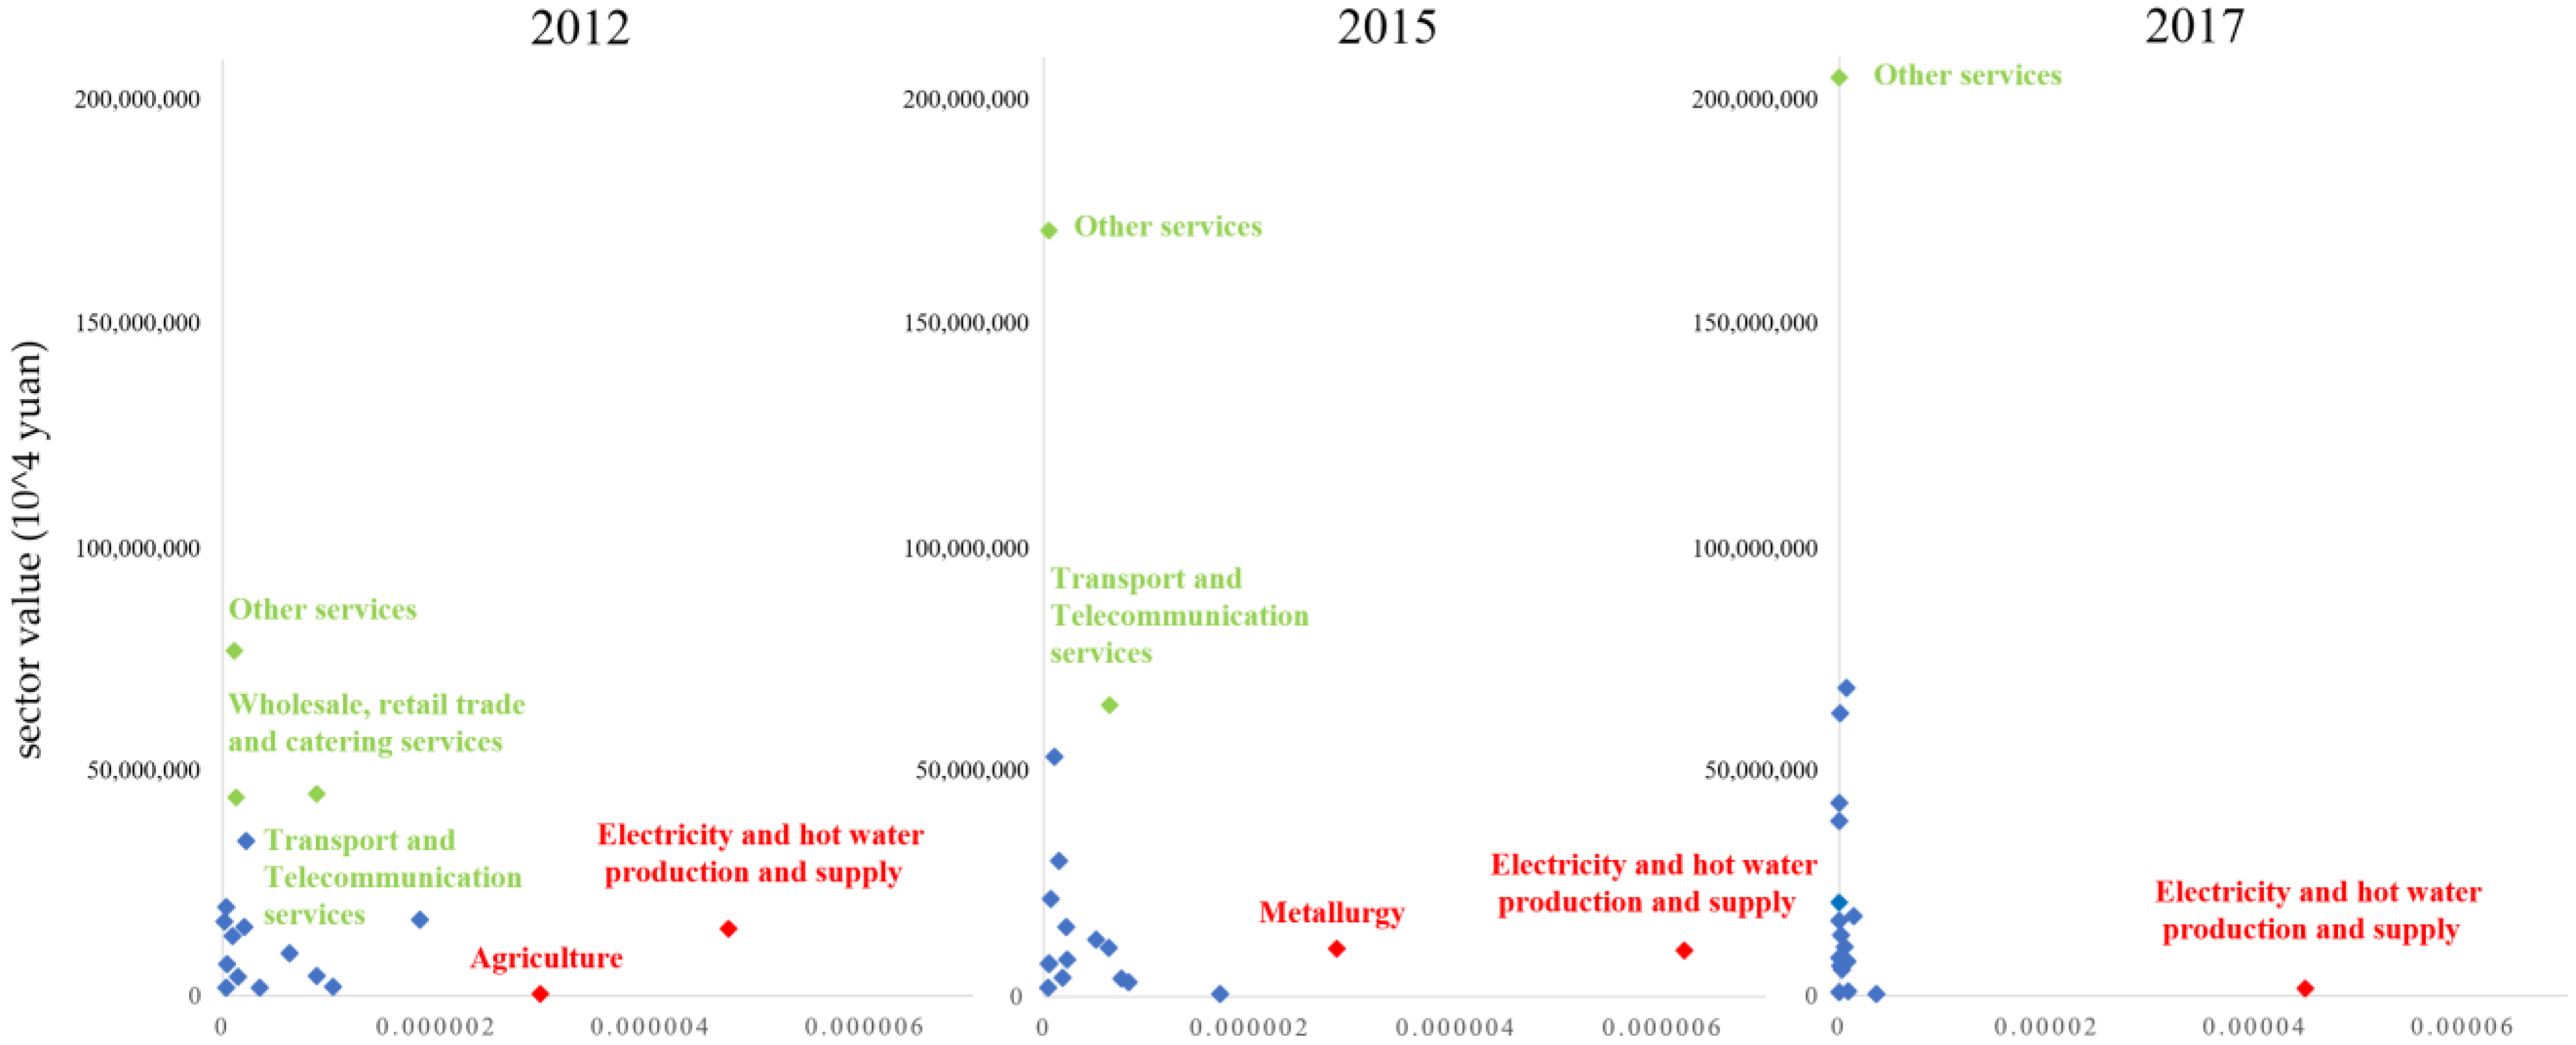
3.1. Changes in Embodied CO2 Emissions

Based on the above methods and data, we calculated the CO2 emissions of 30 provinces in 2012, 2015, and 2017. Our results revealed that in Shanghai, the total amount of embodied carbon emissions on the production side (domestic and external demand emissions) has hardly changed in three years, which were 185.59, 183.65, and 183.11 million tons, respectively. However, the carbon emissions of domestic demand (the embodied carbon produced in Shanghai and eventually flowing into Shanghai) showed a downward trend, from 144.12 million tons in 2012 to 85.39 million tons in 2017. This indicates that Shanghai has achieved specific results in carbon emission reduction, and Shanghai’s energy consumption structure has been adjusted. Shanghai’s external demand emissions (the embodied carbon produced in Shanghai but eventually flowing into other provinces) increased from 41.47 million tons in 2012 to 97.72 million tons in 2017, with an average annual growth of 18.7%, thereby indicating that the embodied carbon flowing from Shanghai to other provinces and cities increased rapidly and that carbon reduction is imperative. In 2012, the external demand-embodied carbon emissions of Shanghai’s production side accounted for 22.3% of Shanghai’s total embodied carbon emissions, increasing to 53.4% in 2017. In contrast to previous perceptions, it can be noted that a considerable part of Shanghai’s carbon emissions is caused by other provinces, and carbon emissions continue to increase.
Figure 1 depicts external demand emissions, and it shows that the embodied carbon inflow in Shanghai experienced an upward trend from 2012 to 2017. Further yearly analysis shows that Jiangsu, Zhejiang, and Guangdong provinces near Shanghai have the largest inflow of embodied carbon, 15.76, 14.56, and 10.76 million tons, respectively, accounting for 42% of the total outflow in 2017. Henan and Anhui, which are closer to Shanghai, and Beijing and Chongqing, which are more economically developed, also have higher embodied carbon inflows than Shanghai. However, the inflow of embodied carbon in Qinghai, Gansu, Ningxia, and other western regions was low for those three years, indicating low trade with Shanghai. Due to a lack of data in CEADS, the embodied carbon flowing into Tibet is vacant, and it is shown as transparent in Figure 1.
According to Figure 2, depicting Shanghai production-side embodied carbon emissions, we can analyze the dimensions of Shanghai’s production-side external demand-embodied carbon emissions flowing into different provinces and, eventually, into sectors. The Sankey diagram shows that, in 2012, the largest amount of embodied carbon flowed into construction, as high as 11.79 million tons. Other services and light industry rank second and third, with 5.42 and 4.58 million tons, respectively. These three sectors accounted for 51.8% of the external demand-embodied carbon emissions on Shanghai’s production side. Mining and the extraction of non-energy- and energy-producing products had the least embodied carbon emission inflow, with only 110,000 tons of carbon emissions. It accounted for 0.3% of the external demand carbon emissions on Shanghai’s production side, indicating that Shanghai is scarce in natural resources. The embodied carbon emission inflows of public utility, other manufacturing, and electricity and hot water production and supply are also considerably small and have not reached 200,000 tons of carbon emissions.
Figure 3 shows that, in 2015, the largest amount of embodied carbon emissions again flowed into construction, up to 18.3 million tons, followed by other services and transport equipment, with 8.86 and 5.73 million tons, respectively. Light industry, with 5.64 million tons, ranks fourth, accounting for 64.8% of the external demand-embodied carbon emissions on Shanghai’s production side. Both the mining and extraction of non-energy and energy products still have the least embodied carbon emissions inflow, with only 100,000 tons of carbon emissions. Compared with petrochemical, electricity and hot water production and supply, public utility, and other manufacturing sectors, the emissions of the four sectors increased in 2015 compared with 2012. However, they did not exceed 300,000 tons.
In 2017, the largest amount of embodied carbon emissions flowed into wholesale, retail trade, and catering services; with 29.91 million tons, other services ranked second with 15.89 million tons, and light industry ranked third (Figure 4). By comprehensively analyzing the situation of the inflow sectors over the three years, we concluded that the embodied carbon emissions flowing into the service sector in other provinces and cities show an increasing yearly trend. However, the embodied carbon emissions in the secondary industry decrease yearly. In particular, the carbon emissions from the construction sector’s production side were only 390,000 tons in 2017, indicating that Shanghai has adjusted its industrial structure, and the proportion from the tertiary industry increased. Although the external demand emissions on the production side in 2017 more than doubled compared to those of 2012, the inflow sector with growth has the highest inflow, and the carbon emission inflow of the secondary industry sector with the lowest inflow is unchanged.
We took the sector value, qi, and the sector emission carbon intensity, ci/qi, as variables to draw a scatter diagram, as shown in Figure 5. The vertical axis represents the sector value, and the horizontal axis represents the sector’s carbon emission intensity. It is clear that there are three characteristic sectors: high production-side value with low embodied carbon intensity, low production-side value with high embodied carbon intensity, and low production-side value with low embodied carbon intensity. In Figure 5, they are indicated in green, red, and blue, with corresponding sector labels. In Shanghai, we identified sectors with high production-side value and low embodied carbon intensity: other services, transport and telecommunication services, wholesale, retail, and catering services. These are mainly concentrated in the service industry, indicating that the service industry brings high benefits with relatively low carbon emissions, which should be vigorously developed. We also identified sectors with low values on the production side and high carbon intensity in the following sectors: electricity and hot water production and supply, agriculture, and metallurgy. Although these sectors have low values because they have high emission intensity, clean energy should be used to reduce carbon emissions. Meanwhile, it can be observed that, from 2012 to 2017, most of the sectors in Shanghai have an obvious trend of contraction to the coordinate origin. This coincides with the downward trend in carbon emissions of domestic demand (the embodied carbon produced in Shanghai and eventually flowing into Shanghai), which indicates that the carbon intensity of the departments in Shanghai is decreasing.

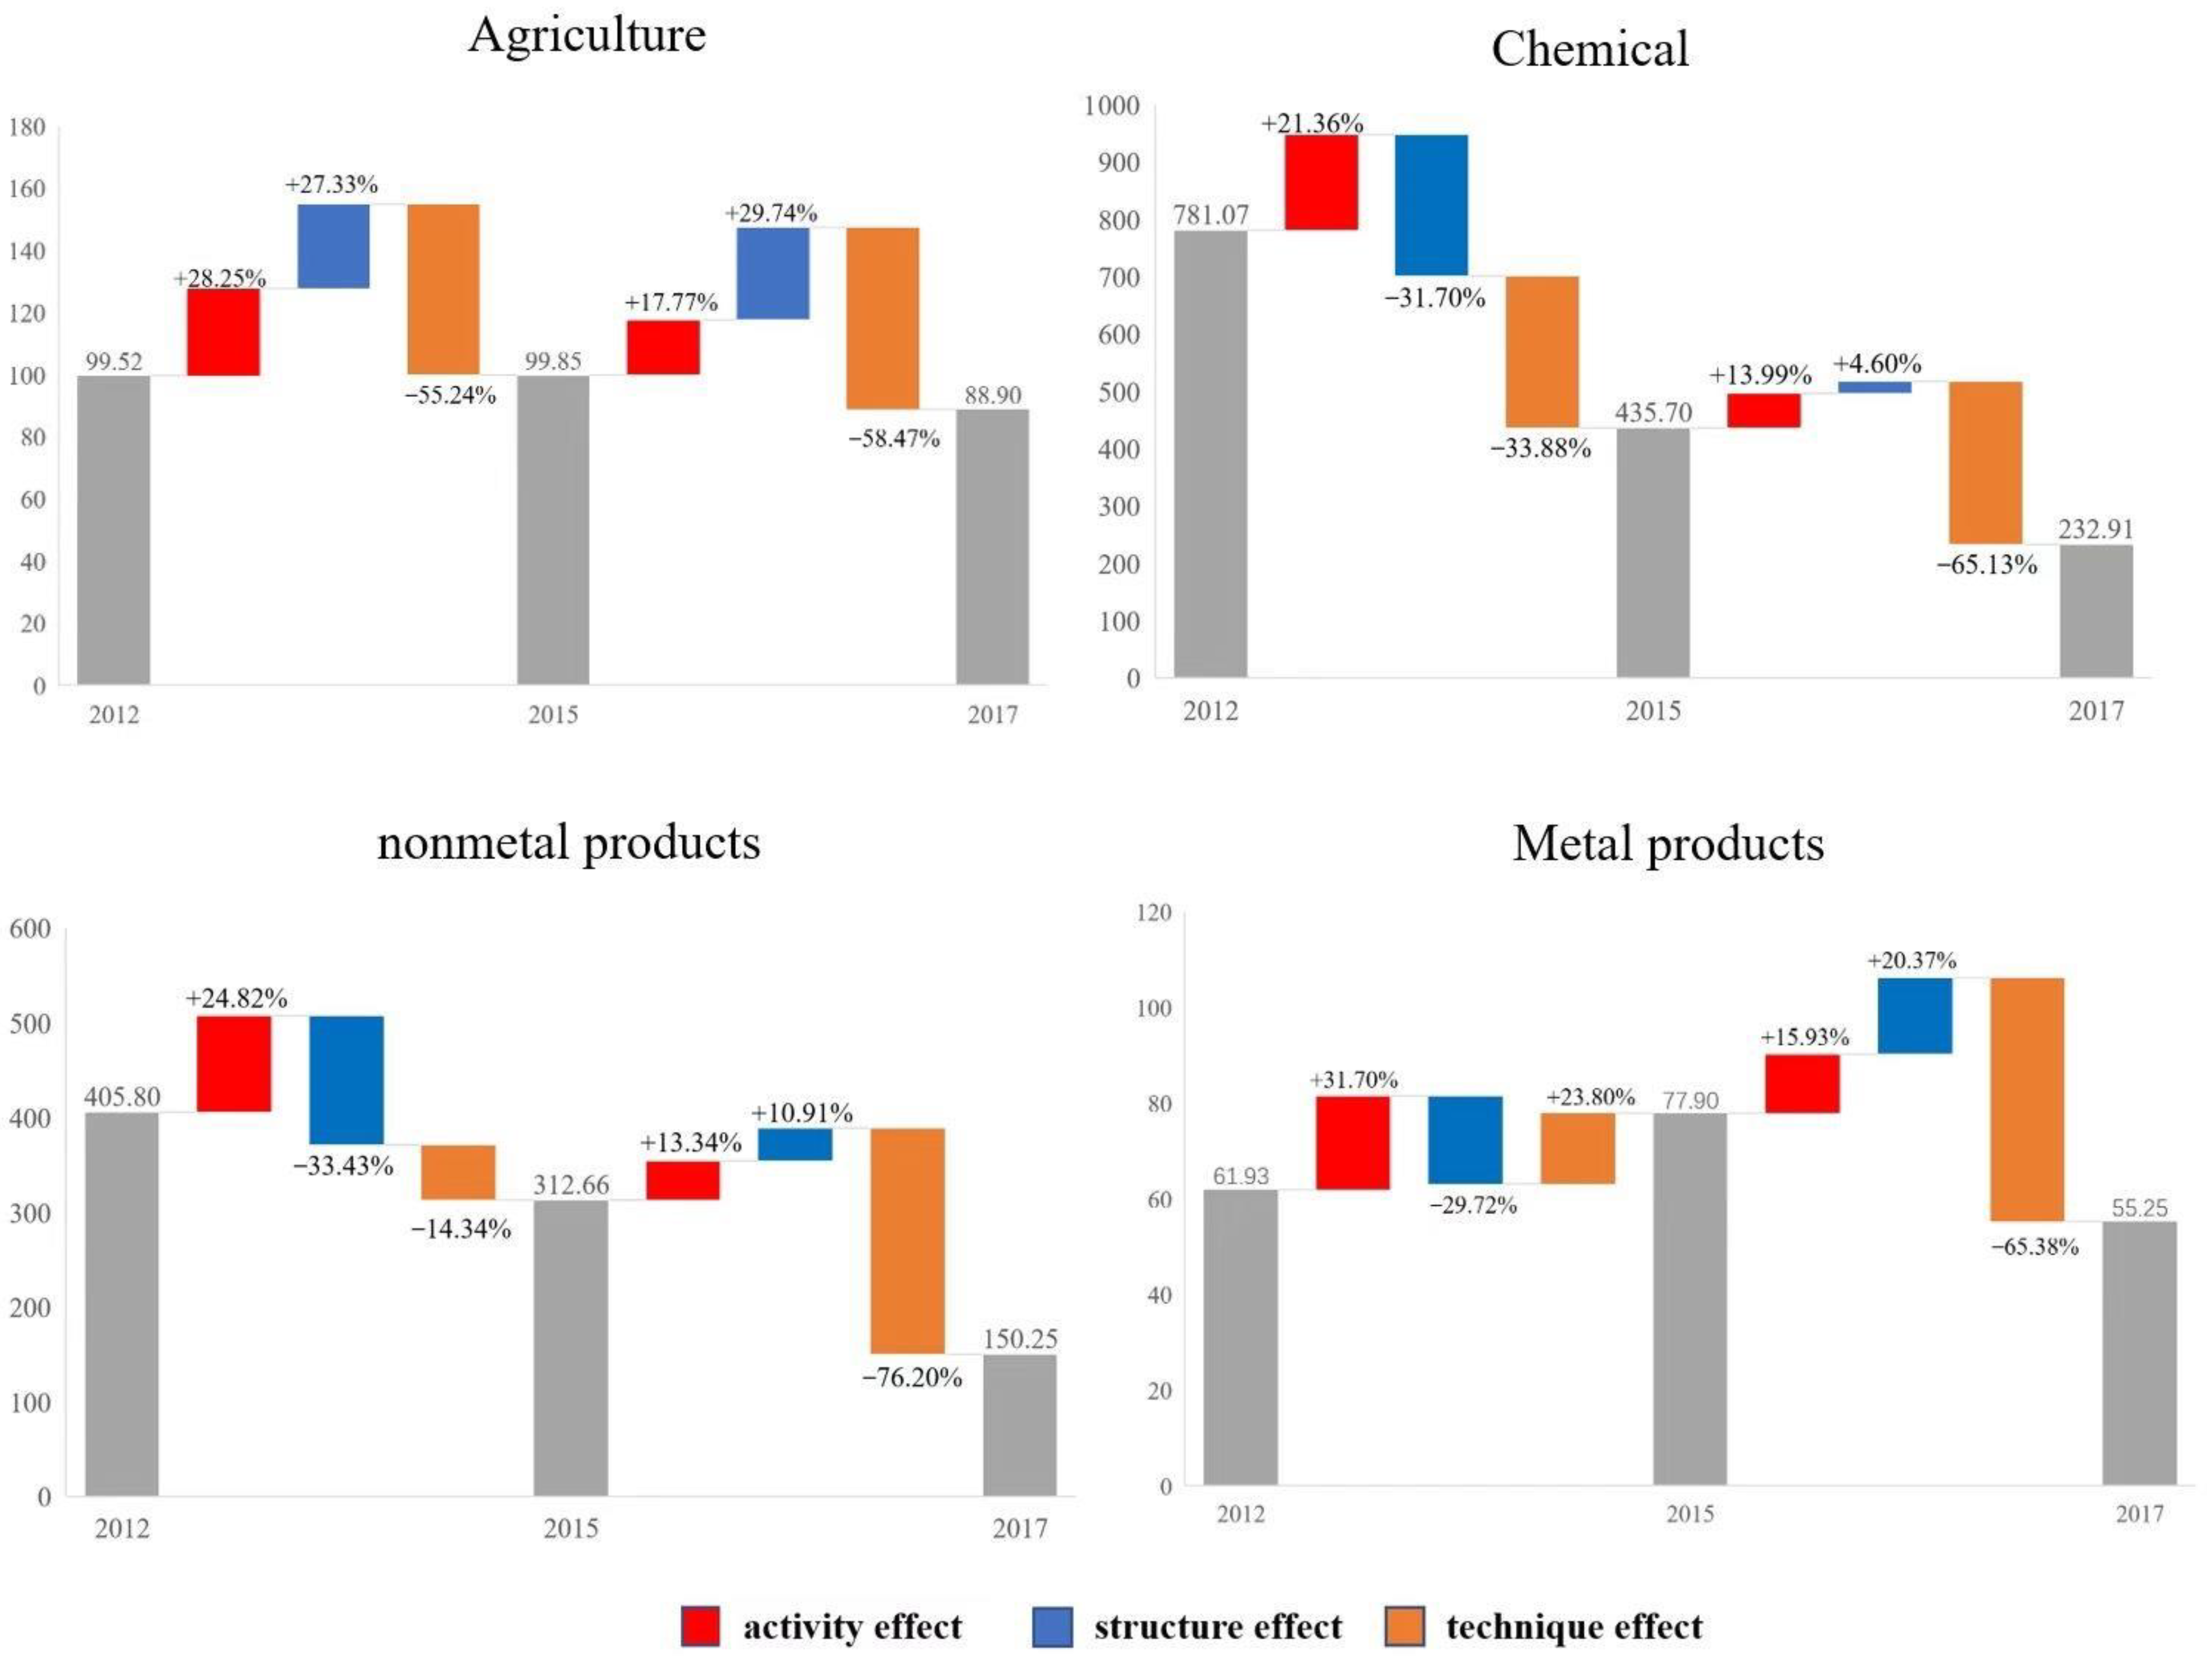
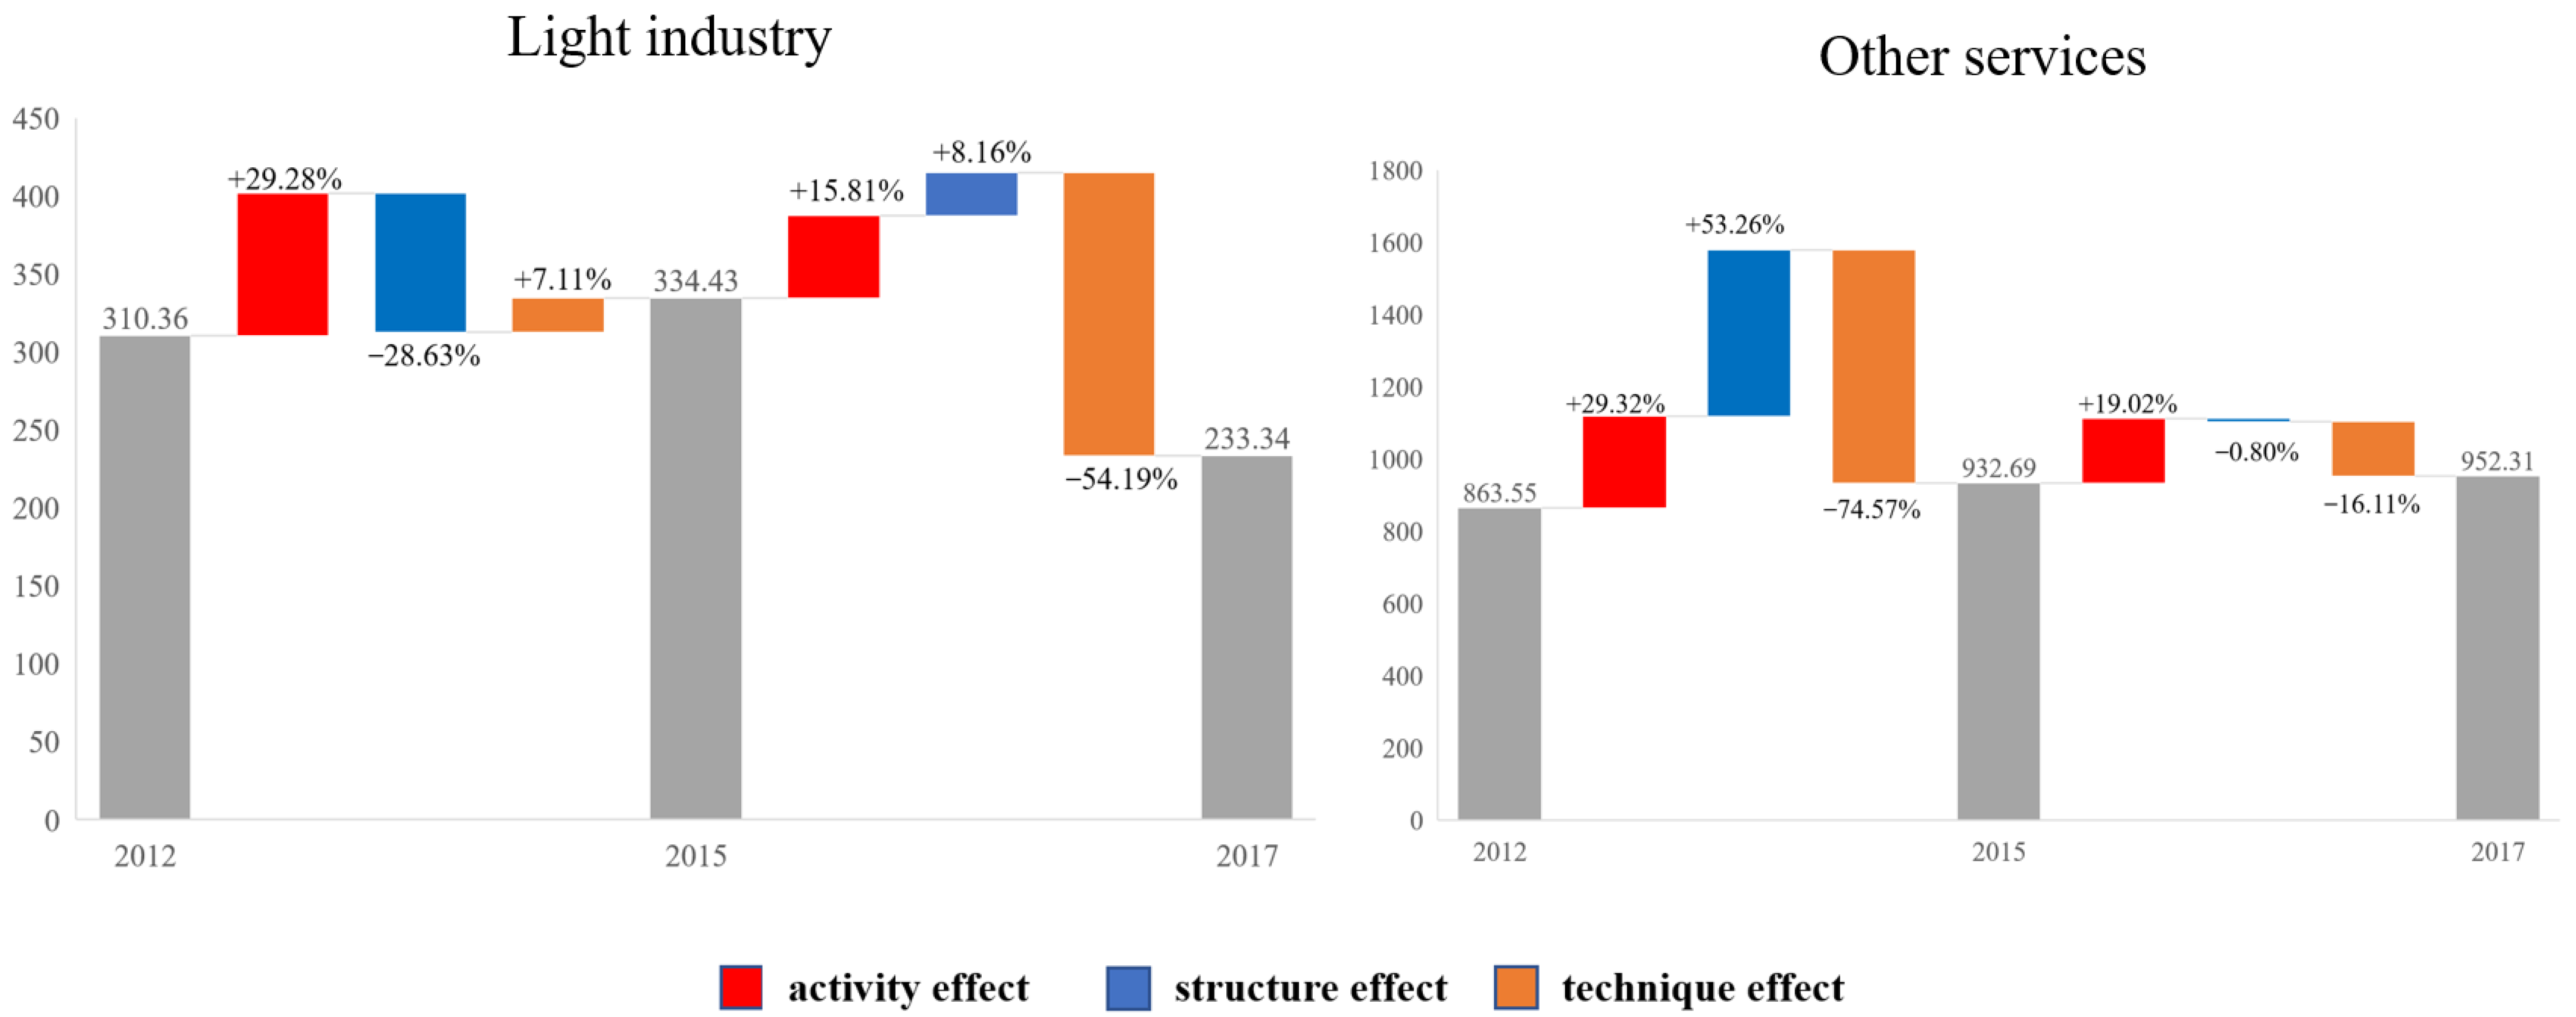
3.2. Driving Forces for Changes in Embodied CO2 Emissions

From an overall view of the effect of carbon emission drivers on the production side of Shanghai, the activity effect is the primary driver of embodied carbon increase, and the technique effect is the primary driver of embodied carbon reduction (Figure 6). From 2012 to 2015, the contribution of the activity effect to the embodied carbon emissions on Shanghai’s production side was 28.05%, increasing carbon emissions by 52.06 million tons; the contribution of the technique effect was −29.10%, reducing carbon emissions by 54.01 million tons. From 2015 to 2017, the contribution of the activity effect to the embodied carbon emissions on Shanghai’s production side was 18.79%, increasing carbon emissions by 34.51 million tons. The contribution of the technique effect to the same was −19.09%, a 35.06-million-ton reduction.
Among these, the sectors with the most apparent activity effects are transport and telecommunication services and wholesale, retail trade, and catering services (Figure 7). Transport and telecommunication services increased by 11.6 million tons of embodied carbon owing to the activity effect in 2012–2015, with a contribution rate of 28.87%, and increased by 8.74 million tons in 2015–2017, with a contribution rate of 20.75%. The carbon emission contribution rates of wholesale, retail trade, and catering services to the increase in the activity effect during 2012–2015 and 2015–2017 were 27.15% and 18.8%, respectively. The analysis shows that Shanghai’s tertiary industry expanded rapidly during 2012–2017, and the growth trend was the best.
The technique effect on agriculture, chemical, and nonmetal products is pronounced (Figure 8). The contribution of the technique effect from agriculture to the reduction in embodied carbon emissions exceeded 50% in 2012–2015 and 2015–2017. The production side’s carbon emissions for the chemical and nonmetal product sectors show a downward trend over the past three years, and the technique effect is the biggest driving factor. The chemical sector reduced emissions by 2.84 million tons during 2015–2017, with a contribution rate of −65.13%, and nonmetal products reduced emissions by 2.38 million tons during 2015–2017, with a contribution rate of −76.2%. The contribution of the technique effect from metal products during 2012–2015 was 23.8%, indicating that this sector’s energy utilization rate and technological level were low during this period. The energy utilization rate and technological level improved during 2015–2017, reducing carbon emissions by 510,000 tons, with a contribution rate of −65.38%.
The structure effect differed for each sector (Figure 9). The structure effect of light industry during 2012–2015 inhibited its embodied carbon emissions, with a contribution of −28.63%, indicating that this sector’s structure was better adjusted during this period. However, the structure effect of light industry during 2015–2017 promoted an increase in carbon emissions, with a contribution rate of 8.16%, and the industrial structure still needs to be adjusted. The structure effect of other services during 2012–2015 was the main driving factor for the increase in carbon emissions, with an increase of 4.6 million tons of carbon emissions and a contribution rate of over 50%. However, during 2015–2017, the industrial structure of this sector was adjusted and the promotion effect on carbon emissions was inhibited.

4. Conclusions

This study explored the carbon emissions caused by other provinces in Shanghai and analyzed the driving factors of embodied carbon emissions on Shanghai’s production side. It comprehensively employed the multi-regional input–output model and the LMDI decomposition method to conduct in-depth, layer-by-layer research. The main conclusions of this study are as follows:
From 2012 to 2017, against the background of increasingly close trade links between Chinese provinces and the increasing trade-embodied carbon emissions, the external demand-embodied carbon emissions on the production side of Shanghai continued to increase. The main destinations of Shanghai’s carbon emission outflow were the surrounding provinces (Jiangsu, Zhejiang, and Guangdong) and economically developed provinces and cities (Beijing and Chongqing). The increasingly close trade relationship between these provinces and cities led to a rapid increase in Shanghai’s embodied carbon. The western region (Qinghai, Gansu, and Ningxia) has always had the least embodied carbon inflow and has low trade with Shanghai.
Construction, other services, and light industry were the main inflow sectors of Shanghai’s production-side embodied carbon from 2012 to 2015. Following the industrial structure adjustment, the tertiary industry gradually became the pillar sector of Shanghai’s industry. In contrast, other services; wholesale, retail trade, and catering services; and light industry became the main inflow sectors of Shanghai’s production-side embodied carbon in 2017. Other services; transport and telecommunication services; and wholesale, retail trade, and catering services have high value and low embodied carbon intensity. Shanghai should continue to vigorously develop these; electricity and hot water production and supply, agriculture, and metallurgy are highly valued but have high embodied carbon intensity. Thus, they should become the critical sectors of carbon reduction.
The activity effect was the main driving factor behind the increase in embodied carbon on Shanghai’s production side from 2012 to 2017 and the technique effect was the main driving factor for the decrease in embodied carbon on the production side during this period. The structure effect differed for each sector. The low efficiency of the energy utilization of metal products and the unreasonable structure of other services increased embodied carbon emissions from 2012 to 2015. By improving the technology level and consumption structure, these two sectors significantly reduced carbon emissions through the technique and structure effects from 2015 to 2017. Therefore, while pursuing the development of various industries, Shanghai should choose low-carbon production methods, introduce low-carbon and high-value-added enterprises to meet its needs, strive to adjust its industrial structure, improve the production technology level, and improve energy efficiency.
Based on the above conclusions, this study proposes the following policy recommendations:
Avoid falling into developing countries’ “low-carbon trap.” The “low carbon trap” phenomenon stems from the carbon barrier introduced by developed Western countries based on global warming. As the proponents of low-carbon economies, developed countries, with their technological and financial advantages, may transform nominal cooperation into substantive restrictions, and the standard of a low-carbon economy will become a “trap” for developing countries’ development, to a certain extent. Presently, Shanghai has many problems, including significant carbon emissions, a low utilization rate, unreasonable energy supply, and industrial structure. However, we should not “give up eating because of choking” and vigorously develop low-carbon industries. A low-carbon industry is a key support for changing the economic development mode, reducing industrial carbon emission intensity, improving economic development quality, and achieving national low-carbon development. At the same time, Shanghai should also adapt to the trend of the times, accelerating energy conservation, emission reduction, and low-carbon transformation. It needs a strategic and long-term development vision and action in the face of resource and energy bottlenecks and serious environmental pollution.
We should eliminate backward energy-use equipment, promote industrial upgrading and technological progress, and improve energy efficiency. The above analysis results show that, during the study period, the external demand carbon emissions on Shanghai’s production side showed an upward trend, and Shanghai’s energy utilization efficiency was low, especially in electricity and hot water production and supply, agriculture, and metallurgy. The energy intensity was low, and the total carbon emissions were high. Thus, the technique effect has great potential for achieving the carbon emission reduction goal; it is also the most effective method. Shanghai should address the government’s leading role and formulate energy consumption standards. Shanghai should also encourage relevant enterprises in various industrial sectors (especially those in electricity and hot water production and supply) to innovate backward equipment and subsidize the enterprises’ research and technology development funds. This will encourage enterprises to improve energy efficiency permanently.
Shanghai should optimize its industrial structure and continue promoting tertiary industries’ development. In Shanghai’s industrial structure, the primary industries at present are secondary and tertiary. Secondary industries have a high carbon emission intensity and high energy consumption compared with tertiary industries. Shanghai needs to develop the tertiary industry with low carbon emission intensity vigorously and continue to reduce the proportion of the secondary industry in the Shanghai economic system. Moreover, as a national low-carbon city pilot, Shanghai should introduce low-carbon industries with high added value throughout the country. The energy technology level should be improved for low-value-added industries, such as nonmetal products, metallurgy, and electricity and hot water production and supply. Relevant enterprises with seriously backward technical equipment and enterprise development should be eliminated to lay a foundation for the direction and effectiveness of national emission reduction work.

Author Contributions

Conceptualization, H.W.; Data curation, H.W. and Y.W.; Methodology, H.W., M.L. and Y.W.; Resources, P.C., M.G., J.W. and K.S.; Software, S.C.; Writing—original draft, Y.W.; Writing—review & editing, Y.W. All authors have read and agreed to the published version of the manuscript.

Funding

This research was funded by “Analysis of Regional Embodied Carbon Flows and Net-zero Emission Scenarios for Shanghai Power Grid”, which is Technology and Service Project of Shanghai Economic and Technological Research Institute, State Grid Corporation of China. Grant number: SGSHJY00ZNJS2100265.

Institutional Review Board Statement

Not applicable.

Informed Consent Statement

Not applicable.

Data Availability Statement

Not applicable.

Conflicts of Interest

The authors declare no conflict of interest.

Nomenclature

GHGGreenhouse gas
CO2Carbon dioxide
LAPsLocal air pollutants
MRIOMulti-regional input–output
SRIOSingle region input–output
EIAEnvironmental impact assessment
IOAInput–output analysis
LMDILogarithmic mean Divisia index
IDAIndex decomposition analysis
SDAStructural decomposition analysis
CEADsCarbon emission accounts and datasets

Appendix A

Table A1. Input and output table.
Intermediate UseFinal DemandFinal
Use
Region 1Region mRegion 1Region m
Sector 1Sector nSector 1Sector n
Intermediate
input
Region 1Sector 1
Z 11 Z 1 m Y 11 Y 1 m X 1
Sector n
Region mSector 1
Z m 1 Z m m Y m 1 Y m m X m
Sector n
Added value V 1 V m
Total input X 1 X m
Note: Z m m represents the flow volume and direction of products between departments; Y m m represents the final product; X m represents total output; V 1 represents the initial input, also known as added value; X 1 represents that the total input is equal to the total output; “…” represents the elements of the matrix which are omitted from the numbering.
Table A2. Setting of sectors.
Sector in This StudyThe Serial NumberSector in the MRIO Table of CEADS Data
Agriculture01Agriculture
Mining and extraction of energy-producing products02Coal mining
03Extraction of Petroleum and Natural Gas
Mining and extraction of non-energy-producing products04Metal mining
05Nonmetal mining
Light industry06Food processing and tobaccos
07Textile
08Clothing, leather, fur, etc.
09Wood processing and furnishing
10Papermaking, printing, stationery, etc.
Petrochemical11Petroleum refining, coking, etc.
Chemical12Chemical industry
Nonmetal products13Nonmetal products
Metallurgy14Metallurgy
Metal products15Metal products
General and special purpose machinery16General machinery
17Specialist machinery
Transport equipment18Transport equipment
Electrical equipment19Electrical equipment
Computer, electronic, and optical products20Electronic equipment
21Instrument and meter
Other manufacturing22Other manufacturing
24Repair service for metal products, machinery, and equipment
Public utility23Waster and flotsam
26Gas production and supply
27Water production and supply
Electricity and hot water production and supply25Electricity and hot water production and supply
Construction28Construction
Wholesale, retail trade, and catering services29Wholesale and retailing
31Hotel and restaurant
Transport and telecommunication services30Transport and storage
32Information transfer and software
Other services33Finances
34Real estate trade
35Leasing and commercial services
36Scientific research
37Management of water conservancy, environment, and public establishment
38Resident services and other services
39Education
40Health and social work
41Culture, sports, and entertainment
42Public management and social organization

References

  1. Yang, Y.; Qu, S.; Cai, B. Mapping global carbon footprint in China. Nat. Commun. 2020, 11, 2237. [Google Scholar] [CrossRef] [PubMed]
  2. Wassily, L. Quantitative input and output relations in the economic systems of the United States. Rev. Econ. Stat. 1936, 18, 105–125. [Google Scholar]
  3. Zhong, Z.Q.; Jiang, L.J.; Zhao, P. Transnational transfer of carbon emissions embodied in trade: Characteristics and determinants from a spatial perspective. Energy 2018, 147, 858–875. [Google Scholar] [CrossRef]
  4. Wassily, L. Environmental repercussions and the economic structure: An input-output approach. Rev. Econ. Stat. 1970, 52, 262–271. [Google Scholar]
  5. Guo, J.; Zhang, Z.K.; Meng, L. China’s provincial CO2 emissions embodied in international and interprovincial trade. Energy Policy 2012, 42, 486–497. [Google Scholar] [CrossRef]
  6. Zhang, B.; Qiao, H.; Chen, Z.M.; Chen, B. Growth in embodied energy transfers via China’s domestic trade: Evidence from multi-regional input–output analysis. Appl. Energy 2016, 184, 1093–1105. [Google Scholar] [CrossRef]
  7. Su, B.; Ang, B.W. Input-output analysis of CO2 emissions embodied in trade: A multi-region model for China. Appl. Energy 2014, 114, 377–384. [Google Scholar] [CrossRef]
  8. Su, B.; Ang, B.W. Multiplicative structural decomposition analysis of aggregate embodied energy and emission intensities. Energy Econ. 2017, 65, 137–147. [Google Scholar] [CrossRef]
  9. Sun, C.W.; Ding, D.; Yang, M. Estimating the complete CO2 emissions and the carbon intensity in India: From the carbon transfer perspective. Energy Policy 2017, 109, 418–427. [Google Scholar] [CrossRef]
  10. Chen, H.; Wen, J.; Pang, J.; Chen, Z.; Wei, Y.S. Research on inter-provincial carbon transfer and carbon equity in China based on 31-province MRIO model. China Environ. Sci. 2020, 40, 5540–5550. [Google Scholar]
  11. Wang, W.Z.; Hu, Y. The measurement and influencing factors of carbon transfers embodied in inter-provincial trade in China. J. Clean. Prod. 2020, 270, 122460. [Google Scholar] [CrossRef]
  12. Han, M.Y.; Yao, Q.H.; Lao, J.M.; Tang, Z.P.; Liu, W.D. China’s intra-and inter-national carbon emission transfers by province: A nested network perspective. Sci. China Earth Sci. 2020, 63, 852–864. [Google Scholar] [CrossRef]
  13. Wang, X.N.; Zhao, S.H.; Liu, X.Y.; Duan, H.Y.; Song, J.N. Carbon neutral target-oriented carbon emission reduction model for provincial consumption side based on multi-regional input-output model. Ecol. Econ. 2021, 37, 43–50. [Google Scholar]
  14. Liu, H.G.; Zhang, Z.M.; Guo, J. Study on the embodied carbon emission transfer in China’s inter-regional value chain. Manag. Rev. 2021, 33, 58–64. [Google Scholar]
  15. Qian, Z.Q.; Yang, L.K. The impact of East Asia vertical specialization on China’s embodied carbon emissions: An inter-temporal MRIO-SDA analysis. Resour. Sci. 2016, 38, 113–119. [Google Scholar]
  16. Jiang, H. Measurement and comparison of implied carbon in foreign trade of BRICS countries—An empirical analysis based on input-output model and structural decomposition. Resour. Sci. 2016, 38, 2326–2337. [Google Scholar]
  17. Guo, C.X. Decomposition of carbon emission factors in China: Based on LMDI decomposition technique. Resourc. Environ. 2010, 20, 4–9. [Google Scholar]
  18. Du, Y.S.; Sun, H.H. Analysis of implied carbon emission growth factors of China’s export trade: Based on LMDI. World Econ. Res. 2012, 11, 44–49. [Google Scholar]
  19. Huang, H.P.; Yi, M.T.; Cao, J.W.; Zou, Y.F.; Huang, X.M. Spatial and temporal variation of implied carbon emissions of regional trade and its influence effect: The Yangtze River Economic Belt as an example. Econ. Geogr. 2021, 41, 49–57. [Google Scholar]
  20. Zhang, W.; Zhou, Y.Y. Study on the decomposition of CO2 increment of energy consumption emission in Beijing: Analysis of LMDI technique based on IDA method. Adv. Geogr. Sci. 2013, 32, 514–521. [Google Scholar]
  21. Wu, R.; Geng, Y.; Dong, H.J. Changes of CO2 emissions embodied in China-Japan trade: Drivers and implications. J. Clean. Prod. 2016, 112, 4151–4158. [Google Scholar] [CrossRef]
  22. Ang, B.W.; Zhang, F.; Choi, K. Factorizing changes in energy and environmental indicators through decomposition. Energy 1998, 23, 489–495. [Google Scholar] [CrossRef]
  23. Ang, B.W. Decomposition analysis for policymaking in energy: Which is the preferred method? Fuel Energy Abstr. 2004, 45, 365–366. [Google Scholar]
Figure 1. Flow chart of external demand emissions in Shanghai (Mt CO2).
Sustainability 14 11109 g001
Figure 2. Shanghai production-side embodied carbon emissions in 2012.
Sustainability 14 11109 g002
Figure 3. Shanghai production-side embodied carbon emissions in 2015.
Sustainability 14 11109 g003
Figure 4. Shanghai production-side embodied carbon emissions in 2017.
Sustainability 14 11109 g004
Figure 5. Relationship between sector value and the sector’s carbon emission intensity.
Sustainability 14 11109 g005
Figure 6. Drivers on the production side of Shanghai.
Sustainability 14 11109 g006
Figure 7. Sectors with an obvious activity effect.
Sustainability 14 11109 g007
Figure 8. Sectors with an obvious technique effect.
Sustainability 14 11109 g008
Figure 9. Sectors with an obvious structure effect.
Sustainability 14 11109 g009
Publisher’s Note: MDPI stays neutral with regard to jurisdictional claims in published maps and institutional affiliations.

