Article

Historical Trends Associated with Annual Temperature and Precipitation in Aegean Turkey, Where Are We Heading?

by
Denizhan Mersin
1,2,
Gokmen Tayfur
2,
Babak Vaheddoost
3 and
Mir Jafar Sadegh Safari
4,*
1
Department of Civil Engineering, Firat University, 23200 Elazig, Turkey
2
Department of Civil Engineering, Izmir Institute of Technology, 35430 Izmir, Turkey
3
Department of Civil Engineering, Bursa Technical University, 16350 Bursa, Turkey
4
Department of Civil Engineering, Yasar University, 35100 Izmir, Turkey
*
Author to whom correspondence should be addressed.
Sustainability 2022, 14(20), 13380; https://doi.org/10.3390/su142013380
Submission received: 22 August 2022 / Revised: 10 October 2022 / Accepted: 12 October 2022 / Published: 17 October 2022

Abstract

:
The trend analysis of annual temperature (daily average) and total precipitation has been conducted for 14 stations located in the Aegean Region, Turkey. The Sen, Spearman’s rho, and Mann-Kendall test methods are used in the detection of the historical trends in the region. The Pettitt test is also implemented to find the significance of the trend, while the Theil-Sen approach is applied to detect the change point(s) in the time series. Findings of the following study indicate that both precipitation and temperature time series in the selected stations depict statistically significant trends with increasing nature. The rate of increase in precipitation and temperature by the Theil-Sen test is found to be 4.2–7.9 mm/year and 0.20–0.35 °C/decade, respectively. It is also found that the turn points of the temperature trends determined by the Pettitt test occurred in 1998 for all the stations. According to the results, the magnitude of the extreme events would change in the future, which may help in conceptualizing the framework and the resilience of the infrastructures against climate change.

1. Introduction

In recent years, one of the most challenging subjects is the climate change issue. To this end, the changes in the microclimate affect the behavior between the frequency and the significant of the climatic change and also accelerate the extreme outcomes. Yet, the majority of the studies performed on the impact of climate change focused on the changes in the trends of hydrological variables (e.g., temperature and rainfall). Evidence in the temperature data records and changes in the rainfall patterns over the past year has been demonstrated by many studies. Lettenmaier et al. [1] determined the hydro-climatological trends during the 1948–1988 period in the continental United States and found out that the trend in the air temperature was increased. Similarly, Jones et al. [2] investigated the variations in the air temperature for 150 years and found out that the global temperature was increased by 0.32° during the 1978–1997 period. When analyzing rainfall data from several nations to identify the patterns, New et al. [3] came to the conclusion that the 20th century experienced an increase in daily rainfall rates. Kwarteng et al. [4] assessed the trends correlated with the 27 years of rainfall records in Oman and found reasonable results which were consistent with those of previous studies. Fathian et al. [5] evaluated the trends associated with the hydrological and climatological components at Lake Urmia basin in Iran. It was concluded that the channel flow is too sensitive against temperature rather than rainfall. Van Beusekom et al. [6] concluded that short-term rainfall patterns may also be reasonable in trend analysis. To this end, previous studies assumed that tracking rainfall trends in short-recorded data are impossible. However, rapid changes in climate behavior and rainfall patterns recently showed that sometimes decisions cannot be postponed for the next 30 years. Using long-term rainfall records, Chen and Grasby [7] analyzed the meteorological drought trends in Taiwan and discovered an upward tendency in the daily rainfall time series in the research area. Vaheddoost [8] used several methods, such as moving average (MA), linear trend (LT), turn point (TP), Mann-Kendall (MK), Spearman rank order correlation (SROC), innovative trend analysis (ITA), innovative Sen (IS), changes in distribution (CD), and the standardized precipitation index (SPI) to track the trends (less than 30 years) of the Bursa region in Turkey. It was concluded that the MA is the less-reliable method while the combination of CD together with IS, ITA, and SPI yields more realistic results.
The trend tests are classified either as a parametric or non-parametric method. However, it was shown that the non-parametric tests were less effective than the parametric tendency test [9]. The nonparametric MK and SROC tests are also frequently employed to identify patterns in the hydro-meteorological variables [9,10,11,12]. These two tests are employed because they can monotonically (upward or downward) detect patterns in the time series. Partal [13], uses non-parametric techniques (e.g., Mann-Kendall and Sen’s t-tests) to find trends in long-term yearly average and monthly total precipitation records. Precipitations recorded at 96 stations were included in this study, which was scattered across Turkey. For each station from 1929 to 1993, monthly totals and annual averages of monthly totals are produced. The application of the trend detection framework led to the discovery of some significant trends, particularly in the annual averages and precipitation for January, February, and September. The west and south of Turkey as well as the Black Sea shores faced the biggest decline in the annual average precipitation. Similar trends in those individual stations were also detected for regional average values. The study of Karpouzos [14] for trend analysis found a non-significant downward tendency in stations located at lower elevations within the Pieria District’s agricultural zone. During 1987 to 1993, a decrease in precipitation was detected in the entire study area. Analyses of regional precipitation in the Aidon River basin also revealed declining trends that were consistent with the results obtained from the majority of the stations. In both the station-based and the region-based analyses, the spring saw a notable drop in precipitation between the four seasons. However, only one station’s decline was statistically significant at the 95% confidence level. Last but not least, there was no statistically significant step change in precipitation. Sen [15] first introduced the ITA method, which is able to detect the trend of a time series, particularly by means of the low, medium, and high data quantities. This strategy is still effective regardless of the serial correlation structure of time, or non-normal probability distribution functions and sample size. Numerous researchers such as [9,16,17] estimate the absolute values of the slope using the Theil-Sen method introduced by Hirsch [18]. A time series’ change points can also be identified using Pettitt’s [19] technique [20]. Using all of the aforementioned techniques, Yacoub and Tayfur [21] reported an increase in maximum, minimum, and average temperature values between 1970 and 2013 in Mauritania (Trarza area), while the rainfall trends revealed an increase of 2.93 and 3.35 mm/year.
Likewise, the temperature fluctuations in Iran from 1961–2010 were investigated by Ghasemi et al. [22]. It was concluded that the majority of Iran had a dominantly positive temperature trend when the Mann-Kendall test, with change rates ranging from 0.09 to 0.38 °C/decade is used. It was also found that the difference between the minimum and maximum temperature (0.34 °C and 0.15 °C, respectively) increased during the study period. Summer and spring patterns also showed a clearer increasing (warming) trend than winter and the autumn. Results indicated that regions with warm-climate are warming faster than the cold-climate regions. A rapid increase in the mean annual temperature also took place in the late 1990s that is detected by the Pettitt’s test [19]. The historical 102-year (1901–2002) rainfall data of the Sindh River basin (SRB) in India, was examined for seasonal and yearly changes in the study by Gajbhiye et al. [23]. The trend and the size of the changes were determined, respectively, using the Mann-Kendall and Sen’s slope tests. For interpolating the spatial pattern over SRB in a GIS environment, the kriging interpolation was applied. Results showed a tendency of significantly rising seasonal and annual precipitation during a 102-year period. Panda et al. [13] tested the temperature and precipitation data from 1980 to 2017. The tendencies were examined and analyzed using Sen’s slope, the Mann-Kendall, and statistical trend analysis tests. A thorough data review for 37 years revealed that the maximum and the minimum temperatures in the monsoon sea season had a declining tendency, while the annual maximum and minimum temperatures depicted an increasing trend. The maximum temperature trend for the same period showed a slight warming or increasing trend, whereas the minimum temperature indicated a cooling trend. The maximum temperature was slightly significant, whereas the minimum temperature trend analysis result was not statistically significant. Beyene et al. [24] states that their study captured a considerable increase in air temperature for the northwest Himalayas (NWH) during the last century, 1.6 °C, while winters experienced quick warmups. The diurnal temperature range (DTR) has also experienced an upward trend. It was assumed to happen due to the increase in the maximum and the minimum temperatures, while the maximum temperature experienced a quicker rise. Results indicated major warming and cooling cycles in the NWH over the past century, which are consistent with worldwide patterns. In this respect, real temperature rises seem to have initiated in the late 1960s, while the last 20 years have seen the highest pace of increase. The study also demonstrates links between temperatures and the precipitation’s epochal behavior until the late 1960s.
Several studies have also addressed the hydro-meteorological trends of the Aegean region in Turkey. Ciflik [25] investigated the annual rainfall pattern in the Aegean region using the t-test, the Mann-Kendall rank correlation, the non-parametrical Mann-Kendall, the Sen’s trend slope, and the Spearman’s rho tests. Asikoglu et al. [26] also used data records in 47 meteorological stations and reported a decreasing trend in rainfall. Bacanli and Tanrikulu [27] evaluated the evaporation values recorded in 25 stations located in the Aegean region in 1960–2013. They used the Sen and Mann-Kendall tests to conclude that a 12–24% reduction in the evaporation rate occurred while a seasonal trend was found in the time series, which should be evaluated in detail. Topuz [28], using the rainfall data of 29 meteorological stations between 1955 and 2013, claims that there is an increase in rainfall, especially in the autumn seasons. According to Kastridis et al. [14], the Mann-Kendall test and Sen’s slope were calculated to detect potential trends in annual and monthly precipitation and temperature values. Tests showed that there was no significant trend in precipitation (0.05 significance level) in the study area. The same test was applied for each month separately, and the results revealed that there was no significant trend (decrease or increase) in monthly precipitation values. Regarding the trend of average annual temperature values in the study area, it showed a statistically significant increase in temperature over time. More specifically, the annual mean temperature remained stable until 1998 (change point), when a sudden increase in temperature occurred and the temperature continued to rise until 2020. Todaro et al. [29] analyzed past and future changes in precipitation and temperature at five pilot sites in the Mediterranean region. Historical trend analysis for the period of 1976–2005 showed a positive temperature gradient for all considered areas, which is statistically significant in some sites. The highest rate of warming is observed in Turkey; the annual average temperature increased by 0.5 °C/decade. Precipitation observed in the same period showed a positive trend for Turkey, but trends were never significant. Behzadi et al. [30] investigated the impact of climate change on future precipitation and temperature from 2021 to 2050. According to the results, the weighted annual precipitation recorded at rain gauge stations increased in all scenarios except RCP8.5 in the IPSL-CM5A-LR model. While the average weighted precipitation rate of rain gauge stations in winter did not decrease under any climate change conditions, the rainfall amount decreased or increased in other seasons. In the GFDL-ESM2M model, the highest increase in weighted average precipitation in winter with 23 mm was calculated under the RCP2.6 scenario. The highest decrease in weighted average precipitation with 10.5 mm was observed in autumn. There was no temperature drop at the meteorological stations. In the HadGEM2-ES model, the highest increase in weighted average temperature with 3.1 °C and the highest seasonal temperature increase with 8.5 °C were observed in the summer months in the RCP8.5 scenario. According to the standardized precipitation index (SPI), almost 70% of the next 30-year period is dry years, and from 2030 to 2040, drought occurs in almost all scenarios for all basins located in Iran.
A brief literature survey shows that no comprehensive study has been conducted to monitor the hydro-meteorological trend associated with both precipitation and temperature simultaneously in the Aegean region of Turkey. As climate reacts more anomalously nowadays, scientists urge the need for a roadmap and continuous monitoring framework to enhance resilience and reduce the vulnerability of the society against climatic factors. The general objective of this study is to identify the situation of the precipitation and temperature during 1974–2020 in the Aegean region, Turkey. To the best knowledge of the authors, no comprehensive study addressed the presence of trends and turn point events associated with the temperature and precipitation time series and their impact on the planning and design of the water infrastructures in this region during the allocated time period. The application of the several trend and turn point detection tools on a recent set of meteorological data is expected to help decision makers in planning and design of the water infrastructure under climate change and emerging concerns against the extreme climatic events.

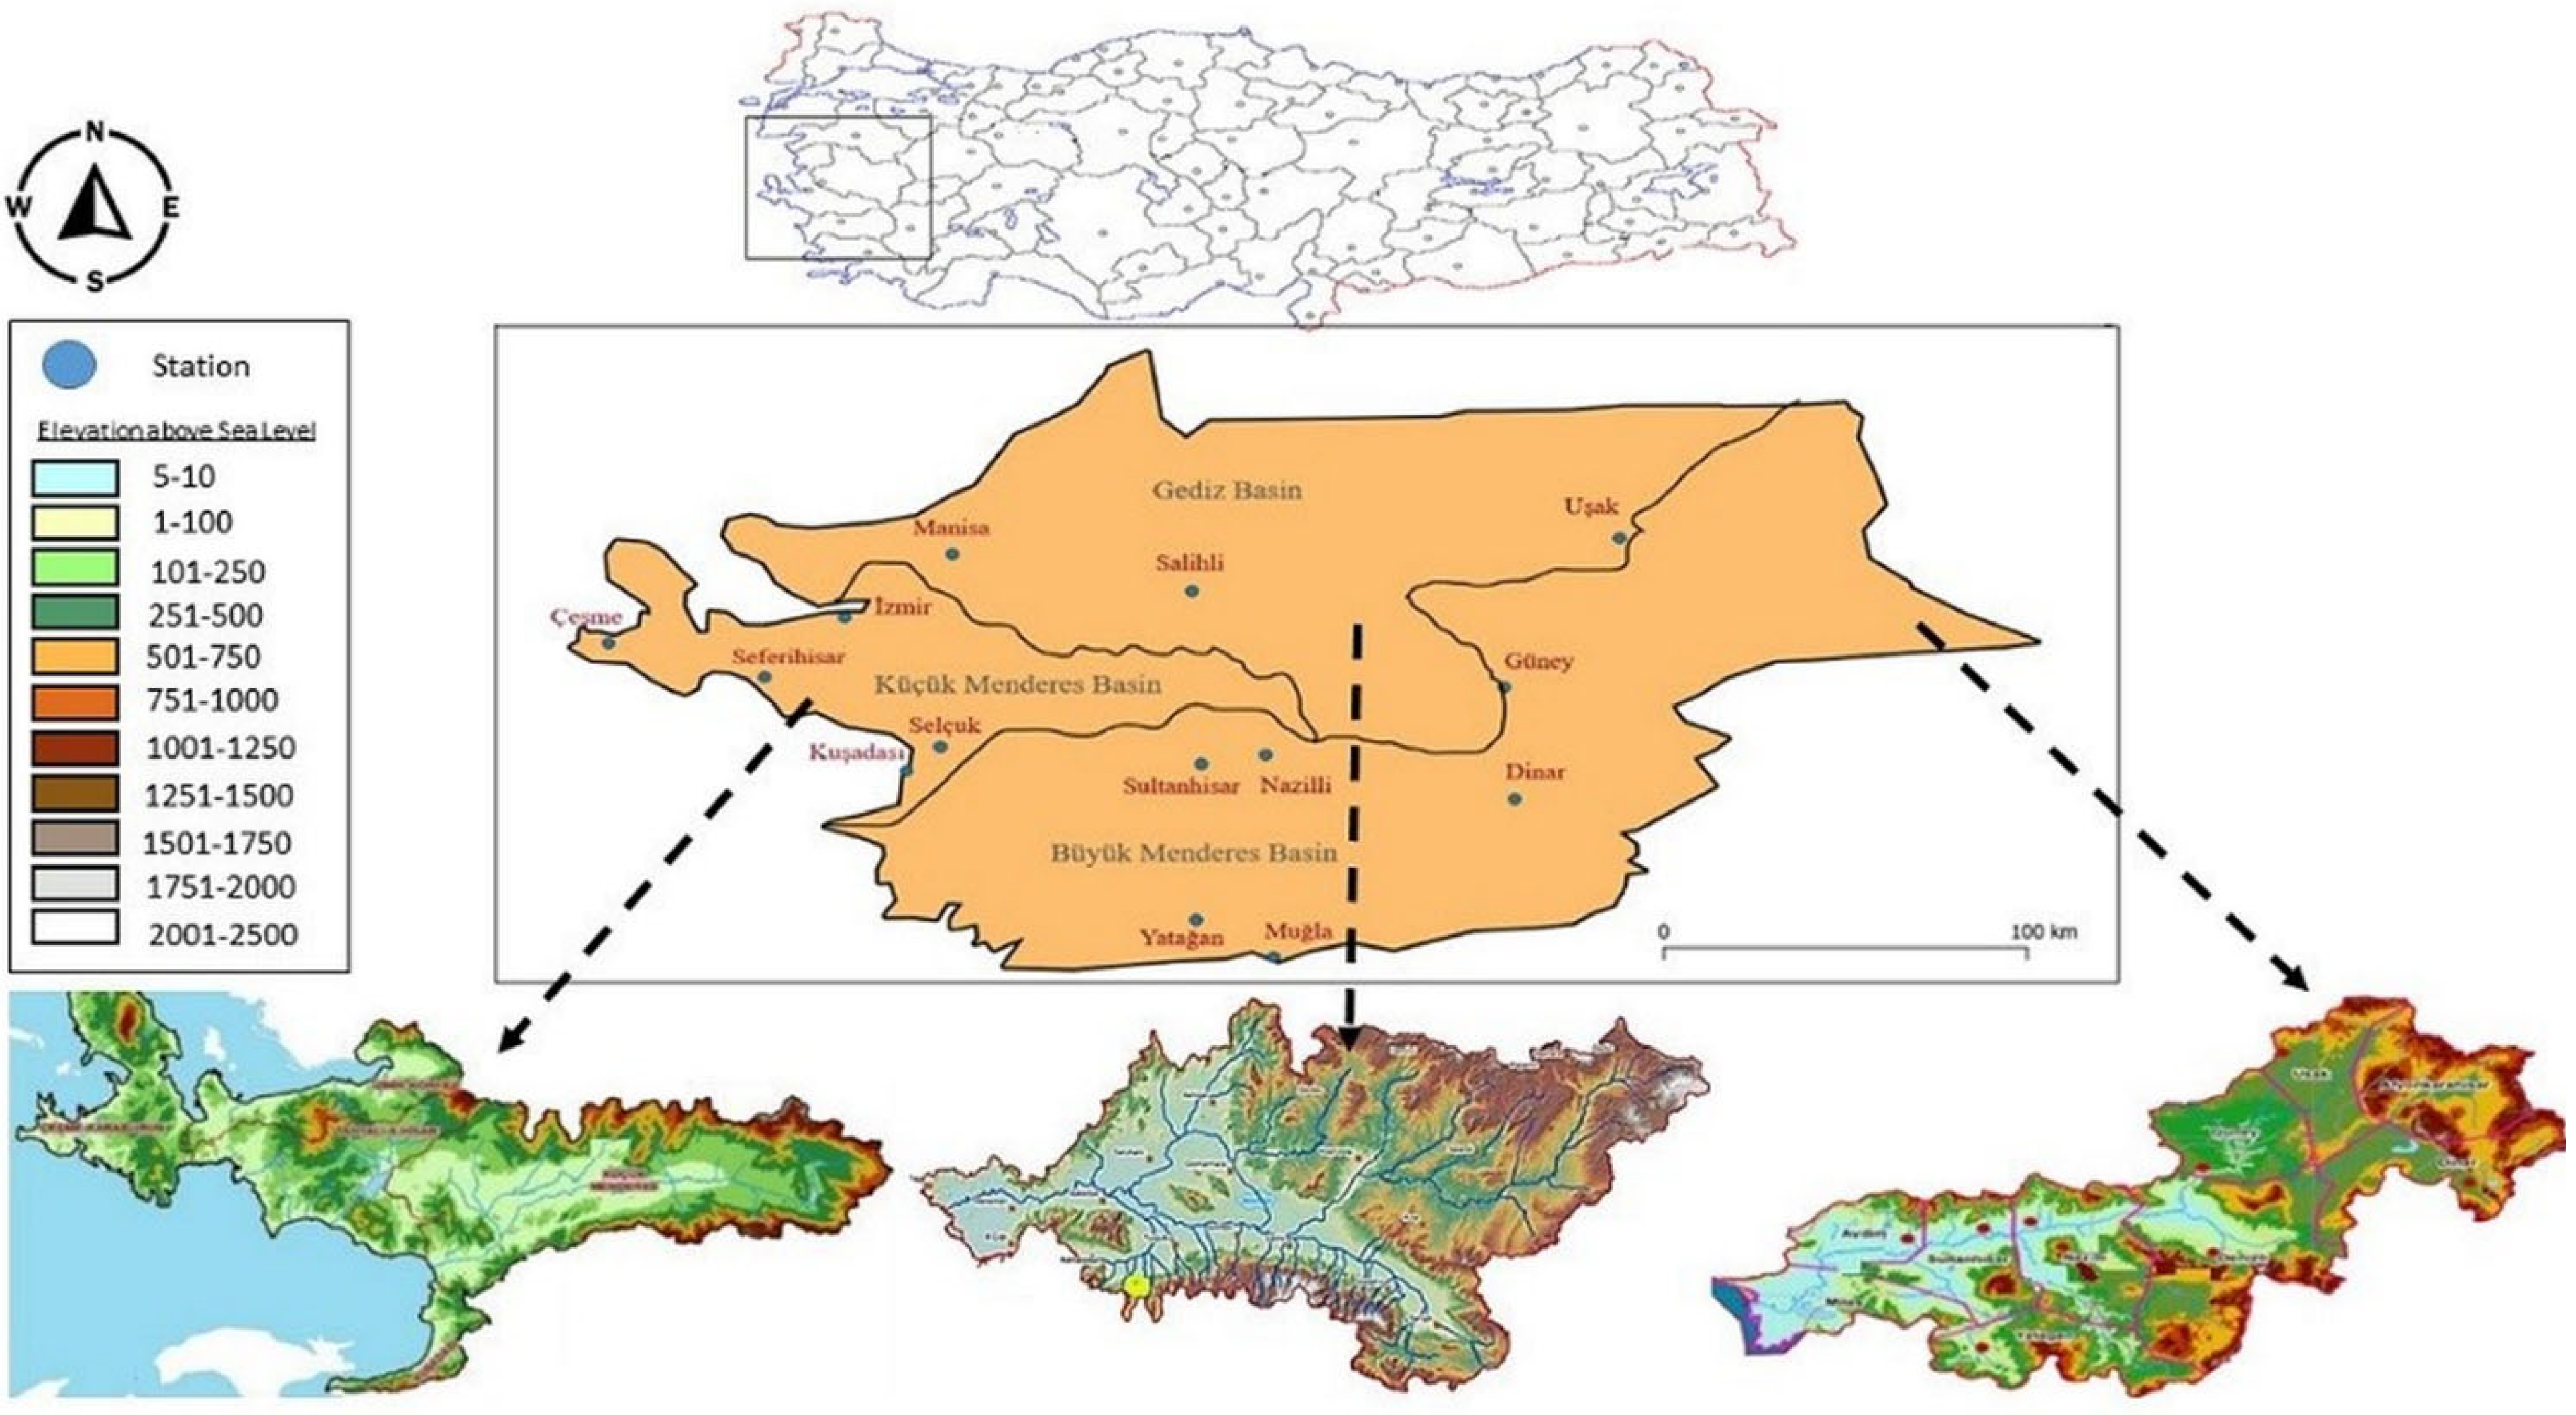
2. Materials (Study Area and Data)

The Aegean Region, with a surface area of 85,000 km2, is Turkey’s third smallest and the most populated region simultaneously. It is adjacent to the Marmara Region in the north, the Mediterranean Region in the southeast, the Central Anatolia Region in the east, and the Aegean Sea in the west (Figure 1). The Mediterranean Climatic, with its dry and, hot summers and wet and mild winters, is the predominant climate type in the region. The dominance of the Mediterranean climate, however, is more sensible in the coastal areas. Yet, due to the local terrain and the land cover, maquis, the Mediterranean climate can be observed in the inner parts of the region as well. There are some forests and jungle zones mostly covered by maquis up to 400 m above sea level. However, the urban area is located mostly on the edges of the fertile plains, while the rural settlements are generally located on the stream banks and valleys. By considering this, since the Roman times, the planning and protection of the water resources and its infrastructures considered as a vital task. Hence, in the following, the situation of the precipitation and temperature in the Aegean Turkey is addressed using a set of data acquired from three major watersheds that will be detailed afterward.
The provinces of Izmir and Aydin are home to some metropolitan cities. It is shared between the Gediz, Buyuk Menderes, and Kucuk Menderes basins. Therefore, the corresponding basins are used in the following study (Figure 1). The research area has 20 sub-basins, of which 10 are located in the Buyuk Menderes basin, five in the Kucuk Menderes basin, and five in the Gediz basin.
Data records associated with the precipitation and the temperature, collected at 14 meteorological stations between 1973 to 2020, are utilized in this study. These stations were Usak, Cesme, Izmir, Denizli, Manisa, Kusadasi, Yatagan, Mugla, Nazilli, Guney, Salihli, Seferihisar, and Selcuk. In Table 1 and Table 2, the statistical characteristics of annual precipitation and the temperature, including the kurtosis coefficient (K), the maximum (Max), the skewness coefficient (S), standard deviation (Sd), the arithmetic mean for the total annual precipitation, and the average annual temperature time series, are given. According to Table 1, Mugla station has the highest average precipitation value among 14 stations. In addition, the maximum precipitation and the highest standard deviation values are observed in this station. On the contrary, the lowest average precipitation value among 14 stations is observed at Salihli station. In addition, the minimum precipitation and the minimum standard deviation value are also observed in Salihli.
According to Table 2, Usak station has the lowest average temperature value among 14 stations, yet the maximum average temperature value is observed in this station. On the contrary, the highest average temperature value among 14 stations is observed at the Izmir station at 18.077 °C, while the maximum average temperature is also recorded in the same station. It is noteworthy that the highest and the lowest standard deviation values (for Tmean) are recorded at Kusadasi and Mugla stations, respectively.

3. Methods

Trend analysis can be considered as one of the most essential indicators of the climate change. In this study, the trend analysis was performed to draw a projection for future events by using historical meteorological records. In this context, 47 years of meteorological records are used to determine the trend in temperature and precipitation time series. Different trend analysis methods, including Mann-Kendall, Spearman’s rho, and the innovative Sen tests are used, while the homogeneity analysis is performed for determination of the turn-point in the allocated time series. In addition, the Thiel-Sen method is used to find the slope associated with the temperature and precipitation trends.

3.1. Mann-Kendall Test (MK)

The trend of a particular time series can be ascertained using the Mann-Kendall test (Mann, 1945). The Mann-Kendall analysis is used in this study to statistically determine if the interested variable has a monotonic temporal trend in an upward or downward direction. A continuous increase in the variable over time is referred to as a monotonic rising trend. A monotonic downward trend, on the other hand, shows that the variable is continually decreasing over time. As a result, the alternative hypothesis (Ha) of this test implies that slopes exist, as opposed to the null hypothesis (H0), which indicates that slopes do not exist. The Mann-Kendall test can be calculated as [31]
S = k = 1 n 1 j = k + 1 n s g n x j x k
where,
s g n x j x k = 1                   i f   x j x k > 0 0                 i f   x j x k = 0 1         i f   x j x k < 0
in which xi and xj are data quantities at time i and j, respectively, and n is the data length. As a result, if S > 0, it indicates a consistently increasing time series, while S < 0 indicates a decreasing one. If n is a positive number, then
σ 2 s = n n 1 2 n + 5 i = 1 p t i t i 1 2 t i + 5 18
in which ti is the data number at pth group and p is the number of groups. The standard Z value can be determined as follows:
Z = S 1 σ 2   S                                 i f   S > 0 0                                                       i f   S = 0 S + 1 σ   S                               i f   S < 0
Afterward, the estimated Z quantity is compared to the standard normal distribution table using a two-sided confidence interval. Hence, if |Z| > Z1−α⁄2, H0 is not accepted and Ha is accepted, there exists a valuable trend. However, if the |Z| > Z1−α⁄2 condition is not satisfied, H0 is accepted and Ha is rejected, meaning that there is no statistical trend. It is noteworthy that in this study, a 5% significance level, as Z1−α⁄2 = 1.96 is used in the analysis.

3.2. Spearman’s Rho Test (SR)

The importance of monotonic patterns in hydro-meteorological time series is assessed using the Spearman’s rho test. This test determines whether or not there are trends in data time series and assesses the trend to show if it is increasing or decreasing. The alternative hypothesis Ha in this test illustrates the existence of a trend, whereas the null hypothesis H0, suggests that the presented data are independent and evenly distributed across time. The Spearman’s rho test [9] statistic D, and the standardized test statistic ZSR, can be obtained as follows:
D = 6 i = 0 n R x i 2 n n 1 2
Z S R = D n 2 1 D 2
in which, R(Xi) is the degree of observation Xi the ith sample dimension. H0 is rejected in this test and Ha is accepted if |ZSR|> 2.08 for a 5% significance level. Once ZSR is positive, it shows a downward trend; however, its negative quantities show an upward trend.

3.3. Sen’s Innovative Trend Detection Test (ST)

It is introduced by Sen [15], where the time series are divided into equal halves, and ranked descending. Afterward, both halves are projected against each other, while the first (Xi) and second (Xj) sub-series are projected on the Y-and X-axis, respectively. Data collected on a 1:1 (45°) straight line shows that there is no trend, data collected in the lower triangle area of the 1:1 straight line indicates a descending trend in the time series, and data collected in the upper triangle area of the 1:1 straight line indicates an ascending trend in the time series.

3.4. Thiel-Sen Approach (TS)

In order to compute the slope value for a specific time series, the Thiel-Sen approach (TS) can be used. The TS approximation is given by [9]:
β = m e d i a n   X j X i j i
in which, Xi and Xj show the ordinal data quantities in the ith and jth year and β shows the trend slope size.

3.5. Pettitt’s Test (PT)

In order to determine a single change-point in the hydro-meteorological time series with controversial data, Pettitt’s test can be used. For a time series of n realization {X1, X2, …, Xn }, let the time of the change point be m. For instance, consider {X1, X2, …, Xm} and {Xm+1, Xm+2, …, Xn}, then the test statistic can be obtained through dividing the time series into time m. The test statistic Um can be written as [32]:
U m = i = 1 n j = i + 1 n s g n x i x j
s g n x = 1                     i f   x > 0 0                     i f   x = 0 1             i f   x < 0
Then, |Ut| is accepted as the main change point at the time t. Thus, the approximate probability of significant change P(t) for the turning point is given by:
P t = 1 e 6 U t 2 n 3 + n 2
The change point is statistically considerable α level when the approximate probability exceeds the value (1-α).

4. Results

Average annual temperature trends were calculated using Spearman’s rho test, Mann-Kendall test, Thiel-Sen, and Pettitt’s test. MK, TS, and SR are used to find trends in temperature time series, while PT is used to determine turning points in time series. In this respect, Table 3 shows an increasing trend at 14 meteorological stations (Δ at all stations). Then, the TS approximation is applied to find the magnitude of the slope. It has been determined that the annual average temperature increases by about 0.20 to 0.35 °C every ten years. Sudden changes in annual mean temperature are determined by PT at all stations (Table 3). The years in which sudden changes were detected can be listed as 2007 in Usak, 2015 in Izmir, 2007 in Guney, 2016 in Manisa, 2013 in Nazilli, 2012 in Salihli, 2007 in Cesme, 2016 in Yatagan, 2007 in Mugla, and 2014 in Usak, Denizli, Selcuk, Sultanhisar, Seferihisar, and Kusadasi stations. The TS trend test is used to investigate the presence of trends in temperature data. Results increased at all stations (for all 14 stations) (Figure 2). Therefore, in the future, the temperature is expected to keep the same trend and increase at the same rate. Therefore, as the global mean of the temperature increases, the frequency and magnitude of the climate extremes would alter the nature of the hydro-climatology and macro-climate patterns.
As a result of MK analysis for annual precipitation time series, it was determined that there was no significant trend in precipitation at Manisa, Salihli, Mugla, Denizli, Yatagan, and Usak stations, and thus the SR test result was also confirmed. Using the TS method, it was determined that the annual increase in precipitation at Izmir, Nazilli, Cesme, Guney, Selcuk, Sultanhisar, Seferihisar, and Kusadasi stations was increasing ( Δ ) as given in Table 4. Table 4 also shows that sudden changes in precipitation regimes were common in all stations in 1998. TS values also showed similar results when the MK test given in Figure 3 is taken into consideration.

5. Discussion

Trends in temperature and precipitation during 1973–2020 are analyzed using various methods in the Aegean region, and these methods indicate the existence of trends in precipitation and temperature during the study period. It is determined that the annual average temperature at all stations has increased from 0.20–0.35 °C/decade. The TS also showed that average temperatures increased over the study period. Abrupt changes in annual temperatures are observed at most stations in 2007, but several changes at Izmir in 2015, Manisa in 2016, Nazilli in 2013, Salihli in 2012, Yatagan in 2016, and Usak in 2014 are also detected. In contradiction with the results, it was also concluded that there was a significant upward trend in temperature between 1998 and 2020 (i.e., 1998 was the year the sudden temperature change trend started—changing point) [14].
Analysis of the annual precipitation time series with SR and MK tests illustrate that in 8 stations (Izmir, Nazilli, Cesme, Guney, Selcuk, Seferihisar, Sultanhisar, and Kusadasi), valuable positive trends exist, while no significant trends are detected at the remaining stations. However, the TS method detects mild positive trends at Mugla, Nazilli, Cesme, Manisa, Izmir, and Seferihisar stations as well. The results of the TS, on the other hand, showed increasing trend between 4.2–7.9 mm/year almost everywhere. Therefore, this study yielded results that are in line with the results obtained by Ciflik [25] and Topuz [28]. As a result, the frequency and magnitude of the meteorological events would be altered and may cause significant biotic/abiotic environmental disturbances (erosion, flood, wildfires, etc.) [9,17], a fact that urges the need for a comprehensive study that addresses the extreme events in the future.
It can be concluded that the trends associated with the precipitations are partly significant, but the trends associated with the temperature are definitely increasing. This means that the region is warming up. As a result, the frequency and magnitude of the meteorological events would be altered and may cause significant biotic/abiotic environmental disturbances (erosion, flood, wildfires, etc.) [33,34,35,36], a fact that urges the need for a comprehensive study that addresses the extreme events in the future. Recent studies suggest that the climate state changes frequently and more often, and this alters the hydrology of river streams and water reservoirs. It is noteworthy that the seasonal variation in the temperature and precipitation rates may also reveal valuable information that need further analysis. In the rapidly growing and developing Aegean region, the planning of water resources is extremely important for political decision makers and public affairs. Hence, this study determines the historical precipitation and temperature trends in the Aegean region and gives an overview about the future. This study also shed light not only on the historical precipitation and temperature trends between 1973 and 2020 in but also about the future climatic events.
Understanding changes in meteorological processes and potential factors provide insights into the conservation and management of water resources. Under the pressure of uncontrollable climate variables, effective measures for sustainable integrated water resources management should be implemented to maintain ecological integrity [37]. Due to the climate change, temperature, and precipitation (as well as indirectly in evapotranspiration values), patterns change in various areas of the world, either in increasing or decreasing directions. These changes in precipitation and temperature are determined through the trend analysis. Water infrastructures need to be planned from hydraulics (and hydrological) points of view that take into account of future variations of meteorological processes. This study provides information on climate change for the Aegean Region, which is crucial for designing more adaptable and sustainable water infrastructures.

6. Conclusions

By using historical meteorological (precipitation and temperature) data, five trend tests are applied at 14 stations in Gediz, Buyuk Menderes, and, Kucuk Menderes hydrological basins in the Aegean region for a period of 1973–2020. The following are concluded from this study:
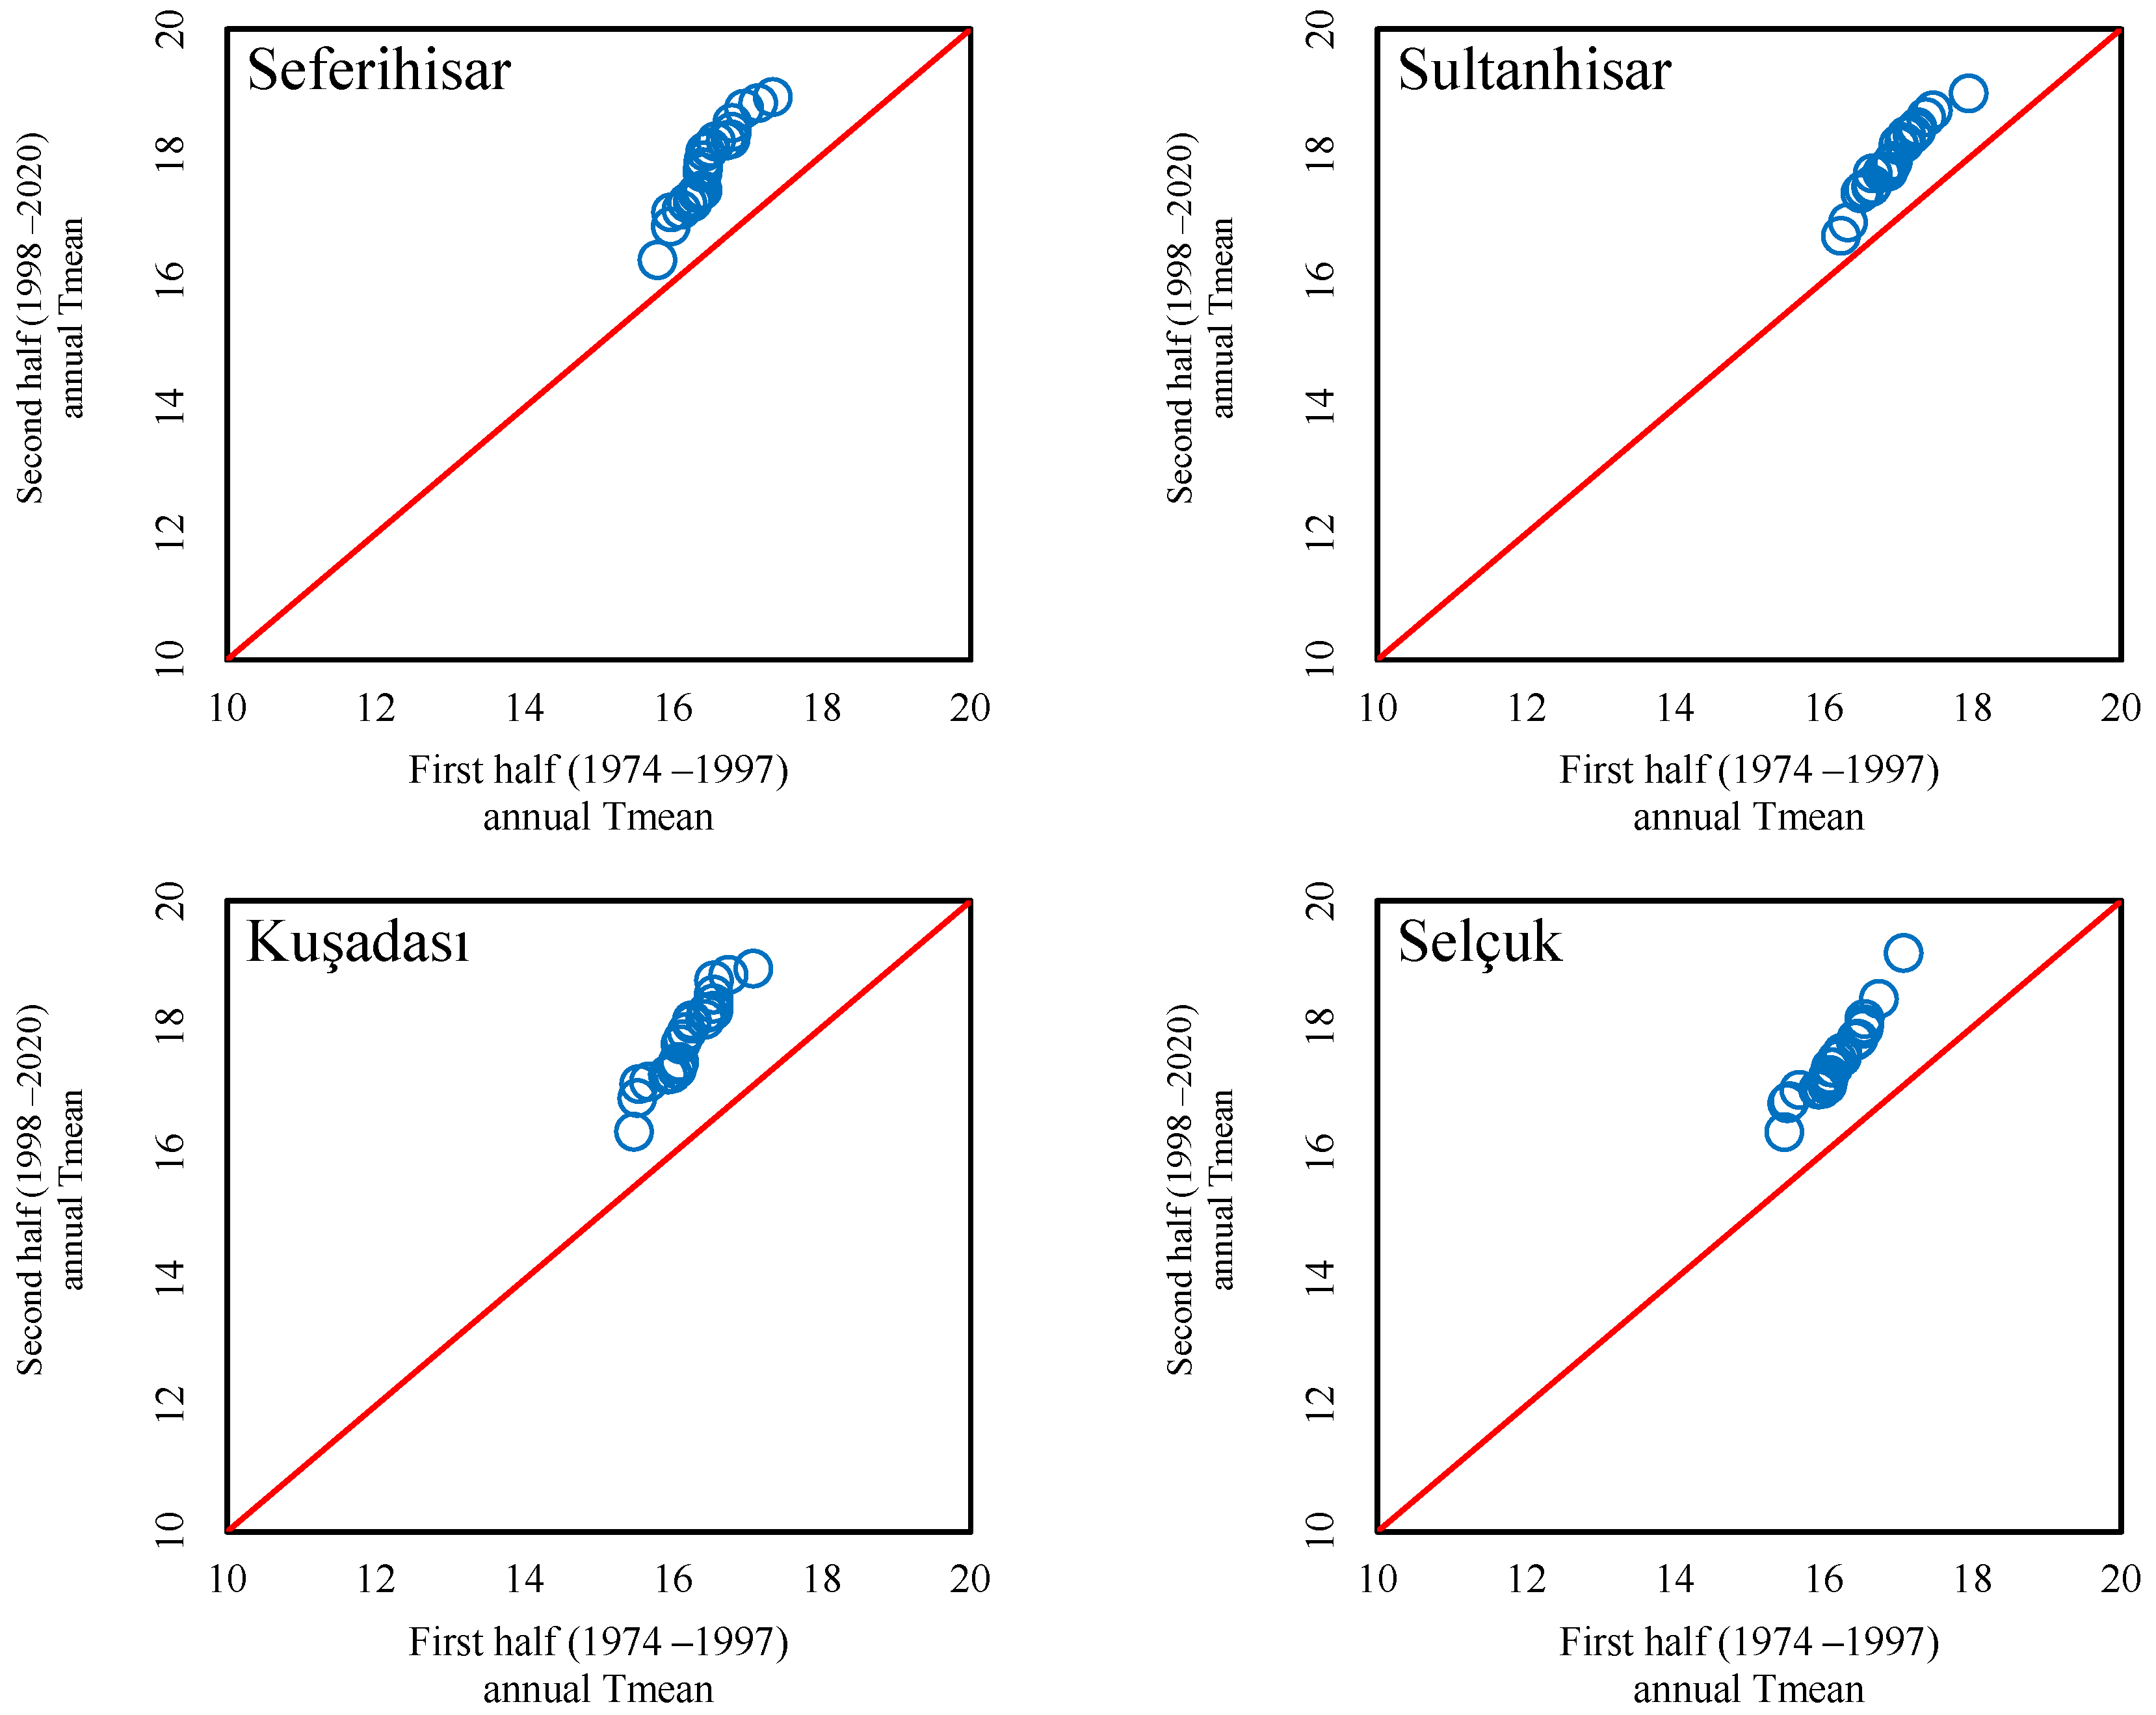
  • Changes in temperature between 1973 and 2020 occurred and can be considered as a sign for regional warming.
  • The temperature shows an increase of about 0.20–0.35 °C/decade. Therefore, the next decade is expected to be warmer.
  • Abrupt temperature changes are also observed in 2007 for most of the stations but are also observed in the 2010s for some stations.
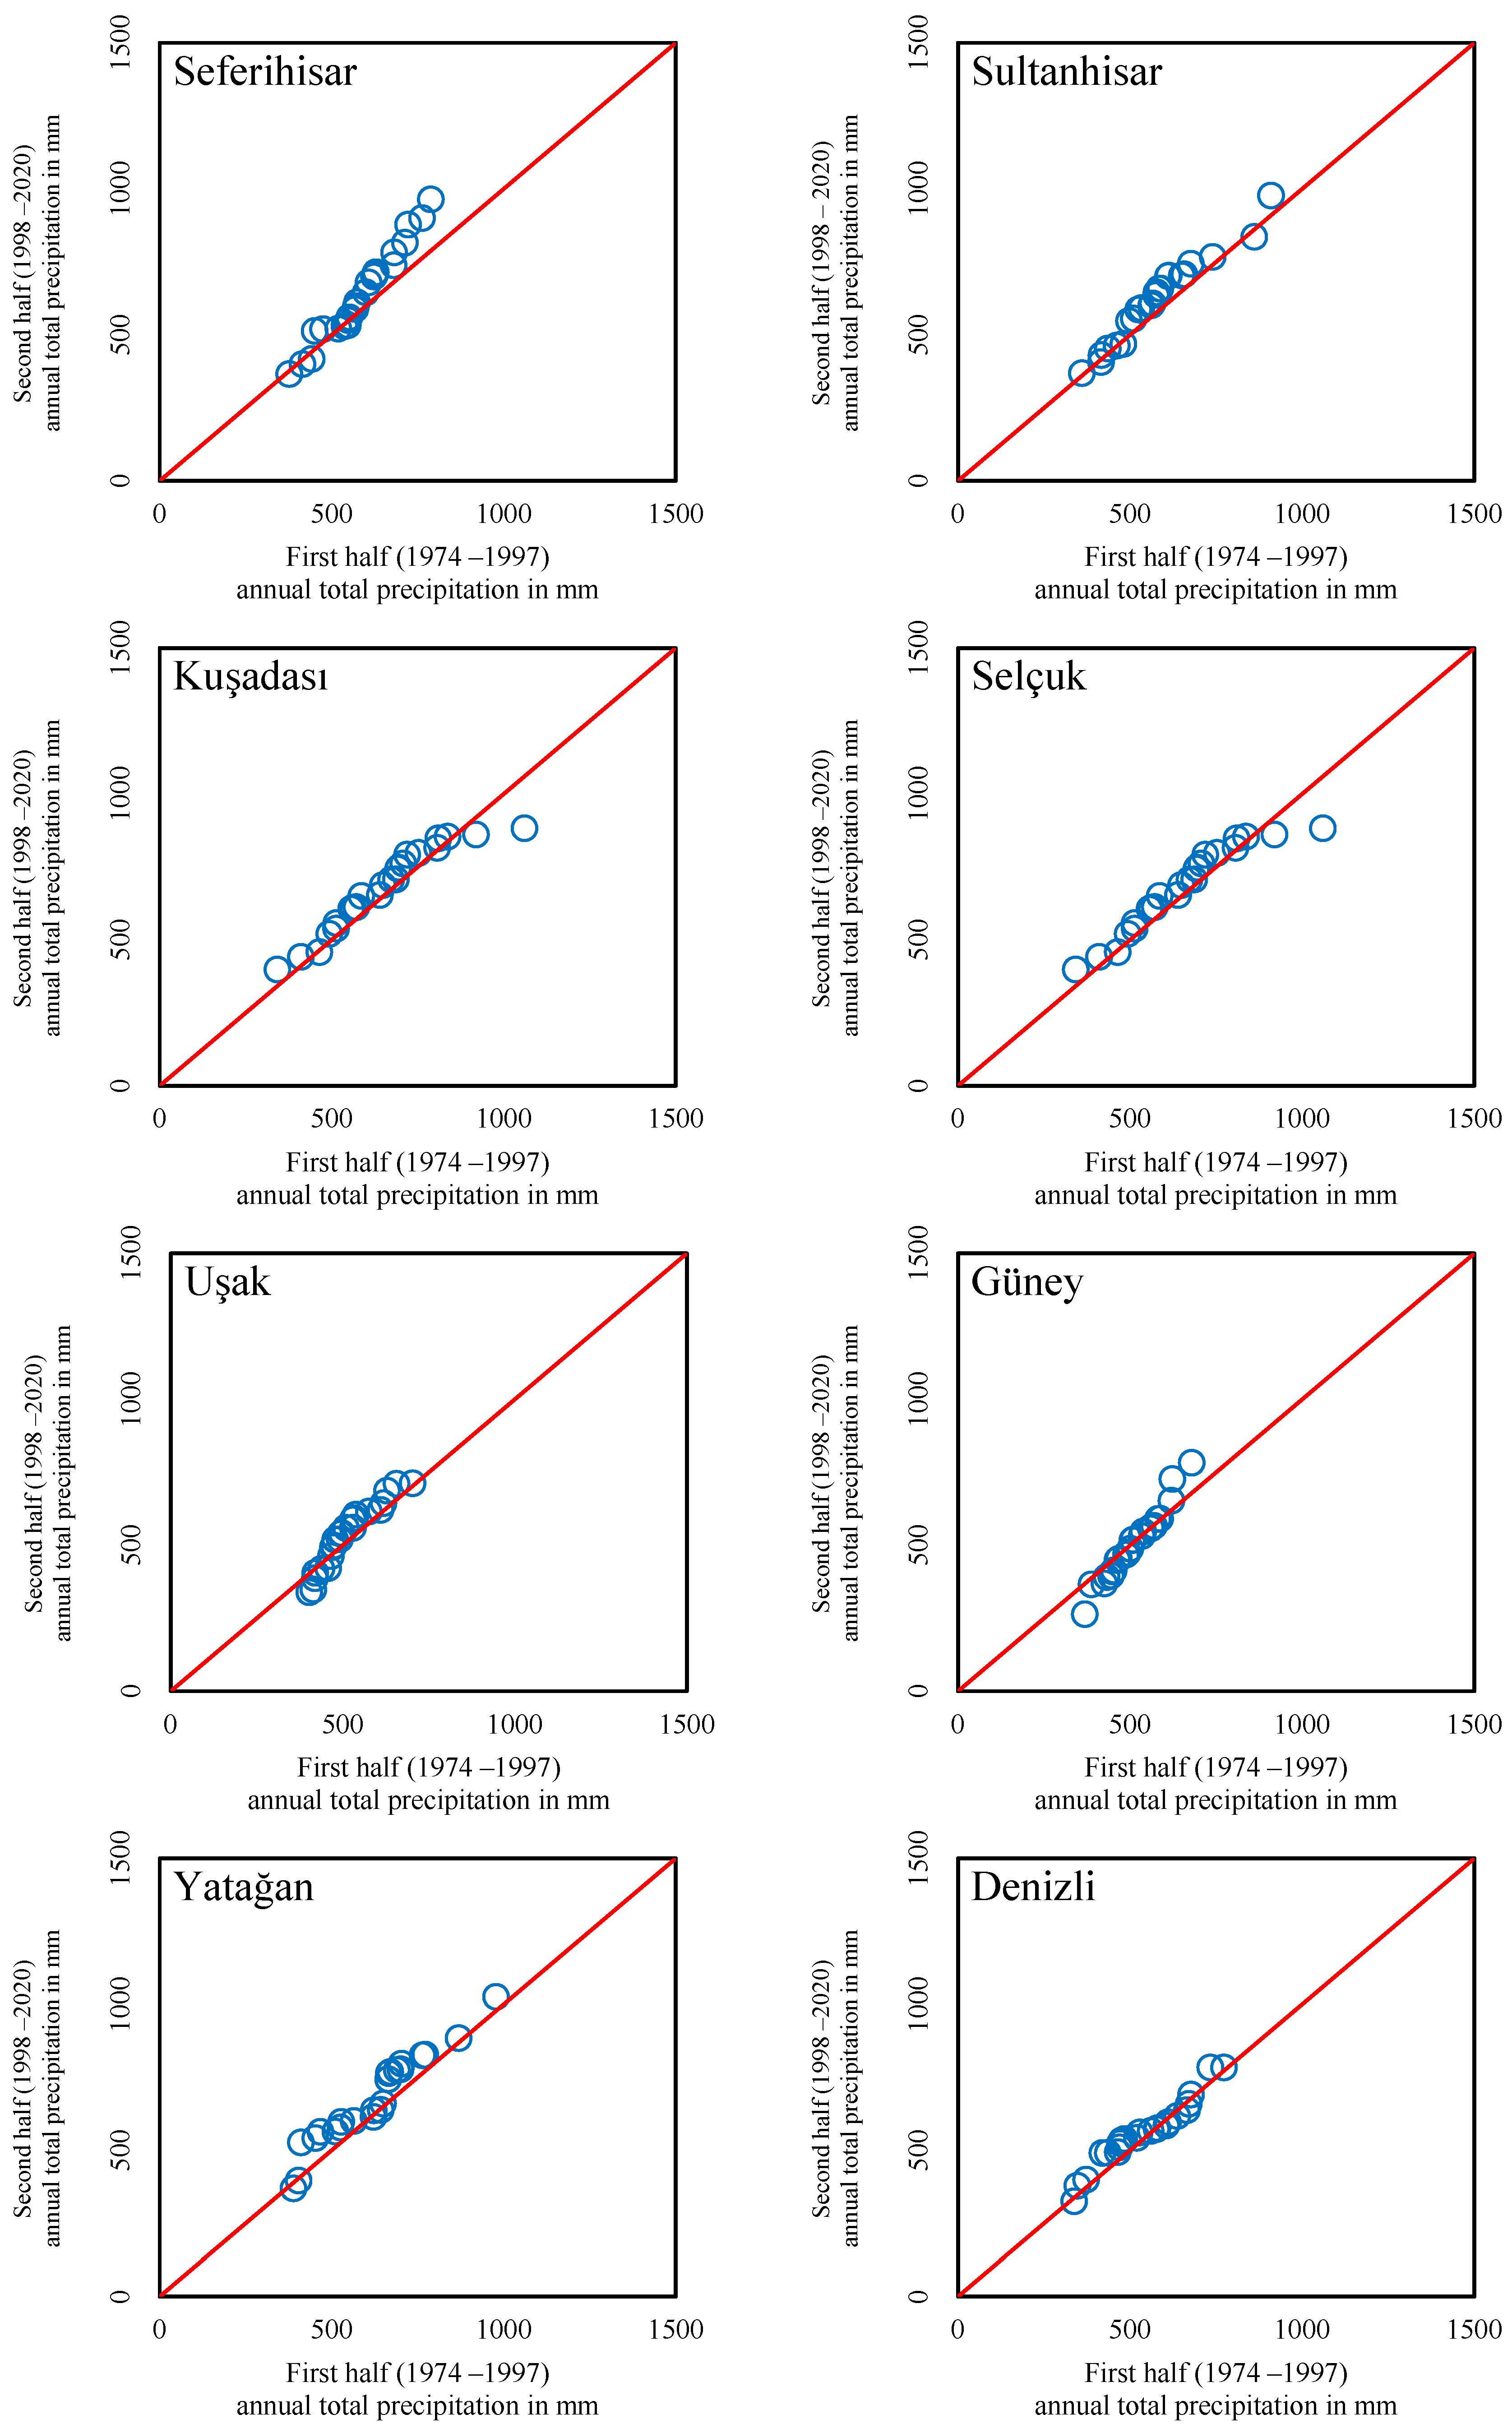
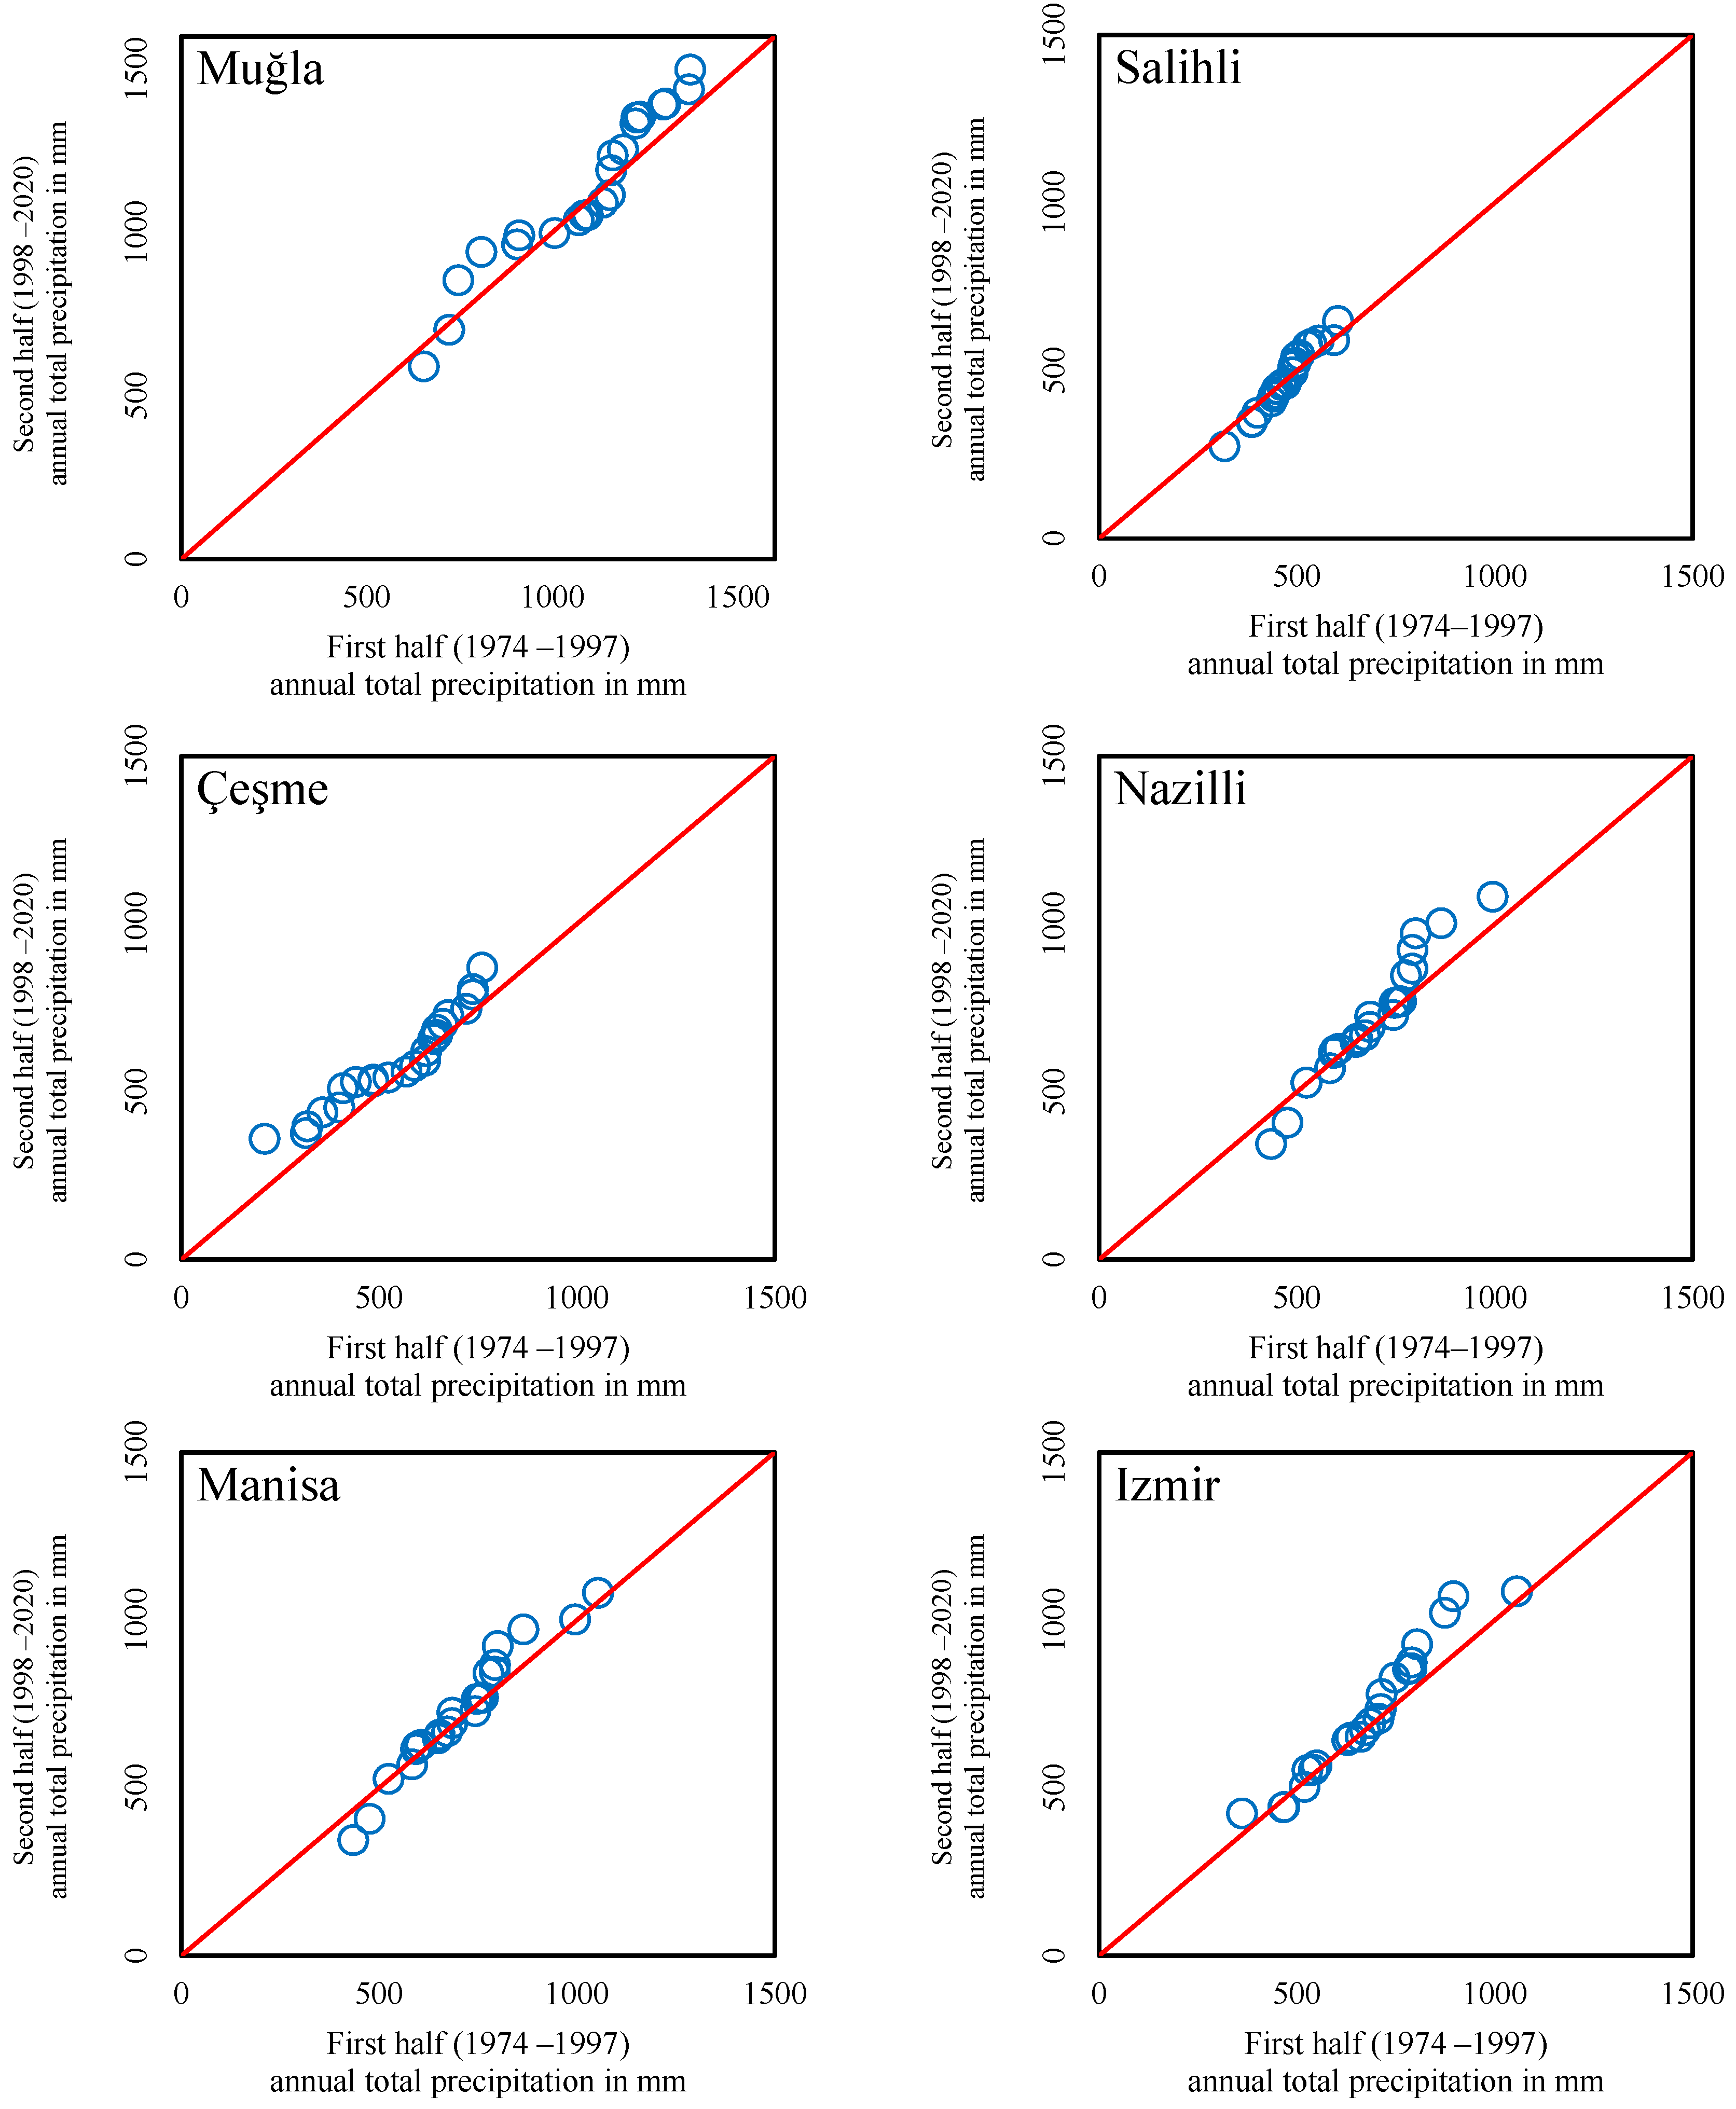
  • When considering the precipitation time series, a positive trend (increase in precipitation amount) is detected, being low for some stations and severe for some stations (ranging between 4.2–7.9 mm/year). In addition, it has been determined that these abrupt changes in the precipitation time series have occurred in 1998.

Author Contributions

Conceptualization, G.T., B.V. and M.J.S.S.; methodology, D.M., G.T. and B.V.; software, D.M.; validation, B.V. and M.J.S.S.; formal analysis, D.M., M.J.S.S. and B.V.; investigation, D.M.; resources, M.J.S.S.; data curation, M.J.S.S.; writing (original draft preparation), D.M; writing—review & editing, M.J.S.S., D.M., B.V. and G.T.; visualization, D.M.; supervision, G.T. and M.J.S.S.; project administration, M.J.S.S.; funding acquisition, M.J.S.S. All authors have read and agreed to the published version of the manuscript.

Funding

This publication is supported as part of Project No. BAP095 entitled ‘‘Drought Assessment in Izmir District, Turkey’’ has been approved by the Yaşar University Project Evaluation Commission (PEC) under the coordination of the third author (M.J.S.S.).

Institutional Review Board Statement

Not applicable.

Informed Consent Statement

Not applicable.

Data Availability Statement

Data could be provided upon reasonable request.

Acknowledgments

Authors want to express their gratitude to the Turkish Meteorology General Directorate (MGM) for providing the database used in this study.

Conflicts of Interest

The authors declare no conflict of interest. The sponsors had no role in the design, execution, interpretation, or writing of the study.

Ethical Statement

This content is entirely unique to the writers and has never been published before. No further publication of the material is presently being explored. The author’s personal research and analysis are accurately and completely reflected in the work.

References

  1. Lettenmaier, D.P.; Wood, E.F.; Wallis, J.R. Hydroclimatological trends in the continental United States, 1948–1988. J. Clim. 1994, 7, 586–607. [Google Scholar] [CrossRef]
  2. Jones, P.D.; New, M.; Parker, D.E.; Martin, S.; Rigor, I.G. Surface air temperature and its changes over the past 150 years. Rev. Geophys. 1999, 37, 173–199. [Google Scholar] [CrossRef]
  3. New, M.; Todd, M.; Hulme, M.; Jones, P. Rainfall measurements and trends in the twentieth century. Int. J. Climatol. 2001, 21, 1889–1922. [Google Scholar] [CrossRef]
  4. Kwarteng, A.Y.; Dorvlo, A.S.; Kumar, G.T.V. Analysis of a 27-Year Rainfall Data (1977–2003) in the Sultanate of Oman. Int. J. Climatol. 2009, 29, 605–617. [Google Scholar] [CrossRef]
  5. Fathian, F.; Morid, S.; Kahya, E. Identification of trends in hydrological and climatic variables in Urmia Lake basin, Iran. Theor. Appl. Climatol. 2015, 119, 443–464. [Google Scholar] [CrossRef]
  6. Beusekom, V.; González, G.; Rivera, M.M. Short-term rainfall and temperature trends along an elevation gradient in northeastern Puerto Rico. Sci. J. Earth Interact. 2015, 19, 1–33. [Google Scholar] [CrossRef] [Green Version]
  7. Chen, Z.; Grasby, S.E. Impact of decadal and century-scale oscillations on hydroclimate trend analyses. J. Hydrol. 2009, 365, 122–133. [Google Scholar] [CrossRef]
  8. Vaheddoost, B. A comparison of several methods in tracking short-term trends associated with the rainfall time series. Uludağ Üniversitesi Mühendislik Fakültesi Derg. 2020, 25, 153–168. [Google Scholar]
  9. Shadmani, M.; Marofi, S.; Roknian, M. Trend analysis about evapotranspiration using Mann-Kendall and Spearman’s Rho tests in arid regions of Iran. Water Res. Manag. 2012, 26, 211–224. [Google Scholar] [CrossRef] [Green Version]
  10. Garbrecht, J.; Van Liew, M.; Brown, G.-O. Trends in rainfall, streamflow, and evapotranspiration in the Great Plains of the United States. J. Hydrol. Eng. 2004, 9, 360–367. [Google Scholar] [CrossRef] [Green Version]
  11. Gellens, D. Trend and correlation analysis of k-day extreme rainfall over Belgium. Theor. Appl. Climatol. 2000, 66, 117–129. [Google Scholar] [CrossRef]
  12. Kahya, E.; Kalayci, S. Trend analysis of streamflow in Turkey. J. Hydrol. 2004, 289, 128–144. [Google Scholar] [CrossRef]
  13. Panda, A.; Sahu, N. Trend analysis of seasonal rainfall and temperature pattern in Kalahandi, Bolangir and Koraput districts of Odisha, India. Atmos Sci. Lett. 2019, 20, e932. [Google Scholar] [CrossRef] [Green Version]
  14. Kastridis, A.; Kamperidou, V.; Stathis, D. Dendroclimatological Analysis of Fir (A. borisii-regis) in Greece in the frame of Climate Change Investigation. Forests 2022, 13, 879. [Google Scholar] [CrossRef]
  15. Sen, Z. Innovative trend analysis methodology. J. Hydrol. Eng. 2012, 17, 1042–1046. [Google Scholar] [CrossRef]
  16. Yue, S.; Pilon, P.; Cavadias, G. Power of the Mann–Kendall and Spearman’s rho tests for detecting monotonic trends in hydrological series. J. Hydrol. 2002, 259, 254–271. [Google Scholar] [CrossRef]
  17. Some’e, B.S.; Ezani, A.; Tabari, H. Spatiotemporal trends and change point of rainfall in Iran. Atmos. Res. 2012, 113, 1–12. [Google Scholar]
  18. Hirsch, R.M.; Slack, J.R.; Smith, R.A. Techniques of trend analysis for monthly water quality data. Water Resour. Res. 1982, 18, 107–121. [Google Scholar] [CrossRef] [Green Version]
  19. Pettitt, A. A non-parametric approach to the change-point problem. Appl. Stat. 1979, 28, 126–135. [Google Scholar] [CrossRef]
  20. Mu, X.; Zhang, L.; McVicar, T.R.; Chille, B.; Gau, P. Analysis of the impact of conservation measures on streamflow regime in catchments of the Loess Plateau, China. Hydrol. Process. 2007, 21, 2124–2134. [Google Scholar] [CrossRef]
  21. Yacoub, E.; Tayfur, G. Trend analysis of temperature and rainfall in Trarza region of Mauritania. J. Water Clim. Chang. 2019, 10, 484–493. [Google Scholar] [CrossRef]
  22. Mersin, D.; Gulmez, A.; Safari, M.J.S.; Vaheddoost, B.; Tayfur, G. Drought Assessment in the Aegean Region of Turkey. Pure Appl. Geophys. 2022, 179, 3035–3053. [Google Scholar] [CrossRef]
  23. Gajbhiye, S.; Meshram, C.; Singh, S.K.; Srivastava, P.K.; Islam, T. Precipitation trend analysis of Sindh River basin, India, from 102-year record (1901–2002). Atmos. Sci. Lett. 2016, 17, 71–77. [Google Scholar] [CrossRef]
  24. Beyene, A.N. Precipitation and temperature trend analysis in Mekelle city, Northern Ethiopia, the Case of Illala Meteorological Station. J. Environ. Earth Sci. 2015, 5, 46–52. [Google Scholar] [CrossRef] [Green Version]
  25. Ciflik, D. Trend Analysis of Annual Rainfall Observed in DSI Stations in Aegean Region. MSc Thesis, Ege University, İzmir, Turkey, 2012. (In Turkish). [Google Scholar]
  26. Omer, A.; Dogangun, C. Recent Rainfall Trends in the Aegean Region of Turkey. J. Hydrometeorol. 2015, 16, 1873–1885. [Google Scholar] [CrossRef]
  27. Bacanli, U.G.; Tanrikulu, A. Trend Analysis of Evaporation Data in Aegean Region. Afyon Kocatepe Üniversitesi Fen Ve Mühendislik Bilim. Derg. 2017, 17, 980–987. (In Turkish) [Google Scholar]
  28. Topuz, M.; Feidas, H.; Karabulut, M. Trend analysis of rainfall data in Turkey and relations to atmospheric circulation: (1955–2013). Ital. J. Agrometeorol. 2021, 2, 91–107. [Google Scholar] [CrossRef]
  29. Todaro, V.; D’Oria, M.; Secci, D.; Zanini, A.; Tanda, M.G. Climate Change over the Mediterranean Region: Local Temperature and Precipitation Variations at Five Pilot Sites. Water 2022, 14, 2499. [Google Scholar] [CrossRef]
  30. Behzadi, F.; Yousefi, H.; Javadi, S.; Moridi, A.; Shahedany, S. Meteorological drought duration–severity and climate change impact in Iran. Theor. Appl. Climatol. 2022, 149, 1297–1315. [Google Scholar] [CrossRef]
  31. Kisi, O.; Ay, M. Comparison of Mann-Kendall and Innovative Trend Method for Water Quality Parameters of the Kizilirmak River, Turkey. J. Hydrol. 2014, 513, 362–375. [Google Scholar] [CrossRef]
  32. Chen, S.-T.; Kuo, C.-C.; Yu, P.-S. Historical trends and variability of meteorological droughts in Taiwan/Tendances historiques et variabilité des sécheresses météorologiques à Taiwan. Hydrol. Sci. J. 2009, 54, 430–441. [Google Scholar] [CrossRef]
  33. Bhutiyani, M.R.; Kale, V.S.; Pawar, N.J. Long-term trends in maximum, minimum and mean annual air temperatures across the Northwestern Himalaya during the twentieth century. Clim. Chang. 2007, 85, 159–177. [Google Scholar] [CrossRef]
  34. Ferreira, C.S.; Seifollahi-Aghmiuni, S.; Destouni, G.; Ghajarnia, N.; Kalantari, Z. Soil degradation in the European Mediterranean region: Processes, status and consequences. Sci. Total Environ. 2022, 805, 150106. [Google Scholar] [CrossRef] [PubMed]
  35. Gallego, M.; García, J.; Vaquero, J.; Mateos, V. Changes in frequency and intensity of daily rainfall over the Iberian Peninsula. J. Geophys. Res., Atmos. 2006, 111, D24105. [Google Scholar] [CrossRef]
  36. Kastridis, A.; Stathis, D.; Sapountzis, M.; Theodosiou, G. Insect outbreak and long-term post-fire effects on soil erosion in mediterranean suburban forest. Land 2022, 11, 911. [Google Scholar] [CrossRef]
  37. Yagbasan, O.; Demir, V.; Yazicigil, H. Trend Analyses of Meteorological Variables and Lake Levels for Two Shallow Lakes in Central Turkey. Water 2020, 12, 414. [Google Scholar] [CrossRef]
Figure 1. Aegean Region and the study area and the meteorological stations.
Sustainability 14 13380 g001
Figure 2. ST analysis for annual average temperatures.
Sustainability 14 13380 g002aSustainability 14 13380 g002bSustainability 14 13380 g002c
Figure 3. ST analysis for annual precipitation.
Sustainability 14 13380 g003aSustainability 14 13380 g003b
Table 1. Annual precipitation characteristics.
StationMean (mm)Sd (mm)Max (mm)K (mm)S (mm)H—Altitude
(m)
Salihli476.783.11669.003.150.03125
Manisa704.83171.31081.63.010.1071
Selcuk664.89152.191060.12.850.02916
Cesme573.83146.61869.72.61−0.342
Izmir696.84175.241086.102.780.345
Seferihisar609.21137.64964.603.020.4511
Kusadasi616.73146.70914.902.150.1717
Denizli583.88111.18784.202.760.04324
Mugla1135.00271.511760.602.97−0.16661
Usak524.195.23712.82.400.19890
Guney507.199.42783.23.700.31750
Yatagan648.94150.271026.002.960.20400
Sultanhisar596.46138.11977.403.370.5597
Nazilli571.14126.74856.202.760.3764
Table 2. Annual Tmean characteristics.
StationMean (°C)Sd (°C)Max (°C)K (°C)S (°C)
Salihli16.560.8718.54−0.710.46
Manisa16.930.6818.47−0.220.30
Selcuk16.850.8419.17−0.140.49
Cesme17.410.6219.180.05−0.36
Izmir18.080.7419.67−0.490.37
Seferihisar17.140.8518.92−0.860.47
Kusadasi17.391.0319.41−0.820.07
Denizli16.410.9718.44−0.780.19
Mugla15.200.6216.700.11−0.13
Usak12.690.7214.560.060.46
Guney13.870.8115.86−0.120.51
Yatagan16.370.6918.05−0.310.23
Sultanhisar17.440.6818.98−0.780.31
Nazilli17.520.6519.13−0.290.21
Table 3. Temperature trend analysis results ( indicate downeard, while Δ indicate upward trend).
StationMKTypeSRTSPT
ZSign?ZsrβYear
Izmir4.800Yes Δ 5.790.32015
Manisa4.380Yes Δ 5.640.252016
Nazilli3.960Yes Δ 5.020.352013
Cesme4.220Yes Δ 5.660.32007
Salihli4.91Yes Δ 6.680.32012
Mugla4.42Yes Δ 5.540.22007
Denizli5.25Yes Δ 7.140.252007
Yatagan4.45Yes Δ 5.720.32016
Usak4.53Yes Δ 5.790.32014
Guney4.34Yes Δ 5.690.22007
Selcuk5.01Yes Δ 6.840.252007
Sultanhisar4.96Yes Δ 5.870.32007
Seferihisar4.76Yes Δ 5.750.22007
Kusadasi4.99Yes Δ 5.720.22007
Table 4. Precipitation trend analysis results ( indicate downward, while Δ indicate upward trend).
StationMKTypeSRTSPT
ZSign?ZsrβYear
Izmir2.100Yes Δ 3.137.31998
Manisa−0.940No ---
Nazilli2.008Yes Δ 3.16.81998
Cesme2.663Yes Δ 3.797.91998
Salihli−0.19No ---
Mugla0.16No Δ ---
Denizli−0.36No ---
Yatagan1.03No Δ ---
Usak0.32No Δ ---
Guney2.14Yes Δ 3.184.21998
Selcuk2.32Yes Δ 3.466.91998
Sultanhisar2.62Yes Δ 3.775.51998
Seferihisar2.88Yes Δ 4.127.41998
Kusadasi2.31Yes Δ 3.437.51998
Publisher’s Note: MDPI stays neutral with regard to jurisdictional claims in published maps and institutional affiliations.

