Article

Influence of Economic Openness on Total Factor Productivity: Evidence from China’s Belt and Road Initiative

SILC Business School, Shanghai University, Shanghai 201899, China
*
Author to whom correspondence should be addressed.
Sustainability 2022, 14(20), 13375; https://doi.org/10.3390/su142013375
Submission received: 6 August 2022 / Revised: 13 October 2022 / Accepted: 14 October 2022 / Published: 17 October 2022
(This article belongs to the Collection Technological Innovation and Economic Growth)

Abstract

:
The impact of international trade and export-oriented policies on economic growth has been an important topic. Based on an evaluation of China’s Belt and Road Initiative (BRI), this study provides new evidence of the positive causal link between increasing openness and long-term economic growth. Specifically, this study evaluates the BRI’s impact on 18 key provinces in China, with a focus on total factor productivity (TFP). Utilizing a panel dataset of 284 prefectural-level cities from 2007 to 2018, we examine the causal relationship between the BRI and TFP in a difference-in-differences framework. We apply the five-pronged approach to the BRI to explore the impact mechanism and examine heterogeneity in the effect in terms of geographic location and local government efficiency. We find that the BRI significantly promotes TFP in key provinces; it increases TFP through unimpeded trade, infrastructure connectivity, technical efficiency, and technological progress. The BRI promotes TFP in key coastal provinces belonging to the Maritime Silk Road while having a relatively limited impact on the other key provinces belonging to the Silk Road Economic Belt. This study has policy implications for promoting the BRI in China. It recommends that the government collaborates with firms and financial institutions in the construction of infrastructure.

1. Introduction

Research in recent decades has found that international trade and an export-oriented economy have a positive impact on economic growth [1,2,3]. Unprecedented trade openness and expansion, especially since the 1970s, can be considered a driving force of economic growth [4]. Trade openness promotes economic growth in the long run [5], though studies have analyzed other sources of growth that lead to increases in the aggregate levels of labor and capital [6]. More open countries can reallocate existing resources from the less efficient non-export sector to the higher productivity export sector. Although the positive impacts on reallocations and productivity have been theoretically examined [7], the effects of international trade on total factor productivity (TFP), which can be regarded as an important driving force of long-term economic growth, remains an area of protracted controversy. Most evidence used in studies in the United States and the United Kingdom suggests that more open countries experience faster productivity growth; these studies claim important links between trade policies and TFP performance [8,9,10,11]. Emerging research has explored how the positive impact is channeled, from the perspective of higher human capital and tougher firm selection [12,13]. Although some studies present different conclusions based on firm-level micro-data, Schor [14] proposes that extensive openness may not always contribute to productivity gains after trade liberalization, showing a high degree of heterogeneity among Brazilian manufacturing firms. Greenaway, Gullstrand, and Kneller [15] find no evidence of pre- or post-entry differences in firm-level productivity in the Swedish economy. Edmond, Midrigan, and Xu [16] use Taiwanese manufacturing data to argue that China’s opening up to trade induced a more efficient allocation of factors within firms and, in turn, increased TFP. Conversely, Chen and Tang [17] find limited support for the effect of export growth on productivity growth. Productivity research often examines the relationship between increases in productivity and structural changes in an economy, such as trade policy reform. By identifying a potential channel through which free trade and further opening up benefit a nation, Lu and Yu [18] shed light on using China’s world trade organization (WTO) accession as an exogenous shock for identifying how greater openness affects a potential source of resource misallocation. They use a difference-in-differences (DID) framework based on the year of China’s WTO accession and the changing embeddedness of the enterprise global value chain. Analogously, to provide new evidence regarding the causal link between greater openness and domestic productivity growth, we choose China’s belt and road initiative (BRI) as an exogenous shock and evaluate its impact on the TFP of several Chinese provinces that have benefited from the initiative to varying degrees.
In this context, it must be noted that China’s opening up and economic reforms over the past three decades have achieved remarkable success. However, when describing the next period of economic growth, President Xi [19] claimed that China’s economic development entered a “new normal” stage in 2014. This concept of “new normal” is widely used to refer to the annual GDP growth that has slowed to 7.0–7.5% from the double-digit levels of the high-growth period. This is attributed to the now weakened traditional driving forces of growth. In other words, there has been a decline in the output growth rates of the labor and capital factors which primarily determined growth [20]. Nonetheless, during this long-term extensive development, more attention was paid to quantitative growth, ignoring qualitative economic development, and creating bottleneck problems such as overcapacity and inefficient resource allocation [21]. Under this “new normal,” opening up further to global trade and strengthening economic cooperation have become important ways to promote economic development. In the Chinese government’s 2014 work report, Premier Li [22] proposed that facilitating opening up to force domestic economic reform and structural transformation would be the focus of the 2014 work deployment.
President Xi first proposed the BRI in 2013. It comprises the Silk Road Economic Belt, with six development corridors, and the 21st-century Maritime Silk Road. According to the State Council Information Office of China, the initiative aims at promoting policy coordination and the connectivity of facilities, unimpeded trade, financial integration, and a people-to-people bond in the international community. This can be summarized as the five-pronged approach [23]. In 2015, to further promote the implementation of the BRI, the State Council of China issued the “vision and actions on jointly building the Silk Road Economic Belt and 21st-Century Maritime Silk Road” (hereafter, Vision and Actions). Under this initiative, 18 provincial-level divisions were designated as key development areas and assigned different roles in the implementation of this strategy. This assignment is attributed either to their connected history with the ancient Silk Road or strategic geographic position [24]. A few node cities were also highlighted in the announcements. The BRI involves open cooperation and new multilateral financial instruments designed to lay infrastructural and industrial foundations to secure and strengthen China’s relationships with countries in the subregions of Asia, Europe, and Africa. The BRI is China’s most important international economic strategy in recent years. Moreover, this initiative is devised to reconfigure China’s external sector and promote its continuous and strong growth [25].
A great deal of research pertains to the BRI’s effect on economic development in various aspects of trade, overseas direct investment, financing, industry upgrading, corporate innovation, and economic growth. Previous studies primarily reveal the positive effect of the BRI on these aspects [26,27,28,29]. However, there have been few attempts to evaluate the effect of the BRI on China’s domestic TFP growth. Several questions loom especially large. As developing countries such as China have suffered from inadequately honed goods and factor markets [30], would the assumptions of a more open trade policy’s positive impact on TFP hold for them? As China faces numerous bottleneck problems in the “new normal” stage [19], can the BRI bring about an economic structure transformation and unleash new opportunities for long-term economic growth? What is the channel through which the BRI could stimulate domestic TFP growth? Which factors impact the effectiveness of this initiative?
The literature has made very little progress in addressing these issues. Based on an evaluation of BRI, this study provides new evidence of the positive causal link between increasing openness and long-term economic growth. Specifically, this study evaluates the BRI’s impact on 18 key provinces in China, with a focus on TFP. Utilizing a panel dataset of 284 prefectural-level cities from 2007 to 2018, we examine the causal relationship between the BRI and TFP in a DID framework. It also uses the data envelopment analysis (DEA)–Malmquist method for calculating TFP (the DEA–Malmquist model combines the DEA method with the Malmquist index). We apply the five-pronged approach to the BRI to explore the impact mechanism and examine heterogeneity in the effect in terms of geographic location and local government efficiency. We find that the BRI significantly promotes TFP in key provinces; it increases TFP through unimpeded trade, infrastructure connectivity, technical efficiency, and technological progress. The BRI promotes TFP in key coastal provinces belonging to the Maritime Silk Road while having a relatively limited impact on the other key provinces belonging to the Silk Road Economic Belt.
This study’s contributions are reflected in the following three aspects. First, most studies have evaluated the effect of BRI on various aspects of economic development [26,27,28,29]. However, there is scant previous literature on the impact of the BRI on Chinese domestic TFP. This study uses the DID and propensity score matching–DID (PSM–DID) methods to conduct a precise assessment of the impact and provide evidence for the link between trade openness and productivity. Second, it exploits the underlying path of how the BRI can promote TFP from the perspective of the five-pronged approach—the Chinese government’s core assertion—which has not been fully discussed in previous studies. In doing so, we seek to provide evidence from China on the effects of knowledge, and reverse spillovers. Third, it examines how promoting the BRI directly influences economic growth in China, by providing a more precise measurement of real economic development—substituting nighttime light data for GDP per capita data [31].
The remainder of this paper is organized as follows. Section 2 discusses the BRI’s background and reviews the related literature, Section 3 describes measurement of TFP and identification strategies, and Section 4 reports the baseline empirical results and the results of checks on the robustness of the estimations, while Section 5 discusses the mechanism of the BRI’s effect. Section 6 investigates whether the effect is heterogeneous across geographical locations and administrative levels, and Section 7 discusses further economic consequences. Section 8 offers concluding remarks and discusses policy implications.

2. Related Literature

2.1. The Impact of BRI

The BRI was proposed in 2013; since then, much research has been conducted, most focusing on its impact on the economies of participating countries. Sun et al. [32] confirm that BRI promotes economic growth in participating countries. In particular, under the framework of the BRI, the China–Pakistan joint economic corridor has positively influenced the economic development and bilateral trade of both countries [33]. The BRI has also positively influenced trade flows between the Association of Southeast Asian Nations (ASEAN) countries and China [34]. In this regard, it must be noted that BRI investments in trade facilitation are complementary policies that can bring large additional welfare gains and can help spatially spread the benefits, especially for larger urban districts near trade hubs [35]. Other research finds that BRI transport infrastructure projects can significantly reduce shipment times and trade costs. Certain models forecast an increase in the global GDP and that of participating countries by up to 2.9% and 3.4%, respectively [36,37].
In terms of the BRI’s impact on the Chinese economy, previous research has primarily studied its impact on trade, direct investment, industrial upgrading, corporate innovation, and economic growth. In terms of trade, research suggests that the BRI can change China’s development path and trade flow direction [38]. Indeed, the BRI has helped increase China’s export volume [39,40,41] through improvements in the transportation infrastructure of participating countries [26]. From the perspective of direct investment, the BRI is expected to significantly promote China’s overseas direct investment (ODI), foreign direct investment (FDI) inflow, and firms’ outward FDI (OFDI) [27,42,43]. The policy support has significantly alleviated the financing constraints faced by Chinese firms and the debt risks of participating countries [28,44]. It has also facilitated industrial upgradation and corporate innovation [29,45].
Among the limited studies on the impact of the BRI on key provinces, one study finds that the BRI promotes public investment in transportation infrastructure. It also shows that BRI can create a better environment for private investment to strengthen the economic ties among key provinces and achieve joint development [46]. Another study reveals that the BRI has increased the degree of openness in China’s central and western regions, narrowed the income gap between the central and western regions, and promoted balanced regional economic development in China [47]. However, incumbent research neglects the quality of economic development and TFP, which is a long-term driving force. Given this, the existing research provides little supportive evidence for further promoting the BRI in 18 key provinces.
Previous research on the BRI’s impact on TFP mainly utilizes country-level data. The DEA–Malmquist method has been utilized to measure participating countries’ TFP, showing that China’s investment and trade with participating countries have a significantly positive impact on the TFP of participating countries [48]. Similarly, one study measures the green total factor productivity (GTFP) of 56 participating countries. It shows that China’s OFDI significantly promoted host countries’ GTFPs with a decreasing marginal effect [49]. However, the BRI’s impact on the TFPs of key provinces has been rarely investigated, a gap that is bridged in this study.

2.2. Sources of TFP

The concept of TFP originated in Solow’s [50] study of the neoclassical economic growth model, which uses the Cobb–Douglas production function. It interprets the residual of the production function after controlling for capital and labor as the rate of technological progress. This is also known as TFP, which measures the economic and technical efficiency of the process through which resources are converted into products. Extensive research examines the factors influencing TFP. Based on the measurement of the Malmquist productivity index of 30 Chinese provinces, a study shows that technological progress is the cause of differentiated regional development, while improvement in technical efficiency is the actual driving force of TFP [51]. Given China’s national conditions, government expenditures and transfers affect the quality of regional economic growth. A study reveals that government expenditures hinder the optimization of resource allocation and significantly inhibit TFP growth. This occurs when inefficient firms are unwilling to withdraw from operations and seek policy protection from the government [52]. Conversely, the government’s fiscal expenditures, tax preferences, and intellectual property protection policies are considered effective in promoting TFP growth in the service industry [53]. An analysis of historical data regarding industrial structure and productivity shows that the proportion of each industry in GDP changes synchronously with productivity—from low to high. This change is reflected in the continuous increase in the proportion of secondary and tertiary industries [54]. Theoretical studies on economic growth show that improvement in economic growth and productivity depends on the accumulation of knowledge and improvement in human capital. An empirical analysis of provincial panel data illustrates that promoting high-tech human capital exerts a threshold effect on TFP. In other words, high-tech human capital plays a greater role in regions with low TFP than in regions with high TFP [55]. Scholars also argue in favor of regional differences in the role of the types of human capital in terms of improving TFP [56]. Primary human capital in the western region and secondary human capital in the central and eastern regions are the main driving forces that absorb technology spillover from international trade. Therefore, this study considers and controls for factors likely to have a significant impact on TFP.
This study also examines the impact from the perspective of the five-pronged approach. It is the main component and key development plan of the BRI [24]. Given its focus on infrastructure connectivity and unimpeded trade, we refer to the existing literature on the impact of infrastructure, FDI, and OFDI on TFP. This helps us to construct the conceptual framework for the underlying mechanism of the BRI’s impact on Chinese domestic TFP. From the perspective of the connectivity of facilities, investments in infrastructure and fixed assets are highly correlated with TFP [57]. For example, the railroads constructed during the British Raj decreased trade costs and increased interregional and international trade, promoting local productivity along the tracks [58]. Specifically, from the perspective of infrastructure’s possible spatial spillover effect on TFP, transportation infrastructure plays a significant role in promoting TFP development with both a spatial spillover effect and heterogeneity among regions [59].
However, there is considerable debate on whether FDI can bring the spillover effect of advanced technological knowledge to the host country and improve TFP. An empirical analysis of TFP in Mexican manufacturing industries, the Uruguayan manufacturing sector, and US firms shows a positive FDI spillover effect [60,61,62]. However, other studies employ different methods to question the positive spillover effect of FDI on developing countries. Indeed, FDI can also have an inhibitory effect on the TFP of host countries [63,64,65]. Empirical studies on China indicate that an increase in FDI is key to Chinese TFP promotion. It can drive transformation and upgrade the economic growth channels [66,67,68,69,70]. However, studies also find that the spillover effect of FDI on China is not obvious [71]. These studies suggest that this effect can be caused by a trade-off between the FDI spillover effect and the substitution effect of technology import on innovation activities [72].
Similarly, research about OFDI’s reverse spillover effect on home countries [73] has not been conclusive. Nonetheless, OFDI is discussed less often than FDI. Direct investment by Japanese enterprises in the United States focuses on industries with intensive R&D and their ability to better absorb and share the host’s advanced technologies. From a different perspective, the United Kingdom’s OFDI in countries with low labor costs aids its technological progress [74]. This indicates that enterprises can also be motivated to conduct OFDI in host countries with low labor costs and benefit from the cost advantage to improve the productivity of parent companies in the home economy. However, studies also question the significance of OFDI’s reverse spillover effect and even advocate an inhibitory effect of OFDI on home countries’ TFP [75,76]. Based on evidence from China, OFDI’s positive effect on TFP is mostly confirmed [77]. Nevertheless, FDI exhibits a non-linear threshold effect, with regional heterogeneity among provinces and different effects on different target host countries [78,79,80]. By including FDI and OFDI in a holistic framework, an empirical analysis reveals that FDI and OFDI have brought positive and reverse spillover effects to China’s TFP. It also reveals that they have brought direct investment from or in the European Union, Japan, and the United States [81]. Therefore, unimpeded trade reflected by FDI and OFDI is a potential impact path of the BRI on TFP that needs to be empirically tested.
In summary, there is scant research evaluating the BRI’s impact from the perspective of Chinese regions and key provinces. Additionally, the relationship between the BRI and the long-term driving force of economic development, TFP, has not been sufficiently discussed. This study searches for answers to these questions by empirically testing the following hypothesis:
H1
The BRI promotes TFP in key provinces through the five-pronged approach.

3. TFP and Empirical Strategy

3.1. Measurement of TFP

Following Zhou, Li, and Li [59], we proxy the labor input index by the number of employees in urban areas in each city at the end of each year. We employ the method proposed by Goldsmith [82] and the perpetual inventory method to estimate capital stock via the following formula:
K i t = I i t + 1 δ K i t 1
where K i t denotes the capital stock of prefecture-level city i in year t, I i t is i’s fixed-asset investment in year t, and δ is the depreciation rate, taking a value of 10.96% for China [83,84]. We employ the GDP of each city as the output indicator. To ensure data reliability, we use 2020 as the base period and obtain the real GDPs of all cities. The DEA–Malmquist model is used to measure the TFP of 284 prefecture-level cities in China from 2007 to 2018. DEA is a non-parametric method that takes the evaluated object as a decision-making unit, constructs the objective function without unifying the dimensions of the indicators, and transforms the non-linear programming problem into a linear problem, expressed as the ratio of output to input. The value obtained by this model is used to measure the increase in TFP over the previous year [85].

3.2. Econometric Model

We divide the prefecture-level cities into four sub-samples: the treatment group (key provinces) and the control group (other provinces) before and after the implementation of the BRI. Accordingly, the benchmark regression specification of the DID model can be defined as follows:
T F P i t = β 0 + β 1 k e y r e g i o n s i t + β 2 p o s t i t + β 3 B R I i t + β 4 X i t + ε i t B R I i t = k e y _ r e g i o n s i t × p o s t i t ,
where the subscripts t and i denote the t-th year and the i-th prefecture-level city, respectively; X i t represents a series of control variables; ε is a random disturbance item; and the interaction term k e y _ r e g i o n s i t × p o s t i t is the net BRI effect. If the BRI promotes the economic development of key provinces, the coefficient β 3 would be significantly greater than zero.

4. Empirical Results and Robustness Checks

4.1. Data

According to Vision and Actions, among the designated 18 key provinces, the Silk Road Economic Belt comprises eight provinces (Xinjiang, Shaanxi, Gansu, Ningxia, Qinghai, Chongqing, Yunnan, and Guangxi), and the 21st-Century Maritime Silk Road comprises five provinces (Shanghai, Fujian, Guangdong, Zhejiang, and Hainan). The other five key provinces are Inner Mongolia, Heilongjiang, Jilin, Liaoning, and Tibet. This study employs data from 284 prefecture-level cities across China, over the period 2007–2018. We collect data from the China city statistical yearbook, China regional economic statistical yearbook, China’s stock market and accounting research database, and WIND economic database. We merge the data according to the city and year to create the sample for the empirical analysis. This process yields 3408 observations. Although the study accounts for some of the missing data via interpolation to maintain a high degree of data consistency, areas with a significant number of missing observations are excluded.
Table 1 defines the main explanatory variable. Treat equals 1 if a prefecture-level city belongs to a key designated province; otherwise, it equals 0. Post indicates whether the BRI has been launched; it equals 0 before 2014 and 1 in or after 2014. Based on the literature review in Section 2.2, we incorporate a series of control variables, including the industrialization level, industrial structure, human capital, technology, urban employment rate, per capita income, fixed-asset investment, and government intervention. Table 1 presents the detailed definitions. All continuous variables are winsorized at the 1% and 99% percentiles to limit the influence of extreme values.
For the underlying mechanism analysis, we use infrastructure investment as the proxy variable for the connectivity of facilities and FDI and OFDI as the proxies for unimpeded trade. Table 2 reports the descriptive statistics of all variables.

4.2. Baseline Estimates

First, we employ Equation (2) to evaluate the net BRI effect on the TFP of key provinces and its decomposition indicators—technical efficiency and the technological progress rate [51]. Table 3 reports the main estimation results. Column (1) shows the estimation results without incorporating the control variables. Columns (2), (3), and (4) show the results after adding the control variables and replacing the explained variable with the two decomposition indicators of TFP. As the results in Table 3 show, the coefficients of the policy variables are significant in all regressions. Thus, the BRI improves the TFP of key provinces by promoting technical efficiency and the technological progress rate.

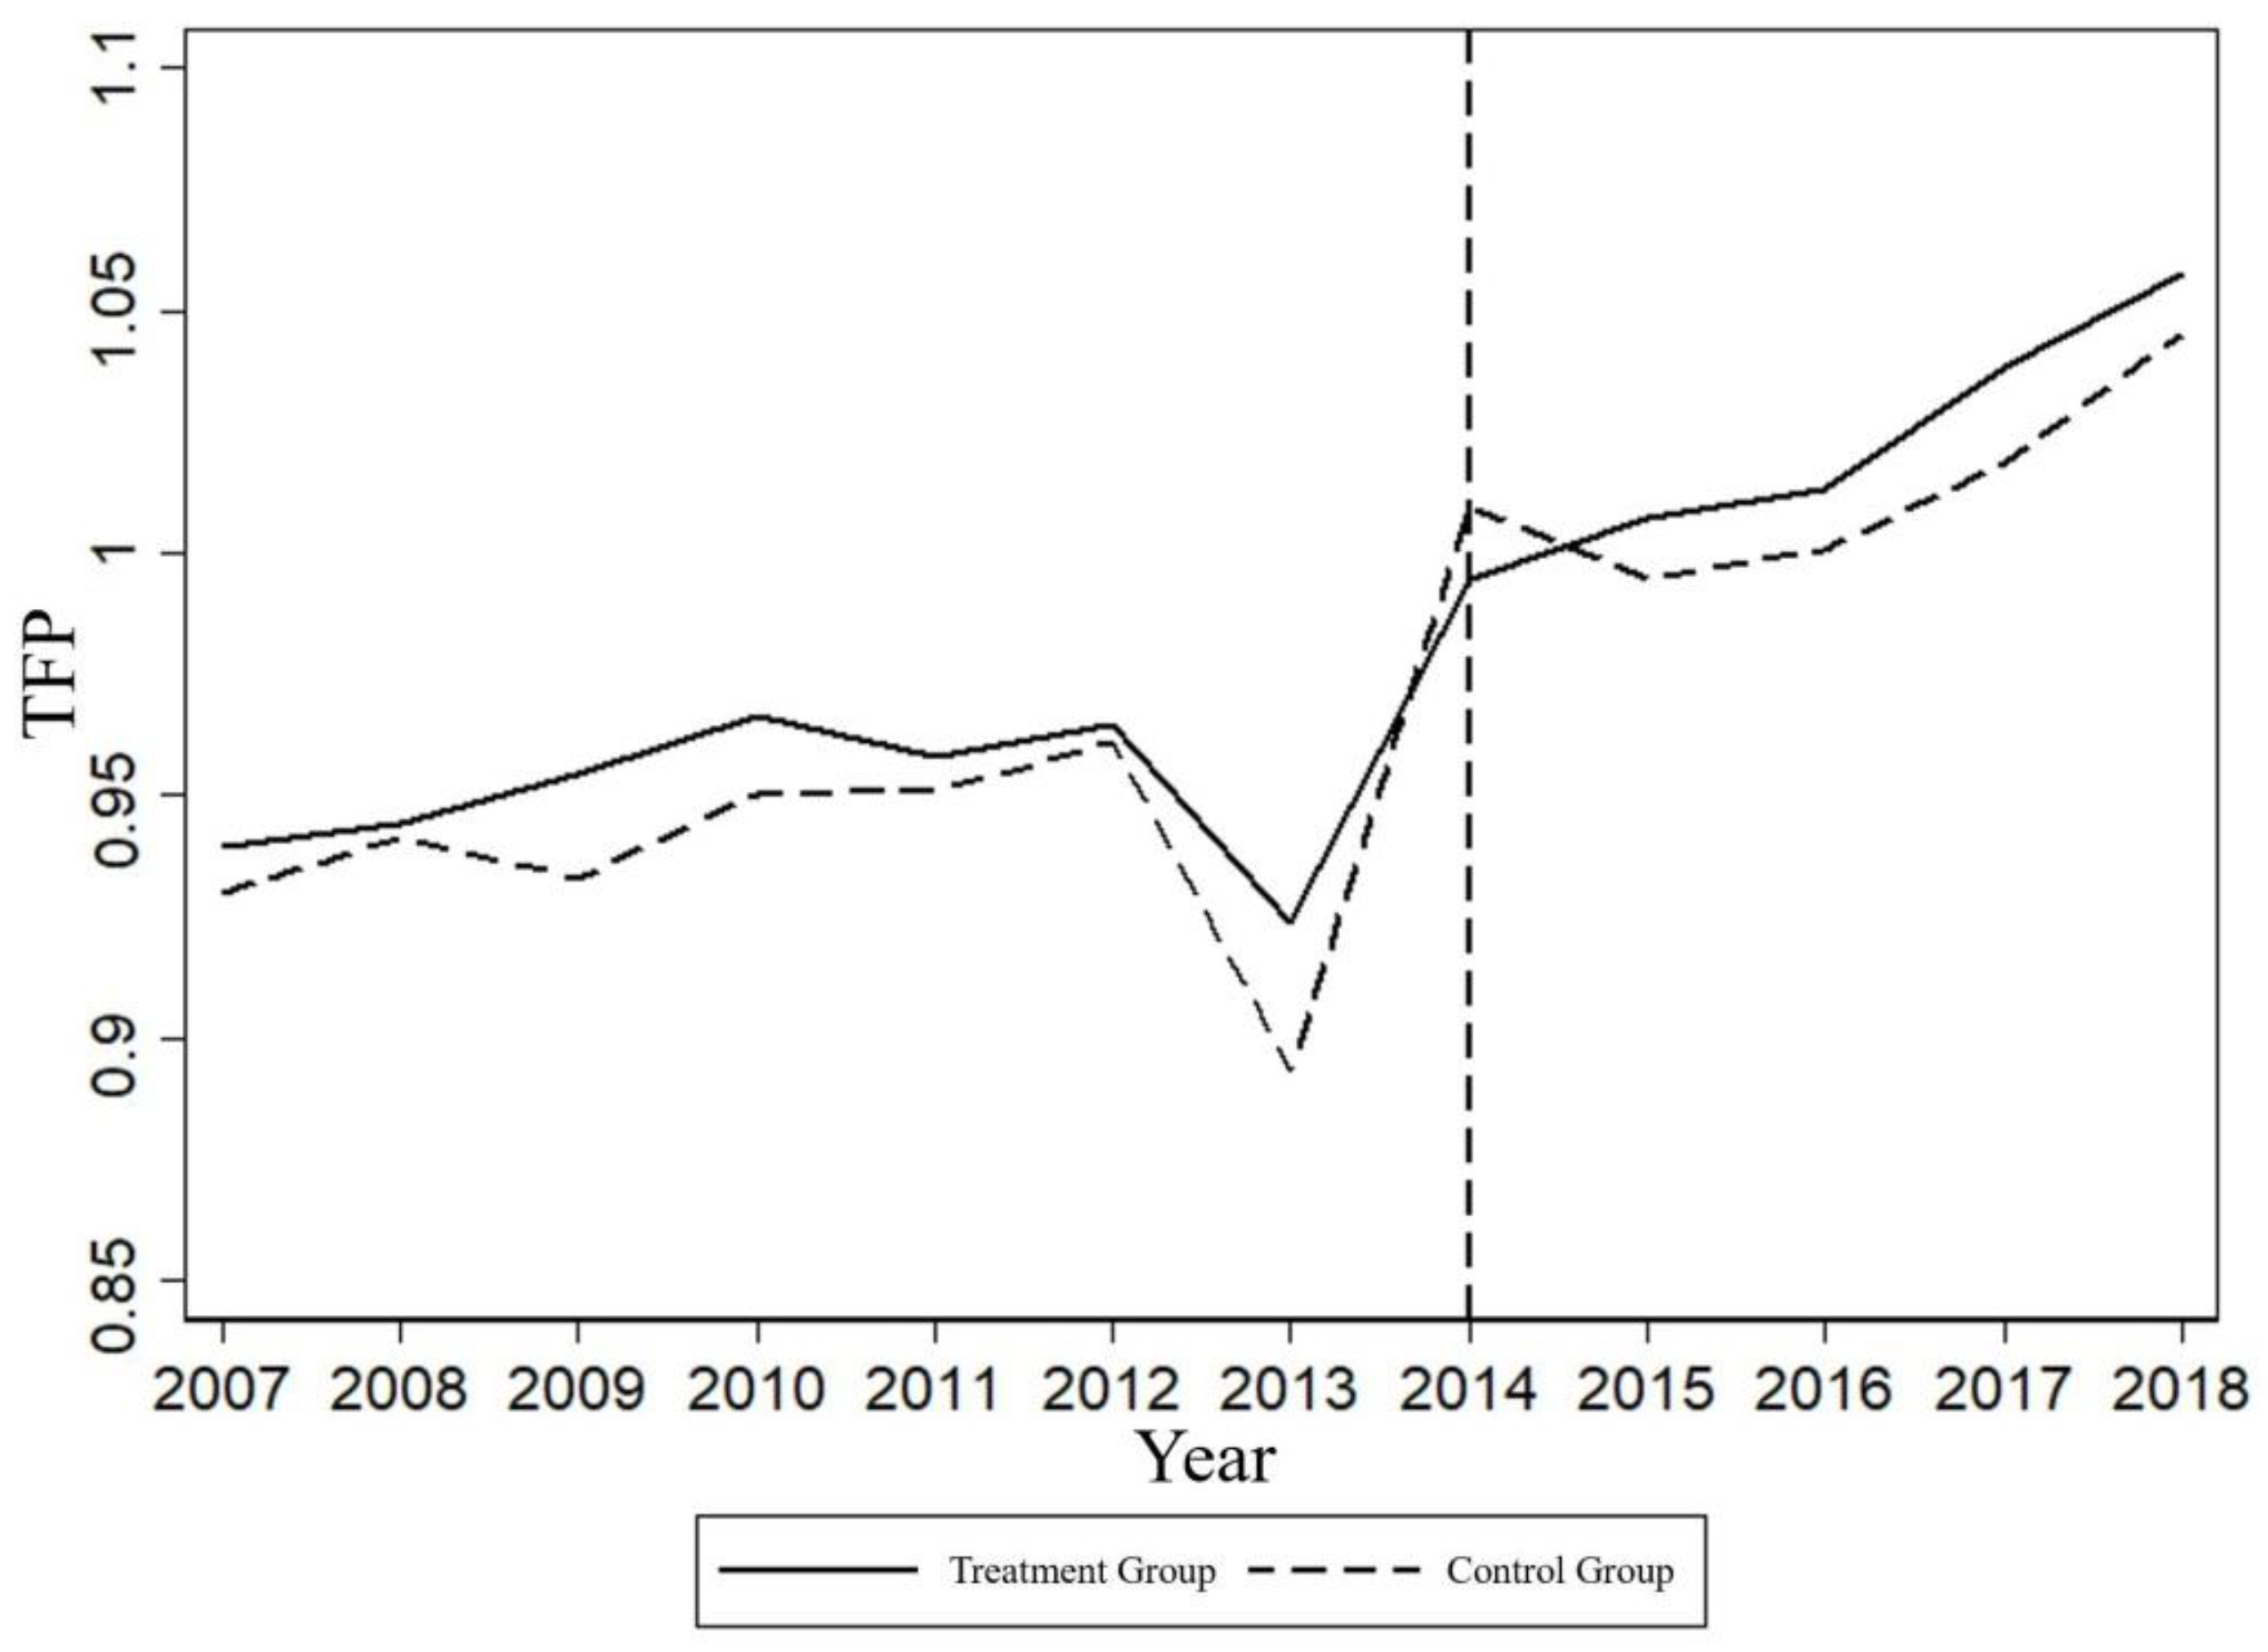
4.3. Testing Pre-Trends and the Dynamic Effect

The DID method assumes that the treatment and control groups have a parallel trend before the event. As shown in Figure 1, the TFP trend of the treatment and control groups is similar before the official BRI launch in 2014.
After implementation, the average TFP of the treatment group increases more rapidly than that of the control group. In the years before the BRI launch, none of the coefficients of the lagged policy variables are significant, indicating no difference in TFP between the treatment and control groups. We exploit the exact timing of the policy implementation to test whether the increase in TFP corresponds to or precedes the implementation. Hence, we estimate Equation (2) by substituting the BRI variable B R I i t with a full set of dummies, ranging from 7 years before the implementation of the BRI to 4 years after the implementation. Particularly, we estimate
T F P i t = β 0 + β 1 B R I i t × B e f o r e 7 + β 2 B R I i t × B e f o r e 6 + β 3 B R I i t × B e f o r e 5 + + β 7 B R I i t × B e f o r e 1 + β 8 B R I i t × A f t e r 1 + β 11 B R I i t × A F t e r 4 + β 12 X i t + μ i + σ t + ε i t .
We replace the regressor k e y _ p r o v i n c e i t × p o s t i t in Equation (2) with k e y _ p r o v i n c e i t × Y e a r _ d u m m y , where Y e a r _ d u m m y represents the year dummies from 2007 to 2018, with 2014 as the reference group. Table 4 shows the corresponding results. The interaction terms from 2007 to 2013 are insignificant and are consistent with Figure 1, which confirms the parallel trend before the implementation of BRI.
The BRI is committed to maintaining a global free trade system and an open world economy. It also conforms to the current trend of global economic development. In this regard, it strengthens and promotes China’s high-quality open economy development. The role of growth is affected by local government participation and other supporting policies. The successive publicity and implementation of the BRI have gradually deepened local governments’ understanding of the initiative. This has improved their relevant policies and increased their capabilities to execute these initiatives. As seen in Table 4, after the implementation of the BRI in 2014, the significance of the coefficient witnessed a year-on-year increase from 2015 to 2018, and its value increases gradually. These results depict dynamic effects. The BRI policy effect records a gradual increase after implementation, with various regions responding to the state’s call. The deepening of the implementation gradually improves policies and related support facilities in various regions. This leads to the implementation of detailed guidance plans. Given this, the impact of BRI on TFP development in key provinces exhibits a dynamic effect.

4.4. Testing Policy Endogeneity

There might be policies or influencing factors other than the BRI that may induce TFP improvement during the same period. To rule out the possibility that TFP might have been enhanced by other contemporaneous policies, following Chen, Wei, and Tong [86], we perform a placebo test by falsifying the policy initiation year. We assume that the BRI was proposed two or three years before the actual date and observe the coefficient and significance of the policy variable. If the estimated coefficient of the policy variable is insignificant under the two placebo tests, the BRI promotes TFP growth in key provinces. If the two falsified policy variables are significant, the BRI implementation does not necessarily promote TFP growth in key provinces. Table 5 presents the results. When we assume that the BRI was proposed in 2011 or 2012, the estimated coefficient of the interaction term is not significant. Thus, BRI implementation promotes the TFP growth of key provinces without interference from other policies or factors.
We also conduct a placebo test to exclude the influence of unobservable random disturbances on TFP development in key provinces. From Equation (2), the estimated values of the BRI policy coefficients are obtained as follows:
β 1 ^ = β 1 + γ c o v ( B R I i t , μ i t | c o n t r o l ) v a r ( B R I i t | c o n t r o l ) ,
where c o n t r o l includes all the control variables. If the estimation of β 1 is unbiased, then γ should be zero. It is impossible to judge whether γ is 0 and directly test whether the estimated coefficient of β 1 is affected by unobservable random disturbance items. Therefore, we set a falsified variable of the BRI policy variables ( B R I _ f a l s e i t ), using a simulation method of randomly assigning values to the cities in the treatment group. Ideally, d i d _ f a l s e i t would have no effect on TFP development in key provinces. Under this setting, if β 1 ^ = 0 is still obtained, γ can be inferred to be 0.
The process is repeated 1000 times to ensure that the placebo test effectively identifies causality. Figure 2 shows the probability density distribution diagram of the estimated coefficient of the BRI policy variables. Accordingly, the estimated values of the randomly generated policy variables are densely distributed around zero. Thus, γ = 0 can be deduced to verify whether no unobservable random disturbance term affects the causal conclusion—the randomly generated BRI policy variables have no impact on the TFP of key provinces. Therefore, the positive and significant BRI impact on the TFP development in key provinces is not affected by unobserved random disturbances.
A suitable control group is essential for the accuracy and credibility of the DID method [87]. This study sets non-key provinces as the control group, ignoring the inherent differences in economic development and other aspects between cities in the treatment and control groups. This may cause the DID method’s estimation results to be unreliable. We employ the PSM method to match cities in the treatment group with those in the control group to reduce the systemic bias and other endogeneity problems of the DID method. Thus, we overcome the systematic differences in the economic growth trends between the treatment and control groups. We conduct logit regressions on the control variables to obtain the PSM. To perform a robustness check, we employ three common matching methods (nearest neighbor, radius, and kernel density matching). Table 6 presents the results.
From Table 6, nearest neighbor, radius, and kernel density matching generate the same results. The coefficients of the DID term are significantly positive at the 5% level. Therefore, the BRI significantly promotes the TFP growth of key provinces, further verifying the main findings.
An important premise of the DID method is that the treatment and control groups’ selection is random, which may not be the case in this study. Unobservable factors might have influenced the designation of key BRI provinces (regions). Regions with a higher level of economic development may first be used as key provinces to further promote BRI implementation. However, regions with lower economic development may also be selected. Therefore, the choice of treatment group may be susceptible to endogeneity. Given the potential endogeneity of the policy variable, we determine an instrumental variable (IV) under the following two conditions: an IV is (1) related to the endogenous variable and (2) unrelated to the random error term. The two-stage least squares method is adopted for the estimation. In determining the IVs, Duranton, Morrow, and Turner [88] use the exogenous variation in exploration routes between 1528 and 1850, railroad routes circa 1898, and the interstate highway system in 1947. They are used as the IVs of the modern network of interstate highways to assess the impact on trade composition in US cities.
The BRI concept is inspired by the ancient Silk Road, which witnessed decades of years of booming trade and cultural exchanges in the Eurasian continent. Therefore, we select the ancient Silk Road route provinces as IVs, following Duranton, Morrow, and Turner [88]. Although the BRI aims to revive the ancient Silk Road, they are far apart in time, and the latter indirectly affects the TFP of the key provinces. Thus, the ancient Silk Road satisfies the two conditions of an IV. The specific setting is that if a key province is among the ancient Silk Road provinces (Shaanxi, Ningxia, Gansu, Qinghai, Xinjiang, Tibet), IV = 1; otherwise, IV = 0. Concurrently, IV × Post is selected as the IV for the interaction term BRI. Table 7 shows the corresponding results after the IV adoption.
The regression results in Column (1) confirm the rationality of using the ancient Silk Road route provinces as IVs. The F value from the Cragg-Donald test is greater than 10, indicating that the IVs are highly correlated with the endogenous variable in the first-stage regression. Column (2) shows the regression results for the second stage. The coefficient of BRI is 0.0308, significant at the 1% level. Thus, after alleviating potential endogeneity problems, the basic findings remain unchanged.

4.5. Removal of Confounding Effects

We modify Equation (2) by incorporating lagged control variables for a robustness check to mitigate the influence of the current data. Moreover, we remove observations from 2013, when the BRI was proposed. During policy formulation and implementation, ethnic minority areas can receive more policy preferences and support. Therefore, we remove ethnic minority areas to control for the confounding effects. By removing observations after 2016, we remove the confounding impact of the supply-side reform (proposed in November 2015 and implemented afterward) on TFP. Table 8 reports the regression results; BRI coefficients in all four regressions remain significant.
Following Zhang, Wang, and Wang [89], this study utilizes the generalized method of moments (GMM) in two estimations for a robustness check, to further control for potential endogeneity by unobserved variables. Table 9 reports the test results of Equation (2). BRI coefficients in the two regressions remain significant.
Given that province- and prefecture-level variables are included in the regression, we utilize a hierarchical mixed model to re-estimate Equation (2). Martin et al. [90] note that a hierarchical mixed model is more suitable for separating provincial- from prefecture-level impacts. Table 10 presents the results.
Previous tests cluster the observations at prefecture-level cities, while the division of key provinces is based on the provincial level. Table 10 shows the results of clustering observations at the provincial level. The interaction term remains significant. The number of clusters is less than 50, inducing bias in standard errors. A wild bootstrapping method, that is, bootstrapping the residual clusters, is recommended to estimate the standard error [91,92,93]. This method corrects the intra-cluster correlation; when the number of clusters is less than six, a reliable inference can be generated. Thus, we utilize this bootstrap method to conduct further robustness checks by clustering the observations at the provincial level with 1000 bootstraps. In parentheses, we report the t values of the regression coefficients with corrected standard errors. The conclusions tally with the baseline regression results in Table 3.
The results obtained from the GMM, hierarchical mixed regression, and those obtained after clustering at provincial levels and after replacing the TFP generated from the stochastic frontier analysis are all consistent with the baseline estimates (The results are similar and are hence not reported. However, they are available upon request). This shows that the measurement error does not significantly interfere with our estimation Given this, the BRI’s positive effect on promoting the TFP of key regions can be considered robust.
We further verify the study’s robustness by conducting a simultaneous quantile regression with 1000 bootstraps [94]. Specifically, we perform regression analysis on the 20th, 50th, and 80th TFP quantiles using Equation (2). The advantage of using this estimate is that it allows us to test how the BRI affects the TFP of cities with different capacities. The results in Table 11 are consistent with the baseline results in Table 3. There is a pronounced positive correlation between the BRI and TFP. For cities with low TFP levels, the BRI provides timely assistance regarding TFP development. However, for cities with high TFP levels, the BRI further enhances TFP. The BRI also exhibits a positive impact on regions with intermediate TFP.
This study measures TFP using an alternative method. We test the robustness of the TFP calculated using the stochastic frontier analysis based on the Cobb–Douglas production function [95]. Table 12 reports the detailed test results using Equation (2). The interaction term still passes the statistical test at the 1% level.

5. Underlying Mechanism

The State Council of China [24] announced that the promotion of the five-pronged approach comprises the focus and main component of the BRI, which was determined at the inception of the initiative. Thus, it is suitable and cogent to explore the BRI impact mechanism for TFP from the perspective of the five-pronged approach (Similar studies have adopted this practice, such as Lyu et al. [22]). Based on the discussion in Section 2.2, we consider the connectivity of facilities and unimpeded trade as the most essential paths of this approach in terms of domestic TFP growth. According to President Xi’s speech [96] at the Belt and Road Forum for International Cooperation, we are witnessing the emergence of a multi-dimensional infrastructure network supported by major railway and port projects under the BRI, featuring land–sea–air transportation routes and the information expressway. Therefore, we describe the connectivity of facilities in terms of both transport and communication facilities [97]. Further, we fit one index of the proxy variable for transport facilities through the three indexes of railway freight volume (mt/km), port container throughput (TEU), and air freight volume (mt/km). For communication facilities, we calculate the average number of Internet users per 100 people, the number of fixed telephone users per 100 people, and the number of rentals of mobile cellular wireless communication systems per 100 people [98]. When describing the achievement in promoting unimpeded trade, President Xi [96] emphasized that the OFDI of China in the BRI participating countries has surpassed US$50 billion. The efforts toward achieving unimpeded trade have been promoting trade and investment facilitation and improving the business environment [99]. Since this would positively influence the ODI, we use FDI and OFDI as proxies for the degree of unimpeded trade. We add the proxies of these two approaches and their interaction terms with the BRI into Equation (2) and obtain the following regression formula. The following regression formula helps us identify whether there is an impact mechanism of the BRI on TFP from the perspective of the approach:
T F P i t = β 0 + β 1 B R I i t + β 2 F i v e _ P r o n g e d i t + β 3 B R I i t × F i v e _ P r o n g e d i t + β 4 X i t + + μ i + σ t + ε i t
where F i v e _ P r o n g e d i t denotes transport facilities, communication facilities, FDI, and OFDI. This is shown in the four columns of Table 13, which reports the estimated results of Equation (5).
Columns (1) and (2) examine the effect path of the connectivity of facilities from two perspectives. The coefficients of transport facilities and communication facilities and their interaction terms with the BRI are all positive and significant, indicating that cities in key provinces can obtain more infrastructure investment with BRI policy support. Through this promotion of facilities, these regions can reduce information communication costs, time costs of human capital accumulation, and transportation costs of material capital to improve their TFP. In this context, it must be noted that better infrastructure construction and the development of foreign trade opportunities brought about by the BRI can promote the agglomeration of relevant industries in a region. The industrial agglomeration effect can increase internal competition in an industry and improve TFP at the local urban level.
However, we should be cautious about the results in Column (2), given that the Chinese government issued the broadband China strategy and upgraded broadband construction as a national strategy in 2013 (the BRI launch year). To this end, it invested 40 billion yuan in broadband construction in 2015 [100]. Therefore, we may not be able to distinguish between the improvements in transport facilities brought about by these two BRI strategies. Column (3) of Table 13 reports the policy effect of the BRI on TFP from the perspective of unimpeded trade. We find that the mutual direct investment between China and other economies along the route has significantly increased after the BRI implementation. Furthermore, the estimated coefficients of the interaction terms BRI × FDI and BRI × OFDI are significantly positive, which shows that the mechanism of TFP’s promotional effect on unimpeded trade is significant. In this context, it must be noted that, after the BRI implementation, there has been an increase in FDI inflows into China with the spillover effect of advanced technological knowledge or increased competition brought by new entrants. This has resulted in improving the TFP of key provinces. In addition, considering that most of the countries participating in the initiative are developing countries, OFDI can bring additional markets and result in lower labor costs for Chinese enterprises. This will help the enterprises to make use of these advantages to improve the productivity of parent companies in China. As stated earlier, the BRI has increased OFDI, and thus improved TFP. This can be attributed to the fact that, amidst the demands of an export-oriented economy, there was an increase in the scale of export-oriented enterprises such that the demand for foreign trade compelled Chinese enterprises to transform into international businesses with higher productivity. This resulted in the upgradation of the urban industrial structure in the regions where the enterprises are located, excluding the backward production capacity. These positive effects were manifested by the increase in TFP at the urban level.

6. Heterogeneity Test

In terms of the initiative layout and mode of transportation, the BRI can be divided into the Silk Road Economic Belt and the 21st-Century Maritime Silk Road. According to the description of the regional opening plans of the Vision and Actions [24], we regard Shanghai, Fujian, Guangdong, Zhejiang, and Hainan as belonging to the 21st-Century Maritime Silk Road and other provinces as belonging to the Silk Road Economic Belt. We believe that although these provinces are designated as key provinces, there are significant differences in the implementation priorities, development levels, and historical factors of the provinces. Conversely, the provinces belonging to the 21st-Century Maritime Silk Road are relatively more developed areas along the eastern coast of China, with relatively higher levels of initial economic development. Therefore, in the analysis, it is necessary to distinguish the key provinces belonging to the two roads. Columns (1) and (2) of Table 14 list the grouping regression results. The BRI estimation coefficient in Column (1) is significantly positive. Conversely, the results in Column (2) show that the BRI plays a relatively limited role in promoting TFP in the provinces of the Silk Road Economic Belt, though they are also designated as key provinces. This result indicates that the BRI mainly improves TFP in the five key provinces belonging to the 21st-Century Maritime Silk Road. This can be attributed to the better economic conditions of these regions, the cost advantage of shipping, better infrastructure, and the business environment. These advantages help these provinces outperform the inland provinces of the Silk Road Economic Belt in internal domestic competition to attract FDI, thereby making the BRI’s effect on promoting TFP more significant.
The BRI is a policy proposed by the Chinese central government and implemented by the local governments of 18 key provinces. Therefore, we conduct a differentiated investigation into whether the BRI policy effect depends on the degree of enforcement by local governments. Research on government quality and governance shows that government efficiency (Gov-Efficiency) can be measured by government anti-corruption strength, scale, and administrative efficiency [101,102]. Therefore, following Li [103], this study constructs a comprehensive index to measure government efficiency through a principal component analysis (PCA) of these three indexes. Anti-corruption strength refers to the natural logarithm of the number of corruption cases per million people in a region. The government scale is expressed as the total fiscal expenditure/GDP. Government administrative efficiency is measured by 1 minus the ratio of administrative fees/total financial revenue. In Columns (3) and (4) of Table 14, based on whether government efficiency is higher than the overall average value, we divide prefecture-level cities across China into two groups—High Gov-Efficiency and Low Gov-Efficiency. As shown in Table 14, the estimated coefficient of the High Gov-Efficiency group is positive and significant. This indicates that the initiative is better implemented in areas with higher government efficiency. The local government has utilized BRI policy resources and benefits, significantly improving the area’s TFP. However, the BRI promotion effect is not evident in areas with lower administrative efficiency. The results of this heterogeneity test illustrate the key role of local governments in BRI implementation.

7. Further Analysis of Economic Consequences

In the context of implementing coordinated development between regions, it must be noted that the spatial aggregation of industries and the choice of investment locations lead to spatial spillover effects in economic development. In other words, economic growth is not locally limited but spreads to surrounding areas. After BRI implementation in key provinces, the increase in financial and other investments promoted development in these provinces. However, it is not clear whether the cities located at the borders of the policy areas also reap the beneficial effects of the BRI policy. Thus, this study sets a new dummy variable, Neighbor, to assess the spatial BRI spillover effects. If a city is located at the border of a key province of the BRI, Neighbor equals 1; otherwise, it is 0. We regress Equation (2) with Neighbor × Post, substituting the BRI. Table 15 presents the estimation results. The coefficient of Neighbor × Post is positive and significant, indicating that the BRI promotes TFP development in surrounding areas.
This study further assesses whether the BRI promotes the economic growth of regions along the route by promoting TFP development in the key regions. We integrate the defense meteorological satellite program (DMSP)/operational linescan system (OLS) (DMSP/OLS) and the Suomi national polar-orbiting partnership (NPP)/the visible infrared imaging radiometer suite (VIIRS) (NPP/VIIRS) nighttime data in a deep learning-based intercalibration. These data act as proxies for economic development when we conduct a direct assessment of the BRI effect on economic growth for a more accurate estimation. This contrasts with previous studies using GDP per capita as the measure of economic development. The nighttime light data have been widely used as a substitute for GDP per capita to alleviate data distortion caused by human factors and political incentives. They provide a more precise measurement of real economic development [31]. Table 15 reports the DID estimation results of the following regression:
N i g h t t i m e   L i g h t i t = β 0 + β 1 B R I i t + β 2 T F P i t + β 3 B R I i t × T F P i t + β 4 X i t + μ i + σ t + ε i t
The use of the nighttime light intensity as the dependent variable, instead of GDP per capita to proxy for economic development, allows this processing method to provide a more precise measurement, particularly considering the distortions in accounting mechanisms and incentives for the promotion of officials. From the regression results in Table 16, irrespective of whether the Province × Year fixed effect is added, the regional nighttime light remains significant at the 1% level as the explained variable. Thus, the BRI effectively promotes economic growth in the regions along the route.

8. Conclusions and Policy Implications

This study adopts the DEA–Malmquist method and calculates the TFPs and the decomposition indicators of 284 prefecture-level cities in China. Based on the varying degrees of benefits different regions receive from the initiative, we conduct a quasi-natural experimental design to evaluate the impact of the BRI on the TFP of key provinces using a DID framework. This is similar to the design of Lu and Yu [18] that uses China’s WTO accession as an exogenous shock to explore the effect of high openness on resource misallocation. Both studies contribute to the literature by identifying another potential channel through which further opening up can benefit an emerging economy.
The empirical results show that the BRI has significantly promoted the TFP in key provinces, and the promoting effect is consistent in various robustness checks. The results also confirm the existence of the spillover effects. Based on a decomposition of TFP, we find that the BRI increases TFP through technical efficiency and technological progress. The BRI also demonstrates dynamic effects, characterized by a stronger year-on-year impact. Contrapuntally, this study uses the initiative’s own focus, the five-pronged approach, to explore the possible underlying mechanisms. We find that the BRI can promote TFP growth through the connectivity of facilities and unimpeded trade. Furthermore, the BRI’s impact on TFP also exhibits heterogeneous effects in terms of geographic location related to the two parts of the BRI and the implementation capacity of local governments in China. This helps in promoting TFP growth in the coastal key provinces of the 21st-Century Maritime Silk Road in the eastern region or in cities with a higher degree of government efficiency. Finally, to further explore the direct impact of the BRI on economic development, we use the nighttime light intensity of cities as a proxy for economic development, instead of GDP. This helps us to provide a more precise measurement. The result reveals the BRI’s positive effect on economic development in China in terms of key provinces along the route.
In the context of China, our findings provide new evidence of the fact that a positive linkage between greater openness and growth still holds in the 21st century for developing countries [7]. Our study also implies that openness works through an improvement in TFP, which is consistent with the research of Alcalá and Ciccone [9]. Concerning the discussion on the potential bidirectional causality between further opening up and productivity growth [5], we use the DID framework design to confirm the one-way causality that increasing openness will lead to TFP growth. Conversely, in terms of the academic discussion regarding knowledge spillover [62,63] and reverse knowledge spillover effects [73,76], we develop a quasi-natural experimental design based on the BRI. To this end, we analyze the interaction terms between FDI, OFDI, and the BRI. The results confirm the positive knowledge spillover and reverse knowledge spillover effects on TFP in China.
This study has important policy implications for the further promotion of the BRI in China. Moreover, China, as the BRI sponsor, seeks to improve domestic TFP growth by implementing an export-oriented international cooperation strategy. This factor can provide insights into aspects that must be considered during the design and implementation of an international cooperation strategy for a developing country. This study takes another step toward interpreting the focus of this initiative and its underlying mechanism. Based on this, it suggests that the government should strengthen multilateral cooperation and accelerate the expansion of infrastructure projects. To this end, the study recommends that the government invest in infrastructure construction in collaboration with firms and financial institutions. It is also necessary to encourage local enterprises to “go global” by further increasing FDI and OFDI, thus promoting TFP in collaboration with multinational enterprises. Concurrently, constructing relevant infrastructure can also provide a vital foundation for attracting FDI and encouraging OFDI by Chinese companies. Based on the results obtained in the heterogeneity test, we conclude that BRI mainly promotes TFP in the coastal key provinces belonging to the 21st-Century Maritime Silk Road. However, it exerts a relatively limited impact on the other key provinces belonging to the Silk Road Economic Belt. This result may be attributed to the relatively higher degree of economic development in coastal areas or the efficiency advantages of shipping, relative to land transportation. This indicates that the local economic structure plays a key role in absorbing the benefits of an economic policy aimed at serving two different roads. This finding is consistent with the research of Becker, Egger, and von Ehrlich [104], who find that only the European Union member states with sufficient human capital and adequate institutions utilize transfers from the European Commission and realize greater economic growth. This heterogeneity in terms of local institutions’ ability suggests that more resources should be allocated to those regions with higher efficiency when further opening up is regarded as the new driving force of economic development.
Finally, we highlight some limitations of our study and discuss some directions for future research. First, to the best of our knowledge, there have been few attempts to evaluate the effect of the BRI from the perspective of the five-pronged approach. Although Lyu et al. [42] construct an impact framework covering all of the five-pronged approaches for exploring the effect of BRI on OFDI, we only investigate two of the five approaches. This is attributed to the fact that we find few obvious theoretical mechanisms for the direct impact of policy coordination, financial integration, and people-to-people bond on TFP. This study paves the way for future work on mechanism discovery regarding the effect of BRI on urban TFP. Although this study finds empirical evidence supporting BRI’s promotion of the TFP in key provinces, further research is needed to investigate the BRI’s impact on the TFP of participating firms using micro-level data. This leads to the question of whether the BRI will affect the development of participating countries’ TFP. Future studies should explore this question in detail.

Author Contributions

Conceptualization, M.W. and X.H.; methodology, M.W.; software, M.W.; validation, M.W.; formal analysis, M.W. and X.H.; investigation, M.W. and X.H.; resources, M.W. and X.H.; data curation, M.W.; writing—original draft preparation, M.W. and X.H.; writing—review and editing, M.W.; supervision, M.W. All authors have read and agreed to the published version of the manuscript.

Funding

This research received no external funding.

Institutional Review Board Statement

Not applicable.

Informed Consent Statement

Not applicable.

Data Availability Statement

The data supporting reported results are in Chinese and are available upon request from the corresponding author.

Acknowledgments

We are indebted to Yuting Zhang for her insights and support.

Conflicts of Interest

The authors declare no conflict of interest.

References

  1. Edwards, S. Trade orientation, distortions and growth in developing countries. J. Dev. Econ. 1992, 39, 31–57. [Google Scholar] [CrossRef] [Green Version]
  2. Frankel, J.A.; Romer, D.H. Does trade cause growth? Am. Econ. Rev. 1999, 89, 379–399. [Google Scholar] [CrossRef] [Green Version]
  3. Singh, T. Does international trade cause economic growth? A survey. World Econ. 2010, 33, 1517–1564. [Google Scholar] [CrossRef]
  4. Vamvakidis, A. How robust is the growth-openness connection? Historical evidence. J. Econ. Growth 2002, 7, 57–80. [Google Scholar] [CrossRef]
  5. Shahbaz, M. Does trade openness affect long run growth? Cointegration, causality and forecast error variance decomposition tests for Pakistan. Econ. Modell. 2012, 29, 2325–2339. [Google Scholar] [CrossRef] [Green Version]
  6. Feder, G. On exports and economic growth. J. Dev. Econ. 1983, 12, 59–73. [Google Scholar] [CrossRef]
  7. Melitz, M.J. The impact of trade on intra-industry reallocations and aggregate industry productivity. Econometrica 2003, 71, 1695–1725. [Google Scholar] [CrossRef] [Green Version]
  8. Edwards, S. Openness, productivity and growth: What do we really know? Econ. J. 1998, 108, 383–398. [Google Scholar] [CrossRef] [Green Version]
  9. Alcalá, F.; Ciccone, A. Trade and productivity. Q. J. Econ. 2004, 119, 613–646. [Google Scholar] [CrossRef]
  10. Cameron, G.; Proudman, J.; Redding, S. Technological convergence, R&D, trade and productivity growth. Eur. Econ. Rev. 2005, 49, 775–807. [Google Scholar] [CrossRef]
  11. Melitz, M.J.; Ottaviano, G.I.P. Market size, trade, and productivity. Rev. Econ. Stud. 2008, 75, 295–316. [Google Scholar] [CrossRef] [Green Version]
  12. Ottaviano, G.I.P.; Peri, G.; Wright, G.C. Immigration, trade and productivity in services: Evidence from UK firms. J. Int. Econ. 2018, 112, 88–108. [Google Scholar] [CrossRef] [Green Version]
  13. Impullitti, G.; Licandro, O. Trade, firm selection and innovation: The competition channel. Econ. J. 2018, 128, 189–229. [Google Scholar] [CrossRef] [Green Version]
  14. Schor, A. Heterogeneous productivity response to tariff reduction. Evidence from Brazilian manufacturing firms. J. Dev. Econ. 2004, 75, 373–396. [Google Scholar] [CrossRef] [Green Version]
  15. Greenaway, D.; Gullstrand, J.; Kneller, R. Exporting may not always boost firm productivity. Rev. World Econ. 2005, 141, 561–582. [Google Scholar] [CrossRef]
  16. Edmond, C.; Midrigan, V.; Xu, D.Y. Competition, markups, and the gains from international trade. Am. Econ. Rev. 2015, 105, 3183–3221. [Google Scholar] [CrossRef] [Green Version]
  17. Chen, T.J.; Tang, D.P. Export performance and productivity growth: The case of Taiwan. Econ. Dev. Cult. Chang. 1990, 38, 577–585. [Google Scholar] [CrossRef]
  18. Lu, Y.; Yu, L. Trade liberalization and markup dispersion: Evidence from China’s WTO accession. Am. Econ. J. Appl. Econ. 2015, 7, 221–253. [Google Scholar] [CrossRef] [Green Version]
  19. Xi, J. New Normal in Economic Development. China Daily. 2014. Available online: https://www.chinadaily.com.cn/china/19thcpcnationalcongress/2017-10/05/content_32869258.htm (accessed on 22 March 2022).
  20. Li, Y.; Zhang, X.J. The new normal: The logic and perspective of economic development. Econ. Res. J. 2015, 9, 4–19. (In Chinese) [Google Scholar]
  21. Wang, X.; Johansson, A. Financial repression and structural transformation. Econ. Res. J. 2013, 1, 54–67. (In Chinese) [Google Scholar]
  22. Li, K.Q. Full Text: Report on the Work of The Government. In The State Council of the People’s Republic of China; 2014. Available online: http://english.www.gov.cn/archive/publications/2014/08/23/content_281474982987826.htm (accessed on 22 March 2022).
  23. The State Council Information Office of China. What is Five-Pronged Approach? The State Council Information Office of China. Available online: http://english.scio.gov.cn/beltandroad/2020-08/04/content_76345571.htm (accessed on 22 March 2022).
  24. The State Council of China. Vision and Actions on Jointly Building Silk Road Economic Belt and 21st-Century Maritime Silk Road. Xinhua Silk Road Information Service. Available online: https://en.imsilkroad.com/p/313145.html (accessed on 22 March 2022).
  25. Huang, Y. Understanding China’s Belt & Road initiative: Motivation, framework and assessment. China Econ. Rev. 2016, 40, 314–321. [Google Scholar] [CrossRef]
  26. Ramasamy, B.; Yeung, M.C.H. China’s one belt one road initiative: The impact of trade facilitation versus physical infrastructure on exports. World Econ. 2019, 42, 1673–1694. [Google Scholar] [CrossRef]
  27. Du, J.; Zhang, Y. Does one belt one road initiative promote Chinese overseas direct investment? China Econ. Rev. 2018, 47, 189–205. [Google Scholar] [CrossRef]
  28. Xu, S.; He, X.Y.; Zhong, K. The belt and road initiative and Chinese firms’ financial constraints. China Ind. Econ. 2019, 155–173. (In Chinese) [Google Scholar]
  29. Wang, G.J.; Lu, X. The belt and road initiative and the upgrading of China’s Enterprises. China Ind. Econ. 2019, 43–61. (In Chinese) [Google Scholar]
  30. Lectard, P.; Rougier, E. Can developing countries gain from defying comparative advantage? Distance to comparative advantage, export diversification and sophistication, and the dynamics of specialization. World Dev. 2018, 102, 90–110. [Google Scholar] [CrossRef] [Green Version]
  31. Henderson, J.V.; Storeygard, A.; Weil, D.N. Measuring economic growth from outer space. Am. Econ. Rev. 2012, 102, 994–1028. [Google Scholar] [CrossRef] [Green Version]
  32. Sun, Q.; Zhang, X.; Xu, X.; Yang, Q.; Wang, S. Does the “belt and road initiative” promote the economic growth of participating countries? Sustainability 2019, 11, 5240. [Google Scholar] [CrossRef] [Green Version]
  33. Irshad, M.S. One belt and one road: Does China–Pakistan economic corridor benefit for Pakistan’s economy? J. Econ. Sustain. Dev. 2015, 6, 24. [Google Scholar]
  34. Foo, N.; Lean, H.H.; Salim, R. The impact of China’s one belt one road initiative on international trade in the ASEAN region. N. Am. J. Econ. Financ. 2020, 54, 101089. [Google Scholar] [CrossRef]
  35. Lall, S.V.; Lebrand, M. Who wins, who loses? Understanding the spatially differentiated effects of the belt and road initiative. J. Dev. Econ. 2020, 146, 102496. [Google Scholar] [CrossRef]
  36. De Soyres, F.; Mulabdic, A.; Murray, S.; Rocha, N.; Ruta, M. How much will the belt and road initiative reduce trade costs? Int. Econ. 2019, 159, 151–164. [Google Scholar] [CrossRef] [Green Version]
  37. De Soyres, F.; Mulabdic, A.; Ruta, M. Common transport infrastructure: A quantitative model and estimates from the belt and road initiative. J. Dev. Econ. 2020, 143, 102415. [Google Scholar] [CrossRef] [Green Version]
  38. Sun, J.; Gao, Y.Y.; Xuan, C.Y. China’s inter-provincial trade evolution and flow direction reshaping under belt and road initiative. Financ. Trade Econ. 2018, 39, 81–95. [Google Scholar]
  39. Chen, S.C.; Hou, J.; Xiao, D. ‘One Belt, One Road’ initiative to stimulate trade in China: A counter-factual analysis. Sustainability 2018, 10, 3242. [Google Scholar] [CrossRef] [Green Version]
  40. Yu, L.; Zhao, D.; Niu, H.; Lu, F. Does the belt and road initiative expand China’s export potential to countries along the belt and road? China Econ. Rev. 2020, 60, 101419. [Google Scholar] [CrossRef]
  41. Li, J.J.; Li, J.C. The belt and road initiative, corporate credit finance enhancement effects and heterogeneities. J. World Econ. 2020, 43, 3–24. (In Chinese) [Google Scholar]
  42. Lyu, Y.; Lu, Y.; Wu, S.B.; Wang, Y. The effect of the belt and road initiative on firms’ OFDI: Evidence from China’s greenfield investment. Econ. Res. J. 2019, 54, 187–201. (In Chinese) [Google Scholar]
  43. Luo, C.; Chai, Q.; Chen, H. “Going global” and FDI Inflows in China: “One Belt & One Road” Initiative as a quasi-natural Experiment. World Econ. 2019, 42, 1654–1672. [Google Scholar] [CrossRef]
  44. Qiu, Y.; Pan, P. The belt and road initiative and debt risk of the countries along the way: Effect and mechanism. Financ. Trade Econ. 2019, 12, 96–111. (In Chinese) [Google Scholar]
  45. Ni, Z.X.; Lu, X.; Xue, W.J. Can the belt and road strategy solve the problem of iron and steel production overcapacity in China? A study based on TVP-VAR-DMA. J. Int. Trade 2016, 3, 161–174. [Google Scholar]
  46. Zhou, G.G.; Wang, Y.J.; Gui, J.W.; Bai, P.X. Research on the effect of transportation infrastructure investment in provinces and cities along “the belt and road”: A comparative analysis based on private investment and public investment. East China Econ. Manag. 2019, 12, 5–12. (In Chinese) [Google Scholar]
  47. Li, X.F.; Jiang, L.D. Belt and road initiative, central and western regions opening and economic development. J. World Econ. 2020, 10, 3–27. (In Chinese) [Google Scholar]
  48. Chen, G.; Fan, S.S. Analysis of “the belt and road” initiative on total factor productivity of the countries along the route. Stat. Decis. 2016, 23, 116–119. (In Chinese) [Google Scholar]
  49. Xie, T.Z.G.; Xue, F.; Gei, P.F. Impact of China’s OFDI on green total factor productivity of countries along the “belt and road”. J. Shanghai Univ. Finan. Econ. 2019, 6, 96–110. (In Chinese) [Google Scholar]
  50. Solow, R.M. A contribution to the theory of economic growth. Q. J. Econ. 1956, 70, 65–94. [Google Scholar] [CrossRef]
  51. Yan, P.F.; Wang, B. Technical efficiency, technical progress & productivity growth: An empirical analysis based on DEA. Econ. Res. J. 2004, 12, 88–96. (In Chinese) [Google Scholar]
  52. Xu, G.X.; Long, X.; Li, B. Construction of Chinese fiscal decentralization index: An analysis of its impact on economic growth and equalization. Stat. Res. 2016, 33, 36–46. (In Chinese) [Google Scholar]
  53. Xu, Y.W.; Hu, D.L.; Li, Y.J. Study on the influence mechanism of local government behavior on total factor productivity of service industry: Analysis based on provincial data in China. Inq. Econ. Issues 2021, 8, 155–168. (In Chinese) [Google Scholar]
  54. Kuznets, S.; Murphy, J.T. Modern Economic Growth: Rate, Structure, and Spread; Yale University Press: New Haven, CT, USA, 1966; Volume 2. [Google Scholar]
  55. Zhang, Y.P.; Wang, X. Composition of human capital, distance to frontier and total factor productivity: An empirical analysis of the provincial panel data in China. Econ. Theory Bus. Manag. 2011, 12, 27–36. (In Chinese) [Google Scholar]
  56. Zhang, Y.L.; Ye, A.Z.; Chen, H. Human capital structure, appropriate technology selection and decomposition of total factor productivity growth: An empirical study based on regional heterogeneous stochastic frontier production function. J. Financ. Econ. 2015, 6, 4–18. (In Chinese) [Google Scholar]
  57. Munnell, A.H. Why has productivity growth declined? Productivity and public investment. N. Engl. Econ. Rev. 1990, 3–22. [Google Scholar]
  58. Donaldson, D. Railroads of the raj: Estimating the impact of transportation infrastructure. Am. Econ. Rev. 2018, 108, 899–934. [Google Scholar] [CrossRef] [Green Version]
  59. Zhou, W.W.; Li, X.P.; Li, J. The spatial effect of infrastructure construction on total factor productivity: Research on panel data of 271 prefecture-level cities under the background of “one belt and one road.". Inq. Econ. Issues 2020, 6, 64–76. (In Chinese) [Google Scholar]
  60. Blomström, M. Foreign investment and productive efficiency: The case of Mexico. J. Ind. Econ. 1986, 35, 97–110. [Google Scholar] [CrossRef]
  61. Kokko, A.; Tansini, R.; Zejan, M.C. Local technological capability and productivity spillovers from FDI in the Uruguayan manufacturing sector. J. Dev. Stud. 1996, 32, 602–611. [Google Scholar] [CrossRef]
  62. Keller, W.; Yeaple, S.R. Multinational Enterprises, International trade, and productivity growth: Firm-level evidence from the United States. Rev. Econ. Stat. 2009, 91, 821–831. [Google Scholar] [CrossRef] [Green Version]
  63. Aitken, B.J.; Harrison, A.E. Do domestic firms benefit from direct foreign investment? Evidence from Venezuela. Am. Econ. Rev. 1999, 89, 605–618. [Google Scholar] [CrossRef] [Green Version]
  64. Djankov, S.; Hoekman, B. Foreign investment and productivity growth in Czech enterprises. World Bank Econ. Rev. 2000, 14, 49–64. [Google Scholar] [CrossRef]
  65. Damijan, J.P.; Knell, M. How important is trade and foreign ownership in closing the technology gap? Evidence from Estonia and Slovenia. Rev. World Econ. 2005, 141, 271–295. [Google Scholar] [CrossRef]
  66. Shen, K.R.; Geng, Q. Foreign direct investment, technical overflow and endogenous economic growth—An econometric test and empirical analysis of Chinese data. Soc. Sci. China 2001, 5, 82–93. (In Chinese) [Google Scholar]
  67. Zhao, W.J.; Yu, J.P. Trade openness, FDI and China’s industrial economic growth pattern: Empirical analysis based on data of 30 industrial sectors. Econ. Res. J. 2011, 8, 18–31. (In Chinese) [Google Scholar]
  68. Wei, Y.; Liu, X. Productivity spillovers from R&D, exports and FDI in China’s Manufacturing Sector. J. Int. Bus. Stud. 2006, 37, 544–557. [Google Scholar] [CrossRef]
  69. Zhang, Q.; Felmingham, B. The role of FDI, exports and spillover effects in the regional development of China. J. Dev. Stud. 2002, 38, 157–178. [Google Scholar] [CrossRef]
  70. Anwar, S.; Sun, S. Foreign direct investment in R&D and domestic entrepreneurship in China’s manufacturing industries. Appl. Econ. 2015, 47, 1633–1651. [Google Scholar] [CrossRef]
  71. Chen, J.Y.; Sheng, Y.Y. An empirical study on FDI international knowledge spillovers and regional economic development in China. Econ. Res. J. 2008, 12, 39–49. (In Chinese) [Google Scholar] [CrossRef]
  72. Ran, W.; Bo, Y.; Wei-gen, D. The impact of FDI on the independent innovation capability of Chinese indigenous industries—From the perspective of industrial linkages. China Ind. Econ. 2010, 11, 16–25. (In Chinese) [Google Scholar]
  73. Kogut, B.; Chang, S.J. Technological capabilities and Japanese foreign direct investment in the United States. Rev. Econ. Stat. 1991, 73, 401–413. [Google Scholar] [CrossRef]
  74. Driffield, N.; Love, J.H.; Taylor, K. Productivity and Labour Demand Effects of Inward and Outward FDI on UK Industry; Aston University: Birmingham, UK, 2005. [Google Scholar]
  75. Dunning, J.H. Multinational enterprises and the globalization of innovatory capacity. Res. Policy 1994, 23, 67–88. [Google Scholar] [CrossRef]
  76. Bitzer, J.; Kerekes, M. Does foreign direct investment transfer technology across borders? New evidence. Econ. Lett. 2008, 100, 355–358. [Google Scholar] [CrossRef]
  77. Zhao, W.; Gu, G.; He, Y. Outward FDI and China’s technological progress: Mechanism analysis and tentative demonstration. Manag. World 2006, 7, 53–60. (In Chinese) [Google Scholar]
  78. Li, M.; Liu, S. Regional differences and threshold effect of reverse technology overflow in FDI-threshold regression analysis based on China interprovincial panel data. Manag. World 2012, 1, 21–32. (In Chinese) [Google Scholar]
  79. Yi, C.; Li, S.; Zhang, J. Institutional environment, absorptive capacity and reverse technological spillovers of OFDI in emerging economies: A threshold test based on interprovincial panel data in China. J. Financ. Econ. 2015, 11, 4–19. (In Chinese) [Google Scholar]
  80. Jiang, G.H. Cross-border merger and acquisitions and the development of productivity: Evidence from Chinese industry panel data. World Econ. Stud. 2017, 1, 60–69. (In Chinese) [Google Scholar]
  81. Shao, Y.F.D.I. OFDI, domestic technology progress. J. Quant. Tech. Econ. 2017, 9, 21–38. (In Chinese) [Google Scholar]
  82. Goldsmith, R.W. A perpetual inventory of national wealth. Stud. Income 1951, 14, 5–73. [Google Scholar]
  83. Zhang, J.; Wu, G.Y.; Zhang, J.P. The estimation of China’s provincial capital stock: 1952–2000. Econ. Res. J. 2004, 10, 35–44. (In Chinese) [Google Scholar]
  84. Shan, H.J. Reestimating the capital stock of China: 1952–2006. J. Quant. Tech. Econ. 2008, 10, 17–31. (In Chinese) [Google Scholar]
  85. Färe, R.; Grosskopf, S.; Norris, M.; Zhang, Z. Productivity growth, technical progress, and efficiency change in industrialized countries. Am. Econ. Rev. 1994, 84, 66–83. [Google Scholar]
  86. Chen, F.; Wei, H.; Tong, W.W. Does undertaking industrial demonstration areas promote economic development? Based on the difference in differences estimation. Sci. Decis. Mak. 2017, 3, 68–94. (In Chinese) [Google Scholar]
  87. Abadie, A. Semiparametric difference-in-differences estimators. Rev. Econ. Stud. 2005, 72, 1–19. [Google Scholar] [CrossRef]
  88. Duranton, G.; Morrow, P.M.; Turner, M.A. Roads and trade: Evidence from the US. Rev. Econ. Stud. 2014, 81, 681–724. [Google Scholar] [CrossRef]
  89. Zhang, J.; Wang, L.; Wang, S. Financial development and economic growth: Recent evidence from China. J. Comp. Econ. 2012, 40, 393–412. [Google Scholar] [CrossRef]
  90. Martin, K.D.; Cullen, J.B.; Johnson, J.L.; Parboteeah, K.P. Deciding to bribe: A cross-level analysis of firm and home country influences on bribery activity. Acad. Manag. J. 2007, 50, 1401–1422. [Google Scholar] [CrossRef]
  91. Hansen, C.B. Asymptotic properties of a robust variance matrix estimator for panel data when T is large. J. Econ. 2007, 141, 597–620. [Google Scholar] [CrossRef]
  92. Cameron, A.C.; Gelbach, J.B.; Miller, D.L. Bootstrap-based improvements for inference with clustered errors. Rev. Econ. Stat. 2008, 90, 414–427. [Google Scholar] [CrossRef]
  93. Petersen, M.A. Estimating standard errors in finance panel data sets: Comparing approaches. Rev. Financ. Stud. 2009, 22, 435–480. [Google Scholar] [CrossRef] [Green Version]
  94. Liu, Y.; Lin, B.; Xu, B. Modeling the impact of energy abundance on economic growth and CO2 emissions by quantile regression: Evidence from China. Energy 2021, 227, 120416. [Google Scholar] [CrossRef]
  95. Gong, B. Agricultural reforms and production in China: Changes in provincial production function and productivity in 1978–2015. J. Dev. Econ. 2018, 132, 18–31. [Google Scholar] [CrossRef]
  96. Xi, J. Work Together to Build the Silk Road Economic Belt and the 21st-Century Maritime Silk Road. Xinhua Silk Road Information Service. 2017. Available online: https://en.imsilkroad.com/p/313153.html (accessed on 22 March 2022).
  97. Zhang, P.F. The infrastructure construction level of the belt and road impacts on bilateral trade from Asian countries: Analysis based on extended gravity model. World Econ. Stud. 2018, 6, 70–82. (In Chinese) [Google Scholar]
  98. Hu, Z.; Fu, S.; Zhang, L. Study of international trade effect of the infrastructure under the belt and road initiatives. J. Quant. Tech. Econ. 2019, 36, 24–44. (In Chinese) [Google Scholar]
  99. The State Council Information Office of China. Unimpeded Trade. The State Council Information Office of China. Available online: http://english.scio.gov.cn/featured/chinakeywords/2019-07/11/content_74977490.htm (accessed on 22 March 2022).
  100. The State Council of China. Guidance of the General Office of the State Council on Accelerating the Construction and Promotion of High-Speed Broadband Networks and Increasing Network Speed and Reducing Network Fees. In The State Council of the People’s Republic of China. 2015. Available online: http://www.gov.cn/zhengce/content/2015-05/20/content_9789.htm (accessed on 22 March 2022).
  101. Helliwell, J.F.; Huang, H. How’s your government? International evidence linking good government and well-being. Br. J. Political Sci. 2008, 38, 595–619. [Google Scholar] [CrossRef] [Green Version]
  102. Bäck, H.; Hadenius, A. Democracy and state capacity: Exploring a J-shaped relationship. Governance 2008, 21, 1–24. [Google Scholar] [CrossRef]
  103. Li, M. An empirical study on state audit and local governance efficiency—A review on the dual leadership system of the local government audit institutions. Res. Econ. Manag. 2015, 60–67. (In Chinese) [Google Scholar]
  104. Becker, S.O.; Egger, P.H.; Von Ehrlich, M. Absorptive capacity and the growth and investment effects of regional transfers: A regression discontinuity design with heterogeneous treatment effects. Am. Econ. J. Econ. Policy 2013, 5, 29–77. [Google Scholar] [CrossRef]
Figure 1. Parallel trend test.
Sustainability 14 13375 g001
Figure 2. Placebo test of random assignment for the treatment group.
Sustainability 14 13375 g002
Table 1. Variable definitions.
VariablesDenotationDefinition and Calculation Method
Explained VariableTFP
EFF
TEC
Total factor productivity, calculated using DEA–Malmquist
Technical efficiency, decomposition of TFP
Technological progress rate, decomposition of TFP
Main Explanatory VariableKey RegionsEquals 1 if a prefecture-level city is in a key province, and otherwise, 0
Before or after the initiation: Post equals 0 before 2014 and 1 after 2014
Post
Control VariablesHuman CapitalNumber of students in general higher education
SecondaryThe secondary industry: Output value of the secondary industry accounts for the proportion of the regional GDP
TertiaryThe tertiary industry: Output value of the tertiary industry accounts for the proportion of the regional GDP
TechnologyGovernment spending on science and technology as a percentage of regional GDP
EmploymentUrban employment: Proportion of employees in an urban area to the region’s total population
IncomeAverage income per capita: Log value of the per capita real wage in a prefecture-level city
Fixed-Asset InvestmentLog value of the regional fixed-asset investment
InterventionGovernment intervention: Proportion of government budget expenditures to the regional GDP
Table 2. Descriptive statistics.
VariablesMeanStandard
Deviation
MaximumMinimum
TFP0.970.140.233.26
EFF1.050.220.374.53
TEC0.950.160.601.43
Human Capital53.7679.154.21986.87
Secondary48.4910.730.0090.97
Tertiary38.569.560.0080.98
Technology7.680.834.1210.92
Employment12.3010.760.2697.36
Income5.500.353.367.58
Fixed
Asset Investment
10.750.947.1216.06
Intervention21.5023.261.54604.06
Table 3. BRI’s impact on the TFP of key provinces.
(1)(2)(3)(4)
TFPTFPEFFTEC
BRI0.0599 ***0.0308 ***0.0975 ***0.0413 ***
(10.10)(4.52)(8.91)(5.62)
Human Capital 0.000579−0.00181 ***0.00204 ***
(1.50)(−2.92)(4.88)
Industrialization 0.000180−0.00396 ***0.00369 ***
(0.39)(−5.29)(7.34)
Industry Structure 0.00006880.000124−0.000137 ***
(1.43)(1.60)(−2.63)
Technology −0.00655−0.0365 ***0.0359 ***
(−1.07)(−3.72)(5.45)
Employment −0.00114 ***0.000908 *−0.00238 ***
(−3.76)(1.87)(−7.28)
Income 0.0776 ***−0.0500 ***0.157 ***
(7.38)(−2.96)(13.86)
Fixed-Asset Investment 0.0148 ***0.0724 ***−0.0523 ***
(2.99)(9.14)(−9.83)
Intervention 0.000648 ***0.00005310.000399 ***
(5.64)(0.29)(3.22)
City Fixed EffectsYesYesYesYes
Year Fixed EffectsYesYesYesYes
_cons0.962 ***0.394 ***1.026 ***0.169 ***
(359.16)(8.57)(13.90)(3.41)
N3408340834083408
R20.02910.0860.0580.159
Note: t values in brackets. *, **, *** indicate significance levels of 10%, 5%, and 1%, respectively.
Table 4. Parallel trend test and dynamic effect.
(1)
TFP
key_province × Before70.0160
(1.41)
key_province × Before60.0116
(1.02)
key_province × Before50.0109
(0.95)
key_province × Before40.0037
(0.32)
key_province × Before30.0213
(1.59)
key_province × Before20.00856
(0.75)
key_province × Before10.0120
(1.05)
key_province × After10.0237 *
(1.92)
key_province × After20.0245 **
(2.03)
key_province × After30.0423 ***
(3.54)
key_province × After40.0629 ***
(4.90)
Control VariablesYes
City Fixed EffectsYes
Year Fixed EffectsYes
_cons0.396 ***
(7.83)
N3408
R20.084
Note: t values in brackets. *, **, *** indicate significance levels of 10%, 5%, and 1%, respectively.
Table 5. Placebo tests by falsifying the BRI launch year.
Assuming the BRI Was
Implemented in 2011
Assuming the BRI Was
Implemented in 2012
TFPTFP
BRI_falsified0.006890.00814
(1.23)(1.37)
Control VariablesYesYes
City Fixed EffectsYesYes
Year Fixed EffectsYesYes
_cons0.348 ***0.352 ***
(7.72)(7.74)
N34083408
R20.0810.081
Note: t values in brackets. *, **, *** indicate significance levels of 10%, 5%, and 1%, respectively.
Table 6. PSM-DID results.
Radius MatchingNearest Neighbor MatchingKernel Density Matching
TFPTFPTFP
BRI0.0156 **0.0155 **0.0155 **
(2.09)(2.09)(2.09)
Control VariablesYesYesYes
City Fixed EffectsYesYesYes
Year Fixed EffectsYesYesYes
_cons0.449 ***0.422 ***0.422 ***
(6.67)(6.40)(6.40)
N338534083408
R20.1140.1140.114
Note: t values in brackets. *, **, *** indicate significance levels of 10%, 5%, and 1%, respectively.
Table 7. Instrumental variables.
First StageSecond Stage
BRITFP
IV × Post0.628 ***
(22.69)
BRI 0.0308 ***
(4.53)
Control VariablesYesYes
City Fixed EffectsYesYes
Year Fixed EffectsYesYes
_cons1.4823 ***0.394 ***
(14.12)(8.59)
N34083408
R20.3780.086
F229.8
Note: t values in brackets. *, **, *** indicate significance levels of 10%, 5%, and 1%, respectively.
Table 8. Removing confounding effects.
Lagged Control VariablesRemove 2013Remove
Minority Areas
Remove the Impact of the Supply-Side Reform
TFPTFPTFPTFP
BRI0.0132 **0.0160 **0.0247 ***0.0399 ***
(2.11)(2.10)(3.39)(5.28)
Control VariablesYesYesYesYes
City Fixed EffectsYesYesYesYes
Year Fixed EffectsYesYesYesYes
_cons0.719 ***0.423 ***0.415 ***0.415 ***
(10.23)(6.08)(8.83)(9.16)
N3124312430482556
R20.0960.1010.0870.089
Note: t values in brackets. *, **, *** indicate significance levels of 10%, 5%, and 1%, respectively.
Table 9. Generalized method of moments (GMM).
Difference GMMSystem GMM
TFPTFP
L.TFP0.156 ***0.399 ***
(6.69)(22.22)
BRI0.0647 ***0.0837 ***
(5.50)(6.26)
Control VariablesYesYes
City Fixed EffectsYesYes
Year Fixed EffectsYesYes
_cons0.07790.514 ***
(0.66)(4.13)
N28403124
Note: t values in brackets. *, **, *** indicate significance levels of 10%, 5%, and 1%, respectively.
Table 10. Hierarchical mixed regression.
(1)
TFP
BRI0.0308 **
(2.57)
Control VariablesYes
City Fixed EffectsYes
Year Fixed EffectsYes
_cons0.394 ***
(5.68)
N3408
R20.086
Note: t values in brackets. *, **, *** indicate significance levels of 10%, 5%, and 1%, respectively.
Table 11. Simultaneous quantile regression.
(1)(2)(3)
TFPTFPTFP
q20q50q80
BRI0.0136 **0.00919 **0.0218 ***
(2.31)(2.03)(3.29)
Control VariablesYesYesYes
City Fixed EffectsYesYesYes
Year Fixed EffectsYesYesYes
_cons0.288 ***0.362 ***0.469 ***
(6.21)(14.04)(10.96)
N340834083408
R20.08650.09340.0535
Note: t values in brackets. *, **, *** indicate significance levels of 10%, 5%, and 1%, respectively.
Table 12. TFP generated from the stochastic frontier analysis.
(1)
TFP
BRI0.0309 ***
(5.71)
Control VariablesYes
City Fixed EffectsYes
Year Fixed EffectsYes
_cons6.884 ***
(131.80)
N3408
R20.908
Note: t values in brackets. *, **, *** indicate significance levels of 10%, 5%, and 1%, respectively.
Table 13. Underlying mechanism of the BRI that affects the TFP of key provinces.
(1)(2)(3)(4)
TFPTFPTFPTFP
BRI3.536 ***0.0249 **1.269 ***0.0386 *
(2.99)(2.04)(4.93)(1.76)
Transport facilities1.548 ***
(3.69)
BRI × Transport facilities0.894 ***
(2.76)
Communication facilities 0.648 ***
(3.02)
BRI × Communication facilities 0.0184 ***
(2.82)
FDI 2.425 ***
(2.98)
BRI × FDI 1.862 ***
(2.68)
OFDI 0.726 ***
(3.85)
BRI × OFDI 0.032 ***
(2.64)
Control VariablesYesYesYesYes
City Fixed EffectsYesYesYesYes
Year Fixed EffectsYesYesYesYes
_cons−49.60 ***0.309 ***−5.917 **3.906 ***
(−4.35)(2.62)(−2.37)(19.53)
N3408340834083408
R20.1660.7860.2860.485
Note: t values in brackets. *, **, *** indicate significance levels of 10%, 5%, and 1%, respectively.
Table 14. Heterogeneous BRI impact on TFP.
(1)(2)(3)(4)
21st-Century Maritime SilkSilk Road Economic BeltHigh Gov-EfficiencyLow Gov-Efficiency
TFPTFPTFPTFP
BRI0.0650 ***0.01560.0386 ***0.0176
(6.27)(1.28)(4.40)(1.62)
Control VariablesYesYesYesYes
City Fixed EffectsYesYesYesYes
Year Fixed EffectsYesYesYesYes
_cons0.942 ***0.214 **0.380 ***0.416 ***
(5.16)(2.27)(4.72)(7.15)
N1380202815441864
R20.0650.1170.0620.125
Note: t values in brackets. *, **, *** indicate significance levels of 10%, 5%, and 1%, respectively.
Table 15. Spillover effect.
(1)
TFP
Neighbor × Post0.0282 *
(1.96)
ControlsYes
City Fixed EffectsYes
Year Fixed EffectsYes
_cons0.289 ***
(4.97)
N1740
R20.098
Note: t values in brackets. *, **, *** indicate significance levels of 10%, 5%, and 1%, respectively.
Table 16. BRI impact on economic growth.
(1)(2)
Nighttime LightNighttime Light
BRI3.691 ***3.271 ***
(3.68)(2.84)
TFP1.635 ***1.372 ***
(3.02)(2.64)
BRI × TFP1.052 ***1.010 ***
(2.92)(2.78)
ControlsYesYes
City Fixed EffectsYesYes
Year Fixed EffectsYesYes
Province × Year Fixed EffectsNoYes
_cons11.10 ***4.973 ***
(1592.84)(46.71)
N34083408
R20.0510.755
Note: t values in brackets. *, **, *** indicate significance levels of 10%, 5%, and 1%, respectively.
Publisher’s Note: MDPI stays neutral with regard to jurisdictional claims in published maps and institutional affiliations.

