Abstract
Background—competitive conditions are often distorted in the construction sector, therefore this affects the market position of all participants. This paper seeks to find the tools for properly assessment of participants by Herfindahl-Hirschmann index (HHI) and to identify what parameters have the greatest impact in the competitiveness of the construction sector. Methods: in this article the DEMATEL method was used whereas tool for assessing the balance of market concentration as it may help to determine factor with the greatest influence on a firm’s HHI. Results in this work showed how different parameters affect each other and their impact on a value of a firms’s HHI. When the parameters are determined, they can be useful for assesment of mergers their influence on the HHI and alteration of the market’s power balance. Conclusions—The calculation of the HHI by using the DEMATEL method allowed to check the empirical implementation check of the multicriteria assessment method, on the market power of business entities, operating in the distorted market conditions of the construction sector.
1. Introduction
The competitive situation sometimes seems to be an obstacle to much-needed co-operation and progress towards a more sustainable economy. Understanding the busi-ness opportunities in the construction sector, which is has a highly concentrated mar-ket, is encourages growing interest in sustainability research. This paper examines how to assess the suitability of the HHI in the construction sector. The various authors [1,2,3,4] submitted few theoretical ways to assess the competition level of the market. The task of this article is to determine the balance of power in the market, in order to seek sus-tainable market competition of business entities. Some authors [1,2,3,4,5,6,7] note that the competition is assessed usually by the following factors: the level of market concen-tration, taxes, price marginal costs, and import penetration of the construction market. Researchers [1,2,3,4,5,6,7,8] have investigated that exists structural (parametric) and non-structural (non-parametric) approaches for measuring competition. They both in-fluence the market as a representative business entities and are trying to find the hypothetical parameters [9]. Some indices are used to assess the concentration in various markets, therefore can be distinguished the following [7,9,10,11]: Hannah and Kay index (HKI), Rosenbluth index (RI), U index (U), Herfindahl-Hirschmann index (HHI), Hall Tidemanfr index (HTI), Lerner (L), Entropy measure (E), detailed industrial concentration index (CCI), Entropy measure (E), k firm concentration ratio (CRk), Multiplication Hause index (Hm) [9]. In the article these indices will be discussed and will be determined which of them would be the best suitable to assess the balance of market power in the construction market. Also, an illustrative example will be given to show the use of the HHI.
However, these different indices raise the new research questions that remain to be clarified:
- Which index would be the best suited to assess the balance of market power in the construction market?
- What are the main approaches of competition assessment in distorted markets?
- What are advantages and disadvantages of the HHI for the use in the construction sector?
- Is DEMATEL method suitable for determining the level of market concen-tration in the construction sector?
This study primarily aims to explore the possibilities of estimating the HHI in the decision-making process for developing business strategies in order to avoid market distortions in the construction sector.
The novelty of this study is to describe the possibilities of the DEMATEL method to estimate the HHI in order to avoid a distorted market situation by using the main economic indicators of the construction sector market.
The main contribution of this article is to provide a comprehensive measurement system for calculation of the HHI in construction businesses trying to determine the market position of the business entity, taking into account its competitive situation and help to achieve sustainable market competition.
2. The Structural Approach of Market Competition
Competition assessment in the economics is based on the theory of market struc-ture [7]. There are two perceptions of industrial competition—dynamical and statical. A statical picture shows—a long-term balance of industrial competition which will exist if the industry would be described as a market entity in perfect competition, having the constant technology [9]. Distorted competition arises from the advantages of various processes, economies of capacity, lower prices, which support greater market power of one against its competitors. Robust approach states—that the market is often imperfect [7,9,10]. Distorted competition arises from modern innovation, product derivations, technological advances in production processes [7,11]. In addi-tion, monopoly situation is volatile because of creative destruction [11]. Whereas factors connected with technological progress and firm innovation are difficult to detect from a dynamic point of view [11].
The structural view is reasoned on the structural-manner-performance method (SCP) and could be related with the market situation and firm’s manner in the market. Intense of competition can be estimated by the firm’s behavior [9]. Market situation is assessed by many criterias: the number, size of customers and vendors, conditions of entry, service differentiation. Behavior is indicated by the pricing policy, agreements, mergers, or business entities. Business activities are related to the industry results such as product/service quality, productivity, profit, distribution efficiency [11,12,13,14,15,16,17,18,19]. It estimates the competition intensity by industry parameters, as the concentration ratio, HHI index, which are commonly used as criterias of competition. In the industrial economy, these indices are often used for evaluating competition. The process of measuring these indices can show the importance of large firms in the industry, both internally and externally [11]. Knowing the possibilities and risks can help scientists to evaluate and interpret competition level of the branch correctly. The measurement of competiton level is is easy if there are uncomplicated data [12]. For choosing the right criterias, there are some important aspects that must be assessed. When calculating concentration ratio (CR), it is possible to make a mistake in choosing the number n of the best business entities. There are no rules of choice. However, choosing the number n of the best companies is not so important point. The main problem of adopting the concentration ratio as an indicator for estimating the degree of concentration, is strong limitations in interpreting amount of the distribution. According to Hannah and Kay, in case when existing companies merge, the size of the concentration should increase, therefore the rate of competition should be reduced, and in case if companies have grown therefore, and the level of competition will be reduced accordingly [10]. However, ratio fails to meet this parameter if business entities are small size companies.
The most important aspect is distribution in the best n companies. Situation when is a large distribution of the main top n companies, competition activity should be less in case of a lower distribution. Due to the CR limitations HHI is important indicator, which is used to estimate the market concentration level. HHI involves all firms and size of their distribution [11]. In summary, CR can be used as an indicator of competition if the number of sellers does not change, and the size of their distribution does not differ. Otherwise, in the event of structural changes in industries: mergers, start-ups, acquisition, and largely distorted distribution across construction market, the HHI may strongly reflect market concentration. Unstructured view rely on the New Empirical Industry Organization (NEIO), it is also more complex than the structural view, talking about requirements for the information and estimation methodologies. Researches of unstructured approach does not allow to set the degree of competition according to the structure of construction market, indirectly monitoring the firm’s behavior. Industry competition also can not be identified without taking advantage of firm behavior [11]. Currently, NEIO area of empirical research was mainly devoted for assessing the behavior of firms. Empirical industry research often uses balance sheets and income statements as a comparison of costs and results. In terms of intermediate modeling, there usually is used property, which is in the balance sheet. It can show the loans, but also show some earnable assets, securities, excess cash reserves. Often there are used three types of costs in the construction market: as input factors generating property, which are personal costs, other non-financial costs, and financial costs, that adequately reflect labor, physical capital, and deposits [12,20,21,22,23,24,25,26,27,28,29,30,31]. The table of concentration indices is given below (Table 1).

Table 1.
The expressions and the limits of the indices [4,7,9,10].
Empirical studies were performed according to the unstructured method. To assess competition are commonly used two main indicators: the Lerner Index (LI) and the Panzar-Rosse H (PRH) statistics [29,31,32,33,34,35,36,37]. In practice, when choosing the right one between these two indicators, interpretation of competition is important. Pros and cons should therefore be determined. One of the most useful and popular indicators is the LI, which is used to determine the companies market power in the construction industry according to mark-ups above the marginal price. One of the most distinguishing factors is opportunity to check the change of pricing per time. In addition, LI helps to monitor the company’s power in different markets, as this do not require a structure to be defined.
However, according to neoclassical view, market power cannot show the degree of competition sufficiently. Criterias to be considered, such as service/product differentiation, obstacles of market access. In addition, when calculating LI by using ordinary method, perfect technical and distributional efficiency are naturally accepted, and it is difficult to confirm circumstances related to optimal efficiency [11,12]. Differently than LI, the PRH was widely used in the assessment of competitors. The PRH is one of the indicators in terms of a static approach to competition. The PRH always takes into account the long period balance by using a monopolist equilibrium according to the oligopoly view. In an equilibrium situation, when marginal prices are equal to the marginal income, factors of entry price are raised, marginal prices will increase consequently. The construction market monopolist will react to the price increment of input elements by reducing their volume.
Neoclassical theory states, that indicator of market power merely cannot adequately describe the level of competition. Market competition level can be evaluated according to the elasticity of total company income, considering the prices of input factors [37]. Transition from input criterias to total income may show the competition level. Like LI, the PRH dont ask the market definition to assess revenue [12]. Among these indicators of competition, there are problems in the theory and in empirical aspects of competition researches on the stability and monetary policy [17]. Indices are shown in 1 table.
The economists are calculating competitive price comparing it with marginal costs and are using LI, which is associated with a percentage mark-up from marginal costs to residual demand functions elasticity as a measure of the market power in construction sector. Noteworthy, approach of market power is described as price higher than the marginal cost and it can be different from the concept of market power in Competition Law [38,39,40]. Perfect competition market level is the concept based on assumptions that must be met. Competitiveness economists have offered a concept of competition that is related with prices above marginal costs [7].
Equilibrium prices in ideal competition are refered to marginal costs and may be competitive pricing. However, the concept of competitive pricing often is not so accurate, if there are no violations of competition law, and can be viewed as competitive prices, although if they are above the marginal costs and the market cannot be described as perfect. Lerner index formula [7,9]:
here:
P—the price of the goods, set by the business entity.
MC—the business entities marginal cost.
The Lerner index measures the percentage markup, which business entity can charge over its marginal line. Range i from 0 to 1. The higher value more the business entity can charge over its marginal cost, and its monopoly power is greater.
The LI results are from the profitability conditions maximization and has relation with the margin to the price elasticity of demand [9].
The trade price for service/product i, the price ductility and the marginal cost of demand. Ductility of price demand for one product/service is described:
There is shown how the demand of one service/product is declining together with a price increase of one percent by service/product. The price ductility takes an adverse valuation, in absolute. The higher ductility level, is the lower LI number, and the less market power the firm will acquire.
Example: there is an oligopolistic construction market in which companies incur certain fixed costs, they compete in production quantities and produces homogeneous product. This can be demonstrated by the Cournot model when the price exceeds marginal costs in the presence of high competition. From a long lasting view whereby description, there are no strict costs however in a free market—a competitive price may be described as the same to the longer period marginal or longer period average increst price. The demand faced by one business entity usually depends not only on consumer behavior, as well as on the prices of the alternatives or supplements of the firm’s relevant services/products, as well as on behavior of other companies supply [9,41,42,43].
Therefore, the specific or residual demand function of a particular firm must be considered if demand and supply can be changed as the most important restriction of competition is faced by the company. Price ductility of residual demand feature covers the restrictions of competition, which company faces are demand and supply substitutes. An increase in a company’s prices, can direct to changes in the customer’s behavior—buyer’s will change the product by buying less, choosing its replacement, buying in other area, or buying something else. The behavior of suppliers may change, due to production amounts, increasing product (or substitute products) supply by other companies, changing the composition of their services/products, expanding the capacity.
The price balance is associated with parameters such as level of differentiation, alternative replacements, the limitation of amounts, the construction product, the market competition, the buyer power. From a long period perspective to evaluate competitive price is the need to consider barriers to entry into construction sector’s market, barriers to development, possible relocation of products and the effects of possible competition.
2.1. Rosenbluth Index
The calculation of the Rosenbluth index, which reflects the level of market concentration, is based on a limited number of market participants [9]. This method evaluates all companies, which are operating in a particular market. Rosenbluth index from other methods of determining the level of market concentration stands out very sensitive reaction to the changes in market shares and the company’s position in the market. Change in firm size in the market also determines the different importance of market share when calculating the index. For market share of each participant is assigned a coefficient of different importance. The HHI is less reactive to changes in market’s share of small market participants. The Rosenbluth index is calculated according to the formula [7,9]:
there:
Si is the the i-th companie’s market share,
i—relevant market firm’s rating.
The values of the RI are evaluated in the same way as in the case of HHI. It should be noted that the RI is calculated only when the number of market participants is finite and when one company has a larger market share than others. This means that the level of concentration cannot be calculated according to the RI if there are companies with the same market share in the market.
2.2. Maurel–Sedillot Index
In 1999 Maurel and Sedillot proposed a different formula for calculating the level of market concentration [8]:
here:
S1—the the i-th companie’s market share.
Si—is the market share of the i-th company.
n—is the enterprises number of the relevant market.
According to the Maurel-Sedillot model, the company with the biggest share of the market is given a higher relative weight in the market. In order not to impede effective competition in the market, the result obtained by this formula should not exceed 0.45.
2.3. Industrial Concentration Index
To measure concentration in markets more indexes are used also. Bikker and Haaf [4], in addition to the above, distinguished the Industrial Concentration Index (CCI) [7]. This index is expressed as squares sum of the dominant undertaking’s market share and the squares of the remaining undertakings’ shares multiplied by the remaining market share [7]:
here:
S1—the largest market share of the company.
Si—the the i-th companie’s market share.
n—is the count of enterprises in the relevant market.
2.4. Hannah and Kay Index
The value of the comprehensive industrial concentration index is equal to one. With a larger number of firms and an index approaching zero, a declining market concentration, the Hannah and Kay Index (HKI), is shown. This aggregate index assesed according tothe [7,9]:
Si—is the the i-th companie’s market share.
n—is the count of enterprises in the relevant market.
α—coefficient of elasticity, 0 < α ≠ 1, optional, reflects the change in concentration depending on entry/exit/market barriers and trade between firms. α freedom of choice allows an overview of different scenarios. When α → 0, it shows the number of business entities in the market, and when α → ∞, the index approaches the analogue of the business entities largest market share.
2.5. Hause Index
Hause proposed his variants for calculating market concentration [27]: Hause Multiplier (Hm). Hause presented a numerical model that with increasing n, competition grows much more slowly at a lower value of α, that is, at a high degree of agreement, than the HHI predicts [7]:
Si—the the i-th companie’s market share.
n—the count of enterprises in the relevant market.
α—coefficient of elasticity, α > 1.
2.6. Entropy Index
The entropy index (E) is expressed by the formula [7]:
The values of the index are between 0 and log2 n and are not limited. The entropy index changes vice versa in proportion to the level of concentration. The index decreases in the presence of inequality. The closer the market is to the monopoly, the value of the index is closer to zero. E = log n, when all firms in the market have equal shares and concentration is the lowest.
2.7. HHI Index
The HHI is broadly used to determine the merger in a competitive business [35]. Measuring the construction sector’s market concentration remains an important issue for understanding the level of diversification and systemic risk. The market influence on merger performance should be evaluated by index which shows the concentration degree. [14,15]. HHI was created to determine diversification [35]. Regulators often use HHI to assess competitiveness and secret behavior effect to concentration. HHI letsto understand the effective structure of controversy and competitive behavior [6]. In most cases, an indirect method is used to assess competitive effects—to identify the competitive constraints faced by the undertaking and to evaluate if the undertaking has market power or the merger strengthened a merger. It is usually gathered by competition authorities usually: there is formulated description of the analyzed market and analyzed the conditions of competition in this market. When the market has been described, it is possible to identify competitors and attribute the relevant market shares to market participants. These market shares and related concentration measures are used for the conclusions about the market power of the undertaking or, unless otherwise specified, the strength of the undertaking’s restrictions of competition. The market share is directly related with market power, the level of concentration in the market points to competition, and the higher prices than in less concentrated industries [44,45,46,47]. The Theory of market concentration and HHI is written by Cournot method of quantitative competition for business entities producing a similar product with fixed marginal prices. According to the Cournot model, the average margin, measured in terms of market shares, is similar to the HHI which contains the price ductility of demand. The HHI shows more strength to bigger market shares, a market in which one entity has a very large market share, few smaller entities receive a high HHI size. Situation when there is only a small number of companies with the same market share, market power may not be used. In addition, if there are only a few companies in the market with symmetrical market shares, this may lead to coordinated behavior. Consideration is given here to a homogeneous product market. Another relationship between HHI and harmonized behavioral stability is indicated in Stigler’s work. He revealed that the stability of coordinated behavior is the opposite proportional to the HHI. Situation when the market concentration is high, a fraudulent company can be found and deterred by the agreed result. The differences in the index are thought to be related to increase of the price. According to the Cournot model, linear demand and the fixed marginal prices wealth becomes lower with increasing concentration—with the condition that there will be no efficiency gains and potential competition [7].
If there is no synergy merger in the market, compared to the Cournot model, may mean that competition leads to price increases. The elevant market description, the calculation of market shares and the concentration measurements obtained from these shares were used to set the thresholds. In the European Commission’s Guidelines, the digital HHI levels and the difference in HHI caused by the merger are used for specifying the range, which will not be subject to any further merger analysis. These limits allow to perform initial merger control therefore, they can be considered as safe ports. The Herfindahl-Hirschman index is mostly used in the EU as a much more detailed model for calculating the construction sector’s concentration. HHI determine the degree of concentration in the important market and its geography. It is based on the market shares squared and sum:
here:
Si—the the i-th companie’s market share.
n—the count of enterprises in the relevant market.
The values of the indexes are determined:
HHI < 0.1—not concentrated market.
HHI = 0.1–0.18—concentrated moderately.
HHI > 0.18—highly concentrated market.
The main limitation of HHI is that predictions are not possible. This is because it is difficult to determine the size of the market because it changes very often. Predictions are possible if the number of construction sector’s players is available, and are known their market shares. All enterprises should be included in the calculation of the HHI, and the lack of information about very small enterprises may be insignificant as they do not have great impact on the outcome.
3. Methods and Data
The DEMATEL method in this work intends to assist the preparation of construction sector’s business strategies based on assessments of market. It have been implemented in a typical area—construction sector. The developed algorithm was designed to assess the market power, to analyze strategic actions in the market, and to choose strategic decisions. Multi-criteria analysis was used with the assistance of experts. The experts were selected for this study based on the following main criteria:
- (1)
- Qualification—manager of a construction company.
- (2)
- At least 10 years of experience in the construction sector.
- (3)
- Experience in conditions of distorted market competition in the construction sector.
10 experts participated in the study. This number of experts was selected based on the methodology of qualitative research: if the number of experts is above 10 so it does not affect the accuracy and reliability of the results significantly.
In a case for the evaluation of market power in the construction sector, the influence of the construction sector on GDP is significant [48]. The DEMATEL method was adapted for the evaluation of the market power of companies in the Slovenian construction sector. Next were presented indicators of 18 companies in construction sector during 2015–2019 period [48].
The main hypotheses of this work are following:
- DEMATEL method is appropriate for assessing the competitive position of a business entity.
- HHI index is suitable for determining the competitive position, considering the specificities of the construction sector.
- The HHI index affect the ability of the business entity to avoid market distortions in relation to competitors over time.
Identification of the relations among the n parameters, an n × n matrix was determined firstly. The influence of the parameter in each row meets with the parameter of each column of this matrix. If experts’ suggestions are used, they must complete the matrix. Arithmetic mean of all experts’ suggestions is used and then a direct relation matrix X is gathered:
Normalization of the sum of all rows and columns of the matrix was made. The biggest count of the row and column sums can be shown by k, It is important that each parameter of the direct-relation matrix would be divided by k.
The fuzzy total-relation matrix can be computed as follows:
An n × n identity matrix shows that matrix is subtracted from normalized matrix and the resulting matrix is reversed. Next, the normalized matrix is multiplied by the resulting matrix in order to acquire the total relation matrix (Table 2).
Table 2.
The final relation matrix.
The threshold score should be taken to evaluate the internal relations matrix. Partial connections are neglected, and the relationship map of the network (NRM) is made. Only connenctions whose scores in matrix T is above the threshold score are depicted in the map. To compute the threshold score for relations, it is sufficient to estimate the average values of the matrix. After estimation of the threshold intensity all values in matrix T, which are less than the threshold score, are set to zero.
In this study, the threshold score is equal 0.346.
The valuations in matrix which are less than 0.346 are set to zero, the causal relation mentioned above is not considered. The model of connections is shown in the table (Table 3).
Table 3.
The final-relationship matrix including the threshold value.
4. Results
Application of DEMATEL method has been shown above. Further we will evaluate the sum of each row and each column of matrix T. The sum of rows (D) and sum of columns (R) can be calculated as follows:
The scores of D − R D + R can be estimated by D and R, D + R reflects the level of importance of parameter i in the entire system and D − R shows net effects, that factor i contributes to the system.
The final output is shown in the Table 4.
Table 4.
The final output.
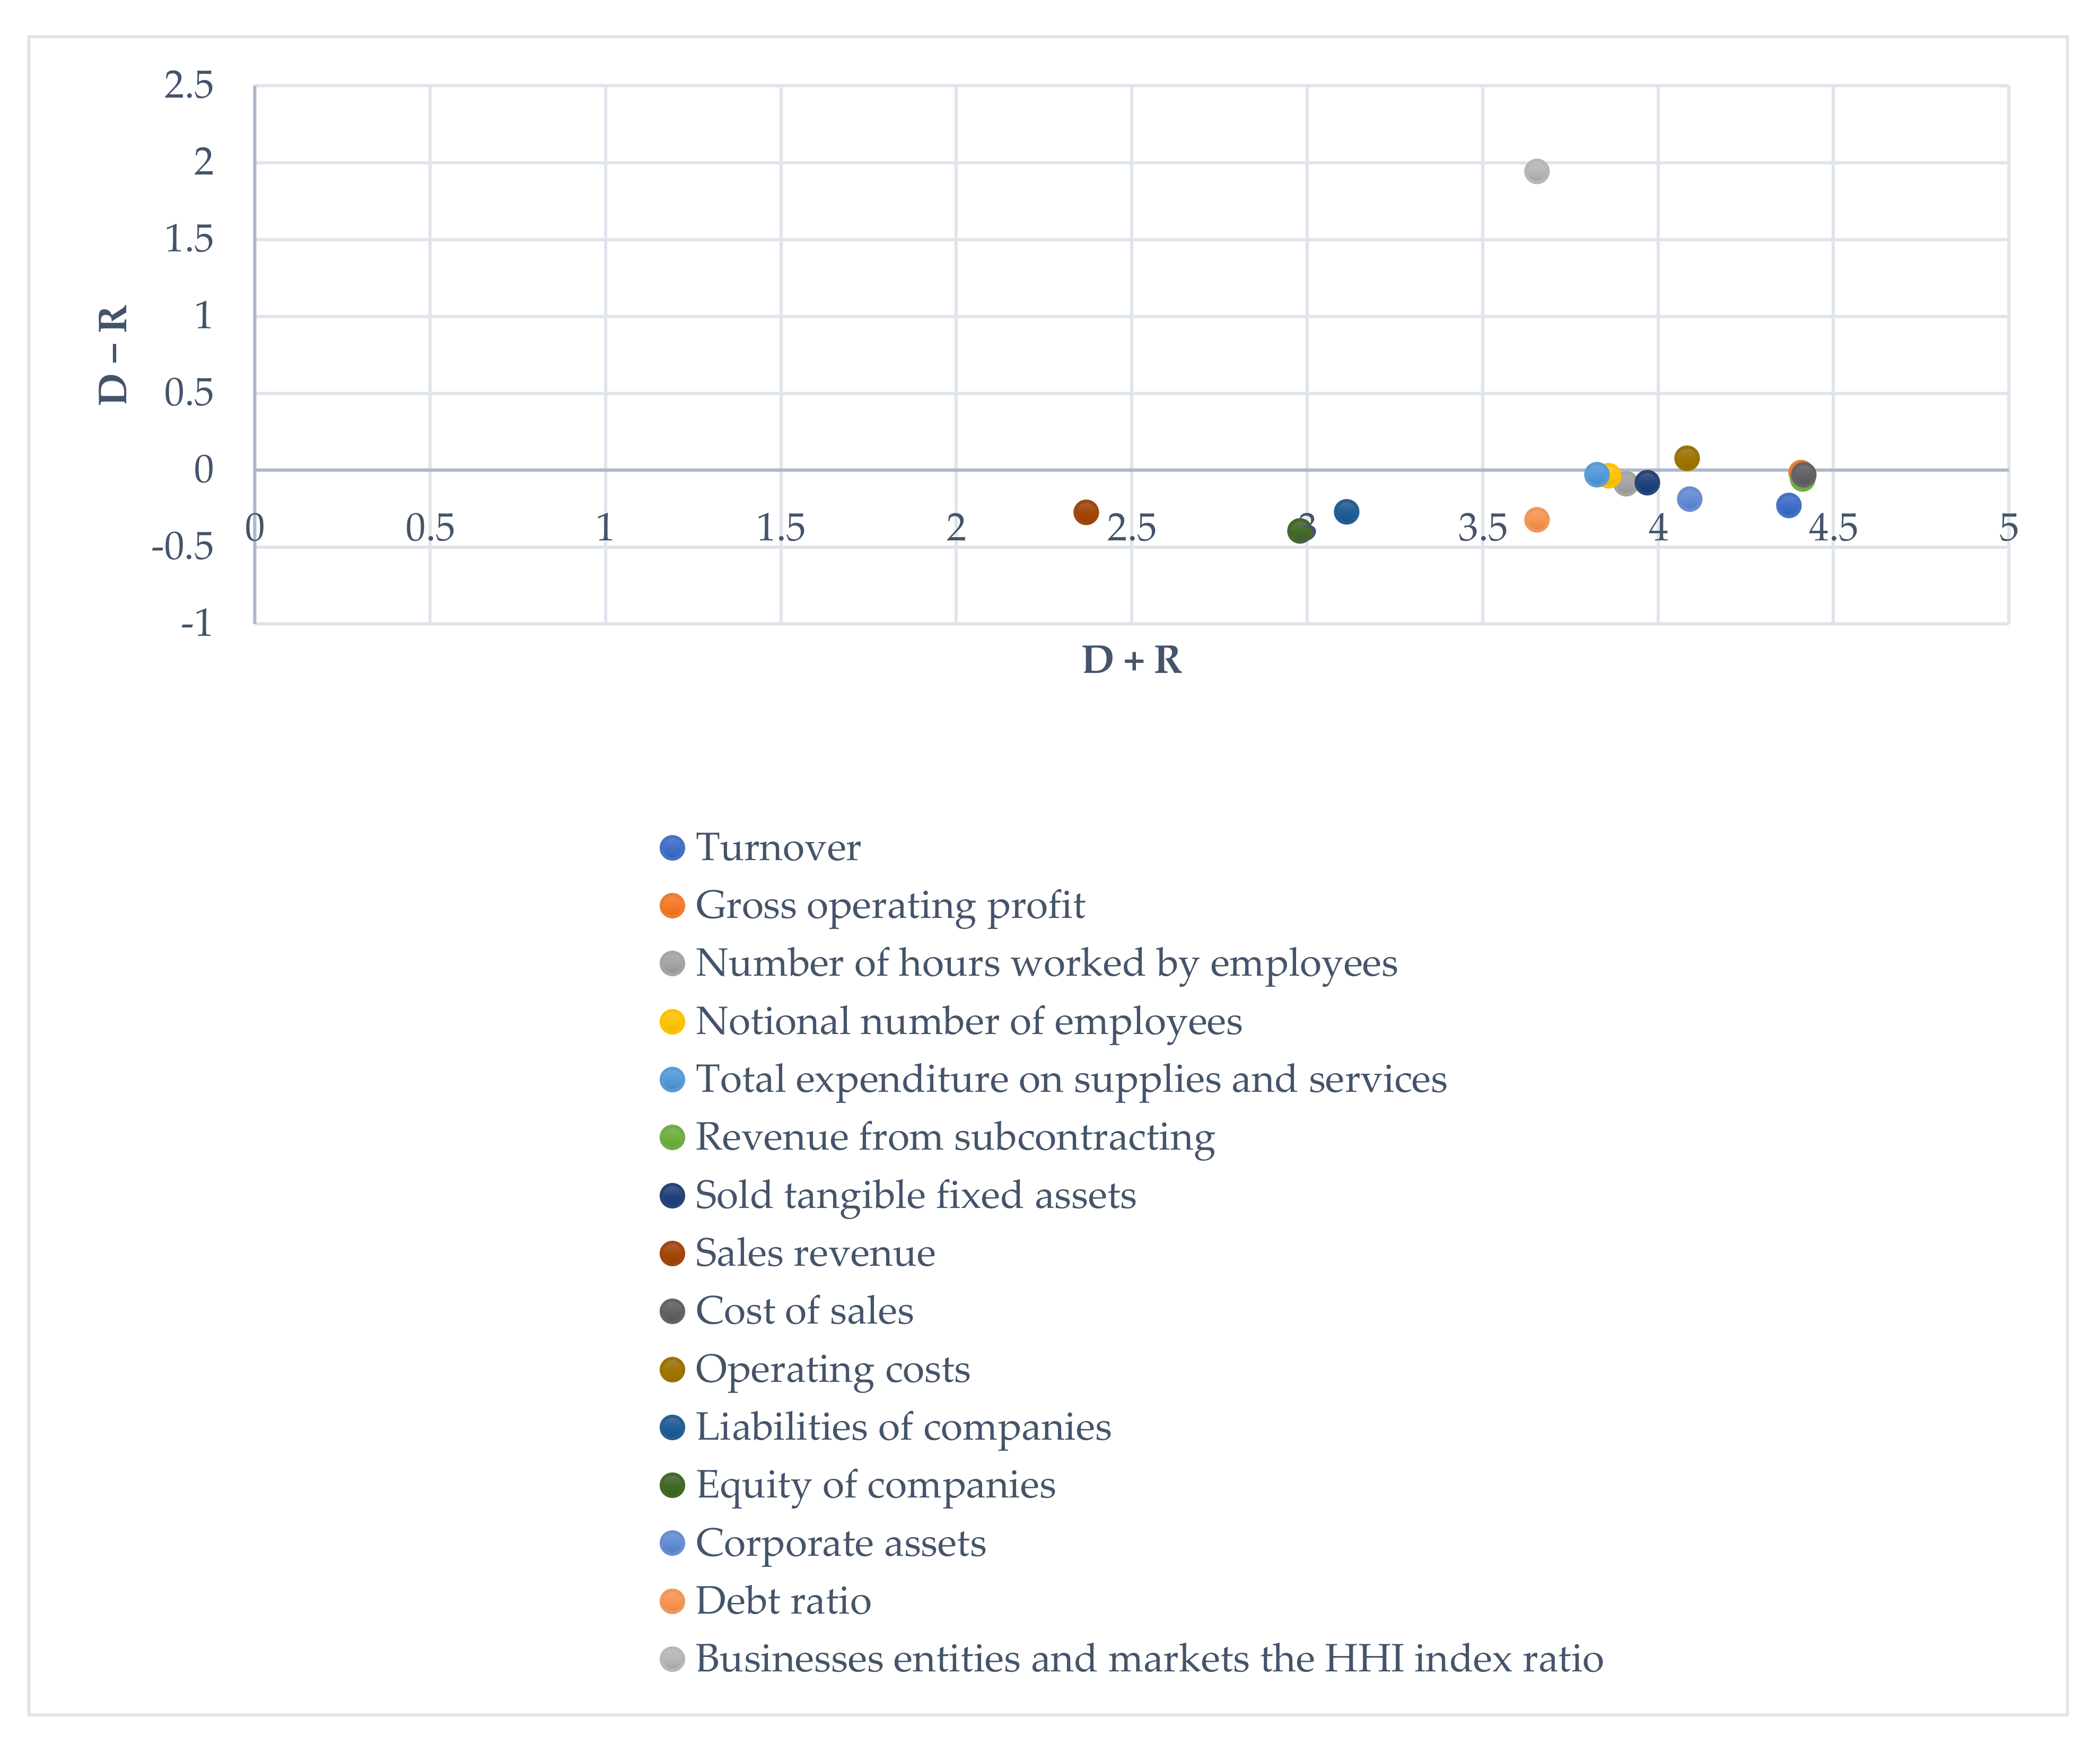
The following Figure 1 shows the important relations. Model was shown as a chart in which the scores of D + R are on the horizontal axis, the results of D − R on the vertical axis. The interaction and position of each parameter with a points in the coordinates (D + R, D − R) are estimated by coordinate system.
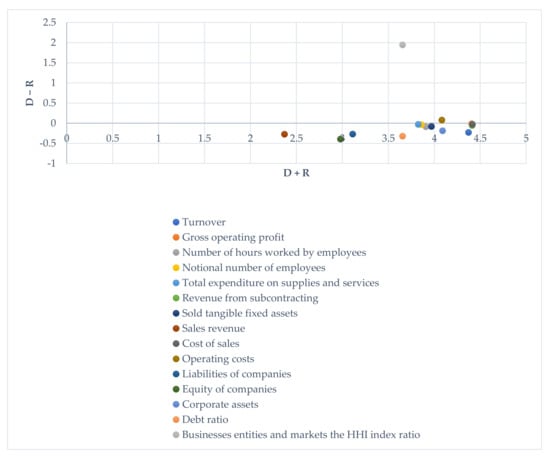
Figure 1.
Cause-effect diagram.
- -
- D + R shows the level of importance between parameters, which works in the whole system. D + R shows both scores i’s impact on the entire system and influence of other system factors’ on the score in terms of importance degree. Cost of sales is ranked in the first place and next are ranked Revenue from subcontracting, Gross operating profit, Turnover, Corporate assets, Operating costs, Sold tangible fixed assets, Number of hours worked by employees, Notional number of employees, Total expenditure on supplies and services, Businesses entities and markets the HHI index ratio, Debt ratio, Liabilities of companies, Equity of companies and Sales revenue.
- -
- D − R shows the degree of a score’s impact on system. In general, the positive value of D − R represents a causal variable, and the negative value of D − R represents an effect. In this study Operating costs, Businesses entities and markets, HHI index ratio are regarded as causal variables. Turnover, Gross operating profit, Number of hours worked by employees, Notional number of employees, Total expenditure on supplies and services, Revenue from subcontracting, sold tangible fixed assets, Sales revenue, Cost of sales, Liabilities of companies, Equity of companies, corporate assets, Debt ratio are regarded as an effect.
5. Discussion
In this article, are identified the main economic indicators that influence the change in the HHI index, their volumes are estimated, it allows to plan business strategies that would help to achieve a sustainable market situation by reducing market concentration. Indicators such as Operating costs, Businesses entities and markets, the HHI index ratio are regarded as a causal variables. Turnover, Gross operating profit, Number of hours worked by employees, Notional number of employees, Total expenditure on supplies and services, Revenue from subcontracting, sold tangible fixed assets, Sales revenue, Cost of sales, Liabilities of companies, Equity of companies, corporate assets, Debt ratio are regarded as an effect.
After receiving the results, we can state that the DEMATEL method is appropriate for assessing the competitive position of a business entity. The HHI was used in the specifications of the level of competition and market concentration in the sector. After empirical verification, we can state that the DEMATEL method is an appropriate multi-criteria tool, assessing the construction sector’s sustainability, as it can help to identify which criteria have the greatest impact on a company’s HHI index. This method is used to analyze and describe the cause-and-effect relationship between the assessment criteria or by revealing the interrelationship of the factors. DEMATEL method analyzes the components of each criterion, also the intensity of direct and indirect relationships between the components, causal links and strength of influence. The first hypothesis was confirmed.
The following are works of similar specificity, which examined concentration indices by using multicriteria methods such as DEMATEL at the full information level, as well as at the GRAY and FUZZY levels. Author Hasan [49] used HHI-based evaluation of the European banking sector using an integrated fuzzy approach, in his work, he also used the HHI index to assess the distorted market, this index was also chosen as valid. In the further research it would be useful to apply FUZZY approach and compare it with this work results. Tzend and Opricovic [50] applied DEMATEL method but noted that there are cases when the assessment of alternatives should provide a well-established criteria and improvement of a multi-criteria decision model is necessary to cope with qualitative, linguistic or limited information. Xiqiang and Junhu [51] research was based on the sustainable circular economy in China Agriculture using Grey-DEMATEL method seeking to determine the development barriers. They noted that it is difficult to develop a circular economy with the lack of sufficient technical and financial support. DEMATEL method was used even at GRAY situations and was successfully implemented. Huichen and Livan [52] used the HHI index to determine the sustainable development of Chinese listed banks. Their work founded that a mix of an entropy index and an HHI are useful for analysing the connection between diversification and risk. They suggest that business entities should use an appropriate diversification to achieve the sustainable development. Wen-Kuo [53] use the DEMATEL to check the main limits for implementing the circular economy, his research method was based on experts, the initial-direct matrix obtained from the experts, however, have been affected by the uncertainty of those relationships. This correlated with our work. Chia-Chen et al. [54] also use the DEMATEL method for the qualitative data analysis, they apply the GRA and DEMATEL methods together with the quantitative data. Based on previous work by the authors, our results are similar, but future work is needed on the FUZZY and GREY levels.
The differences in HHI are caused by the mergers, which are used to define a range, that will not be subject to further merger analysis. These restrictions allow the initial merge control, so they can be considered as secure ports. The HHI is mainly used in the EU as a much more detailed model for calculating the concentration of the construction sector. The Herfindahl-Hirschman Index (HHI) estimates the degree of concentration in a product market and its geography. With respect to the second question of the hypothesis, we can say that the HHI index is suitable for determining the competitive position considering the specifics of the construction sector.
The main limitation in this work is that HHI index results of the relevant period are gathered using existing information merely, and forecasts are not available. In the markets which are frequently undergoing restructuring, it is difficult to assess the the market size—as it changes frequently. Particular predictions are possible, when there are available number of companies in the construction sector and their market shares. All businesses should be included in the HHI index calculation, and the lack of information on very small businesses may be negligible as they do not have a significant influence on the bottom line. However, it could be stated that the change in the HHI index during the period (in our case 2015–2019) affects the ability of a business entity to avoid market distortions vis-à-vis competitors, thus confirming the third hypothesis.
Another limitation of this study relates to the DEMATEL method and the selection of the expert group. The selection of experts necessarily involves subjective bias in academic and industrial networks. However, despite the aim of neutrality and the special attention paid to the consistency and complementarity of the selected profiles, it seems difficult to remove these difficulties completely, given the purpose of the study. Future research should examine and compare the results in detail, interviewing not only business representatives but also researchers in the field. Despite the widespread use of the HHI index in a distorted market, further research should extend the remaining concentration indices discussed, to assess the competitive situation in the construction sector using the DEMATEL method. The applicability of these methods to different levels of distorted market should be assessed also.
6. Conclusions
Competition usually is determined with the help of these variables: concentration, price marginal costs, taxes and import penetration. Exists structural (parametric) and non-structural (non-parametric) approaches to measure competition in the construction sector. The structural approach of research relies on the structure-behavior-performance (SCP) paradigm, which is tied with the relationship between construction sector’s market structure and companies behavior. CR and the HHI are commonly used as indicators of competition. The main problem of using CR as an index for estimating competition is that there are serious issues in interpreting the number and size of the distribution. In the data of larger n firms only total value (sales, wealth, and employment) are considered, and value outside those firms and their distribution are clearly ignored.
Unstructured approach is more difficult than the structural, because of the the data quality and assessment methodologies. One of the most useful and popular indicators is the Lerner index (LI), which is used to determine market power of entities in construction market according to mark-ups above the marginal price. The calculation of the Rosenbluth index (RI), which reflects the level of market concentration, is based on a limited number of market participants. The RI is calculated only when the number of construction market participants is finite and when one company has a larger market share than others. This means that the level of concentration in the market cannot be calculated according to the RI if there are companies with the same market share.
The main limitation of HHI is due to unavailability of predictions since it is difficult to determine size of the market—it often changes. Predictions are possible if the number of construction sector’s players is available, and their market shares are known. All enterprises should be included in the calculation of the HHI, and the lack of information on very small enterprises may be insignificant, as they do not have notable impact on the outcome.
Knowing the key economic indicators and their impact on the change of the HHI index, it is possible to plan business strategies that would help to achieve a sustainable market situation by reducing market concentration. The diagram of vector (D + R) shows the degree of importance of each parameter, which they play in the system. (D + R) shows both scores of influence on the all system and influence of other system parameters’ on the score according to importance level. Cost of sales is ranked in the first place and next are ranked Revenue from subcontracting, Gross operating profit, Turnover, Corporate assets, Operating costs, sold tangible fixed assets, number of hours worked by employees, Notional number of employees, Total expenditure on supplies and services, Businesses entities and markets the HHI index ratio, Debt ratio, Liabilities of companies, Equity of construction companies and Sales revenue. Empirical results show that the vector (D − R) illustrates the level of a score’s impact on system. The positive value of D − R shows a causal variable, and the negative value of D − R represents an influence. In this work, Operating costs, Businesses entities and markets the HHI ratio are considered to be as a causal variable, Turnover, Gross operating profit, Number of hours worked by employees, Notional number of employees, Total expenditure on supplies and services, Revenue from subcontracting, Sold tangible fixed assets, Sales revenue, Cost of sales, Liabilities of companies, Equity of the construction companies, Corporate assets, Debt ratio are regarded as an effect.
Funding
This project has received funding from European Social Fund (project No 09.3.3-LMT-K-712-19-0025) under grant agreement with the Research Council of Lithuania. (LMTLT).
Institutional Review Board Statement
Not applicable.
Informed Consent Statement
Not applicable.
Data Availability Statement
Not applicable.
Conflicts of Interest
The authors declare no conflict of interest.
References
- Amir, R.; Machowska, D.; Troege, M. Advertising patterns in a dynamic oligopolistic growing market with decay. J. Econ. Dyn. Control 2021, 131, 104229. [Google Scholar] [CrossRef]
- Androniceanu, A.; Caplescu, R.D.; Tvaronavičienė, M.; Cosmin, D. The interdependencies between economic growth, energy consumption and pollution in Europe. Energies 2021, 14, 1–23. [Google Scholar]
- Wisuttisak, P.; Kim, C.; Rahim, M. PPPs and challenges for competition law and policy in ASEAN. Econ. Anal. Policy 2021, 71, 291–306. [Google Scholar] [CrossRef]
- Lăzăroiu, G.; Kliestik, T.; Novak, A. Internet of Things Smart Devices, Industrial Artificial Intelligence, and Real-Time Sensor Networks in Sustainable Cyber-Physical Production Systems. J. Self-Gov. Manag. Econ. 2021, 9, 20–30. [Google Scholar] [CrossRef]
- Nica, E.; Stan, C.I.; Luțan, A.G.; Oașa, R.Ș. Internet of Things-based Real-Time Production Logistics, Sustainable Industrial Value Creation, and Artificial Intelligence-driven Big Data Analytics in Cyber-Physical Smart Manufacturing Systems. Econ. Manag. Financ. Mark. 2021, 16, 52–62. [Google Scholar] [CrossRef]
- Rahman, D.; Kabir, M.; Oliver, B. Does exposure to product market competition influence insider trading profitability? J. Corp. Financ. 2021, 66, 101792. [Google Scholar] [CrossRef]
- Bradūnas, V.; Mikelionytė, D.; Petrauskaitė, L. Lietuvos Duonos Rinkos Koncentracijos Poveikio Kainoms Ekonominis Vertinimas: Mokslo Studija; Lietuvos Agrarinės Ekonomikos Institutas: Vilnius, Lithuania, 2010; Available online: http://www.laei.lt/?mt=leidiniai&straipsnis=329&metai=2010 (accessed on 1 October 2021). (In Lithuanian)
- Maurel, F.; Sédillot, B. A measure of the geographic concentration in french manufacturing industries. Reg. Sci. Urban Econ. 1999, 29, 575–604. [Google Scholar] [CrossRef]
- Directorate for Financial And Enterprise Affairs Competition Committee. Market Definition; DAF/COMP (2012)13/REV1; Directorate for Financial And Enterprise Affairs Competition Committee: Helsinki, Finland, 2012. [Google Scholar]
- Gancevskaitė, K. Research of Competition in Lithuanian Life Insurance Market. Master’s Thesis, Vytauto Didžiojo Universitetas, Kaunas, Lithuania, 2008. Available online: https://hdl.handle.net/20.500.12259/124545 (accessed on 1 October 2021).
- Valaskova, K.; Ward, P.; Svabova, L. Deep Learning-assisted Smart Process Planning, Cognitive Automation, and Industrial Big Data Analytics in Sustainable Cyber-Physical Production Systems. J. Self-Gov. Manag. Econ. 2021, 9, 9–20. [Google Scholar] [CrossRef]
- Loertscher, S.; Marx, L. Digital monopolies: Privacy protection or price regulation? Int. J. Ind. Organ. 2020, 71, 102623. [Google Scholar] [CrossRef]
- Brooks, W.; Kaboski, J. Exploitation of labor? Classical monopsony power and labor’s share. J. Dev. Econ. 2021, 150, 102627. [Google Scholar]
- Branger, N.; Flacke, R.; Gräber, N. Monopoly power in the oil market and the macroeconomy. Energy Econ. 2020, 85, 106–113. [Google Scholar] [CrossRef]
- Chen, Y.; Wei, X.; Zhang, L. A new measurement of sectoral concentration of credit portfolios. Procedia Comput. Sci. 2013, 17, 1231–1240. [Google Scholar]
- Chernenko, N. Market power issues in the reformed Russian electricity supply industry. Energy Econ. 2015, 50, 315–323. [Google Scholar]
- Chileshe, M.P. Bank Competition and Financial System Stability in a Developing Economy: Does Bank Capitalization and Size Matter? BoZWorking Paper 5/2017; Bank of Zambia: Vilnius, Lithuania, 2017; Available online: https://mpra.ub.uni--muenchen.de/82758/1/MPRA_paper_82758.pdf (accessed on 6 October 2019).
- Chortareas, G.; Noikokyris, E. Investment, firm-specific uncertainty, and market power in South Africa. Econ. Model. 2021, 96, 389–395. [Google Scholar]
- Claessens, S. Competition in the Financial Sector: Overview of Competition Policies; IMFWorking Paper; International Monetary Fund: Bali, Indonesia, 2009. [Google Scholar]
- Albrecht, J.; Cai, X.; Gautier, P.; Vroman, S. Multiple applications, competing mechanisms, and market power. J. Econ. Theory 2020, 190, 105121. [Google Scholar] [CrossRef]
- Guo, Y.; Yu, X.; Zhou, C.; Lyu, G. Government subsidies for preventing supply disruption when the supplier has an outside option under competition. Transp. Res. E Logist. Transp. Rev. 2021, 147, 102218. [Google Scholar] [CrossRef]
- Fernández-Villaverde, J.; Mandelman, F.; Yu, Y.; Zanetti, F. The “Matthew effect” and market concentration: Search complementarities and monopsony power. J. Monet. Econ. 2021, 121, 62–90. [Google Scholar]
- Li, J.; Zhang, Y. The side with larger network externality should be targeted aggressively? Monopoly pricing, reference price and two-sided competition. Transp. Res. E Logist. Transp. Rev. 2021, 147, 102218. [Google Scholar] [CrossRef]
- Guissoni, L.; Rodrigues, J.; Zambaldi, F. Distribution effectiveness through full- and self-service channels under economic fluctuations in an emerging market. J. Retail. 2021, 97, 545–560. [Google Scholar]
- Gyimah, D.; Siganos, A.; Veld, C. Effects of financial constraints and product market competition on share repurchases. J. Int. Financ. Mark. Inst. Money 2021, 74, 101392. [Google Scholar] [CrossRef]
- Nica, E.; Stehel, V. Internet of Things Sensing Networks, Artificial Intelligence-based Decision-Making Algorithms, and Real-Time Process Monitoring in Sustainable Industry 4.0. J. Self-Gov. Manag. Econ. 2021, 9, 35–47. [Google Scholar] [CrossRef]
- Kovacova, M.; Lăzăroiu, G. Sustainable Organizational Performance, Cyber-Physical Production Networks, and Deep Learning-assisted Smart Process Planning in Industry 4.0-based Manufacturing Systems. Econ. Manag. Financ. Mark. 2021, 16, 41–54. [Google Scholar] [CrossRef]
- Hirche, M.; Farris, P.; Greenacre, L.; Quan, Y.; Wei, S. Predicting Under - and Overperforming SKUs within the Distribution–Market Share Relationship. J.Retail. 2021, 97. [Google Scholar]
- Huang, Y.; Qian, L. Buy, lease, or share? Consumer preferences for innovative business models in the market for electric vehicles. Technol. Forecast. Soc. Change 2021, 166, 120639. [Google Scholar]
- Jenkins, M.; Liu, P. The browser war—Analysis of Markov Perfect Equilibrium in markets with dynamic demand effects. J. Econom. 2021, 222, 244–260. [Google Scholar]
- Lee, C.; Rhee, B. Retailer-run resale market and supply chain coordination. Int. J. Prod. Econ. 2021, 235, 108089. [Google Scholar]
- Mao, Z.; Duan, Y.; Yao, Y.; Huo, J. The moderating effect of average wage and number of stores on private label market share: A hierarchical linear model analysis. J. Retail. Consum. Serv. 2021, 60, 102454. [Google Scholar]
- Mukherjee, A.; Carvalho, M. Dynamic decision making in a mixed market under cooperation: Towards sustainability. Int. J. Prod. Econ. 2021, 241, 108270. [Google Scholar]
- Novak, A.; Bennett, D.; Kliestik, T. Product Decision-Making Information Systems, Real-Time Sensor Networks, and Artificial Intelligence-driven Big Data Analytics in Sustainable Industry 4.0. Econ. Manag. Financ. Mark. 2021, 16, 62–72. [Google Scholar] [CrossRef]
- Jung, H.; Subramanian, A. Search, product market competition and CEO pay. J. Corp. Financ. 2021, 69. [Google Scholar] [CrossRef]
- Beall, R.F.; Hollis, A.; Kesselheim, A.; Spackman, E. Reimagining Pharmaceutical Market Exclusivities: Should the Duration of Guaranteed Monopoly Periods Be Value Based? Value Health 2021, 24, 1328–1334. [Google Scholar] [CrossRef] [PubMed]
- Moussawi, C.; Mansour, R. Competition, cost efficiency and stability of banks in the MENA region. Q. Rev. Econ. Financ. 2021, 82, 115–125. [Google Scholar] [CrossRef]
- Prayoonrattana, J.; Laosuthi, T.; Chaivichayachat, B. Empirical Measurement of Competition in the Thai Banking Industry. Economies 2020, 8, 44. [Google Scholar]
- Subramaniam, R.; Prakash, V.; Ab-Rahim, R.; Selvarajan, S.K. Financial Development, Eciency, and Competition of ASEAN Banking Market. Asia-Pac. Soc. Sci. Rev. 2019, 19, 185–202. [Google Scholar]
- Schøne, P.; Strøm, M. International labor market competition and wives’ labor supply responses. Labour Econ. 2021, 70, 101983. [Google Scholar]
- Gehlot, M.; Shrivastava, S. Sustainable construction Practices: A perspective view of Indian construction industry professionals. Mater.Today Proc. 2021, in press. [Google Scholar] [CrossRef]
- Ogunmakinde, O.; Egbelakin, T.; Sher, W. Contributions of the circular economy to the UN sustainable development goals through sustainable construction. Resour. Conserv. Recycl. 2021, 178, 106023. [Google Scholar] [CrossRef]
- Becchetti, L.; Bruni, L.; Zamagni, S. Non-competitive markets and elements of game theory. In The Microeconomics of Wellbeing and Sustainability; Academic Press: Cambridge, MA, USA, 2020; pp. 157–198. [Google Scholar] [CrossRef]
- Li, J.; Sun, W.; Song, H.; Li, R.; Hao, J. Toward the construction of a circular economy eco-city: An emergy-based sustainability evaluation of Rizhao city in China. Sustain. Cities Soc. 2021, 71, 102956. [Google Scholar] [CrossRef]
- Wang, J.; Wu, C.; Zhong, X. Prospect theory and stock returns: Evidence from foreign share markets. Pac.-Basin Financ. J. 2021, 69, 101644. [Google Scholar] [CrossRef]
- Marcysiak, A.; Pleskacz, Ż. Determinants of digitization in SMEs. Entrep. Sustain. Issues 2021, 9, 300–318. [Google Scholar]
- Shevyakova, A.; Munsh, E.; Arystan, M.; Petrenko, Y. Competence development for Industry 4.0: Qualification requirements and solutions. Insights Reg. Dev. 2021, 3, 124–135. [Google Scholar]
- Eurostat. Construction Statistics—Supply, Transformation, Consumption. 2021. Available online: https://ec.europa.eu/eurostat/web/main/data/database?p_p_id=NavTreeportletprod_WAR_NavTreeportletprod_INSTANCE_nPqeVbPXRmWQ&p_p_lifecycle=0&p_p_state=pop_up&p_p_mode=view&_NavTreeportletprod_WAR_NavTreeportletprod_INSTANCE_nPqeVbPXRmWQ_nodeInfoService=true&nodeId=-2625 (accessed on 6 October 2021).
- Hasan, D. HHI-based evaluation of the European banking sector using an integrated fuzzy approach. Kybernetes Int. J. Syst. Cybern. 2019, 48, 1195–1215. [Google Scholar] [CrossRef]
- Tzeng, G.; Opricovic, S. Defuzzification within a multicriteria decision model. Int. J. Uncertain. Fuzziness Knowl.-Based Syst. 2003, 11, 635–652. [Google Scholar] [CrossRef]
- Xia, X.; Ruan, J. Analyzing Barriers for Developing a Sustainable Circular Economy in Agriculture in China Using Grey-DEMATEL Approach. Sustainability 2020, 12, 6358. [Google Scholar] [CrossRef]
- Jiang, H.; Han, L. Does Income Diversification Benefit the Sustainable Development of Chinese Listed Banks? Analysis Based on Entropy and the Herfindahl–Hirschman Index. Entropy 2018, 20, 255. [Google Scholar] [CrossRef] [PubMed] [Green Version]
- Chen, W.-K.; Nalluri, V.; Hung, H.-C.; Chang, M.-C.; Lin, C.-T. Apply DEMATEL to Analyzing Key Barriers to Implementing the Circular Economy: An Application for the Textile Sector. Appl. Sci. 2021, 11, 3335. [Google Scholar] [CrossRef]
- Yang, C.-C.; Ou, S.-L.; Hsu, L.-C. A Hybrid Multi-Criteria Decision-Making Model for Evaluating Companies’ Green Credit Rating. Sustainability 2019, 11, 1506. [Google Scholar] [CrossRef] [Green Version]
Publisher’s Note: MDPI stays neutral with regard to jurisdictional claims in published maps and institutional affiliations. |
© 2022 by the author. Licensee MDPI, Basel, Switzerland. This article is an open access article distributed under the terms and conditions of the Creative Commons Attribution (CC BY) license (https://creativecommons.org/licenses/by/4.0/).