Article

Red to Blue Light Ratio and Iron Nutrition Influence Growth, Metabolic Response, and Mineral Nutrients of Spinach Grown Indoors

by
Viktorija Vaštakaitė-Kairienė
1,*,
Aušra Brazaitytė
1,
Jurga Miliauskienė
1 and
Erik S. Runkle
2,*
1
Lithuanian Research Centre for Agriculture and Forestry, Institute of Horticulture, Kaunas Street 30, LT-54333 Babtai, Lithuania
2
Department of Horticulture, Michigan State University, 1066 Bogue Street, East Lansing, MI 48824-1325, USA
*
Authors to whom correspondence should be addressed.
Sustainability 2022, 14(19), 12564; https://doi.org/10.3390/su141912564
Submission received: 10 July 2022 / Revised: 18 September 2022 / Accepted: 28 September 2022 / Published: 2 October 2022

Abstract

:
Leafy greens are increasingly being produced indoors with electric lighting from light-emitting diodes (LEDs). Red (R) and blue (B) LEDs are commonly used to ensure healthy plant growth, but biofortification techniques can potentially maximise nutritional quality. The aim of the study was to evaluate the effects of B (peak = 450 nm) and R (peak = 665 nm) light ratios (R:B) of 9:1, 3:1, and 1:3 on growth, metabolic response, and the accumulation of mineral nutrients in spinach ‘Corvair F1’ and ‘Space F1’ grown in hydroponic solutions with different iron (Fe) concentrations (2, 5, and 15 mg L−1). Plant biomass and leaf length, width, and number generally decreased as the R:B decreased, leading to a high concentration of Fe in the solution. A higher Fe dose increased the contents of some other minerals but depended on the R:B and cultivar. For example, Zn generally increased with increasing Fe but Cu content decreased, especially in ‘Space F1’. There were less-profound effects of the R:B and Fe dose on metabolites or antioxidant capacity. The research findings suggest that the overall nutritional quality of spinach could improve with lighting and Fe biofortification strategies and thus increase the sustainability of indoor crop production.

1. Introduction

Leafy green vegetables have substantial health-promoting properties attributed to the functionality of their nutrients and non-essential chemical compounds. Spinach (Spinacia oleracea) is a functional food due to its diverse nutritional composition, including vitamins and minerals, and its phytochemicals and bioactive compounds that promote health beyond essential nutrition. However, the variety or cultivation method of spinach can influence the nutrient composition [1].
More leafy greens, including spinach, are being produced in indoor farms. Vertical farming’s strength lies in producing crops indoors under optimized and consistent environmental conditions. As a result, indoor farming is weather and climate independent, requires less inputs of natural resources, and has a higher net productivity than field agriculture. Less water consumption, year-round production, reduced (or no) pesticide or herbicide use, and chemical runoff prevention are some of the key advantages of these systems over land-based farming. These advantages and various other environmental and social advantages of urban CEA uphold its potential to tackle the effects of urbanization and food insecurity [2,3].
Indoor farming usually does not include sunlight, and thus electric light sources are used to provide a desirable photon spectrum and flux density to increase the performance of vital processes in plants. Light-emitting diodes (LEDs) are the most promising lighting technology for CEA systems considering the confines of space, energy efficacy, high throughput, and high product quality [4]. Many studies have shown that adjusting LED light parameters, such as the photon spectrum, photon flux density, and the photoperiod, influence the growth of various horticultural plants. Blue (B; 400–499 nm) and red (R; 600–699 nm) light are sometimes considered to be the most efficient for plant growth because of its absorption by chlorophylls and carotenoids. In addition, there are blue light photoreceptors [cryptochromes (cry1-3)] and red/far-red light photoreceptors [phytochromes (phyA-E)] that play fundamental roles in the perception of the light environment and the subsequent morphological acclimation that influences plant growth and development [5,6].
The effects of LED lighting parameters on spinach growth and metabolism are presented in several studies. Yorio et al. [7] demonstrated that adding about 30 µmol m−2 s−1 of B light to R LEDs greatly improved spinach growth. Zou et al. [4] showed that spinach plants grown under an R:B of 4:1 at a photosynthetic photon flux density (PPFD) of 150 µmol m−2 s−1 for 13 h d−1 had the highest fresh weight, dry weight, and root surface area among the test groups. Furthermore, that ratio and PPFD for 9 h d−1 elicited the greatest soluble sugar content or protein content in spinach [4].
Several research studies about using LED lighting as a tool for plant biofortification have been recently published. One of the main topic areas of biofortification is plant quality improvement with an increased content of various mineral nutrients [8,9,10,11]. Biofortification is the concept of delivering minerals via staple foods through agronomic practices, conventional plant breeding, or modern biotechnology [12]. Nutrient balance is crucial to the survival and health of all organisms throughout the food chain [13,14]. With the world population continuing to ascend, land space, soil fertility, water accessibility, and nutrient availability are susceptible to degradation from urbanization, industrial activity, and over-cultivation. Thus, there is an increasing need to develop technologies for producing water-efficient and nutrient-enriched crops to improve agriculture sustainably without an excessive reliance on fertilizers and pesticides [14].
The element iron (Fe) is one of the most abundant in the earth’s crust and an essential requirement for organisms [12]. Fe accepts and donates electrons and plays important roles in the electron transport chains associated with photosynthesis and respiration [15]. Fe is a precursor of chlorophyll synthesis and a constituent of cytochromes and ferredoxin in the electron transport pathway [16,17] and is a co-factor of many vital enzymes [18]. Insufficient Fe uptake causes retarded growth, interveinal chlorosis, and reduced fitness. Too much Fe is, however, toxic to cells. Sufficient Fe levels in food crops are critical to combat Fe deficiency-induced anemia, which is one of the largest nutritional disorders worldwide. It is, therefore, mandatory for plants to overcome the often-restricted availability of soil Fe by strategies that increase its mobility and restrict its uptake when present in excess [18]. The ferric form (Fe3+) is dominant in soils, but most plants absorb the ferrous form (Fe2+). Fe is highly reactive and must be chelated throughout intra- and inter-cellular trafficking to avoid cellular damage [18]. Additionally, Fe metabolism is tightly linked to the nutritional quality and antioxidant activity of plant products [19]. The level of Fe in plant biomass is ultimately partitioned into the higher trophic levels through the consumption of vegetarian foods [12]. A consistent consumption of fresh vegetables with a high nutritional quality can prevent various human health diseases such as cardiovascular diseases, cancer, diabetes, and obesity [20].
Several studies have elucidated the mechanistic basis for Fe uptake and distribution throughout the plant [12]. How plants sense their Fe status is a new frontier in this field of research [21]. The uptake of Fe in spinach and the impact of LED lighting in CEA have not been thoroughly investigated. We hypothesized that the photon spectrum (at a constant photon flux density) would modify the uptake of Fe and other mineral nutrients, influencing the growth and metabolic response of spinach. Therefore, we grew two spinach cultivars under light with different R:B ratios and Fe concentrations in hydroponic solution. In addition, we evaluated the plant growth parameters, accumulation of macro- and micro-nutrients, sugars, total phenolic content, and antioxidant capacity, according to the DPPH and ABTS free radical scavenging activities, and the ferric reducing antioxidant power (FRAP) of spinach. Sugars are regulatory molecules of gene expression that can affect growth, development, and induce metabolic processes, including the synthesis of stress-resistance compounds [22]. For this reason, we quantified plant soluble sugars (e.g., glucose or fructose) and evaluated the content of phenolic compounds as they act like antioxidants by reacting with a variety of free radicals [23].

2. Materials and Methods

2.1. Growth Conditions

The two replicates of the experiments were performed in the Controlled-Environment Lighting Laboratory at Michigan State University, East Lansing, MI, USA. The seeds of two hybrid smooth-leaf spinach (Spinacia oleracea) cultivars, ‘Space F1’ (Johnny’s Selected Seeds, Winslow, ME, USA) and ‘Corvair F1’ (Territorial Seed Company, Cottage Grove, OR, USA), were sown into Rockwool cubes (2.5 cm × 2.5 cm) (AO 25/40 Starter Plugs; Grodan, Milton, ON, Canada), pre-soaked in deionized water (pH of 4.4–4.5). The seeded cubes were placed in plastic trays at a constant 18 °C air temperature and covered with transparent humidity domes for 4 days. After, the trays were placed under warm-white LEDs (peak = 639 nm, correlated color temperature = 2700 K) (PHYTOFY RL, OSRAM, Beverley, MA, USA) lighting at a total photon flux density (PFD) of 250 µmol m−2 s−1 for 12 h d−1. The seedlings were watered with a water-soluble fertilizer, which contained (in mg L−1): 125 N (117 NO3; 8 NH4), 42 P, 167 K, 73 Ca, 47 Mg, 34 S, 0.21 B, 0.21 Cu, 1.6 Fe, 0.5 Mn, 0.01 Mo, and 0.36 Zn (Jack’s Nutrients FeEd 12–4–16 (N–P–K); JR Peters, Inc. Allentown, PA, USA; Pennington Epsom salt, Madison, GA, USA). The pH and the electrical conductivity (EC) of the nutrient solution were measured daily using a portable meter (GroLine HI9814, Hanna Instruments, Woonsocket, RI, USA), and were adjusted using sulfuric acid or sodium bicarbonate to maintain a pH of 5.6 and an EC of 1.2 mS cm−1.

2.2. Lighting Treatments and Iron Biofortification

The 16-day old spinach seedlings of each cultivar were transplanted into a deep-flow hydroponic system with three vertically stacked layers (Indoor Harvest, Houston, TX, USA) with a nutrient solution composed of deionized water and the same fertilizer as described previously, but elevated by 20% (e.g., 150 mg L−1 N). The pH (5.4 ± 0.2 standard deviations) and EC (1.8 ± 0.1 mS cm−1) of the nutrient solution tanks were measured daily. The plants were grown at an air temperature of 20 °C with ambient CO2.
For the iron (Fe) biofortification treatments, the 6% Fe chelate (Fe EDDHA, C18H20N2O6FeNa) was used. The Fe EDDHA was added to the nutrient solution up to 5 mg L−1 and 15 mg L−1. The treatment with the R:B ratio of 9:1 and nutrient solution without the added Fe EDDHA (2 mg L−1) was considered a control treatment.
The transplanted spinach plants were grown under a controllable lighting fixture (PHYTOFY RL, OSRAM, Beverley, MA, USA) consisting of B (peak = 450 nm) and R (peak = 665 nm) LEDs. In experiments, LEDs were used at different PPFD ratios of R:B: 9:1, 3:1, and 1:3. All lighting treatments delivered the same PPFD of 250 μmol m−2 s−1 for 12 h d−1, which yielded a daily light integral of 10.8 mol m−2 d−1. The photon distributions of all lighting treatments were measured using a portable spectroradiometer (PS-200; Apogee Instruments, Inc., Logan, UT, USA) (Table 1).

2.3. Measurements of Growth Parameters and Relative Chlorophyll Content

After 34 d from the seed sow, destructive measurements were conducted on ten spinach plants of each cultivar from each lighting treatment and replication. The shoot fresh weight (FW, g) and dry weight (DW, g) were measured using an analytical balance (AG245; Mettler Toledo, Columbus, OH, USA). The leaf length (cm) and width (cm) of the fourth fully expanded leaf and leaf number (when >2 cm) were measured. The shoots were dried in an oven (Blue M, Blue Island, IL, USA) at 60 °C for 4 days.
The relative chlorophyll content (SPAD) was evaluated using an MC–100 m (Apogee Instruments, Inc, Logan, UT, USA). The measurements were made on the fourth fully expanded leaf of ten plants from each lighting treatment, from two replicates of the experiment, to calculate an average SPAD value.

2.4. The Determination of Mineral Nutrients

The contents of mineral nutrients in the mature leaves of spinach were determined by the modified microwave-assisted digestion technique combined with inductively coupled plasma optical emission spectrometry (ICP-OES) methods, as described by Araújo et al. [24] and Barbosa et al. [25]. The complete digestion of 0.5 g of powdered plant material, dried at 60 °C for 48 h, was achieved with 8 mL of 65% nitric acid using a microwave-assisted digestion system (Multiwave GO; Anton Paar GmbH, Graz, Austria), following a two-step heating program: (1) 3 min to 150 °C then held for 10 min, and (2) 10 min to 180 °C then held for 10 min, and then the final cooling. The mineralized samples were diluted to 50 mL with ultrapure deionized water (Elga PURELAB Flex, VWS (UK) Ltd. Trading as ELGA LabWater Woodridge, IL, USA), and filtered with Whatman Grade 1 qualitative filter paper (Tisch Scientific, OG, USA). The nutrient profile was analyzed by ICP-OES (SPECTRO Genesis spectrometer, Analytical Instruments GmbH, Kleve, Germany). The contents of the mineral nutrients (mg L−1) were evaluated according to analytical wavelengths of 766.491 nm for potassium (K), 445.478 nm for calcium (Ca), 279.079 nm for magnesium (Mg), 259.941 nm for iron (Fe), 213.856 nm for zinc (Zn), and 213.618 nm for phosphorus (P). The content of each mineral nutrient was calculated as mg g−1 dry matter (DM).

2.5. The Determination of Soluble Sugars

The contents of monosaccharides fructose and glucose, disaccharide sucrose, and trisaccharide raffinose in mature leaves of spinach were determined by ultra-fast liquid chromatography (UFLC) according to Ma et al. [26], with modifications. About 100 mg of dried and ground plant material was diluted with 2 mL of ultrapure deionized water and heated up to 50 °C in an ultrasound bath (Thermo Fisher Scientific Inc., Uppsala, Sweden) for 30 min. After the extraction, the samples were centrifugated for 15 min at 3000 rpm (Hermle Z300K, Baden-Württemberg, Germany). A clean-up step to remove the soluble proteins, according to Brons and Olieman’s [27], was performed prior to the chromatographic analysis: 0.5 mL of the supernatant was mixed with 0.5 mL of 0.01% (w/v) ammonium acetate in acetonitrile and incubated for 30 min at 4 °C. The samples were centrifuged at 14,000× g for 15 min (Hettich MIKRO 120, Westphalia, Germany) and filtered through a 0.22 µm nylon syringe filter (BGB Analytik Vertrieb GmbH, Rheinfelden, Germany). The analyses were performed on a Shimadzu UFLC (Kyoto, Japan) instrument equipped with an evaporative light scattering detector (ELSD). The separation of sugars was performed on a Shodex HILICpak VG-50 4D 5 µm, 4.6 × 150 mm column (Showa Denko America, Inc., New York, NY, USA) with deionized water (mobile phase A) and acetonitrile (mobile phase B) gradient. The gradient was maintained at 77% B for 11.5 min, changed linearly to 71% B at 2.5 min, kept at 71% B for 2 min, and raised back to 77% B in 2 min. The flow rate was 0.8 mL min−1.

2.6. The Determination of Antioxidant Capacity and Total Phenolic Content

The extracts for the determination of the antioxidant capacity and total phenolic content (TPC) were prepared from 100 mg of dried plant material and diluted with 5 mL of 80% ice-cold methanol, and transferred to a 15 mL polypropylene conical centrifuge tube (Thermo Fisher Scientific Inc., Waltham, MA, USA). The extract was incubated at 4 °C for 24 h. After the incubation, the samples were centrifuged for 15 min at 3000 rpm and filtered through Whatman Grade 1 qualitative filter paper.
The TPC of lettuce was determined spectrophotometrically with slight modifications, according to Ainsworth and Gillespie [28]. One hundred µL of the extract was diluted with 200 µL of 10% (vol/vol) Folin and Ciocalteu’s phenol reagent and vortexed thoroughly. Then, 800 µL of 700 mM of sodium carbonate was added. After 20 min, the absorbance of the samples was measured using a spectrophotometer (M501, Spectronic Camspec Ltd., Leeds, UK) at 765 nm. The TPC in the dried plant tissues was calculated using a standard curve of gallic acid (R2 > 0.95). Data are presented as the mean of three analytical measurements of TPC (in mg g−1) on a plant dry mass basis.
The same extracts from the TPC measurements were used to evaluate the antioxidant capacity of spinach leaves. The 2-diphenyl-1-picrylhydrazyl (DPPH), 2,2′-azino-bis (3-ethylbenzothiazoline-6-sulphonic acid) (ABTS) diammonium salt, radical scavenging activities, and Fe2+ reducing antioxidant power assays (FRAP) were performed as described by Sutulienė et al. [29] using a SPECTROstar Nano Microplate Reader from BMG LABTECH (Ortenberg, Germany).
All of the biochemical analyses were performed in two biological replications. Each of the two biological replicates consisted of at least five conjugated plants and were repeated in three analytical replicates.

2.7. Statistical Analyses

We utilized a randomized complete block experimental design that was repeated in time, where the block was the experimental replication (two), experimental units were lighting and iron concentration treatments (nine), and each plant per cultivar was the subsample.
A statistical analysis was performed using Microsoft Excel 2016 and Addinsoft XLSTAT 2022 statistical and data analysis (Long Island, NY, USA). A two-way analysis of variance followed by Tukey’s honestly significant difference test (and p < 0.01 and < 0.05) for multiple comparisons was used to evaluate the differences between the means of the measurements.

3. Results

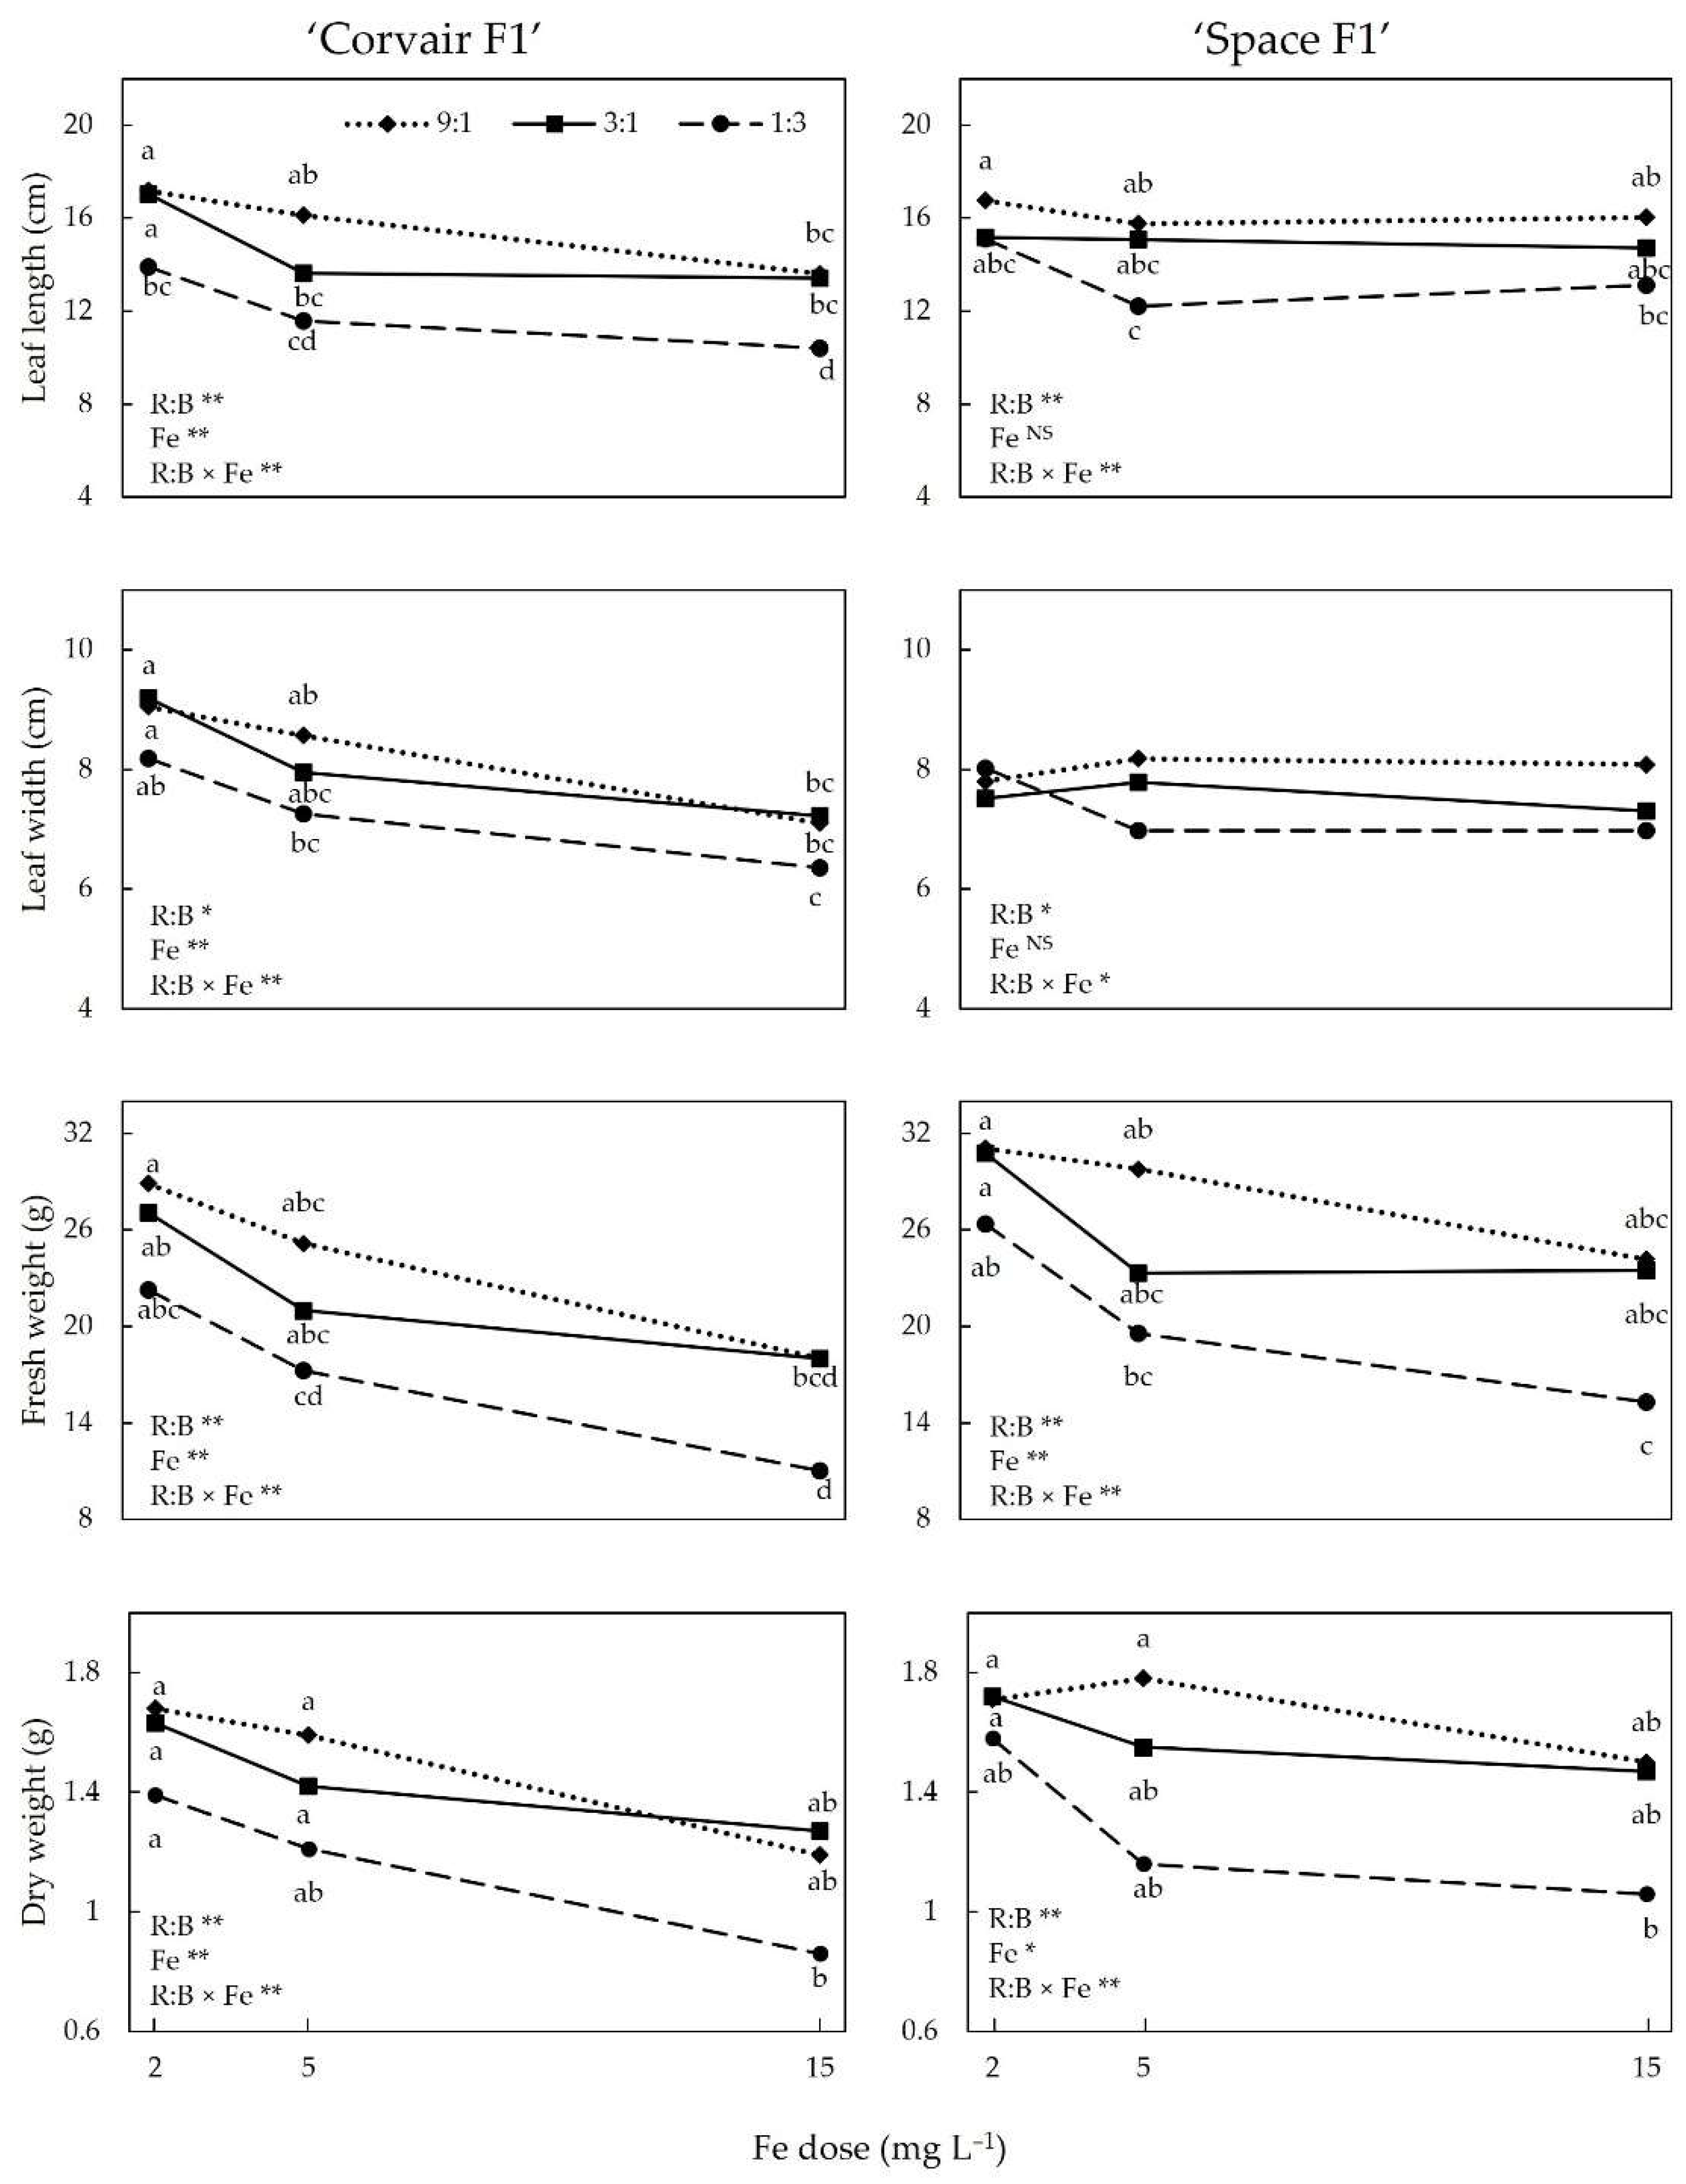
3.1. SPAD Index and Growth Indices

The leaf length and width generally decreased with a decrease in the R:B light ratio (Figure 1). The leaves of ‘Corvair F1’ were also generally smaller when grown with higher Fe concentrations in the hydroponic solution. Collectively, the leaves of both cultivars were shortest and narrowest when grown under the R:B ratio of 1:3 and 15 mg L−1 of Fe. While there was little or no effect of the R:B light ratio on leaf number, the combination of the low R:B and the highest concentration of Fe produced the fewest leaves. These differences in leaf size and number are likely why both cultivars of spinach had the greatest shoot FW (and sometimes DW) under treatments with the higher R:B ratios and lower Fe concentrations (including the control treatment). For example, the FW of ‘Corvair F1’ and ‘Space F1’ decreased by up to 2.6- and 2.0-fold, respectively, as the R:B decreased and Fe increased.
There was no effect of the R:B light ratio on the SPAD index of either spinach cultivar studied (Table 2). However, the SPAD index was greater than the control treatment (R:B = 9:1 and Fe at 2 mg L−1) when spinach cultivar ‘Space F1’ was grown under an R:B ≤ 3:1 and ≥5 mg L−1 of Fe.

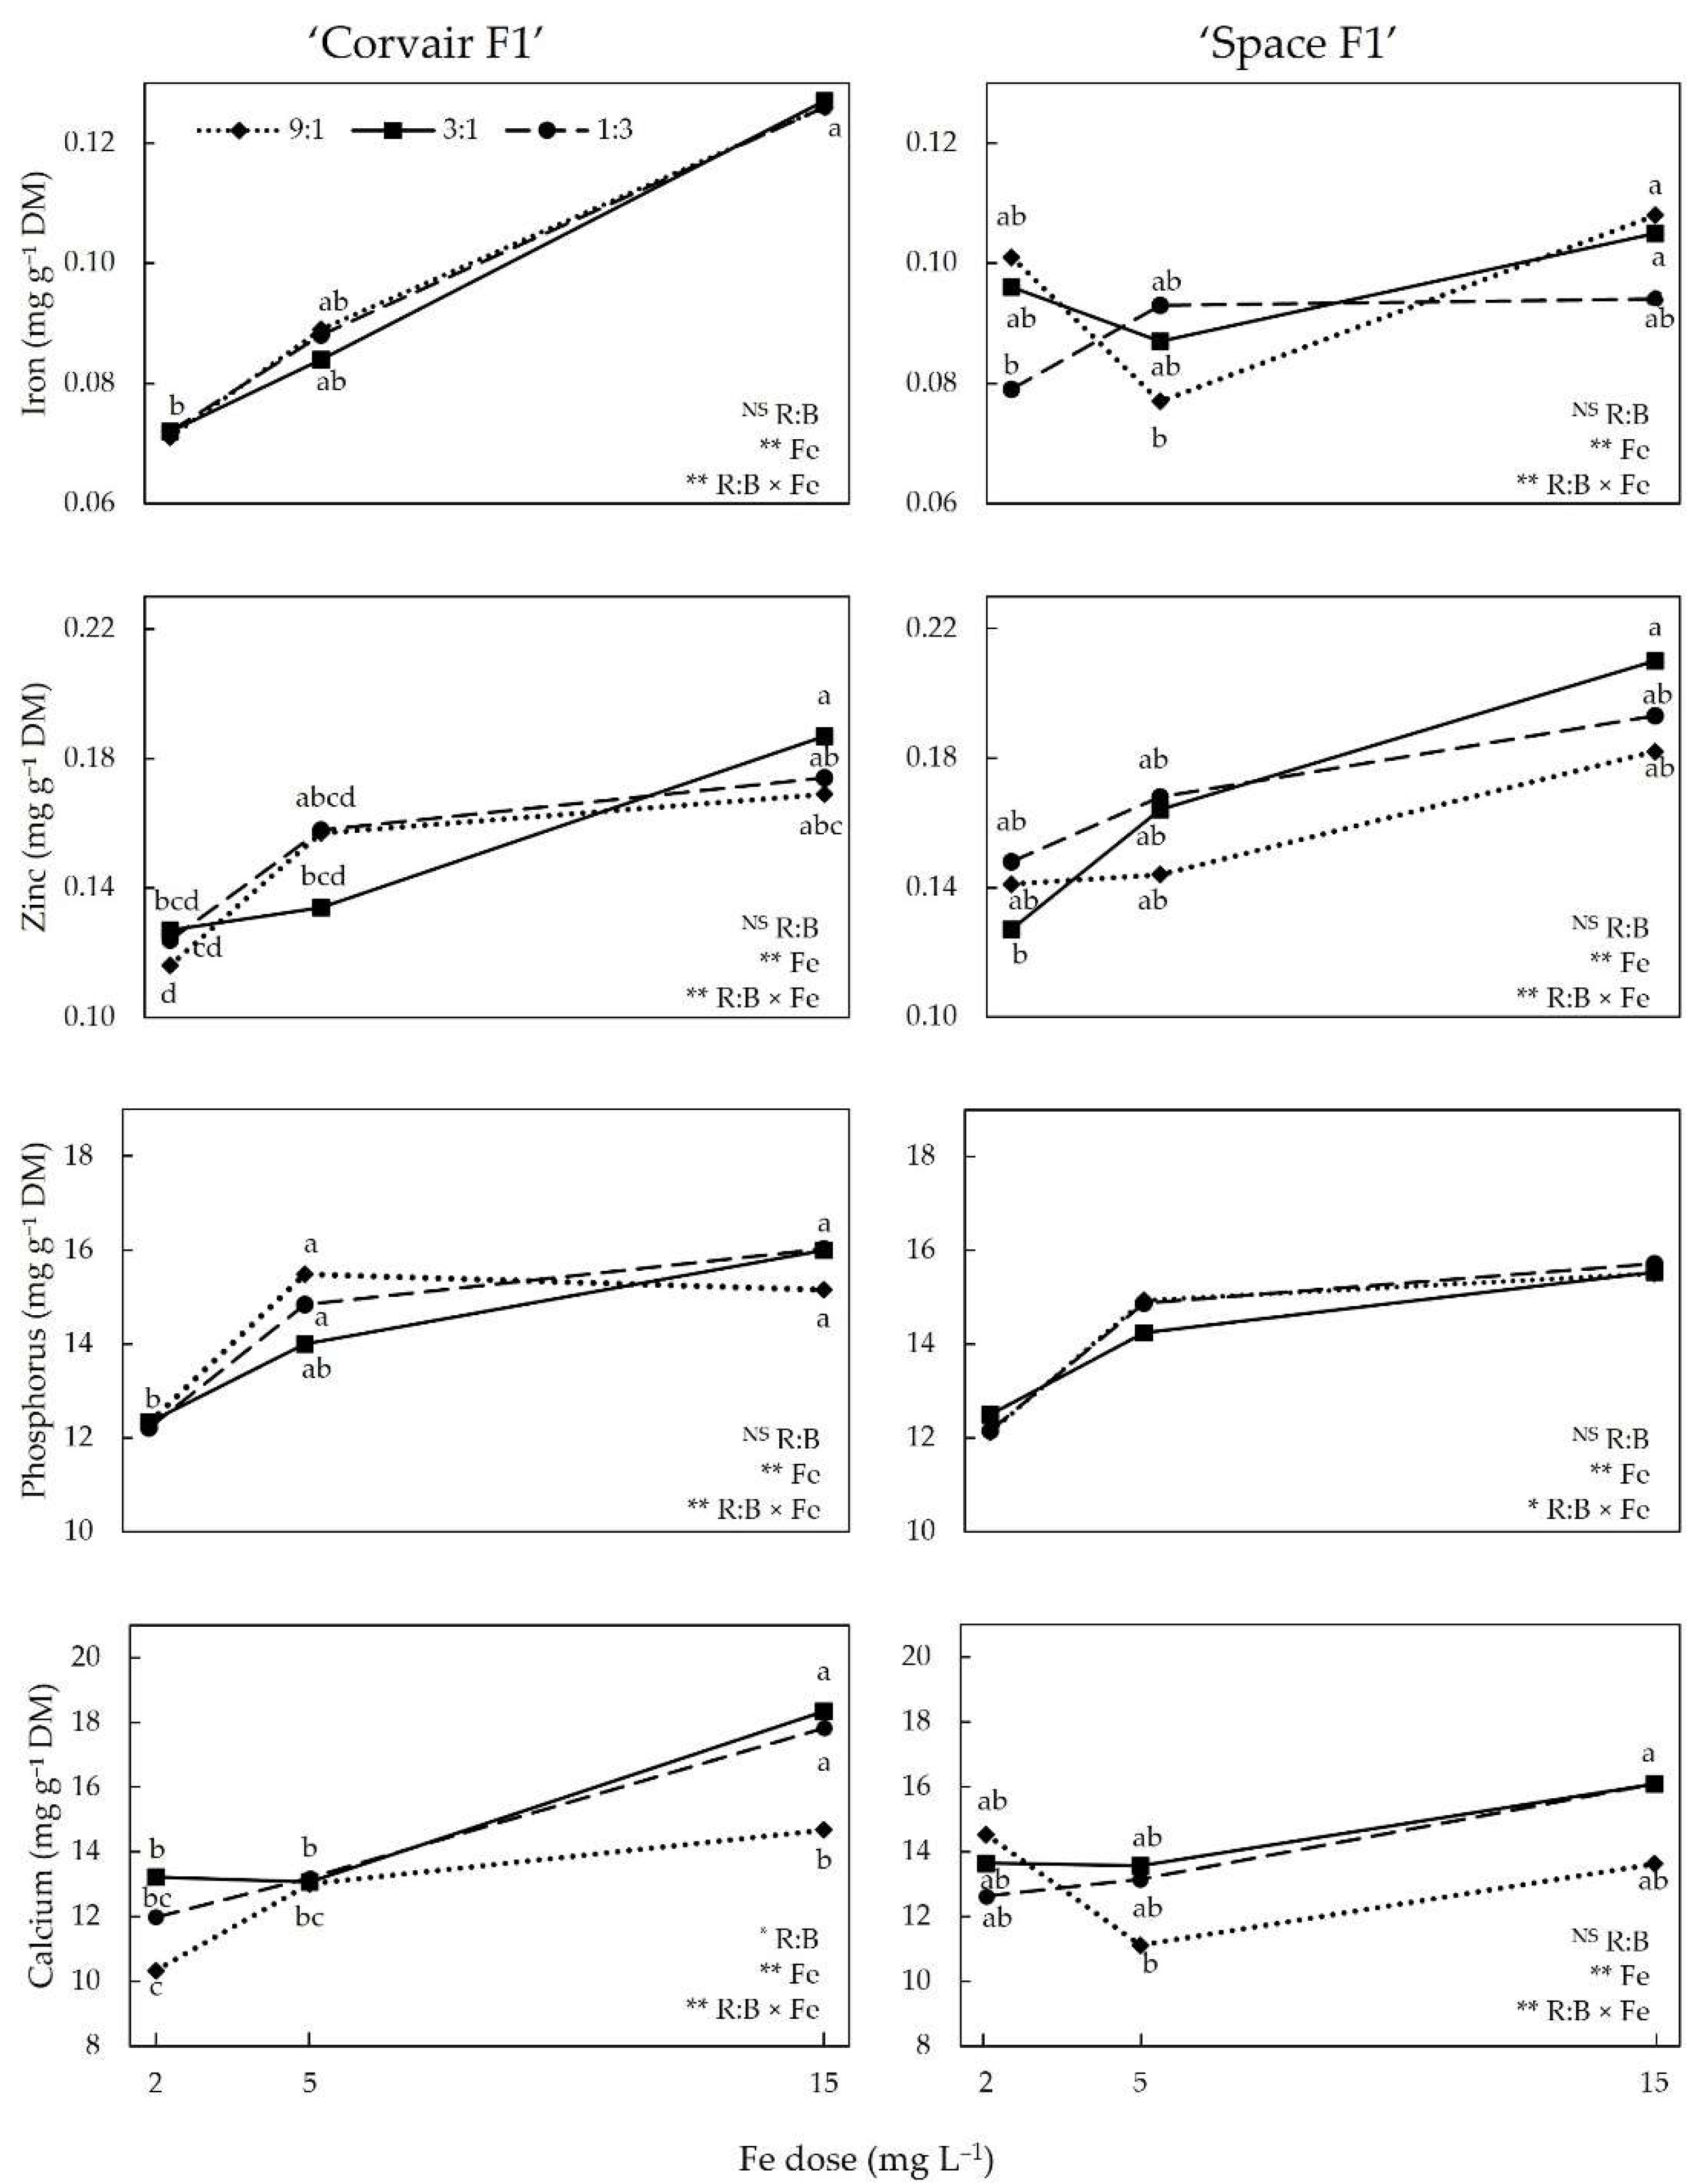
3.2. Mineral Nutrients

Increasing the Fe concentration in the hydroponic solution increased Fe content in one spinach cultivar but not in the other (Figure 2). The Fe content in ‘Corvair F1’ spinach grown in the solution with 15 mg L−1 of Fe increased up to 77% (regardless of the R:B light ratio) compared to the control Fe concentration of 2 mg L−1. However, there was less or no effect of the hydroponic Fe concentration on the Fe content in ‘Space F1’. In both cultivars, there was no consistent effect of the R:B light ratio on Fe content.
The Fe content in the hydroponic solution influenced the uptake of micronutrients Zn and Cu in both spinach cultivars (Figure 2, Table 2). Generally, the contents of Zn increased with an increasing Fe concentration in the solution. In both cultivars, the highest contents of Zn were in plants grown in the solution with 15 mg L−1 of Fe, regardless of the R:B light ratio. Compared to the control, the Zn content increased by 15% in ‘Corvair F1’ and 49% in ‘Space F1’ when spinach was grown with the highest Fe concentration. In contrast, the 15 mg L−1 of Fe in the solution somewhat decreased the Cu content, especially in ‘Space F1’. The spinach uptake of macronutrients P, Ca, and K (but not Mg) was also influenced by the Fe concentration in the hydroponic solution (Figure 2, Table 2). The content of P in ‘Corvair F1’ plants increased, regardless of the R:B ratio, with an elevated Fe concentration in the solution. Similarly, the Ca content in ‘Corvair F1’ plants grown in a solution with 15 mg L−1 of Fe was up to 77% greater than plants in the control treatment. The increasing Fe concentration had no consistent effect on K uptake in ‘Corvair F1’ plants and no effect on ‘Space F1’.
Except for Mg, and Ca for ‘Corvair F1’, the R:B light ratio had no material effect on the mineral uptake of spinach. The accumulation of Ca by ‘Corvair F1’ depended somewhat on the R:B light ratio, but the interaction with Fe in the nutrient solution made interpretations difficult. In contrast, the Mg concentration of both cultivars generally increased as the R:B light ratio decreased from 9:1 to 1:3.

3.3. Soluble Sugars

The fructose content in ‘Corvair F1’ spinach increased with an increasing Fe concentration in the solution regardless of the lighting treatment (Table 3). The highest amount of fructose was in plants grown in 15 mg L−1 of Fe solution and an R:B ratio of 9:1 or 3:1. However, the fructose content in ‘Space F1’ spinach did not consistently change in response to the light and Fe treatments. The glucose content generally increased in ‘Corvair F1’ plants as the R:B light ratio decreased and/or as the Fe in the solution increased. In contrast, the 5 mg L−1 or 15 mg L−1 Fe concentrations decreased the glucose content (by up to 35%) in ‘Space F1’ spinach. For sucrose, the R:B light ratio had no clear effect on the accumulation, but it increased with the Fe concentration in nutrient solution for both cultivars. The contents of maltose and raffinose did not change significantly in either spinach cultivar under all lighting and Fe treatments.

3.4. Total Phenolic Content and Antiradical Activity

The total phenolic content (TPC) of ‘Corvair F1’ and ‘Space F1’ plants are presented in Table 4. The TPC in ‘Space F1’ plants did not change significantly under different R:B light ratios, and the responses to Fe concentrations in the hydroponic solution were not consistent. In ‘Corvair F1’, the TPC increased by an average of 17% under 5 and 15 mg L−1 of Fe dose compared to the control. However, no significant differences were found under the different lighting treatments.
There were no significant differences in antiradical activity in ‘Corvair F1’ plants according to the ABTS measurements, except for the 34% increase in plants under the R:B light ratio of 1:3 and 15 mg L−1 of Fe in the solution compared to the control plants. The FRAP measurements showed that the antiradical activity in ‘Corvair F1’ increased as the R:B light ratio decreased, but the response depended on the Fe concentration. The DPPH free radical scavenging activity showed similar effects. In contrast, there were no significant differences among the treatments in the antiradical activity of ‘Space F1’ plants. However, the DPPH free radical scavenging activity generally increased in plants as the R:B light ratio decreased, and was greatest at the R:B = 1:3 and with 15 mg L−1 of Fe in the hydroponic solution.

4. Discussion

4.1. Growth

Morphology, development, and biomass are important metrics for vegetable crop production and quality. R and B light wavebands affect plant photosynthesis, its morphology, and its physiology, and are the most manipulated wavebands in CEA crop production [30]. However, we have not found data on the impact of a wide range of B:R light ratios on growth indices and biomass in Fe-biofortified horticultural crops. Our results show that a higher concentration of Fe in a hydroponic solution suppressed the growth and leaf morphological responses of spinach. Furthermore, although this growth suppression occurred regardless of the R:B light ratio, the plants were the smallest when grown under the most B light (i.e., lowest R:B ratio).
The effect of B light in regulating crop yield has been addressed in a range of recent reports, although with conflicting results [31]. Increasing the B light fraction inhibits cell division and cell expansion, and thus decreases the leaf area [32]. A reduced leaf area leads to less photon capture, which is often the primary reason for decreased growth [33]. Previous studies showed that a light environment with a high R:B ratio led to increases in growth parameters. For example, shoot elongation, plant height, leaf number, and the length of Chinese kale were promoted by an R:B light ratio of 8 [34]. Moreover, in the same study, that R:B ratio increased the fresh weight by 21% compared to an R:B ratio of 6:3. In another study, the fresh and dry mass accumulation of coriander ‘Leisure’ was greatest under an R:B light ratio of 10 or 19 [35]. These results are in agreement with those presented here, in which a decrease in the R:B light ratio produced spinach with lower biometric indices.
Fe availability is assumed to limit the growth of fast-growing, economically important plants. There are numerous visible effects associated with high Fe concentrations, including growth retardation or a reduction in leaf size [15]. The basic helix–loop–helix (bHLH) proteins play a key role in the regulation of Fe uptake. Sixteen bHLH transcription factors of this type are involved in the control of cellular Fe homeostasis [18]. The bHLH protein FIT (bHLH29) is central to this regulatory network. FIT activity is sophisticatedly controlled by a suite of proteins, which either activate or enhance its degradation [18,36]. Fe deficiency negatively affects plant development and growth, and excess Fe in cells is toxic when high levels accumulate. Increased or uncontrolled levels of Fe can act catalytically via the Fenton reaction to generate hydroxyl radicals, which can damage lipids, proteins, and DNA [15,37,38]. Because of the potential for toxicity associated with high Fe levels, cells store Fe as a specialized iron-storage protein ferritin, which plays an essential role in Fe homeostasis [37]. Therefore, there is a relatively narrow range in Fe concentration for healthy plant development [15].
In a study by Peña-Olmos et al. [39], Fe concentrations of 100 and 250 mg L−1 inhibited the leaf area and total dry mass of broccoli plants as a result of Fe toxicity. In addition, the total dry weight of pea plants decreased when 40 mg L−1 of Fe2+ was in the substrate [40]. This growth inhibition was attributed to Fe toxicity that induced the formation of reactive oxygen species (ROS). This is in agreement with our results, in which higher (5 and 15 mg L−1) Fe doses decreased morphological and growth parameters compared to the control dose (2 mg L−1 Fe).

4.2. Chlorophylls

In plants, Fe is involved in chlorophyll synthesis, which is essential for maintaining chloroplast structure and function. Typically, approximately 80% of Fe is found in photosynthetic cells, where it is essential for the biosynthesis of cytochromes and other heme molecules, including chlorophyll, the electron transport system, and the construction of Fe-S clusters [19,41]. In the photosynthetic apparatus, two or three Fe atoms are found in molecules directly related to photosystem II (PS-II), 12 atoms in photosystem I (PS-I), 5 in the cytochrome complex, and 2 in the ferredoxin molecule [42]. Such distributions show that Fe is directly involved in the photosynthetic activity of plants and, consequently, their productivity [19]. Our results demonstrated that while the R:B light ratio had no consistent effect on the SPAD index (the relative chlorophyll content), higher doses of Fe in the nutrient solution increased the SPAD index in both spinach cultivars. This is not consistent with studies that reported an excess of Fe reduced plant growth and chlorophyll content as a consequence of oxidative stress [39].

4.3. Mineral Nutrients

A previous study conducted with microgreens showed that responses to the B light fraction (0–33%) depended on plant species and mineral elements [43]. Concentrations of macro-elements (Ca, K, Mg, and P) and Zn were greatest in mustard when grown under LED lighting with 25% B light and lowest with 16% B light. In our spinach study, an increase in the B light fraction (from 10% to 75%) had no effect on the content of Zn, P, or K but increased Ca (in one cultivar) and Mg (in both cultivars). In mustard, Fe was greatest with 33% B light and lowest when deficient in B light [43]. However, in the present study, the accumulation of Fe was more affected by its concentration in hydroponic solution than by the R:B light ratio. Specifically, when data for the Fe dose were pooled, the Fe content of spinach grown under the diverse R:B light ratios only ranged from 0.089 to 0.096 mg g−1 DM for both of the cultivars studied. When data for the R:B light ratios were pooled, Fe dose increased the uptake of ‘Corvair F1’ by up to 75%, but such a response of ‘Space F1’ was less clear. At least for ‘Corvair F1’, the results agree with Cavalcante et al. [44]: an increase in Fe concentration in the nutrient solution increased the micronutrient accumulation both in the shoots and roots of sugar cane.
Plants have developed sophisticated mechanisms to take up small amounts of soluble Fe [15]. How the Fe status of a plant is sensed and how this signal is transmitted to transcriptional networks for Fe acquisition and response are currently areas of great interest in the field of Fe homeostasis [21]. A primary goal is to find a master Fe sensor controlling Fe homeostasis in plants [45]. Phytochrome interacting factor PIF4/5 and long hypocotyl 5 (HY5) transcription factors, which are activated through R and B photoreceptors, may be involved in nutrient use-related gene expression or the regulation of root morphogenesis [46]. These can regulate the architecture and distribution of roots in the growing media, enhancing the probability of nutrient uptake and modulating its utilization and use efficiency [46].
The positive effects of a higher B light fraction on the uptake of mineral nutrients were presented in several studies. A recent study by Carrilo et al. [46] showed that P, K, and Ca contents in parsley microgreens grown under B light were significantly higher than under R or R+B+green light. In another study, the overall mineral content, N, P, K, Ca, Mg, and Fe were the greatest in sweet basil plants grown under an R:B light ratio of 3:1, with some comparable values observed in plants grown under an R:B ratio of 2:1 (N, P, K, Ca, and Mg) or 4:1 (N, K, and Mg) [47]. According to Kopsell et al. [48], five days of B light treatment before harvesting broccoli microgreens increased the contents of mineral nutrients. Such a light treatment also increased the content of K, Mg, and P in buckwheat microgreens compared with dark conditions [49]. Only B or dichromatic R+B light increased Ca, Mg, Mn, and Fe content in lettuce [50]. Such inconsistent results could be because of different plant species, cultivars, development stages, photon flux densities, and peak wavelengths.
Excess Fe can lead to deficiencies of essential nutrients (e.g., Mn, P, K, Ca, and Mg) in plants [15]. However, our results show that elevated concentrations of Fe in hydroponic solution increased the uptake of some other mineral nutrients, especially Zn. From a nutritional aspect, competition exists between Zn and Fe elements; host plants require coordinated Zn–Fe homeostasis to avoid ion imbalances [51].

4.4. Soluble Sugars

Plant sugars (glucose, fructose, and sucrose) and sucrose-derived oligosaccharides (e.g., raffinose family oligosaccharides) are directly or indirectly derived from photosynthesis [52]. Plants typically accumulate higher carbohydrate levels when (mild) stresses compromise growth more than photosynthesis [53]. From a nutritional perspective, sugars significantly affect taste, increasing sweetness [54]. Samuolienė et al. demonstrated that short-term preharvest R LED light increased sugar content by 52% in green baby-leaf lettuce. However, in the present study, there was almost no effect of the R:B light ratio on the soluble sugar contents of either spinach cultivar.
More detailed studies have been published on sugars and Fe-deficiency cross-talk mechanisms [55,56,57]. For example, Lin et al. [56] showed that Fe deficiency increased sucrose content in Arabidopsis roots, elevating auxin levels in roots and the subsequent induction of NO accumulation, thereby activating reduction-based Fe uptake via the FIT-mediated transcriptional regulation of FRO2 and IRT1. In another study, two sugar transporters, a major facilitator superfamily protein (STP13; AT5G26340), and sugar transporter 4 (STP4; AT3G19930) had higher expression levels under Fe-deficient conditions [55]. Furthermore, the concentration of sucrose, fructose, and glucose was significantly greater in 2-week-old shoots of Arabidopsis grown with an Fe deficiency compared to the control condition. Thus, there was a greater expression of sugar transporters and sugar concentration in shoots when Fe was deficient [55,57]. However, our results with spinach show that the contents of sucrose (in both cultivars) and fructose and glucose (in ‘Corvair F1’) increased with an increasing Fe dose.

4.5. Antioxidant Capacity

The Fe metabolic pathway is directly linked to ROS, leading to oxidative stress in plants. The primary ROS include non-radical molecules such as singlet oxygen (1O2) and hydrogen peroxide (H2O2), as well as free radicals such as superoxide (O2-) and hydroxyl radicals (≥OH) [58,59]. As Fe is one constituent of the electron transport chain in mitochondria and chloroplasts, Fe deficiency can create an imbalance of cellular redox. However, the role of ROS in Fe response regulation has not been well defined, and they may play multiple roles. For example, H2O2 is involved in regulating ferritins in response to excess Fe to alleviate oxidative stress in various plants [60].
Phenolic compounds have antioxidant activity from metal chelation and/or free radical scavenging [23,59,61]. Several assays, such as the Trolox equivalent antioxidant activity (TEAC) and DPPH, ABTS scavenging, or FRAP, are commonly used to study the radical-scavenging ability of polyphenols [59]. These assays provide a relative measure of antioxidant activity, but often the radicals scavenged have little relevance to those present in biological systems. In addition, radical scavenging assays do not account for the iron-binding properties of polyphenol antioxidants [59,62].
Johkan et al. [63] demonstrated that B or R+B light applied to lettuce ’Banchu Red Fire’ during the seedling stage for seven days increased the TPC and antioxidant capacity compared to R LEDs or fluorescent light. In another study, Chinese kale ‘Bailey’ sprouts had a higher TPC and antioxidant capacity under B light than those grown in darkness, under white light, or under R LEDs [64]. In our study with spinach, there were no consistent effects of the R:B light ratio on the TPC in either cultivar. However, in ‘Corvair F1’, elevated Fe in the nutrient solution (from 2 to ≥5 mg L−1) increased the TPC.
A recent study with parsley microgreens indicated that ABTS antioxidant activity was higher under B light than under R or R+B+green light [46]. In sweet basil, the highest FRAP values were in plants grown under an R:B of 3:1 [47]. This is consistent with our results with spinach ‘Corvair F1’, in which the FRAP increased as the fraction of B light increased (there was no effect in ‘Space F1’). In addition, a decrease in the R:B light ratio increased the ABTS in ‘Corvair F1’ and the DPPH free radical scavenging activity in both cultivars.

5. Conclusions

We performed a comprehensive assessment of the effects of different R:B light ratios on two spinach cultivars grown in hydroponic solutions with three Fe concentrations. The novel research revealed that the ratio of R:B light influenced the uptake of Fe and other nutrients as well as the growth and antioxidant properties of plants, but responses varied by spinach cultivar. Plants grown indoors with an R:B light ratio of 9:1 and a 2 mg L−1 Fe dose generally had the largest and most number of leaves and the greatest biomass accumulation, and these parameters decreased as the R:B light ratio decreased and the Fe concentration increased. The accumulation of Fe was more affected by its concentration in hydroponic solution than by the R:B light ratio. For example, an increase in the B light fraction (from 10 to 75%) had no effect on the content of Zn, P, or K but increased Ca (in one cultivar) and Mg (in both cultivars). However, an elevated concentration of Fe in the nutrient solution increased the contents of Fe, Zn, P, Ca, and K (and decreased Cu) in one or both cultivars. There was little to no effect of the R:B light ratio on the soluble sugar contents, whereas some sugars increased with an Fe dose. Finally, an increasing fraction of B light increased the FRAP and ABTS in ‘Corvair F1’ and the DPPH free radical scavenging activity in both cultivars.
The findings of the study reveal trade-offs that exist between maximizing the indoor production (i.e., fresh weight) of spinach and enriching its nutritional content using sole-source electric lighting. At the same time, it contributes to a greater understanding of the uptake of the trace element Fe and selecting an appropriate concentration in hydroponic solution for a sustainable cultivation. The research results also contribute to the body of knowledge about strategies to increase the contents of the essential nutrient Fe for human health. Additional research on the photon distribution of sole-source lighting in combination with the composition of nutrient solution is needed to improve the indoor production of leafy greens with health-promoting benefits.

Author Contributions

Conceptualization, V.V.-K., A.B., J.M. and E.S.R.; methodology, V.V.-K., A.B., J.M. and E.S.R.; software, V.V.-K.; validation, V.V.-K., A.B., J.M. and E.S.R.; formal analysis, V.V.-K. and E.S.R.; investigation, V.V.-K.; resources, V.V.-K., A.B. and E.S.R.; data curation, V.V.-K., A.B. and E.S.R.; writing—original draft preparation, V.V.-K.; writing—review and editing, V.V.-K., A.B., J.M. and E.S.R.; visualization, V.V.-K.; supervision, A.B. and E.S.R.; project administration, A.B. and E.S.R.; funding acquisition, A.B. and E.S.R. All authors have read and agreed to the published version of the manuscript.

Funding

This project has received funding from the Research Council of Lithuania (LMTLT), agreement No S-MIP-19-2, and supported by the Specialty Crops Research Initiative (grant no. 2019-51181-30017) and Hatch project 192266 from the USDA National Institute of Food and Agriculture.

Data Availability Statement

The datasets used and/or analyzed in this manuscript are available from the first corresponding author on reasonable request by E-mail.

Conflicts of Interest

The authors declare no conflict of interest. The funders had no role in the design of the study; in the collection, analyses, or interpretation of data; in the writing of the manuscript, or in the decision to publish the results.

References

  1. Roberts, J.L.; Moreau, R. Functional Properties of Spinach (Spinacia oleracea L.) Phytochemicals and Bioactives. Food Funct. 2016, 7, 3337–3353. [Google Scholar] [CrossRef]
  2. Dsouza, A.; Price, G.W.; Dixon, M.; Graham, T. Sustainability A Conceptual Framework for Incorporation of Composting in Closed-Loop Urban Controlled Environment Agriculture. Sustainability 2021, 13, 2471. [Google Scholar] [CrossRef]
  3. Mrinmoy Majumder, A.S. Suitable Substrate for Crop Growth under Protected Farms—An Assessment. J. Sci. Agric. 2018, 2, 62. [Google Scholar] [CrossRef] [Green Version]
  4. Zou, T.; Huang, C.; Wu, P.; Ge, L.; Xu, Y. Optimization of Artificial Light for Spinach Growth in Plant Factory Based on Orthogonal Test. Plants 2020, 9, 490. [Google Scholar] [CrossRef]
  5. Li, J.; Li, G.; Wang, H.; Wang Deng, X. Phytochrome Signaling Mechanisms. Arab. Book 2011, 9, e0148. [Google Scholar] [CrossRef] [Green Version]
  6. Liu, H.; Liu, B.; Zhao, C.; Pepper, M.; Lin, C. The Action Mechanisms of Plant Cryptochromes. Trends Plant Sci. 2011, 16, 684–691. [Google Scholar] [CrossRef] [Green Version]
  7. Yorio, N.C.; Goins, G.D.; Kagie, H.R.; Wheeler, R.M.; Sager, J.C. Improving Spinach, Radish, and Lettuce Growth under Red Light-Emitting Diodes (LEDs) with Blue Light Supplementation. HortScience 2001, 36, 380–383. [Google Scholar] [CrossRef] [Green Version]
  8. Sago, Y.; Watanabe, N.; Minami, Y. Zinc Biofortification of Hydroponic Baby Leaf Lettuce Grown under Artificial Lighting with Elevated Wind Speed and Root Zone Temperature. J. Agric. Meteorol. 2018, 74, 173–177. [Google Scholar] [CrossRef] [Green Version]
  9. Brazaitytė, A.; Vaštakaitė, V.; Viršilė, A.; Jankauskienė, J.; Samuolienė, G.; Sakalauskienė, S.; Novičkovas, A.; Miliauskienė, J.; Duchovskis, P. Changes in Mineral Element Content of Microgreens Cultivated under Different Lighting Conditions in a Greenhouse. Acta Hortic. 2018, 1227, 507–515. [Google Scholar] [CrossRef]
  10. Brazaitytė, A.; Miliauskienė, J.; Vaštakaitė-Kairienė, V.; Sutulienė, R.; Laužikė, K.; Stašytė, K.; Duchovskis, P.; Samuolienė, G. The Response of Baby Leaf Lettuce to Selenium Biofortification under Different Lighting Conditions. Biol. Life Sci. Forum. 2021, 3, 10. [Google Scholar]
  11. Brazaitytė, A.; Miliauskienė, J.; Vaštakaitė-Kairienė, V.; Sutulienė, R.; Laužikė, K.; Duchovskis, P.; Małek, S. Effect of Different Ratios of Blue and Red Led Light on Brassicaceae Microgreens under a Controlled Environment. Plants 2021, 10, 801. [Google Scholar] [CrossRef]
  12. Jaiwal, P.K.; Chhillar, A.K.; Chaudhary, D.; Jaiwal, R. (Eds.) Nutritional Quality Improvement in Plants; Springer Nature: Cham, Switzerland, 2019. [Google Scholar] [CrossRef]
  13. Santos, J.; Herrero, M.; Mendiola, J.A.; Oliva-Teles, M.T.; Ibáñez, E.; Delerue-Matos, C.; Oliveira, M. Fresh-Cut Aromatic Herbs: Nutritional Quality Stability during Shelf-Life. LWT-Food Sci. Technol. 2014, 59, 101–107. [Google Scholar] [CrossRef]
  14. Tilman, D. Global Environmental Impacts of Agricultural Expansion: The Need for Sustainable and Efficient Practices. Proc. Natl. Acad. Sci. USA 1999, 96, 5995–6000. [Google Scholar] [CrossRef] [Green Version]
  15. Rout, G.R.; Sahoo, S. Role of iron in plant growth and metabolism. Rev. Agric. Sci. 2015, 3, 1–24. [Google Scholar] [CrossRef] [Green Version]
  16. Briat, J.; Fobis-Loisy, I.; Grignon, N.; Lobréaux, S.; Pascal, N.; Savino, G.; Thoiron, S.; von Wirén, N.; van Wuytswinkel, O. Cellular and Molecular Aspects of Iron Metabolism in Plants. Biol. Cell 1995, 84, 69–81. [Google Scholar] [CrossRef]
  17. Bryson, G.M.; Mills, H.A.; Sasseville, D.N.; Jones Jr, J.B.; Barker, A.V. Plant Analysis Handbook III: A Guide to Sampling, Preparation, Analysis, and Interpretation for Agronomic and Horticultural Crops; Micro-Macro Publishing Inc.: Athens, Clarke, 2014. [Google Scholar]
  18. Schmidt, W.; Thomine, S.; Buckhout, T.J.; Astolfi, S.; Vigani, G. Editorial: Iron Nutrition and Interactions in Plants. Front. Plant Sci. 2020, 10, 1670. [Google Scholar] [CrossRef] [Green Version]
  19. Briat, J.-F.; Curie, C.; Gaymard, F. Iron Utilization and Metabolism in Plants. Curr. Opin. Plant Biol. 2007, 10, 276–282. [Google Scholar] [CrossRef]
  20. Blekkenhorst, L.C.; Sim, M.; Bondonno, C.P.; Bondonno, N.P.; Ward, N.C.; Prince, R.L.; Devine, A.; Lewis, J.R.; Hodgson, J.M. Cardiovascular Health Benefits of Specific Vegetable Types: A Narrative Review. Nutrients 2018, 10, 595. [Google Scholar] [CrossRef] [Green Version]
  21. Briat, J.F.; Rouached, H.; Tissot, N.; Gaymard, F.; Dubos, C. Integration of P, S, Fe, and Zn Nutrition Signals in Arabidopsis Thaliana: Potential Involvement of phosphate starvation response 1 (PHR1). Front. Plant Sci. 2015, 6, 290. [Google Scholar] [CrossRef] [Green Version]
  22. Pego, J.V.; Kortstee, A.J.; Huijser, C.; Smeekens, S.C.M. Photosynthesis, Sugars and the Regulation of Gene Expression. J. Exp. Bot. 2000, 51, 407–416. [Google Scholar] [CrossRef]
  23. Rice-Evans, C.A.; Miller, N.J.; Paganga, G. Antioxidant Properties of Phenolic Compounds. Trends Plant Sci. 1997, 2, 152–159. [Google Scholar] [CrossRef]
  24. Araújo, G.C.L.; Gonzalez, M.H.; Ferreira, A.G.; Nogueira, A.R.A.; Nóbrega, J.A. Effect of Acid Concentration on Closed-Vessel Microwave-Assisted Digestion of Plant Materials. Spectrochim. Acta Part B At. Spectrosc. 2002, 57, 2121–2132. [Google Scholar] [CrossRef]
  25. Barbosa, J.T.P.; Santos, C.M.M.; Peralva, V.N.; Flores, E.M.M.; Korn, M.; Nóbrega, J.A.; Korn, M.G.A. Microwave-Assisted Diluted Acid Digestion for Trace Elements Analysis of Edible Soybean Products. Food Chem. 2015, 175, 212–217. [Google Scholar] [CrossRef] [PubMed]
  26. Ma, C.; Sun, Z.; Chen, C.; Zhang, L.; Zhu, S. Simultaneous Separation and Determination of Fructose, Sorbitol, Glucose and Sucrose in Fruits by HPLC-ELSD. Food Chem. 2014, 145, 784–788. [Google Scholar] [CrossRef]
  27. Brons, C.; Olieman, C. Study of the High-Performance Liquid Chromatographic Separation of Reducing Sugars, Applied to the Determination of Lactose in Milk. J. Chromatogr. A 1983, 259, 79–86. [Google Scholar] [CrossRef]
  28. Ainsworth, E.A.; Gillespie, K.M. Estimation of Total Phenolic Content and Other Oxidation Substrates in Plant Tissues Using Folin-Ciocalteu Reagent. Nat. Protoc. 2007, 2, 875–877. [Google Scholar] [CrossRef]
  29. Sutulienė, R.; Ragelienė, L.; Samuolienė, G.; Brazaitytė, A.; Urbutis, M.; Miliauskienė, J. The Response of Antioxidant System of Drought-Stressed Green Pea (Pisum sativum L.) Affected by Watering and Foliar Spray with Silica Nanoparticles. Horticulturae 2022, 8, 35. [Google Scholar] [CrossRef]
  30. Li, Y.; Xin, G.; Liu, C.; Shi, Q.; Yang, F.; Wei, M. Effects of Red and Blue Light on Leaf Anatomy, CO2assimilation and the Photosynthetic Electron Transport Capacity of Sweet Pepper (Capsicum annuum L.) Seedlings. BMC Plant Biol. 2020, 20, 318. [Google Scholar] [CrossRef]
  31. Piovene, C.; Orsini, F.; Bosi, S.; Sanoubar, R.; Bregola, V.; Dinelli, G.; Gianquinto, G. Optimal Red:Blue Ratio in Led Lighting for Nutraceutical Indoor Horticulture. Sci. Hortic. 2015, 193, 202–208. [Google Scholar] [CrossRef]
  32. Dougher, T.A.O.; Bugbee, B. Long-term Blue Light Effects on the Histology of Lettuce and Soybean Leaves and Stems. J. Am. Soc. Hortic. Sci. 2004, 129, 467–472. [Google Scholar] [CrossRef]
  33. Bugbee, B. Economics of LED Lighting. In Light Emitting Diodes for Agriculture: Smart Lighting; Springer: Singapore, 2017; pp. 81–99. ISBN 9789811058073. [Google Scholar]
  34. Zhang, Y.; Ji, J.; Song, S.; Su, W.; Liu, H. Growth, Nutritional Quality and Health-Promoting Compounds in Chinese Kale Grown under Different Ratios of Red:Blue LED Lights. Agronomy 2020, 10, 1248. [Google Scholar] [CrossRef]
  35. Naznin, M.T.; Lefsrud, M.; Grave, V.; Hao, X. Different Ratios of Red and Blue LED Light Effects on Coriander Productivity and Antioxidant Properties. Acta Hortic. 2016, 1134, 223–229. [Google Scholar] [CrossRef]
  36. Buckhout, T.J.; Kobayashi, T.; Gao, F.; Robe, K.; Gaymard, F.; Izquierdo, E.; Dubos, C. The Transcriptional Control of Iron Homeostasis in Plants: A Tale of BHLH Transcription Factors? Front. Plant Sci. 2019, 10, 6. [Google Scholar] [CrossRef] [Green Version]
  37. Connolly, E.L.; Guerinot, M.L. Iron Stress in Plants. Genome Biol. 2002, 3, 1024. [Google Scholar] [CrossRef] [PubMed] [Green Version]
  38. Valko, M.; Rhodes, C.J.; Moncol, J.; Izakovic, M.; Mazur, M. Free Radicals, Metals and Antioxidants in Oxidative Stress-Induced Cancer. Chem. Biol. Interact. 2006, 160, 1–40. [Google Scholar] [CrossRef] [PubMed]
  39. Peña-Olmos, J.E.; Casierra-Posada, F.; Olmos-Cubides, M.A. The Effect of High Iron Doses (Fe2+) on the Growth of Broccoli Plants (Brassica oleracea var. Italica). Agron. Colomb. 2014, 32, 22–28. [Google Scholar] [CrossRef]
  40. Nenova, V. Effect of Iron Supply on Growth and Photosystem II Efficiency of Pea Plants. Gen. Appl. Plant Physiol. 2006, 32, 81–90. [Google Scholar]
  41. Hänsch, R.; Mendel, R.R. Physiological Functions of Mineral Micronutrients (Cu, Zn, Mn, Fe, Ni, Mo, B, Cl). Curr. Opin. Plant Biol. 2009, 12, 259–266. [Google Scholar] [CrossRef]
  42. Varotto, C.; Maiwald, D.; Pesaresi, P.; Jahns, P.; Salamini, F.; Leister, D. The metal ion transporter IRT1 is necessary for iron homeostasis and efficient photosynthesis in Arabidopsis thaliana. Plant J. 2002, 31, 589–599. [Google Scholar] [CrossRef]
  43. Brazaitytė, A.; Vaštakaitė-Kairienė, V.; Jankauskienė, J.; Viršilė, A.; Samuolienė, G.; Sakalauskienė, S.; Novičkovas, A.; Miliauskienė, J.; Duchovskis, P. Effect of Blue Light Percentage on Mineral Elements Content in Brassica Microgreens. Acta Hortic. 2020, 1271, 119–126. [Google Scholar] [CrossRef]
  44. Cavalcante, V.S.; Prado, R.d.M.; Vasconcelos, R.d.L.; Campos, C.N.S.; Cavalcante, V.S.; Prado, R.d.M.; Vasconcelos, R.d.L.; Campos, C.N.S. Iron Concentrations in Sugar Cane (Saccharum officinarum L.) Cultivated in Nutrient Solution. Agrociencia 2016, 50, 867–875. [Google Scholar]
  45. Hindt, M.N.; Guerinot, M. lou Getting a Sense for Signals: Regulation of the Plant Iron Deficiency Response. Biochim. Biophys. Acta Mol. Cell Res. 2012, 1823, 1521–1530. [Google Scholar] [CrossRef] [PubMed]
  46. Carillo, P.; El-Nakhel, C.; de Micco, V.; Giordano, M.; Pannico, A.; de Pascale, S.; Graziani, G.; Ritieni, A.; Soteriou, G.A.; Kyriacou, M.C.; et al. Morpho-Metric and Specialized Metabolites Modulation of Parsley Microgreens through Selective LED Wavebands. Agronomy 2022, 12, 1502. [Google Scholar] [CrossRef]
  47. Dorais, M.; Bergstrand, K.-J.; Orsini, F.; Pennisi, G.; Blasioli, S.; Cellini, A.; Maia, L.; Crepaldi, A.; Braschi, I.; Spinelli, F.; et al. Unraveling the Role of Red:Blue LED Lights on Resource Use Efficiency and Nutritional Properties of Indoor Grown Sweet Basil. Front. Plant Sci. 2019, 10, 305. [Google Scholar] [CrossRef] [Green Version]
  48. Kopsell, D.A.; Sams, C.E. Increases in Shoot Tissue Pigments, Glucosinolates, and Mineral Elements in Sprouting Broccoli after Exposure to Short-duration Blue Light from Light Emitting Diodes. J. Amer. Soc. Hort. Sci. 2013, 138, 31–37. [Google Scholar] [CrossRef] [Green Version]
  49. Choi, M.-K.; Chang, M.-S.; Eom, S.-H.; Min, K.-S.; Kang, M.-H. Physicochemical Composition Of Buckwheat Microgreens Grown Under Different Light Conditions. J. Korean Soc. Food Sci. Nutr. 2015, 44, 709–715. [Google Scholar] [CrossRef]
  50. Shin, Y.-S.; Lee, M.-J.; Lee, E.-S.; Ahn, J.; Do, H.-W.; Choi, D.-W.; Jeong, J.-D.; Lee, J.-E.; Kim, M.-K.; Park, J.-U.; et al. Effect of Light Emitting Diodes Treatment on Growth and Mineral Contents of Lettuce (Lactuca sativa L. ‘Chung Chi Ma’). Korean J. Org. Agric. 2013, 21, 659–668. [Google Scholar] [CrossRef]
  51. Fiorilli, V.; Ferrol, N.; Tang, M.; Xie, X.; Hu, W.; Fan, X.; Chen, H.; Fiorilli, V.; Ferrol, N.; Tang, M.; et al. Interactions Between Phosphorus, Zinc, and Iron Homeostasis in Nonmycorrhizal and Mycorrhizal Plants. Front. Plant Sci. 2019, 10, 1172. [Google Scholar] [CrossRef]
  52. van den Ende, W.; Ruan, Y.-L.; Weckwerth, W. Multifunctional Fructans and Raffinose Family Oligosaccharides. Front. Plant Sci. 2013, 4, 247. [Google Scholar] [CrossRef] [Green Version]
  53. van den Ende, W. Sugars Take a Central Position in Plant Growth, Development and, Stress Responses. A Focus on Apical Dominance. Front. Plant Sci. 2014, 5, 313. [Google Scholar] [CrossRef] [Green Version]
  54. Kelly, N.; Vaštakaitė-Kairienė, V.; Runkle, E.S. Indoor Lighting Effects on Plant Nutritional Compounds. In Plant Factory Basics, Applications and Advances; Elsevier: Amsterdam, The Netherlands, 2022; pp. 329–349. [Google Scholar]
  55. Zargar, S.M.; Kurata, R.; Inaba, S.; Oikawa, A.; Fukui, R.; Ogata, Y.; Agrawal, G.K.; Rakwal, R.; Fukao, Y. Quantitative Proteomics of Arabidopsis Shoot Microsomal Proteins Reveals a Cross-Talk between Excess Zinc and Iron Deficiency. Proteomics 2015, 15, 1196–1201. [Google Scholar] [CrossRef] [PubMed]
  56. Lin, X.Y.; Quan Ye, Y.; Fan, S.K.; Jin, C.W.; Zheng, S.J. Increased Sucrose Accumulation Regulates Iron-Deficiency Responses by Promoting Auxin Signaling in Arabidopsis Plants. Plant Physiol. 2016, 170, 907–920. [Google Scholar] [CrossRef] [PubMed]
  57. Zargar, S.M.; Agrawal, G.K.; Rakwal, R.; Fukao, Y. Quantitative Proteomics Reveals Role of Sugar in Decreasing Photosynthetic Activity Due to Fe Deficiency. Front. Plant Sci. 2015, 6, 592. [Google Scholar] [CrossRef] [PubMed] [Green Version]
  58. da Silva, E.C.; Nogueira, R.J.M.C.; de Araújo, F.P.; de Melo, N.F.; de Azevedo Neto, A.D. Physiological Responses to Salt Stress in Young Umbu Plants. Environ. Exp. Bot. 2008, 63, 147–157. [Google Scholar] [CrossRef]
  59. Khokhar, S.; Owusu Apenten, R.K. Iron Binding Characteristics of Phenolic Compounds: Some Tentative Structure–Activity Relations. Food Chem. 2003, 81, 133–140. [Google Scholar] [CrossRef]
  60. Sun, C.; Wu, T.; Zhai, L.; Li, D.; Zhang, X.; Xu, X.; Ma, H.; Wang, Y.; Han, Z. Reactive Oxygen Species Function to Mediate the Fe Deficiency Response in an Fe-Efficient Apple Genotype: An Early Response Mechanism for Enhancing Reactive Oxygen Production. Front. Plant Sci. 2016, 7, 1726. [Google Scholar] [CrossRef] [Green Version]
  61. Son, K.-H.; Oh, M.-M. Leaf Shape, Growth, and Antioxidant Phenolic Compounds of Two Lettuce Cultivars Grown under Various Combinations of Blue and Red Light-emitting Diodes. HortScience 2013, 48, 988–995. [Google Scholar] [CrossRef]
  62. Perron, N.R.; Brumaghim, J.L. A Review of the Antioxidant Mechanisms of Polyphenol Compounds Related to Iron Binding. Cell Biochem. Biophys. 2009, 53, 75–100. [Google Scholar] [CrossRef]
  63. Johkan, M.; Shoji, K.; Goto, F.; Hashida, S.-N.; Yoshihara, T. Blue Light-emitting Diode Light Irradiation of Seedlings Improves Seedling Quality and Growth after Transplanting in Red Leaf Lettuce. HortScience 2010, 45, 1809–1814. [Google Scholar] [CrossRef] [Green Version]
  64. Qian, H.; Liu, T.; Deng, M.; Miao, H.; Cai, C.; Shen, W.; Wang, Q. Effects of Light Quality on Main Health-Promoting Compounds and Antioxidant Capacity of Chinese Kale Sprouts. Food Chem. 2016, 196, 1232–1238. [Google Scholar] [CrossRef]
Figure 1. The growth indices of ‘Corvair F1’ and ‘Space F1’ spinach under different red (R) and blue (B) light ratios and Fe concentrations in hydroponic solution. Means with different letters are significantly different from the control treatment (R:B ratio of 9:1 and 2 mg L−1 of Fe) at p < 0.05. Main effects and interactions are significant at p < 0.01 (**) or < 0.05 (*) or not significant (NS). Data are means of two replications with six samples per replication (n = 12). The fourth leaf was measured for leaf length and width.
Sustainability 14 12564 g001
Figure 2. The contents of mineral nutrients on a dry mass (DM) basis in ‘Corvair F1’ and ‘Space F1’ spinach under different red (R) and blue (B) light ratios and Fe concentrations in hydroponic solution. Data are means of two replications with six samples per replication (n = 12). Means with different letters are significantly different from the control treatment (R:B ratio of 9:1 and 2 mg L−1 of Fe) at p < 0.05. Main effects and interactions are significant at p < 0.01 (**) or < 0.05 (*) or not significant (NS).
Sustainability 14 12564 g002
Table 1. The red (R; 600–699 nm) and blue (B; 400–499 nm) lighting ratios, photosynthetic photon flux densities (PPFD; µmol m−2 s−1), and iron (Fe) doses in the hydroponic solution were used to deliver nine treatments used in experiments.
R:B Light RatioFe (mg L−1)PPFD (% of Total PPFD)
RB
9:12225 (90%)25 (10%)
5
15
3:12188 (75%)62 (25%)
5
15
1:3262 (25%)188 (75%)
5
15
R–red LEDs (peak = 665 nm); B–blue LEDs (peak = 450 nm).
Table 2. The SPAD index, leaf number, and mineral nutrients (Cu, K, and Mg) on a dry mass (DM) basis of ‘Corvair F1’ and ‘Space F1’ spinach under different red (R) and blue (B) light ratios and Fe concentrations in hydroponic solution. Means with different letters are significantly different from the control treatment (R:B ratio of 9:1 and 2 mg L−1 of Fe) at p < 0.05. Main effects and interactions are significant at p < 0.01 (**) or < 0.05 (*) or not significant (NS).
Source of VarianceBiometric IndicesMineral Nutrients (mg g⁻1 DM)
SPAD IndexLeaf No.CuKMg
‘Corvair F1’
R:B light ratio
9:144.01 a9.11 a0.012 a36.03 a8.38 b
3:145.39 a9.02 a0.013 a35.68 a9.06 a
1:344.69 a8.73 a0.013 a35.32 a9.17 a
Fe dose, mg L−1
242.08 b9.72 a0.013 a36.82 a8.56 a
546.79 a8.95 b0.014 a34.35 b9.04 a
1545.22 ab8.19 c0.011 b35.86 a9.01 a
R:B light ratio × Fe dose
9:129.83 ab42.43 ab0.012 abcd38.26 a8.00 b
59.33 abc44.97 ab0.013 ab33.72 c8.84 ab
158.17 cd44.64 ab0.011 d36.12 abc8.29 ab
3:1210.00 a42.70 ab0.013 abc36.80 ab8.93 ab
58.42 bcd46.12 ab0.013 abc34.09 c8.85 ab
158.63 abcd47.34 ab0.011 bcd36.16 abc9.40 a
1:329.33 abc41.13 b0.013 abc35.42 bc8.75 ab
59.10 abcd49.30 a0.014 a35.25 bc9.42 a
157.77 d43.66 ab0.011 cd35.31 bc9.33 ab
R:B light ratioNSNSNSNS**
Fe dose********NS
R:B light ratio × Fe dose*******NS
‘Space F1’
R:B light ratio
9:1 (control)35.31 a10.70 a0.011 a37.86 a9.48 b
3:137.10 a10.10 ab0.012 a36.69 a10.01 a
1:337.37 a9.70 b0.012 a36.63 a10.20 a
Fe dose, mg L−1
2 (control)32.73 b10.57 a0.016 a37.08 a9.90 a
538.64 a10.10 a0.011 b36.58 a9.96 a
1538.57 a9.79 a0.008 b37.51 a9.83 a
R:B light ratio × Fe dose
9:12 (control)11.32 a32.30 c0.016 a37.72 a9.95 ab
510.40 ab36.43 abc0.010 ab37.22 a9.34 cd
1510.32 ab37.31 abc0.008 b38.64 a9.15 d
3:1210.00 ab32.95 bc0.016 a36.59 a9.92 abc
510.20 ab40.61 a0.011 ab35.86 a10.02 ab
1510.12 ab37.68 ab0.008 b37.61 a10.08 ab
1:3210.40 ab32.92 bc0.015 ab36.94 a9.83 bc
59.70 ab38.87 a0.012 ab36.67 a10.51 a
159.00 b40.31 a0.008 b36.27 a10.24 ab
R:B light ratioNS*NSNS**
Fe dose**NS**NSNS
R:B light ratio × Fe dose*****NS**
Data are means of two replications with six samples per replication (n = 12).
Table 3. The contents of soluble sugars in ‘Corvair F1’ and ‘Space F1’ spinach on a dry mass (DM) basis under different red (R) and blue (B) light ratios and Fe concentrations in hydroponic solution. Means with different letters are significantly different from the control treatment (R:B ratio of 9:1 and 2 mg L−1 of Fe) at p < 0.05. Main effects and interactions are significant at p < 0.01 (**) or < 0.05 (*) or not significant (NS).
Source of VarianceSoluble Sugars (mg g−1 DM)
FructoseGlucoseSucroseMaltoseRaffinose
‘Corvair F1’
R:B light ratio
9:1 (control)2.19 a1.54 b3.70 a2.46 a17.45 a
3:12.42 a1.70 ab2.98 a2.99 a18.56 a
1:32.10 a2.14 a3.26 a2.74 a14.79 a
Fe dose, mg L−1
2 (control)1.44 c1.34 b2.39 b3.00 a17.49 a
52.08 b2.01 a3.34 ab2.15 a15.23 a
153.18 a2.03 a4.21 a3.04 a18.08 a
R:B light ratio × Fe dose
9:12 (control)1.37 d1.40 bc3.35 abc2.91 a18.04 ab
51.61 d1.58 abc2.34 bc2.08 a16.74 ab
153.60 a1.65 abc5.41 a2.38 a17.56 ab
3:121.30 d1.14 c1.60 c3.97 a22.40 b
52.40 b1.90 abc3.35 abc2.14 a19.31 b
153.56 a2.05 abc3.98 ab2.87 a23.97 a
1:321.67 cd1.49 abc2.22 bc2.13 a12.02 ab
52.24 bc2.54 a4.32 ab2.22 a19.64 ab
152.38 b2.38 ab3.23 abc3.86 a12.72 ab
R:B light ratioNS*NSNSNS
Fe dose******NSNS
R:B light ratio × Fe dose******NS*
‘Space F1’
R:B light ratio
9:1 (control)2.19 a3.51 a3.43 a3.27 a14.52 a
3:11.96 a3.05 a3.56 a2.51 a13.51 a
1:32.11 a3.53 a3.93 a2.58 a14.54 a
Fe dose, mg L−1
2 (control)2.27 a4.30 a2.99 b3.29 a13.68 a
51.95 a2.81 b3.60 ab2.58 a13.65 a
152.03 a2.98 b4.33 a2.49 a15.24 a
R:B light ratio × Fe dose
9:12 (control)2.09 abc4.69 a2.77 b4.64 a13.67 a
52.16 abc2.88 b2.99 ab2.60 a13.54 a
152.33 ab2.96 b4.55 a2.56 a16.34 a
3:122.07 abc3.57 ab2.67 b2.35 a12.29 a
52.14 abc3.05 b3.78 ab2.64 a15.26 a
151.66 bc2.53 b4.23 ab2.55 a12.99 a
1:322.65 a4.64 a3.53 ab2.87 a15.08 a
51.55 c2.50 b4.04 ab2.51 a12.16 a
152.11 abc3.45 ab4.21 ab2.37 a16.39 a
R:B light ratioNSNSNSNSNS
Fe doseNS****NSNS
R:B light ratio × Fe dose******NSNS
Data are means of two replications with six samples per replication (n = 12).
Table 4. The antiradical activity of ‘Corvair F1’ and ‘Space F1’ spinach on a dry mass (DM) basis under different red (R) and blue (B) light ratios and Fe concentrations in hydroponic solution. Means with different letters are significantly different from the control treatment (R:B ratio of 9:1 and 2 mg L−1 of Fe) at p < 0.05. Main effects and interactions are significant at p < 0.01 (**) or < 0.05 (*) or not significant (NS).
Source of VarianceTPC (mg g−1 DM)ABTS,
TEAC (mM g−1 DM)
FRAP,
TEAC (µmol g−1 DM)
DPPH
(µmol g−1 DM)
‘Corvair F1’
R:B light ratio
9:1 (control)5.14 a26.25 a1.80 c3.32 a
3:14.94 a30.27 b3.18 b4.20 a
1:34.88 a32.64 b4.22 a5.84 b
Fe dose, mg L−1
2 (control)4.47 b29.21 a3.48 a5.46 a
55.26 a28.21 a2.66 a3.47 b
155.23 a31.73 a3.06 a4.43 ab
R:B light ratio × Fe dose
9:12 (control)4.85 abc24.76 bc2.82 abc5.49 ab
55.36 bc23.58 c1.01 d1.52 c
155.21 bc30.42 abc1.57 cd2.95 bc
3:124.80 abc30.02 abc3.79 ab4.34 abc
55.31 bc29.19 abc2.56 bcd4.10 abc
154.69 ab31.59 abc2.56 bcd4.18 abc
1:323.74 a32.84 ab3.83 ab6.54 a
55.03 bc31.87 ab4.43 a4.80 abc
155.87 c33.20 a4.43 a6.18 ab
R:B light ratioNS******
Fe dose**NSNS*
R:B light × Fe******
‘Space F1’
R:B light ratio
9:1 (control)4.53 ab29.66 a3.81 a3.89 a
3:15.27 a31.59 a3.99 a5.75 b
1:34.06 b33.12 a3.70 a6.22 b
Fe dose, mg L−1
2 (control)4.87 a30.88 a3.80 a4.71 a
54.63 a33.49 a3.89 a5.39 a
154.35 a30.02 a3.82 a5.77 a
R:B light ratio
9:12 (control)4.89 abc31.24 ab3.69 a3.45 b
53.60 c30.18 ab4.66 a4.40 b
155.09 abc27.57 b3.08 a3.83 b
3:125.77 ab31.92 ab4.28 a6.64 ab
56.14 a32.76 ab3.50 a5.49 ab
153.89 c30.10 ab4.19 a5.13 ab
1:323.96 c29.46 ab3.42 a4.02 b
54.14 bc37.53 a3.50 a6.29 ab
154.07 c32.38 ab4.17 a8.35 a
R:B light ratio*NSNS**
Fe doseNSNSNSNS
R:B light ratio × Fe*NSNS**
Data are means of two replications with six samples per replication (n = 12). TPC–total phenolic content; ABTS–2,2-azino-bis (3-ethylbenzothiazoline-6-sulphonic acid) diammonium salt radical scavenging activity; TEAC–trolox-equivalent antioxidant activity; FRAP–ferric reducing antioxidant power; DPPH–2-diphenyl-1-picrylhydrazyl free radical scavenging activity.
Publisher’s Note: MDPI stays neutral with regard to jurisdictional claims in published maps and institutional affiliations.

