


Extraction of Rural Residential Land from Very-High Resolution UAV Images Using a Novel Semantic Segmentation Framework


Abstract
1. Introduction
2. Research Area and Data
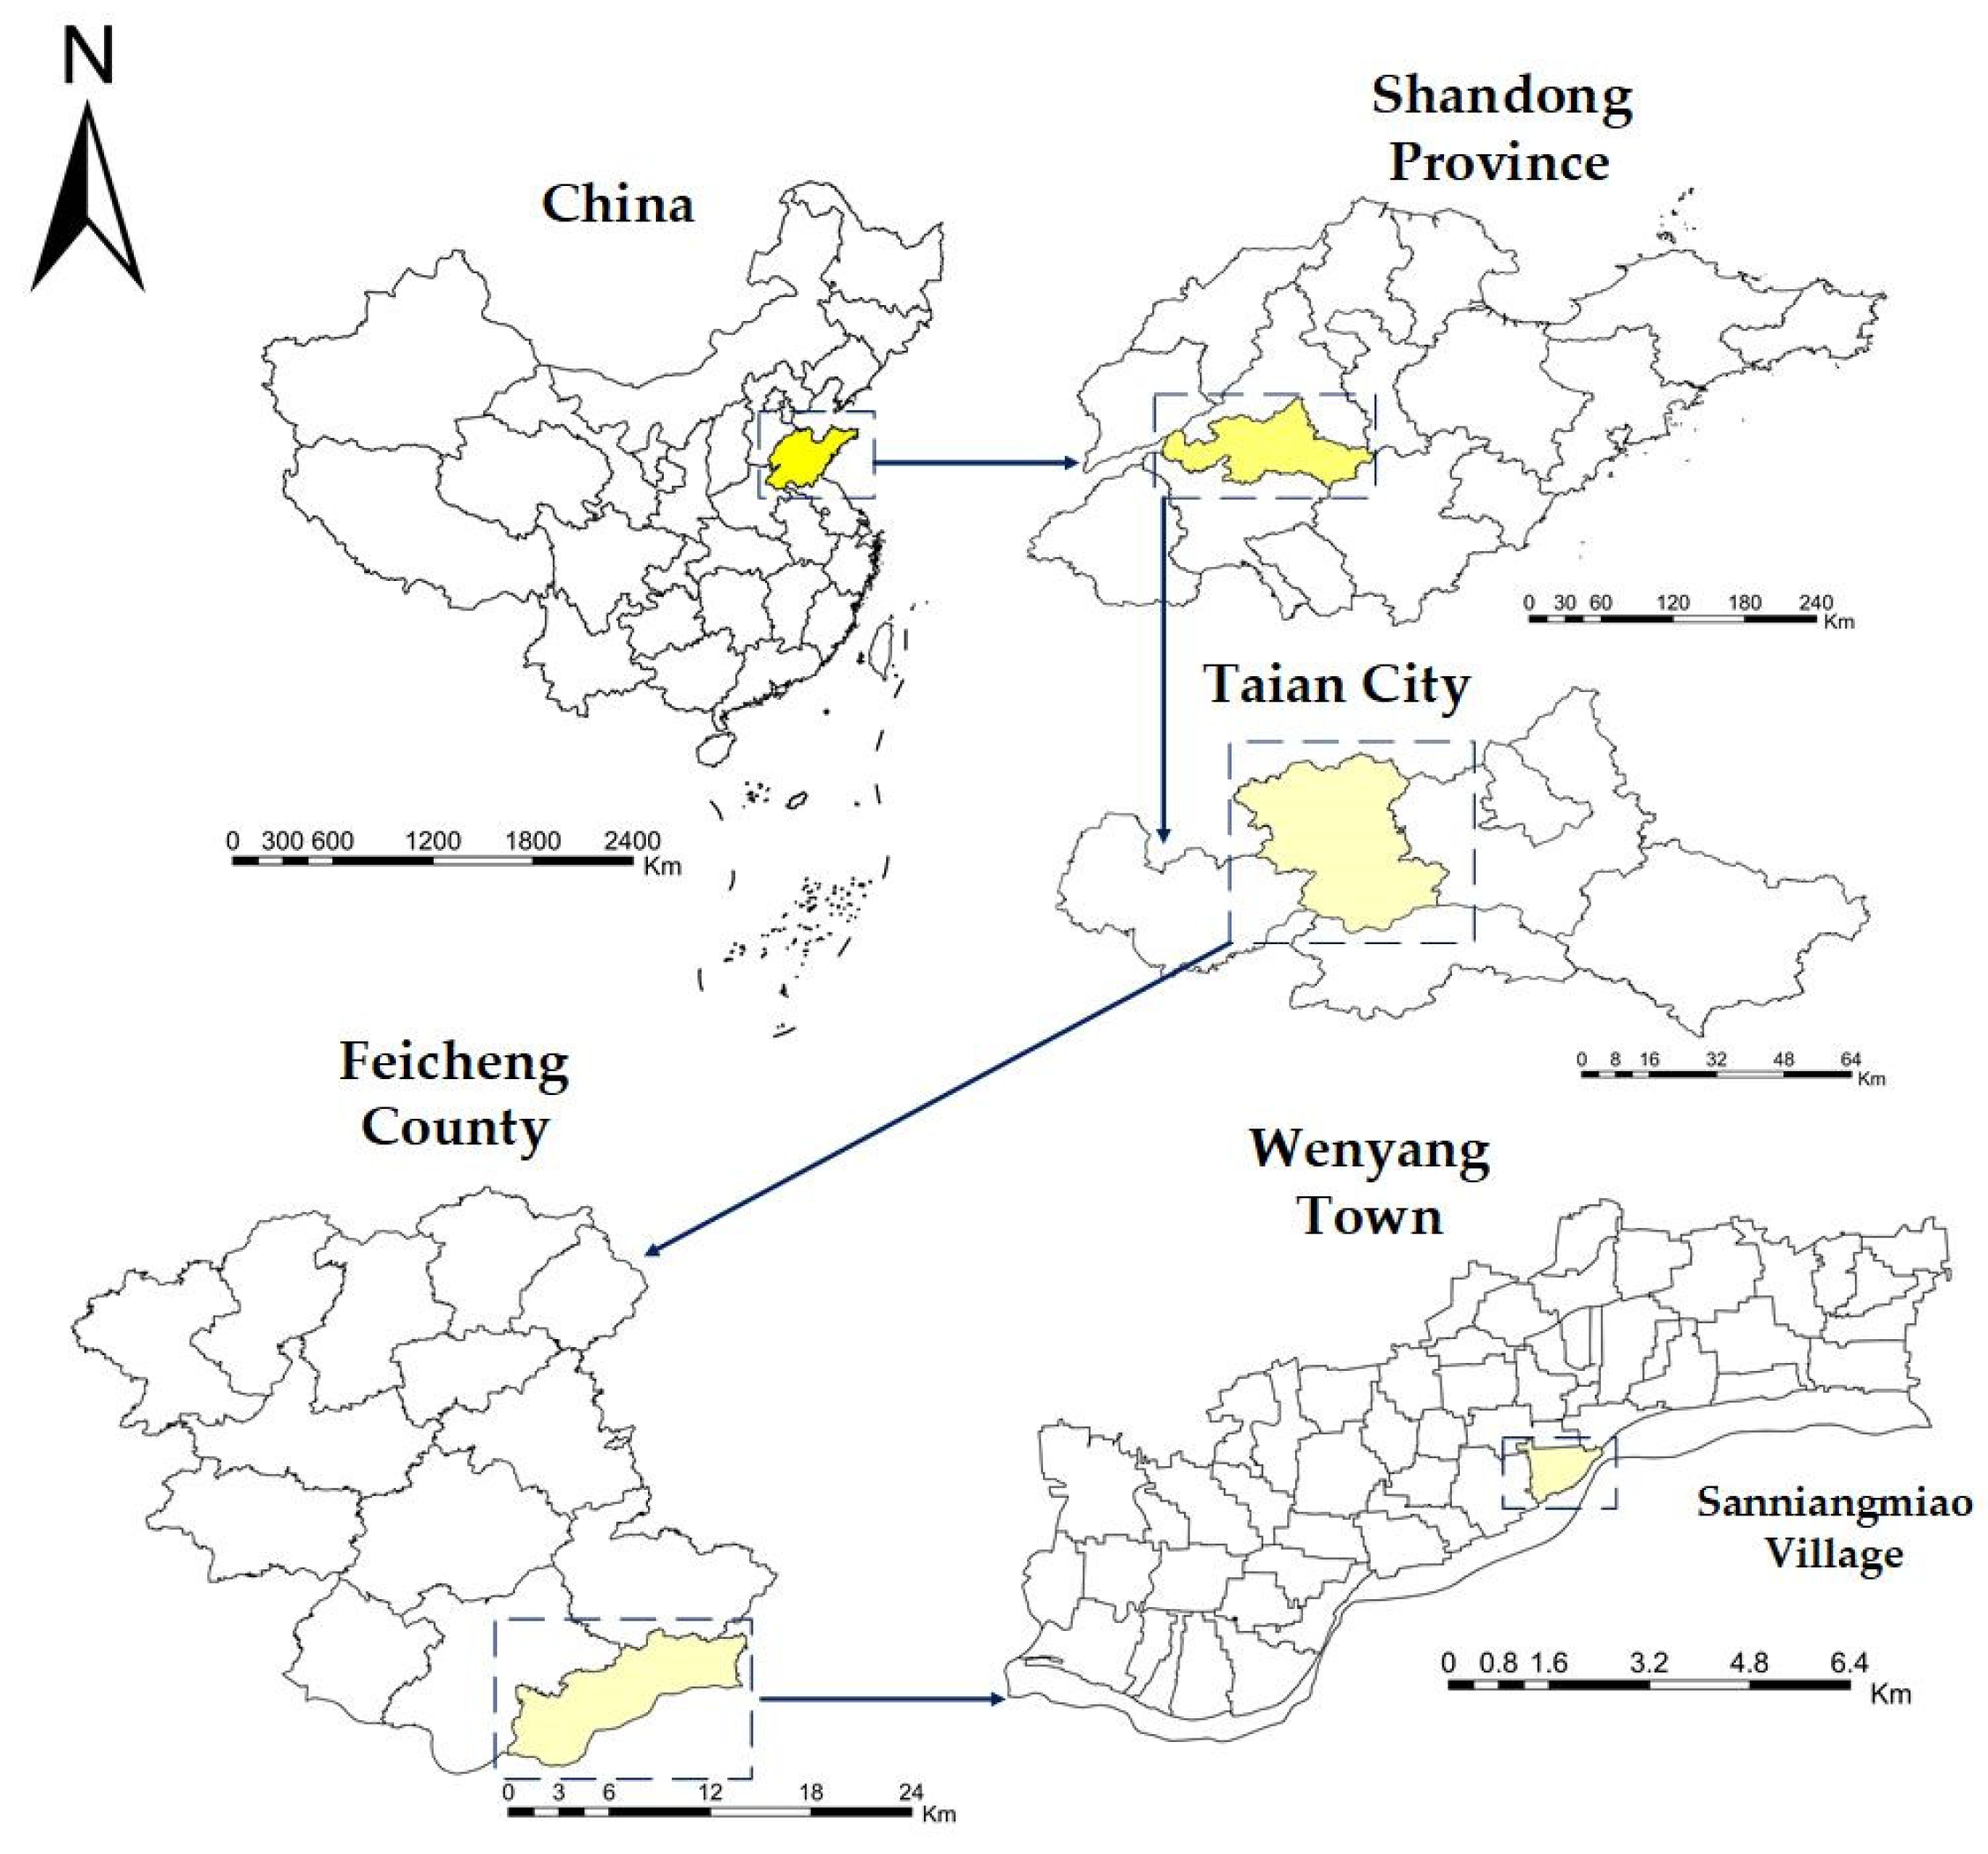
2.1. Overview of the Research Area
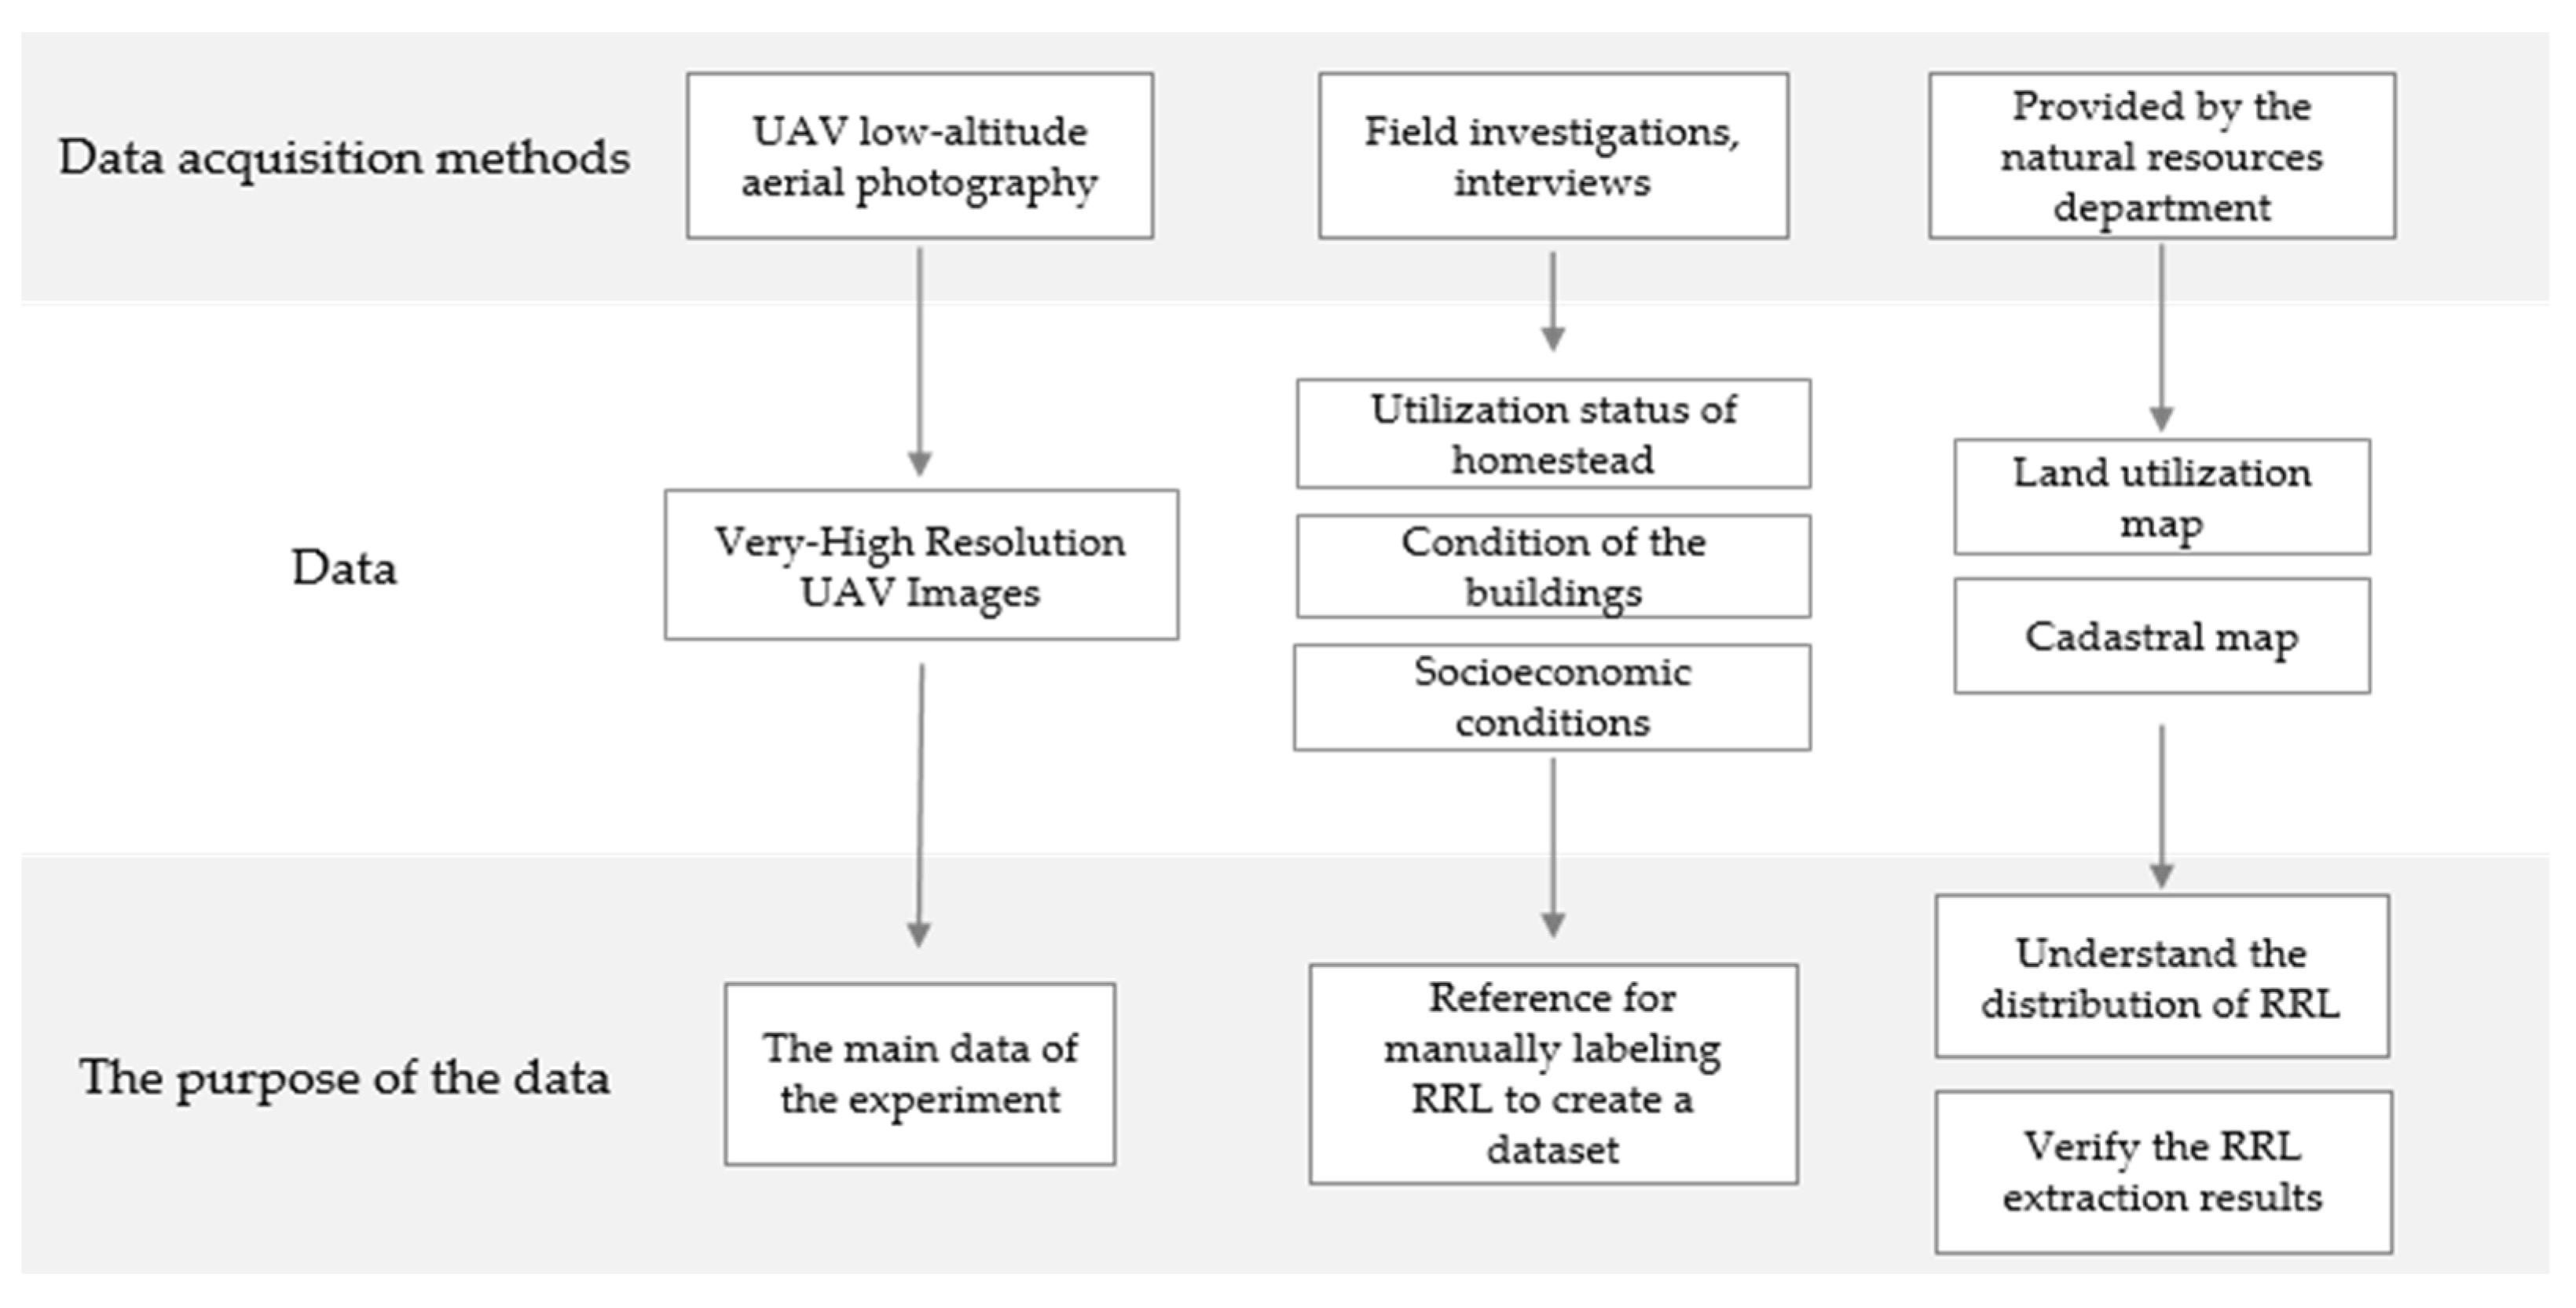
2.2. Data Acquisition and Preprocessing
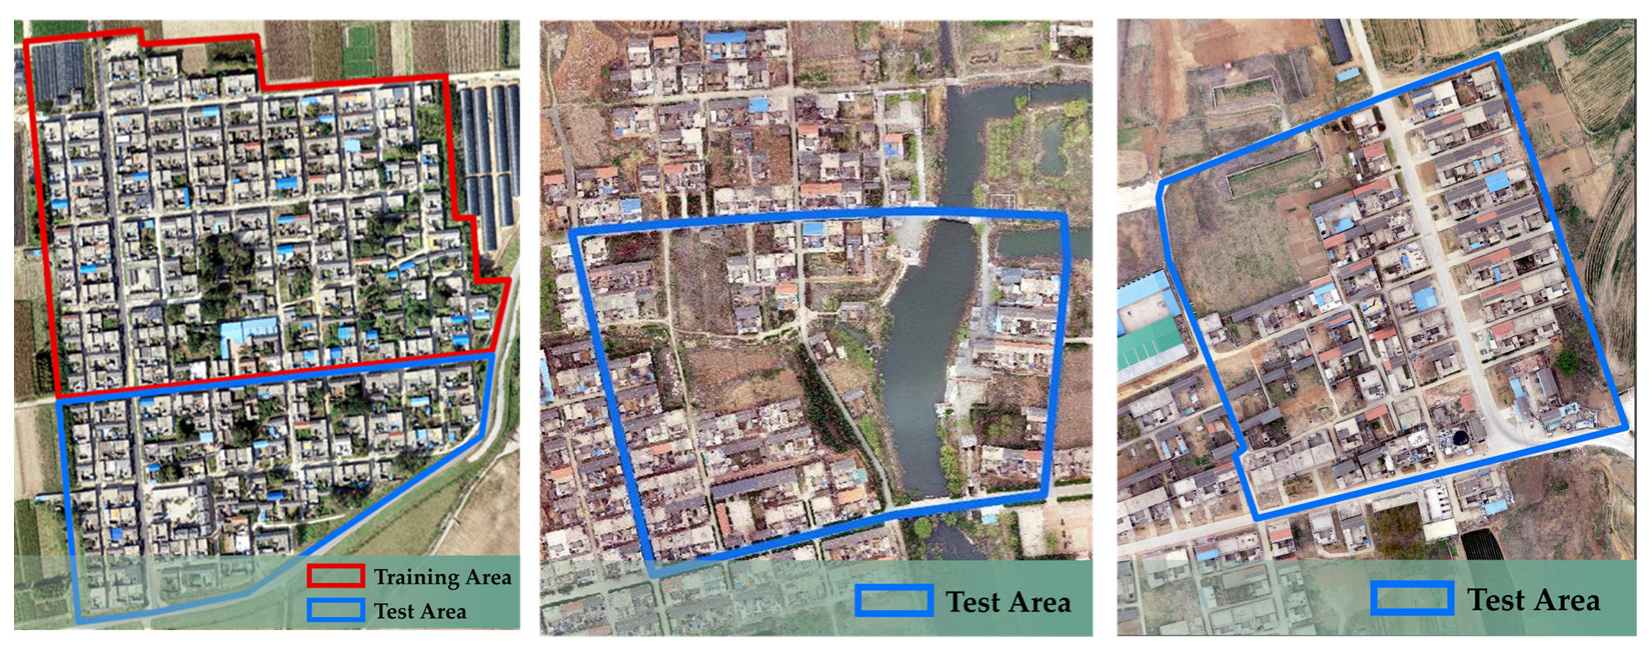
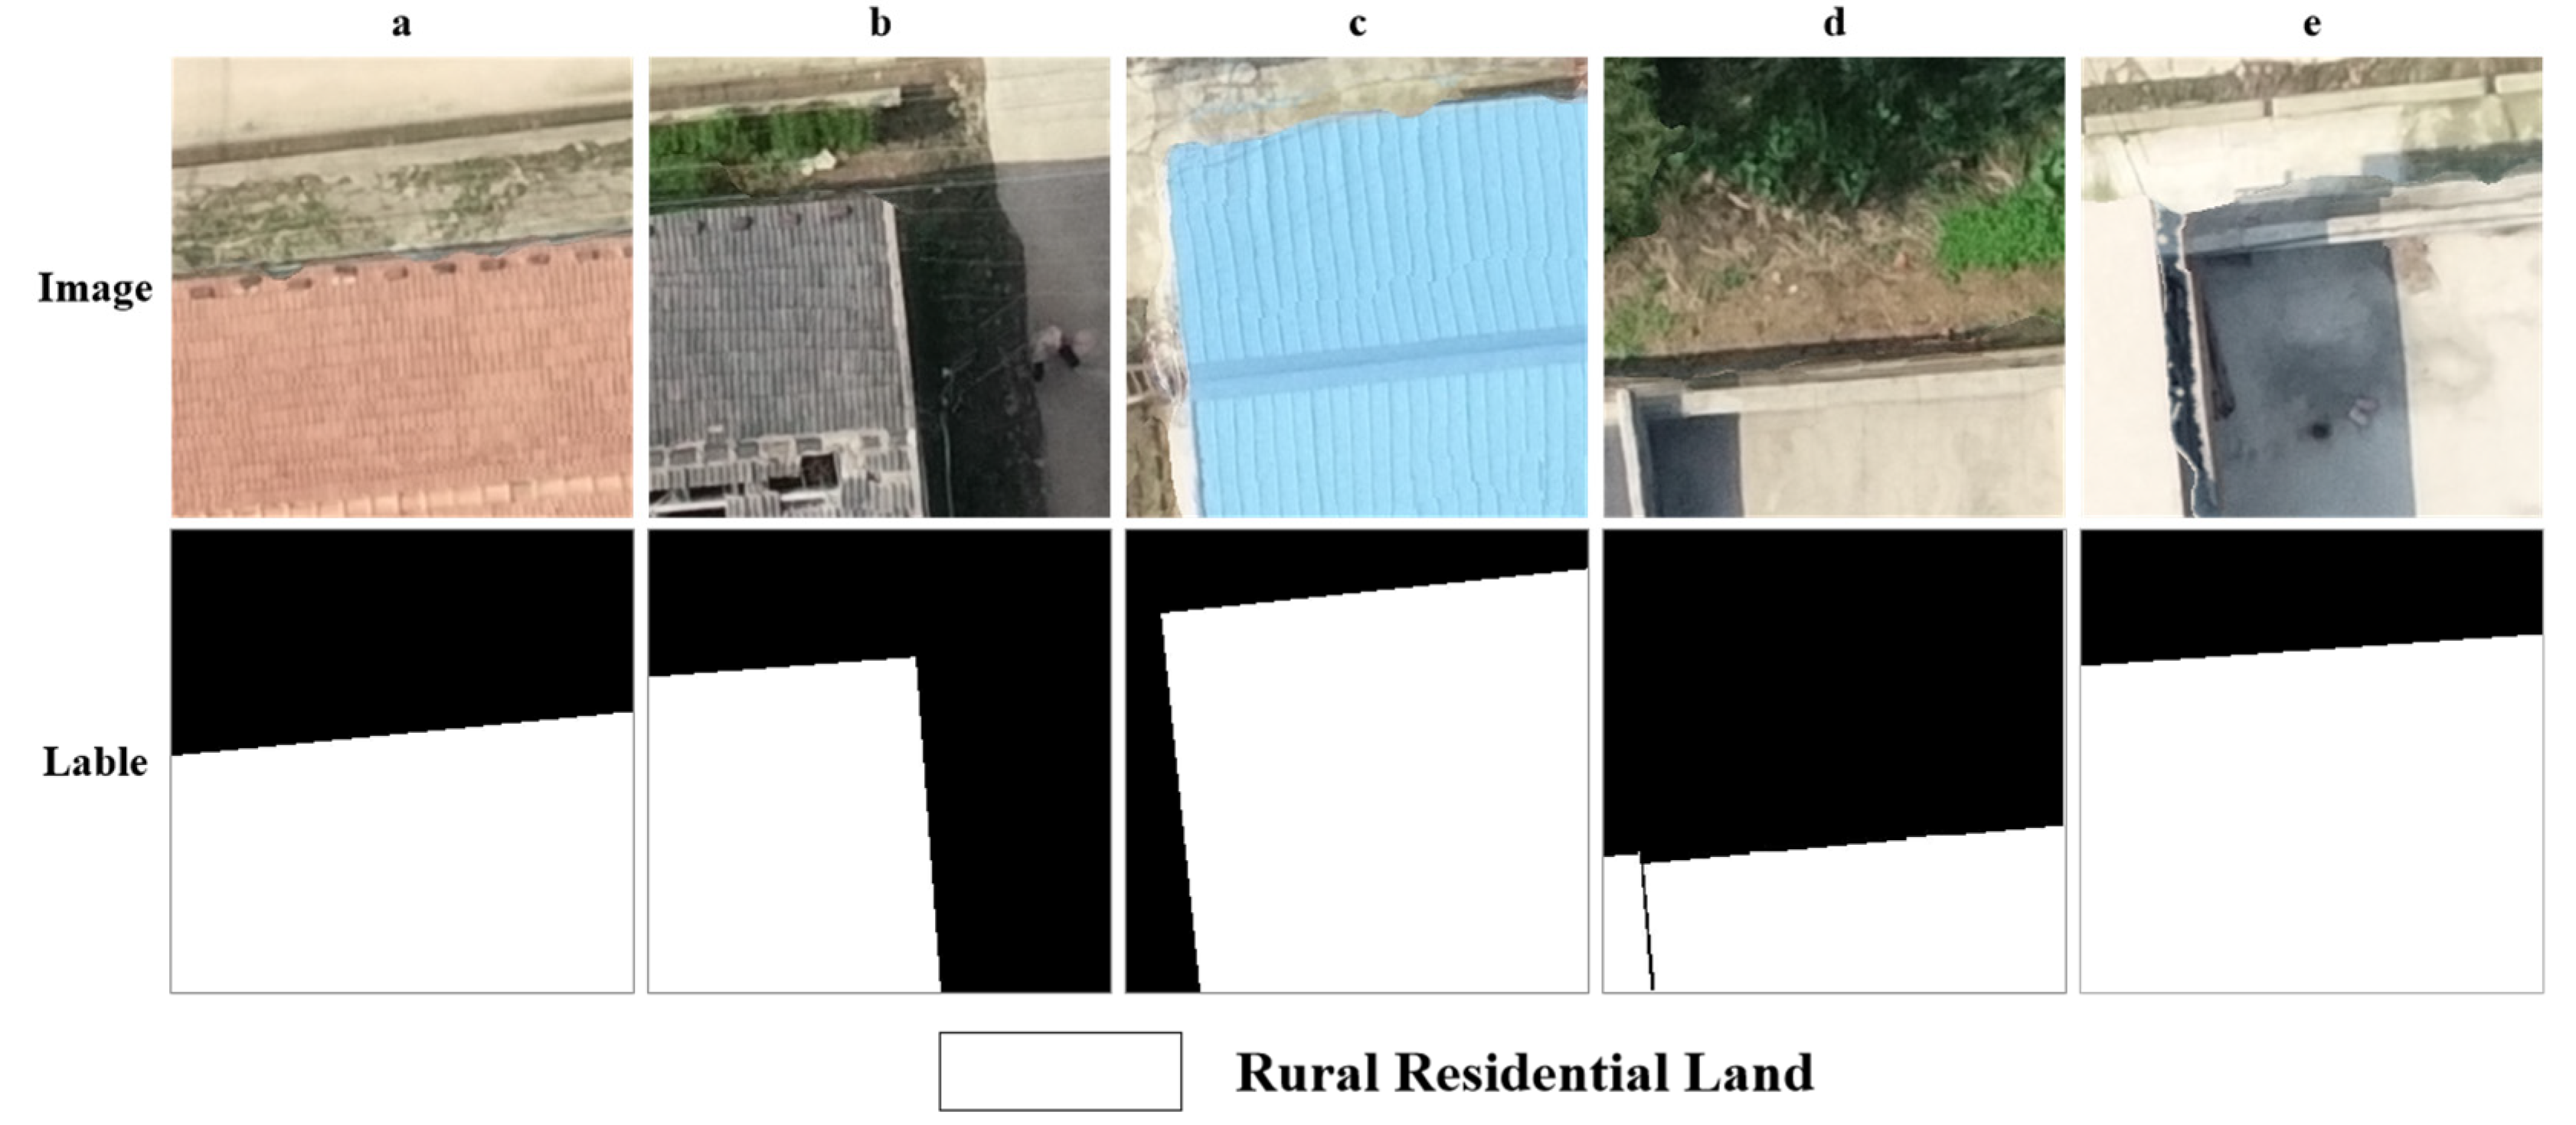
2.3. Construct Semantic Segmentation Dataset
3. Methodology
3.1. The Framework for Extraction
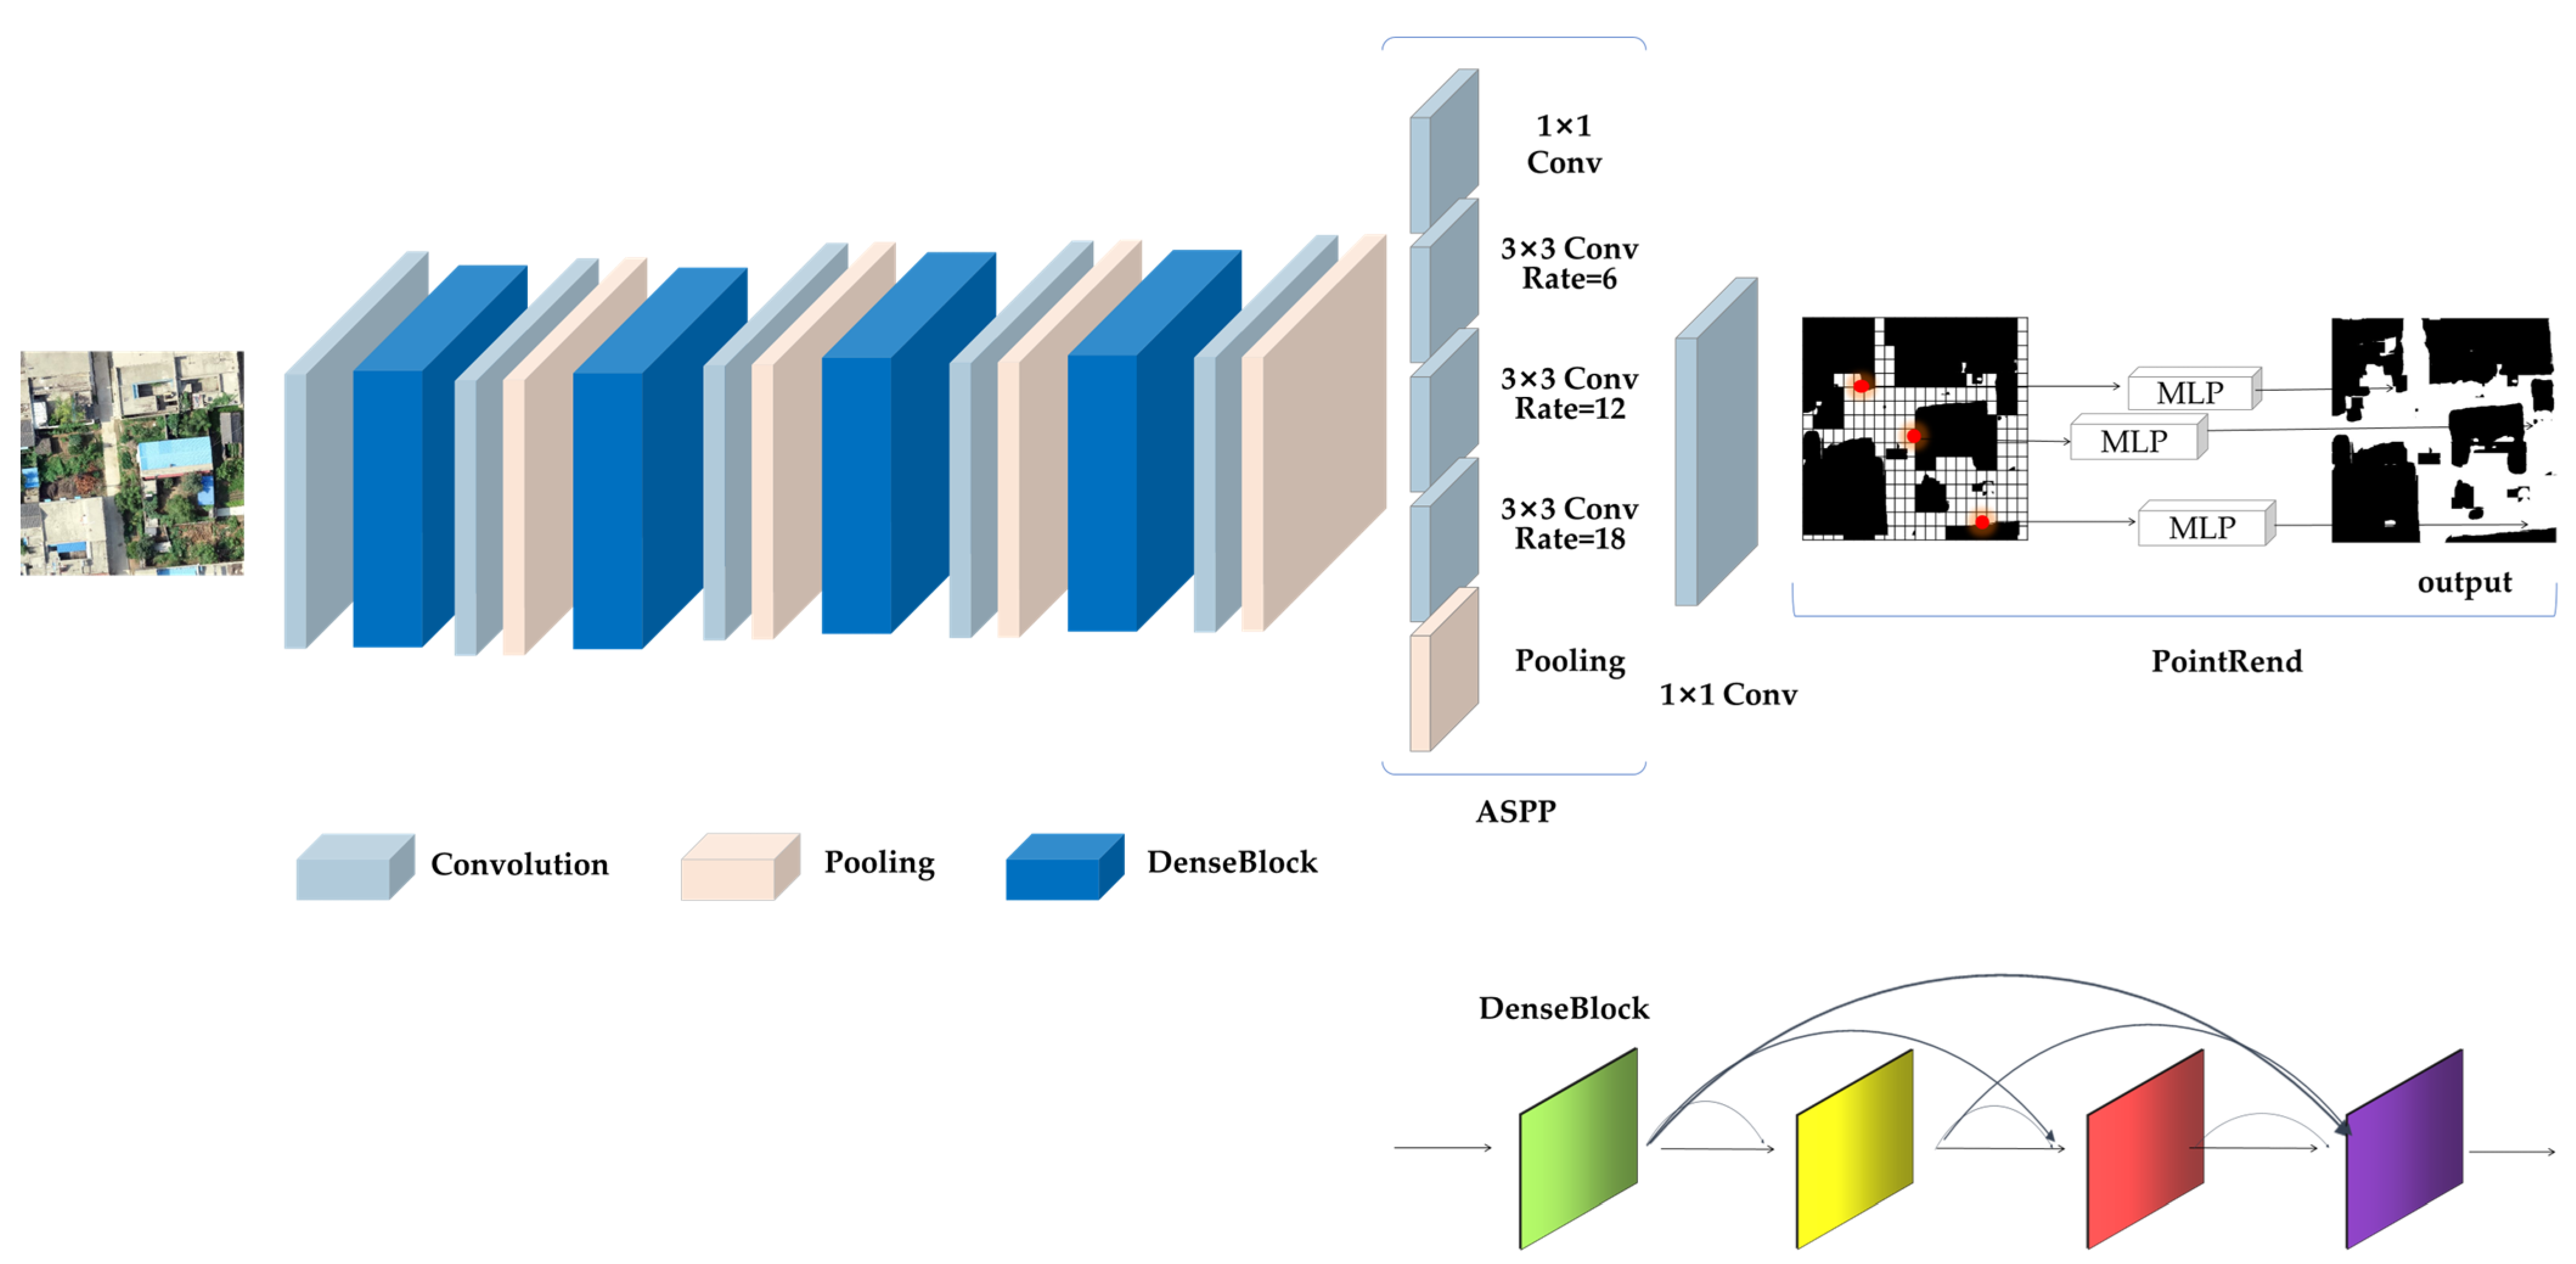
3.1.1. Architecture of the Framework
3.1.2. Feature Extraction Network: DenseNet
3.1.3. Dilated Convolution and ASPP
3.1.4. PointRend Module
3.2. Accuracy Evaluation Method
3.2.1. Evaluation Metrics for the Model Training Phase
3.2.2. Evaluation Metrics for the Model Testing Phase
3.3. Transfer Learning
4. Results and Analysis
4.1. The Results of Training
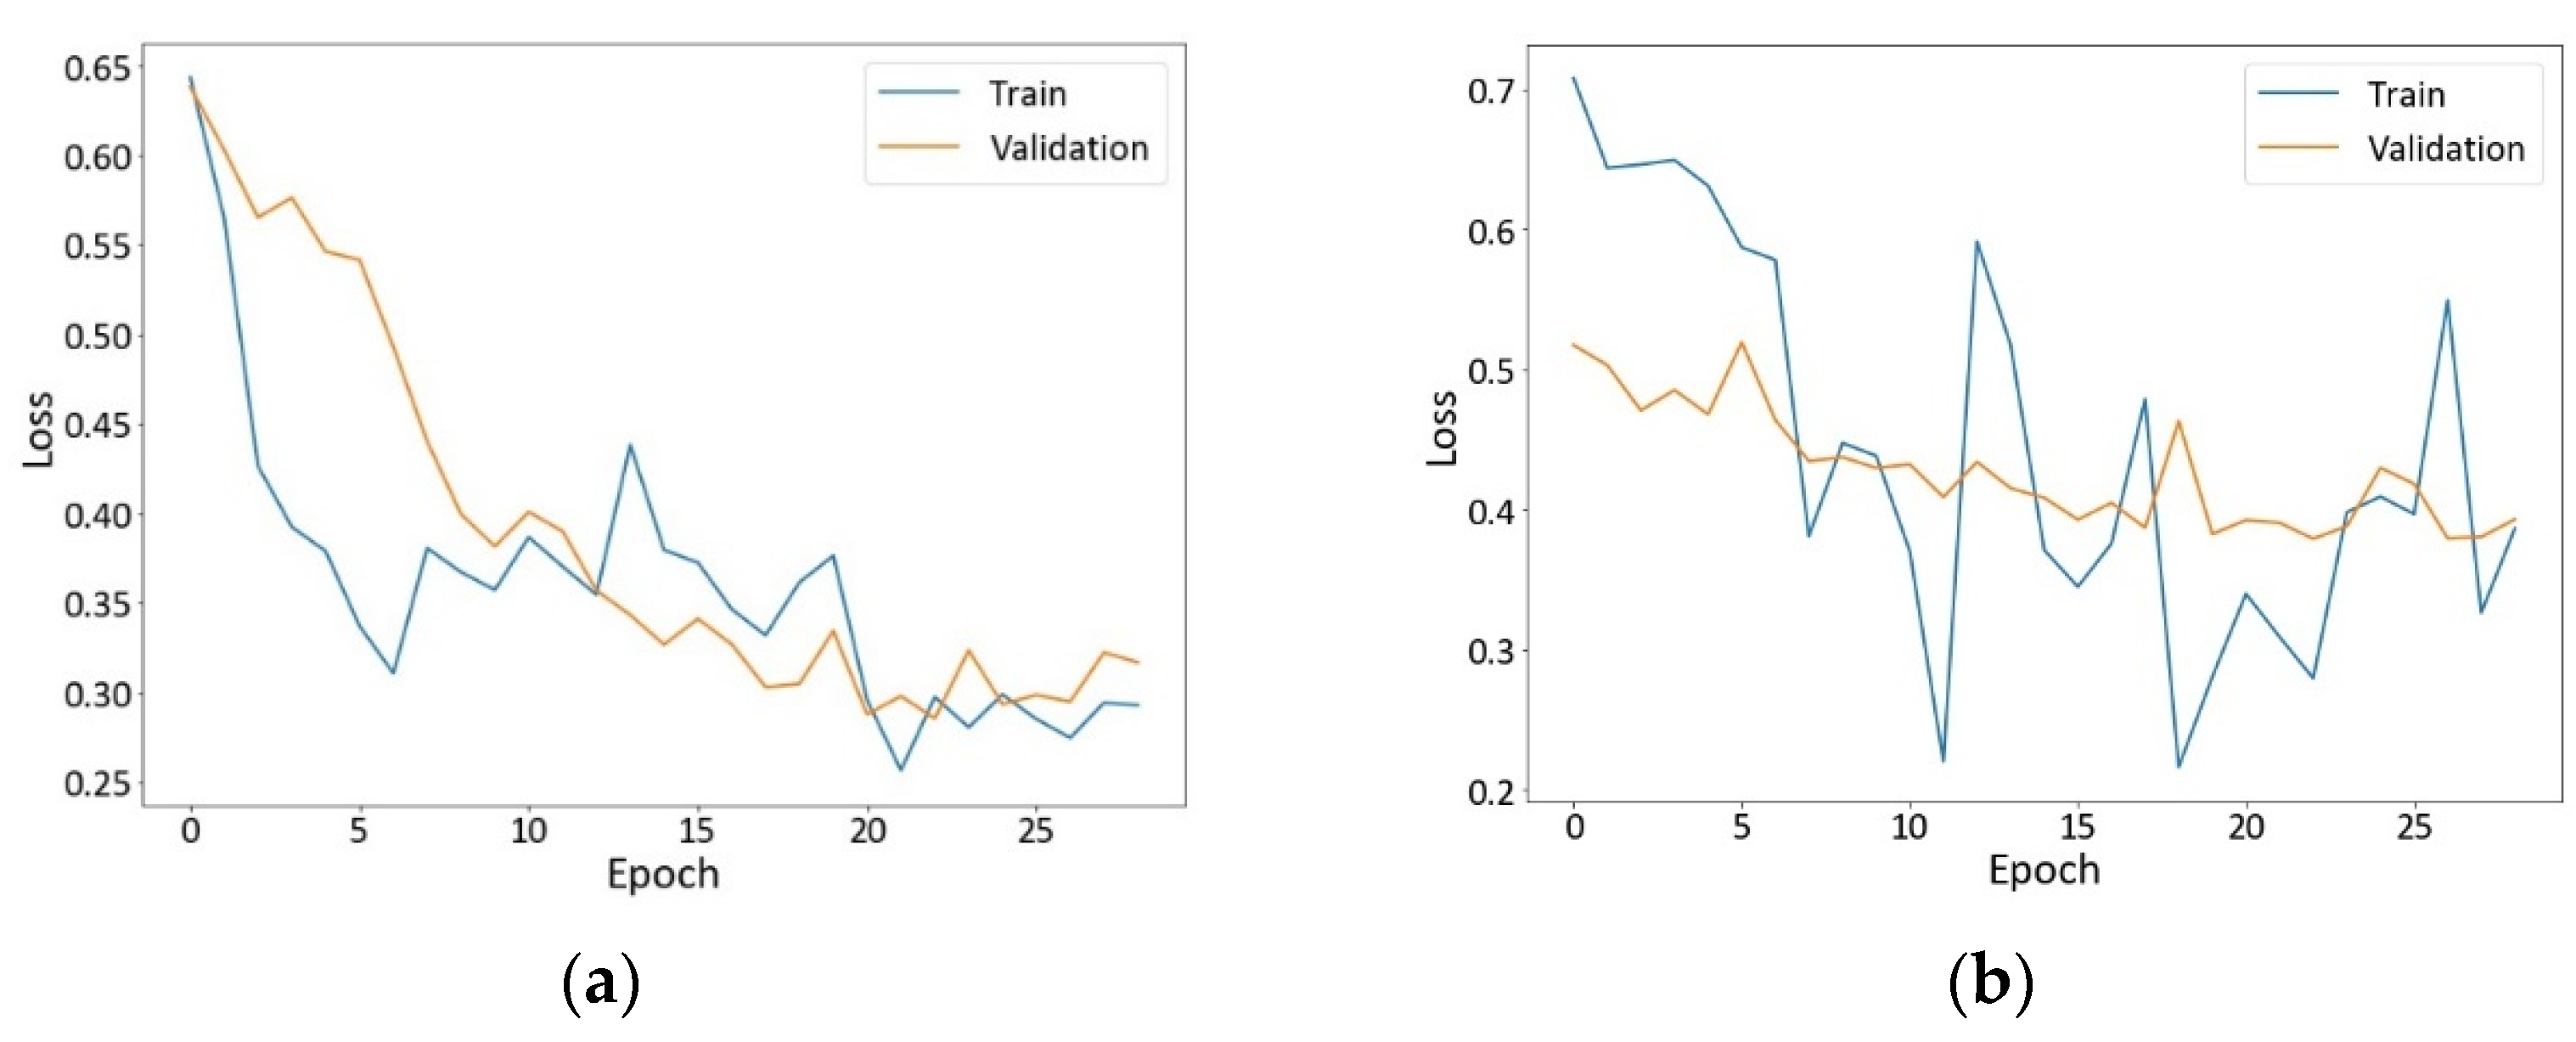
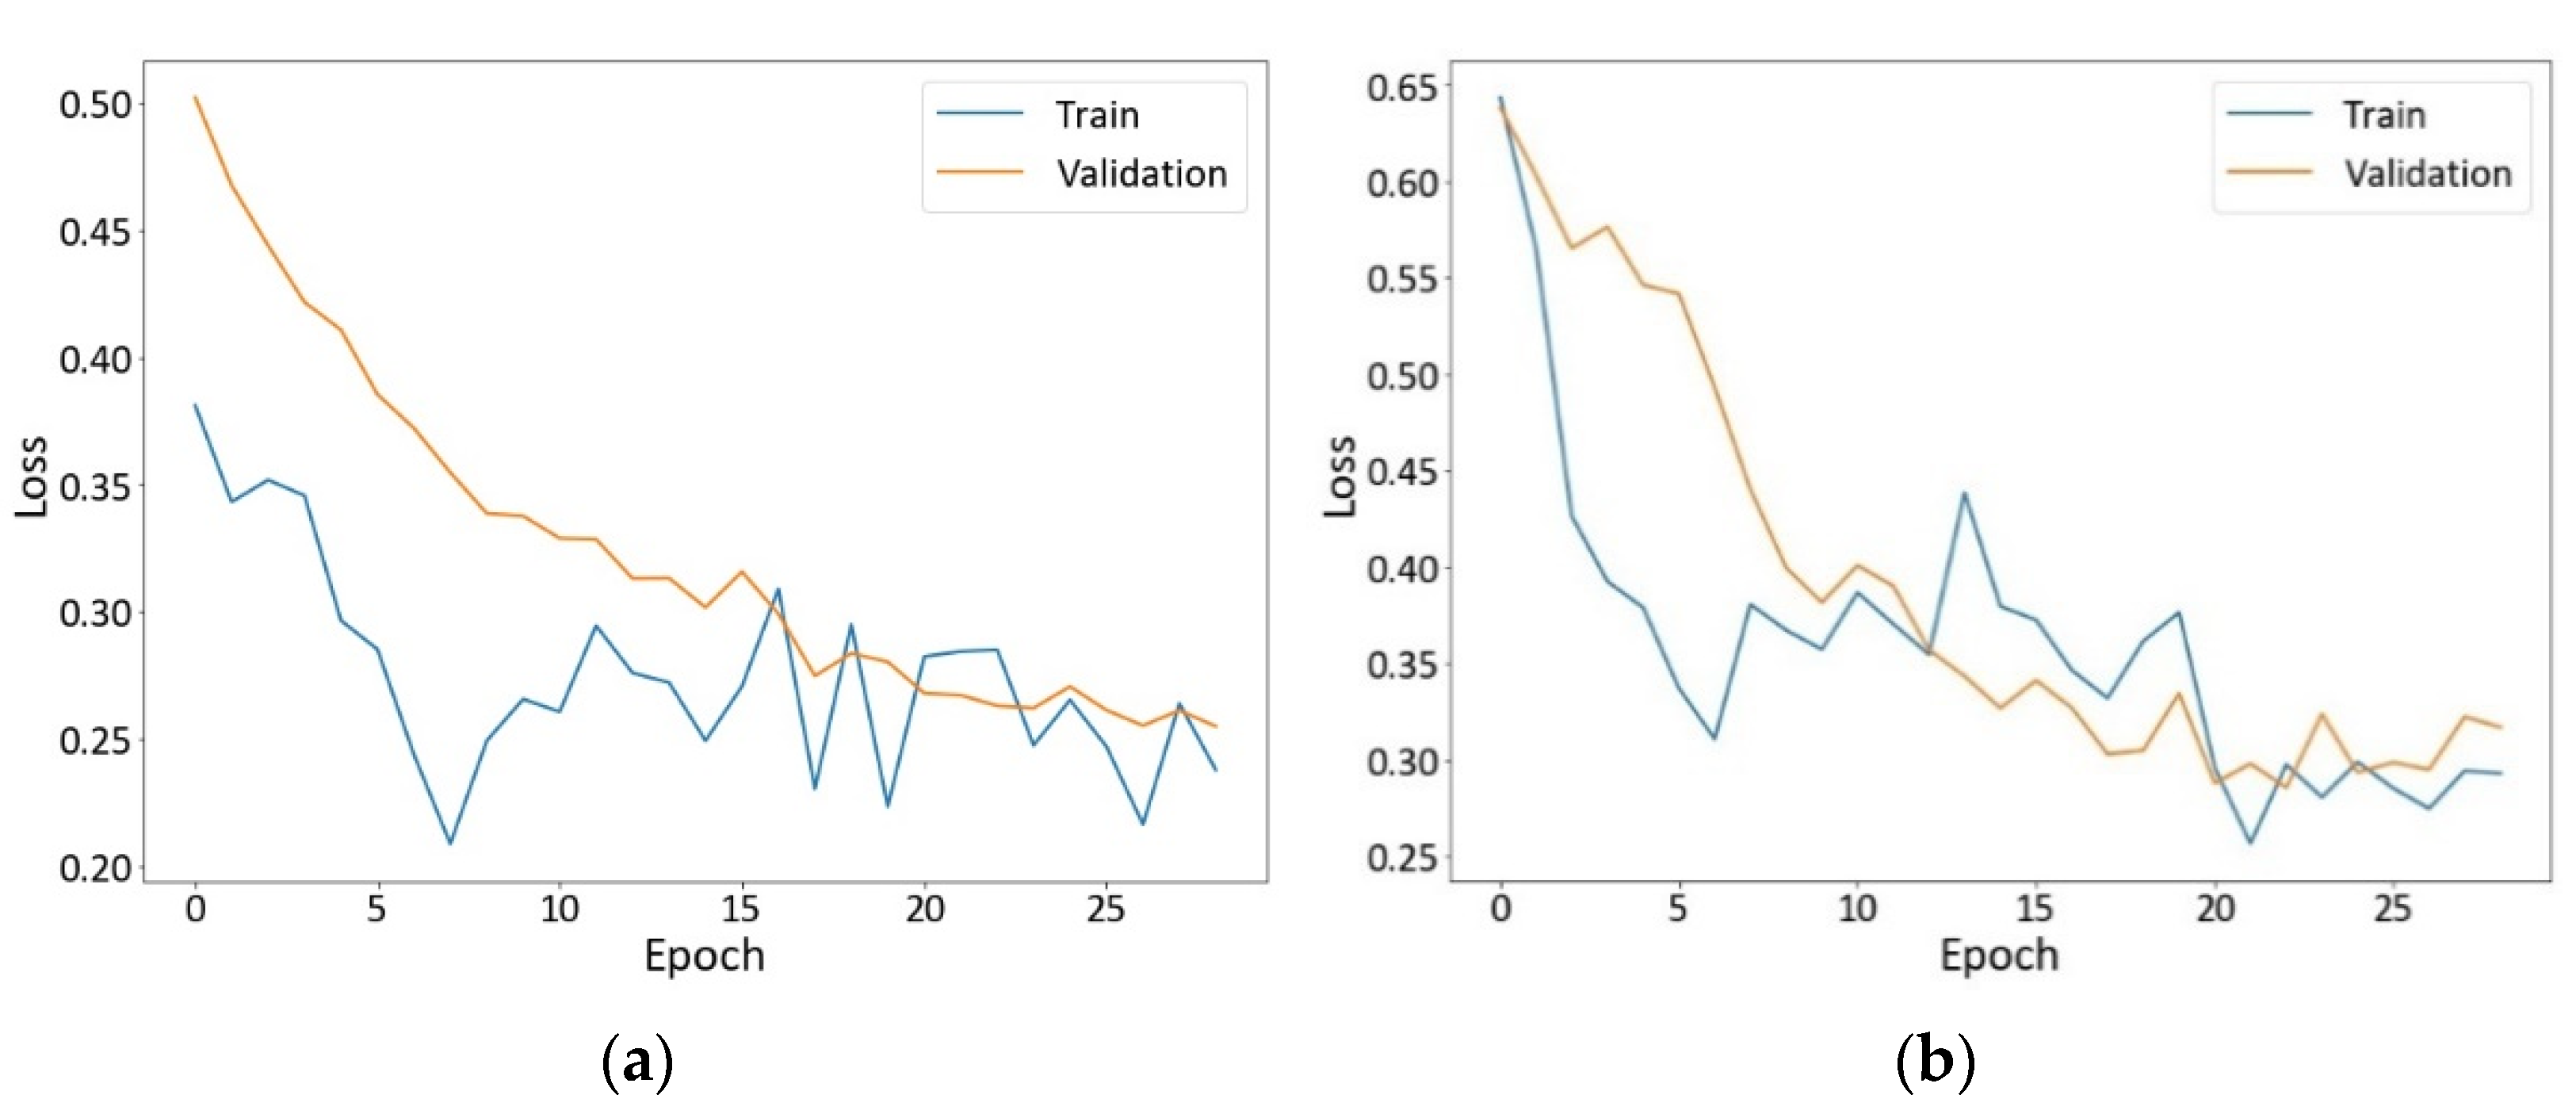
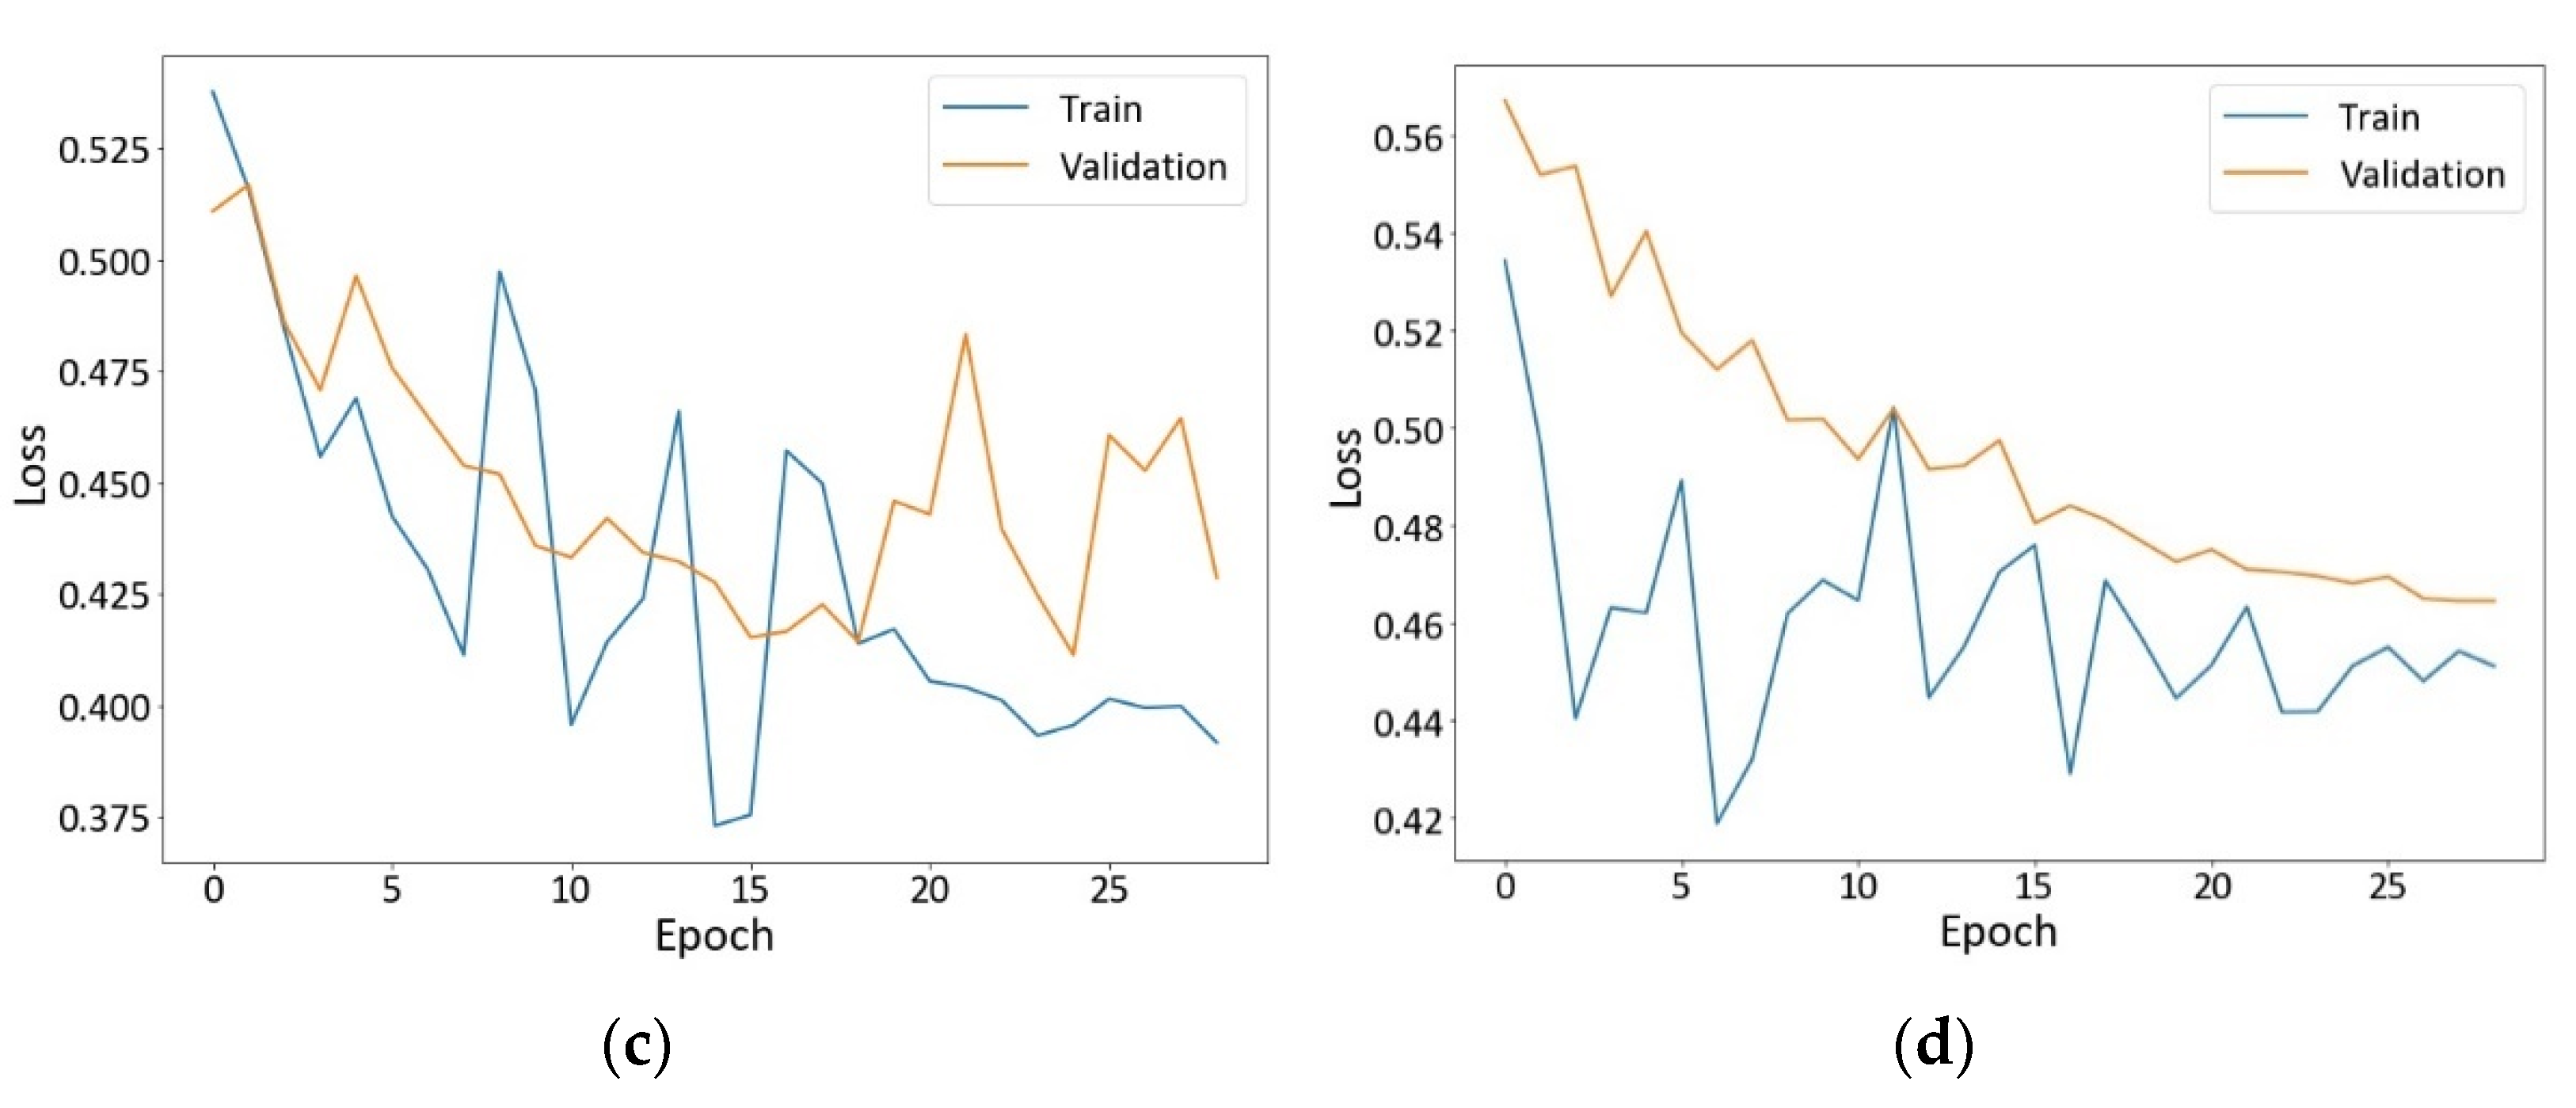
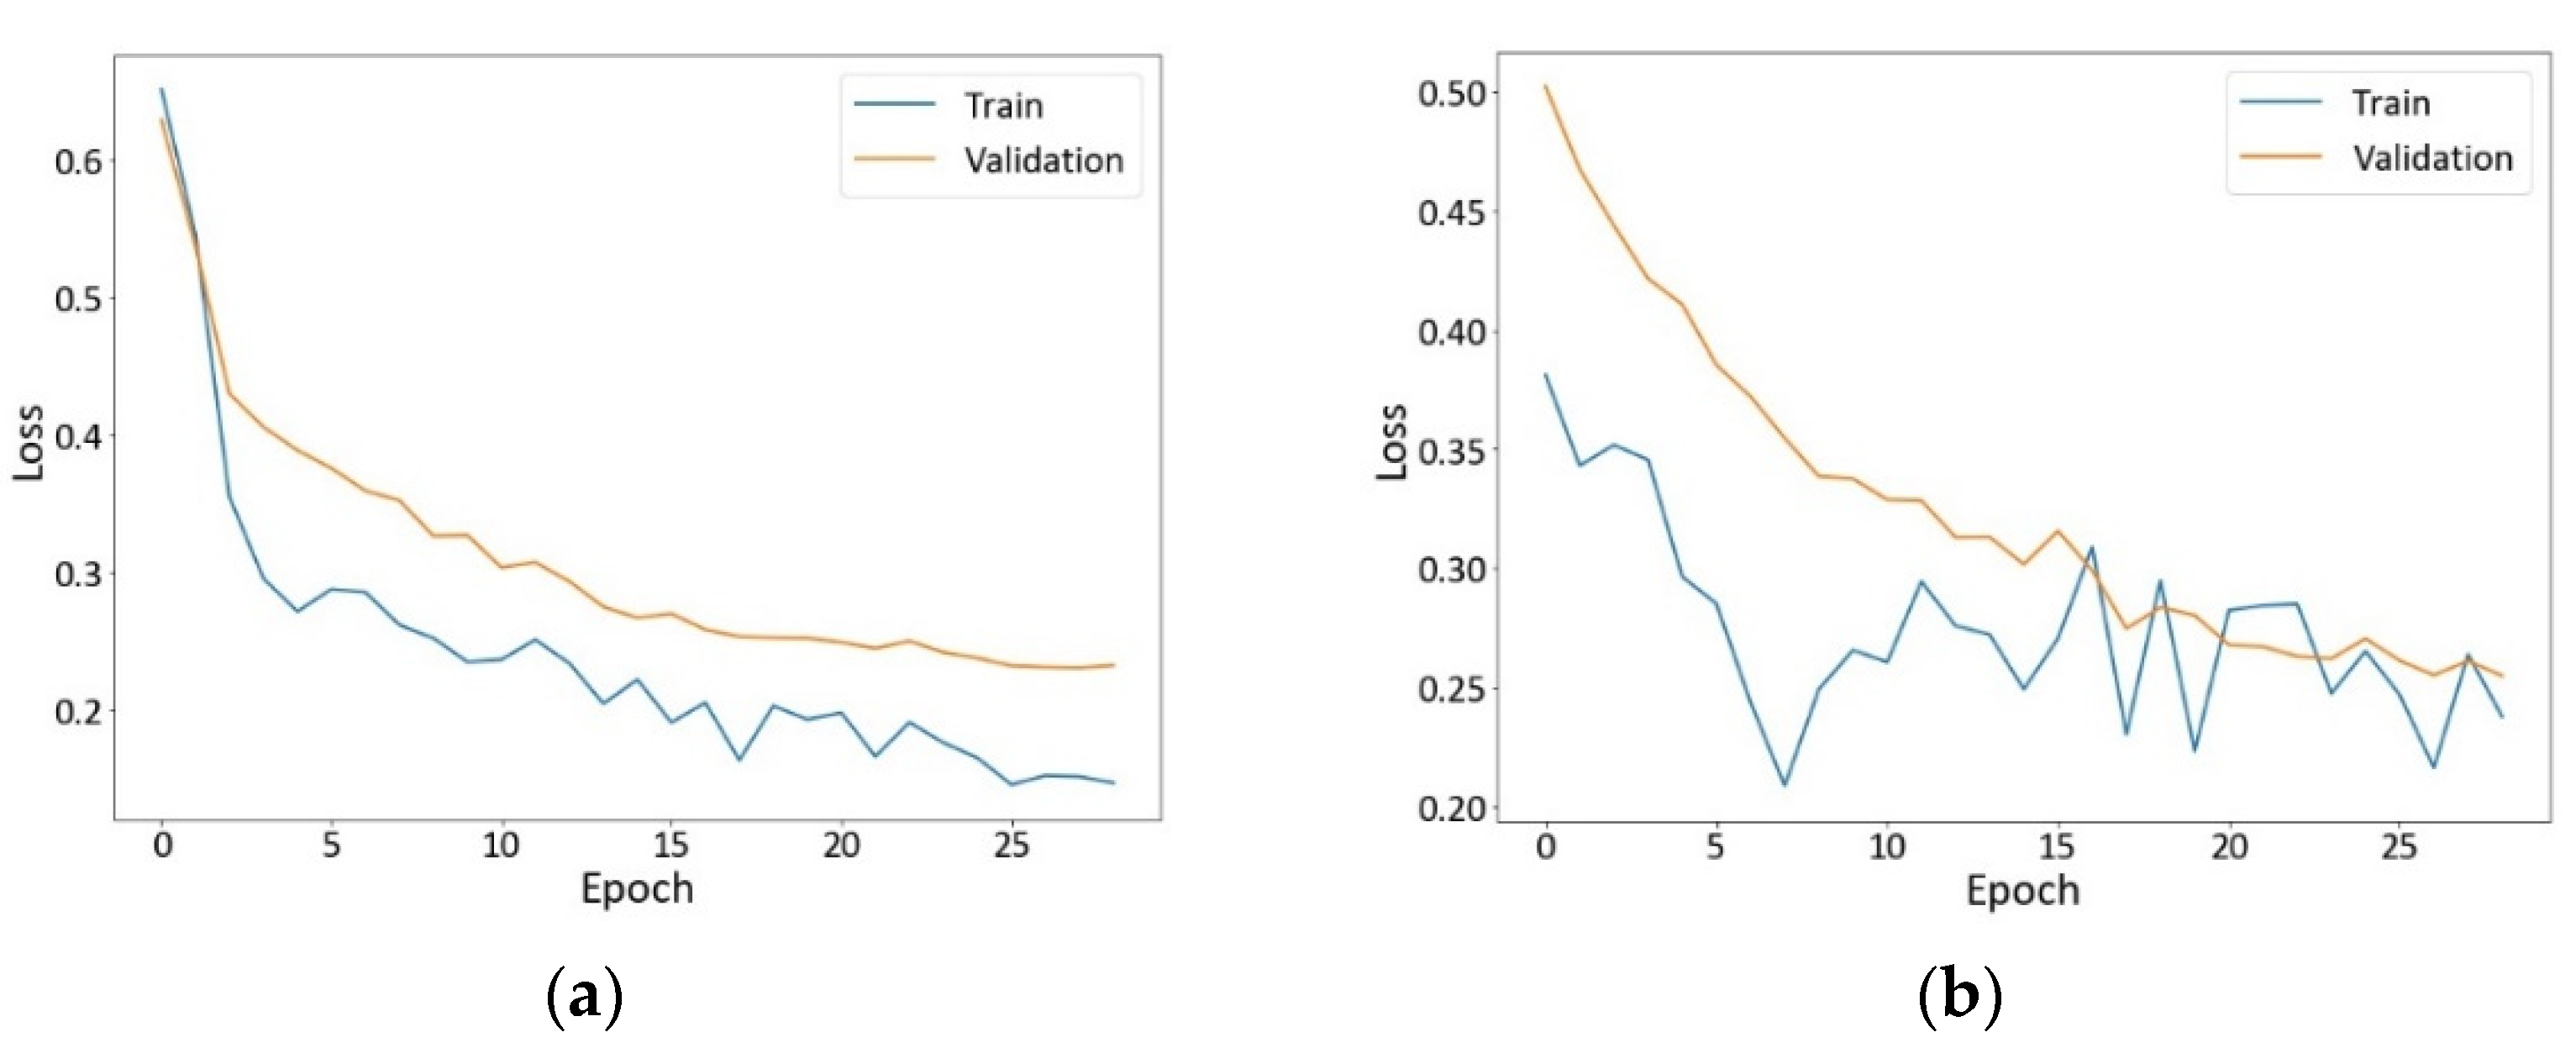
4.1.1. Loss Curves
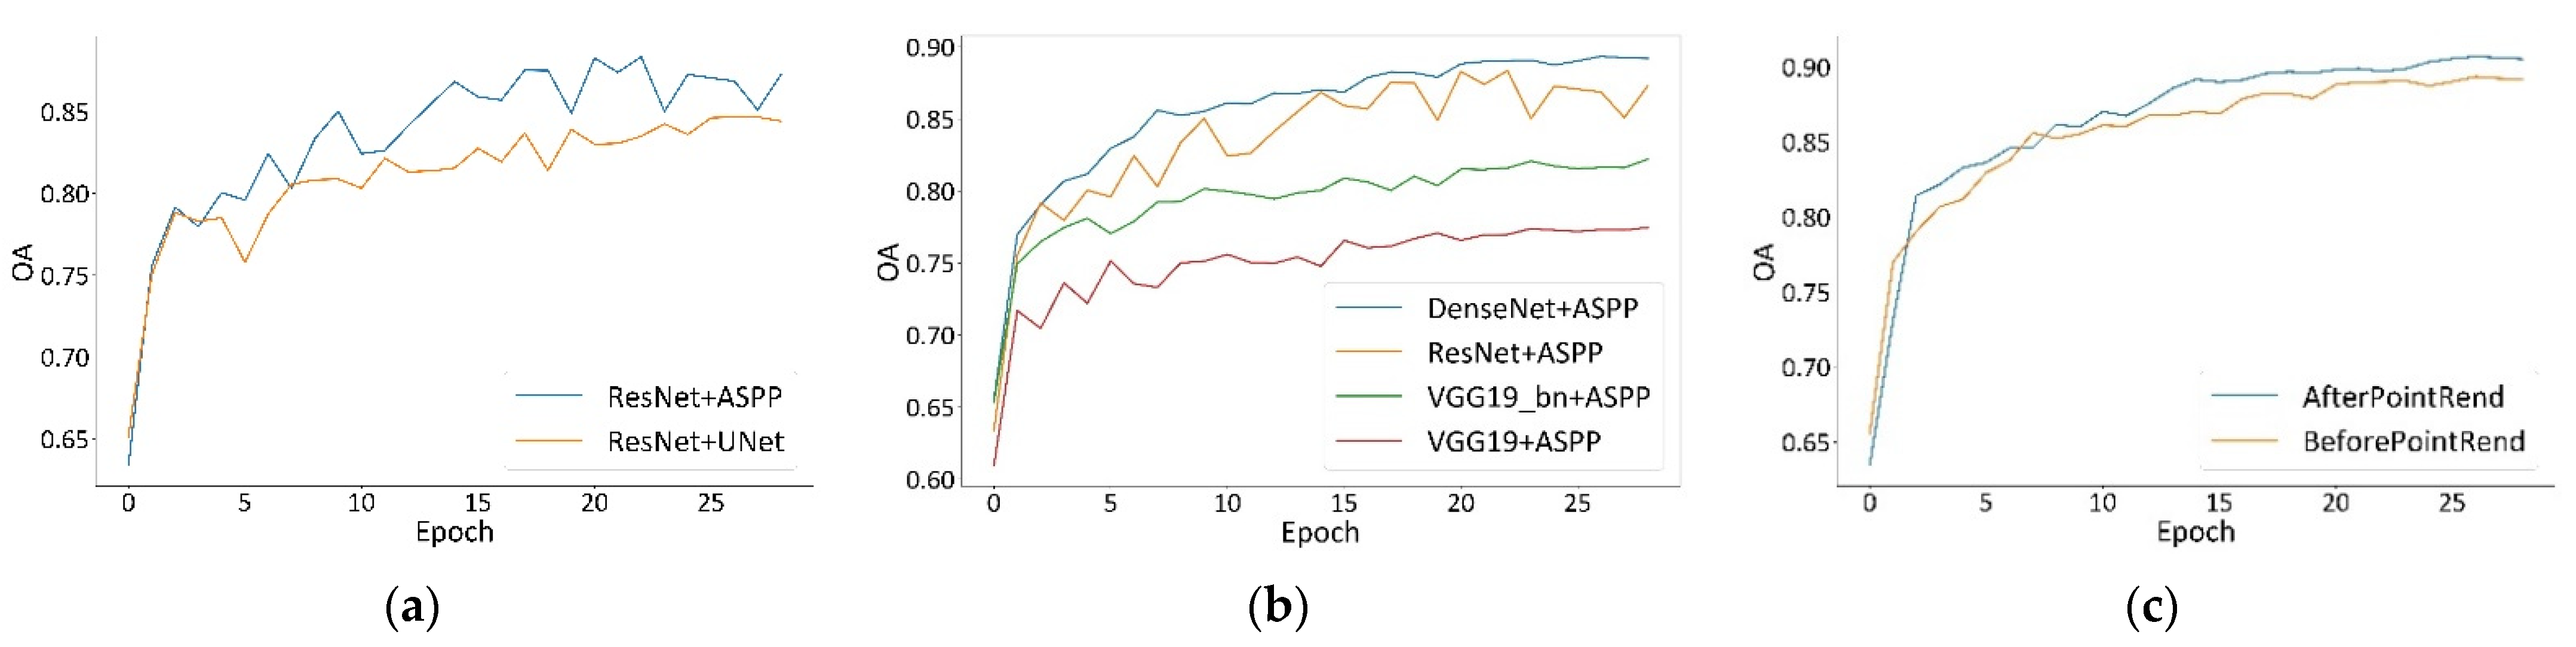
4.1.2. OA
4.2. Comparison of the Framework with Other Approaches
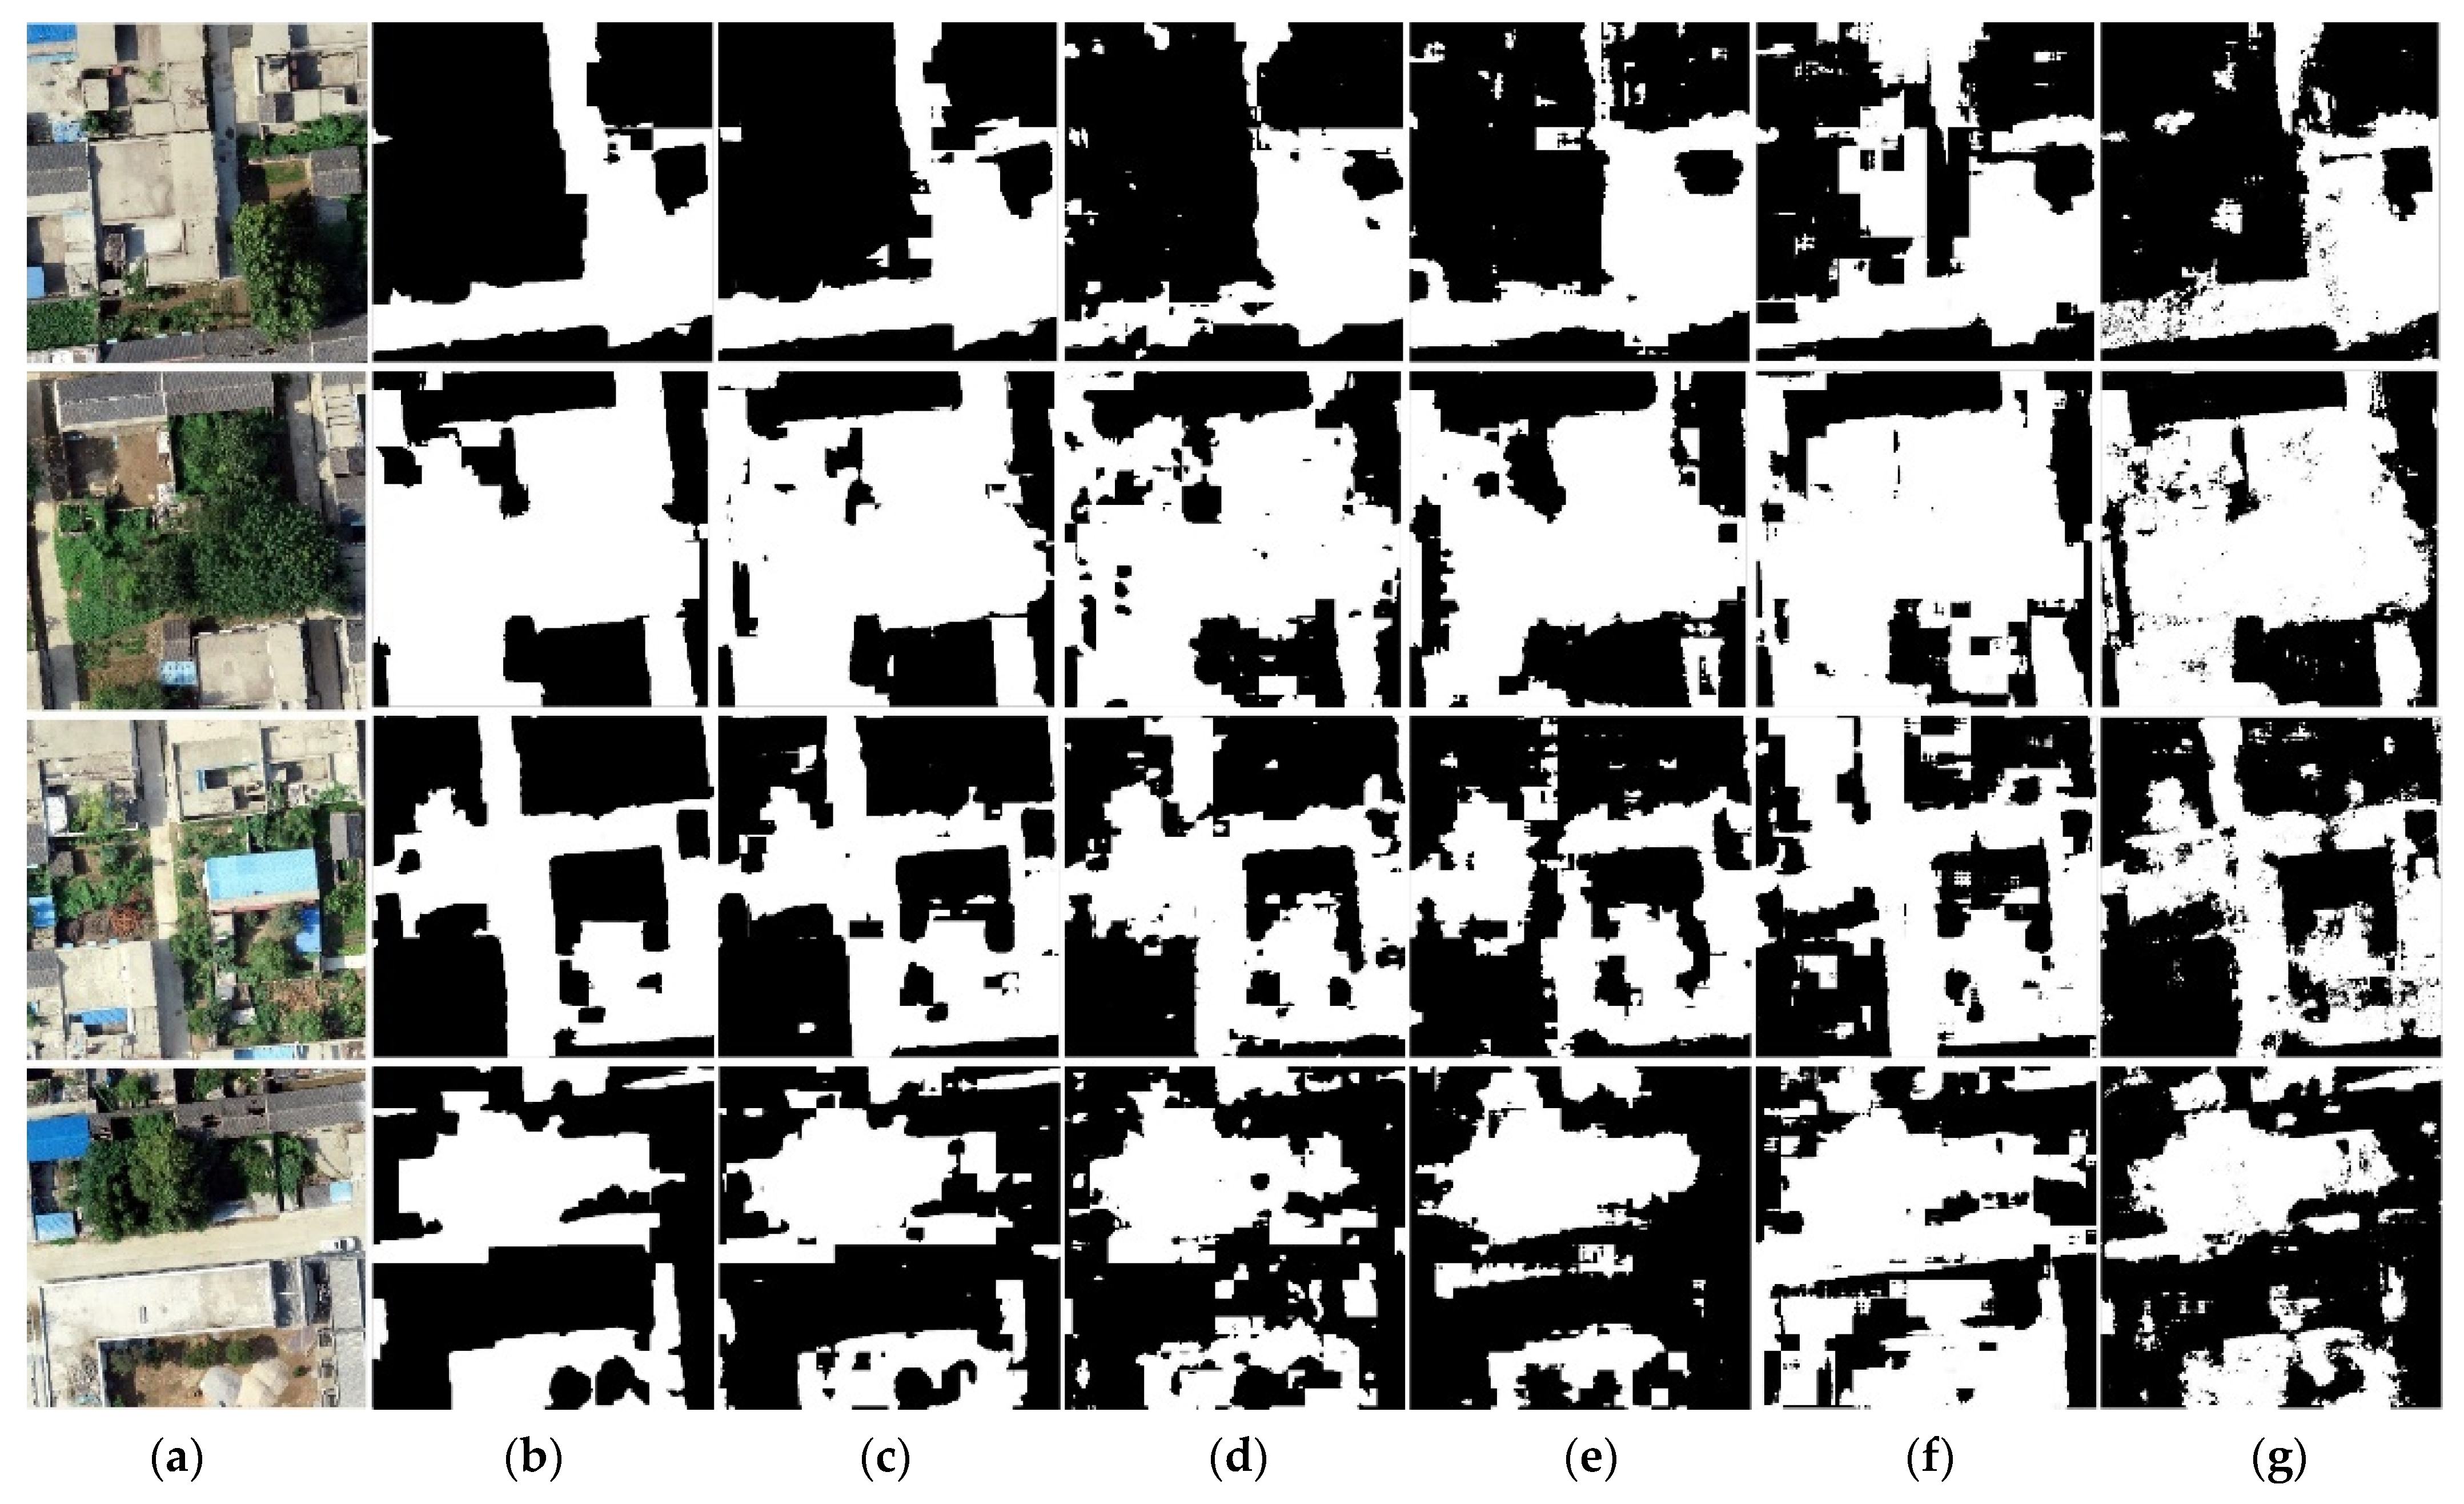
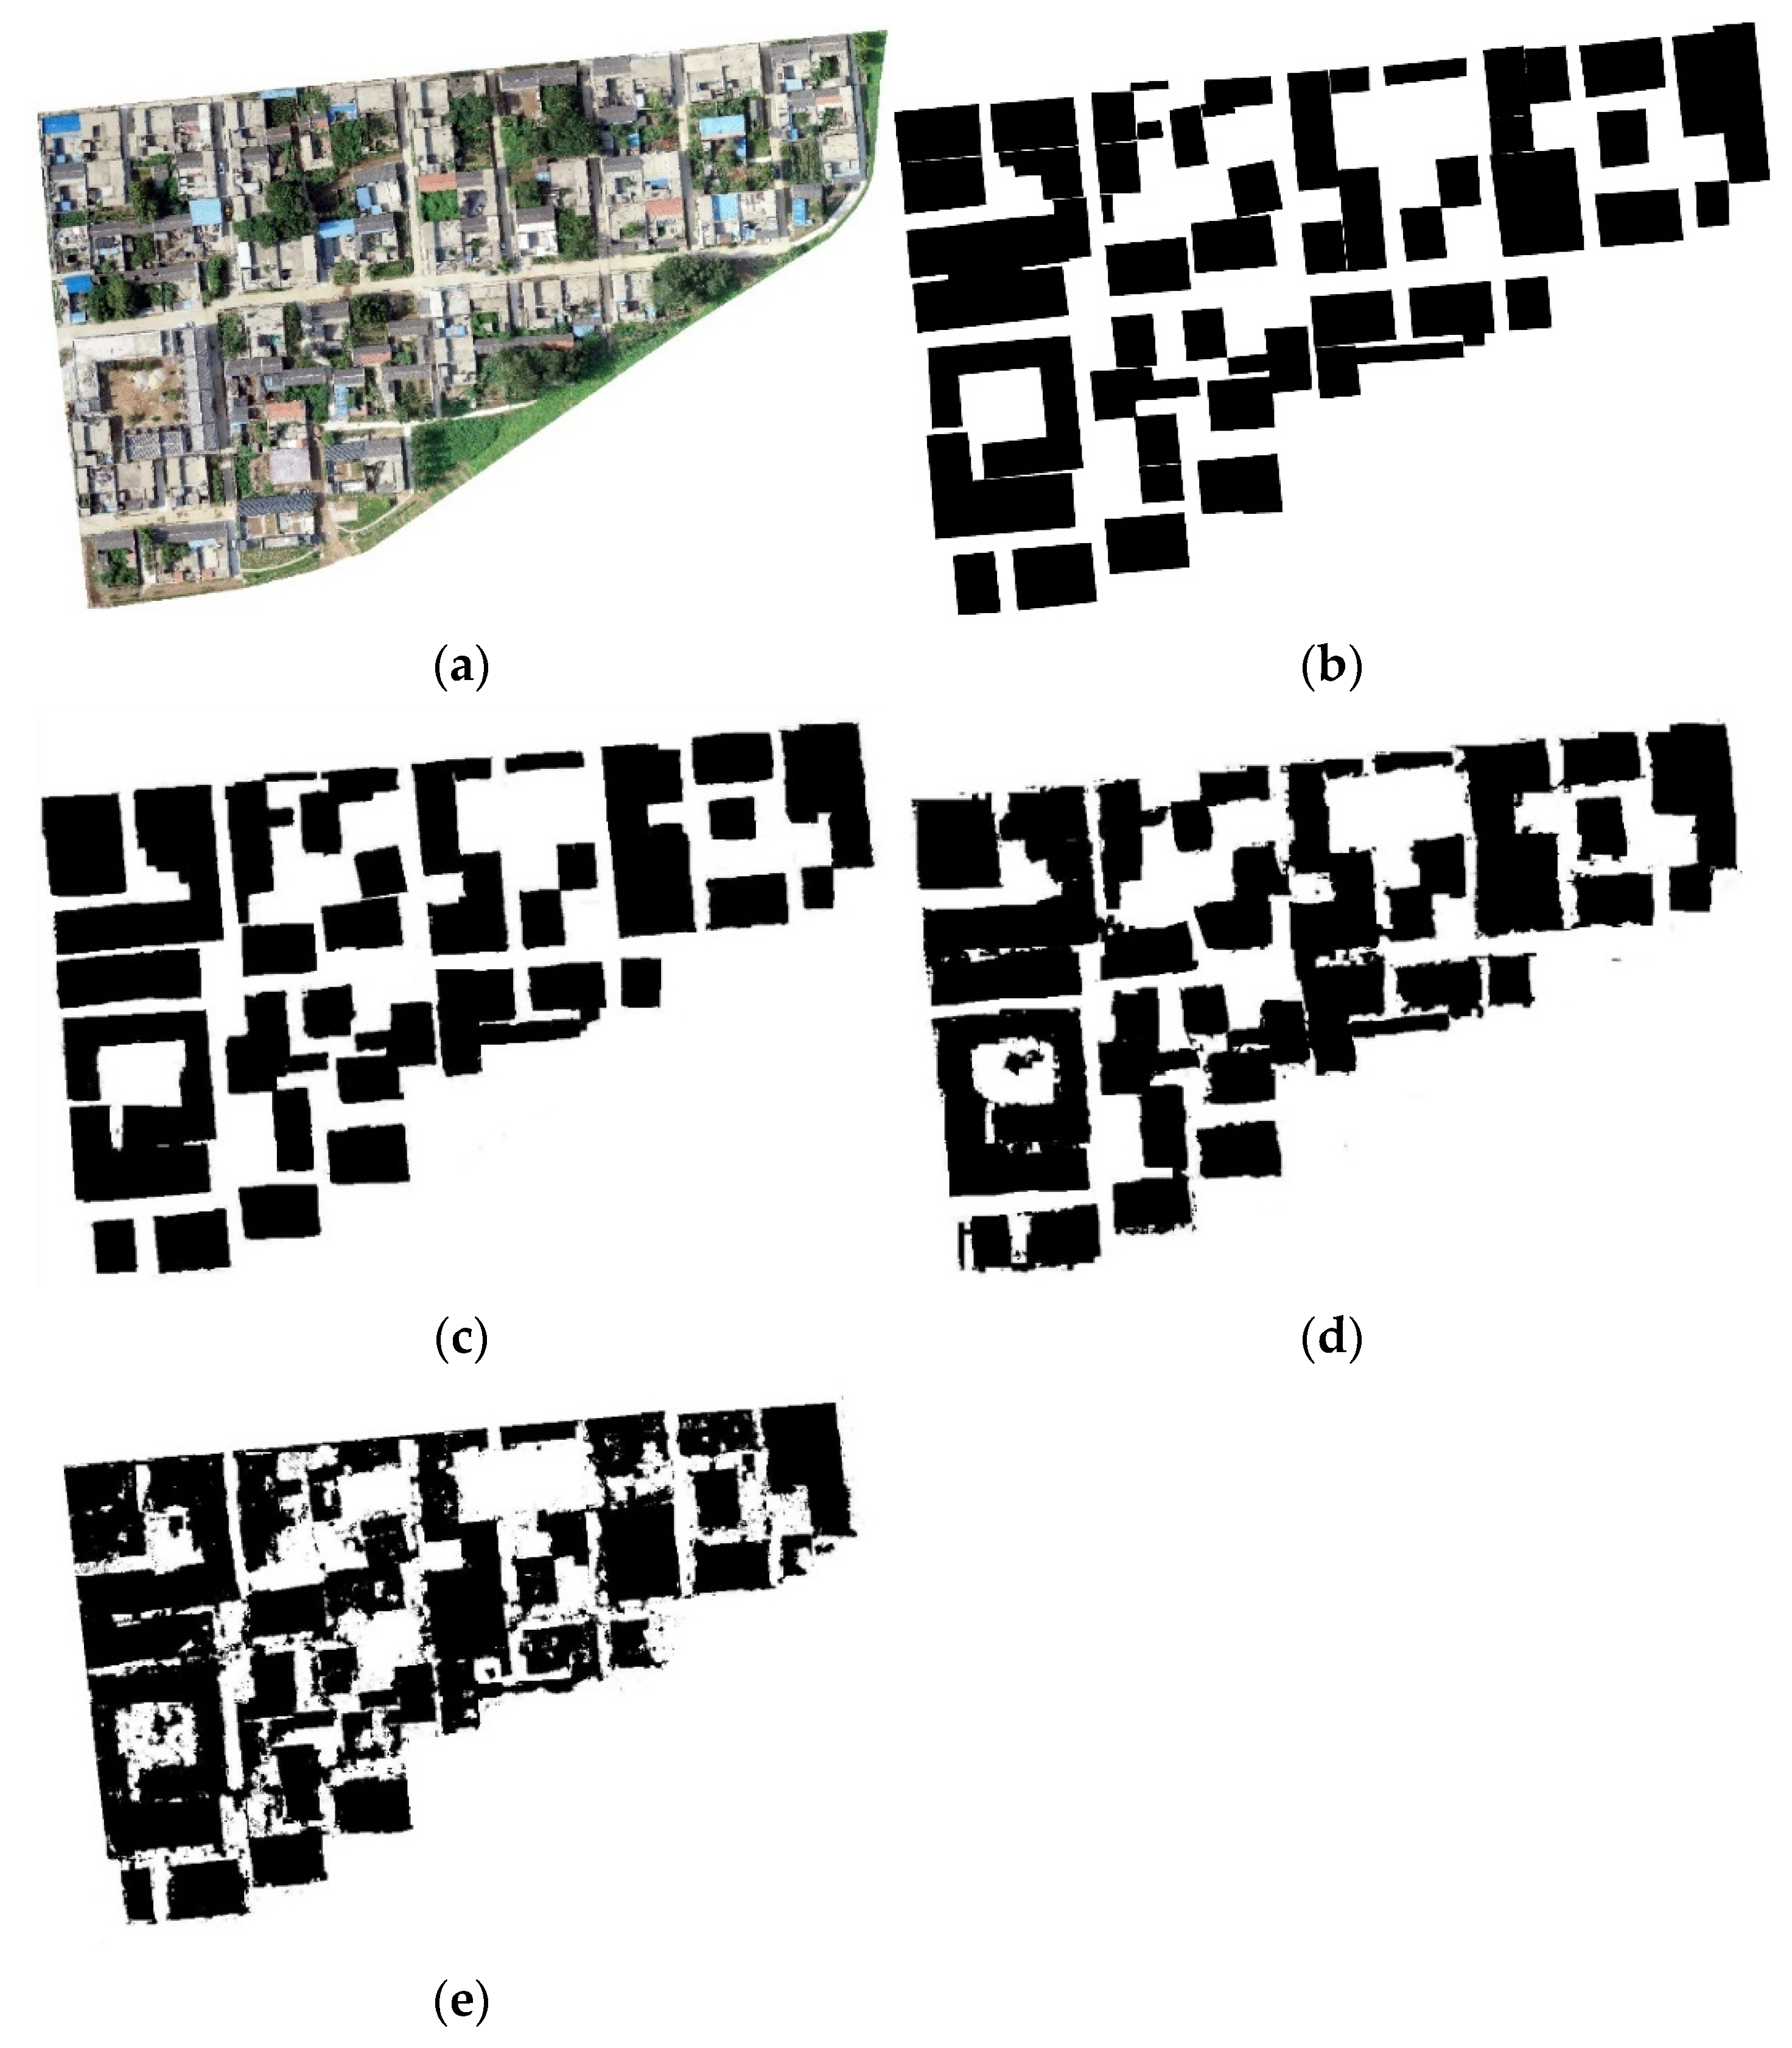
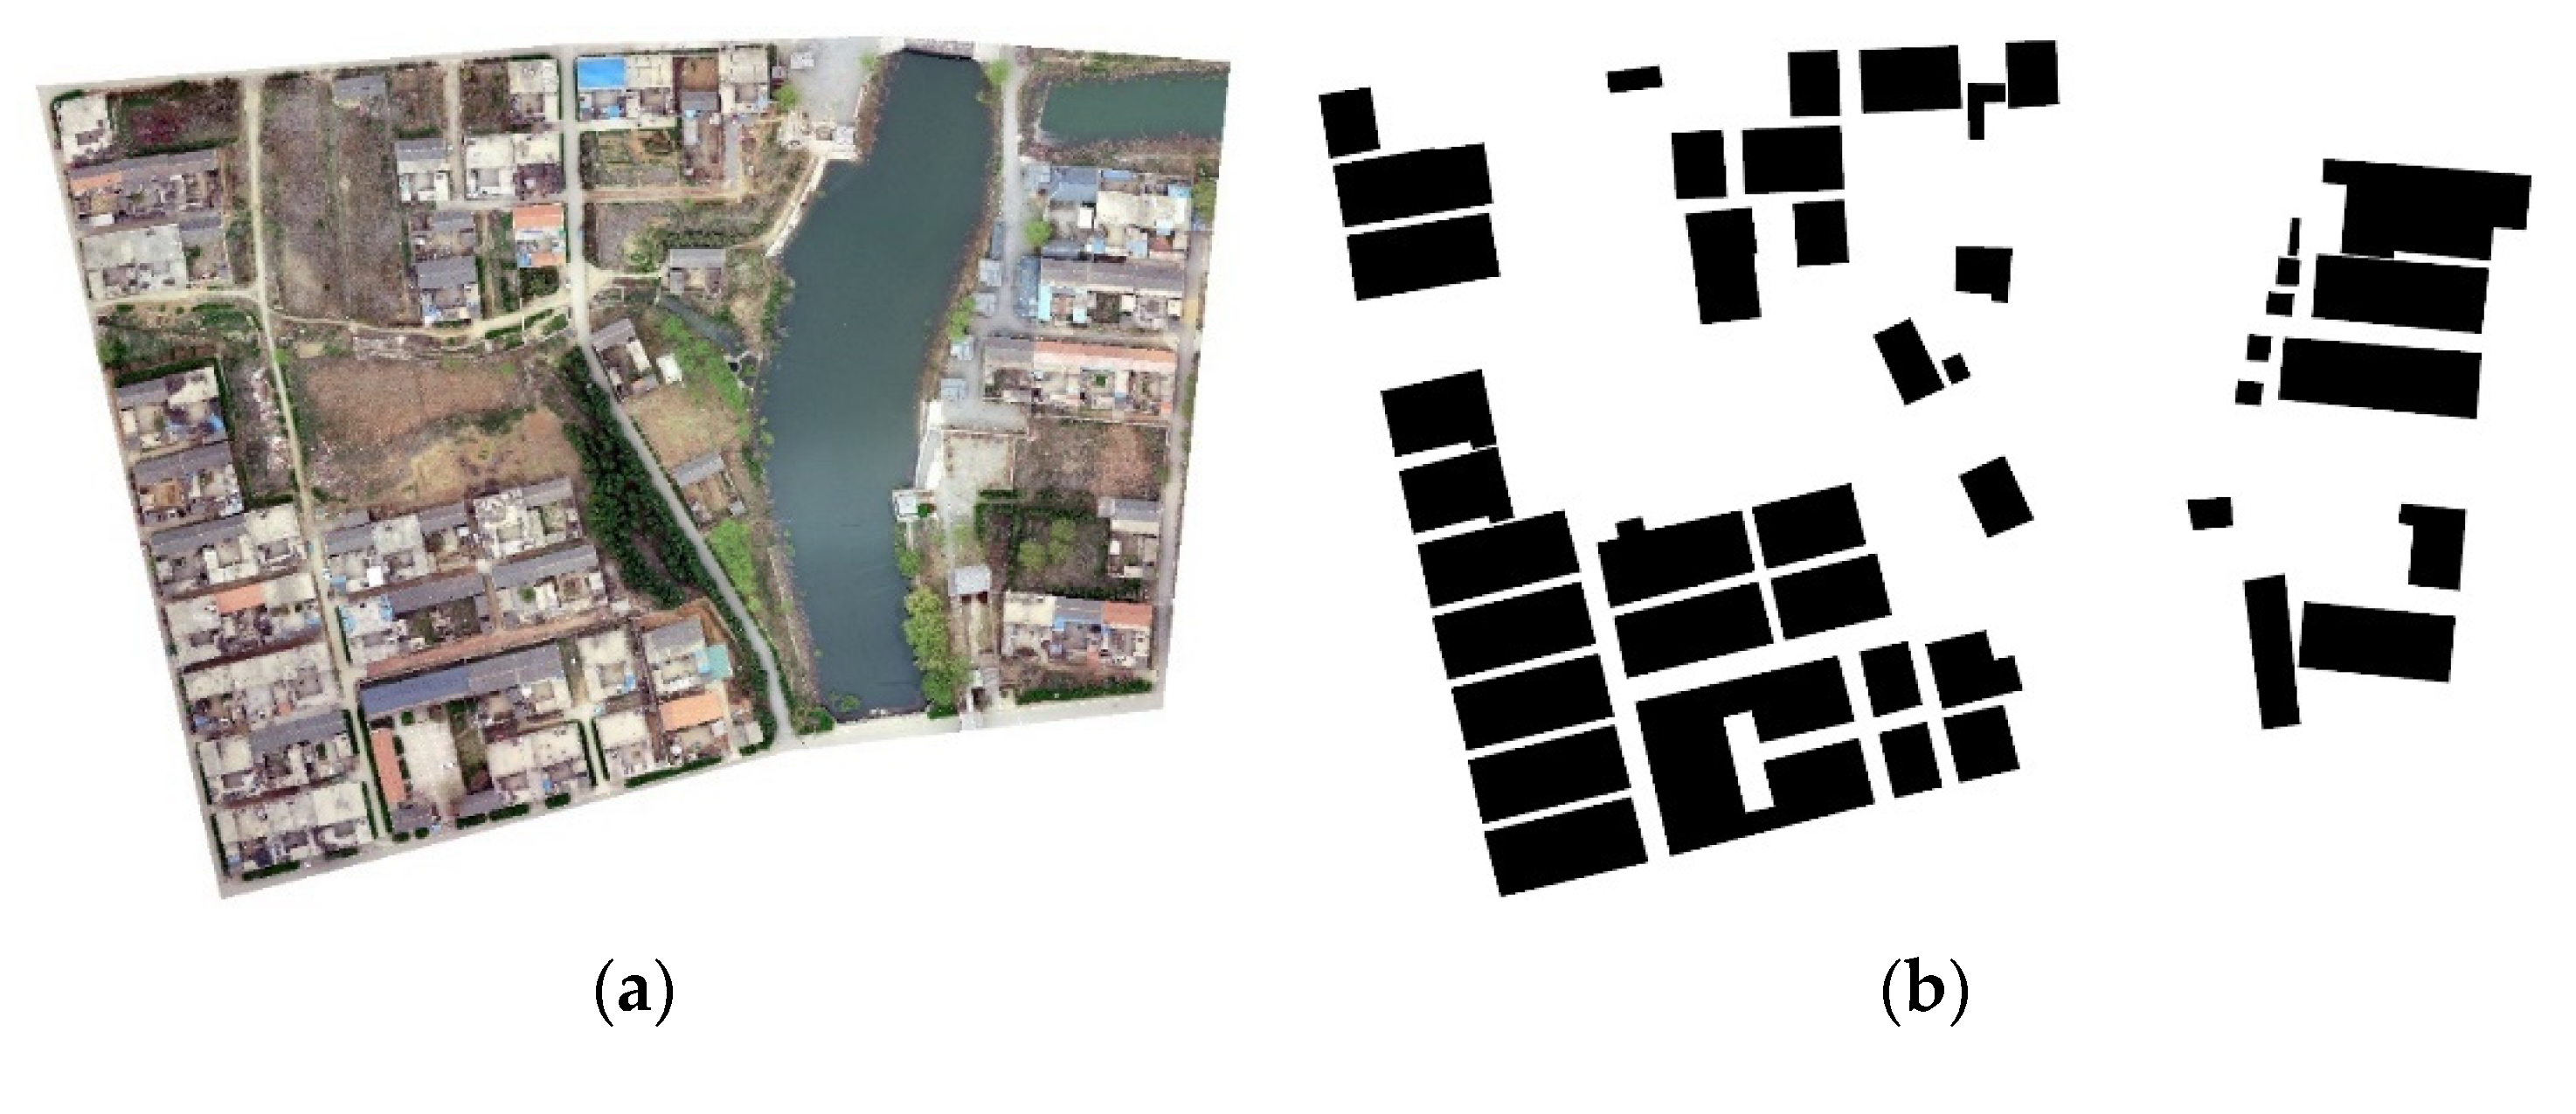
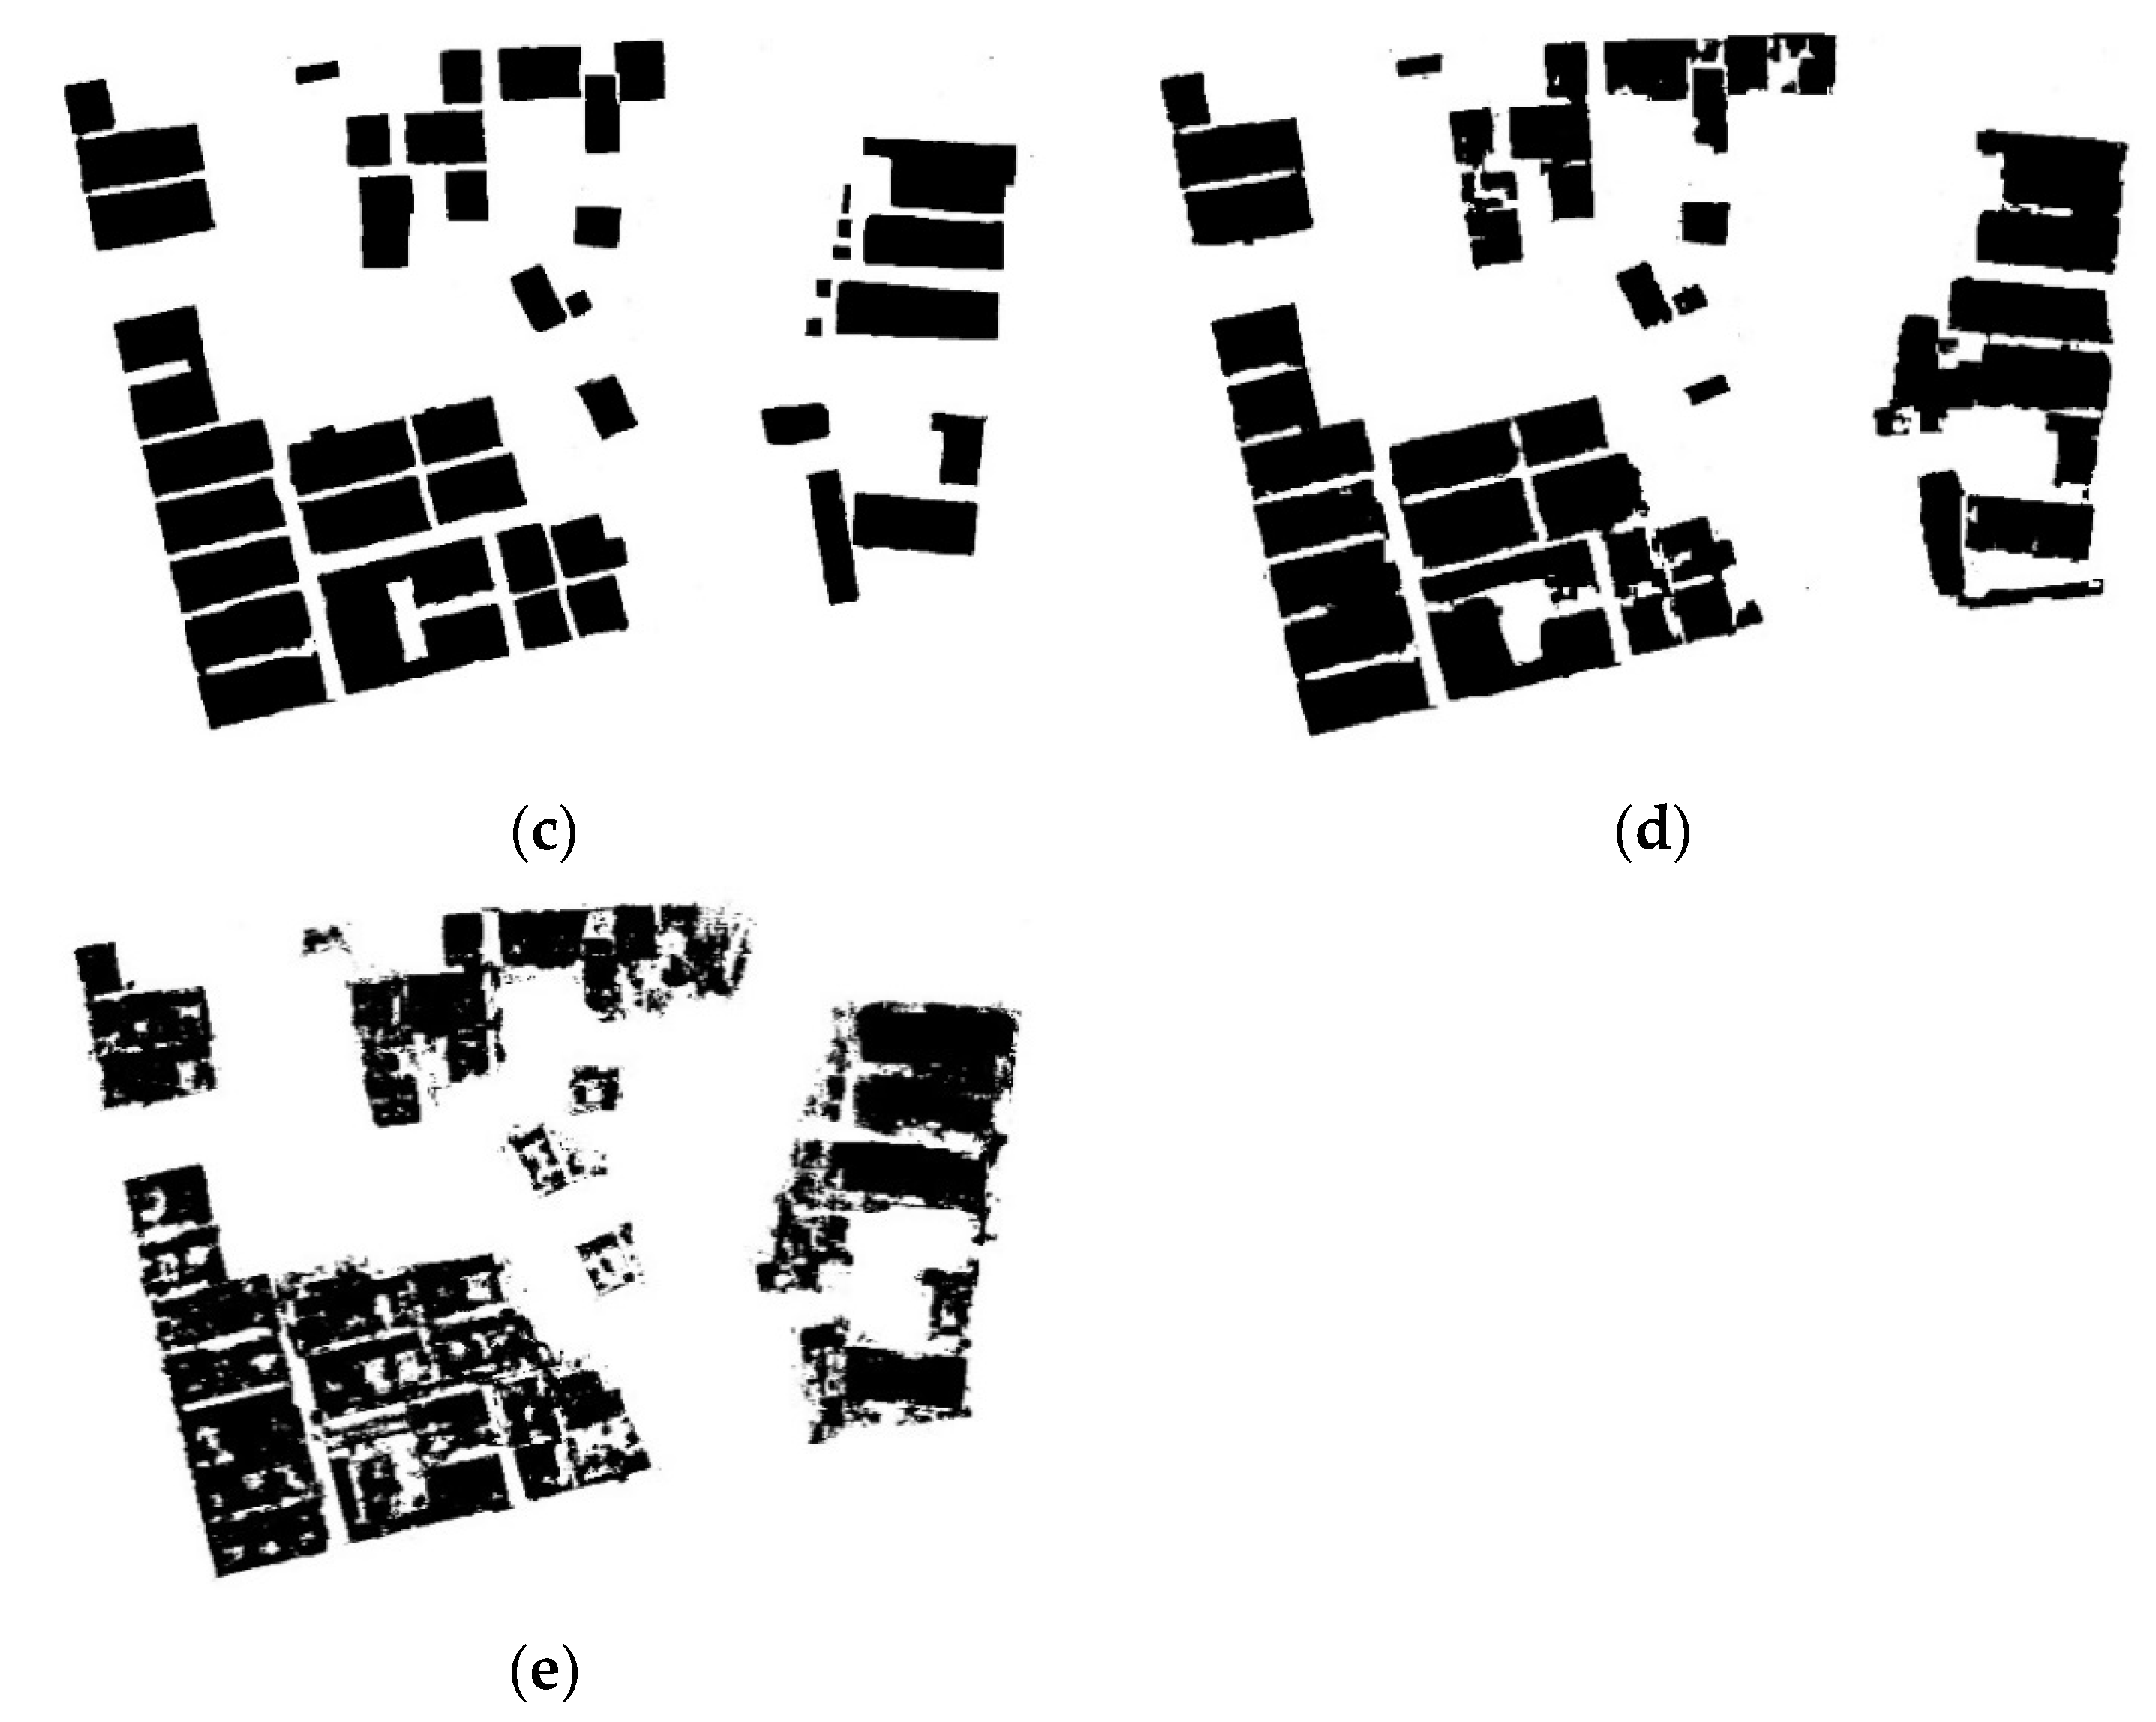
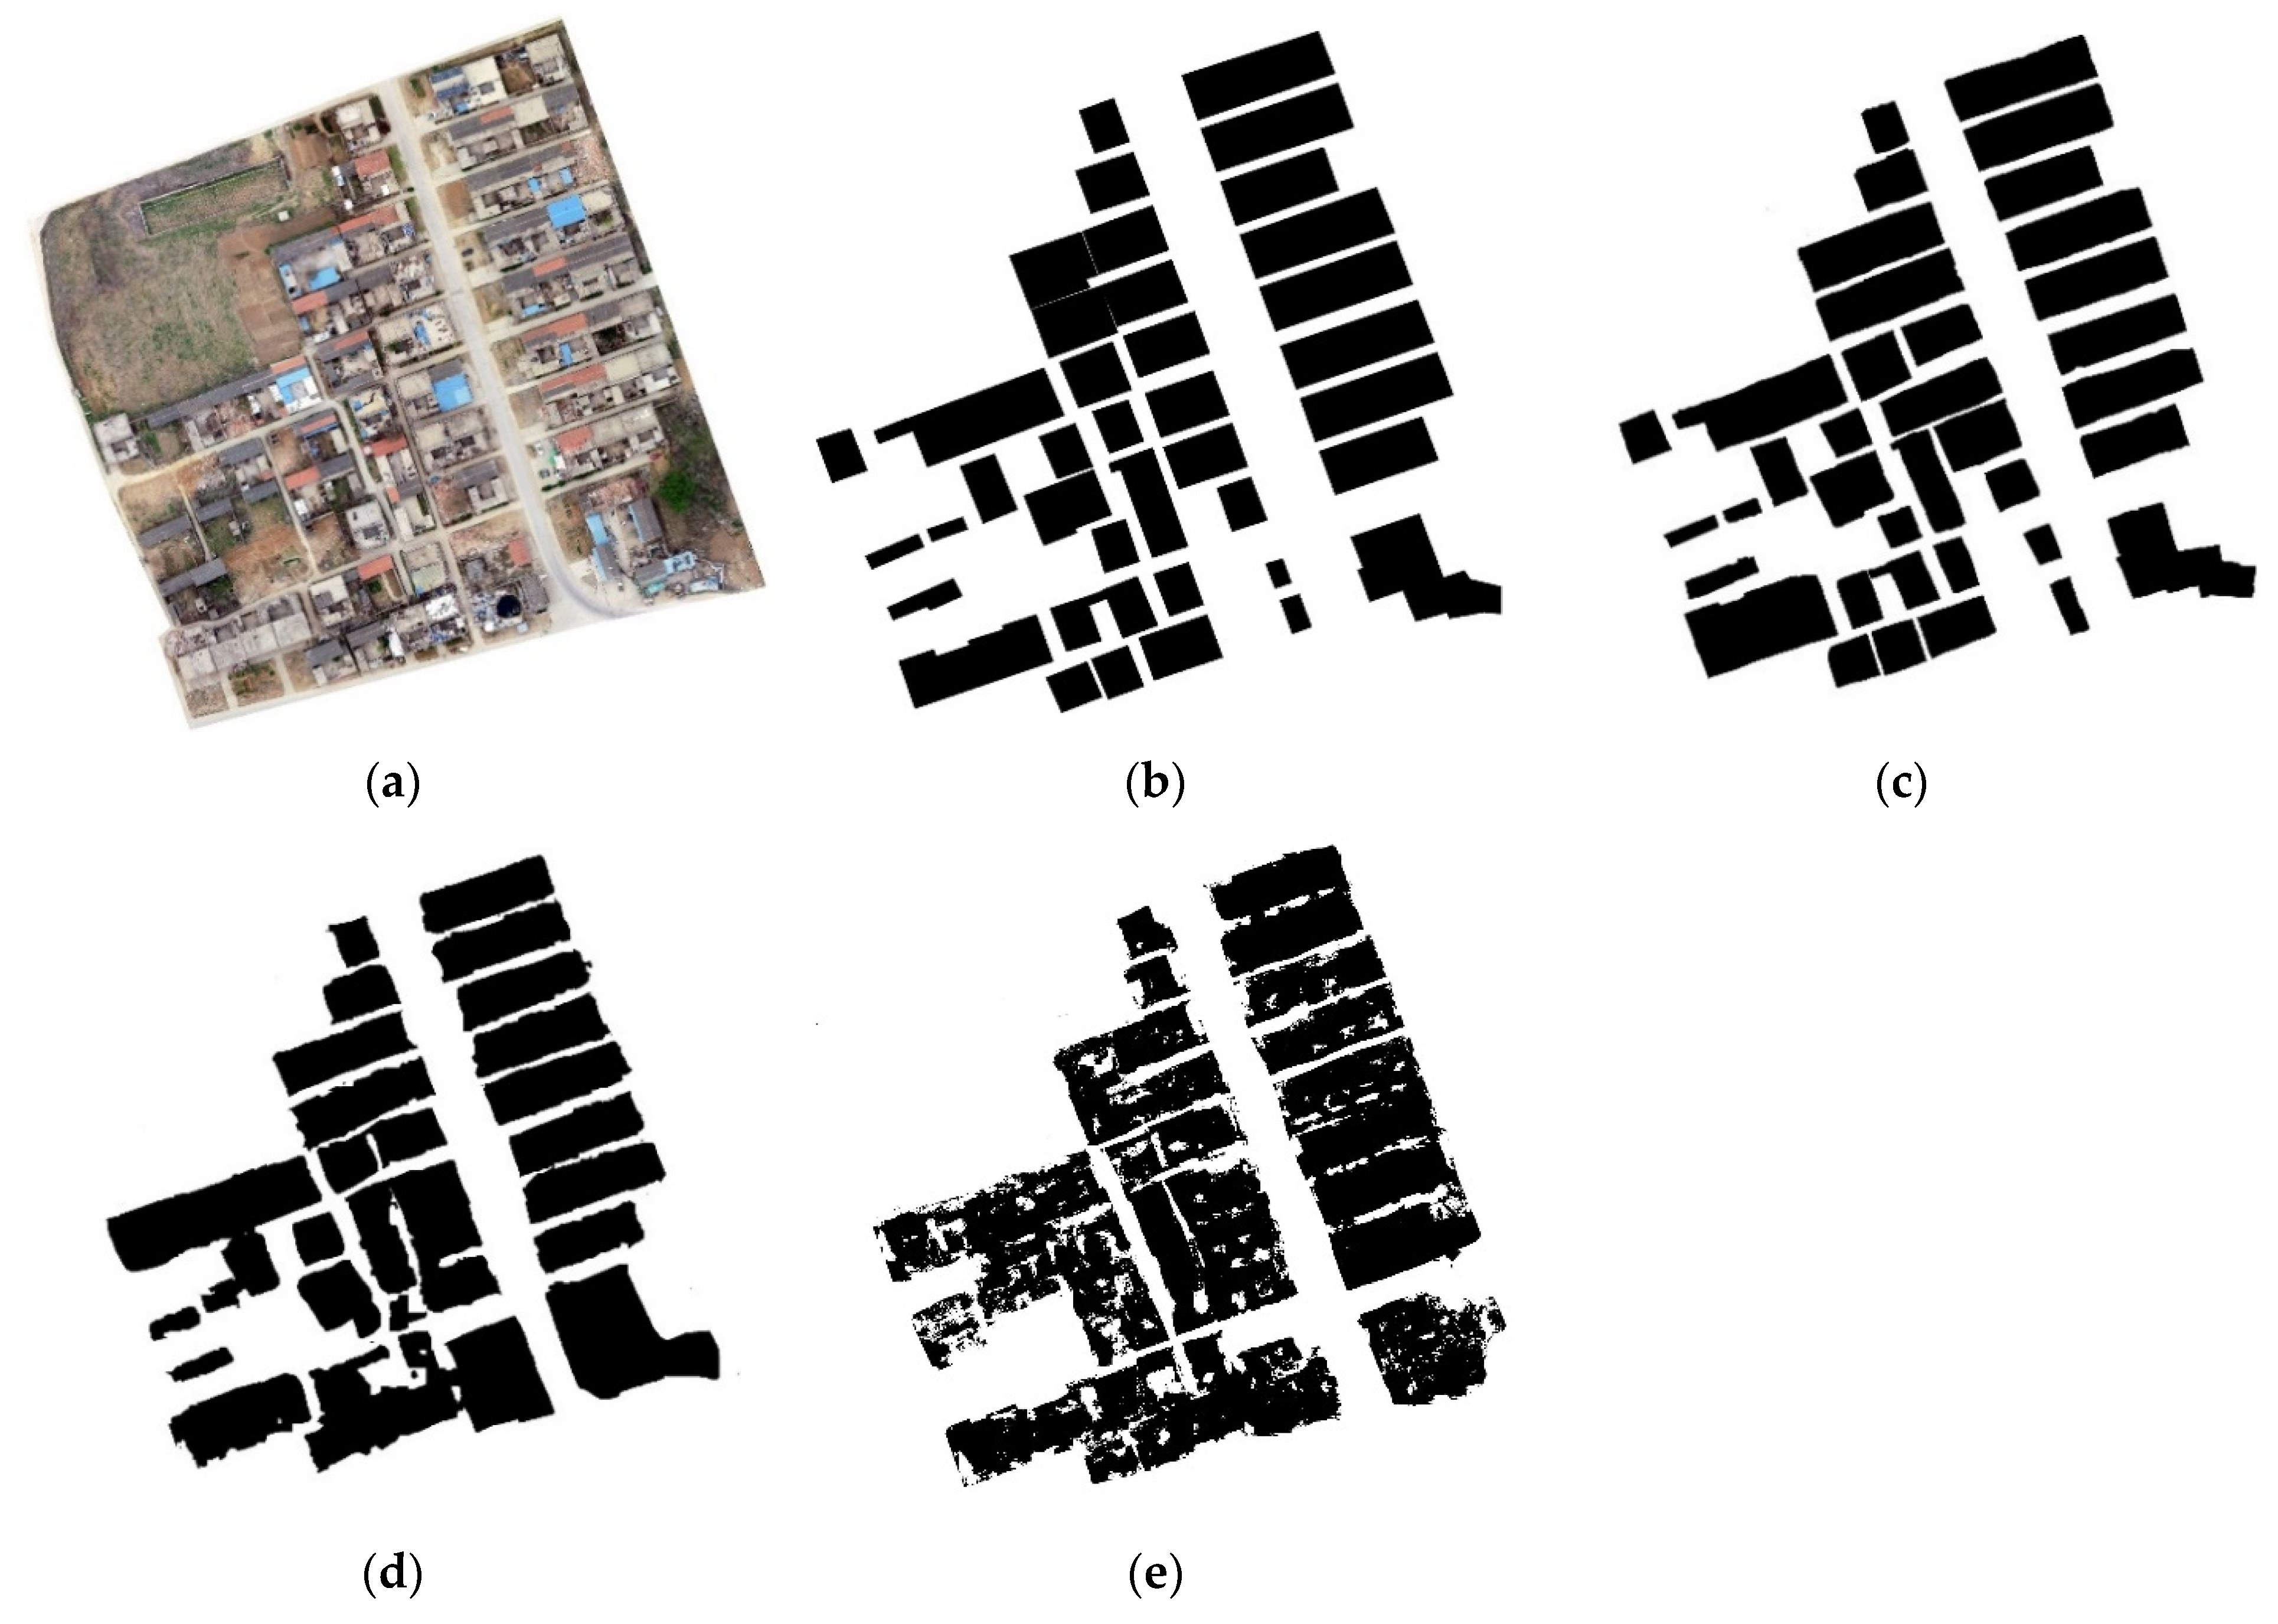
4.2.1. Qualitative Comparison
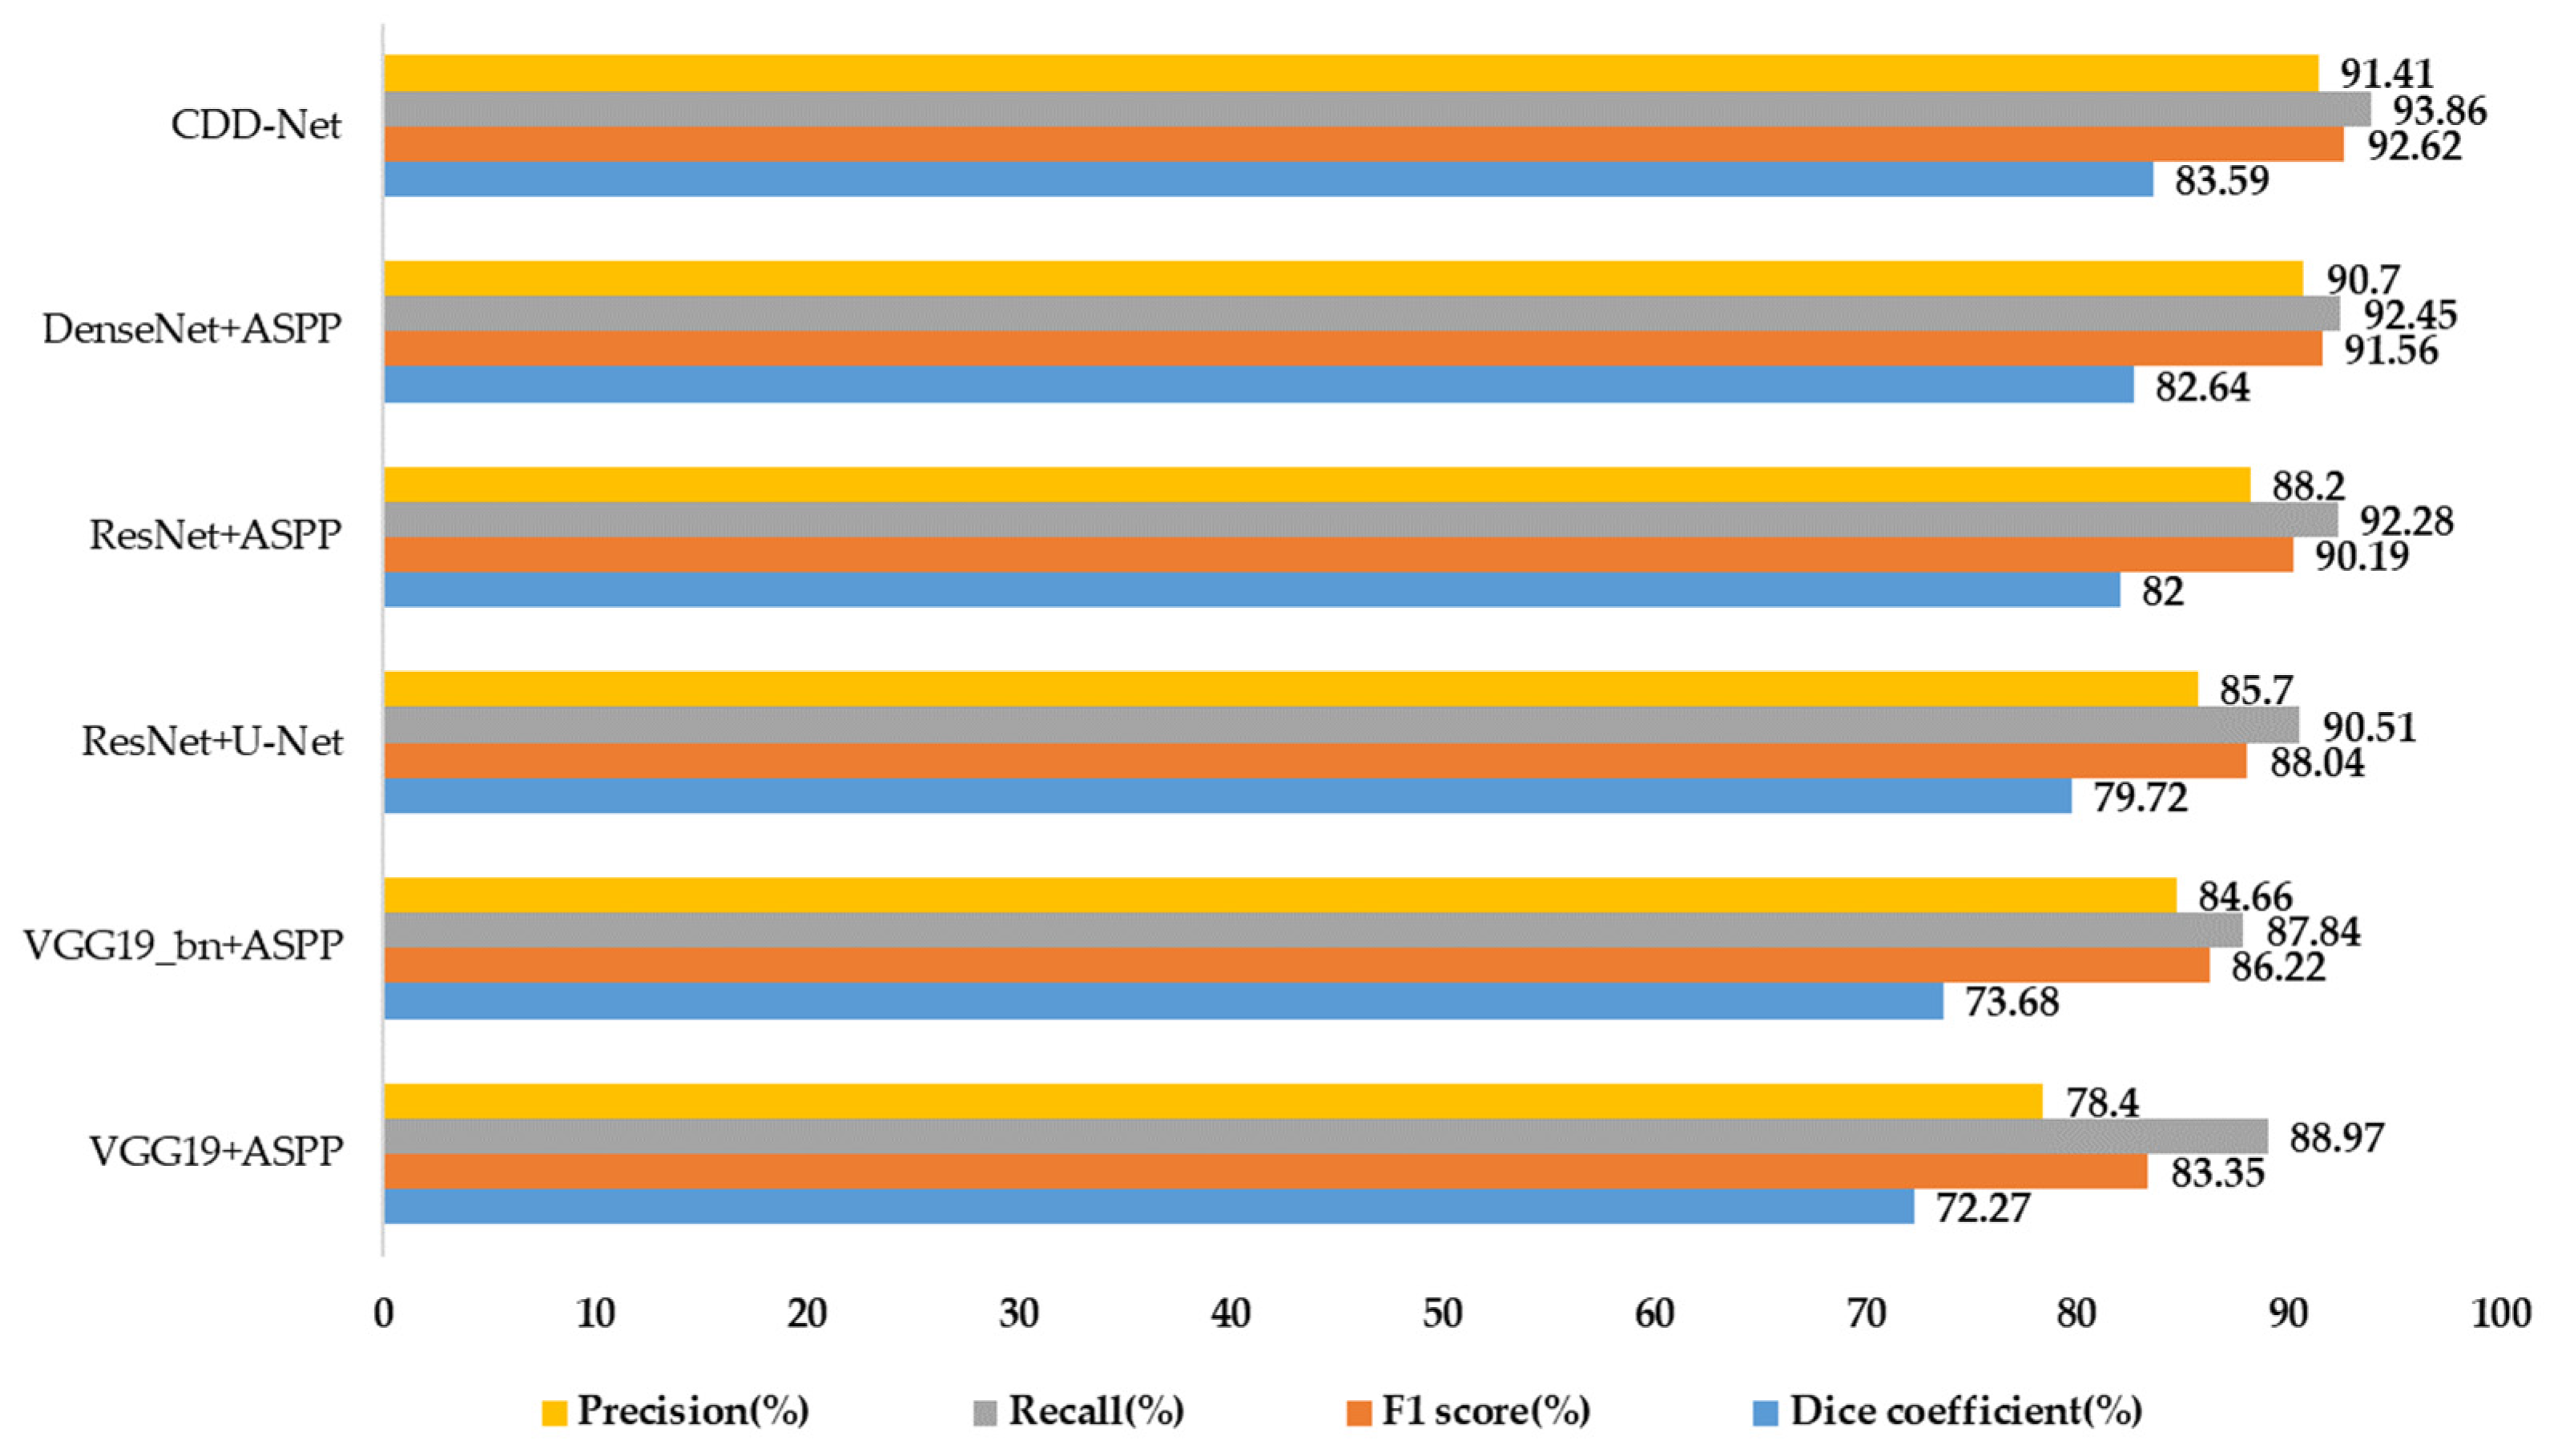
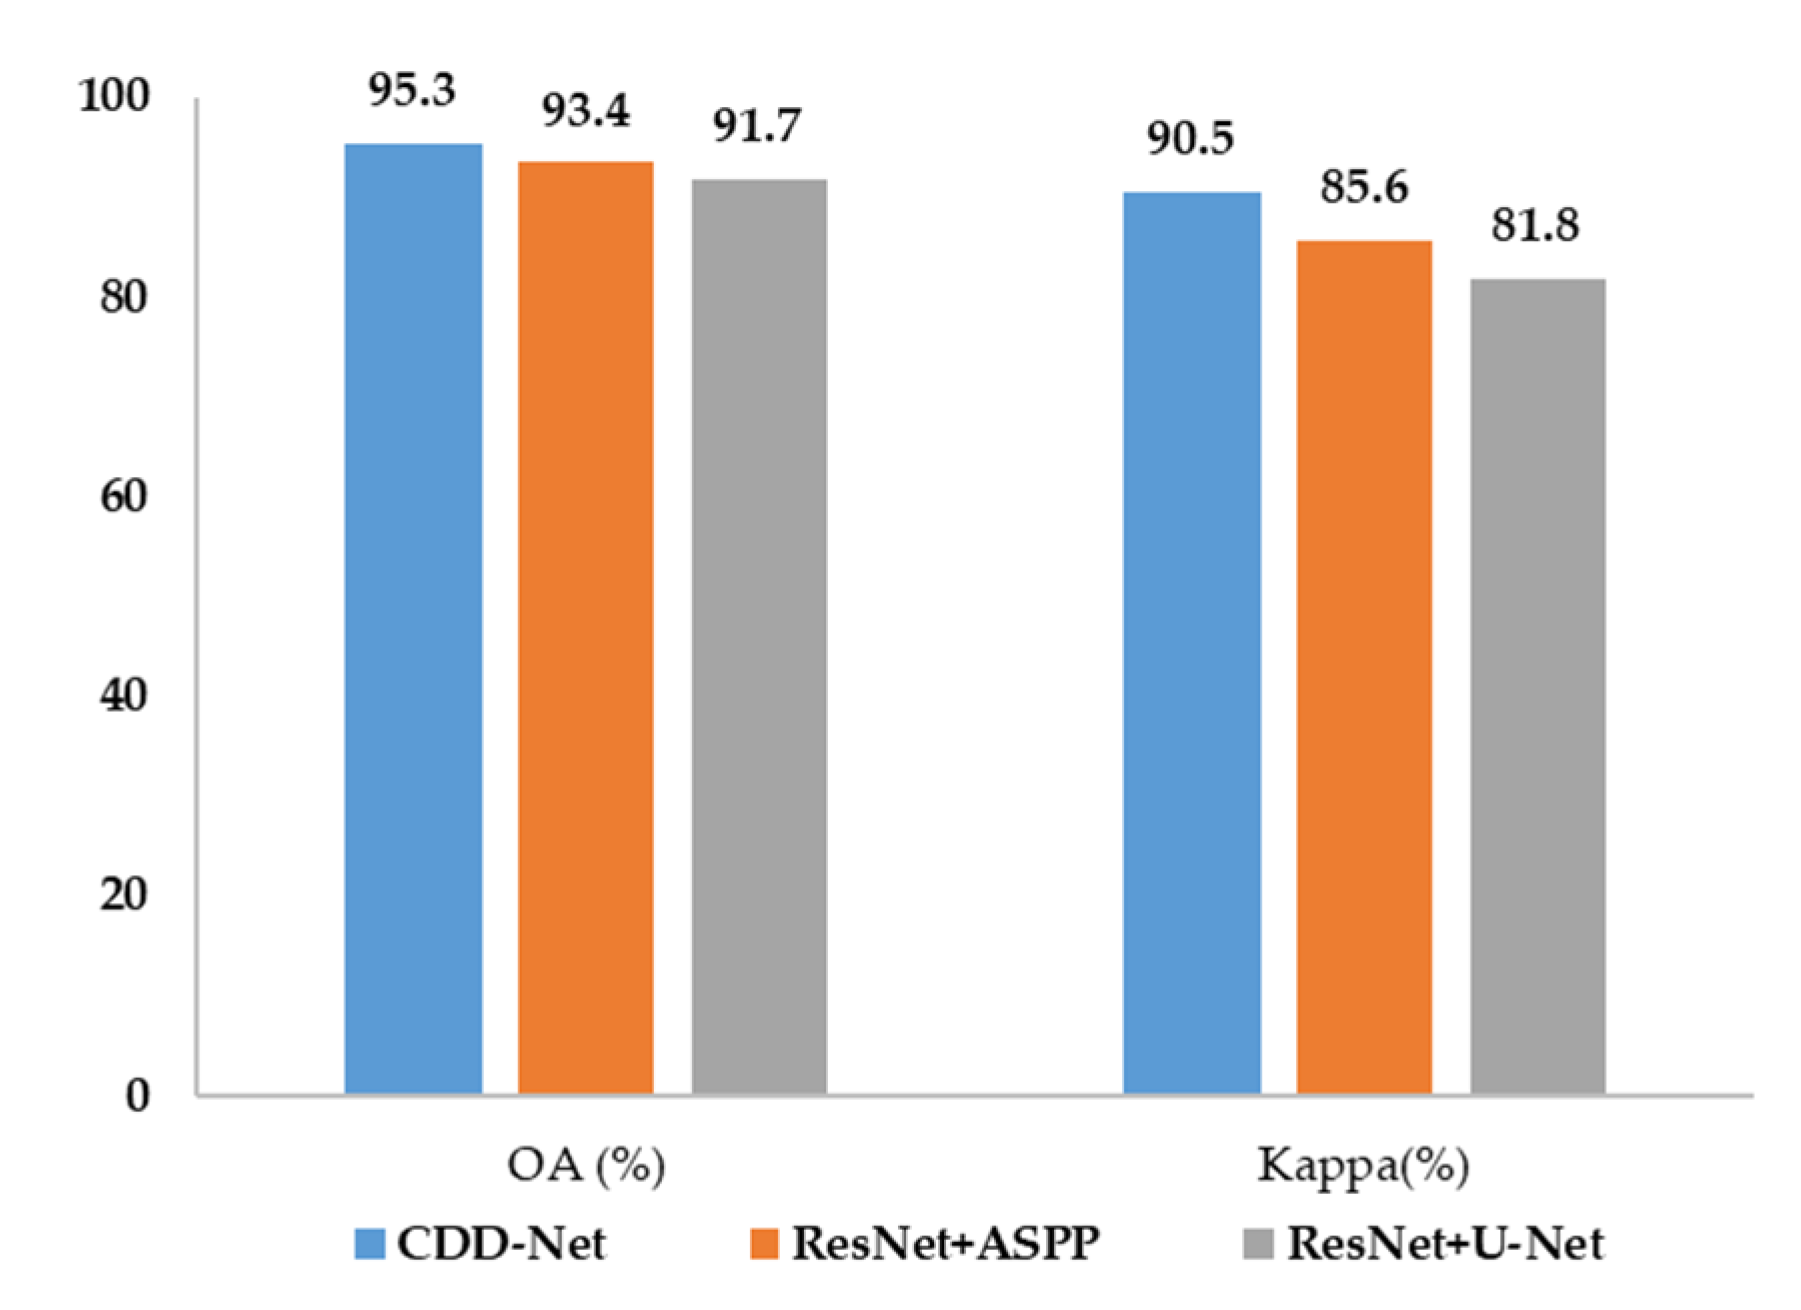
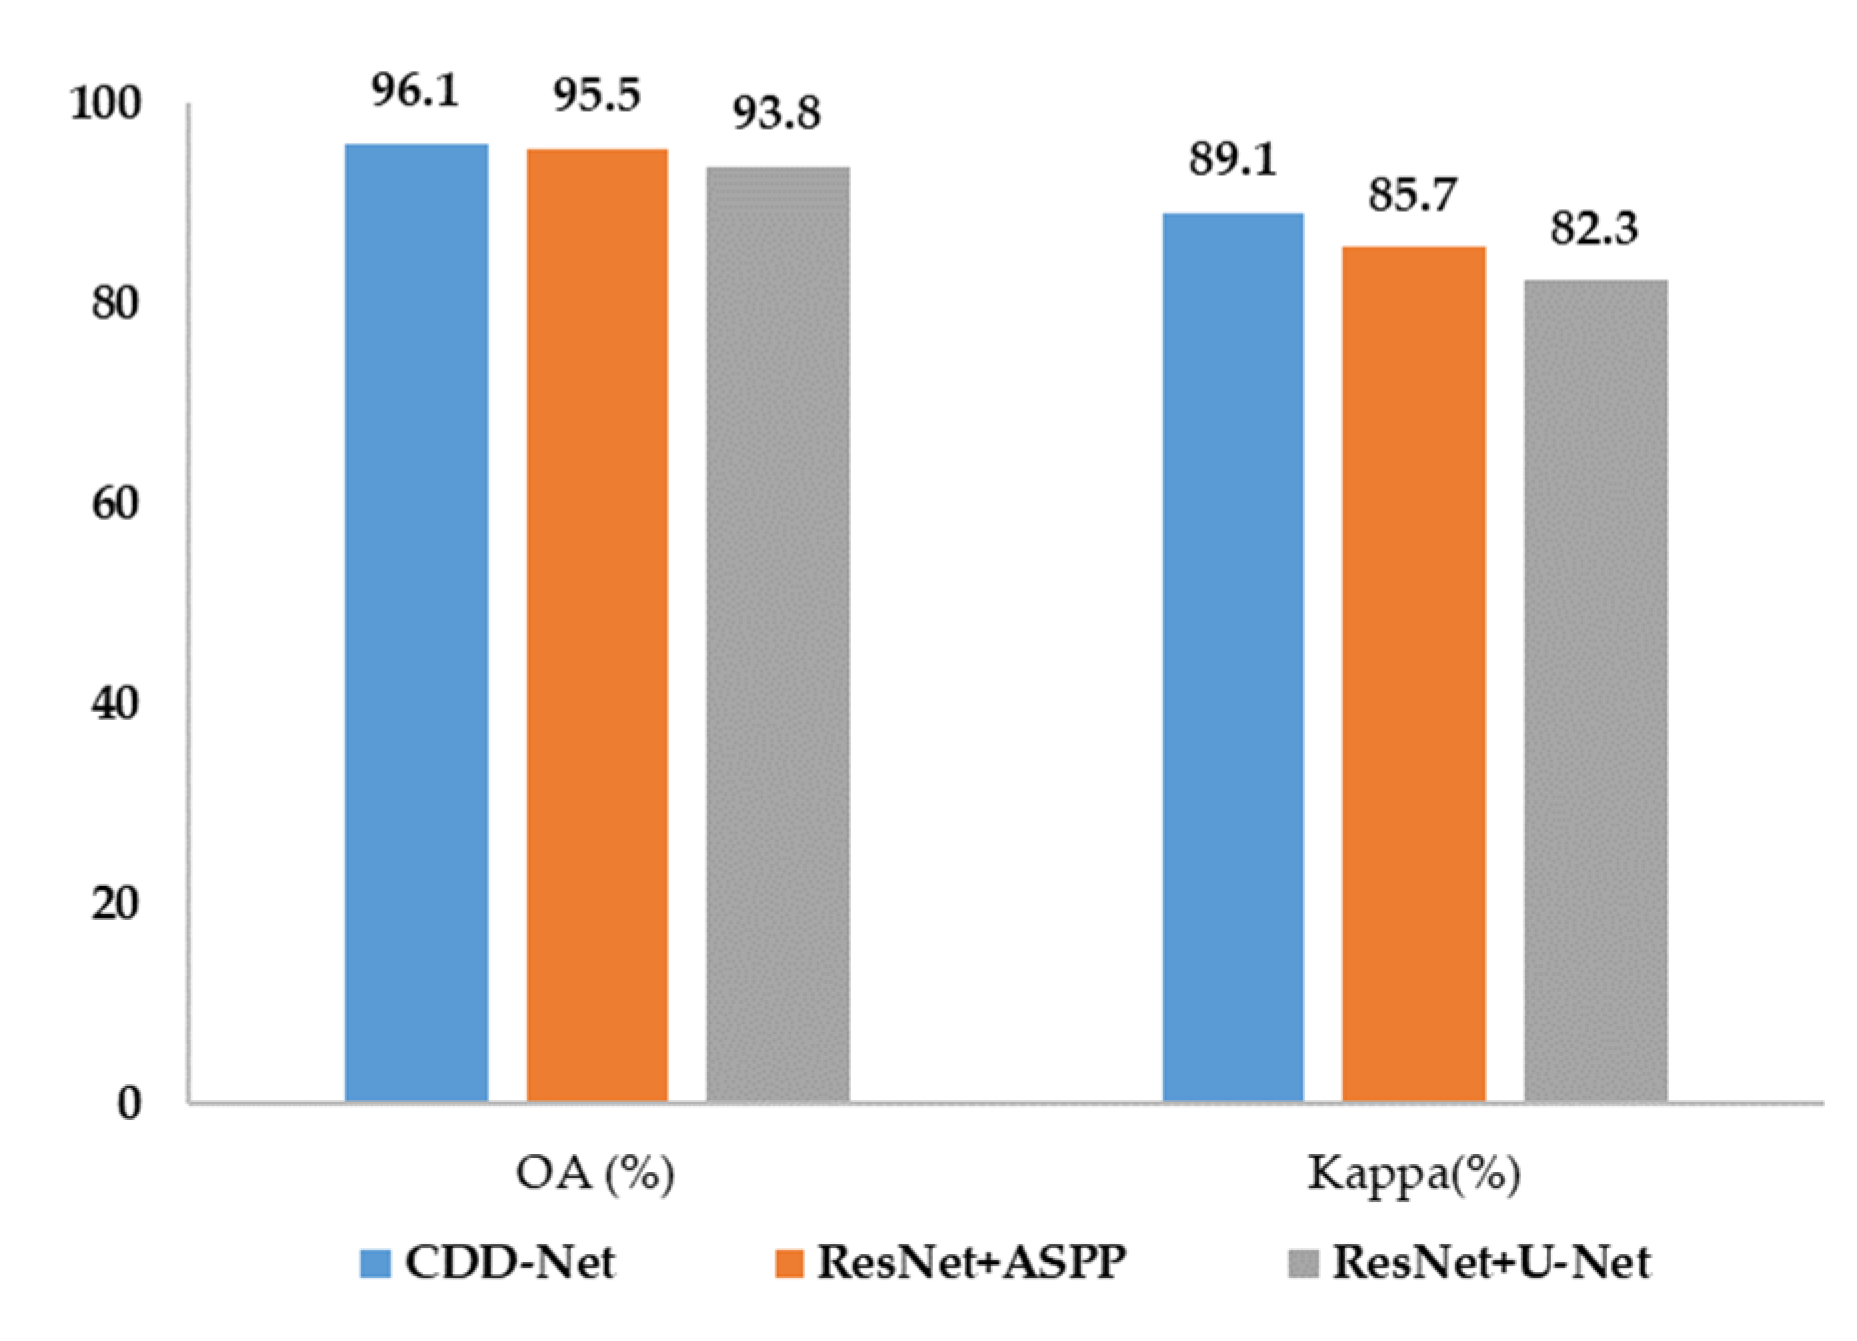
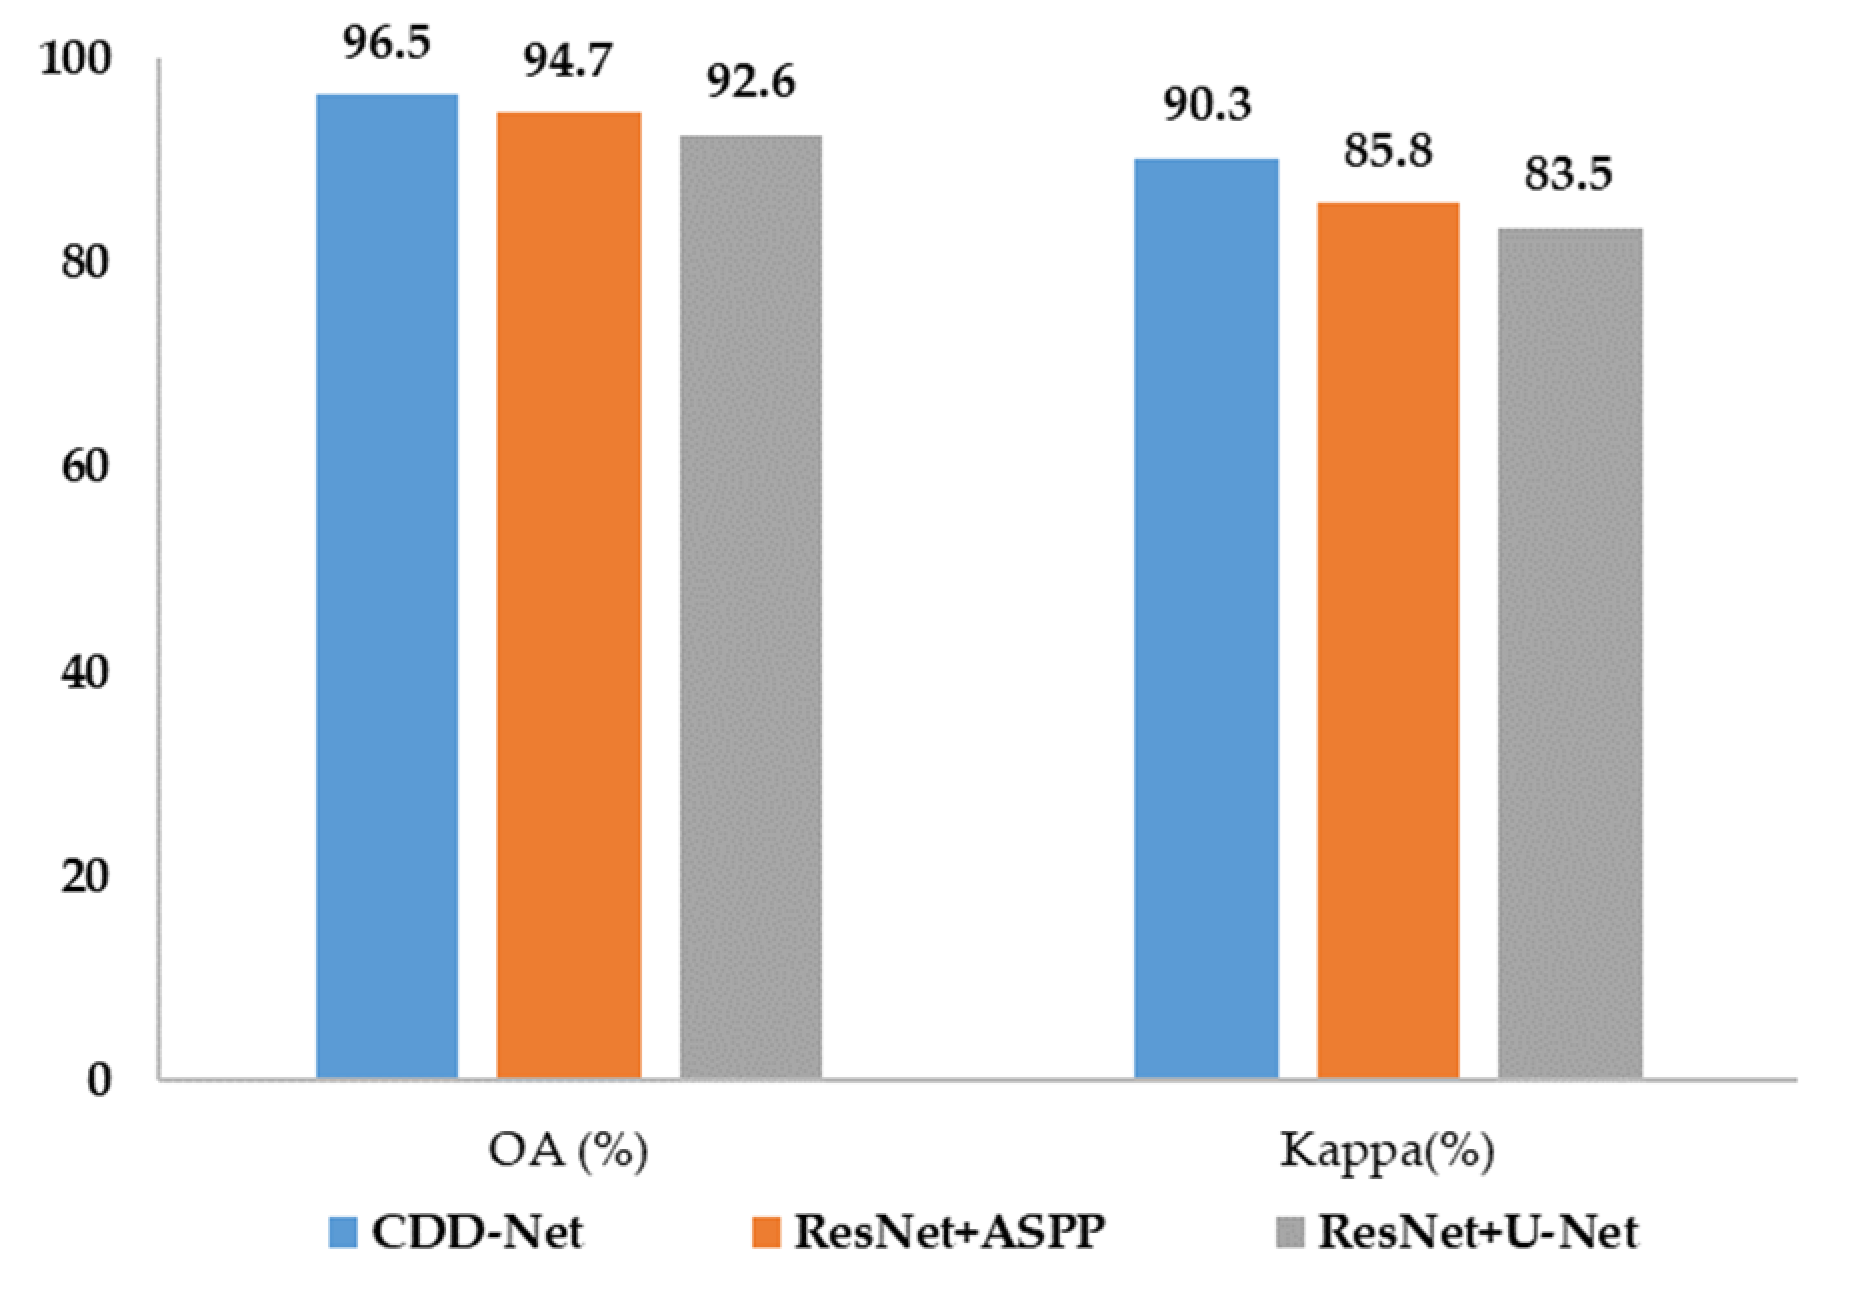
4.2.2. Quantitative Comparison
4.3. The Results of Testing
5. Discussion
6. Conclusions
- (1)
- The CDD-Net is a RRL extraction framework with remarkable effects and high precision, which can identify boundary features more accurately, and perform well in extracting both small-scale and large-scale targets. It can better face the interference of complex backgrounds and building shadows in VHR UAV images.
- (2)
- Comparisons from different perspectives have all shown that the ASPP module can better handle multi-scale features in VHR images. As a feature extraction network, DenseNet can realize the reuse of features and achieve the goals of higher accuracy with fewer parameters, and has better applicability in RRL extraction tasks. The PointRend neural network module can better handle edge features. The improved model using PointRend is not only easier to train, but can also output more accurate object boundaries, which has further improved the extraction accuracy of RRL.
- (3)
- The proposed framework outperforms other advanced semantic segmentation algorithms with better performance and solves the problems of low segmentation accuracy and the too smooth output boundaries of existing semantic segmentation models. Subsequent research needs to further expand the amount of data and number of experimental scenarios to achieve RRL identification and extraction in a large area. In future, the application of night light remote sensing data could be used in the research to understand the utilization and idle conditions of RRL.
Author Contributions
Funding
Institutional Review Board Statement
Informed Consent Statement
Data Availability Statement
Acknowledgments
Conflicts of Interest
References
- Chen, Z.; Li, Y.; Liu, Y.; Liu, X. Does rural residential land expansion pattern lead to different impacts on eco-environment? A case study of loess hilly and gully region, China. Habitat Int. 2021, 117, 102436. [Google Scholar] [CrossRef]
- Tao, Z.; Guanghui, J.; Guangyong, L.; Dingyang, Z.; Yanbo, Q. Neglected idle rural residential land (IRRL) in metropolitan suburbs: Spatial differentiation and influencing factors. J. Rural Stud. 2020, 78, 163–175. [Google Scholar] [CrossRef]
- Yanbo, Q.; Guanghui, J.; Yuting, Y.; Qiuyue, Z.; Yuling, L.; Wenqiu, M. Multi-scale analysis on spatial morphology differentiation and formation mechanism of rural residential land: A case study in Shandong Province, China. Habitat Int. 2018, 71, 135–146. [Google Scholar] [CrossRef]
- Tao, Z.; Guanghui, J.; Wenqiu, M.; Guangyong, L.; Yanbo, Q.; Yingying, T.; Qinglei, Z.; Yaya, T. Dying villages to prosperous villages: A perspective from revitalization of idle rural residential land (IRRL). J. Rural Stud. 2021, 84, 45–54. [Google Scholar] [CrossRef]
- Van Vliet, J.; de Groot, H.L.; Rietveld, P.; Verburg, P.H. Manifestations and underlying drivers of agricultural land use change in Europe. Landsc. Urban Plan. 2015, 133, 24–36. [Google Scholar] [CrossRef]
- Glanz, H.; Carvalho, L.; Sulla-Menashe, D.; Friedl, M.A. A parametric model for classifying land cover and evaluating training data based on multi-temporal remote sensing data. ISPRS J. Photogramm. Remote Sens. 2014, 97, 219–228. [Google Scholar] [CrossRef]
- Jay, S.; Guillaume, M. A novel maximum likelihood based method for mapping depth and water quality from hyperspectral remote-sensing data. Remote Sens. Environ. 2014, 147, 121–132. [Google Scholar] [CrossRef]
- Adugna, T.; Xu, W.B.; Fan, J.L. Comparison of Random Forest and Support Vector Machine Classifiers for Regional Land Cover Mapping Using Coarse Resolution FY-3C Images. Remote Sens. 2022, 14, 574. [Google Scholar] [CrossRef]
- Noi, P.T.; Kappas, M. Comparison of Random Forest, k-Nearest Neighbor, and Support Vector Machine Classifiers for Land Cover Classification Using Sentinel-2 Imagery. Sensors 2018, 18, 18. [Google Scholar] [CrossRef]
- Xi, Y.B.; Tian, J.; Jiang, H.L.; Tian, Q.J.; Xiang, H.X.; Xu, N.X. Mapping tree species in natural and planted forests using Sentinel-2 images. Remote Sens. Lett. 2022, 13, 544–555. [Google Scholar] [CrossRef]
- Breiman, L. Bagging Predictors. Mach. Learn. 1996, 24, 123–140. [Google Scholar] [CrossRef]
- Belgiu, M.; Drăguţ, L. Random forest in remote sensing: A review of applications and future directions. ISPRS J. Photogramm. Remote Sens. 2016, 114, 24–31. [Google Scholar] [CrossRef]
- Rodriguez-Galiano, V.F.; Ghimire, B.; Rogan, J.; Chica-Olmo, M.; Rigol-Sanchez, J.P. An assessment of the effectiveness of a random forest classifier for land-cover classification. ISPRS J. Photogramm. Remote Sens. 2012, 67, 93–104. [Google Scholar] [CrossRef]
- Pande-Chhetri, R.; Abd-Elrahman, A.; Liu, T.; Morton, J.; Wilhelm, V.L. Object-based classification of wetland vegetation using very high-resolution unmanned air system imagery. Eur. J. Remote Sens. 2017, 50, 564–576. [Google Scholar] [CrossRef]
- Matikainen, L.; Karila, K.; Hyyppä, J.; Litkey, P.; Puttonen, E.; Ahokas, E. Object-based analysis of multispectral airborne laser scanner data for land cover classification and map updating. ISPRS J. Photogramm. Remote Sens. 2017, 128, 298–313. [Google Scholar] [CrossRef]
- Garcia-Garcia, A.; Orts-Escolano, S.; Oprea, S.; Villena-Martinez, V.; Martinez-Gonzalez, P.; Garcia-Rodriguez, J. A survey on deep learning techniques for image and video semantic segmentation. Appl. Soft Comput. 2018, 70, 41–65. [Google Scholar] [CrossRef]
- Guo, Y.M.; Liu, Y.; Oerlemans, A.; Lao, S.Y.; Wu, S.; Lew, M.S. Deep learning for visual understanding: A review. Neurocomputing 2016, 187, 27–48. [Google Scholar] [CrossRef]
- Ma, L.; Liu, Y.; Zhang, X.; Ye, Y.; Yin, G.; Johnson, B.A. Deep learning in remote sensing applications: A meta-analysis and review. ISPRS J. Photogramm. Remote Sens. 2019, 152, 166–177. [Google Scholar] [CrossRef]
- Chen, B.Y.; Xia, M.; Huang, J.Q. MFANet: A Multi-Level Feature Aggregation Network for Semantic Segmentation of Land Cover. Remote Sens. 2021, 13, 731. [Google Scholar] [CrossRef]
- Ji, S.P.; Wang, D.P.; Luo, M.Y. Generative Adversarial Network-Based Full-Space Domain Adaptation for Land Cover Classification From Multiple-Source Remote Sensing Images. IEEE Trans. Geosci. Remote Sens. 2021, 59, 3816–3828. [Google Scholar] [CrossRef]
- Li, R.R.; Liu, W.J.; Yang, L.; Sun, S.H.; Hu, W.; Zhang, F.; Li, W. DeepUNet: A Deep Fully Convolutional Network for Pixel-Level Sea-Land Segmentation. IEEE J. Sel. Top. Appl. Earth Obs. Remote Sens. 2018, 11, 3954–3962. [Google Scholar] [CrossRef]
- Xu, Y.Y.; Wu, L.; Xie, Z.; Chen, Z.L. Building Extraction in Very High Resolution Remote Sensing Imagery Using Deep Learning and Guided Filters. Remote Sens. 2018, 10, 144. [Google Scholar] [CrossRef]
- Zhang, Z.; Liu, Q.; Wang, Y. Road Extraction by Deep Residual U-Net. IEEE Geosci. Remote Sens. Lett. 2018, 15, 749–753. [Google Scholar] [CrossRef]
- Xia, M.; Cui, Y.C.; Zhang, Y.H.; Xu, Y.M.; Liu, J.; Xu, Y.Q. DAU-Net: A novel water areas segmentation structure for remote sensing image. Int. J. Remote Sens. 2021, 42, 2594–2621. [Google Scholar] [CrossRef]
- Zhao, L.J.; Zhang, W.; Tang, P. Analysis of the inter-dataset representation ability of deep features for high spatial resolution remote sensing image scene classification. Multimed. Tools Appl. 2019, 78, 9667–9689. [Google Scholar] [CrossRef]
- Srivastava, V.; Biswas, B. CNN-based salient features in HSI image semantic target prediction. Conn. Sci. 2020, 32, 113–131. [Google Scholar] [CrossRef]
- Shi, C.P.; Zhao, X.; Wang, L.G. A Multi-Branch Feature Fusion Strategy Based on an Attention Mechanism for Remote Sensing Image Scene Classification. Remote Sens. 2021, 13, 1950. [Google Scholar] [CrossRef]
- Feng, J.; Chen, J.T.; Liu, L.G.; Cao, X.H.; Zhang, X.R.; Jiao, L.C.; Yu, T. CNN-Based Multilayer Spatial-Spectral Feature Fusion and Sample Augmentation With Local and Nonlocal Constraints for Hyperspectral Image Classification. IEEE J. Sel. Top. Appl. Earth Obs. Remote Sens. 2019, 12, 1299–1313. [Google Scholar] [CrossRef]
- Broni-Bediako, C.; Murata, Y.; Mormille, L.H.B.; Atsumi, M. Searching for CNN Architectures for Remote Sensing Scene Classification. IEEE Trans. Geosci. Remote Sens. 2022, 60, 4701813. [Google Scholar] [CrossRef]
- Ahmed, A.A.; Darwish, S.M. A Meta-Heuristic Automatic CNN Architecture Design Approach Based on Ensemble Learning. IEEE Access 2021, 9, 16975–16987. [Google Scholar] [CrossRef]
- Chen, G.Z.; Tan, X.L.; Guo, B.B.; Zhu, K.; Liao, P.Y.; Wang, T.; Wang, Q.; Zhang, X.D. SDFCNv2: An Improved FCN Framework for Remote Sensing Images Semantic Segmentation. Remote Sens. 2021, 13, 4902. [Google Scholar] [CrossRef]
- Li, L.Y.; Li, X.Y.; Liu, X.; Huang, W.W.; Hu, Z.Y.; Chen, F.S. Attention Mechanism Cloud Detection With Modified FCN for Infrared Remote Sensing Images. IEEE Access 2021, 9, 150975–150983. [Google Scholar] [CrossRef]
- Shao, Z.F.; Zhou, W.X.; Deng, X.Q.; Zhang, M.D.; Cheng, Q.M. Multilabel Remote Sensing Image Retrieval Based on Fully Convolutional Network. IEEE J. Sel. Top. Appl. Earth Obs. Remote Sens. 2020, 13, 318–328. [Google Scholar] [CrossRef]
- Tian, T.; Chu, Z.Q.; Hu, Q.; Ma, L. Class-Wise Fully Convolutional Network for Semantic Segmentation of Remote Sensing Images. Remote Sens. 2021, 13, 3211. [Google Scholar] [CrossRef]
- Zhu, Y.T.; Long, L.H.; Wang, J.J.; Yan, J.W.; Wang, X.Q. Road Segmentation from High-Fidelity Remote Sensing Images using a Context Information Capture Network. Cogn. Comput. 2020, 14, 780–793. [Google Scholar] [CrossRef]
- Ding, L.; Tang, H.; Bruzzone, L. LANet: Local Attention Embedding to Improve the Semantic Segmentation of Remote Sensing Images. IEEE Trans. Geosci. Remote Sens. 2021, 59, 426–435. [Google Scholar] [CrossRef]
- Zhu, Q.; Liao, C.; Hu, H.; Mei, X.; Li, H. MAP-Net: Multiple Attending Path Neural Network for Building Footprint Extraction From Remote Sensed Imagery. IEEE Trans. Geosci. Remote Sens. 2021, 59, 6169–6181. [Google Scholar] [CrossRef]
- Liu, Y.; Pang, C.; Zhan, Z.; Zhang, X.; Yang, X. Building Change Detection for Remote Sensing Images Using a Dual-Task Constrained Deep Siamese Convolutional Network Model. IEEE Geosci. Remote Sens. Lett. 2021, 18, 811–815. [Google Scholar] [CrossRef]
- Wang, J.; Shen, L.; Qiao, W.; Dai, Y.; Li, Z. Deep Feature Fusion with Integration of Residual Connection and Attention Model for Classification of VHR Remote Sensing Images. Remote Sens. 2019, 11, 1617. [Google Scholar] [CrossRef]
- Li, X.; Yang, X.F.; Li, X.T.; Lu, S.J.; Ye, Y.M.; Ban, Y.F. GCDB-UNet: A novel robust cloud detection approach for remote sensing images. Knowl. Based Syst. 2022, 238, 107890. [Google Scholar] [CrossRef]
- Priyanka; Sravya, N.; Lal, S.; Nalini, J.; Reddy, C.S.; Dell’Acqua, F. DIResUNet: Architecture for multiclass semantic segmentation of high resolution remote sensing imagery data. Appl. Intell. 2022. [Google Scholar] [CrossRef]
- Wang, H.Y.; Miao, F. Building extraction from remote sensing images using deep residual U-Net. Eur. J. Remote Sens. 2022, 55, 71–85. [Google Scholar] [CrossRef]
- Yan, C.; Fan, X.S.; Fan, J.L.; Wang, N.Y. Improved U-Net Remote Sensing Classification Algorithm Based on Multi-Feature Fusion Perception. Remote Sens. 2022, 14, 1118. [Google Scholar] [CrossRef]
- Huang, G.; Liu, Z.; Van Der Maaten, L.; Weinberger, K.Q. Densely connected convolutional networks. In Proceedings of the 2017 IEEE Conference on Computer Vision and Pattern Recognition (CVPR), Honolulu, HI, USA, 21–26 July 2017; pp. 4700–4708. [Google Scholar]
- Sha, Y.C. An Information Extraction Method of Suburban Industrial Land Using Improved Densenet Network in Remote Sensing Images. Fresenius Environ. Bull. 2021, 30, 1190–1200. [Google Scholar]
- Li, H.L.; Wang, G.J.; Dong, Z.; Wei, X.K.; Wu, M.J.; Song, H.H.; Amankwah, S.O.Y. Identifying Cotton Fields from Remote Sensing Images Using Multiple Deep Learning Networks. Agronomy 2021, 11, 174. [Google Scholar] [CrossRef]
- He, H.; Yang, D.; Wang, S.; Wang, S.; Li, Y. Road Extraction by Using Atrous Spatial Pyramid Pooling Integrated Encoder-Decoder Network and Structural Similarity Loss. Remote Sens. 2019, 11, 1015. [Google Scholar] [CrossRef]
- Wulamu, A.; Shi, Z.X.; Zhang, D.Z.; He, Z.Y. Multiscale Road Extraction in Remote Sensing Images. Comput. Intell. Neurosci. 2019. [Google Scholar] [CrossRef]
- Zhang, W.; Tang, P.; Zhao, L.J. Fast and accurate land cover classification on medium resolution remote sensing images using segmentation models. Int. J. Remote Sens. 2021, 42, 3277–3301. [Google Scholar] [CrossRef]
- Kirillov, A.; Wu, Y.; He, K.; Girshick, R. PointRend: Image Segmentation As Rendering. In Proceedings of the 2020 IEEE/CVF Conference on Computer Vision and Pattern Recognition (CVPR), Seattle, WA, USA, 13–19 June 2020; pp. 9796–9805. [Google Scholar] [CrossRef]
- Qiu, T.Q.; Liang, X.J.; Du, Q.Y.; Ren, F.; Lu, P.J.; Wu, C. Techniques for the Automatic Detection and Hiding of Sensitive Targets in Emergency Mapping Based on Remote Sensing Data. ISPRS Int. J. Geo-Inf. 2021, 10, 68. [Google Scholar] [CrossRef]
- Deng, J.; Dong, W.; Socher, R.; Li, L.-J.; Li, K.; Fei-Fei, L. In Imagenet: A large-scale hierarchical image database. In Proceedings of the 2009 IEEE Conference on Computer Vision and Pattern Recognition (CVPR), Miami, FL, USA, 20–25 June 2009; pp. 248–255. [Google Scholar] [CrossRef]
- Krizhevsky, A.; Sutskever, I.; Hinton, G.E. ImageNet classification with deep convolutional neural networks. Commun. ACM 2017, 60, 84–90. [Google Scholar] [CrossRef]
- Marmanis, D.; Datcu, M.; Esch, T.; Stilla, U. Deep Learning Earth Observation Classification Using ImageNet Pretrained Networks. IEEE Geosci. Remote Sens. Lett. 2016, 13, 105–109. [Google Scholar] [CrossRef]


| Classification of Land Use | Whether to Determine as RRL |
|---|---|
| homestead in use | ✓ |
| homestead without residential function | ✗ |
| educational land· | ✓ |
| public facility land | ✓ |
| street land | ✗ |
| green spaces | ✗ |
| open spaces | ✗ |
| Method | Params (M) |
|---|---|
| DenseNet121 | 6 |
| resnet50 | 23 |
| vgg19_bn | 20 |
| vgg19 | 20 |
| Xception | 22 |
| Method | OA (%) |
|---|---|
| CDD-Net | 90.51 |
| DenseNet + ASPP | 89.19 |
| ResNet + ASPP | 87.27 |
| VGG19_bn + ASPP | 77.45 |
| VGG19 + ASPP | 82.19 |
| ResNet + UNet | 84.40 |
Publisher’s Note: MDPI stays neutral with regard to jurisdictional claims in published maps and institutional affiliations. |
© 2022 by the authors. Licensee MDPI, Basel, Switzerland. This article is an open access article distributed under the terms and conditions of the Creative Commons Attribution (CC BY) license (https://creativecommons.org/licenses/by/4.0/).
Share and Cite
Sha, C.; Liu, J.; Wang, L.; Shan, B.; Hou, Y.; Wang, A. Extraction of Rural Residential Land from Very-High Resolution UAV Images Using a Novel Semantic Segmentation Framework. Sustainability 2022, 14, 12178. https://doi.org/10.3390/su141912178
Sha C, Liu J, Wang L, Shan B, Hou Y, Wang A. Extraction of Rural Residential Land from Very-High Resolution UAV Images Using a Novel Semantic Segmentation Framework. Sustainability. 2022; 14(19):12178. https://doi.org/10.3390/su141912178
Chicago/Turabian StyleSha, Chenggao, Jian Liu, Lan Wang, Bowen Shan, Yaxian Hou, and Ailing Wang. 2022. "Extraction of Rural Residential Land from Very-High Resolution UAV Images Using a Novel Semantic Segmentation Framework" Sustainability 14, no. 19: 12178. https://doi.org/10.3390/su141912178
APA StyleSha, C., Liu, J., Wang, L., Shan, B., Hou, Y., & Wang, A. (2022). Extraction of Rural Residential Land from Very-High Resolution UAV Images Using a Novel Semantic Segmentation Framework. Sustainability, 14(19), 12178. https://doi.org/10.3390/su141912178