Article

Fast InSAR Time-Series Analysis Method in a Full-Resolution SAR Coordinate System: A Case Study of the Yellow River Delta

1
National Institute of Natural Hazards, Ministry of Emergency Management of China, Beijing 100085, China
2
School of Automation, China University of Geoscience, Wuhan 430074, China
*
Author to whom correspondence should be addressed.
Sustainability 2022, 14(17), 10597; https://doi.org/10.3390/su141710597
Submission received: 28 June 2022 / Revised: 11 August 2022 / Accepted: 23 August 2022 / Published: 25 August 2022

Abstract

:
Ground deformation is a major determinant of delta sustainability. Sentinel-1 Terrain Observation by Progressive Scans (TOPS) data are widely used in interferometric synthetic aperture radar (InSAR) applications to monitor ground subsidence. Due to the unparalleled mapping coverage and considerable data volume requirements, high-performance computing resources including graphics processing units (GPUs) are employed in state-of-the-art methodologies. This paper presents a fast InSAR time-series processing approach targeting Sentinel-1 TOPS images to process massive data with higher efficiency and resolution. We employed a GPU-assisted InSAR processing method to accelerate data processing. Statistically homogeneous pixel selection (SHPS) filtering was used to reduce noise and detect features in scenes with minimal image resolution loss. Compared to the commonly used InSAR processing software, the proposed method significantly improved the Sentinel-1 TOPS data processing efficiency. The feasibility of the method was investigated by mapping the surface deformation over the Yellow River Delta using SAR datasets acquired between January 2021 and February 2022. The findings indicate that several events of significant subsidence have occurred in the study area. Combined with the geological environment, underground brine and hydrocarbon extraction as well as sediment consolidation and compaction contribute to land subsidence in the Yellow River Delta.

1. Introduction

Increasing ground subsidence may threaten the development of industrialization and urbanization in delta regions [1,2]. Therefore, the effective monitoring of ground settlement and the analysis of the spatial distribution patterns and influencing factors of ground settlement are crucial for regional sustainability [3]. Satellite-based interferometric synthetic aperture radar (InSAR) is a particularly effective tool for surface deformation measurements [4]. Compared with traditional observation methods, InSAR provides regular and continuous observations with a broad coverage of the Earth’s surface at a high accuracy and low cost. Since the 1990s, InSAR technology has been widely applied to detect and monitor ground deformation due to earthquakes, volcanoes, landslides, land subsidence, glacier drift, groundwater exploitation, and irrigation [5,6,7,8,9,10,11,12]. This technique has also been used for the large-scale analyses of deformation patterns and causes in urban areas [13,14,15]. The demand for ground deformation monitoring across large areas has fueled the ongoing development of time-series InSAR techniques.
As a representative time-series InSAR technique, various improved versions of the small baseline subset (SBAS) method have been derived to solve multiple problems due to its excellent ability in ground displacement surveillance [16]. Because the classic SBAS method is not suitable for the local deformation analysis of small targets, the full-resolution SBAS method was first proposed in 2004 and then extended in 2010, focusing on generating mean deformation velocity maps and time-series deformation data at regional and local scales, respectively [17,18]. Ojha et al. [19] presented an innovative constrained-network propagation (C-NetP) scheme based on the use of a network optimization strategy, which improved the performance of the two-scale SBAS technique in retrieving the deformation time series at a full spatial resolution. Recently, Manunta et al. [20] developed a full parallel-resolution P-SBAS processing chain for many COSMO-SkyMed datasets, allowing for the retrieval of deformation maps and displacement time series in a short period of time (less than 24 h).
With the launch of a new generation of SAR satellite systems such as the Sentinel-1, Advanced Land Observing Satellite-2 (ALOS-2), and RADARSAT Constellation Mission (RCM), the ground coverages and spatial resolutions have greatly improved, resulting in explosive data growth. As Sentinel-1 satellite constellations, SAR images obtained by single or double satellites are acquired with revisit times of 12 or 6 days, respectively. The interferometric wide (IW) mode provides a standard frame (three subswaths and nine bursts in each subswath), reaching volumes higher than 4.5 GB [21]. Furthermore, local-scale interferometric processing methods must manage large numbers of SAR acquisitions at full spatial resolution, corresponding to hundreds of millions of points [20]. This considerable data volume leads to higher demands for storage and computation devices. Traditional InSAR processing methods and computing environments can hardly match advances in SAR satellite imaging techniques and data-processing capabilities.
The emergence and development of high-performance computing (HPC) and even grid computing clusters have provided new environments to resolve large-scale InSAR processing problems. The HPC approach can significantly improve the data processing speed without reducing the accuracy [22]. Several specific parallel algorithms have been proposed to lower the computational cost of different fundamental stages of interferometric processing in recent years. Graphics processing units (GPUs), as a representative technology, have received increased attention because of their robust parallelism, large memory bandwidth, and low power consumption, in addition to their excellent performance in solving parallel processing and calculation-intensive problems [23,24,25]. Guerriero et al. [23] provided an initial assessment of the potential of GPU-enabled processing by comparing the central processing unit (CPU)- and GPU-based image fine-registration steps. Bonano et al. [26] presented a full-resolution SBAS-differential InSAR (DInSAR) processing chain relying on granularity level parallelization strategies to investigate localized displacements. Tahsin et al. [27] proposed a new GPU-based algorithm, PtSel, to improve the speed and number of persistent scatterer (PS) point selections. Yu et al. [25] developed a GPU-accelerated InSAR processing flow for Sentinel-1 Terrain Observation by Progressive Scans (TOPS) data based on the Compute Unified Device Architecture (CUDA) framework and improved key modules such as geometric registration, resampling, enhanced spectral diversity (ESD), and coherence estimation in InSAR processing, which significantly enhanced the efficiency of InSAR data processing.
Considering that most current InSAR algorithms perform time-series analysis in the geographic coordinate system, the geocoding step can easily yield gross errors and increase the computational cost [28]. We proposed a GPU-assisted rapid InSAR time-series analysis framework targeting Sentinel-1 TOPS images based on the SBAS algorithm. Based on the function proposed by Yu et al. [25], this method employed a GPU to accelerate key modules, geometric coregistration, resampling, and ESD correction in the InSAR processing algorithms. In addition, the statistically homogeneous pixel selection (SHPS) algorithm filters differential interferograms to maximize the noise reduction and preserve the image details. Finally, the full-resolution raster data are processed in the SAR coordinate system to obtain a time series of surface deformation. The proposed method was applied to map the surface deformation over a wide area covering the entire Yellow River Delta and part of Laizhou Bay. We conducted fine-scale monitoring of unstable regions and focused on the impact of industrial development such as oil extraction on the surface deformation.
The rest of this paper is organized as follows. Section 2 describes the overall data-processing procedure. Section 3 introduces the core algorithms of the workflow. In Section 4, the study area, the SAR data used, and the results obtained with the proposed methods are presented. Finally, the performance and extensibility of the workflow are examined, and relevant findings are provided in Section 5 and Section 6, respectively.

2. InSAR Time-Series Analysis Method in the SAR Coordinate System

This paper proposed a fast GPU-assisted full-resolution InSAR time-series processing chain in the SAR coordinate system that could provide higher efficiency and better accuracy with regard to massive Sentinel-1 data. The SBAS-InSAR algorithm is characterized by low requirements for the number of images, few digital elevation model (DEM) decorrelation and atmospheric delay error limitations, and high calculation efficiency. Therefore, the SBAS-InSAR algorithm is highly suitable for the monitoring of slow deformations occurring within a relatively large spatial area. Consequently, we designed an InSAR time-series analysis method in the SAR coordinate system based on the SBAS-InSAR algorithm. The whole processing workflow is schematically described as follows (as shown in Figure 1):
(1)
Baseline estimation and optimal interferometry network generation. Baselines were calculated for all interferometry pairs, and the baselines whose spatiotemporal baseline remained within a limited range were selected. Then, the optimal network was generated for all pairs (generally, the middle image of the time series was selected as the main reference image).
(2)
Burst offset calculation between each image and the reference image. By selecting the burst area of interest (AOI) in the reference image, the burst AOI of each slave image could be calculated and derived from the reference image.
(3)
Auxiliary data preparation. Precise orbit files and external DEM files for each image were assessed and prepared. If the corresponding orbit files were not available in the system, they were automatically downloaded online. The SRTM DEM with a resolution of 30 m was used [29].
(4)
Production of all differential interferograms. This step is very time-consuming, and we employed the GPU-assisted InSAR processing method to improve the processing efficiency including geometric coregistration, resampling, and ESD correction. This step constitutes the core of this algorithm and is described in Section 3.1.
(5)
Coregistration of the interferograms. The offsets of all interferograms were calculated between the reference and other images. Then, all of the interferograms were resampled according to the estimated offsets. The resampled interferograms were interpolated into a uniform SAR coordinate system.
(6)
SHPS phase filtering and unwrapping. SHPS filtering was performed to reduce noise in the InSAR covariance matrix and simultaneously preserve the spatial resolution of SAR imagery [30]. Phase unwrapping was processed for all interferograms via minimum cost flow (MCF) networks [31].
(7)
Orbital error and atmospheric delay removal. To reduce the orbital residual derived from possible inaccurate ephemeris parameters and tropospheric effects in the interferograms, we estimated a polynomial function to remove the estimated phase ramp [32].
(8)
Time-series analysis in the SAR coordinate system. With high- and low-pass filters, the average deformation rate was calculated by employing the linear least squares (LS) method, and the time-series cumulative deformation was then obtained via the singular value decomposition (SVD) algorithm.
(9)
Calculation of geographic coordinates. The deformation rate and deformation time series of each high-coherence point were transformed into a geographical coordinate system.

3. Central Methods for the InSAR Processing Workflow

3.1. GPU-Assisted InSAR Process

Sentinel-1 operates in TOPS mode, requiring a high coregistration accuracy due to the significant Doppler center frequency shift in the azimuth. During interferometric processing, the interferometric phase deviation introduced by the Doppler center frequency deviation can be expressed as [33,34,35]:
Δ Φ a z = 2 π Δ f D C Δ t = 2 π 2 v λ Δ β Δ t
where Δ f D C is the change in the Doppler centroid over the azimuth; Δ β is the corresponding difference in the squint angle; and Δ t is the misregistration between the master and slave in the azimuth. To ensure that the phase ramp is limited to less than 3.6° considering the Sentinel-1TOPS data, the coregistration accuracy in the azimuth must be higher than 0.0009 pixels [34]. To achieve accuracy, it is necessary to exploit different coregistration techniques to perform geometric primary registration, followed by shift refinement. When calculating the offsets, fewer control flow instructions are exhibited in the Newton–Raphson method than in the traditional binary search method, while arithmetic instructions were more common, resulting in higher GPU performance [25]. After the offset estimation, the azimuthal or distance displacements were fitted using least squares (LS). The cuBLAS and cuSOLVER libraries were used for matrix multiplication and linear system solving on the GPU for LS fitting [25].
To realize high-precision coregistration, ESD technology was used to fine-tune the azimuth offsets derived from the geometric coregistration [25,33,34,36]. ESD technology utilizes the phase difference between the overlapping regions of adjacent bursts within a chosen subswath. To obtain the azimuth registration error Δ y , let m i and s i denote the overlapping area of the i-th burst of the main and auxiliary images, respectively, and let m i + 1 and s i + 1 denote the overlapping area of the i + 1-th burst of the master and slave images, respectively. The ESD phase of a pixel can be expressed as:
Φ E S D = arg m i s i * m i + 1 s i + 1 * = 2 π f D C i + 1 f D C i Δ y f a z
where denotes the conjugate operation; arg denotes the complex phase; f D C denotes the corresponding Doppler centroid frequency; and f a z is the azimuth sampling frequency of the image. It is accepted that the phase interval of the unwrapped differential interferometry calculated by ESD is π , π , which is equivalent to an accuracy of 0.05 pixels; accordingly, the accuracy of geometric coregistration must be higher than this value to avoid phase ambiguity [33,35]. During ESD execution, the differential interferogram for each overlapping region was estimated by a DoubleInterfo kernel, and the averaged coherence of each pair of upper and lower images in the overlapping regions was calculated [25]. Although the common software Doris used an improved coherence calculation method that reduced repetitive memory access and repeated calculation in overlap regions, this method suffers from a vertical prefix sum challenge when performing parallel optimization on a GPU [25,37]. In this paper, a scan algorithm was used to calculate the prefix sum of each column in the vertical direction, implementing the parallel computation of optimized coherence estimation on a GPU [25,38].
It is notable that the target object of ESD processing is the baseband signal. Therefore, deramping and resampling must be performed before ESD refinement. The deramping function is [25,33,35,39]:
φ ( t a , t r ) = exp j π k t ( t r ) t a η r e f ( t r ) 2 j 2 π f D C ( t r ) t a η r e f ( t r )
where k t is the Doppler center rate and η r e f is the reference time. During resampling, a raised cosine (RC) interpolation kernel of 12-points was used to balance the computational efficiency and accuracy. Additionally, texture memory and registers could improve memory access, reducing the data access delay and providing runtime savings.
Furthermore, data transmission between the CPU and GPU during the whole workflow is costly because of the very large number of Sentinel-1 images. Thus, two approaches can be adopted to address this issue: one approach is to use page-locked memory to facilitate the CPU–GPU data transfer; the other approach is to apply asynchronous data transfer (ADT) between the CPUs and GPUs to reduce the majority of data transmission costs during kernel execution [25].

3.2. SHPS Phase Filtering

The acquired interferogram contains a large amount of phase noise due to spatiotemporal decoherence, Doppler center frequency deviation, and thermal noise in the TOPS imaging [40]. This noise seriously affects the phase unwrapping and deformation estimation’s reliability and accuracy. Previous studies have demonstrated that the estimation accuracy for the distributed targets could be improved through the application of statistically homogeneous pixels (SHPs), determined via statistical tests and stochastic models [41,42,43].
Assuming that similar ground objects exhibit homogeneous backscattering characteristics in space, pixels can be sorted by comparing the similarity of the reference pixel and the timewise SAR intensity samples of all pixels within the given window. Only pixels of the same class participating in parameter estimation were employed to greatly enhance the signal-to-noise ratio (SNR) of the SAR/InSAR data and detect scene features of scenes with minimal image resolution loss [30,44].
To date, homogenous sample selection algorithms can mainly be divided into nonparametric statistical inference (e.g., the Kolmogorov–Smirnov test and Baumgartner–Wei–Schindler test methods) and parametric statistical inference algorithms (e.g., the likelihood ratio test (LRT) method) [45,46]. The algorithm proposed by Jiang et al., namely, the SHPS algorithm, is based on optimal parameter statistics. The SHPS algorithm combines the advantages of the fast SHP selection (FaSHPS) and LRT methods. The SHPS method adopts the homogeneous sample set selected via the LRT as the initial value and then refines the reference pixels. Thereafter, this algorithm adopted a narrower confidence interval (CI) and high-quality observation iterations to control type II errors, thereby minimizing the sample heterogeneity [30].
Assuming that single-look complex (SLC) data satisfy the complex circular Gaussian distribution, the intensity followed the exponential distribution, while the phase followed the Rayleigh distribution [30,44]. Monte Carlo simulation experiments indicated that when datasets follow the complex Gaussian distribution, application of the SHPS algorithm can yield the best results in controlling the type I/II errors and standard deviation and increasing the efficiency [30]. Estimation based on the homogeneous point selection algorithm could maintain the spatial resolution of the original SAR image and reduce the noise attributed to the InSAR covariance matrix. Additionally, this approach could improve the SNR in each homogeneous region and ensure that the point target signal remains unaffected by the surrounding DS signal pollution.
Thus, we applied the SHPS algorithm in interferogram filtering to remove low-coherence points in the wetlands, vegetation-covered areas, and low-reflectivity areas. This algorithm could effectively improve the accuracy and reliability of the results while preserving the detailed features of the interferograms.

3.3. Full-Resolution SBAS Analysis in the SAR Coordinate System

The SBAS method relies on only pairs of images with small spatiotemporal baselines to generate differential interferograms [47]. Low-frequency linear and high-frequency nonlinear deformations can be estimated with the LS and SVD methods, respectively [48,49]. The SBAS method can detect partially distributed targets with a high coherence over a short period due to the short spatiotemporal baseline within the subsets [50,51]. Therefore, the small baseline set method is often used for deformation monitoring in nonurban areas and complex surfaces [52]. However, the traditional SBAS approach may result in a lack of coherent point coverage in some cases due to the multi-look procedure [16,18]. In addition, the spatial resolution can be reduced if the image contains abundant details or a complex deformation signal [53].
After interferometry processing, the interferograms occur in the SAR coordinate system and must be converted into a geographic coordinate system for further analysis [54]. However, several adjacent high-coherence points in mountain regions may overlap and resemble one point after geocoding, reducing the density of coherent points. In addition, interpolation and resampling in geocoding can generate gross errors, lowering the geocoding accuracy [28]. Consequently, the full resolution of SAR images derived from Sentinel-1 data was employed to produce time-series displacement fields in the SAR coordinates, maintaining the density of coherent points and avoiding an extraneous computational burden.
After phase unwrapping, the phase components of a pixel in an interferogram can be represented as [55,56]:
Δ Φ = W Δ Φ d e f + Δ Φ t o p o + Δ Φ o r b + Δ Φ a t m + Δ Φ n o i s e
where W denotes the phase winding operator; Δ Φ d e f is the surface deformation signal; Δ Φ t o p o is the topographic residual error; and Δ Φ a t m and Δ Φ n o i s e represent the atmospheric propagation delay and the thermal noise, respectively.
These phase components, which are unrelated to the deformation information, can be regarded as high-frequency noise components. We performed high- and low-pass filtering routines to improve the accuracy of the InSAR time series analysis. Interferograms were subjected to spatial high-pass filtering to remove residual orbital ramps and other long-wavelength noise. We applied a fast Fourier transform and a Gaussian window to execute high-pass filtering, and the threshold frequency for the Gaussian window was set as 3. The inverse fast Fourier transform algorithm was then used to reconstruct high-pass interferograms [54]. The LS method could significantly improve the SNR via random noise reduction [57]. The LOS deformation rate of each pixel in the study area could be estimated using the LS method [58]. Nonlinear deformation components could be easily obtained via the SVD technique. Then, low-pass filtering was employed to eliminate the high-frequency components of the computed time series in the spatial domain to enhance the accuracy of the time series and linear deformation rate. We used the Gaussian filter kernel in the frequency spectrum with a size of 200 [54]. Finally, the overall differential deformation signal could be obtained by combining the available linear and nonlinear displacement information [18,48].

4. Results and Analysis

4.1. Study Area

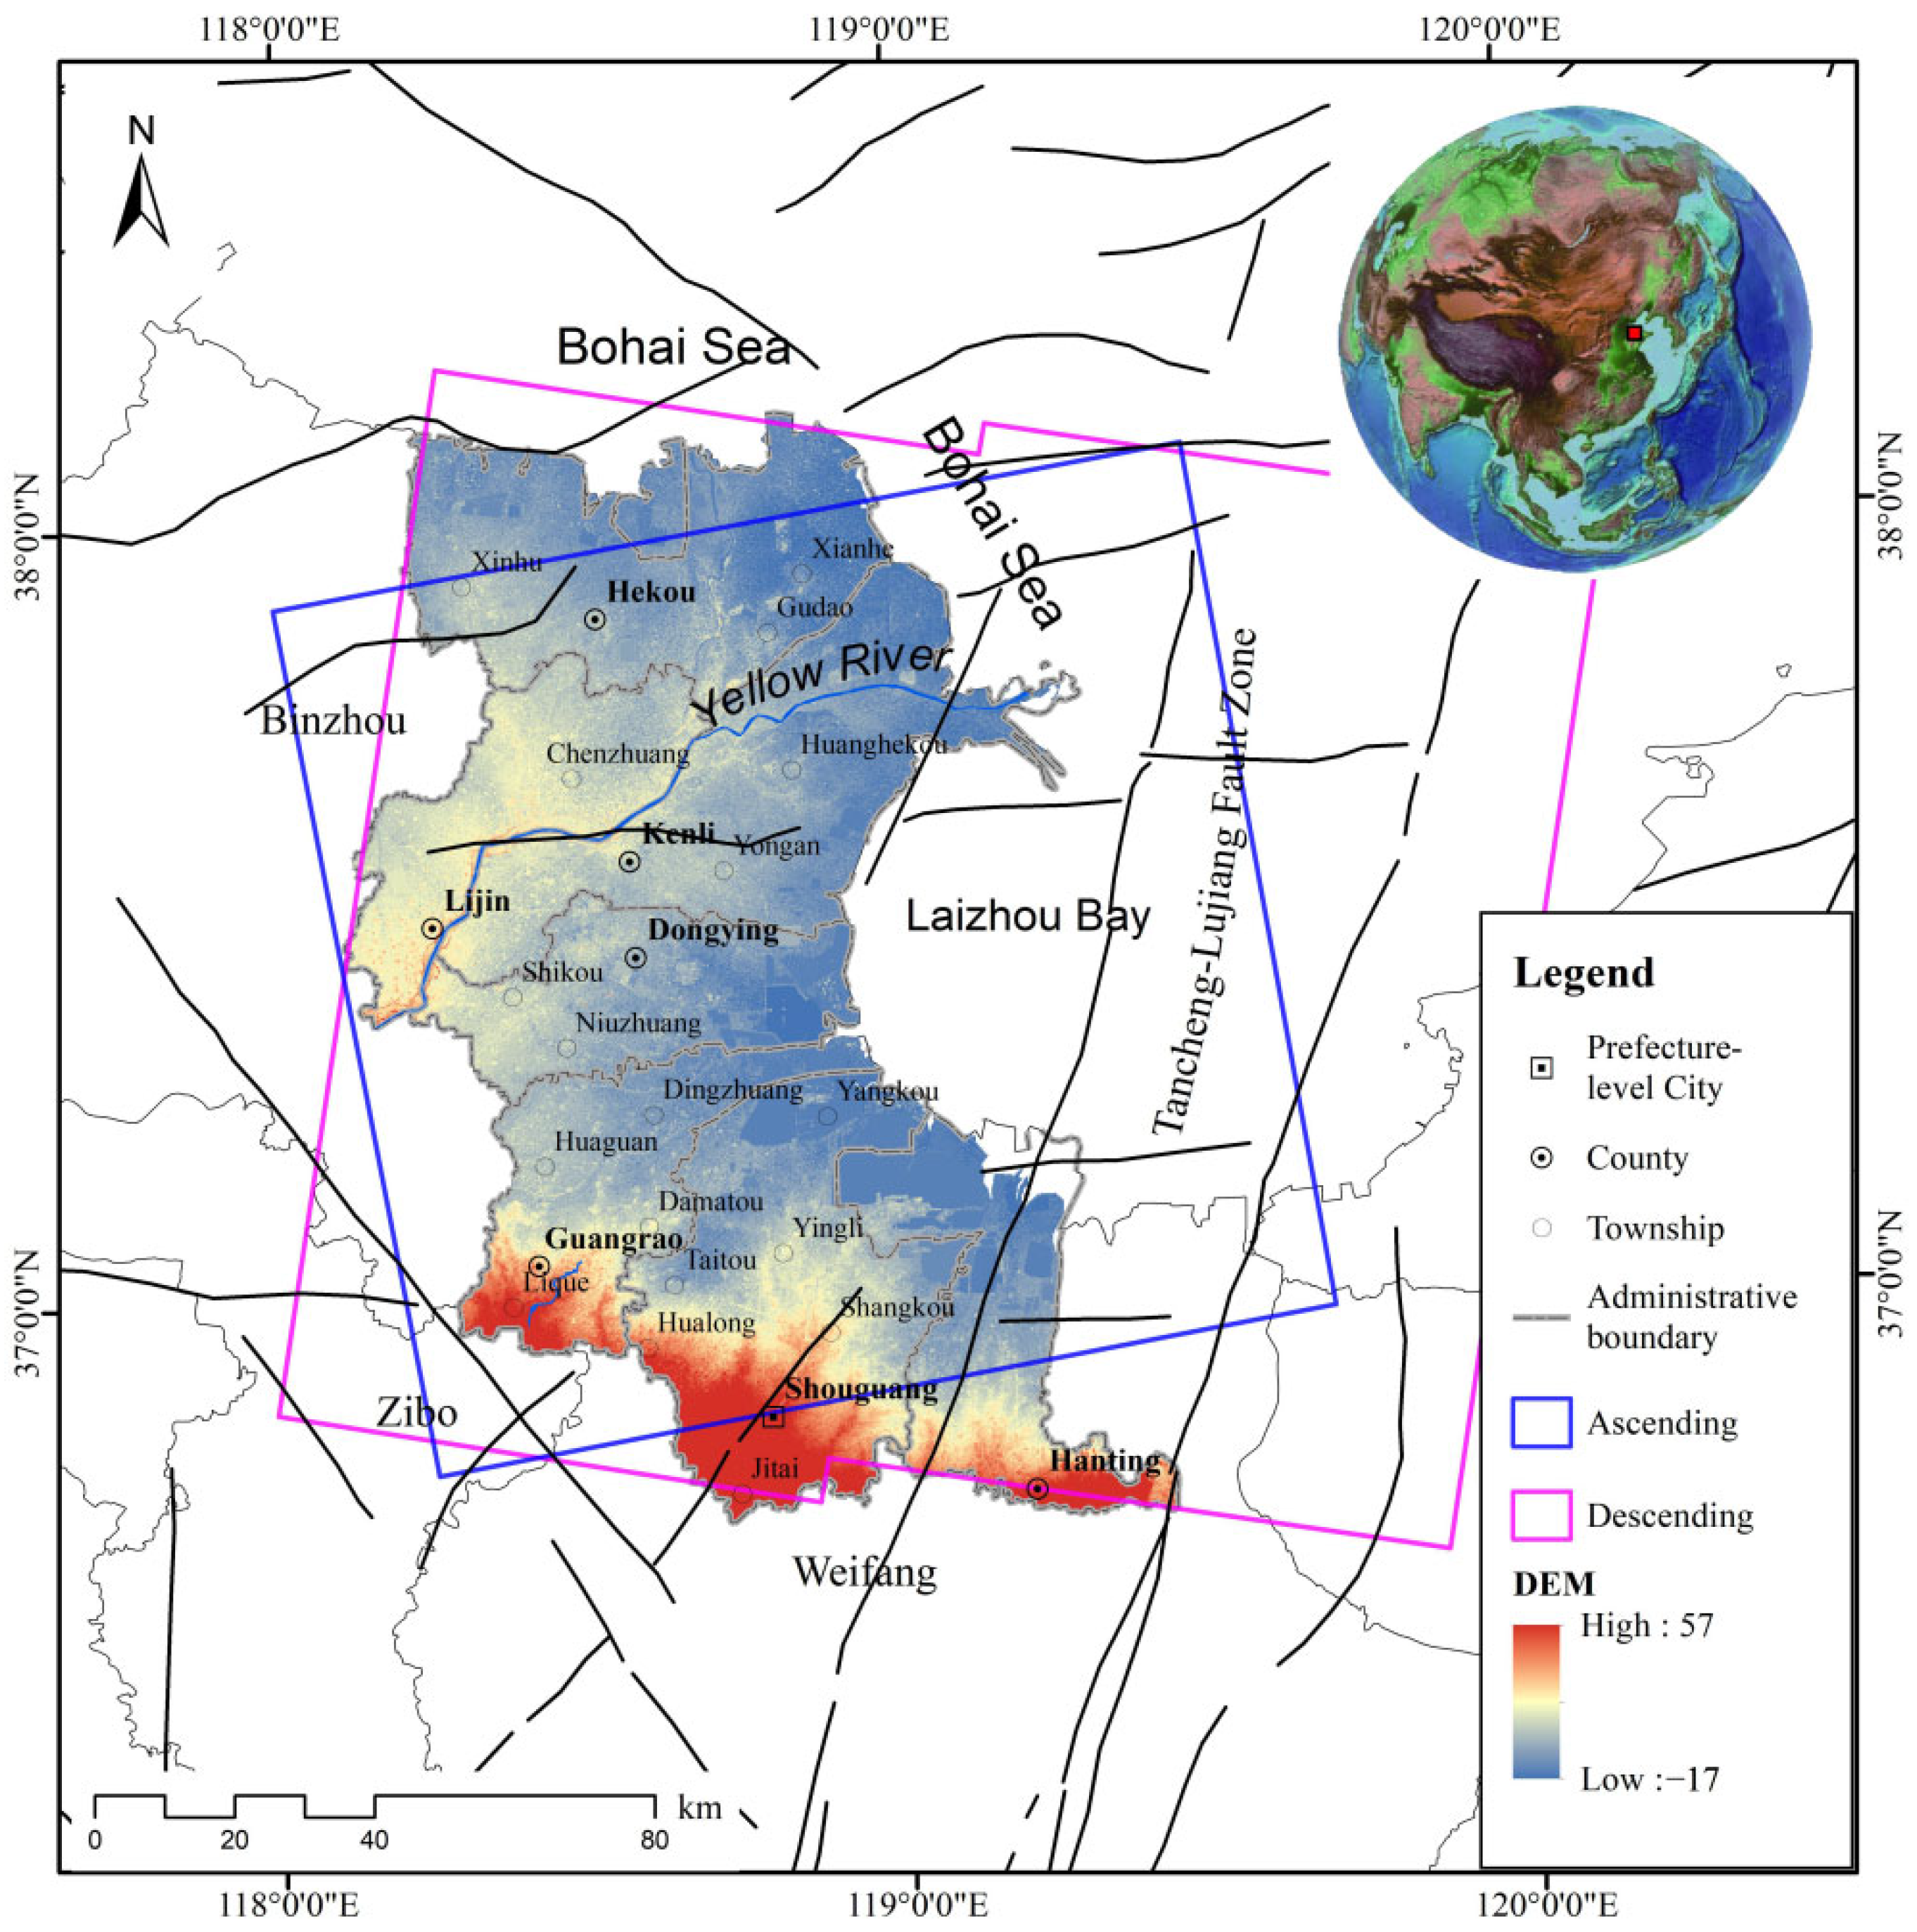
The Yellow River Delta is situated in the Chinese province of Shandong, north of the Bohai Sea, and is part of the North China Plain [59]. The entire Yellow River Delta is contained between the eastern Taihang piedmont fault zone and the Tancheng–Lujiang fault zone [60]. The Yellow River deposits a large amount of sediment at the entrance to the Bohai Sea, forming an impact plain with an open and flat topography of more than 5000 km2. Employing the Yellow River as the axis, the terrain is high near the river and lower far away, which is generally fan-shaped and gradually decreases toward the sea from southwest to northeast (as shown in Figure 2). The region exhibits an altitude lower than 10 m and a natural slope of only approximately 1/10,000 [1,59,61].
The lithology in the study area is dominated by chalky sand, clayey chalk, and clay but also fine to medium sand, fine sand, and powdery fine sand [62,63]. The majority of the sediments in the region are thick, loose, unconsolidated, undercompacted, and soft plastic. It is characterized by high water content, high compressibility, low strength, and low bearing capacity [60,62]. Therefore, ground subsidence is very common within the study area.
The Yellow River Delta is densely vegetated and contains abundant wetland resources. Buildings are mainly distributed in Dongying city and the surrounding towns in a checkerboard shape, while other areas mainly contain farmland, wasteland, or bare land. In addition, abundant resources occur in the Yellow River Delta such as oil, natural gas, geothermal, and underground brine. Saltfields and aquaculture bases are widely distributed in coastal areas. Due to the extensive hydrocarbon production and groundwater extraction for industry and agriculture, the withdrawal of the aquifer leads to the consolidation of the alluvium formation and the manifestation of land subsidence [35,61,64,65]. Ground subsidence in a deltaic region may lead to several man-made and natural disasters such as infrastructure destruction, wetland loss, coastline retreat, saltwater intrusion, and even an increase in flood and storm surge hazards [10,61,66]. Previous studies have verified that the subsidence rate in the Yellow River Delta is nearly two orders of magnitude greater than the average sea level rise locally and globally, posing a severe threat to the lives and property of residents [1]. Consequently, it is crucial to conduct large-scale deformation monitoring in the Yellow River Delta.

4.2. SAR Data

Twenty-nine Sentinel-1 IW C-band SAR images from ascending Path 69 and twenty-five images from descending Path 76 from January 2021 to February 2022 were used to detect surface displacements across the Yellow River Delta region in this study. The SAR data coverage is shown in Figure 2, in which the blue and magenta rectangles indicate the AOIs of the ascending and descending SAR datasets, respectively. In addition, a Shuttle Radar Topography Mission (SRTM) DEM with a 30 m resolution was used as the reference DEM to estimate and remove the topographic phase.
This paper set the time baseline as 5–50 days to avoid decoherence. A total of 95 interferometry pairs were obtained from the ascending images, while 80 pairs were obtained from the descending images. The interferometric combinations of these two datasets in the SBAS-InSAR analysis are shown in Figure 3.

4.3. Results and Analysis

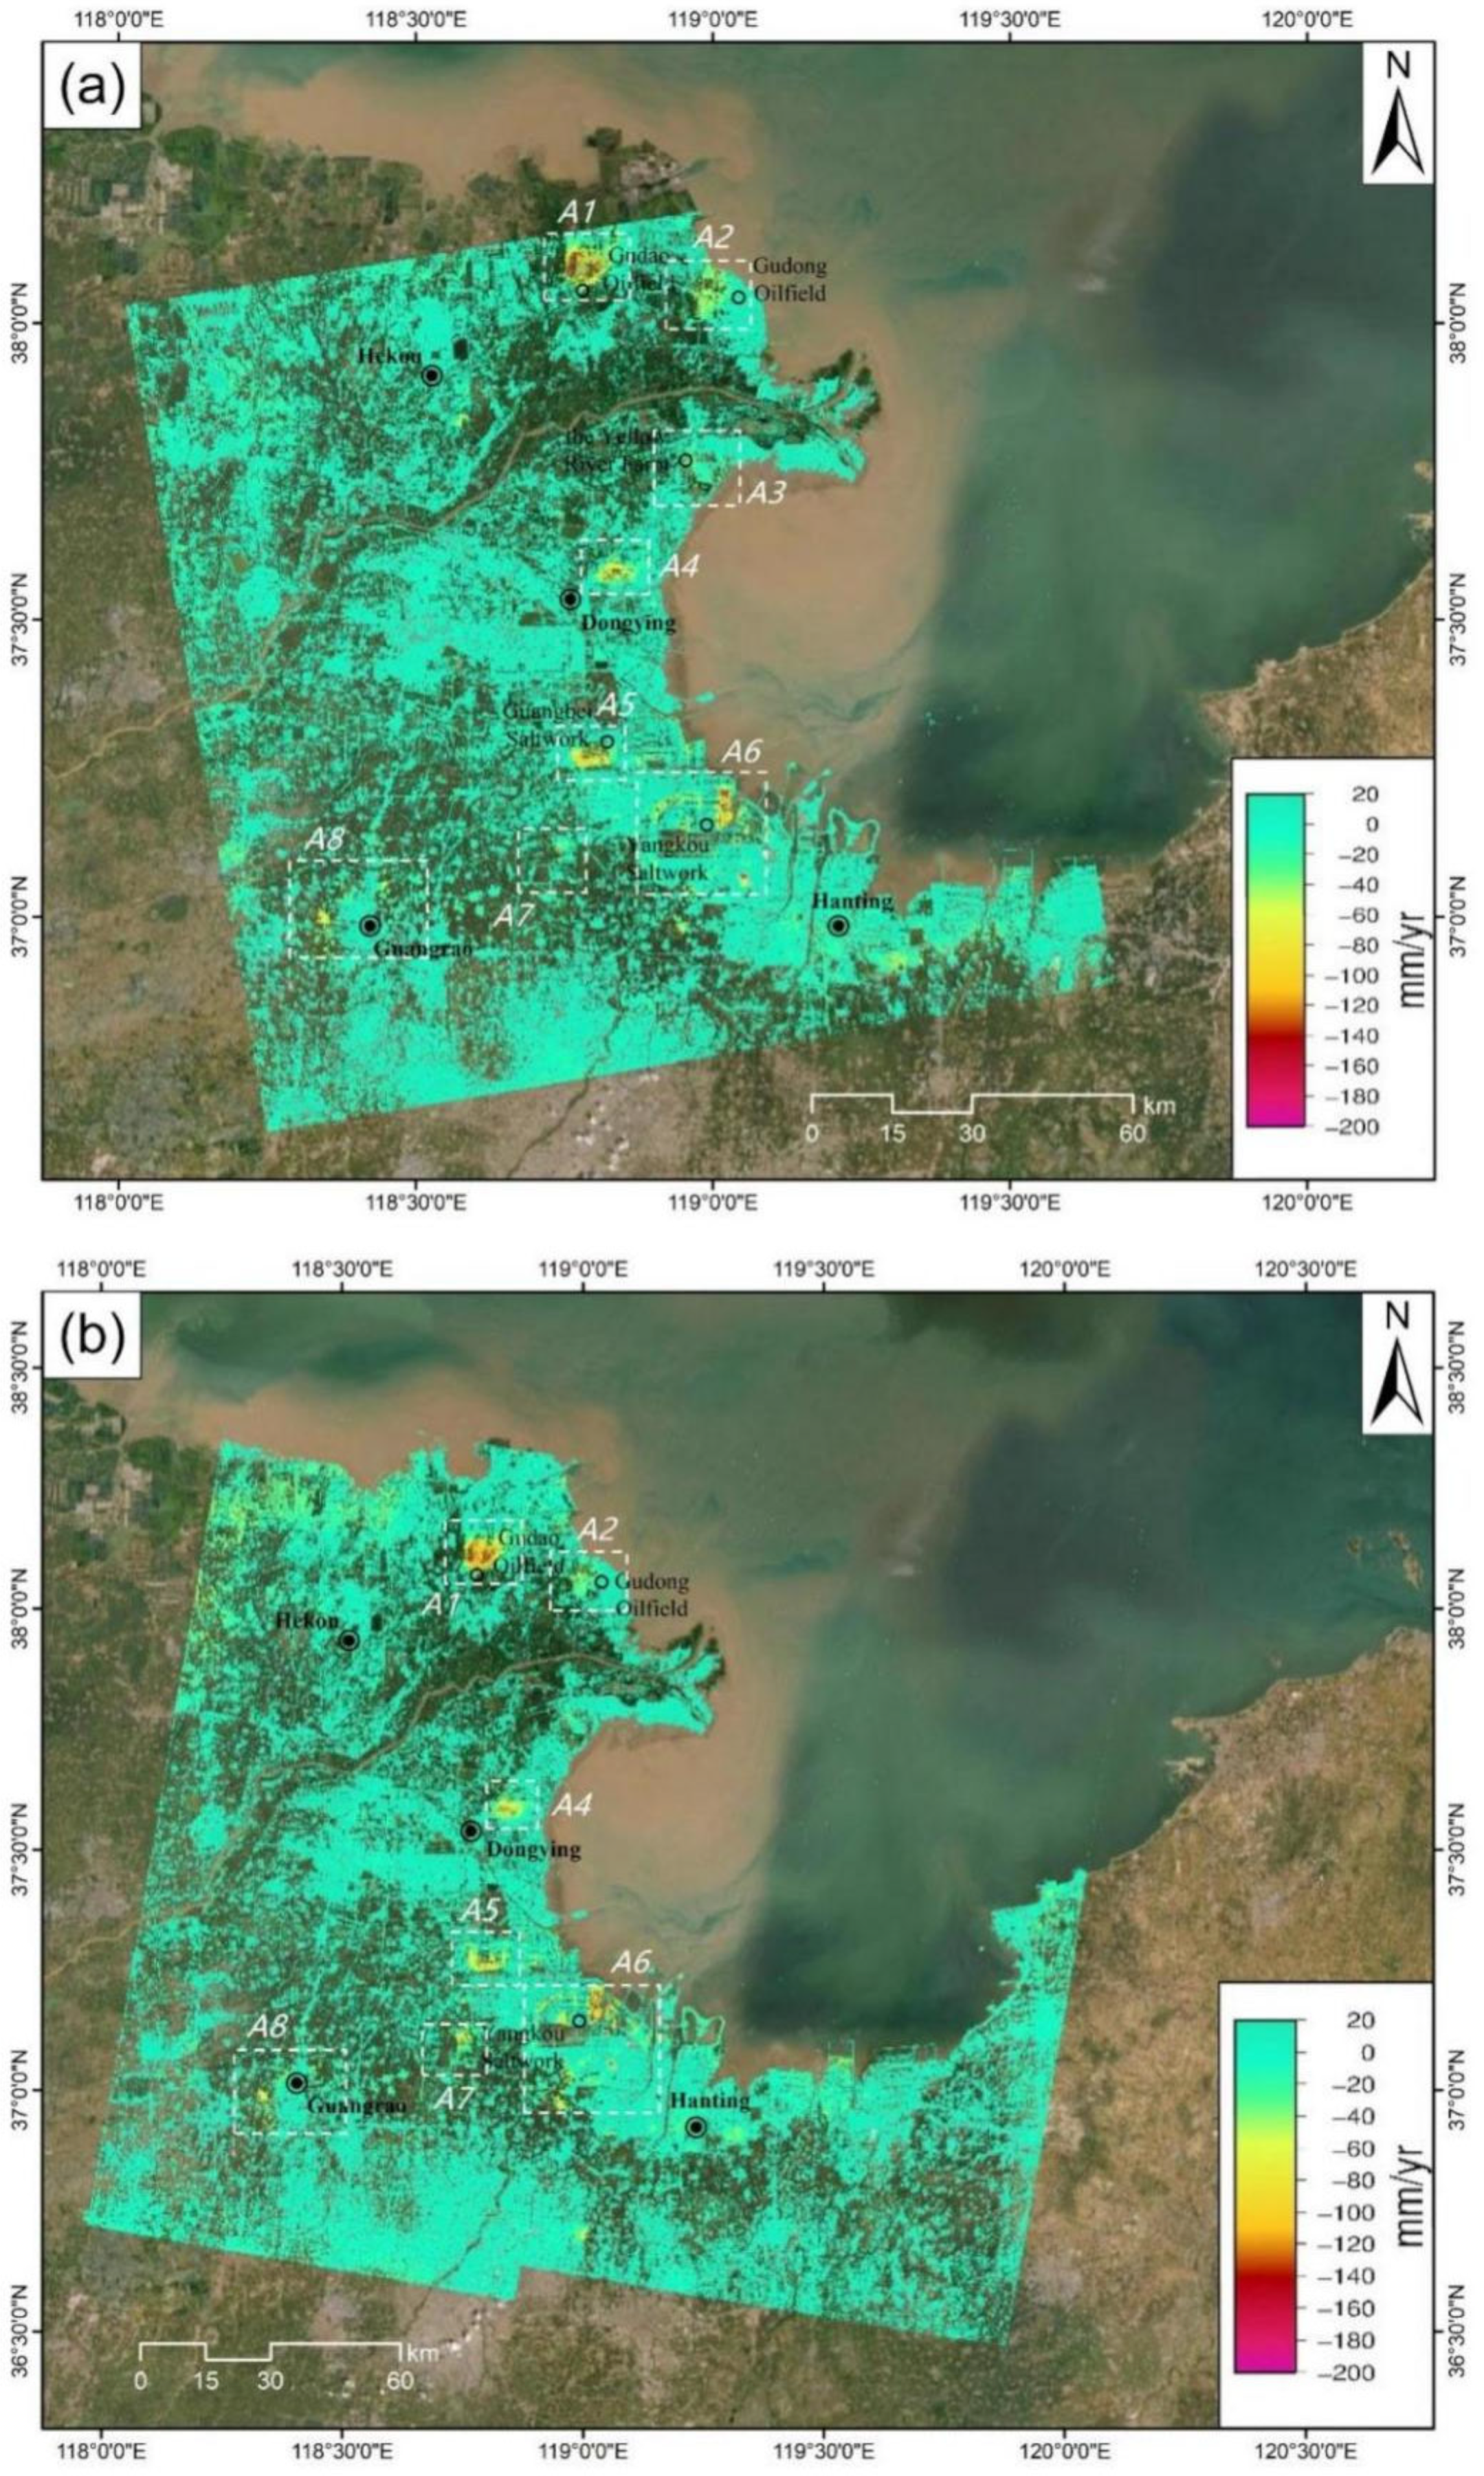
The LOS deformation rate in the Yellow River Delta and most of the Laizhou Bay coastal area was obtained from both the ascending and descending Sentinel-1 data, as shown in Figure 4 (the negative values indicate subsidence). The InSAR results revealed a general stability in our study area during the monitoring period of this paper. However, there remained several severe areas with a certain degree of subsidence. The ascending and descending deformation rates exhibited similar spatial patterns, and the maximum deformation rates reached approximately −254 and −271 mm/yr, respectively.
According to previous studies, significant subsidence occurred in the oilfields, saltworks, and aquaculture facilities, especially in Dongying and Guangrao [35,61,67,68]. The Gudong Oilfield, Yangkou Saltwork, and Guangrao County are all typical ground subsidence areas. In particular, the annual average sedimentation rate of the Gudong Oilfield in 2016–2017 was 286.3 mm/yr, while the maximum sedimentation rates of the Yankou saltfield in 2015–2016 and 2016–2017 were 224.6 mm/yr and 264.3 mm/yr, respectively [67]. The results in this paper demonstrated that serious deformation was primarily distributed in Hekou, Dongying, Guangrao, and Hanting, and the deformation spatial distribution pattern and the subsidence rate of the major deformation areas were similar to findings in the previous research. The location with the most significant subsidence rate (−271 mm/yr) was located in the industrial park south of the Yangkou Saltwork. More serious subsidence occurred in the Gudong Oilfield, Guangbei Saltfield, the industrial park near the Yangkou Saltfield, and Guangrao County. Small-scale to moderate subsidence (less than 50 mm/yr) also occurred near the Gubei Reservoir, the east bank of the Old Yellow River Channel, Linjiawuzi, and the Yellow River Farm.
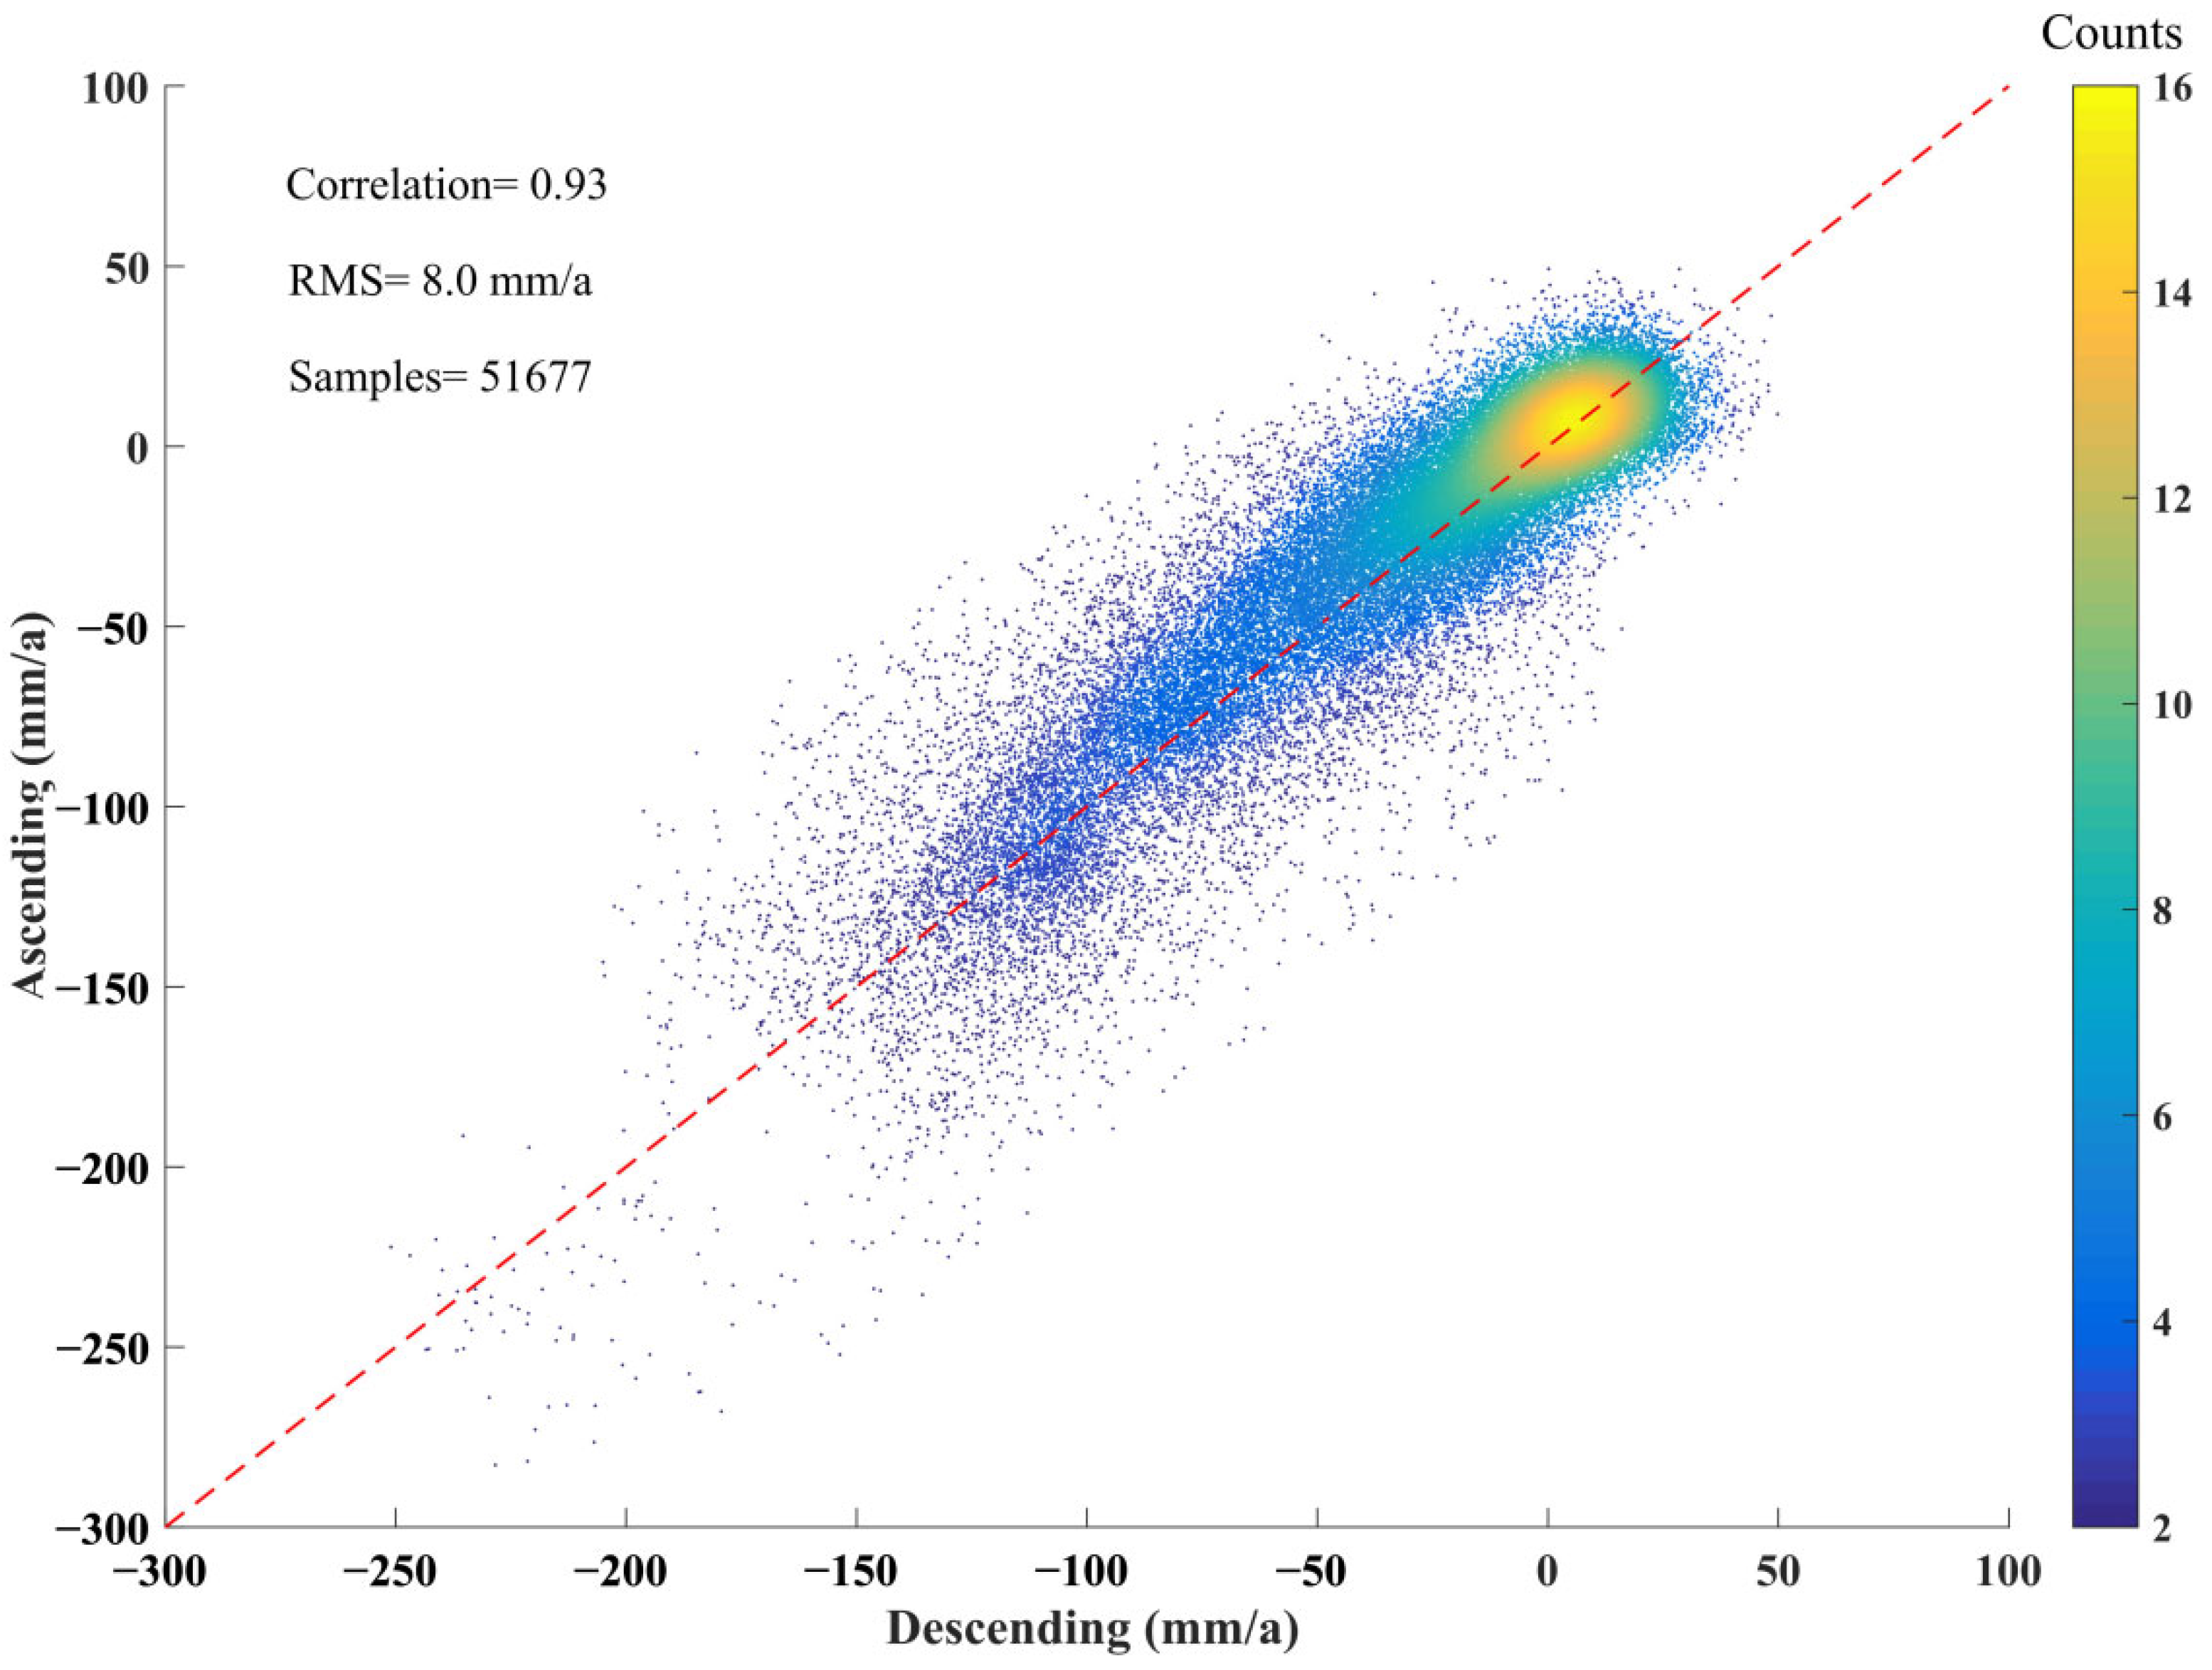
To assess the reliability and consistency of the deformation rate measurements, we performed a cross-comparison of the observation results between the ascending and descending datasets. Considering the mismatch in geolocation between pixels of these two datasets due to the dissimilar imaging geometries, we first selected 51,677 points in the study area via grid sampling and then generated a scatterplot of the deformation rates derived from the two SAR datasets, as shown in Figure 5, revealing a high correlation of 0.93. The root mean square error (RMSE) of the difference reached 8 mm/year.

4.4. Deformation Analysis of Unstable Areas

Eight subsidence areas were marked as A1–A8, as shown in Figure 4. Region A1 is the Gudao Oilfield. Region A2 is located near the Gudong Oilfield, and a saltwork exists on the north side. Region A3 mainly contains aquaculture and husbandry activities. Many saltworks surround regions A4, A5, A6, and A8. Large chemical plants can be found near the subsidence centers of regions A6 and A8. These typical areas are examined in detail in the following sections. In summary, the factors leading to ground settlement in the Yellow River Delta region are diverse and complex, but they can be broadly classified into three categories: underground brine exploitation, hydrocarbon extraction, and soft soil consolidation and compaction.

4.4.1. Saltwork Exploitation

The salinity of subsurface brine in the coastal area of the Yellow River Delta is higher than that of seawater. Therefore, a large number of salterns exist. The extraction of underground brine for salt-making has become the main production method of coastal salterns in this area. In addition, saltwork exploitation is often accompanied by the development of the chemical industry and pharmaceutical production, which are characterized by high water consumption. The continuous extraction of underground water is the main reason for the subsidence in saltwork areas. As shown in Figure 4, large numbers of saltworks occur in regions A5, A6, and A7.
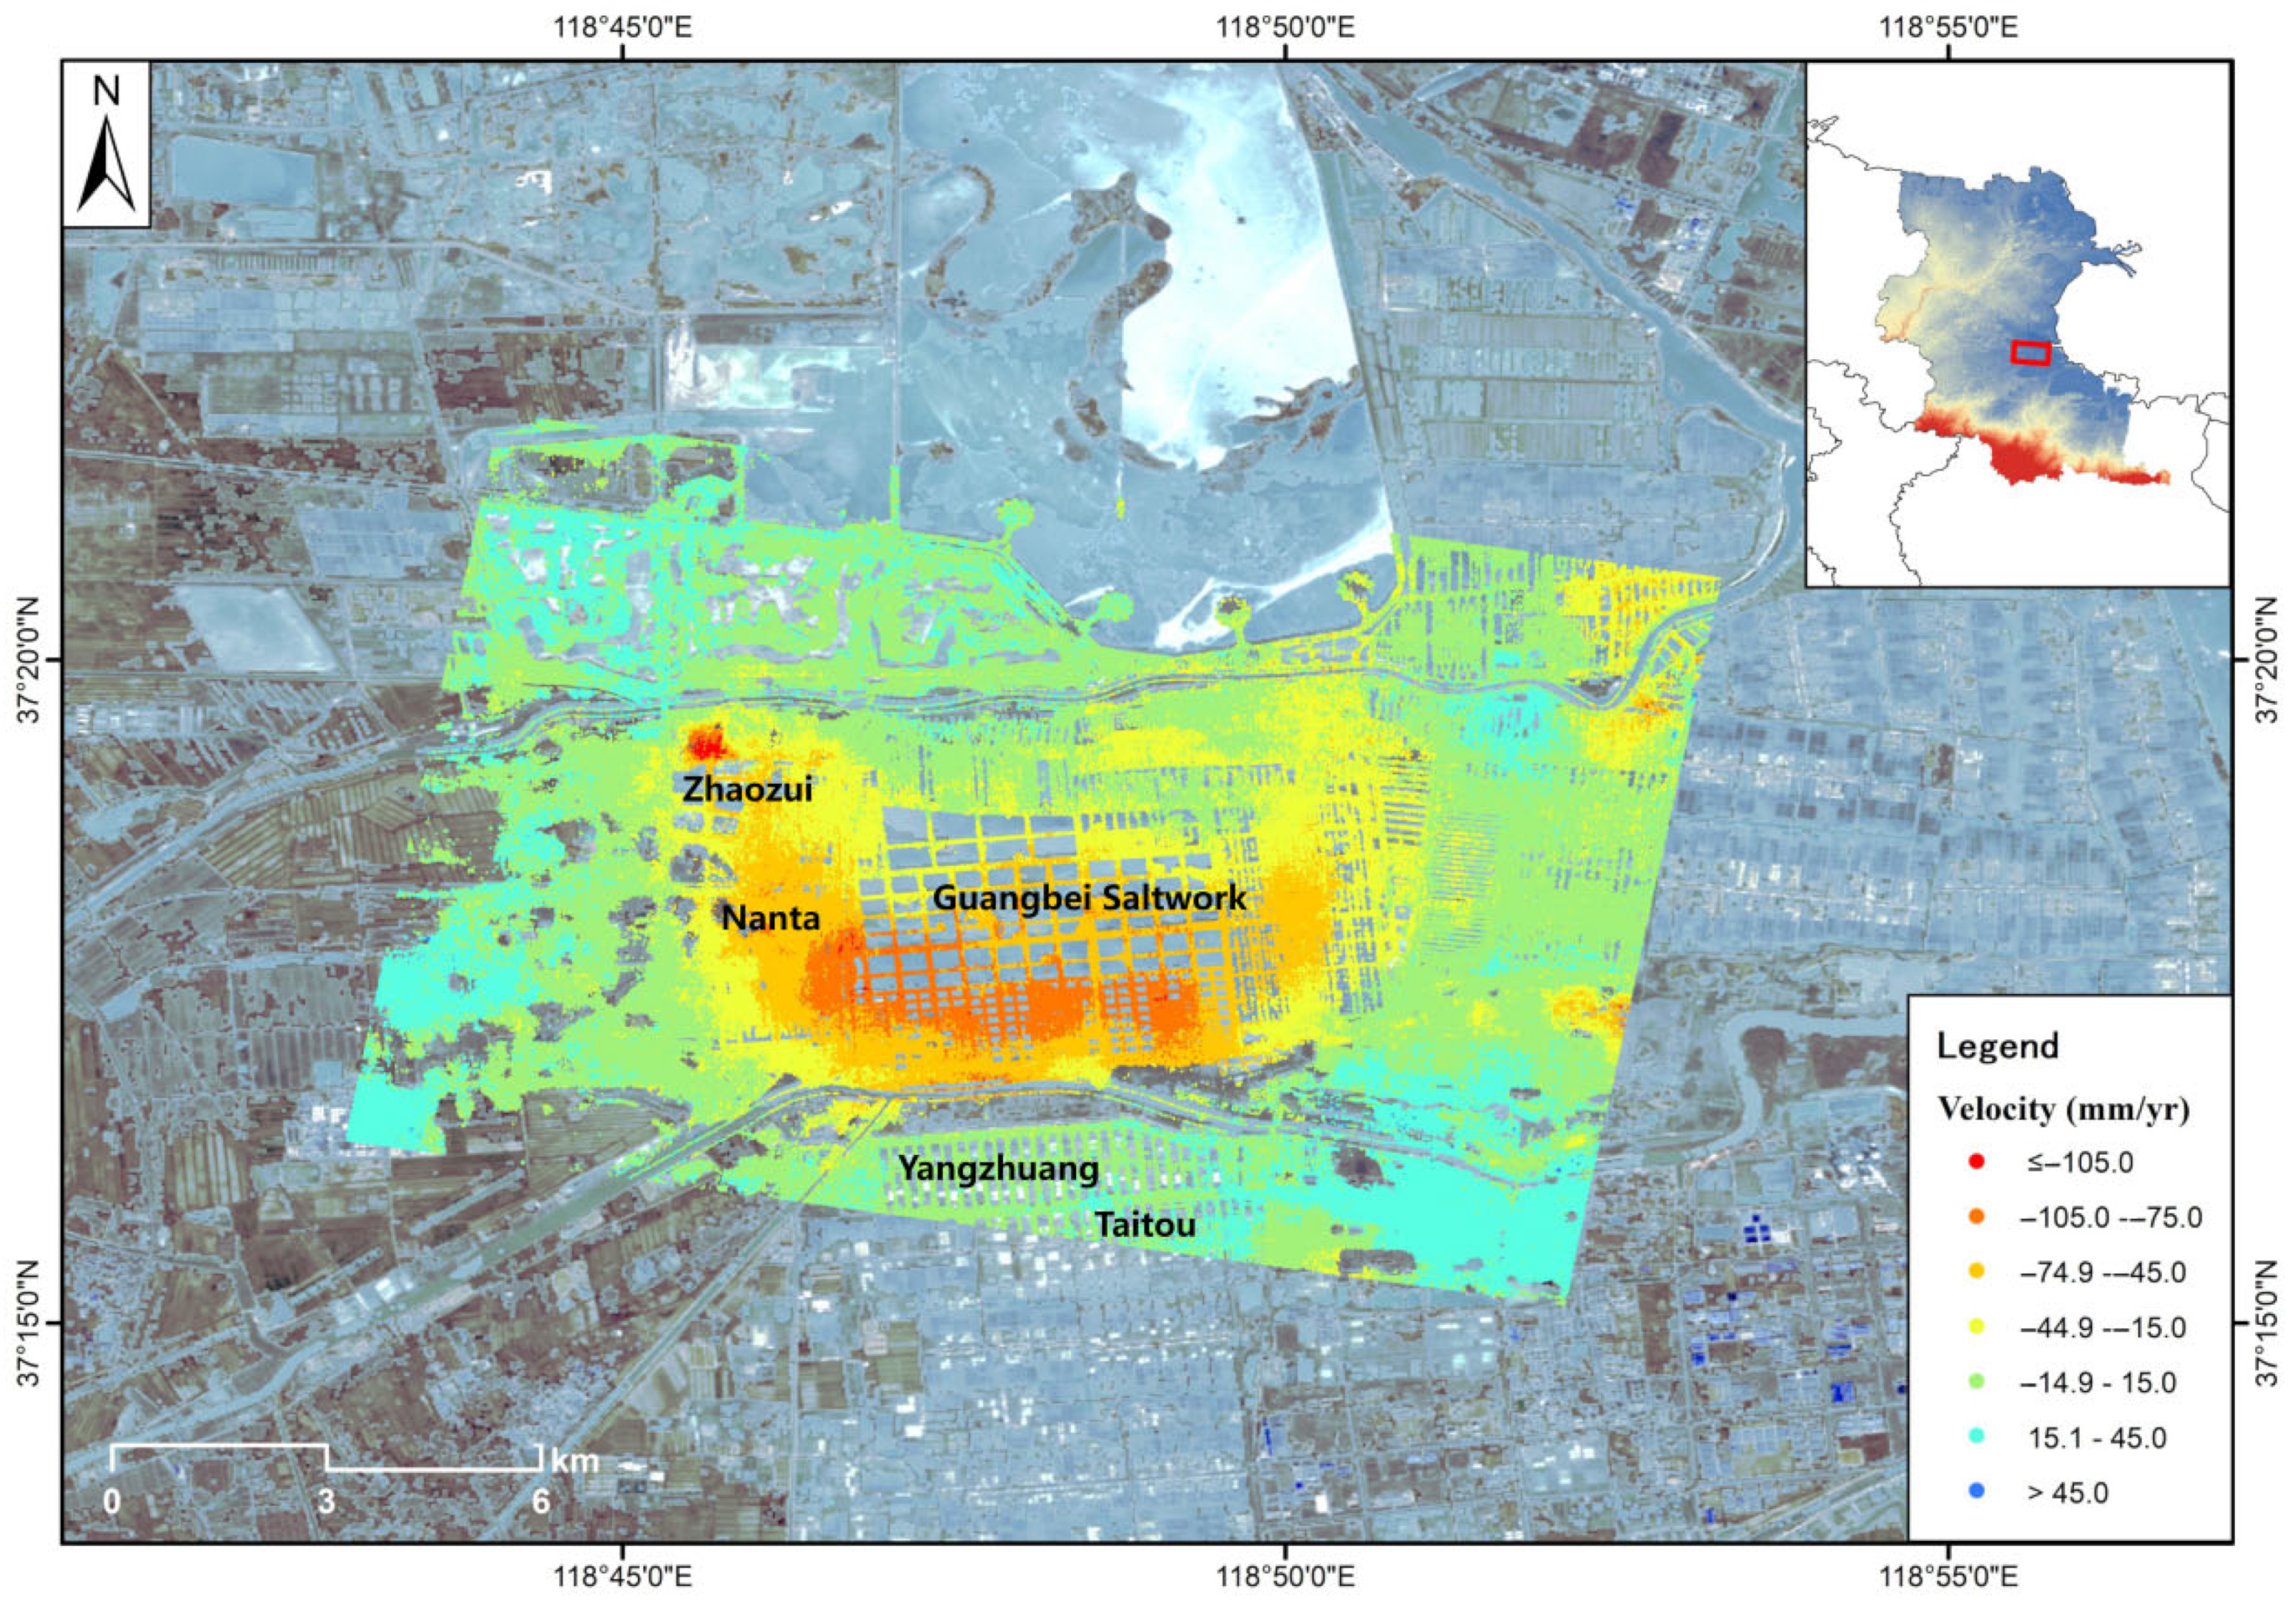
The Figure 6 shows the deformation rate in region A5. The largest saltwork in region A5 is the Guangbei Saltwork. The Guangbei Saltwork is surrounded by nearly ten salterns of different scales in the region including the Nanta Saltwork, Zhaozui Saltwork, Yangzhuang Saltwork, and Taitou Saltwork. The surface water system in the area mainly comprises two rivers, the Zhimai River and the Xiaoqing River. The land subsidence of Nanta, Xinji, and Guangbei, located on the north side of the Xiaoqing River, exhibited severe land subsidence, with a maximum subsidence rate of −142 mm/yr.
Region A6 is located in Yangkou town. The industries in Yangkou include the chemical industry, machinery processing, pharmaceutical production, and salt production. The Yangkou Saltwork, the largest salt farm in the region, is surrounded by several large chemical industrial parks such as Lingang Industrial Park, Luli Industrial Park, calcium chloride plants, and bromine plants. In the 1960s, underground brine extraction began, followed by the vigorous development of aquaculture and the chemical industry [35]. Previous research has demonstrated that the subsidence rate attributed to groundwater pumping along aquaculture-based coastlines can reach as high as 250 mm/yr [1]. Moreover, as a high-water-consumption industry, the chemical industry needs a large amount of groundwater. Therefore, the main reason for land subsidence in this region is groundwater overexploitation. As shown in Figure 7, the areas with the most severe subsidence were found at the chemical plant and on both sides of the old estuary of the Yellow River, and the maximum deformation rates reached −194 mm/yr and −271 mm/yr, respectively.
The Shuangwangcheng Reservoir (A7) is located in southwestern Yangkou town. The Yanyuan Saltwork is located approximately 4.5 km to the northeast of the reservoir. The Shuangwangcheng Reservoir is a significant adjustment and storage reservoir for the Jiaodong Water Transmission Trunk Project along the east route of the South-to-North Water Transfer Project. We randomly selected five points on both the northeastern and southwestern side slopes of the Shuangwangcheng Reservoir and determined the settlement rate (Figure 8). The average settlement rate of the five points on the northeastern side was −39.71 mm/yr, while that on the southwestern side reached −13.94 mm/yr. The settlement on both sides of the reservoir differed, and the settlement rate on the northeastern side was higher than that on the southwestern side. This phenomenon illustrated that saltwork exploitation might accelerate ground subsidence, leading to the instability of the reservoir slopes.

4.4.2. Hydrocarbon Extraction

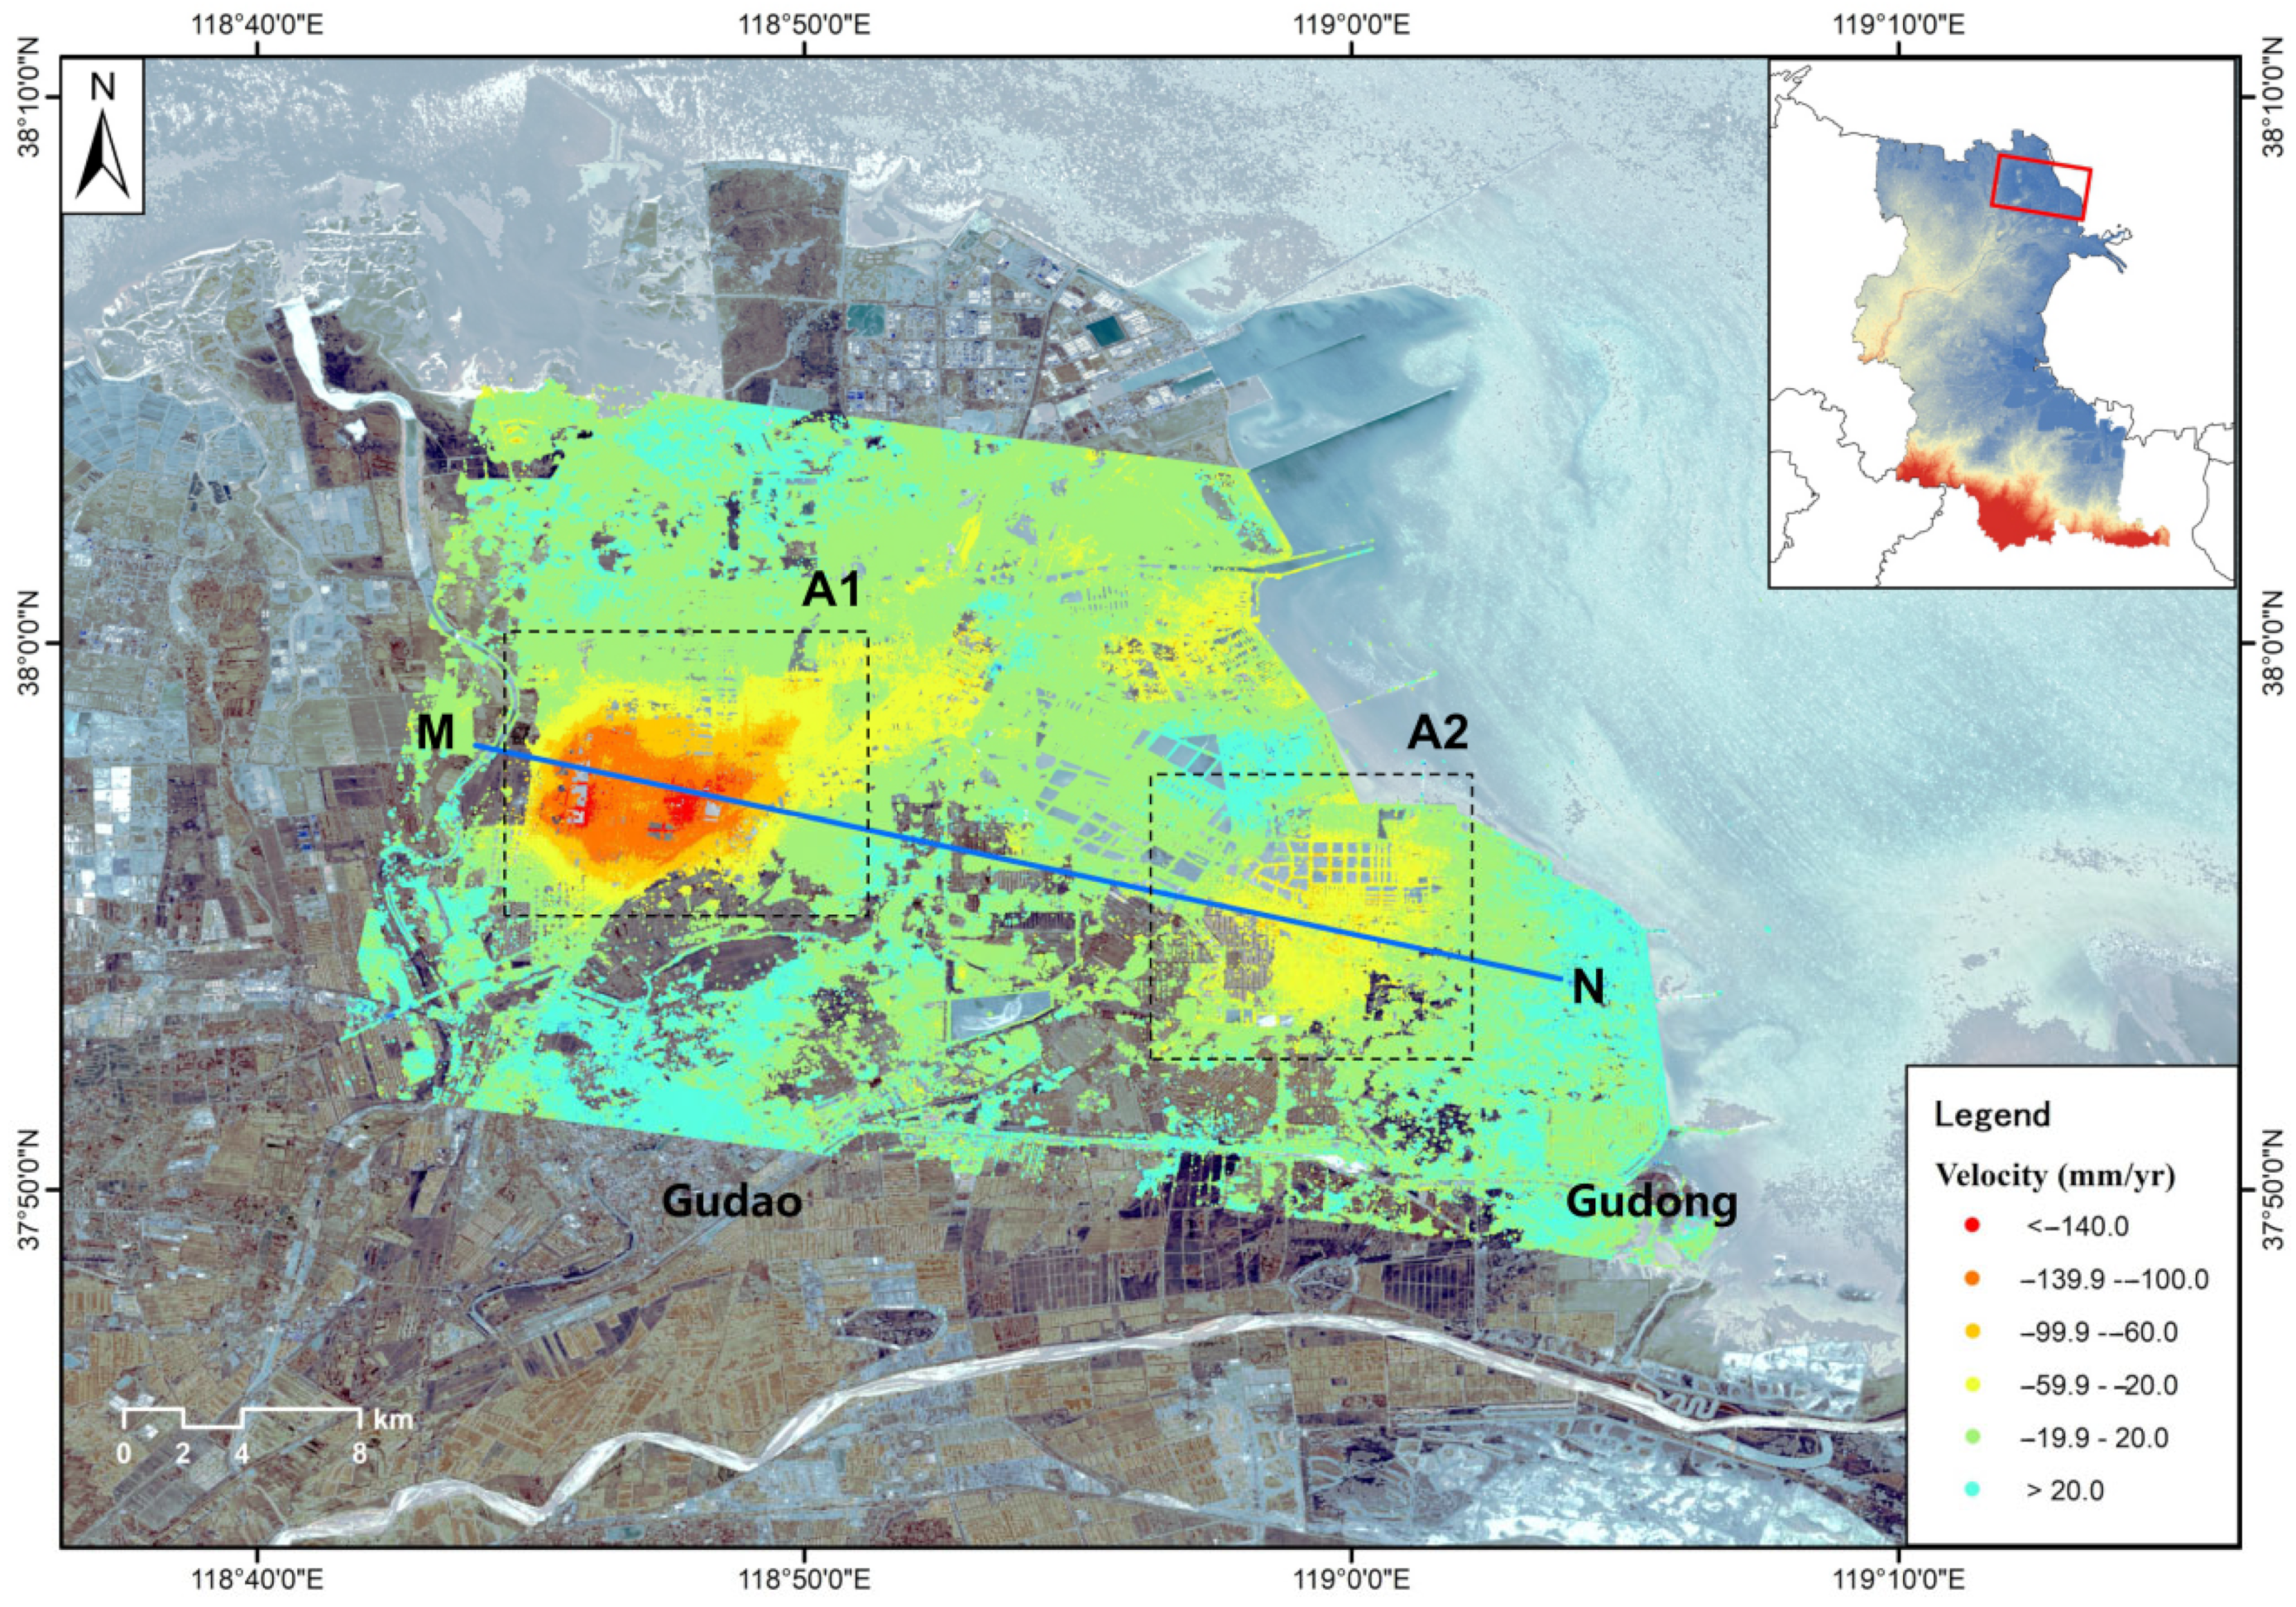
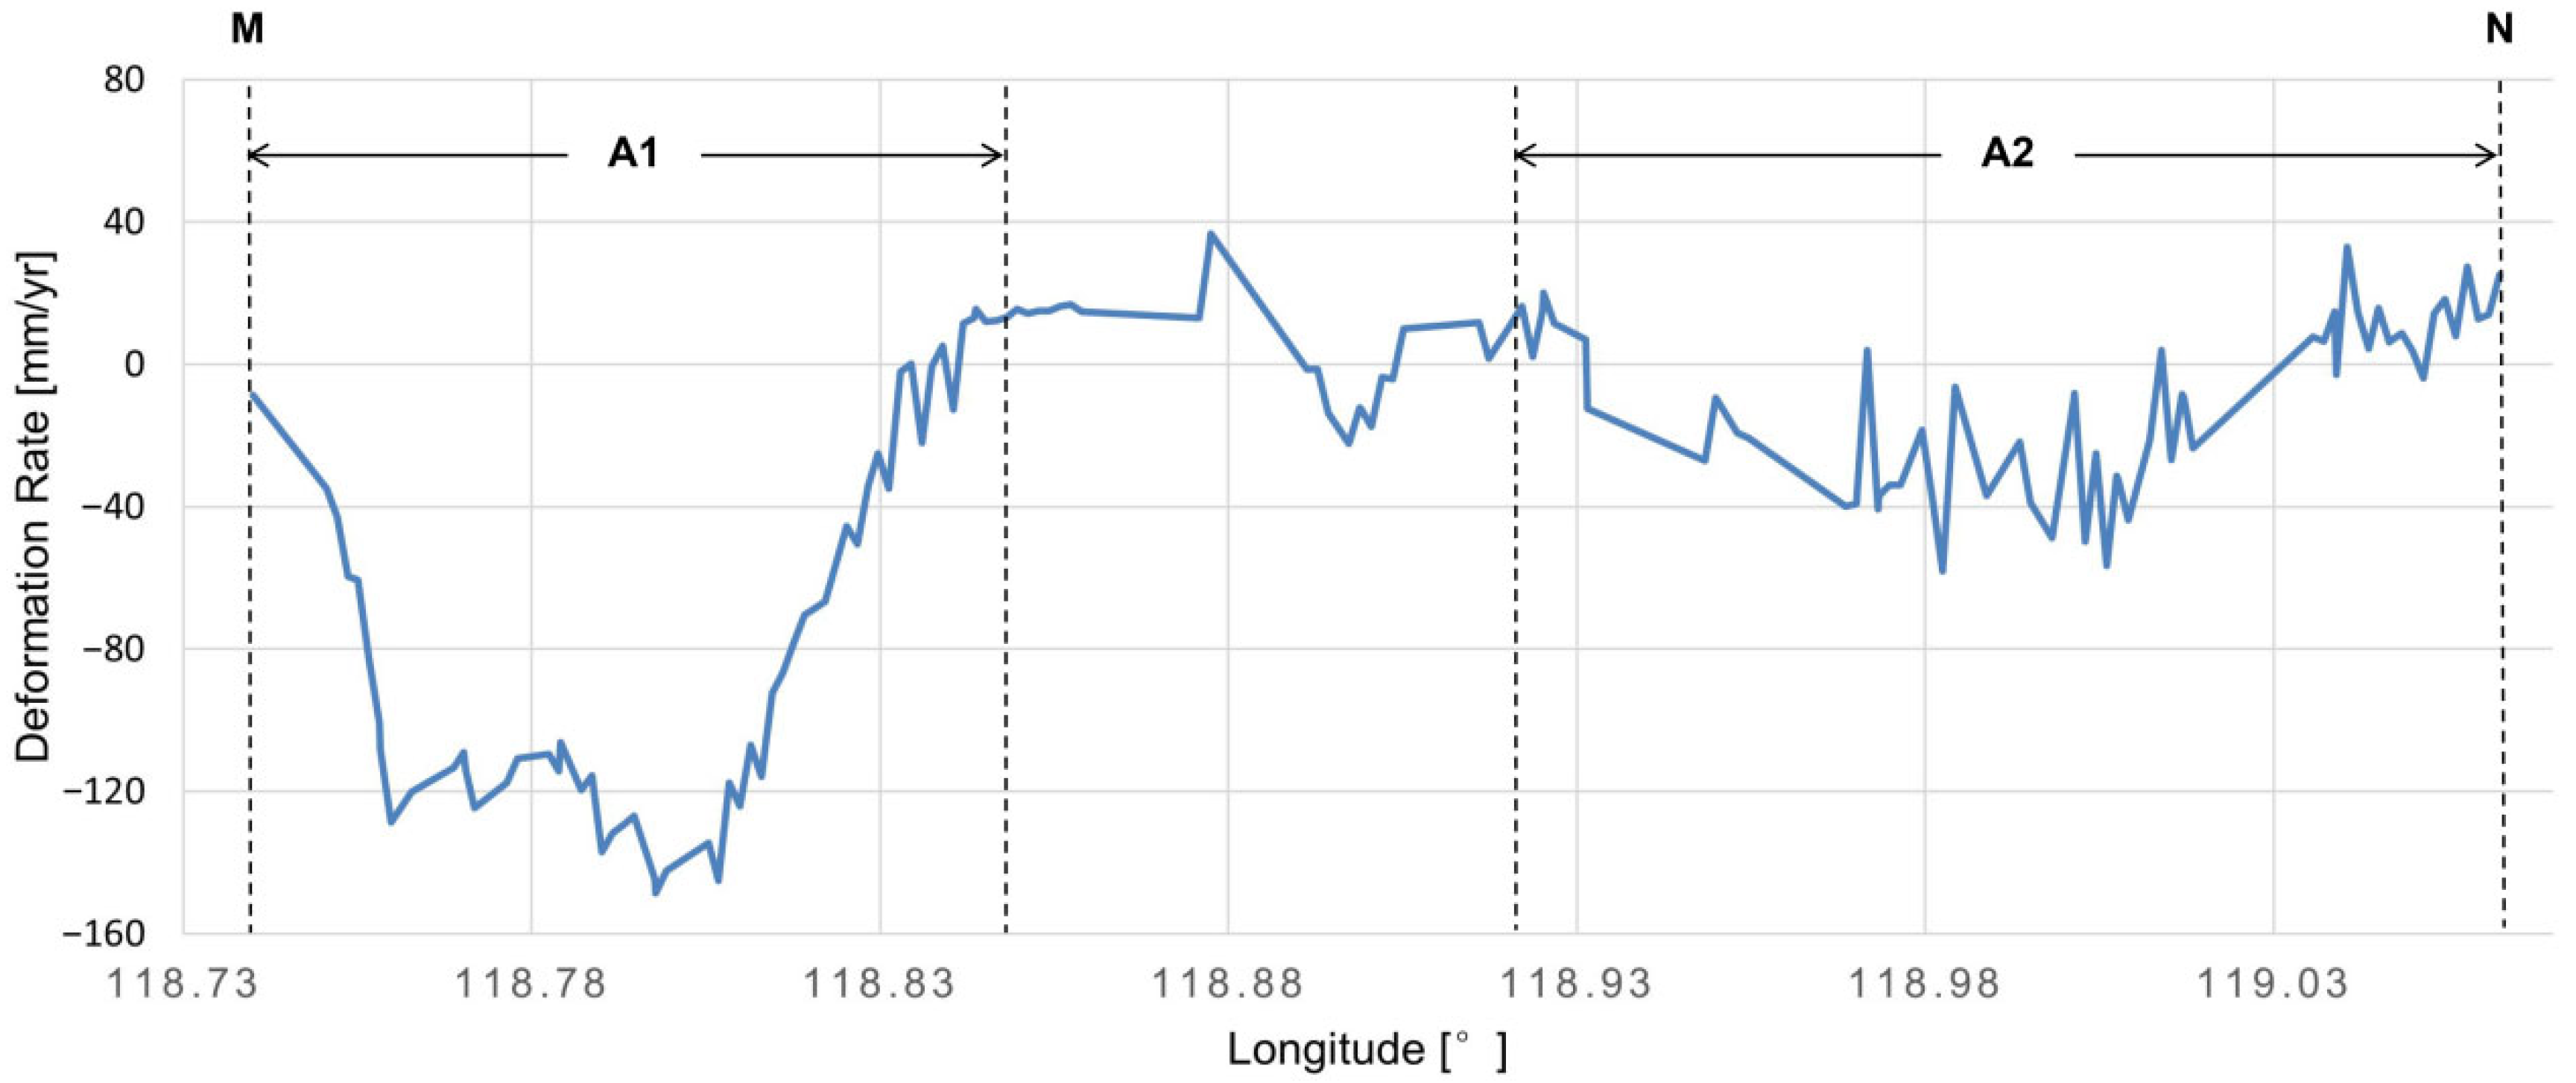
Since the discovery of the Gudao Oilfield in the 1960s and the Zuangxi and Gudong Oilfields in the late 1980s, long-term oil extraction and substantial land subsidence have occurred in these areas [35,61]. Both regions A1 and A2 are located within typical oilfield areas. The average annual subsidence rate in the area is shown in Figure 9, as the InSAR results indicated that there were two subsidence centers, regions A1 and A2, in this area, which did not coincide with the locations of the Gudao and Gudong Oilfields, respectively. Region A1 is located hard to the north of the Gudao Oilfield, and region A2 is located on the southwestern side of the Gudong Oilfield. Regions A1 and A2 exhibited average subsidence rates of −40 and −4 mm/yr, respectively, with maximum subsidence rates of −221 and −108 mm/year, respectively. A profile of the InSAR deformation rate is plotted along the blue solid line MN through regions A1 and A2 in Figure 9 (as depicted in Figure 10). According to the extracted results, the deformation rates in regions A1 and A2 were found to be much higher than those in the oilfields.
As revealed in previous studies, high-intensity oil and gas extraction leads to long-term land subsidence. Land subsidence, caused by reservoir decompression as a result of oil and gas extraction, has also been reported in other deltas and coastal areas [59,61]. Although oil and gas overexploitation could lead to a certain amount of ground subsidence, extraction is often followed by artificial water injection into the extracted fields, significantly impeding the ground subsidence process. One of the reasons for subsidence in these two areas is groundwater overextraction. Additionally, it was found that a form of oil extraction combined with saltwork development was often adopted in near-coastal areas [35]. While oil is extracted, the underground brine, after salt production, is reinjected to compensate for the oil pumping deficit. The simultaneous extraction of oil and gas, brine, and shallow groundwater from different strata dramatically exacerbated land subsidence in this region. Significant groundwater extraction could decrease the pore water pressure in areas with less consolidated or semiconsolidated soil. As a result of the decreasing hydrostatic pressure, the soil layers experienced consolidation and compaction, resulting in land subsidence [61]. Moreover, the sediment deposition process of the Yellow River and construction activities could increase the surface load and cause ground subsidence.
It should be noted that the greatest sedimentation rate in the A1 area from 2016 to 2017 was 449.7 mm/yr, which was significantly far from the number given in this study [35]. This phenomenon occurred because the Gudao Oilfield began using a new oil-production technique in 2019, which reduced water consumption in the oil recovery process. Based on the previous analysis, it is apparent that reducing water consumption in the oilfield reduces groundwater extraction in the surrounding area, resulting in a decrease in the rate of ground subsidence.

4.4.3. Sediment Consolidation and Compaction

Land subsidence in the Yellow River Delta may also be exacerbated by the consolidation and compaction of recent deposits, which are also important natural factors. A delta is prone to subsidence because the area receives a large volume of sediments, which can be compressed due to postdepositional consolidation, resulting in significant regional subsidence [69]. The sediment formation age is closely related to the spatiotemporal variation in land subsidence [70]. The more recently formed the delta sublobe is, the more significant the regional settlement [10,71]. Since the diversion of the Yellow River in 1855, a large amount of deltaic sediment has been deposited to form the modern Yellow River Delta. More than 50% of the modern Yellow River Delta is covered by soft soil, which is characterized by high compressibility and is primarily composed of saturated or near-saturated clay, silt, and mucky silt [61,69].
Previous studies on deltaic land subsidence in the Yellow River Delta focused on areas experiencing severe settlement associated with the consequences of sediment consolidation and compaction. These previous studies provided qualitative and quantitative analysis results [61,72]. Most of the cumulative settlement due to compaction in the study area occurred before 2000, and the subaerial delta has become more stable over time. However, due to the extensive development of soft soils in the Yellow River Delta, sediment consolidation remains a significant contributor to land subsidence [70,72,73].

5. Discussion

5.1. Performance Analysis of GPU-Accelerated Modules

The platform used in this experiment was an NVIDIA Tesla V100 GPU (Santa Clara, CA, USA). Tesla V100 adopts a new architecture in which the performance of a single GPU is equivalent to that of up to 100 CPUs. The platform contains 5120 CUDA cores and 32 GB/16 GB HBM2 of memory. We recorded the processing time of a standard Sentinel-1A image (three swaths and nine bursts in each swath) based on the GPU-accelerated algorithm described above (Table 1). In the same hardware environment, geometric coregistration took only 3 min using the method proposed in this paper, while it took 15 min using GAMMA and 30 min using ISCE. In addition, approximately 15 min was needed to process a pair of interferometry pairs with the results provided at an approximately 20 m resolution (with multi-look 5:1), while GAMMA needed 45 min.
In summary, compared with GAMMA software, the GPU-based InSAR fast time-series analysis method proposed in this paper reduced the generation of interferograms. In summary, our processing flow greatly reduced the generation of unnecessary temporary files compared to the GAMMA software, thus saving considerable time and storage space. Therefore, our workflow can significantly improve the processing efficiency of the Sentinel-1 TOPS data. Considering the three steps of geometric registration, resampling, and ESD in SAR interferometric processing, the GPUs were 30 and 150 times faster than multi- and single-threaded CPUs, respectively. A high speedup ratio could not be achieved due to the inclusion of many other factors (e.g., terrain phase removal, phase filtering, and phase unwrapping) that were not optimized in parallel in our method. However, compared with the above commonly used InSAR processing software, the algorithm proposed in this paper considerably shortened the data-processing time and could provide suitable application prospects.

5.2. Scalability Analysis of the Method

Studies have indicated that space-borne InSAR can monitor large-scale surface deformation [40,49,52]. High-coherence points are continuously distributed in space, and the deformation in the entire Yellow River Delta region and subsidence funnels can be obtained. In this paper, SHPS filtering was used to remove low-coherence areas such as farmland and water bodies and decoherent regions such as overlays and shadows, while homogeneous high-coherence points were retained. This approach could facilitate more accurate monitoring of complex scenes in coastal areas, thereby improving the accuracy of the results.
Previous experiments have verified that this method could significantly enhance the efficiency of the InSAR time-series analysis of Sentinel-1TOPS data while providing extensibility. To date, this method has been employed only for parallel optimization of individual steps in InSAR processing, while there are still many unoptimized steps. There remained considerable potential to improve the data-processing efficiency of the present method. In addition, the processing method in this paper is only suitable for the Sentinel-1 satellite, but can be extended to other medium- and high-resolution SAR satellites in the future.
However the method in this paper still suffers from satellite InSAR-related limitations whereby only the deformation component projected onto the LOS direction can be measured, so the deformation perpendicular to the LOS direction is hardly observed [74,75]. Although we utilized both the ascending and descending orbit SAR images for cross-validation purposes, the mechanism of channel deformation was not comprehensive enough. Therefore, a joint solution involving InSAR and multisource SAR image/ground-based datasets such as GPS or leveling is still crucial for comprehensive analysis of the deformation mechanism and factors causing deformation [76].

6. Conclusions

This paper presented a GPU-assisted fast InSAR processing method based on the process framework of SBAS-InSAR technology. This method employed a GPU to accelerate geometric coregistration, resampling, and ESD correction modules in InSAR processing algorithms. After differential interferogram generation, the SHPS algorithm masks the phase unwrapping results in the low-coherence region. Time-series analysis of full-resolution raster images was performed in the SAR coordinate system.
We applied the method proposed above to evaluate the stability in the Yellow River Delta and part of the coastal area of Laizhou Bay. Twenty-nine Sentinel-1 IW ascending SAR images and twenty-five descending images were used to detect surface displacements with a small multi-looking number across the study area. Moreover, the spatial distribution pattern and temporal variations in the ground displacement in this region from 2021 to 2022 were obtained, and the deformation in various areas was monitored and analyzed in detail. The InSAR results revealed stability in most of the study area, while a fraction of the region was affected by hydrocarbon exploitation in oilfields or underground water overextraction. The impact of groundwater overexploitation on regional land subsidence is notable.
For the purpose of multisource remote sensing interpretation of ground subsidence in the Yellow River Delta, our upcoming study will combine Sentinel-1 SAR data with other high-resolution satellite data such as GF-3, ALOS-2, and TerraSAR-X. Additionally, it is possible to gather some high-precision ground data such as GNSS or level data to confirm the accuracy of the monitoring results and the viability of the GPU-assisted InSAR processing framework suggested in this paper. It is also critical to improve the data processing efficiency to achieve near real-time SAR data processing, which is a key direction for future development.

Author Contributions

Conceptualization, H.D.; Methodology, H.D. and Y.L.; Software, Y.L. and B.L.; Validation, H.D., Y.L. and B.L.; Formal analysis, H.D.; Data curation, H.L.; Writing—original draft preparation, H.D.; Writing—review and editing, Y.L. and B.L.; Visualization, H.D.; Supervision, Y.L. and B.L.; Project administration, Y.L.; Funding acquisition, Y.L. All authors have read and agreed to the published version of the manuscript.

Funding

This research was funded by the National Key Research and Development Program of China (2021YFC3001903; the Gaofen Earthquake Monitoring and Emergency Application Demonstration (phase II) (31_Y30F09-9001-20/22); the National Natural Science Foundation of China (No. 41704051); and research grants from the National Institute of Natural Hazards, MEMC (Grant No. ZDJ 2019-17).

Institutional Review Board Statement

Not applicable.

Informed Consent Statement

Not applicable.

Data Availability Statement

The authors would like to thank the European Space Agency (ESA) for providing the Sentinel-1A SAR data and precise orbit information for free.

Acknowledgments

The authors would like to thank the anonymous reviewers for their time and constructive feedback in helping to improve the quality of this paper.

Conflicts of Interest

The authors declare no conflict of interest.

References

  1. Higgins, S.; Overeem, I.; Tanaka, A.; Syvitski, J.P.M. Land subsidence at aquaculture facilities in the Yellow River delta, China. Geophys. Res. Lett. 2013, 40, 3898–3902. [Google Scholar] [CrossRef]
  2. Liu, Y.; Huang, H.; Liu, Y.; Bi, H.; Zhang, Y.; Luo, Y. Monitoring of Land Subsidence and Impacts of Human Activities in the Yellow River Delta Using the Small Baseline Subset Method. Mar. Geol. Quat. Geol. 2016, 36, 173–180. [Google Scholar]
  3. Yang, Y.; Wang, R.; Zhou, Y.; Jiang, Y.; Wang, X. The interaction between land subsidence and urban development in China. In Proceedings of the Prevention and Mitigation of Natural and Anthropogenic Hazards due to Land Subsidence, Nagoya, Japan, 15–19 November 2015; pp. 471–474. [Google Scholar]
  4. Carlà, T.; Intrieri, E.; Raspini, F.; Bardi, F.; Farina, P.; Ferretti, A.; Colombo, D.; Novali, F.; Casagli, N. Perspectives on the prediction of catastrophic slope failures from satellite InSAR. Sci. Rep. 2019, 9, 1–9. [Google Scholar]
  5. Chaussard, E.; Amelung, F. Precursory inflation of shallow magma reservoirs at west Sunda volcanoes detected by InSAR. Geophys. Res. Lett. 2012, 39, gl053817. [Google Scholar] [CrossRef]
  6. Dong, J.; Liao, M.S.; Xu, Q.; Zhang, L.; Tang, M.G.; Gong, J.Y. Detection and displacement characterization of landslides using multi- temporal satellite SAR interferometry: A case study of Danba County in the Dadu River Basin. Eng. Geol. 2018, 240, 95–109. [Google Scholar] [CrossRef]
  7. Atzori, S.; Antonioli, A.; Tolomei, C.; De Novellis, V.; De Luca, C.; Monterroso, F. InSAR full-resolution analysis of the 2017-2018 M > 6 earthquakes in Mexico. Remote Sens. Environ. 2019, 234, 111461. [Google Scholar] [CrossRef]
  8. Zhang, L.; Ge, D.; Guo, X.; Liu, B.; Li, M.; Wang, Y. InSAR monitoring surface deformation induced by underground mining using Sentinel-1 images. Proc. IAHS 2020, 382, 237–240. [Google Scholar] [CrossRef]
  9. Lei, Y.; Gardner, A.; Agram, P. Autonomous Repeat Image Feature Tracking (autoRIFT) and Its Application for Tracking Ice Displacement. Remote Sens. 2021, 13, 749. [Google Scholar] [CrossRef]
  10. Liu, Y.; Liu, J.; Xia, X.; Bi, H.; Huang, H.; Ding, R.; Zhao, L. Land subsidence of the Yellow River Delta in China driven by river sediment compaction. Sci. Total Environ. 2021, 750, 142165. [Google Scholar] [CrossRef] [PubMed]
  11. Tang, W.; Zhao, X.; Motagh, M.; Bi, G.; Li, J.; Chen, M.; Chen, H.; Liao, M. Land subsidence and rebound in the Taiyuan basin, northern China, in the context of inter-basin water transfer and groundwater management. Remote Sens. Environ. 2022, 269, 112792. [Google Scholar] [CrossRef]
  12. Zhang, Q.; Wu, Y.; Guo, N.; Chen, C. Research on deformation characteristics of the 2021 Qinghai Maduo MS7.4 earthquake through coseismic dislocation inversion. Adv. Space Res. 2022, 69, 3059–3070. [Google Scholar] [CrossRef]
  13. Arangio, S.; Calo, F.; Di Mauro, M.; Bonano, M.; Marsella, M.; Manunta, M. An application of the SBAS-DInSAR technique for the assessment of structural damage in the city of Rome. Struct. Infrastruct. Eng. 2014, 10, 1469–1483. [Google Scholar] [CrossRef]
  14. Drougkas, A.; Verstrynge, E.; Van Balen, K.; Shimoni, M.; Croonenborghs, T.; Hayen, R.; Declercq, P.-Y. Country-scale InSAR monitoring for settlement and uplift damage calculation in architectural heritage structures. Struct. Health Monit. Int. J. 2020, 2020, 1475921720942120. [Google Scholar] [CrossRef]
  15. Mele, A.; Vitiello, A.; Bonano, M.; Miano, A.; Lanari, R.; Acampora, G.; Prota, A. On the Joint Exploitation of Satellite DInSAR Measurements and DBSCAN-Based Techniques for Preliminary Identification and Ranking of Critical Constructions in a Built Environment. Remote Sens. 2022, 14, 1872. [Google Scholar] [CrossRef]
  16. Li, S.; Xu, W.; Li, Z. Review of the SBAS InSAR Time-series algorithms, applications, and challenges. Geod. Geodyn. 2021, 13, 114–126. [Google Scholar] [CrossRef]
  17. Bonano, M.; Manunta, M.; Marsella, M.; Lanari, R. The extended sbas technique for generating full resolution ers/envisat deformation time-series. In Proceedings of the 30th IEEE International Geoscience and Remote Sensing Symposium (IGARSS) on Remote Sensing—Global Vision for Local Action, Honolulu, HI, USA, 25–30 June 2010; pp. 4616–4619. [Google Scholar]
  18. Lanari, R.; Mora, O.; Manunta, M.; Mallorqui, J.J.; Berardino, P.; Sansosti, E. A small-baseline approach for investigating deformations on full-resolution differential SAR interferograms. IEEE Trans. Geosci. Remote Sens. 2004, 42, 1377–1386. [Google Scholar] [CrossRef]
  19. Ojha, C.; Manunta, M.; Lanari, R.; Pepe, A. The Constrained-Network Propagation (C-NetP) Technique to Improve SBAS-DInSAR Deformation Time Series Retrieval. IEEE J. Sel. Top. Appl. Earth Obs. Remote Sens. 2015, 8, 4910–4921. [Google Scholar] [CrossRef]
  20. Manunta, M.; Yasir, M.; Buonanno, S.; Zinno, I.; Lanari, R.; Bonano, M. The parallel implementation of the full resolution SBAS-DInSAR processing chain for surface deformation analyses in extended urban areas. In Proceedings of the EGU General Assembly, Virtual Event, 4–8 May 2020; p. 20198. [Google Scholar]
  21. Nagler, T.; Rott, H.; Hetzenecker, M.; Wuite, J.; Potin, P. The Sentinel-1 Mission: New Opportunities for Ice Sheet Observations. Remote Sens. 2015, 7, 9371–9389. [Google Scholar] [CrossRef]
  22. Imperatore, P.; Pepe, A.; Sansosti, E. High Performance Computing in Satellite SAR Interferometry: A Critical Perspective. Remote Sens. 2021, 13, 4756. [Google Scholar] [CrossRef]
  23. Guerriero, A.; Anelli, V.W.; Pagliara, A.; Nutricato, R.; Nitti, D.O. Efficient implementation of InSAR time-consuming algorithm kernels on GPU environment. In Proceedings of the IEEE International Geoscience and Remote Sensing Symposium (IGARSS), Milan, Italy, 26–31 July 2015; pp. 4264–4267. [Google Scholar]
  24. Baier, G.; Rossi, C.; Lachaise, M.; Zhu, X.X.; Bamler, R. A Nonlocal InSAR Filter for High-Resolution DEM Generation from TanDEM-X Interferograms. IEEE Trans. Geosci. Remote Sens. 2018, 56, 6469–6483. [Google Scholar] [CrossRef]
  25. Yu, Y.; Balz, T.; Luo, H.; Liao, M.; Zhang, L. GPU accelerated interferometric SAR processing for Sentinel-1 TOPS data. Comput. Geosci. 2019, 129, 12–25. [Google Scholar] [CrossRef]
  26. Bonano, M.; Buonanno, S.; Ojha, C.; Berardino, P.; Lanari, R.; Zeni, G.; Manunta, M. A new implementation of full resolution SBAS-DInSAR processing chain for the effective monitoring of structures and infrastructures. In Proceedings of the EGU General Assembly, Vienna, Austria, 8–13 April 2017; p. 17809. [Google Scholar]
  27. Reza, T.; Zimmer, A.; Delgado Blasco, J.M.; Ghuman, P.; Aasawat, T.K.; Ripeanu, M. Accelerating Persistent Scatterer Pixel Selection for InSAR Processing. IEEE Trans. Parallel Distrib. Syst. 2018, 29, 16–30. [Google Scholar] [CrossRef]
  28. Liu, Y. Research on the monitoring and inversion of different-scale complex surface deformation with multi-temporal InSAR. Ph.D. Thesis, Chang’an University, Xi’an, China, 2018. (In Chinese). [Google Scholar]
  29. Farr, T.G.; Rosen, P.A.; Caro, E.; Crippen, R.; Duren, R.; Hensley, S.; Kobrick, M.; Paller, M.; Rodriguez, E.; Roth, L.; et al. The shuttle radar topography mission. Rev. Geophys. 2007, 45, G22B–0214. [Google Scholar] [CrossRef]
  30. Jiang, M.; Ding, X.; Li, Z. Homogeneous pixel selection algorithm for multitemporal InSAR. Chin. J. Geophys. 2018, 61, 4767–4776. (In Chinese) [Google Scholar] [CrossRef]
  31. Chen, C.W.; Zebker, H.A. Network approaches to two-dimensional phase unwrapping: Intractability and two new algorithms. J. Opt. Soc. Am. A Opt. Image Sci. Vis. 2000, 17, 401–414. [Google Scholar] [CrossRef]
  32. Li, Y.; Jiang, W.; Li, Y.; Shen, W.; He, Z.; Li, B.; Li, Q.; Jiao, Q.; Tian, Y. Coseismic Rupture Model and Tectonic Implications of the January 7 2022, Menyuan Mw 6.6 Earthquake Constraints from InSAR Observations and Field Investigation. Remote Sens. 2022, 14, 2111. [Google Scholar] [CrossRef]
  33. Wu, W. TOPS Interferometry with Sentinel-1; Wuhan University: Wuhan, China, 2016. (In Chinese) [Google Scholar]
  34. Yague-Martinez, N.; Prats-Iraola, P.; Gonzalez, F.R.; Brcic, R.; Shau, R.; Geudtner, D.; Eineder, M.; Bamler, R. Interferometric Processing of Sentinel-1 TOPS Data. IEEE Trans. Geosci. Remote Sens. 2016, 54, 2220–2234. [Google Scholar] [CrossRef]
  35. Cheng, X.; Zhang, Y.; Deng, M.; Wu, H.a.; Kang, Y. Recent surface deformation analysis of the Yellow River Delta based on Sentinel-1A SAR images. Sci. Surv. Mapp. 2020, 45, 43–51. (In Chinese) [Google Scholar] [CrossRef]
  36. Prats-Iraola, P.; Scheiber, R.; Marotti, L.; Wollstadt, S.; Reigber, A. TOPS Interferometry with TerraSAR-X. IEEE Trans. Geosci. Remote Sens. 2012, 50, 3179–3188. [Google Scholar] [CrossRef]
  37. Kampes, B.M.; Hanssen, R.F.; Perski, Z. Radar interferometry with public domain tools. In Proceedings of the FRINGE, Frascati, Italy, 1–5 December 2003. [Google Scholar]
  38. Sengupta, S.; Harris, M.; Zhang, Y.; Owens, J.D. Scan Primitives for GPU Computing. In Proceedings of the ACM SIGGRAPH/Eurographics Workshop on Graphics Hardware, San Diego, CA, USA, 4–5 August 2007; p. 97. [Google Scholar]
  39. Miranda, N. Definition of the TOPS SLC Deramping Function for Products Generated by the S-1 IPF; Technical Report; European Space Agency: Paris, France, 2014. [Google Scholar]
  40. Liu, G.; Chen, Q.; Luo, X.; Cai, G. InSAR Principles and Applications; Science Press: Beijing, China, 2019. (In Chinese) [Google Scholar]
  41. Ferretti, A.; Fumagalli, A.; Novali, F.; Prati, C.; Rocca, F.; Rucci, A. A New Algorithm for Processing Interferometric Data-Stacks: SqueeSAR. IEEE Trans. Geosci. Remote Sens. 2011, 49, 3460–3470. [Google Scholar] [CrossRef]
  42. Parizzi, A.; Brcic, R. Adaptive InSAR Stack Multilooking Exploiting Amplitude Statistics: A Comparison between Different Techniques and Practical Results. IEEE Geosci. Remote Sens. Lett. 2011, 8, 441–445. [Google Scholar] [CrossRef]
  43. Jiang, M.; Ding, X.; Li, Z. Hybrid Approach for Unbiased Coherence Estimation for Multitemporal InSAR. IEEE Trans. Geosci. Remote Sens. 2014, 52, 2459–2473. [Google Scholar] [CrossRef]
  44. Jiang, M.; Ding, X.; Hanssen, R.F.; Malhotra, R.; Chang, L. Fast Statistically Homogeneous Pixel Selection for Covariance Matrix Estimation for Multitemporal InSAR. IEEE Trans. Geosci. Remote Sens. 2015, 53, 1213–1224. [Google Scholar] [CrossRef]
  45. Papoulis, A.; Pillai, S.U. Probability, Random Variables and Stochastic Processes; McGraw-Hill Europe: New York, NY, USA, 2002. [Google Scholar]
  46. Baumgartner, W.; Weiss, P.; Schindler, H. A nonparametric test for the general two-sample problem. Biometrics 1998, 54, 1129–1135. [Google Scholar] [CrossRef]
  47. Li, Y. Surface Deformation, Co-Seismic and Post-Seismic Activity Constrained by Advanced in SAR Time Series Analysis; Institute of Engineering Mechanics, China Earthquake Administration: Beijing, China, 2014. (In Chinese) [Google Scholar]
  48. Berardino, P.; Fornaro, G.; Lanari, R.; Sansosti, E. A new algorithm for surface deformation monitoring based on small baseline differential SAR interferograms. IEEE Trans. Geosci. Remote Sens. 2002, 40, 2375–2383. [Google Scholar] [CrossRef]
  49. Zhu, J.; Li, Z.; Hu, J. Research Progress and Methods of InSAR for Deformation Monitoring. Acta Geod. Cartogr. Sin. 2017, 46, 1717–1733. [Google Scholar] [CrossRef]
  50. Liu, P.; Li, Z.; Hoey, T.; Kincal, C.; Zhang, J.; Zeng, Q.; Muller, J.-P. Using advanced InSAR time series techniques to monitor landslide movements in Badong of the Three Gorges region, China. Int. J. Appl. Earth Obs. Geoinf. 2013, 21, 253–264. [Google Scholar] [CrossRef]
  51. Sun, Q.; Zhang, L.; Ding, X.; Hu, J.; Li, Z.W.; Zhu, J.J. Slope deformation prior to Zhouqu, China landslide from InSAR time series analysis. Remote Sens. Environ. 2015, 156, 45–57. [Google Scholar] [CrossRef]
  52. Liao, M.; Zhang, L.; Shi, X.; Jiang, Y.; Dong, J.; Liu, Y. Methodology and Practice of Landslide Deformation Monitoring with SAR Remote Sensing; Science Press: Beijing, China, 2017. (In Chinese) [Google Scholar]
  53. Wang, R. Research on High-Resolution Ground Settlement Monitoring Technology Based on SBAS-InSAR; China University of Geosciences: Beijing, China, 2015. (In Chinese) [Google Scholar]
  54. Samsonov, S.; van der Kooij, M.; Tiampo, K. A simultaneous inversion for deformation rates and topographic errors of DInSAR data utilizing linear least square inversion technique. Comput. Geosci. 2011, 37, 1083–1091. [Google Scholar] [CrossRef]
  55. Hanssen, R.F. Radar Interferometry: Data Interpretation and Error Analysis; Springer: Berlin/Heidelberg, Germany, 2001. [Google Scholar]
  56. Zhang, L.; Liao, M.; Dong, J.; Xu, Q.; Gong, J. Early Detection of Landslide Hazards in Mountainous Areas of West China Using Time Series SAR Interferometry-A Case Study of Danba, Sichuan. Geomat. Inf. Sci. Wuhan Univ. 2018, 43, 2039–2049. (In Chinese) [Google Scholar] [CrossRef]
  57. Wright, T.; Parsons, B.; Fielding, E. Measurement of interseismic strain accumulation across the North Anatolian Fault by satellite radar interferometry. Geophys. Res. Lett. 2001, 28, 2117–2120. [Google Scholar] [CrossRef]
  58. Xiao, R.; Yu, C.; Li, Z.; Song, C.; He, X. General Survey of Large-scale Land Subsidence by GACOS-Corrected InSAR Stacking: Case Study in North China Plain. Proc. Int. Assoc. Hydrol. Sci. 2020, 382, 213–218. [Google Scholar] [CrossRef] [Green Version]
  59. Liu, Y.; Huang, H. Characterization and mechanism of regional land subsidence in the Yellow River Delta, China. Nat. Hazards 2013, 68, 687–709. [Google Scholar] [CrossRef]
  60. Liu, G. Research on Characteristics of Land Subsidence and Storm Surge and the Environmental Effects in the Huanghe River Delta; China Institute of Oceanology, Chinese Academy of Science: Beijing, China, 2010. (In Chinese) [Google Scholar]
  61. Zhang, J.; Huang, H.; Bi, H. Land subsidence in the modern Yellow River Delta based on InSAR time series analysis. Nat. Hazards 2015, 75, 2385–2397. [Google Scholar] [CrossRef]
  62. Liu, Y. Spatiotemporal Evolution of Land Subsidence and Mechanism Discussion in the Yellow River Delta; China Institute of Oceanology, Chinese Academy of Sciences: Beijing, China, 2013. [Google Scholar]
  63. Liu, Y. Land subsidence monitoring and correlation analysis with ground fluid exploitation using time series. In SAR Technique Over the Yellow River Delta (China); Institute of Oceanology, Chinese Academy of Sciences: Beijing, China, 2016. [Google Scholar]
  64. Mao, J.; Meng, L.; Su, Y.; Xu, J.; Ding, S. The study of ground settlement monitoring in Dongying area based on GPS. Geotech. Investig. Surv. 2014, 42, 56–59. (In Chinese) [Google Scholar]
  65. Liu, P.; Li, Q.; Li, Z.; Hoey, T.; Liu, Y.; Wang, C. Land Subsidence over Oilfields in the Yellow River Delta. Remote Sens. 2015, 7, 1540–1564. [Google Scholar] [CrossRef]
  66. Liu, G.; Huang, H.; Du, T.; Bie, J.; Chen, J. Effective factors of l and subsidence in the Yellow River Delta. Mar. Sci. 2011, 35, 43–50. [Google Scholar]
  67. Chen, J.; Zeng, Q.; Jiao, J.; Zhao, B. SBAS time series analysis technique based on Sentinel-1A TOPS SAR images: A case study of Yellow River Delta. Remote Sens. Land Resour. 2017, 29, 82–87. (In Chinese) [Google Scholar]
  68. Wang, H.; Zeng, Q.; Jiao, J.; Chen, J. InSAR Time Series Analysis Technique Combined with Sequential Adjustment Method for Monitoring of Surface Deformation. Acta Sci. Nat. Univ. Pekin. 2021, 57, 241–249. [Google Scholar]
  69. Shi, C.; Zhang, D.; You, L.; Li, B.; Zhang, Z.; Zhang, O. Land subsidence as a result of sediment consolidation in the Yellow River delta. J. Coast. Res. 2007, 23, 173–181. [Google Scholar] [CrossRef]
  70. Liu, Y.; Du, T.; Huang, H.; Liu, Y.; Zhang, Y. Estimation of sediment compaction and its relationship with river channel distributions in the Yellow River delta, China. Catena 2019, 182, 104113. [Google Scholar] [CrossRef]
  71. Zhang, J.; Huang, H.; Bi, H.; Wang, Q. Monitoring Ground Subsidence in the Modern Yellow River Delta Based on SBAS Time-series Analysis. Geomat. Inf. Sci. Wuhan Univ. 2016, 41, 242–248. (In Chinese) [Google Scholar]
  72. Zhang, Y.; Huang, H.; Liu, Y.; Liu, Y.; Bi, H. Spatial and temporal variations in subsidence due to the natural consolidation and compaction of sediment in the Yellow river delta, China. Mar. Georesour. Geotechnol. 2018, 37, 152–163. [Google Scholar] [CrossRef]
  73. Zhang, Y.; Huang, H.; Liu, Y.; Liu, Y. Self-weight consolidation and compaction of sediment in the Yellow River Delta, China. Phys. Geogr. 2018, 39, 84–98. [Google Scholar] [CrossRef]
  74. Ao, M.; Zhang, L.; Shi, X.; Liao, M.; Dong, J. Measurement of the three-dimensional surface deformation of the Jiaju landslide using a surface-parallel flow model. Remote Sens. Lett. 2019, 10, 776–785. [Google Scholar] [CrossRef]
  75. Dong, J.; Lai, S.; Wang, N.; Wang, Y.; Zhang, L.; Liao, M. Multi-scale deformation monitoring with Sentinel-1 InSAR analyses along the Middle Route of the South-North Water Diversion Project in China. Int. J. Appl. Earth Obs. Geoinf. 2021, 100, 102324. [Google Scholar] [CrossRef]
  76. Fan, H.; Wang, L.; Wen, B.; Du, S. A New Model for three-dimensional Deformation Extraction with Single-track InSAR Based on Mining Subsidence Characteristics. Int. J. Appl. Earth Obs. Geoinf. 2021, 94, 102223. [Google Scholar] [CrossRef]
Figure 1. The workflow of the full-resolution InSAR time-series analysis method in the SAR coordinate system.
Sustainability 14 10597 g001
Figure 2. The location of the study area and corresponding DEM. Black lines show the Tancheng–Lujiang fault zone.
Sustainability 14 10597 g002
Figure 3. The small baseline network. (a) Ascending (Path 69); (b) descending (Path 76).
Sustainability 14 10597 g003
Figure 4. The mean displacement velocity map obtained based on Sentinel-1 data from (a) ascending (Path 69) and (b) descending images (Path 76). A1–A8 indicate the unstable regions in the study area. The optical image of the study area adopted the 1 m resolution World TerraColor imagery provided by ArcGIS Earth.
Sustainability 14 10597 g004
Figure 5. The location of the study area and corresponding DEM.
Sustainability 14 10597 g005
Figure 6. The LOS deformation rate in the Guangbei Saltfield. The mean deformation velocity map was overlaid on a Landsat 8 Operational Land Imager (OLI) Thermal Infrared Sensor (TIRS) map after image fusion, and mosaicking revealed the topographic variation surrounding the study area.
Sustainability 14 10597 g006
Figure 7. The LOS deformation rate in the Yangkou Saltfield and surrounding chemical plants.
Sustainability 14 10597 g007
Figure 8. The LOS deformation rates at the Yanyuan Saltwork and Shuangwangcheng Reservoir.
Sustainability 14 10597 g008
Figure 9. The LOS deformation rate in the Gudong Oilfield.
Sustainability 14 10597 g009
Figure 10. The deformation rate profile ranges along MN.
Sustainability 14 10597 g010
Table 1. The runtime comparison of the GPU-accelerated geometric coregistration.
PlatformGeometric CoregistrationInterferogram Generation
ISCE30 min60 min
GAMMA15 min30 min
GPU-based3 min18 min
Publisher’s Note: MDPI stays neutral with regard to jurisdictional claims in published maps and institutional affiliations.