1. Introduction
Brazil is a country of continental size and has a maritime coastline of approximately 7400 km, connected to some navigable rivers, which characterizes it with a natural vocation for the practice of cabotage navigation [
1].
Cargo transportation by cabotage is an option to cheapen logistics costs when this mode of transportation is used to transport a significant volume of cargo.
Cargo transportation by cabotage is little used in Brazil, although its use has grown significantly in recent years. However, it is still far from what could be ideal due to the favorable conditions existing in the country.
Two factors can be determined to explain the limited use of cabotage in Brazil: the freight price, which is not as attractive as it is expected to be, and the preference of transporters for roads, due mainly to transport time, which is much shorter on roads. The freight price would undoubtedly be more rewarding, and carriers’ preferences would move more quickly from road to waterway, were the cabotage to transport a considerable cargo volume [
2].
Few scientific studies have been conducted to date on Brazilian cabotage. Generally, qualitative assessments have been performed about the cabotage industry. These assessments indicate alternative solutions to the problems, difficulties, and barriers detected [
1].
This study focused on another perspective: it aimed to quantify how satisfied users of Brazilian cabotage, particularly the containerized cargo segment, are with the services offered, based on gathered qualitative considerations from users of this mode of transport. With user satisfaction information, if this is positive, motivations are created so that new carriers begin to use cabotage to transport their products and thus reduce freight price and Brazil’s costs.
The containerized cargo segment differs from other types of cargo—solid bulk cargo, liquid and gaseous, and lost general cargo—because it is cargo with standardized packaging, which facilitates its transport, handling, and operation. As depicted by Borges et al. [
3], this type of cargo results from the technological evolution of global shipping that occurred in the 1960s, when the container first appeared, which promoted the specialization of container vessels, focused solely on the transport of containerized cargo.
In recent years, in Brazil, the containerized cargo segment has grown exponentially. The containerized cargo volume transported by cabotage grew from 5,191,629 tons in 2010 to 15,808,209 tons in 2019, an increase of 204.49% in the period, equivalent to an average growth of 13.17% per year [
4]. These data by themselves justify the realization of a study of this nature.
The methodology used for this study was the multicriteria decision aid (MCDA), based on the constructivist paradigm and with the collaboration of a team of cabotage specialists to build the assessment model. This methodology was chosen because it was understood to be adequate for the objectives of the study, that is, a complex scenario with a variety of criteria to be assessed.
3. Methodology
A multicriteria decision aid methodology (MCDA) was used to operationalize this work. The choice of an MCDA methodology for the study was due, primarily, to the need to use a robust and precise approach, given the importance that cabotage has for cargo transport in Brazil, both in economic and environmental terms, as well as other perceived benefits.
Another factor involved in the choice of a multi-criteria methodology was the combination of objectivity and subjectivity of the method, as well as the ease of use, as highlighted by Naegler et al. [
35], especially when multiple criteria or objectives need to be considered together [
36].
Considering our decision scenario where criteria have weights and the need to use a relative scale, the framework proposed by [
24] leads to the use of one of those methods: AHP, ANP, DEMATEL, MACBETH, and REMBRANDT. After analyzing some multicriteria methods, the MCDA methodology of the European school was chosen, or more precisely, the method proposed by Ensslin et al. that uses MACBETH [
37]. Another factor involved in the choice of this methodology was the variety of studies in logistics and maritime transport conducted based on MCDA methodologies, as also noted by Lorencˇicˇ et al. [
38].
To assess the degree of satisfaction of Brazilian cabotage users, a specific evaluation model was developed for this purpose. This model was based on the premises, assumptions, and epistemological foundations proposed by Ensslin et al. [
37], with necessary adjustments. The development of this model consisted of seven phases: definition of the label, identification of actors, identification of assessment elements, construction of descriptors, determination of value functions, definition of substitution rates, and construction of the value tree. Next, each of these phases will be discussed.
3.1. Label Definition
Considering that the goal of the study was to assess how satisfied cabotage freight transport users are with the services provided to them by operators in this transport segment, the title set for the model was: Assessment of the level of satisfaction of users of Brazilian cabotage—container cargo segment.
3.2. Actors Identification
The players that participate directly or indirectly in the decision-making process, contributing with suggestions for the model’s construction, are classified by Ensslin et al. [
37] into two groups: acted and intervening. The latter is composed of two categories: decision makers and facilitators. The actors contemplated in the model under analysis were the following:
Acted—the Brazilian cabotage users, who in this specific case will participate in the field research aimed at raising their awareness about the quality of the services provided by the shipping companies;
Decision makers—cabotage experts invited to contribute with their knowledge to the construction of the assessment model; and
Facilitators—the authors of the current work, who master the techniques and tools to obtain the necessary information to build the assessment model from the decision makers.
The decision-making team was made up of cabotage experts who were invited to collaborate with the facilitators in the preliminary phase of the study, namely:
A manager of a government agency dealing with water transport;
A manager of a cabotage shipping company;
A port manager;
Four managers of a waterway transport agency; and
A professor of a postgraduate program in transport.
These people contributed decisively to the construction of the model for assessing the degree of satisfaction of Brazilian cabotage users.
3.3. Assessment Elements Identification
The assessment elements constitute the basis of the evaluative process. Ensslin et al. [
37] proposed a set of steps for the identification of the elements as follows: (i) identification of the primary elements of evaluation (PEE); (ii) construction of cognitive maps; and (iii) identification of the fundamental points of view (FPV).
The primary elements of evaluation are the initial step in arriving at the cognitive maps. These, in turn, provide the identification of the fundamental viewpoints that, in the final analysis, are the main objective of this stage. The FPVs are at the head of the primary evaluation axes as criteria and correspond to the aspects considered by decision makers as essential to the evaluation process. FPVs are the key points that will compose the larger scope of the evaluation model.
Interviews and brainstorming sessions were held with the decision makers to identify the primary evaluation elements capturing knowledge and perceptions on the theme under analysis. The data collected were computed and treated by the facilitators, resulting in a preliminary proposal submitted to the decision makers and adequately adjusted by them.
Seven assessment axes were identified: level of service, cargo safety, cabotage routes, transportation cost, general aspects of transportation, quality of information provided by Brazilian shipping companies (EBNs), and intermediary agents and other aspects related to transportation. These assessment axes were initially characterized as FPV candidates. To be accepted as an FPV candidate, they need to fulfill the following requirements: be essential, controllable, complete, measurable, non-redundant, concise, understandable, isolable, and operational [
15,
25].
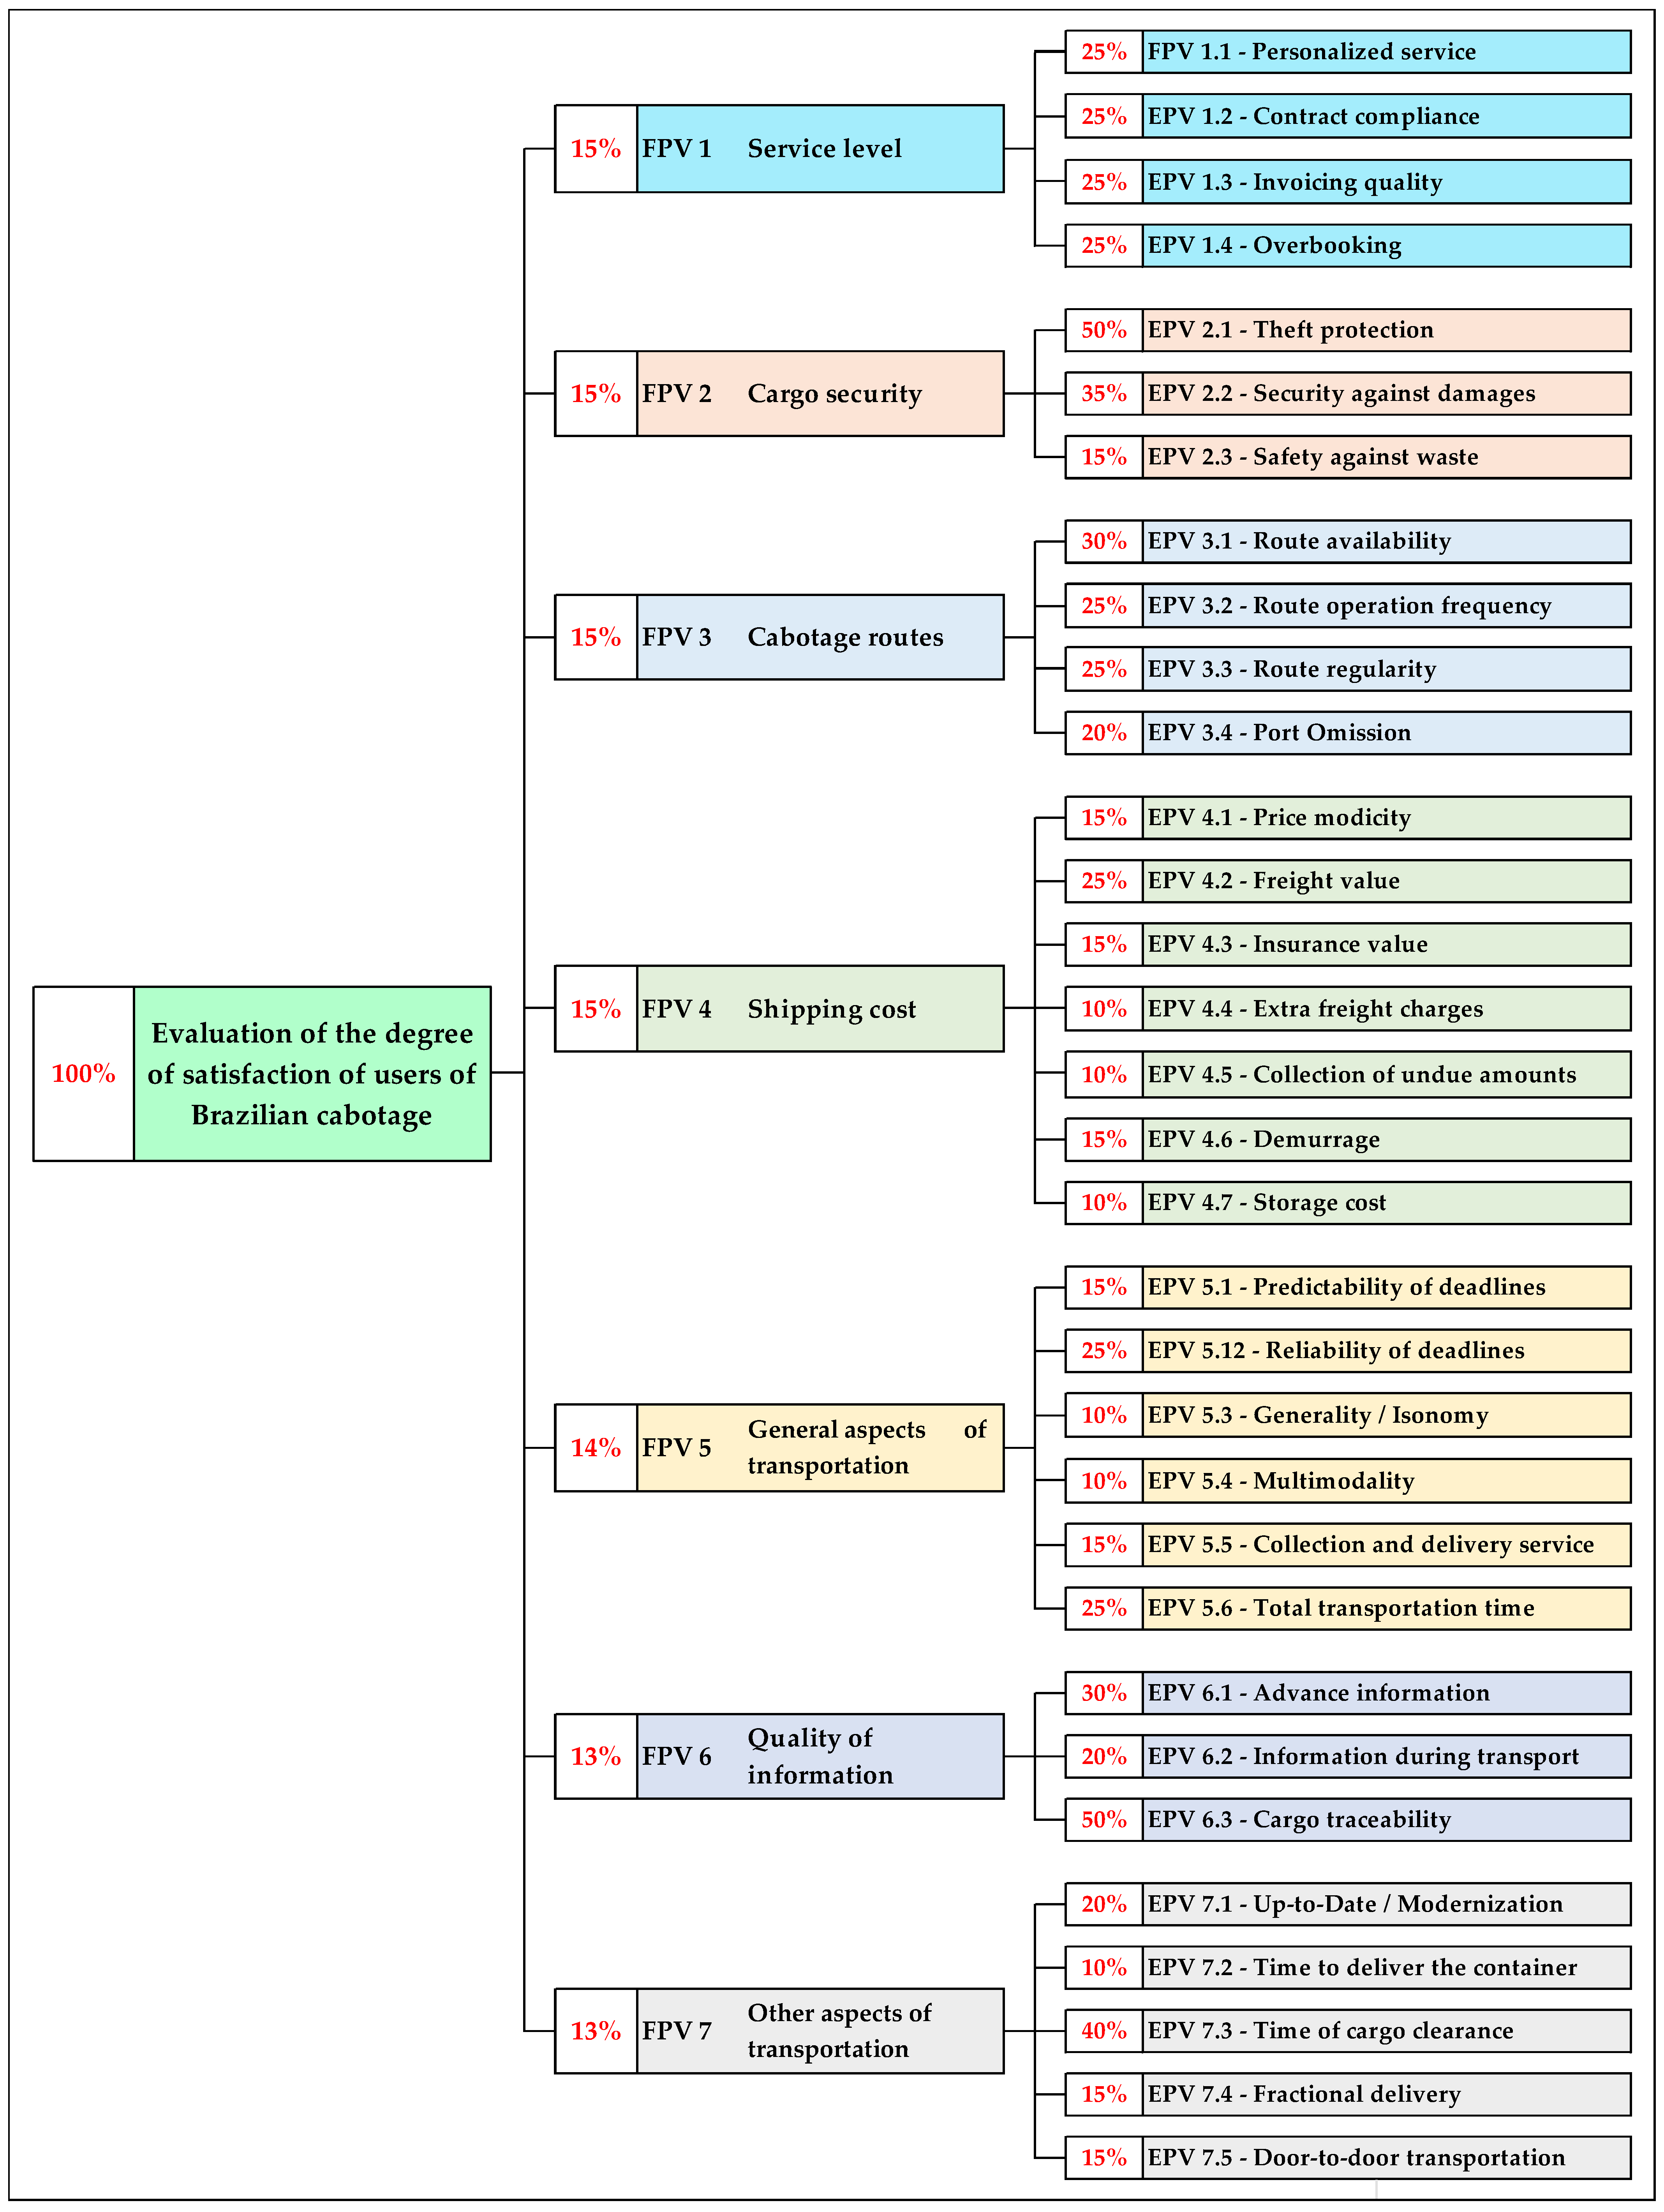
Once it was found that the set of FPV candidates met all the properties indicated in the previous paragraph, they became a family of FPVs, which will be the basis of the multi-criteria assessment model used in this study. Each FPV, due to its complexity, was broken down into elementary points of view (EPV) and became part of the basic structure of the assessment model, which, after being validated by the decision makers, was defined according to the value tree shown in
Section 3.6.
3.4. Descriptors Construction
For each assessment axis, which extends from FPV to FPV, an assessment instrument must be built, consisting of two tools: a descriptor and a value function [
1]. A descriptor corresponds to a set of impact levels (IL) intended to describe the plausible performances of criteria and sub-criteria. The value functions will be dealt with in the next sub-item. As all criteria (FPVs) were broken down into sub-criteria (EPVs) in the current study, descriptors were defined only for these.
According to the actors’ value systems, this study defined five impact levels in descending order for each descriptor ranked in terms of preference. The most attractive corresponds to the action with the best possible performance, and the least attractive level corresponds to the worst. For most of the EPVs in the assessment model, a single descriptor was defined based on the Likert scale, as seen in
Table 3.
For the EPVs that did not support this type of descriptor, such as the EPV regarding overbooking, among others, we defined other appropriate descriptors for each case.
It is stressed that the levels of impact of the descriptors correspond to the alternative answers of the survey used in the field research. In other words, for each EPV, a multiple-choice question was prepared, whose answers corresponded to the levels of impact of the respective EPV.
3.5. Value Function Determination
According to the decision makers’ value systems, the value functions are tools intended to quantify the performance of criteria or sub-criteria (potential actions) [
37]. They are also mathematical representations, through graphs or numerical scales, of the attractiveness of each level of impact, concerning a scale that is anchored in previously fixed levels, based on the value systems of the decision makers [
24].
There are several methods in the literature that can be used for the construction of value functions. In this study, the method called semantic judgment was employed, which was considered by Quirino [
25] as suitable to assist the decision maker in the articulation of their preferences during the assessment of a given point of view.
The construction of value functions using the semantic judgment method is based on pairwise comparisons of the difference in attractiveness between impact levels for each potential action. These comparisons are made by asking the decision maker to qualitatively express, using a semantic ordinal scale (with words), the intensity of preference for one level of impact over another [
25].
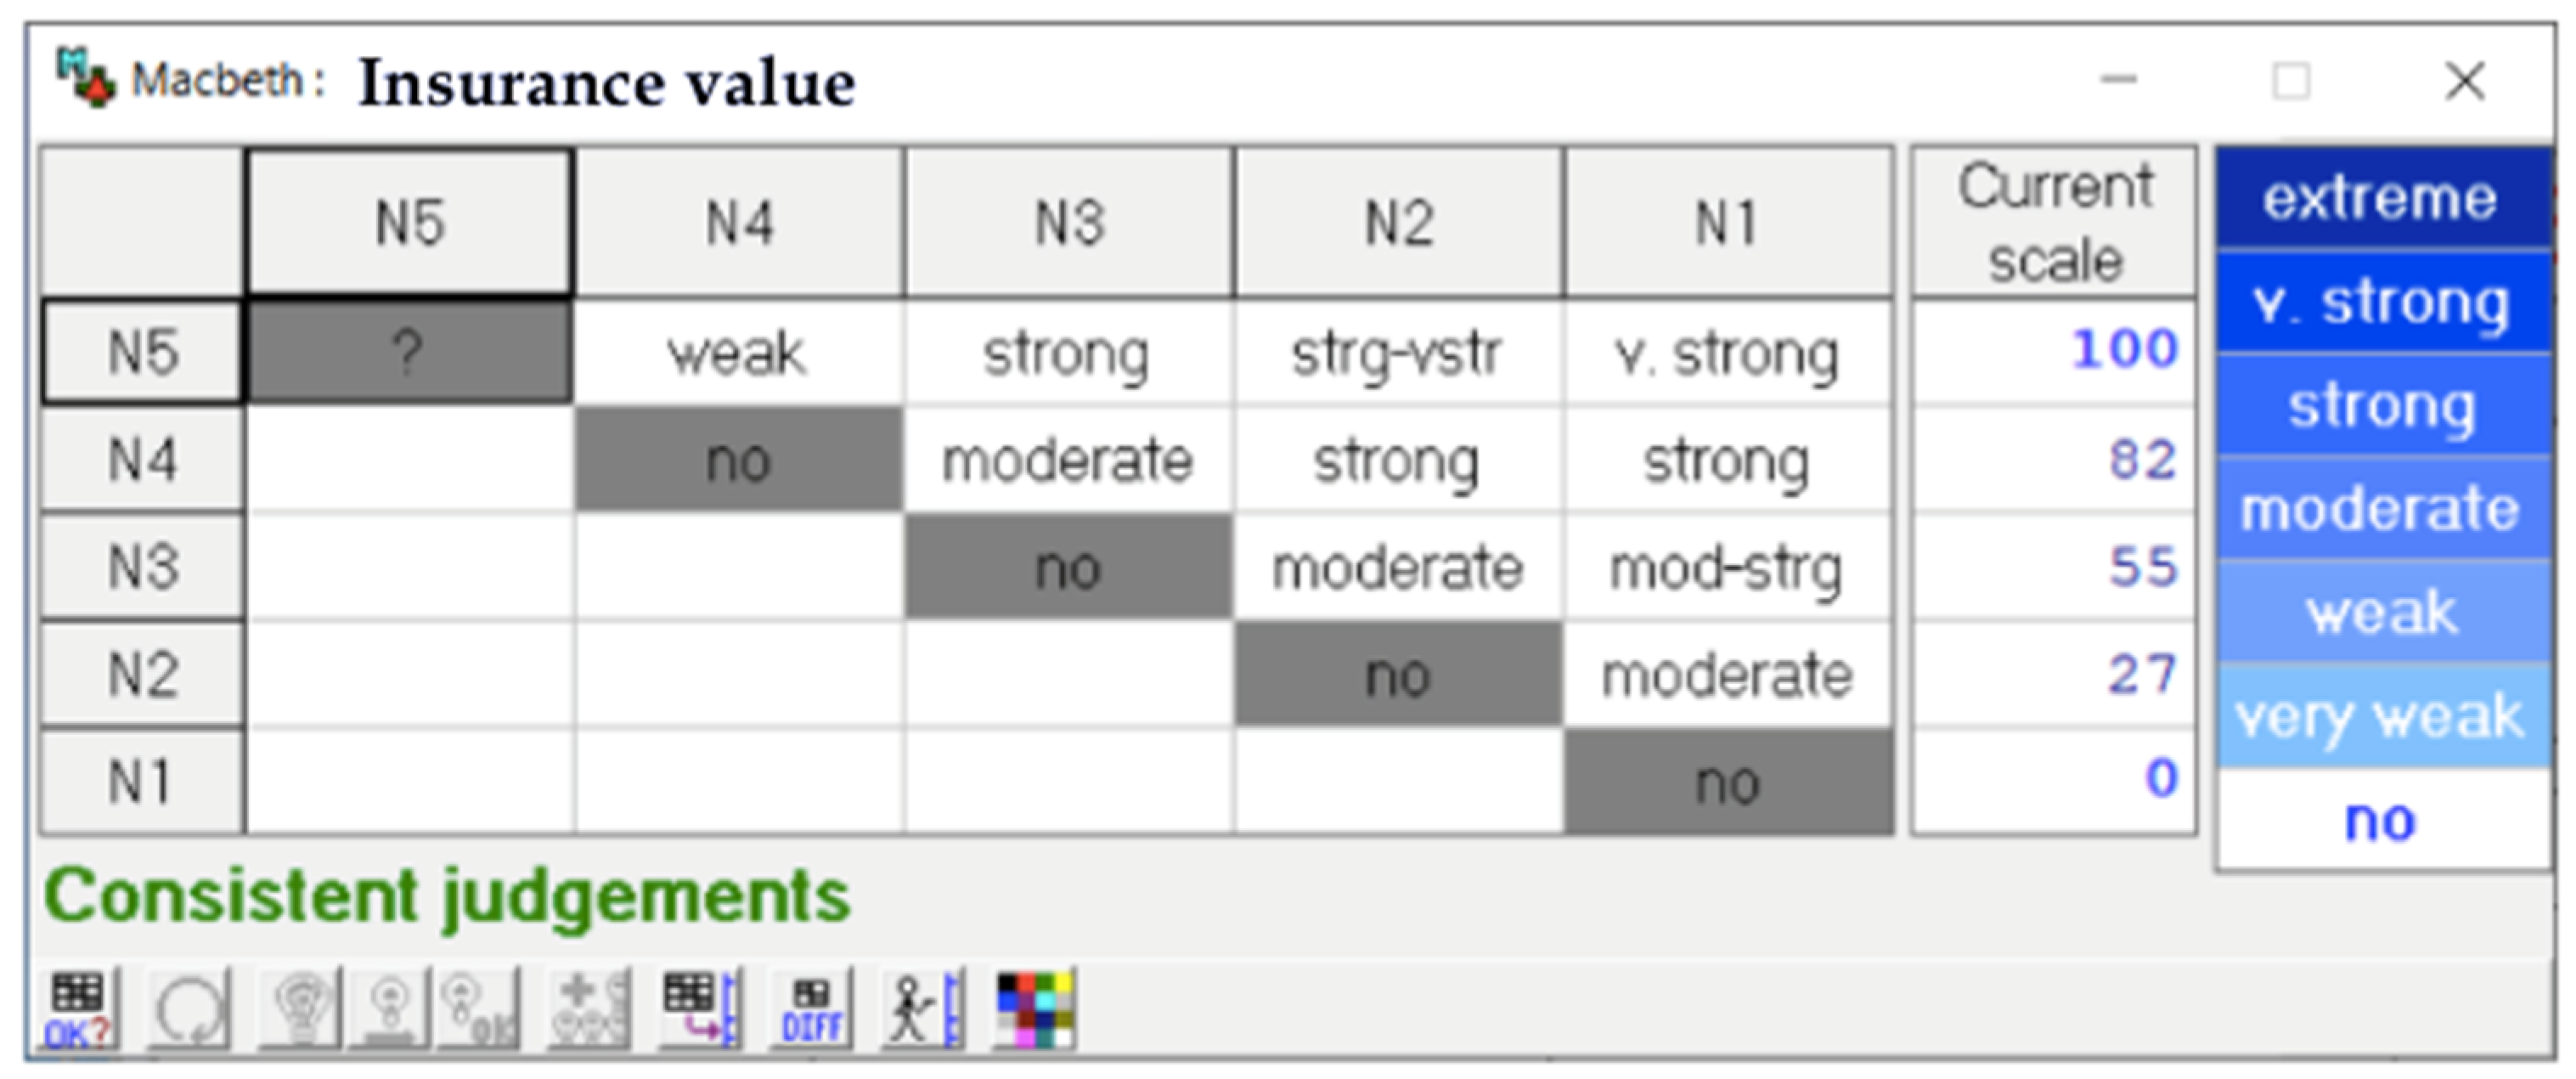
Semantic judgment was operationalized by the measuring attractiveness by a categorical-based evaluation technique (MACBETH), developed by Bana e Costa and Vanisck [
39]. This method uses linear programming to determine the value function (numerical value) that best represents the decision makers’ judgments [
40]. Bana e Costa, Corte, and Vansnick [
39] offer further details on the MACBETH software.
In the present study, MACBETH was used to determine the value functions, with the support of the Hiview3 software, developed by Catalyze Ltd., which incorporates MACBETH.
Figure 1 shows as an example the MACBETH screen with the semantic matrix concerning the determination of the value function of insurance value. The current scale column indicates the value function.
Gomes [
41] points out that, as soon as a value function is associated with an FPV, it can be called a criterion, and its EPVs can be called sub-criteria.
3.6. Definition of Replacement Rates
The replacement rates, also called compensation rates, or simply weights, express the loss in performance that one criterion or sub-criterion must lose to compensate for the gain in another so that its global value remains unchanged [
15,
42,
43,
44]. Several methods can be used to determine the substitution rates. In this study, the swing weights method was used to determine the replacement rates of the FPVs (criteria) and the pairwise comparison method for the EPV (sub-criteria), as defined by Quirino [
25].
The determination of the criteria substitution rates using the swing weights method consisted of two steps: (i) ranking of the FPVs by order of preference according to the value judgment of the decision makers; and (ii) definition of the respective substitution rates.
We used the Roberts matrix to conduct FPV ranking [
45], which compares all criteria against each other, pair by pair, to determine a score for each criterion, whose orders of magnitude will choose the ranking.
The score of the matrix elements to rank the FPVs is obtained as follows: if a criterion
bi (meaning criterion b is in row (i)) is preferred to criterion
cj (meaning that criterion c is in column j), then the element of the ranking matrix
bij = 1 and the element
cji = 0, where
i,
j = 1, 2, 3, 4, 5, 6 and 7 (number of criteria). When the matrix is finished filling, the values of each row i are added. The row with the highest numerical value of preferences corresponds to the most attractive criterion, and the row with the lowest numerical value indicates the least attractive criterion. Next, the matrix is ordered in descending order of preference (attractiveness). In symbolic terms, this property is represented as follows:
Table 4 presents the Roberts matrix with the ordering of the FPVs contained in the evaluation model.
The next step consisted of defining the replacement rates of these criteria based on the following chaining: the most attractive criterion, according to the value judgments of the decision makers, received a score of 100, and the other FPVs were assigned points in descending order, always compared to the most attractive FFV.
In the present case, the decision makers understood that FPVs 1, 2, 3, and 4 were at the same level of importance, as were FPVs 6 and 7, so criteria with the same level of importance have the same score.
Table 5 presents the final score of the FPVs, the method of calculating replacement rates, and such rates from the respective criteria.
The determination of EPVs’ replacement rates followed the same procedure adopted to determine FPVs’ replacement rates: first, sorting the EPVs in order of preference according to the value judgment of decision makers; then, determining the respective replacement rates, by estimation, from the pairwise comparison of the EPVs of the same FPV.
3.7. Construction of the Value Tree
After defining the basic structure of the assessment model, a value tree was built, which consists of a tree diagram of the defined structure, composed of the criteria, sub-criteria, and their respective weights, as shown in
Figure 2.
After the demonstration of the elaboration of the valuation model is concluded, the procedures for calculating the valuations and performing the sensitivity analysis will be presented next.
3.8. Procedures for Calculating Assessments
As discussed in previous items, the final objective of this study was to structure an assessment model to assess the degree of satisfaction of the users of Brazilian cabotage. The following equations were used to transform the qualitative data (as a result of the field research) into quantitative. The results express a value on a scale from zero to ten, which represents the degree of satisfaction of the Brazilian cabotage’s users with the quality and readiness of the services offered.
The data treatment of the research was carried out with Hiview3 software (Winchester, UK), which defined the ratings of the assessment criteria based on the defined model, and from these assessments, the global assessment was calculated through an additive aggregation formula given by the following equation adapted from Ensslin et al. [
37]:
where:
This equation is subject to the following restrictions:
The sum of the replacement rates must equal 1 (x1 + x2 + … + x7 = 1);
The value of the replacement rates must be greater than zero and less than 1 (1 > xi > 0 for i = 1, 2, …, 7).
This formula is adequate to calculate the global assessment (final score) from the data collected during the research after being tabulated and treated by the Hiview3 software.
As far as the calculation of criteria assessments is concerned, the procedure adopted is similar to that indicated above, as it corresponds to the weighted average of sub-criteria assessments. These, on the other hand, have their assessments calculated directly by Hiview3 from the value functions imputed to the answers of the field research surveys.
3.9. Sensitivity Analysis
Although the assessment model was designed with dedication and care by the decision makers when defining its parameters, it remains unclear to what extent it is solid enough to lend credibility to the assessment result. It was therefore crucial to perform a sensitivity analysis, which could only be performed after the field research was conducted and the data were adequately treated based on the assessment model developed.
The sensitivity analysis of the assessment model was performed based on the variation in the criteria substitution rates (FPV) of 10% more and less, as proposed by Ensslin et al. [
37], changing the parameters of these rates and verifying the impact that occurs in the global assessment.
4. Presentation and Analysis of the Research Data
The field research was conducted in April and May 2021 via telephone interviews with representatives of companies that transport cargo by cabotage. The interview followed a structured script based on the evaluation model presented in
Section 3. In total, 157 companies use Brazilian cabotage to transport their products. Almost all of these companies were contacted, but only 22 companies volunteered to answer the survey.
The number of companies that participated in the survey corresponds to 14% of the total number of companies using Brazilian cabotage. This percentage is significant and gives credibility to the result of the study, given the characteristics and peculiarities of the methodology used.
Table 6 displays the results of the sub-criteria, criteria, and global assessments after the data were analyzed by using the Hiview3 software:
The results were analyzed by FPV and, at the end, the overall assessment will be discussed.
4.1. FPV 1—Service Level of Shipping Companies
This FPV contains four sub-criteria with significant impacts on cabotage customer satisfaction concerning the services offered to them, which are: 1.1—personalized customer service by the cabotage shipping companies; 1.2—fulfillment of transport contracts; 1.3—quality of the invoicing by the cabotage shipping companies; and 1.4—overbooking practiced by the shipping companies. These sub-criteria have a weight of 25% in the composition of the criterion assessment.
This criterion had a low assessment, achieving a score of 6.53 on a scale of 0 to 10. The overbooking criterion was assessed with a score of 5, demonstrating dissatisfaction with this practice, proving common practice on the part of cabotage shipping companies. This causes inconvenience to cabotage users since it results in a total transportation time superior to that initially expected.
Personalized customer service and contract compliance were evaluated with relatively good scores—7.3 and 7.5, respectively—showing a reasonable satisfaction of the cabotage users with these items.
The invoicing quality sub-criterion was lower than the first two sub-criteria. This shows that this activity presents problems, which causes problems for both cabotage users and the shipping companies themselves. The shipping companies need to improve their invoicing practices, which will improve the service-level quality.
These results show that the cabotage shipping companies should invest in improving customer service to enhance customer satisfaction and increase the volume of cargo transported by cabotage. Additionally, they should pay attention to the more effective compliance with transport contracts, implement invoicing activities that improve the quality of this service, and, above all, abandon the practice of overbooking, as it causes inconvenience to customers and is harmful to the modal.
4.2. FPV 2—Cargo Security
Cargo security is a relevant aspect in cabotage and is its central differential due to the intrinsic characteristics of this type of transport, characteristics that inhibit theft and detour and have a low rate of damage and waste; the three aspects addressed by FPV 2.
This criterion scored 9.13, strongly driven by EPV 2.1—cargo security against theft and robbery—which contributes with a weight of 50% to the FPV assessment and received the maximum score: 10.0. The other sub-criteria, EPV 2.2—cargo security against damage—with a weight of 35% and EPV 2.3—cargo security against waste—with a weight of 15%, were evaluated, respectively, with scores of 8.1 and 8.6. Although 100% secure against theft and robbery, this shows that the cargo transported by cabotage presents some insecurity concerning damage and waste.
Regarding theft protection, the only concern of the cabotage shipping companies should be to maintain the status quo. Regarding the other aspects, despite having been well evaluated, they deserve attention from the shipping companies when implementing measures aimed at reducing damage and waste, which will further improve the quality of service of this type of transport and contribute to the increase of new users.
4.3. FPV 3—Cabotage Routes
The routes operated by the shipping companies for cabotage constitute one of the main differentials of this modal. The longer transport time concerning other modalities reduces its attractiveness; if there is no significant choice of routes, customers end up distancing themselves more and more from cabotage.
This FPV has four sub-criteria: EPV 3.1—route availability; EPV 3.2—route operating frequency; EPV 3.3—route regularity; and EPV 3.4—port omission. The first three sub-criteria were well evaluated, with 7.3, 8.4, and 8.3 scores, respectively. The last sub-criterion obtained a score of only 3.4, which was the lowest score among all the evaluated sub-criteria, rating FPV 3 with a score of 7.05.
The weights of the sub-criteria for the assessment of FPV 3 are relatively close, with a slightly higher emphasis on EPV 3.1, with 30%; the next two EPVs, 3.2 and 3.3, contribute a weight of 25% each, while EPV 3.4 contributes a weight of 20%.
Although this FPV was rated relatively well, it could have been rated better if port omission was not a common practice. However, port omission is a strategy adopted by shipping companies to avoid delays in the total transportation time when a ship does not obtain authorization to dock in a given port due to the unavailability of a berth. Nevertheless, although beyond the control of shipping companies, this practice causes serious inconvenience to cabotage users.
Although the sub-criterion route availability has been well-evaluated, with a score of 7.3, shipping companies need to increase the number of routes available to cabotage clients, which requires significant investments, such as acquiring new equipment, among others.
Regarding the sub-criteria route operation frequency and regularity of routes, although they were also well-evaluated, they will tend to perform better with the acquisition of new vessels to increase the number of routes. The government should invest in expanding a port’s installed capacity, especially the cabotage docks. As for the sub-criterion port omission, for this practice to be reduced or eliminated, infrastructure investments by the government are needed to expand the installed capacity of ports, especially the expansion of docks for cabotage.
4.4. Shipping Cost
In theory, the cost of cargo transportation by cabotage should be much lower than the costs of other modes, given the volume of cargo transported by each ship. However, the reality is different because for this to happen, a significant volume of cargo would need to be transported regularly by this modal to offset the high investments and lower the cost of freight.
This FPV obtained the lowest score among the seven criteria evaluated, a score of 6.02. For assessment purposes, this criterion was broken down into seven sub-criteria, all with very similar weights, except for the one referring to the freight value, which was given a higher weight. The scores obtained by the sub-criteria were: EPV 4.1—price modicity (weight 15%) = 5.6; EPV 4.2—freight value (25%) = 6.9; EPV 4.3—insurance value (15%) = 8.1; EPV 4.4—extra freight charges (10%) = 4.1; EPV 4.5—collection of undue amounts (10%) = 5.2; EPV 4.6—demurrage (15%) = 5.5; and EPV 4.8—storage cost (10%) = 4.8.
In general, the scores for the sub-criteria were very low, except for the sub-criterion related to the insurance value, which was well-evaluated. This is because as the risk of theft and robbery is almost zero, and the risks of damage and waste are very low, the value of insurance, compared to the insurance of other modes, is much lower, which is one of the positive aspects of cabotage. The low assessment of the other sub-criteria reflects the dissatisfaction of the cabotage users with the prices practiced, especially regarding the extra freight charges.
The reduction in transport price invariably goes through the volume increase in containerized cargo transported by cabotage. This volume is still very low but has been growing significantly in recent years. With the expansion of the installed port capacity and the supply routes by the shipping companies, the cost of cargo transport by cabotage is likely to fall due to the entry of new players in this market, which, notably, has been occurring in recent years, according to Antaq [
4]. Lowering the cost of freight will undoubtedly reduce logistics costs and, consequently, reduce Brazil’s costs.
4.5. FPV 5—General Aspects of Transportation
This FPV encompasses the aspects directly related to cargo transportation itself. Its assessment was slightly low, 6.84, and reflects the weighted average of the six EPVs that comprise it, whose weights vary from 10 to 25%, as follows: EPV 5.1—predictability of deadlines, score 6.7; EPV 5.2—reliability of contracted deadlines, score 7.5; EPV 5.3—generality/isonomy with users, score 7.3; EPV 5.4—multimodality, score 6.9; EPV 5.5—collection and delivery service, score 6.6; and, finally, EPV 5.6—total transportation time, with a score of 6.2.
In practice, these aspects are some of the most interesting to cabotage customers, especially the total transportation time, which was evaluated with the lowest score. The extended total transportation time is an intrinsic characteristic of cabotage. However, due to the omission of ports, overbooking, and the cargo clearance time at the port of destination, this time becomes even longer, generating a negative image for the modal.
Shipping companies and public authorities should develop mechanisms to provide dynamism in aspects directly related to the transport itself for improving cabotage performance. This can also attract new supporters to this mode of transportation, considering that, according to Borges et al. [
3], promoting an increase in cabotage nationwide is a worthwhile investment.
4.6. FPV 6—Quality of Information Provided by EBNs and Intermediate Agents
Data regarding the cargo transported, such as its location and the estimated time of arrival at the destination, among others, are essential for cabotage customers. This FPV was rated with a score of 7.11, which is reasonably good but far from excellent, just acceptable. The scores for the three sub-criteria that compose it were: EPV 6.1—advance information on the transport service as a whole, weighted 30%, received a low score of 5.7; EPV 6.2—cargo transport information during the operation, weighted 20%, was rated 7.0; and EPV 6.3—cargo traceability, weighted 50%, was rated 8.0.
It is noticeable from the scores obtained that EBNs possess good cargo traceability systems. However, they need improvement, along with the other two sub-criteria, especially the one regarding advanced information on transportation as a whole. This highlights that both shipping companies and their agents are more interested in attracting cargo than in providing reliable transport information. Furthermore, they should not forget that one is dependent on the other.
To broaden the customer base of cabotage, which will lead to an increased volume of cargo transported by this modal, it is essential that the shipping companies invest in reliable information systems and provide reliable and precise information on the transport service as a whole.
4.7. FPV 7—Other Aspects Related to Cargo Transportation by Cabotage
This criterion also had a low assessment, achieving a score of 6.44. It consists of five sub-criteria regarding aspects related to cargo transportation that did not fit in the previous FPVs, whose names and weights are as follows: EPV 7.1—up-to-date (modernization of techniques, vessels, and equipment (20%); EPV 7.2—time required to deliver the hole container to the port before shipment (10%); EPV 7.3—time of cargo clearance at the destination port (40%); EPV 7.4—fractional delivery at the end (15%); and EPV 7.5—door-to-door service (15%).
Half of the criteria weights refer to external factors: the time required by the ports to deliver the entire container before shipment and the time spent to clear the cargo at the port of destination, both of which contribute exactly 50% to the assessment of the criterion. They were evaluated with scores of 7.3 and 6.5, respectively.
Concerning the other three sub-criteria, regarding the degree to which shipping companies are up-to-date in terms of methods, techniques, vessels, and equipment, and the activities of cargo fractioning during delivery and door-to-door service, they participate with the other 50% for the assessment of the criterion and obtain the following scores: 6.6, 5.3, and 6.6, respectively.
These results call for ports’ improvement concerning the reduction of deadlines and shipping companies regarding the increase of their activities. As part of the requirements to improve the performance of the modal as a whole, and consequently attract new customers, aiming to increase the volume of cargo transported by cabotage and the consequent reduction of the cost of transport as a whole.
4.8. Global Assessment
The global assessment of the degree of satisfaction of users of cabotage, regarding the segment of containerized cargo, was 7.02. This is a good score, reflecting the weighted average of the criteria assessments, as seen in
Table 7.
It is noticeable that the criteria scores are very close, ranging between 6.0 and 7.0, except for FPV 2—cargo security, which scored 9.1, as it is a significant and positive differential of cabotage.
The reasonably good score obtained in the global assessment denotes a considerable margin for improvement that needs to be worked on, not only by the shipping companies but also by the government, and particularly investments in infrastructure, to create conditions for the expansion and development of the model.
However, there is also a need for investment by the Brazilian shipping companies expanding the fleet, methods, techniques, and quality of service. Such investments are imperative to maintain the current status quo of acceptance of the modal and expand its participation in the Brazilian matrix of cargo transportation.
4.9. Sensitivity Analysis Application
After processing the field research data, computing criteria evaluations, and global evaluation, we conducted a sensitivity analysis of the multicriteria evaluation model, as recommended in
Section 3.9.
We tested the sensitivity of the evaluation model by modifying the substitution rates (weight) of each criterion by plus or minus 10, as shown in
Table 7. Considering that the criteria substitution rates must total 100% and that the change of a specific rate necessarily implies the modification of the others, after the adjustment of the substitution rate of each criterion, the following formula proposed by Ensslin et al. [
37] was utilized to calculate the weights of the other criteria:
where:
pi = the substitution rate of the original criteria i;
pi′ = the substitution rate of the modified criteria i;
pn = the substitution rate of the original criteria n; and
pi′ = substitution rate of the modified criteria n.
Table 8 presents the results of the sensitivity tests applied to all the criteria.
In all the tests performed for each criterion, changing substitution rates by 10% up and down, the global evaluation variation results showed a maximum of 0.6%, which leads to the conclusion that the evaluation model built is robust and that the evaluations are reliable.
5. Conclusions
This research accomplished the objectives initially set out as a multicriteria assessment model was developed and applied to users of Brazilian cabotage in the container cargo sector. The model construction was assessed with the participation of cabotage specialists associated with institutions directly linked to Brazilian cabotage, which gave it greater credibility and consistency.
The global assessment of the degree of customer satisfaction in the Brazilian cabotage segment of containerized cargo reached a score of 7.0, a score corresponding to the weighted average of the various criteria evaluated, whose assessments and respective weights for the calculation of the global assessment were as follows: FPV 1—service level = 6.5 (15%); FPV 2—cargo security = 9.1 (15%); FPV 3—cabotage routes = 7.0 (15%); FPV 4—shipping cost = 6.0; FPV 5—general aspects of transportation = 6.8 (14%); FPV 6—quality of information provided by EBNs and intermediary agents = 7.1 (13%); and FPV 7—other aspects related to cabotage transportation = 6.4 (13%).
The weights of the various criteria were considered as very close by the decision makers, varying between 13 and 15%. There was also certain linearity between the assessments of the various criteria, which was between six and seven, apart from cargo security, which reached a score of 9.1, indicating the excellent satisfaction of the cabotage users with this criterion.
Ultimately, the study found reasonable satisfaction on the part of the users of Brazilian cabotage, even though most of the aspects analyzed need improvements to serve the clients better. These improvements will undoubtedly increase the volume of cabotage users if implemented, resulting in an expansion of the cargo volume to be transported by this modal.
As for future studies, we suggest that a similar analysis be carried out periodically, between every one and three years, to verify the evolution of the degree of satisfaction of cabotage users and subsidize actions to be implemented by the shipping companies and the government. We suggest evaluating whether other multicriteria methods can also effectively assess scenarios like this.


