Case Report

Impact of Land Cover Change on a Typical Mining Region and Its Ecological Environment Quality Evaluation Using Remote Sensing Based Ecological Index (RSEI)

1
Department of Civil Engineering, Tongling University, Tongling 244061, China
2
Tongling Seismic Station, Tongling 244061, China
3
Anhui Zhonghui Urban Planning Survey & Design Institute Company Limited, Tongling 244061, China
4
Department of Building, Civil, and Environmental Engineering, Concordia University, Montreal, QC H3G 1M8, Canada
*
Author to whom correspondence should be addressed.
Sustainability 2022, 14(19), 12694; https://doi.org/10.3390/su141912694
Submission received: 25 July 2022 / Revised: 26 September 2022 / Accepted: 30 September 2022 / Published: 6 October 2022

Abstract

:
Ecological environment in mining cities has become an important part of ecological construction. This paper takes Tongling, a mining city, as the research area, and uses Landsat series remote sensing images from 2000 to 2020 as data sources. Using the principal component analysis method and the Remote Sensing Ecological Index (RSEI) integrated with four indexes of greenness, humidity, dryness, and heat, the ecological disturbance of the mining area was evaluated and studied. Meanwhile, the land cover spatiotemporal classification of Tongling city was extracted by the maximum likelihood method. Furthermore, landscape metrics were used, based on the information on open-pit mining areas, to quantitatively analyze the ecological environment quality and its change characteristics in the study area. The results show that (1) RSEI can better characterize the ecological quality of Tongling city, greenness and humidity are positively correlated with it, dryness and heat are negatively correlated with it, and dryness and RSEI have the highest correlation coefficient, indicating that urban expansion will cause ecological environment deterioration to a certain extent. (2) The ecological environment quality of the research area showed a “decline-rising” trend, and the mean value of RSEI decreased from 0.706 to 0.644. Spatially, the areas with poor RSEI are mainly distributed in the central urban area and the open-pit mining area in the south. (3) Land cover change leads to changes in landscape metrics, and most landscape-level metrics are positively or negatively correlated with RSEI. The more concentrated the land cover type distribution is, the smaller the change is, and the more regional RSEI can be improved. (4) The mean value of RESI of the ten open-pit mining areas in Tongling city decreased significantly, with a maximum decrease of 52.73%. Among them, the RESI decline rate in the area around the no.1 open pit mine is 0.034/year. The ecological degradation in Tongling city is attributed to the rapid expansion of built-up areas and the development of the mining industry. The research results can provide a scientific basis for protecting the ecological environment of mining cities.

1. Introduction

Ecological and environmental problems have gradually become one of the main factors threatening regional ecological security and sustainable economic and social development [1]. Mining is the pillar industry of the country’s economy, and its development is, to some extent, at the cost of environmental damage [2]. Furthermore, mining has also caused serious impacts on the sustainable development of the local ecological environment and the social economy, which is one of the difficulties in current environmental management [3,4,5]. With the continuous expansion of the population and the acceleration of urbanization, the structural contradiction between economic development and resources and the environment has become increasingly apparent, and the ecological environment problems disturbed by human beings have become particularly prominent [6,7,8]. The ecological environment of mining cities is under the double pressures of mineral exploitation and urbanization. Therefore, it is very necessary to evaluate the regional ecological environmental quality of mining cities.
The Environmental Protection Agency (EPA) conducted an environmental survey of all counties using the Environmental Quality Index (EQI), which can be used to quantitatively evaluate the regional ecological and Environmental Quality [9]. Based on the EQI, the Ministry of Environmental Protection of China developed an eco-environmental quality Index (EI) model [10] based on the biomass abundance index, vegetation cover index, water network density index, land stress index, pollution load index, and environmental limitation index, which has been widely used in regional eco-environmental quality assessment [11]. Moreover, remote sensing technology has the advantages of a large monitoring range, instantaneous imaging, real-time transmission, fast processing, rapid information acquisition and dynamic monitoring, and little ground influence, which has improved the assessment of ecological environment quality [12,13,14]. Some research combined using remote sensing technology and the EQI to study ecological environment quality. For example, Li et al. studied the ecological environment change of Mu Us Sandy Land by combining land cover and the Normalized Difference Vegetation Index (NDVI). The results showed that the ecological restoration in the Mu Us is experiencing increasing challenges, due to the growing human activities (including land cover change) and still-fragile eco-environment [15]. Mozumder et al. used Landsat as the data source and the Normalized Difference Water Index (NDWI), Modified Normalized Difference Water Index (MNDWI), Normalized Difference Pond Index (NDPI), NDVI and field survey data to classify and evaluate the Ramsar wetland ecosystem. The environmental quality of the wetland ecosystem was closely related to major contributing anthropogenic factors, such as railway line construction, growing croplands, and illegal human settlements in the wetland catchment [16]. It can be seen that changes in land cover or land use have a great impact on the quality of the ecological environment. Mining areas face difficulties in statistical data collection, low accuracy of spatial data and subjectivity of ecological index weight [16,17]. Since remote sensing technology is so widely used in ecological environment quality evaluation, it set a great example to be used in mining area ecological research [18].
In addition, considering the complexity of the ecological environment, a single EQI such as the surface temperature or drought index is not enough to evaluate the ecological environment quality [19,20]. So, the comprehensive Remote Sensing Ecological Index (RSEI) has attracted the attention of scholars. RSEI was proposed by Xu et al. to evaluate the ecological quality of Fuzhou city [7,8,21]. Principal component analysis was used to conduct an integrated analysis on the four indexes of greenness, humidity, dryness, and temperature, acquired based on remote sensing images, to rapidly evaluate the regional ecological environmental quality [17,22]. This method is simple to calculate and not only quantitatively represents the ecological quality monitoring and evaluation but also carries out a visual analysis, which has been widely used in the field of ecological research in many areas [23,24,25,26,27]. For example, Wei showed that RSEI and EI had strong similarities in the ecological sense, and RSEI was more effective than EI in reflecting changes in ecological environmental quality [16]. The index has been improved by many scholars due to the difference in the study area. Based on Principal Component Analysis (PCA), Li added the Analytic Hierarchy Process (AHP) and Technique for Order Preference by (TOPSIS) Similarity to an Ideal Solution (algorithm), which improved the result of RSEI. The results showed that RSEI along the Grand Canal showed a decline and then an upward trend during 2000–2019. Li found that the RSEI has an important relationship with human activities, especially tourism development and urban development [28]. Wu used moderate-Resolution Imaging Spectroradiometer (MODIS) data, based on the ecological environment of the Sahel Region in Africa, and an improved remote sensing ecological index model was established combining drought, moisture, greenness, and desertification indexes to reflect the ecological quality of desert areas. Different land-cover types demonstrated different RSEI values and changing trends. Wu found that RSEI and precipitation were positively correlated in the Sahel Region [29]. Sun et al. added the white rot Night Light Index (CNLI) based on RSEI to evaluate the urbanization level and environmental quality in Ethiopia during 2010–2020. The spatial correlation between the urbanization process and RSEI was strong [30]. Zhang proposed a new assessment method for urban ecological environmental quality based on RSEI, which comprehensively considered the impact of the RSEI index on ecological environmental quality and seasonal changes. The results showed that rapid urban expansion and land reclamation in Binhai New Area have a great impact on RSEI [31]. However, the application of these comprehensive remote sensing index methods in mining areas is relatively few. The application of mathematical methods such as principal component analysis to the analysis of influencing factors of ecological environment quality in specific mining areas is also relatively few [32,33,34]. Moreover, an in-depth analysis of the impact of Land Cover changes on RSEI is also rare.
This study takes Tongling city, a typical mining city, as the research area. Considering the rapid urban expansion in the past two decades, urban expansion and mining development simultaneously affect the ecological environment of the region for mining cities. Using remote sensing technology to monitor the ecological environment is beneficial to quickly understand the change process of the ecological environment. Therefore, based on the RSEI model, principal component analysis, and maximum likelihood classification, the remote sensing ecological index and land cover data of Tongling city were extracted from Landsat series images in this study. Furthermore, Fragstats 4.2 software was used to calculate landscape metrics, combined with opencast mine information, and the ecological environment of the study area from 2000 to 2020 was evaluated as a whole. The results can provide a typical scientific basis for protecting the ecological environment of a mining city and provide data support for subsequent mining areas to accurately formulate ecological environment restoration plans.

2. Methods and Materials

2.1. Study Area

Tongling city is in east China in the south-central Anhui Province (Figure 1). Its geographical coordinates are between 117°04′~118°09′ EAST longitude and 30°38′~31°09′ north latitude. Tongling City belongs to the North subtropical humid monsoon climate, with a significant temperature difference between winter and summer, frequent exchanges of warm and cold air masses, a changeable climate, and great inter-annual variation of precipitation. Low temperatures and continuous rainy weather often occur in spring and drought in autumn. In the south of the low mountains, hills cross a north-eastern spread. It is known as “Ancient copper capital of China and modern copper base”. The history of copper mining began in the Shang and Zhou Dynasties and flourished in the Han and Tang dynasties, extending for more than 3500 years. Tongling has provided copper, gold, silver, sulfur, iron, limestone, and all kinds of rare metals associated with them, among which the reserves of copper, sulfur, and limestone rank first in East China and China [24,35]. After 2000, there were ten open-pit mining areas in Tongling city (Table 1), mainly distributed in the southern mountainous area (Figure 1).

2.2. Data Resources and Pre-Processing

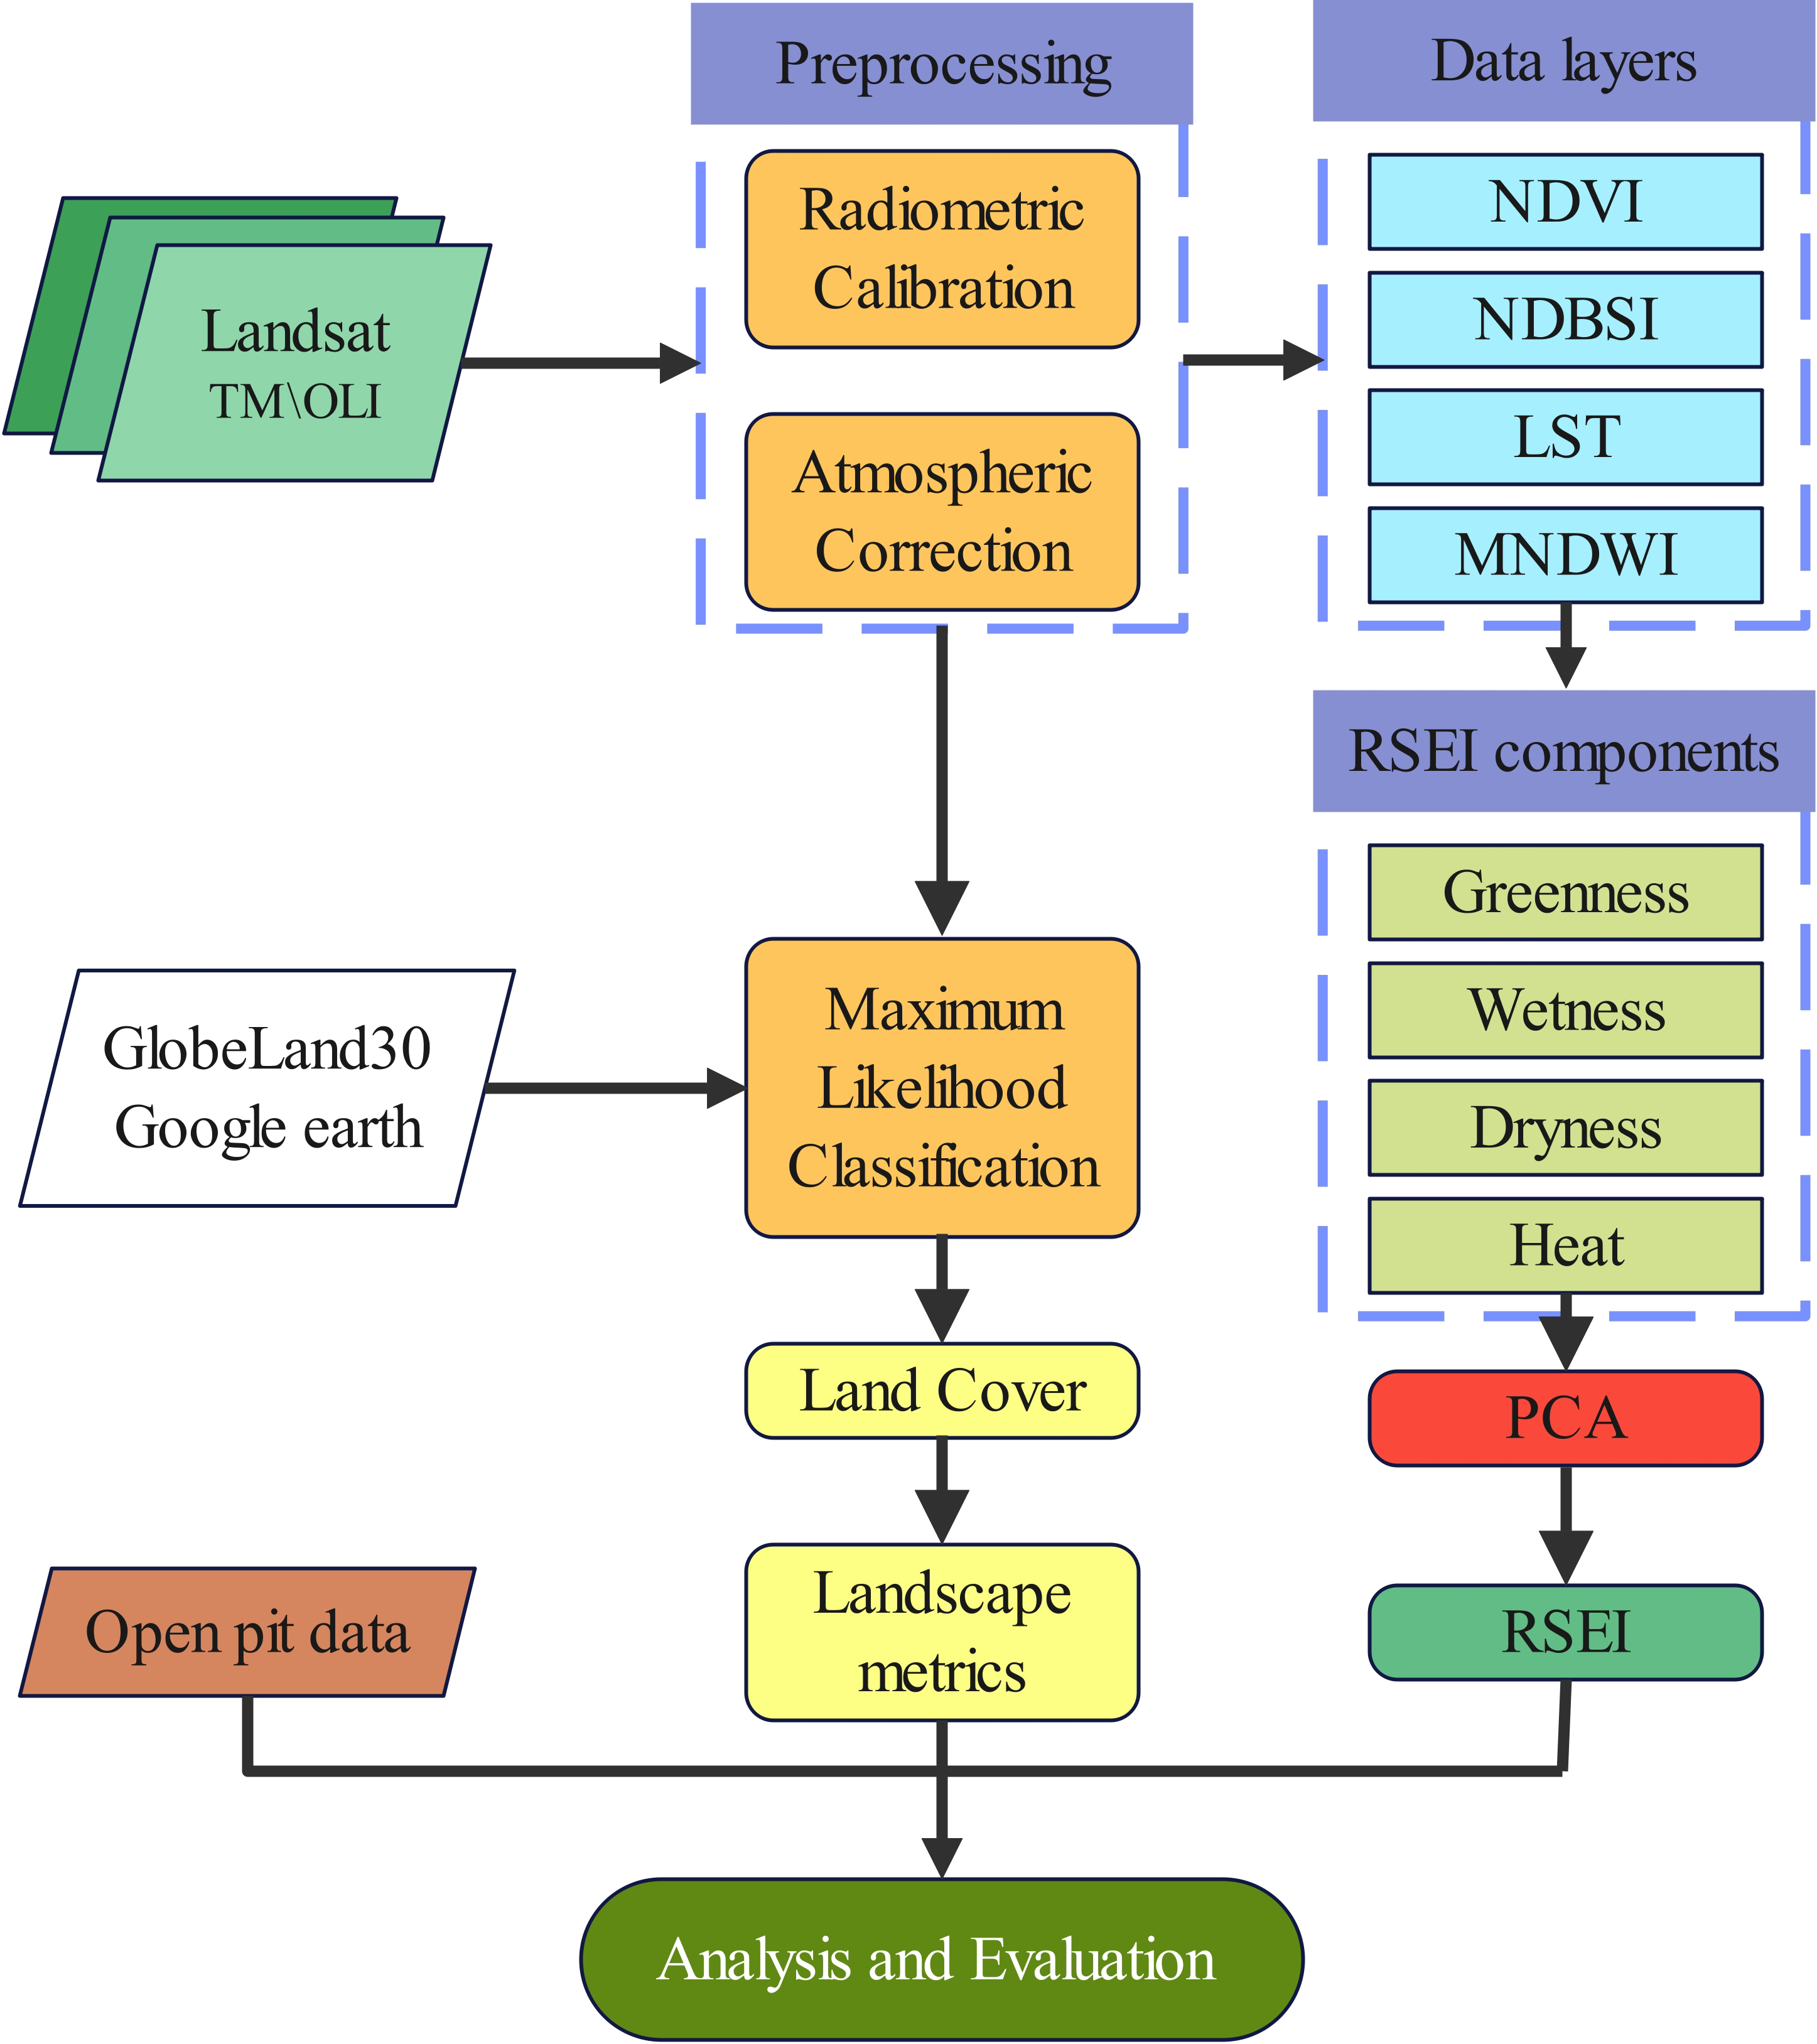
In this paper, three Landsat series remote sensing images provided by the United States Geological Survey (USGS) were selected as data sources: Landsat 5 Thematic Mapper (TM) images in 2000 and 2010 and Landsat 8 Operational Land Imager (OLI) images in 2020, with a spatial resolution of 30 m and a line band number of (path 120, row 39) (https://www.usgs.gov/core-science-systems/nli/landsat accessed on 6 September 2022), the acquisition time of the three scene images were October 3 every year. Radiometric calibration, atmospheric correction, and geometric correction were used to preprocess the three phase images, and the images were trimmed according to the administrative boundary of Tongling city to obtain the three phase surface reflectance images of the study area. As the Water body affects the principal component load, the water body is masked according to the Modified Normalized Difference Water Index (MNDWI) [15,36,37]. The location data of ten mining areas are provided by the Anhui Zhonghui Planning survey, Design, and Research Institute. The detailed data resources and data processing procedure are listed in Figure 2.

2.3. RSEI Evaluation Model

RSEI was used to comprehensively reflect the ecological environment status of the study area. The RSEI index is based on the integration of four indices closely related to human beings extracted from remote sensing images and principal component analysis, so it avoids artificial weighted calculation and is more reasonable [36,38,39]. RSEI can visualize the ecological environment of the studied region to intuitively feel the changes in ecological conditions. The detailed Equations are as follows:
R S E I = ( W , D , G , T )
R S E I = f ( W e t , D N B S I , N D V I , L S T )
where W, D, G, and T are four remote sensing indexes: Greenness, humidity, dryness, and heat indexes, respectively. Wet is the moisture index, DNBSI is the average value of the Normalized Difference Built-up and Soil Index, NDVI is the vegetation index, and LST is the surface temperature index.
In the ENVI (Environment for Visualizing Images) 5.3 platform (https://www.envi.com accessed on 6 September 2022), the NDVI, WET, Normalized Difference Built-up and Soil Index (NDBSI), and Land Surface Temperature (LST) were calculated to represent greenness, humidity, dryness, and heat indexes, respectively [1,7,35,38].
Then, MNDWI was used to extract the water body in the study area, mask the four remote sensing indexes, and combine them into a new image for principal component analysis. The first component is the initial ecological index. At last, the principal component analysis method was used to collect most of the information on the four indicators and can be used to represent the ecological environment characteristics of the region [40].

2.4. Land Cover and Landscape Metrics Calculation

Maximum likelihood classification is to establish a set of nonlinear discriminant functions according to the maximum likelihood ratio and Bayes decision criterion method in two or more types of decisions, assume that each distribution function is a normal distribution, select training areas, and calculate the probability of belonging of each sample area to be classified. An image classification method for classification has high precision and good stability [39]. Therefore, the maximum likelihood method was used in the ENVI5.3 platform to monitor land cover change in Tongling city from 2000 to 2020, to further analyze the causes of ecological environment change in the mining area.
The Globe Land 30 dataset of Anhui Province in 2010 was downloaded from the National Earth System Science Data Sharing Service Platform-Loess Plateau Science Data Center (http://loess.geodata.cn accessed on 6 September 2022), and the regions of interest were selected to classify the images of the three phases, including water, arable land, forest and grassland, and artificial surfaces of 4 types. The classification results were processed by clustering analysis and were modified by right and wrong regions. The accuracy of classification was evaluated by random selection points from Google Earth (https://developers.google.com/earth-engine accessed on 6 September 2022), and the Overall Accuracy (OA) of classification was higher than 85%, kappa coefficient was all higher than 0.81, indicating that the maximum likelihood method can be used to extract land cover information in Tongling city, to analyze the causes of ecological environment change.
Based on previous studies [25,41,42], the I landscape-level scales contagion index (CONTAG), the aggregation index (AI), Shannon’s diversity index (SHDI), interspersion and juxtaposition Index (IJI), Mean patch Shape Index (SHAPE_MN), and mean Patch fractal Dimension (FRAC_MN) are the six landscape pattern indexes. The grid analysis method was applied, and the size of a single pixel was 30 m × 30 m. The processed land cover data were input into the Fragstats 4.2 software platform (http://www.umass.edu/landeco/research/fragstats accessed on 6 September 2022) as the data source, and the landscape pattern indexes of each grid were obtained.

2.5. Biological Abundance Index Calculation

To further evaluate the results of the RSEI model, we calculated the Biological Abundance Index (BAI) using the ArcGIS platform. BAI was an important indicator used to evaluate the quality of the ecological environment, which was defined in the National Environmental Protection Standard of the People’s Republic of China HJ623–2011 Regional Biodiversity Assessment Standard. It refers to the difference in the number of biological species of different ecosystem types per unit area, which indirectly reflects the abundance and poverty of organisms in the assessed area. The higher the value, the better the ecological environment. The formula is as follows:
BAI = Abio × (0.35 × forest + 0.21 × grassland + 0.28 × wetland + 0.11 × cropland + 0.04 × construction land + 0.01 × unused land)/total area
The area of each land type was extracted from remote sensing data. In the formula, Abio represents the normalization constant of the biological abundance index [43].

3. Results and Discussion

3.1. Principal Component and Correlation Analysis

In this paper, the correlation coefficients between RSEI and each sub-index were calculated by SPSS 26.0 software (Table 2). The correlation between NDVI and NDBSI was as high as 0.97. NDVI and WET were positively correlated with RSEI, while NDBSI and LST were negatively correlated with RSEI, that is, RSEI increased as NDVI and WET increased, signifying better ecological quality. On the contrary, with the increase in NDBSI and LST, RSEI decreased and ecological quality decreased. This is consistent with the regional ecological response in previous studies [32,38,44,45]. NDBSI has the largest correlation coefficient, which mainly reflects the distribution of bare soil and buildings, indicating, to some extent, that urban expansion will cause ecological environment deterioration [33,40]. Both indicate that dryness is the most important factor affecting the ecological environmental quality, followed by greenness, which is consistent with the research results of Zhu [40], and reflects that human activities have caused increasingly serious damage to the environment in recent years. Therefore, urban planning should consider the ecological environment, balance the relationship between urban development and ecological environment quality, and promote sustainable urban development.

3.2. Overall Evaluation of Ecological Environment in Tongling City

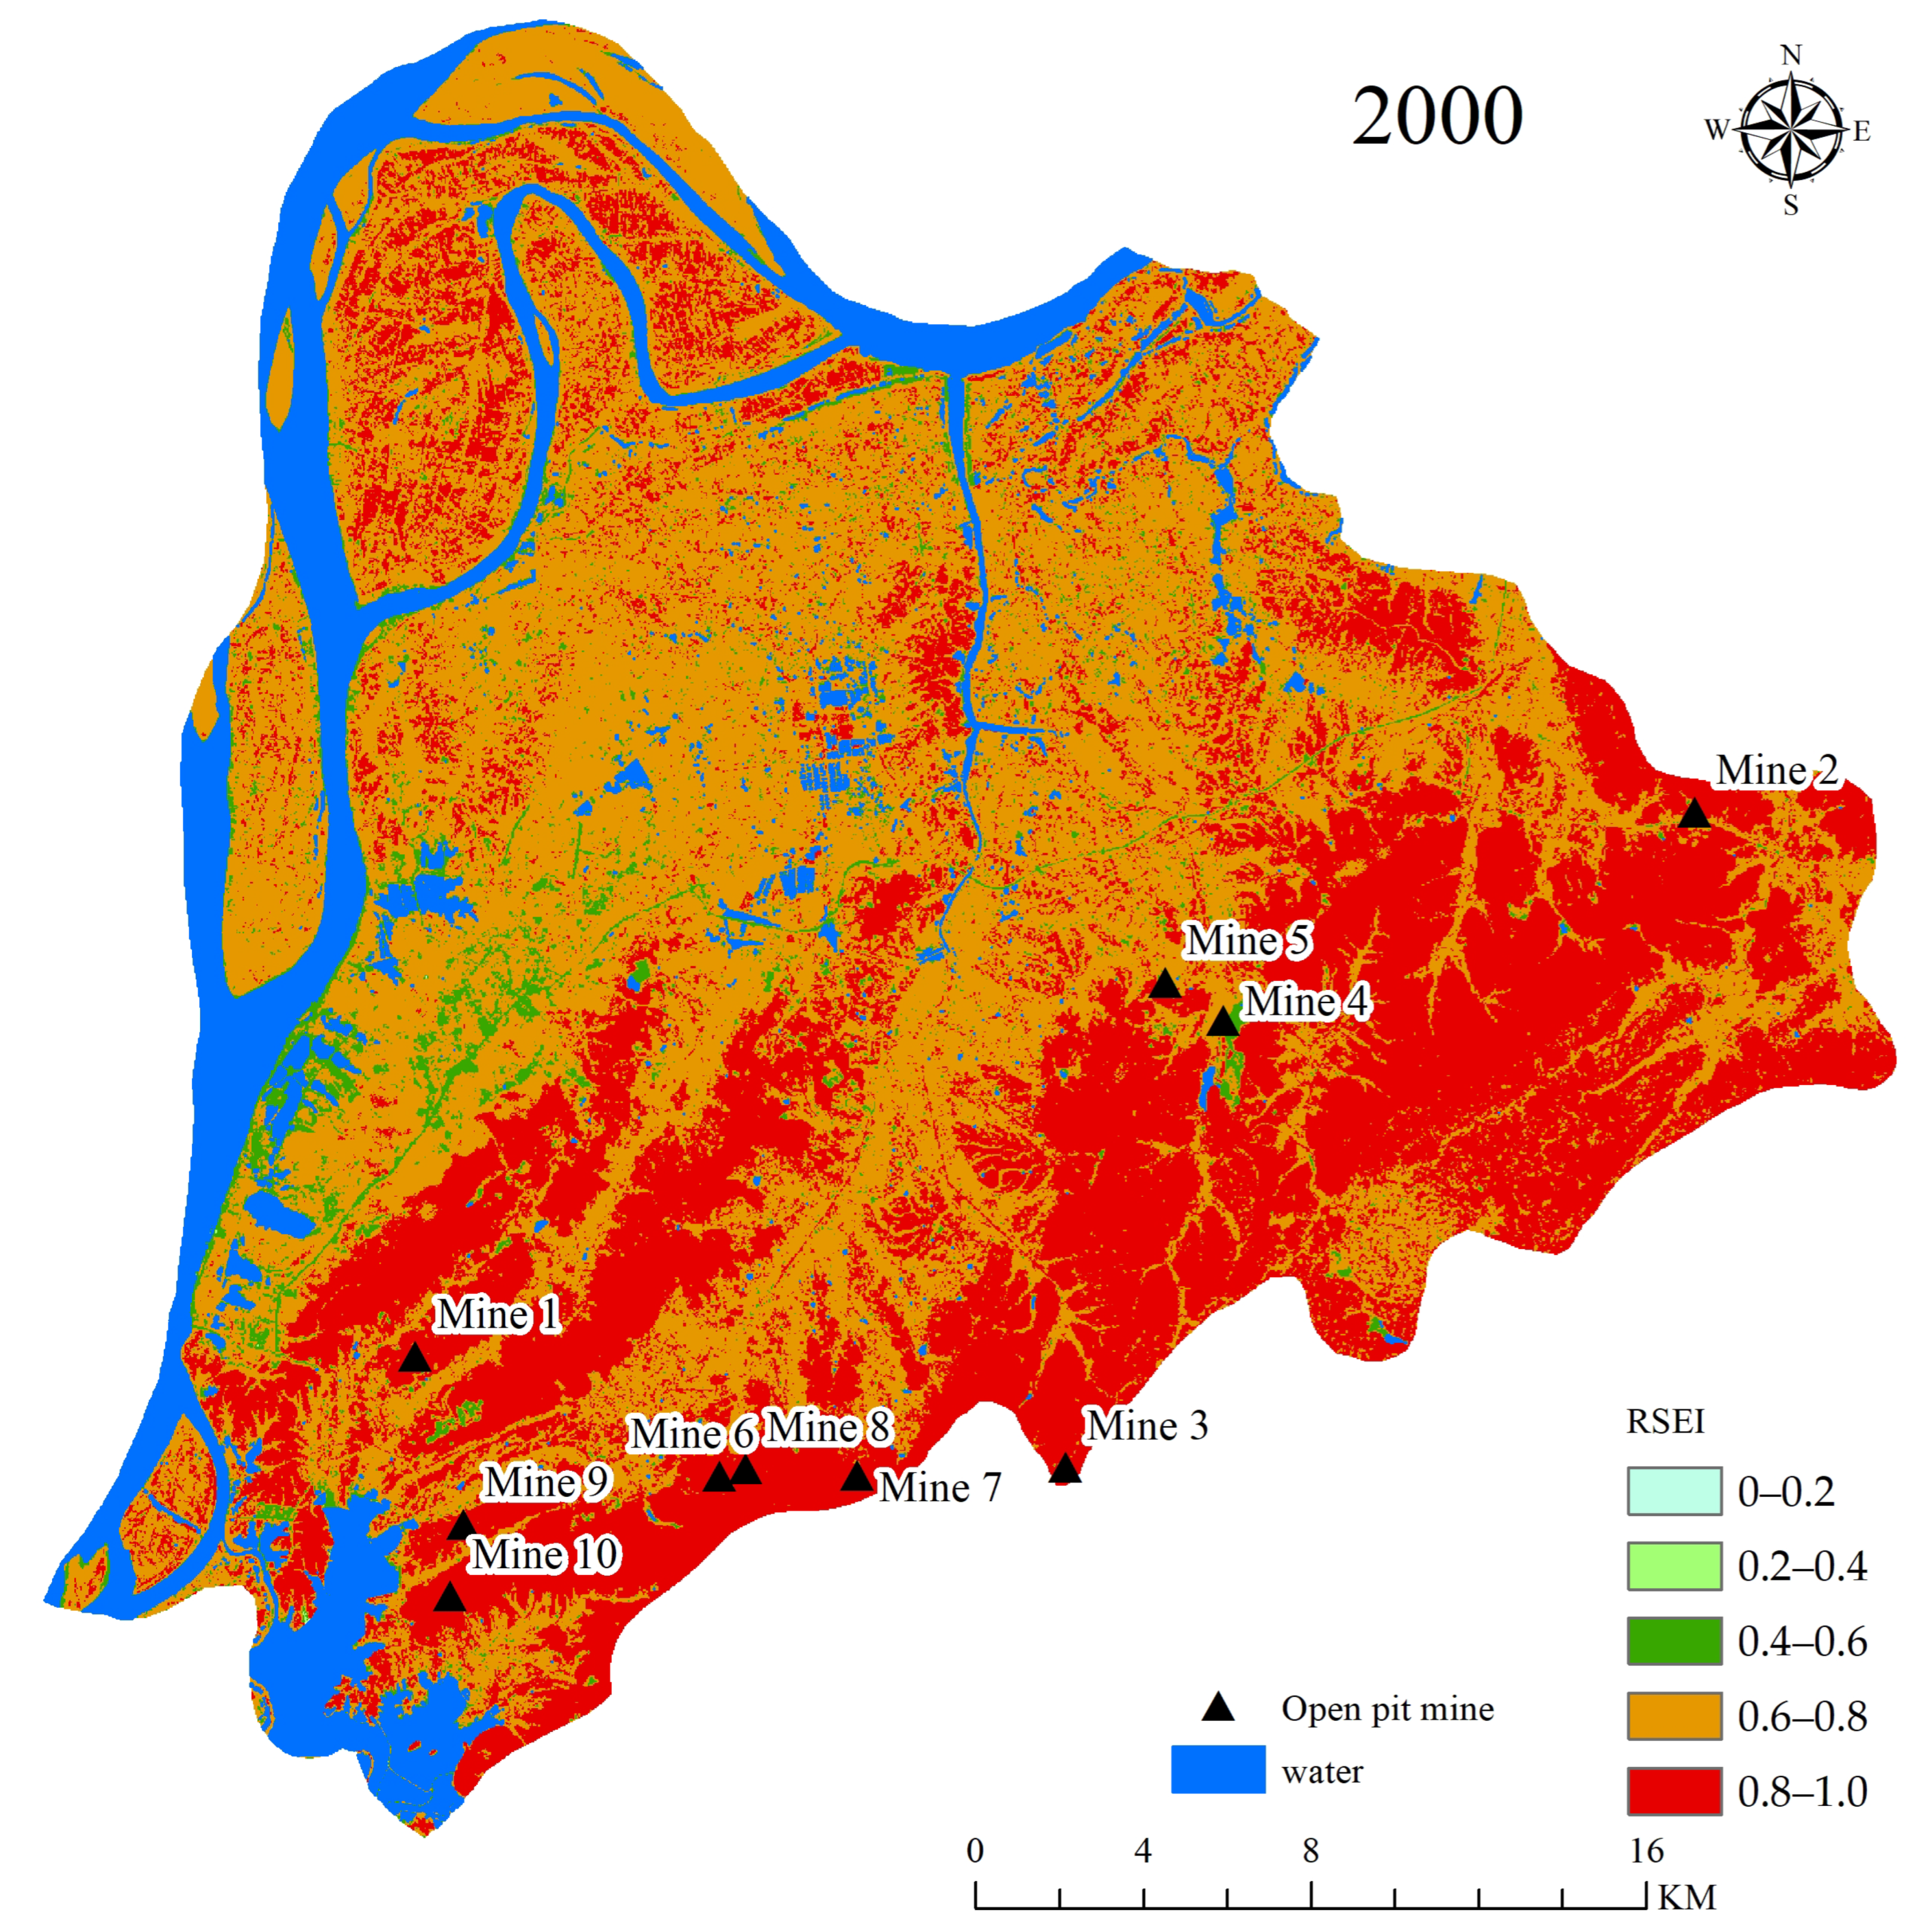
Overall, Figure 3 lists the Spatial distribution of RSEI in Tongling City. Figure 3 shows that RSEI in the southeast of Tongling city is higher than that in the northwest. In 2000, the mean VALUE of RSEI in Tongling city was 0.706, and the mean value of RSEI in 4.67% of the area was 0–0.6. In 2010, the mean value of RSEI was 0.637, and the mean value of RSEI ranged from 0 to 0.6, accounting for 21.80% of the total area, increasing by 17.13%. In 2020, the mean RSEI of Tongling city was 0.644, which was slightly better than that of 2010. The mean RSEI of 12.55% area was between 0 and 0.6. During the study period, the RSEI value of Tongling city decreased from 0.706 to 0.644, with a decrease of 9.63%, indicating that the ecological environment quality of Tongling city showed a downward trend.
To further study the ecological effects of RSEI, RSEI values in each year were divided into five grades with 0.2 intervals, representing ecologically poor, poor, medium, good, and excellent, respectively. Table 3 showed the classification of the ecological environment. It can be seen from Table 4 that the area occupied by poor and poor ecological grades is almost unchanged from 2000 to 2020. From 2000 to 2010, the proportion of the medium ecological grade in the area increased significantly from 4.66% to 21.65%, the proportion of the good grade increased by 7.48%, and the proportion of the excellent grade decreased by 24.61%. It shows that the ecological environment quality of Tongling city decreased from 2000 to 2010. As can be seen from Figure 3, the overall environmental quality of Tongling city deteriorated from 2000 to 2010, especially in the northern area along the Yangtze River. In this paper, RSEI is used to monitor the changes in ecological environment quality in mining cities and analyze the causes. This result is consistent with the results shown in the Bulletin of Environmental Conditions in Anhui Province, which shows that the comprehensive index of ecological environment conditions in Tongling city decreased slightly from 2005 to 2010.
From 2010 to 2020, the proportion of the area with a medium ecological grade decreased significantly, from 21.65% to 12.42%. The proportion of the good grade increased significantly from 63.66% to 79.30%. The proportion of the excellent ecological environment decreased from 14.54% to 8.15%. As can be seen from Figure 3, from 2010 to 2020, RSEI increased in the northern and central areas of Tongling city, resulting in better environmental quality, while the environmental quality deteriorated in the southern open-pit mine area. This variation trend of RSEI is in good agreement with Niu’s research results [22]. Niu showed that RSEI in Anqing city, a neighboring city of Tongling, showed a downward trend from 1999 to 2009, and a slow rise from 2009 to 2019. The results of this study are consistent with the results of the Anhui Province Environmental Status Bulletin, indicating that the eco-environmental status index of Tongling city is in the range of 65–70 from 2010 to 2015, while it is in the range of 70–75 from 2015 to 2020, indicating a slight increase in eco-environmental quality. Compared with 2000, the areas with worse environmental quality in 2020 are mainly located along the Yangtze River, the central urban area, and the mining area in the southeast. From 2000 to 2010, the average NDVI of Tongling City decreased from 0.481 to 0.345. From 2010 to 2020, the average NDVI increased from 0.345 to 0.389. Section 3.1 shows that the correlation coefficient between RSEI and NDVI reached 0.97. NDVI first decreased and then increased slightly, which is completely consistent with the change in RSEI. The change in NDVI further proves that RSEI is suitable for explaining the ecological environment quality of Tongling City.
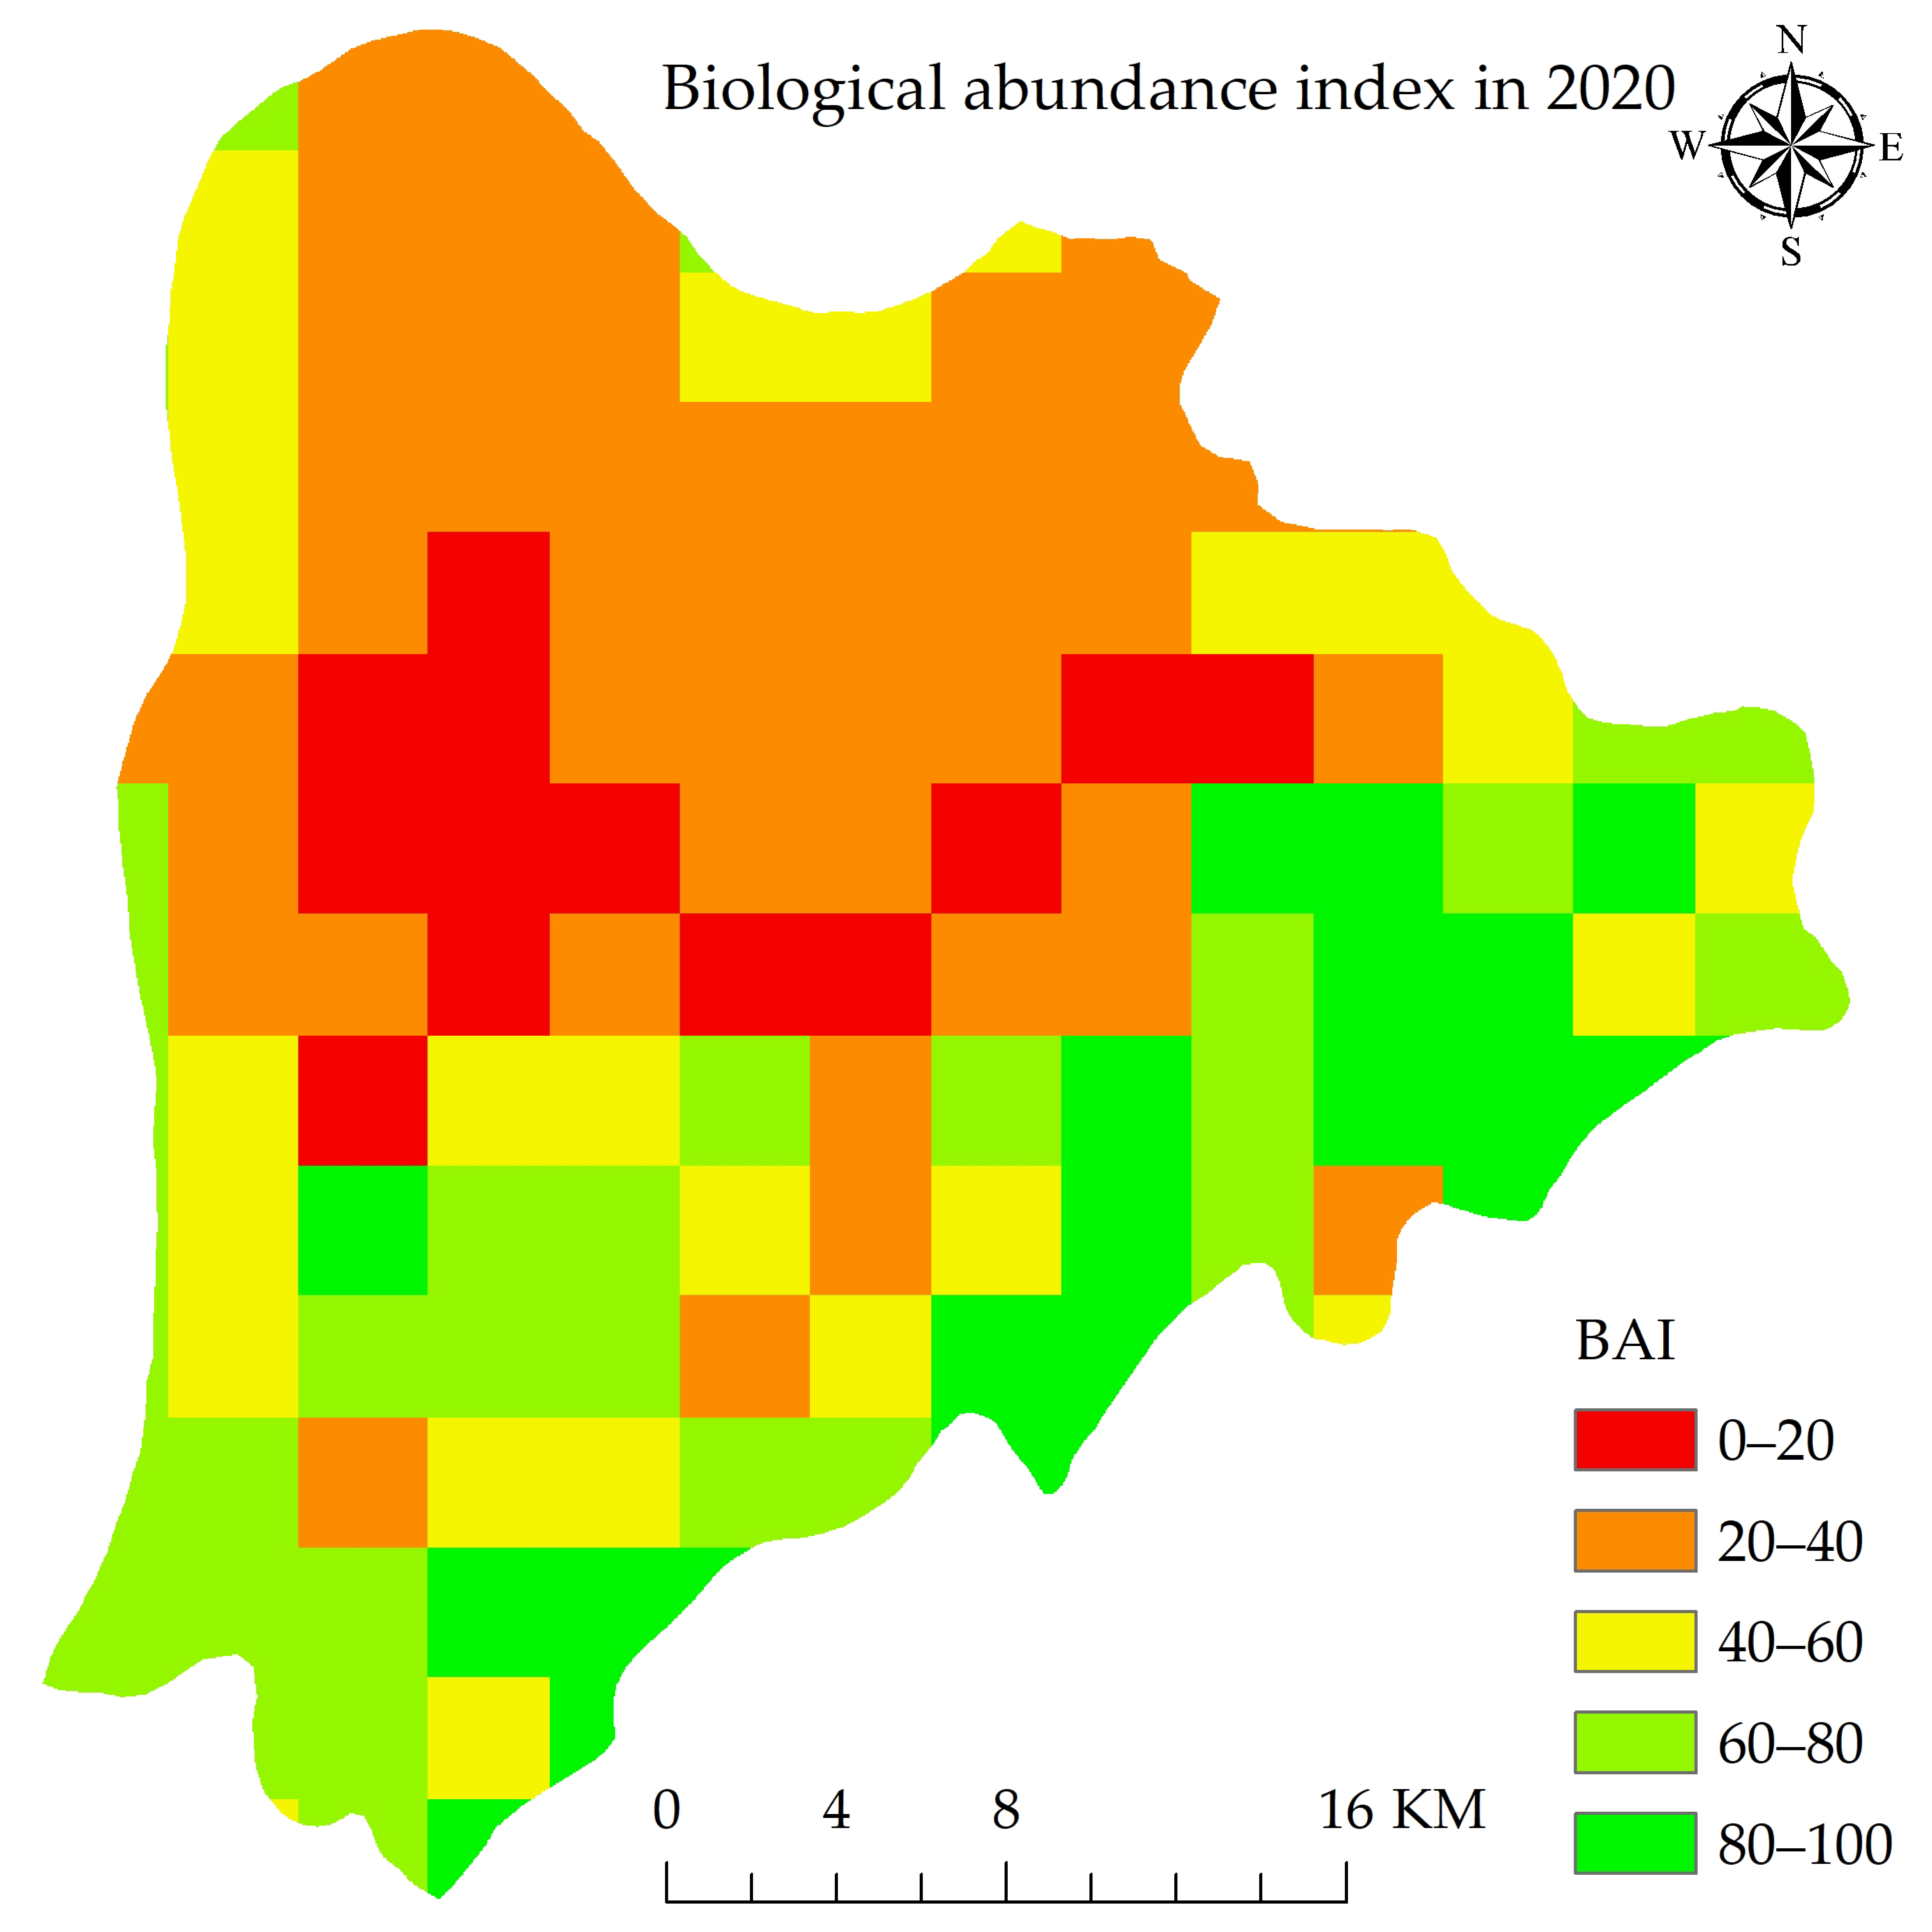
Figure 4 shows the distribution of BAI in Tongling City from 2000 to 2020. The BAI of Tongling City is higher in the south than in the north. In 2000, the BAI of Tongling City was between 30 and 100, with an average of 61.34. The BAI in the southern mountain area was above 80, and that of the northern cultivated land was the lowest, between 30 and 40. The BAI of cultivated land in the central area was slightly higher, above 40.
In 2010, the BAI of Tongling City was between 0 and 90, with an average of 45.50. Compared with 2000, the BAI in the middle and north of Tongling City has declined seriously, with the lowest value in the city center, below 10. The BAI of cultivated land around the city center decreased to approximately 30. The results showed that the ecological environment quality of Tongling in 2010 was much worse than that in 2000.
In 2020, the BAI of Tongling City was also between 0 and 90, with an average of 45.84. The BAI in the city center slightly increased, which may be related to urban greening. The BAI in the southern mountains improved slightly. The BAI of cultivated land in the north is much higher than that in 2010. This shows that the ecological environment quality of Tongling in 2020 is better than that in 2010.
In general, the BAI of Tongling City showed a downward trend, and the ecological environment quality was becoming worse. The trend is completely consistent with that of the RSEI model, which proves that the RSEI model is suitable for monitoring the ecological environment quality of Tongling City.

3.3. Analysis of Land Cover Change in Tongling City

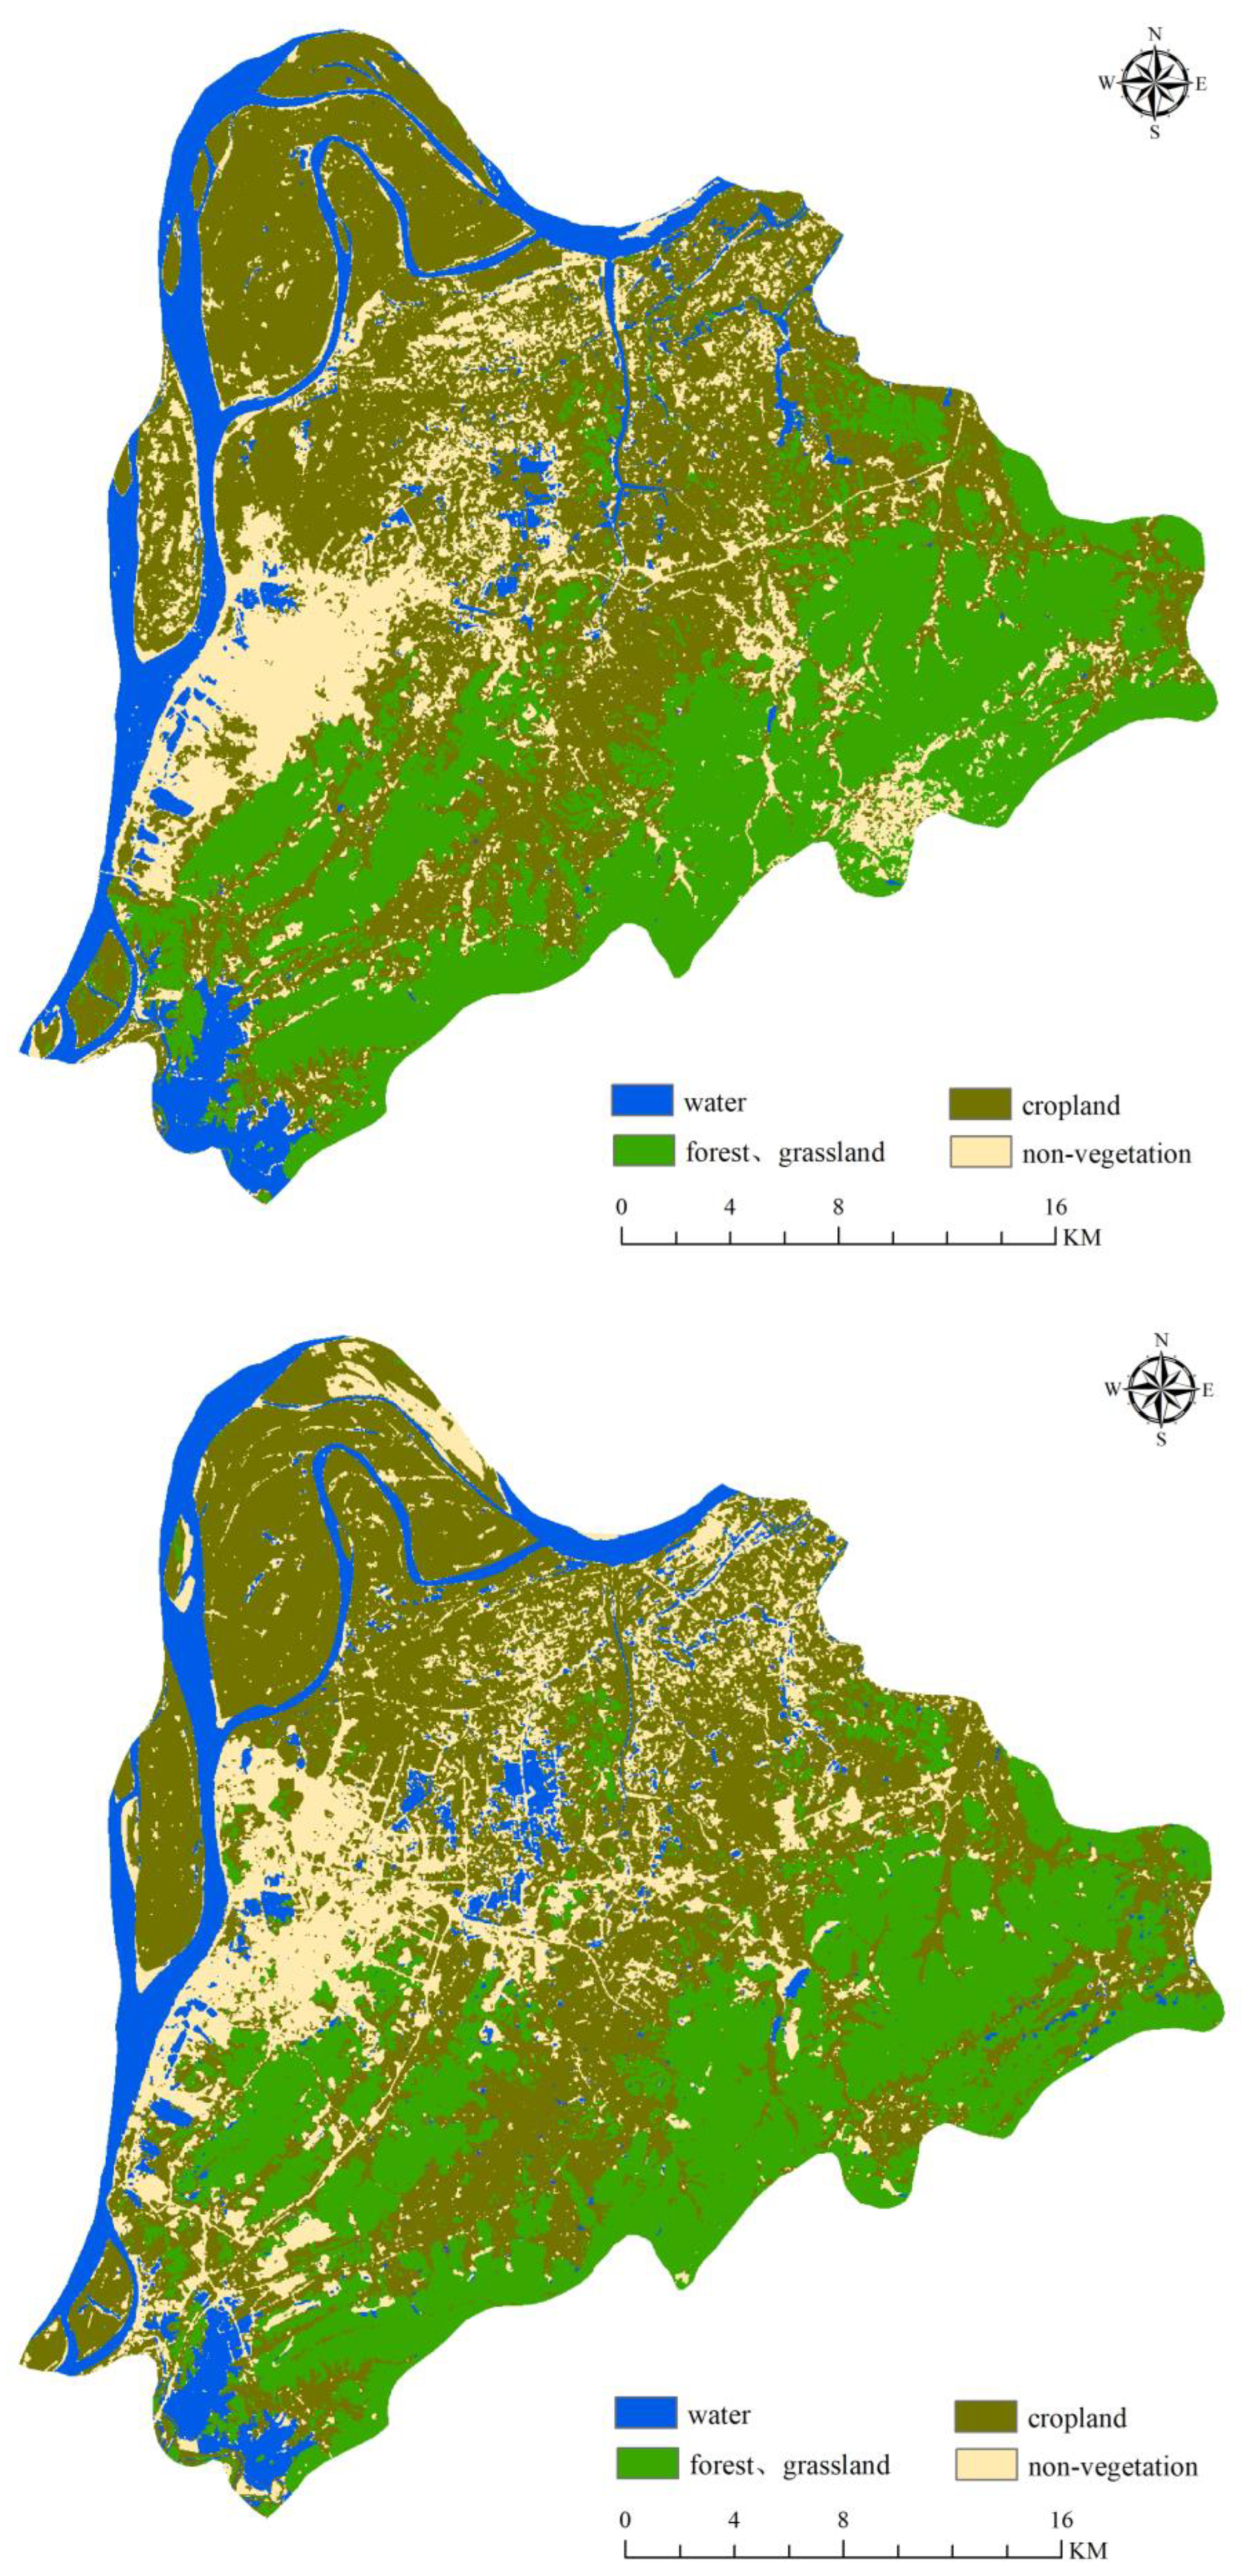
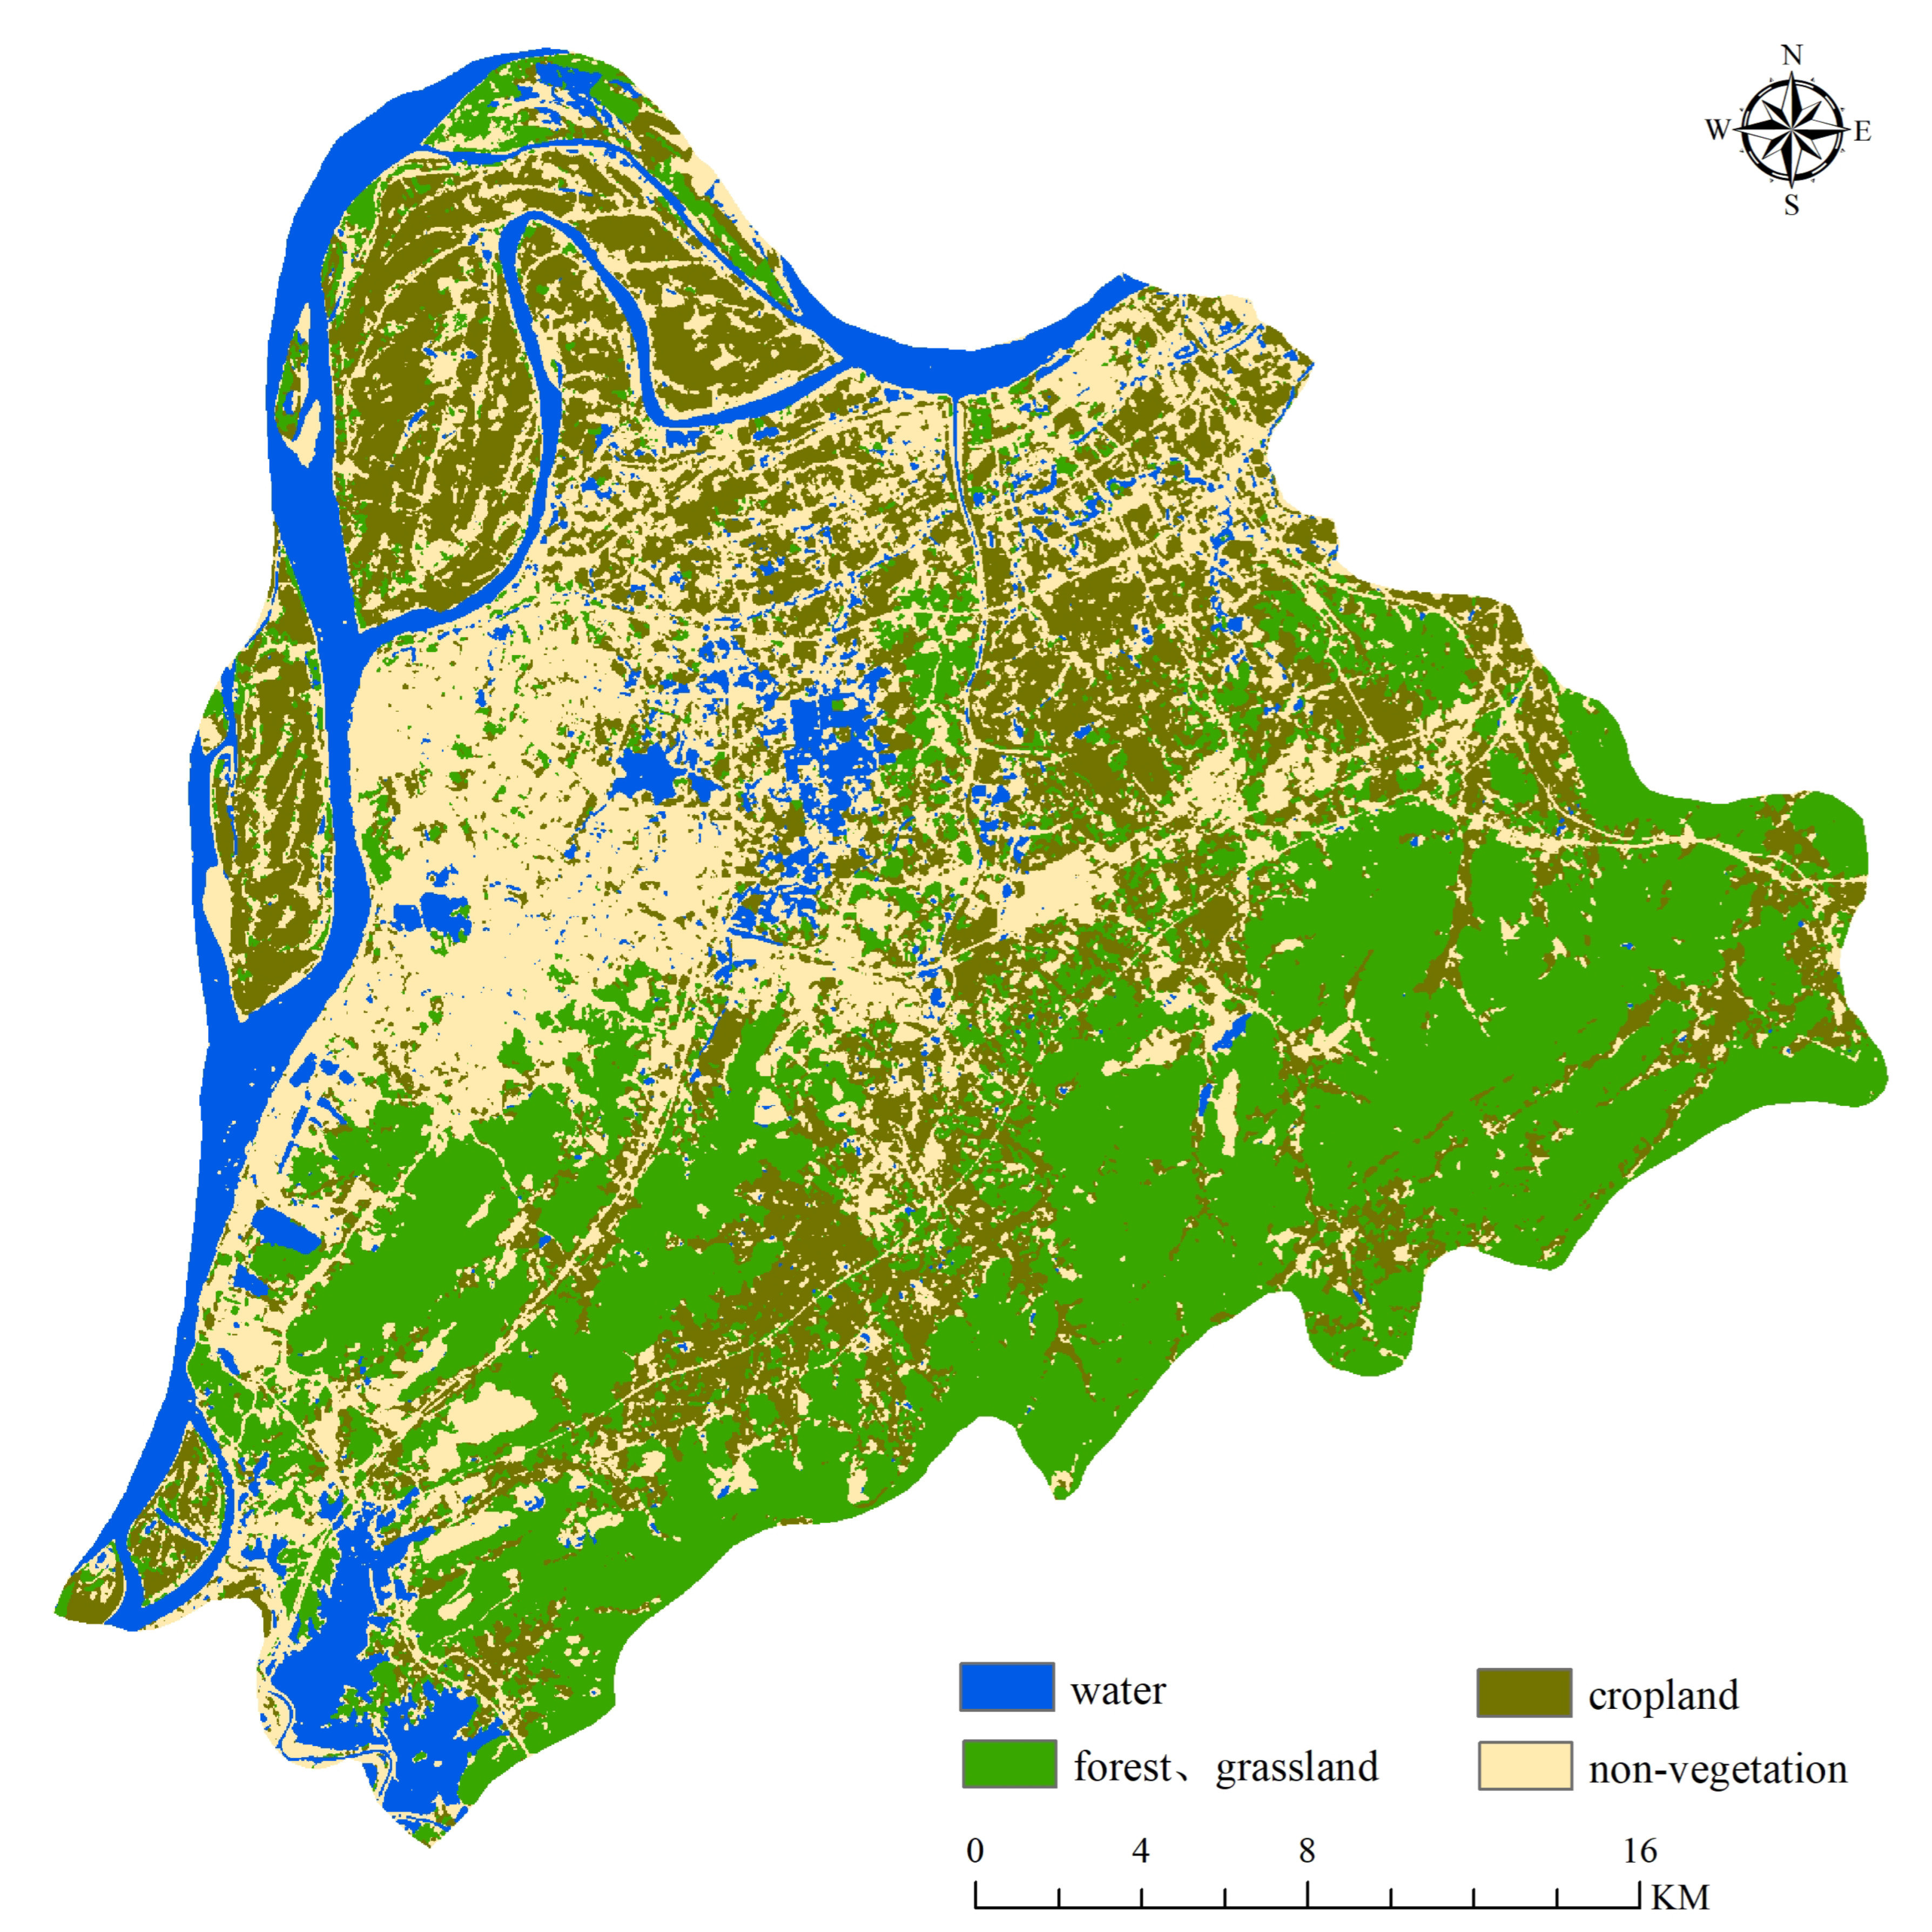
To further analyze the causes of ecological change in Tongling Mining area, Figure 5 lists the spatial distribution map of land cover in Tongling City. As can be seen from Figure 5, woodland and grassland in Tongling city are mainly concentrated in the south, while the Yangtze River runs across Tongling City from west to east and cultivated land and artificial surfaces are mainly distributed along the river. As can be seen from Figure 5, the crop land area decreased significantly from 2000 to 2020, while the artificial surface area increased significantly, and the increased area was in the central and eastern riverside zone of Tongling City.
Table 5 and Table 6 show the specific land cover classification area from 2000 to 2020. As can be seen from Table 5, from 2000 to 2010, the land cover classification area from high to bottom is crop land > forest land, grassland > water > artificial surface. The water area in Tongling was almost unchanged, and the crop land area increased by 24.12 km2, mainly from forest land and grassland. The area of man-made land increased slightly, and the area of forest and grassland decreased by 23.85 km2.
In Table 6, from 2010 to 2020, the land cover classification area from high to low is crop land > artificial surface > forest land, grassland > water. The area of water area was flat, the area of forest land and grassland increased slightly, and the area of artificial land increased significantly, increasing to 124.60 km2. The area of crop land decreased significantly, from 478.84 km2 to 273.21 km2, and mainly changed to artificial land, forest land, and grassland. According to the results of Table 5 and Table 6, combined with Figure 5, the urban expansion of Tongling city is mainly completed on crop land, and it expands to the northeast based on the urban expansion in 2000.

3.4. Landscape Pattern Variations of Tongling

Landscape-level metrics can measure the overall structure, function, or changes of the entire region by computing all patches. Those indexes could be used to calculate dominance, evenness, diversity, fractal dimension, clumpy, the habitat fragmentation index, etc. In this study, after careful selection, six landscape-level metrics were applied to identify these features (Table 7).
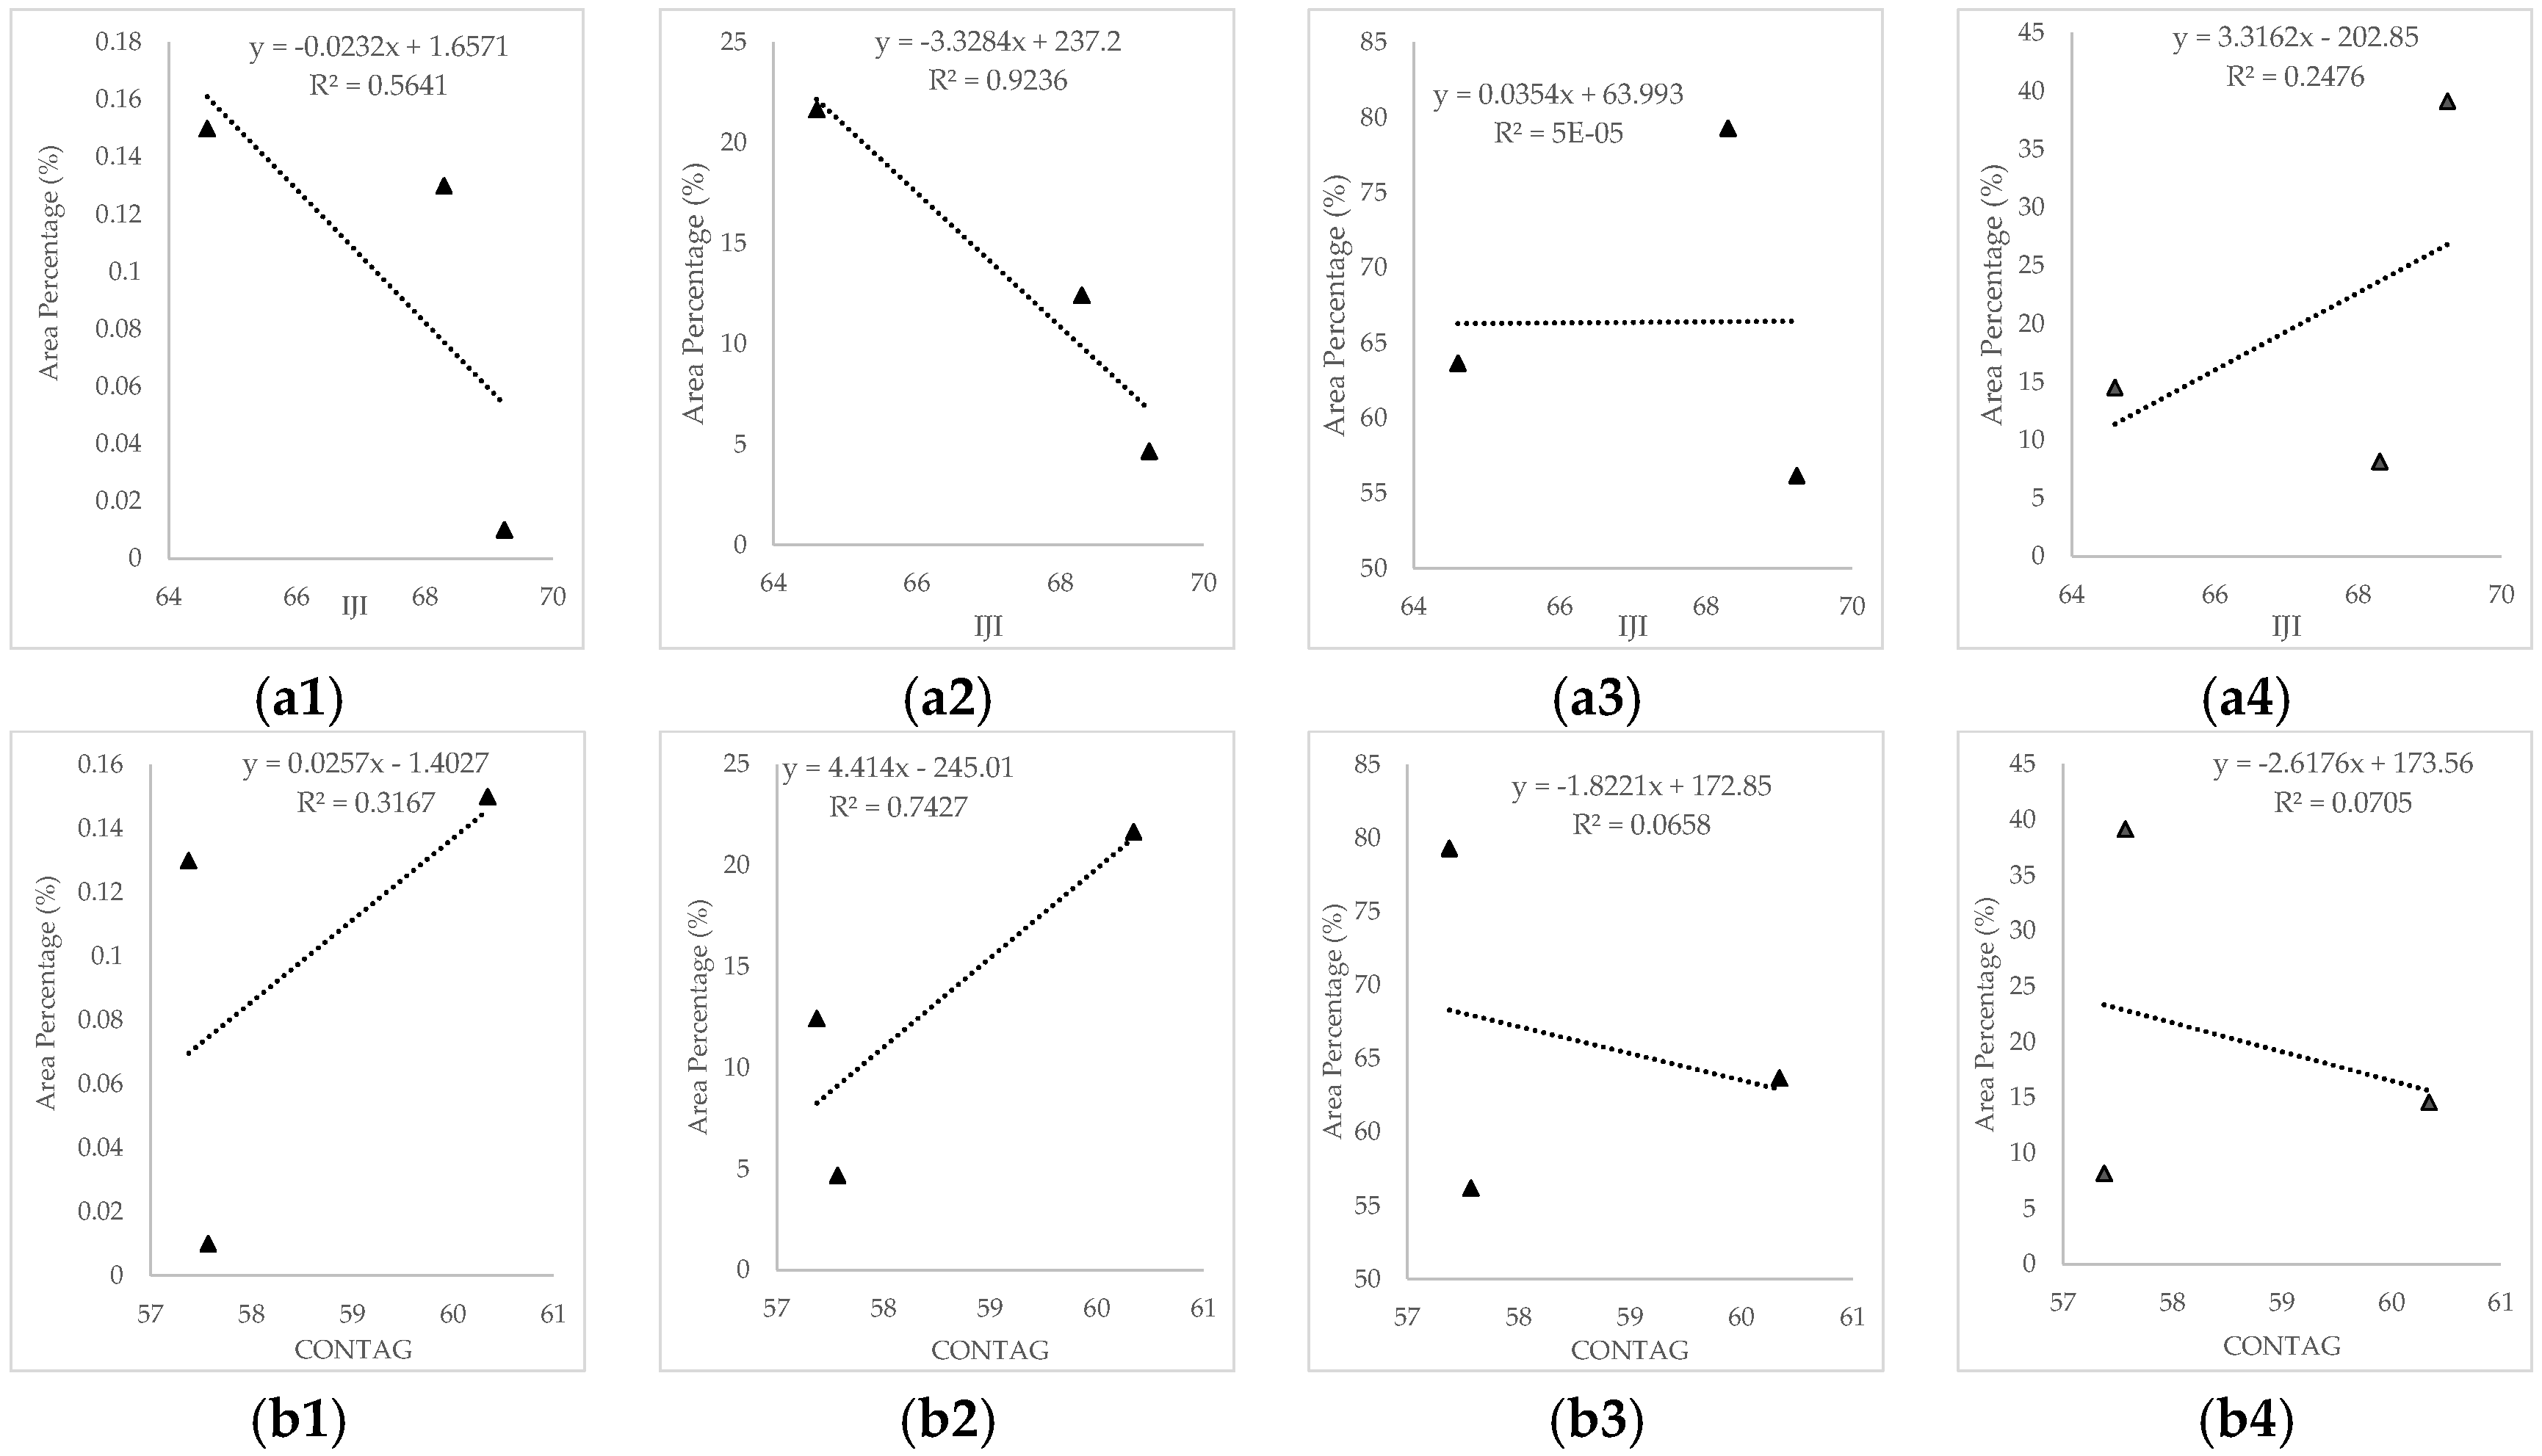
IJI, the shortened form of the ‘interspersion and juxtaposition index’, measures the patch adjacency and the degree of the interspersion or intermixing of patch types. During the study period, the value of IJI first decreased and then increased, showing a downward trend. The significance of this index is opposite to CONTAG. The smaller its value is, the more landscape types tend to be composed of large patches, and the more stable the ecological environment is. CONTAG indicators, the abbreviation of the ‘contagion index’, describe the degree of agglomeration or extension of different patch types in a landscape. High sprawl indicates that some dominant patch types in the landscape form good connectivity. On the contrary, it indicates that the landscape is a dense pattern with many elements, and the fragmentation degree of the landscape is high. From 2000 to 2020, the value of CONTAG increased first, then decreased, but was still higher than the first period. It shows that the patch area increased from 2000 to 2010. Combined with land cover change data, woodland and grassland patches decreased while cultivated land patches increased during this period. Therefore, it is highly likely that the increase in the CONTAG value is caused by the increase in cultivated land area. From 2010 to 2020, the CONTAG value decreased, meaning that the number of patches increased, and the average area decreased. Combined with the land cover change data, the cultivated area decreased during this period, which was transformed into an artificial surface. The decrease in the CONTAG value may be related to the increase in small construction land patches in Tongling during the study period.
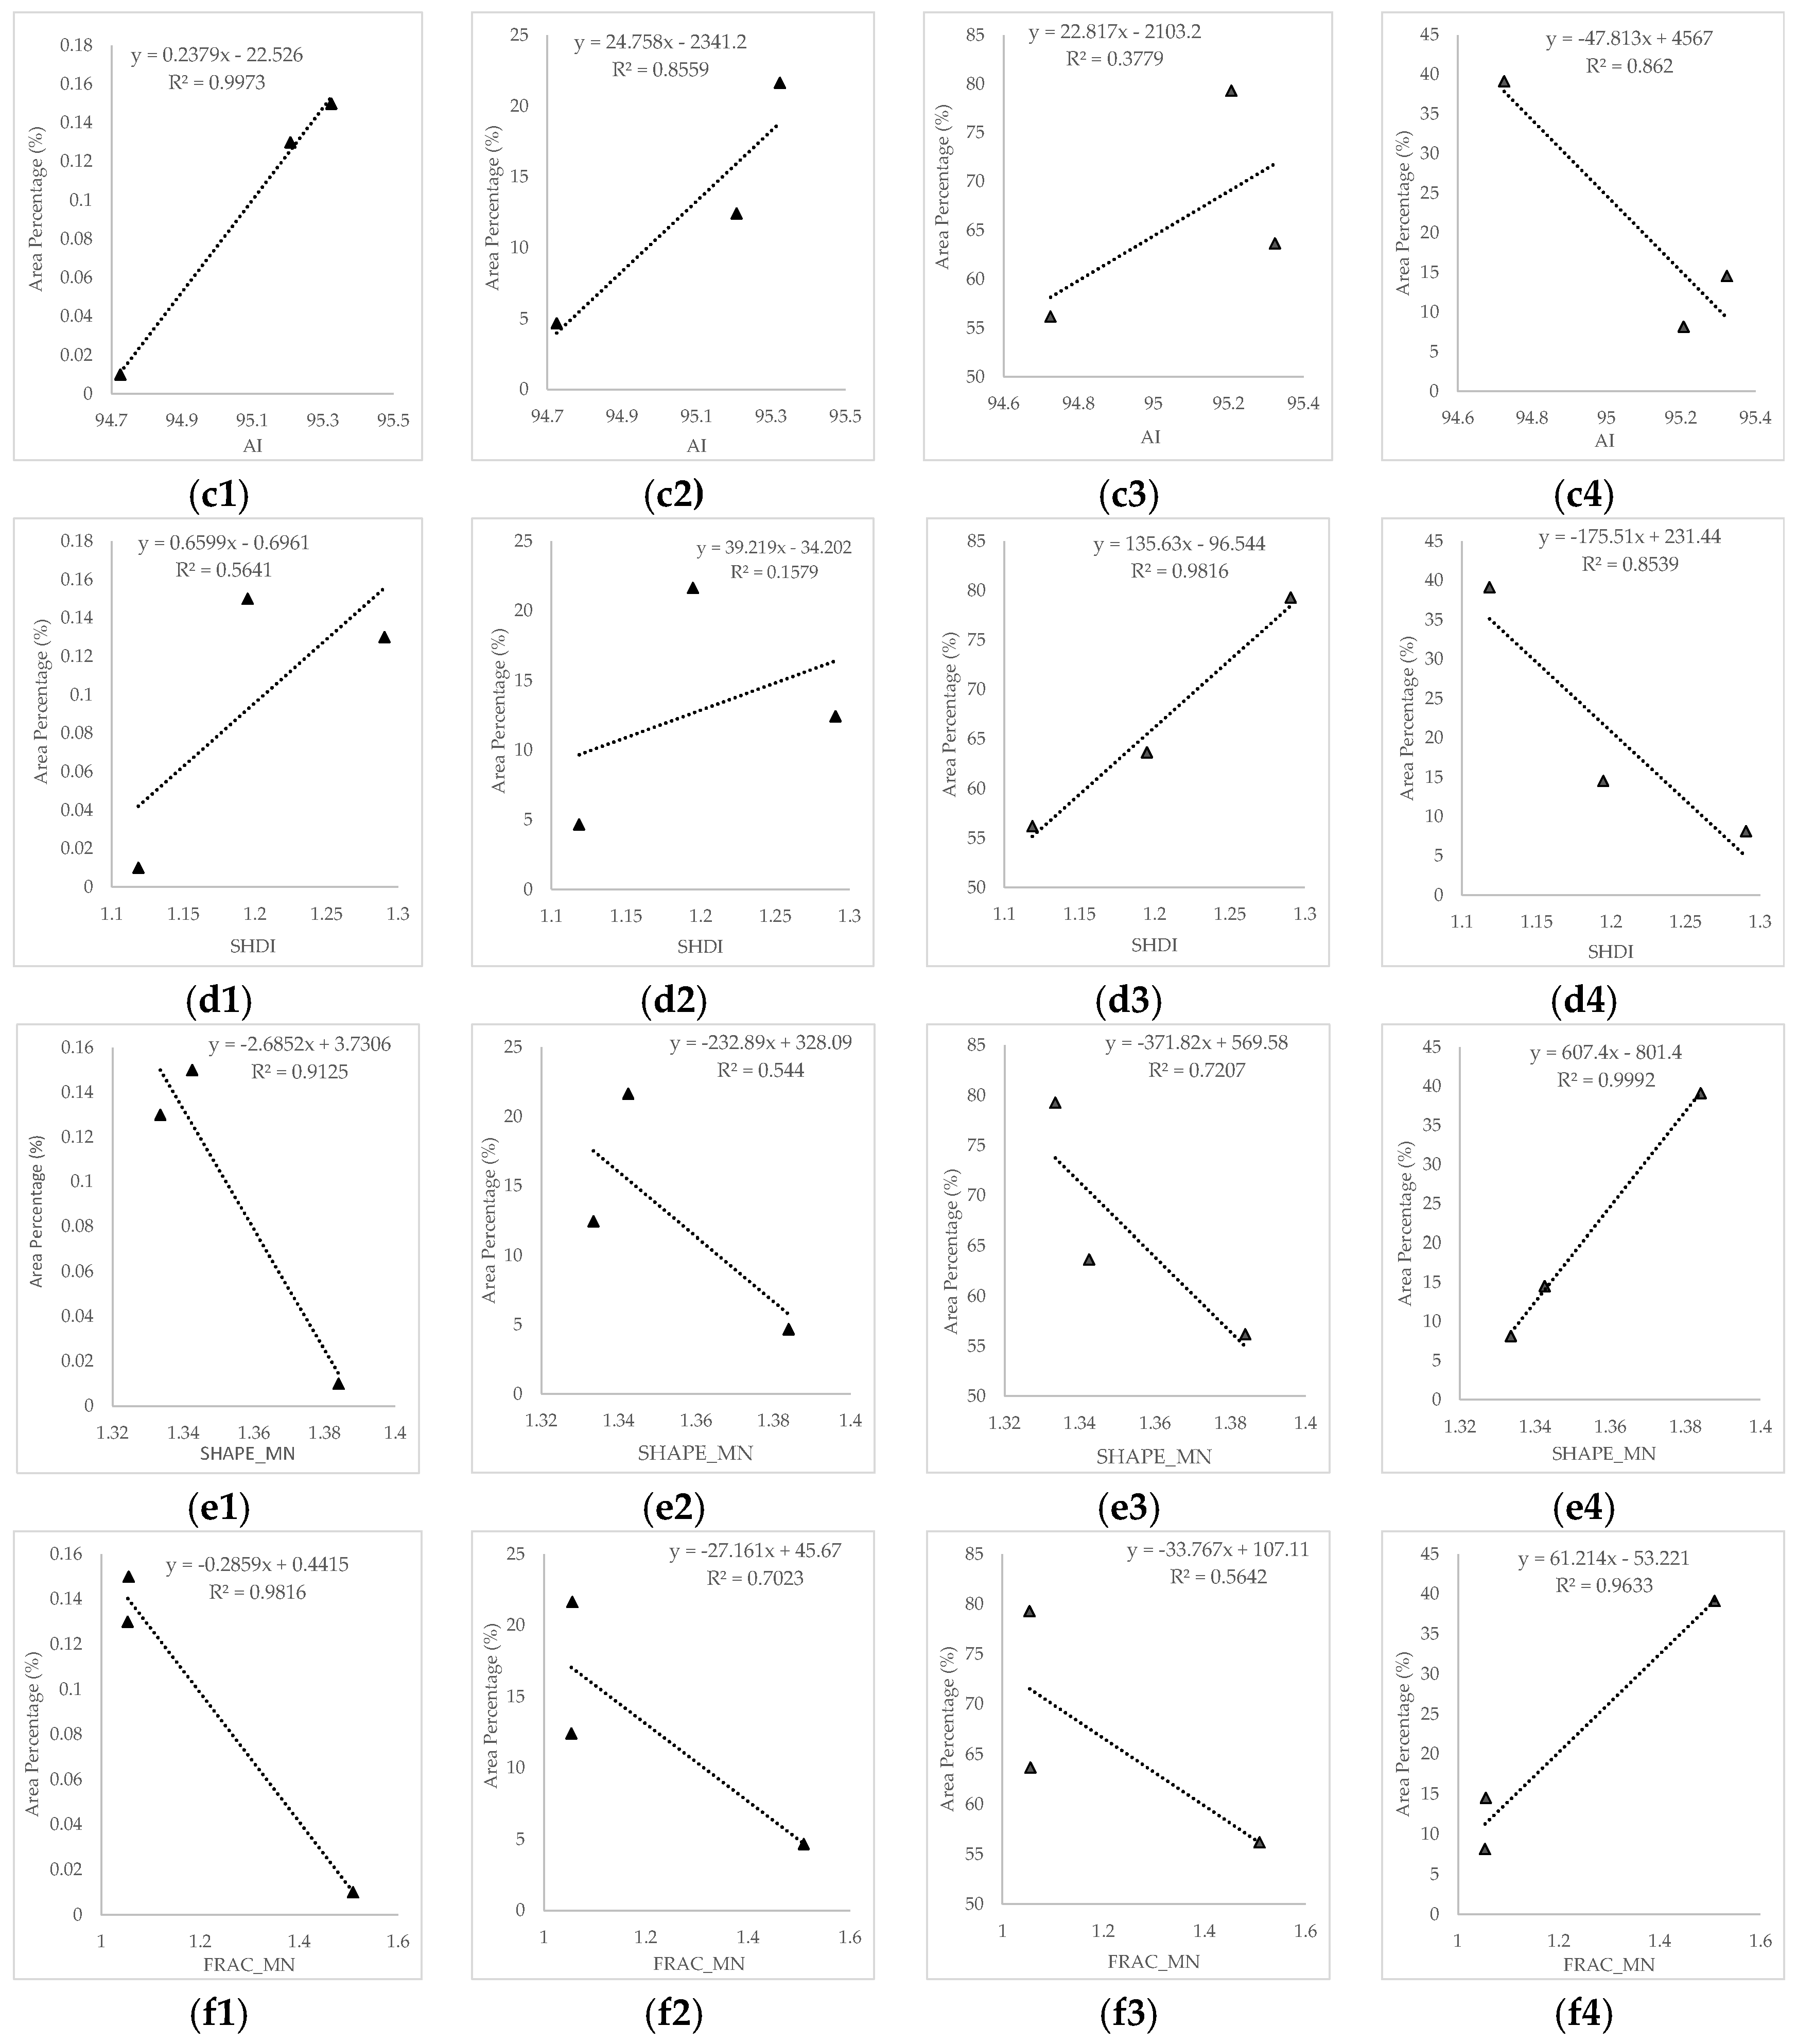
AI is the shortened version of the ‘aggregation index’. The smaller the value is, the more discrete the landscape is. Combined with CONTAG data, the Combined AI value increased by 0.483% from 2000 to 2020. Further, we observed the improvement of patches aggregation.
SHDI is the shortened version of ‘Shannon’s diversity index’. This index can reflect landscape heterogeneity and is especially sensitive to the uneven distribution of patch types in the landscape. It was applied here to reflect the diversity of RSEI Grades. From 2000 to 2020, SHDI has been increasing, representing the patches becoming more complex. Combined with land cover change data, during the study period, the rapid expansion of construction land and the accompanying decrease in cultivated land area, together with the increase in woodland and grassland to varying degrees, led to the increase in landscape diversity. Consistent with the conclusion of Yang [46], SHDI in the Yangtze River Basin studied by Yang has been increasing from 2001 to 2019. By 2019, SHDI increased to 1.25. In Tongling City, SHDI reached 1.29 in 2020, which may be related to the resolution of pixels. In this paper, 30 m was adopted, while Yang [47] adopted 500 m.
SHAPE_MN is used to reflect the complexity of shapes. From 2000 to 2020, the value of SHAPE_MN has been declining, and the decrease from 2000 to 2010 is larger than that from 2010 to 2020. This means that the shape of patches was becoming more regular.
FRAC_MN, the abbreviation of ‘mean patch fractal Dimension’, also measures the patch shape complexity. Similar to SHAPE_MN, it has been declining during the study period, among which the decline rate from 2000 to 2010 is larger than that from 2010 to 2020, further demonstrating that the shape of patches was becoming more regular.
In conclusion, from 2000 to 2020, the change in landscape metrics in Tongling city may have been caused by the decrease in cultivated land area and the rapid expansion of construction land. That is, urban expansion causes changes in landscape metrics.

3.5. Landscape Pattern Change Impact on RSEI

Landscape changes have had an impact on RSEI. The relationship between RSEI grades and landscape-level metrics is analyzed in Figure 6. Changes in Landscape have different effects on different ecological levels. In the Inferior grade, the R2 of AI, FRAC_MN, and SHAPE_MN components all exceed 0.91, showing a high correlation. The remaining three components also have a high correlation with the RSEI of the ecological Inferior grade, with R2 greater than 0.31. In the Medium grade, IJI has the highest correlation, followed by AI component > CONTAG component > FRAC_MN, and R2 exceeds 0.70. The SHDI component has the lowest R2, which is weakly correlated with the RSEI of the Medium grade. In the Good grade, the SHDI component had a high correlation with the RSEI of this grade, while IJI and CONTAG components had a very weak correlation with the RSEI of the Good grade. In the Excellent grade, SHAPE_MN, FRAC_MN, AI, and SHDI components are highly correlated with the RSEI of this grade, while the CONTAG component has a very weak correlation with the RSEI of the Excellent grade.
Besides those poor correlations, RSEI is generally well correlated with landscape changes. This indirectly indicates that the change in landcover affects RSEI. However, these effects are different. SHAPE_MN, FRAC_MN and IJI components have a strong negative correlation with the RSEI of Inferior, Medium, and Good grades, while having a strong positive correlation with Excellent grades. AI and SHDI components have a strong positive correlation with the RSEI of Inferior, Medium, and Good grades, and a strong negative correlation with Excellent grades.
The results showed that most landscape-level metrics were positively or negatively correlated with RSEI. If the ecological grade of Tongling city is improved to the Excellent grade, it can be achieved by increasing FRAC_MN and SHAPE_MN components and reducing AI and SHDI components. The results are consistent with those obtained by Ji [25] and Wang [42]. In other words, the more concentrated the distribution of land cover type is, the less the change is, and the more the regional RSEI can be improved.

3.6. Evaluation of Ecological Environment Quality in Tongling Open-Pit Mining Area

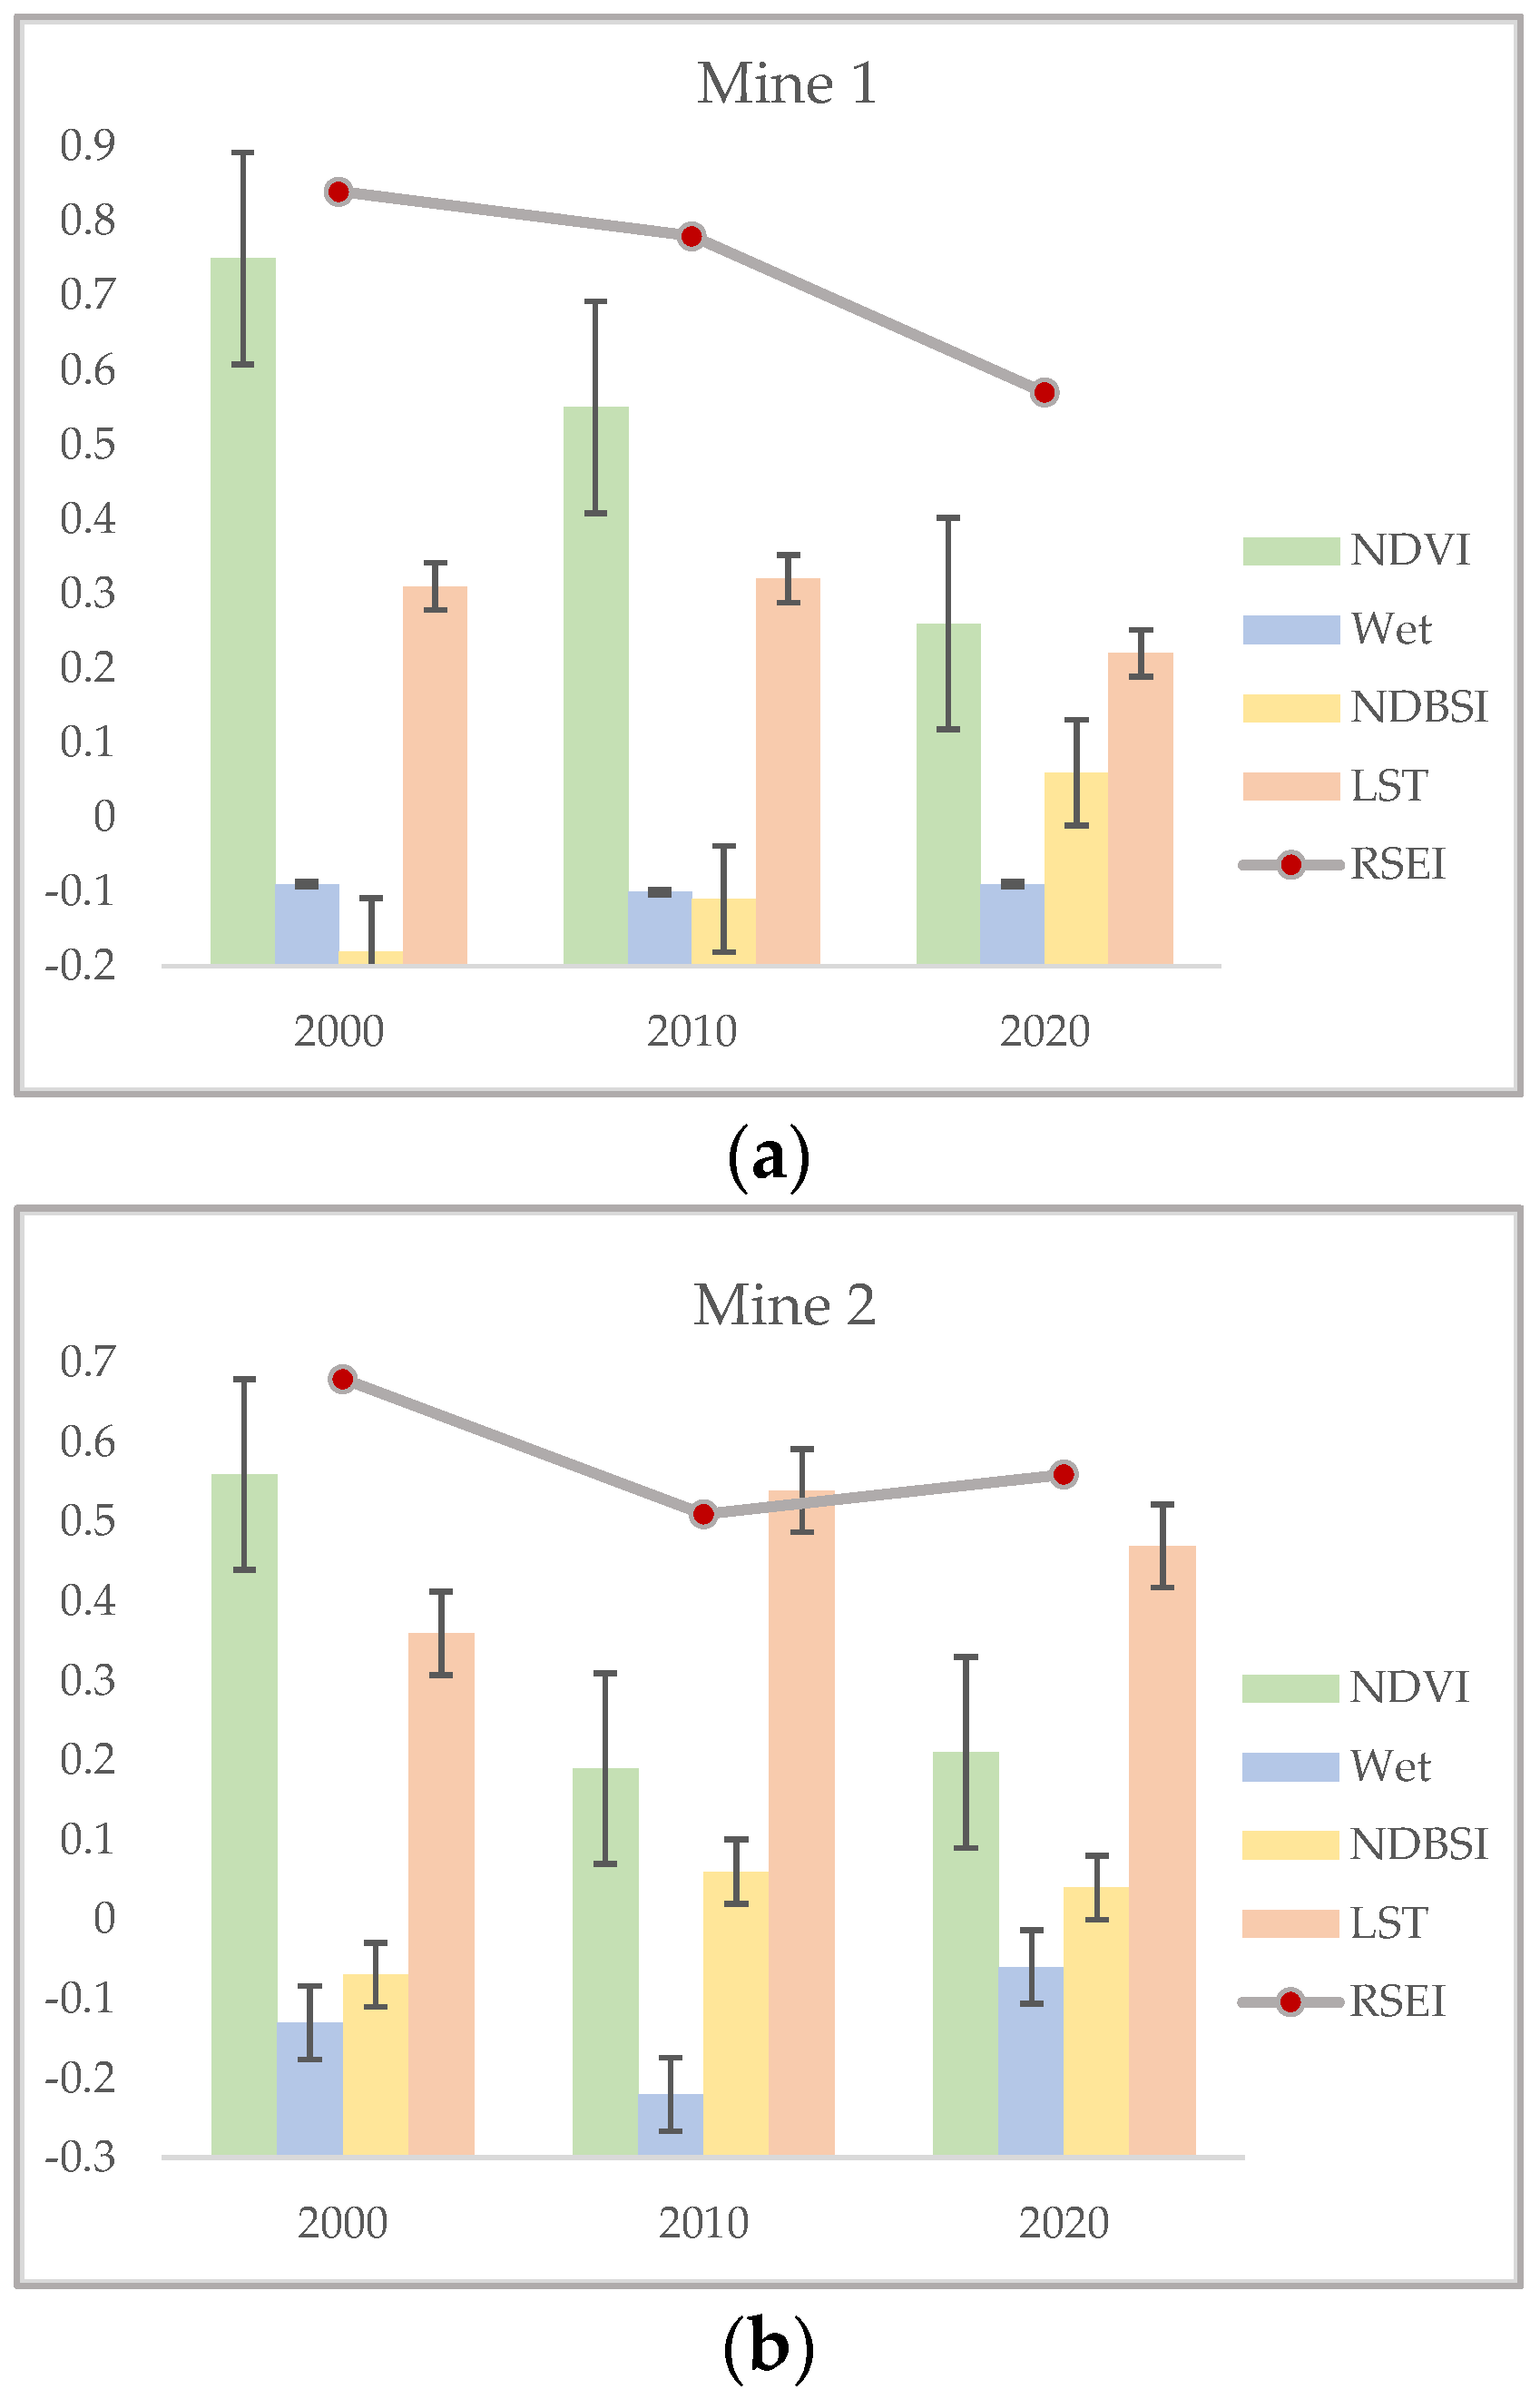
In Figure 7, Mine 1 and Mine 2 were selected to analyze the annual changes of the four indicators and RSEI. The results show that RSEI is very integrative regarding the four aspects of greenness, wetness, dryness, and heat. RSEI values comprehensively reflect and quantitatively describe the ecological quality and can effectively reflect the ecological changes of Mine 1 and Mine 2. Among these four indicators, NDVI and Wet decrease with the decrease in RSEI, and NDBSI and LST increase with the decrease in RSEI. Among them, the changes in Wet and LST are not as obvious as those of NDVI and NDBSI. This conclusion also verifies the results of the correlation test in Table 2.
Table 8 summarizes the analysis results of RSEI of ten open-pit mining areas in Tongling city. It can be seen from Table 8 that the mean value of RESI of the open-pit mining areas in Tongling city decreased significantly from 2000 to 2010, with a maximum decline of 44.83%, indicating that the ecological environmental quality of these mining areas declined. From the four sub-indexes, the greenness index, which had a positive effect on the ecological environment, decreased, but the dryness index, which had a negative effect on the ecological environment, increased more, and the negative effect offset the positive effect. Therefore, the quality of the ecological environment in these mining areas has become worse. Among them, the mean RSEI of Mine 3 and Mine 9 both decreased by more than 40%, NDVI decreased by more than 65%, and the correlation was more obvious, which further proved the rationality and effectiveness of RSEI. This result is consistent with the conclusion of GAO [47].
From 2010 to 2020, the mean value of RESI of Mine 2, Mine 3, and Mine 4 in the east of Tongling city increased slightly, but the mean value of RSEI of seven large mining areas in the west continued to decline, with Mine 1 having the largest decline. It belongs to the Anhui Tongling Conch Cement Company. The company is currently one of the largest single-plant clinker production bases in the world, with an annual production capacity of 10 million tons of clinker and 5.8 million tons of cement. The Mine 1 open-pit mining area was established in 2011. The research results show that before 2010, that is, before mining in this area, RESI was always greater than 0.75, and the RESI around it was in the range of 0.8~1. By 2020, the RSEI of the mine area had decreased to 0.57, while the RSEI of the surrounding area was around 0.6. After mining for 9 years in the Mine 1 open-pit mining area, RESI in surrounding areas decreased by more than 0.3, with a decrease rate of 0.034/year. The results show that mining will not only change the ecological environment of the mining area, but also radially affect the ecological environmental quality of the surrounding area [18].
Combing the further analysis of land cover and landscape, land cover change causes landscape change. However, most landscape-level metrics are positively or negatively correlated with RSEI. This indirectly proves that land cover change affects RSEI. During the study period, the rapid expansion of construction land and the concomitant decrease in the cultivated land area led to changes in landscape metrics, resulting in fluctuations in RSEI. Therefore, urban expansion is one of the reasons for the deterioration of ecological environment quality in Tongling city, which is consistent with the result of Hu [8]. Besides, open-pit mining will also have an impact on the ecological environment of this city. From 2010 to 2020, RSEI increased and environmental quality became better in the northern and central parts of Tongling city, while ecological environmental quality continued to decline in the southern part of Tongling city, mainly due to the obvious disturbance of open-pit mining area. Ten open-pit mining areas are all located in the southern mountainous area of Tongling city, and the RSEI of seven mining areas decreased significantly, with the largest decrease of 36.85%. This stage is the mining development period of Tongling city, resulting in the decline of ecological quality in the southern mountainous area. This is consistent with the research conclusion of Zhu [18,40]. It shows that the main driving factor of ecological environment deterioration is the change in land use/cover, most of which comes from urban expansion. Furthermore, in mining cities, open-pit mining will have a more serious impact on the ecological environment of the cities.
In conclusion, land cover change is restricted by natural, social, economic, and technological conditions. Natural factors set the basic outline of land cover. However, over centuries, environmental changes caused by human factors such as industrialization, urbanization, economy, and technology even exceed those caused by natural factors in intensity and have a decisive impact on short-term changes in land cover. Especially for mining areas, social and economic factors are more important. Specifically, with the acceleration of urbanization and industrialization, more areas of cultivated land at the edge of cities and towns have been transformed into mining areas and residential areas, and leading industries such as mining have promoted the employment of local people. At the same time, it also leads to the transfer of the labor force, which in turn will change the traditional farming mode and lead to the destruction of the ecological environment.

4. Conclusions

In this paper, three Landsat satellite images from 2000 to 2020 were used in the ENVI 5.3 platform for radiometric calibration, atmospheric correction, and other pre-processing, the indicators of greenness, humidity, dryness, and heat were extracted year by year to construct RSEI, and land cover data of corresponding years were extracted as well. Landscape metrics were calculated in Fragstats 4.2, and combined with opencast mine information, the temporal and spatial changes of regional ecological quality at three different periods in Tongling, a typical mining city, in the most recent 20 years were analyzed. The following conclusions are drawn.
Firstly, NDVI and WET were positively correlated with RSEI, while NDBSI and LST were negatively correlated with RSEI. The correlation coefficient between NDBSI and RSEI was the largest, indicating that urban expansion would cause ecological environment deterioration to a certain extent. Therefore, urban planning should consider the ecological environment, balance the relationship between urban development and ecological environment quality, and promote sustainable urban development.
Secondly, from 2000 to 2010, the mean value of RSEI decreased by 0.07 (10.83%), and the proportion of the ecological grade increased significantly from 4.66% to 21.65%, that of the good grade increased by 7.48%, and that of the excellent grade decreased by 24.61%. From 2010 to 2020, the mean value of RSEI increased by 0.007 and remained almost unchanged. However, the proportion of areas with a medium ecological grade decreased by 9.23%, that with a good ecological grade increased to 79.30%, and that with an excellent grade decreased from 14.54% to 8.15%. In general, the ecological quality of Tongling city showed a downward trend of “decline-rising” during the study period.
Thirdly, From the perspective of space, ecological quality has obvious spatial heterogeneity, and the poor level of RSEI is mainly distributed in the central urban area and the open-pit mining area in the south. Ecological degradation is attributed to the rapid expansion of built-up areas and the development of the mining industry, which is characterized by the significant increase in normalized built-up area and soil index values in these areas.
Fourthly, the relationship between landscape-level metrics and RSEI grade percentage represented that most landscape-level metrics had a positive or negative correlation. The change in land cover resulted in a change in the landscape index. This indirectly proves that land cover change affects RSEI. During the study period, the rapid expansion of construction land and the concomitant decrease in the cultivated land area led to changes in landscape metrics, resulting in fluctuations in RSEI. If the ecological grade of Tongling city is raised to an Excellent grade, it can be achieved by reducing land cover change. This conclusion does not necessarily apply elsewhere.
At last, from 2000 to 2020, the mean value of RESI of ten open-pit mining areas in Tongling city decreased significantly, with a maximum decrease of 52.73%. The decline rate of RESI in the area surrounding the No.1 open-pit mine was 0.034/year. It is quantitatively proven that mining will not only change the ecological environment of the mining area but also radially affect the ecological environment quality of surrounding areas.

Author Contributions

H.T.: Conceptualization, writing—original draft. J.F.: Methodology, software, visualization. R.X.: Data curation, formal analysis. X.J.: Investigation. D.L.: Validation. J.Y.: Writing—review and editing, supervision. All authors have read and agreed to the published version of the manuscript.

Funding

The APC was funded by the Scientific research project of Education Department of Anhui Province [KJ2021A1051].

Institutional Review Board Statement

Not applicable.

Informed Consent Statement

Informed consent was obtained from all subjects involved in the study.

Data Availability Statement

Data used for this study is available, as per cited references, as well as in the available tables.

Acknowledgments

Acknowledgement for the data support from“ Loess plateau science data center, National Earth System Science Data Sharing Infrastructure, National Science & Technology Infrastructure of China. (http://loess.geodata.cn)”.

Conflicts of Interest

The authors declare that they have no known competing financial interests or personal relationships that could have appeared to influence the work reported in this paper.

References

  1. Liao, W.; Jiang, W. Evaluation of the spatiotemporal variations in the eco-environmental quality in China based on the remote sensing ecological index. Remote Sens. 2020, 12, 2462. [Google Scholar] [CrossRef]
  2. Shrestha, N.K.; Leta, O.T.; De Fraine, B.; van Griensven, A.; Bauwens, W. OpenMI-based integrated sediment transport modelling of the river Zenne, Belgium. Environ. Model. Softw. 2013, 47, 193–206. [Google Scholar] [CrossRef]
  3. Popovic, V.; Miljkovic, J.Ž.; Subic, J.; Jean-Vasile, A.; Adrian, N.; Nicolaescu, E. Sustainable land management in mining areas in Serbia and Romania. Sustainability 2015, 7, 11857–11877. [Google Scholar] [CrossRef] [Green Version]
  4. Yuan, J.; Elektorowicz, M. Extended environmental multimedia modeling system assessing the risk carried by pollutants in interacted air-unsaturated-groundwater zones. J. Hazard. Mater. 2020, 381, 120852. [Google Scholar] [CrossRef]
  5. Li, Z.; Ma, Z.; van der Kuijp, T.J.; Yuan, Z.; Huang, L. A review of soil heavy metal pollution from mines in China: Pollution and health risk assessment. Sci. Total Environ. 2014, 468–469, 843–853. [Google Scholar] [CrossRef] [PubMed]
  6. Cao, W.; Li, R.; Chi, X.; Chen, N.; Chen, J.; Zhang, H.; Zhang, F. Island urbanization and its ecological consequences: A case study in the Zhoushan Island, East China. Ecol. Indic. 2017, 76, 1–14. [Google Scholar] [CrossRef]
  7. Hu, X.; Xu, H. A new remote sensing index for assessing the spatial heterogeneity in urban ecological quality: A case from Fuzhou City, China. Ecol. Indic. 2018, 89, 11–21. [Google Scholar] [CrossRef]
  8. Hu, X.; Xu, H. A new remote sensing index based on the pressure-state-response framework to assess regional ecological change. Environ. Sci. Pollut. Res. 2019, 26, 5381–5393. [Google Scholar] [CrossRef] [PubMed]
  9. U.S. Environmental Protection Agency. Environmental Quality Index—Technical Report, 2006–2010; U.S. Environmental Protection Agency: Washington, DC, USA, 2020.
  10. Shang, D.; Yin, G.; Li, X.; Li, Y.; Jiang, C.; Kang, X.; Liu, C.; Zhang, C. Analysis for Green Mine (phosphate) performance of China: An evaluation index system. Resour. Policy 2015, 46, 71–84. [Google Scholar] [CrossRef]
  11. Yu, H.; Zhao, J. The impact of environmental conditions on urban eco-sustainable total factor productivity: A case study of 21 cities in guangdong province, china. Int. J. Environ. Res. Public Health 2020, 17, 1329. [Google Scholar] [CrossRef]
  12. Roerink, G.J.; Danes, M.H.G.I. Quantification of Ecological Changes by Remote Sensing. EGU Gen. Assem. Conf. Abstr. 2010, 12, 4643. [Google Scholar]
  13. Willis, K.S. Remote sensing change detection for ecological monitoring in United States protected areas. Biol. Conserv. 2015, 182, 233–242. [Google Scholar] [CrossRef]
  14. Ju, W.; Gao, P.; Wang, J.; Zhou, Y.; Zhang, X. Combining an ecological model with remote sensing and GIS techniques to monitor soil water content of croplands with a monsoon climate. Agric. Water Manag. 2010, 97, 1221–1231. [Google Scholar] [CrossRef]
  15. Li, Y.; Cao, Z.; Long, H.; Liu, Y.; Li, W. Dynamic analysis of ecological environment combined with land cover and NDVI changes and implications for sustainable urban–rural development: The case of Mu Us Sandy Land, China. J. Clean. Prod. 2017, 142, 697–715. [Google Scholar] [CrossRef]
  16. Shan, W.; Jin, X.; Ren, J.; Wang, Y.; Xu, Z.; Fan, Y.; Gu, Z.; Hong, C.; Lin, J.; Zhou, Y. Ecological environment quality assessment based on remote sensing data for land consolidation. J. Clean. Prod. 2019, 239, 118126. [Google Scholar] [CrossRef]
  17. Jing, Y.; Zhang, F.; He, Y.; Kung, H.-t.; Johnson, V.C.; Arikena, M. Assessment of spatial and temporal variation of ecological environment quality in Ebinur Lake Wetland National Nature Reserve, Xinjiang, China. Ecol. Indic. 2020, 110, 105874. [Google Scholar] [CrossRef]
  18. Zhu, D.; Chen, T.; Zhen, N.; Niu, R. Monitoring the effects of open-pit mining on the eco-environment using a moving window-based remote sensing ecological index. Environ. Sci. Pollut. Res. 2020, 27, 15716–15728. [Google Scholar] [CrossRef] [PubMed]
  19. Imhoff, M.L.; Zhang, P.; Wolfe, R.E.; Bounoua, L. Remote sensing of the urban heat island effect across biomes in the continental USA. Remote Sens. Environ. 2010, 114, 504–513. [Google Scholar] [CrossRef] [Green Version]
  20. Sandholt, I.; Rasmussen, K.; Andersen, J. A simple interpretation of the surface temperature/vegetation index space for assessment of surface moisture status. Remote Sens. Environ. 2002, 79, 213–224. [Google Scholar] [CrossRef]
  21. Xu, H.Q. A remote sensing urban ecological index and its application. Shengtai Xuebao Acta Ecol. Sin. 2013, 33, 7853–7862. [Google Scholar] [CrossRef]
  22. Niu, X.; Li, Y. Remote sensing evaluation of ecological environment of anqing city based on remote sensing ecological index. Int. Arch. Photogramm. Remote Sens. Spat. Inf. Sci. ISPRS Arch. 2020, 43, 733–737. [Google Scholar] [CrossRef]
  23. Bai, X.; Du, P.; Guo, S.; Zhang, P.; Lin, C.; Tang, P.; Zhang, C. Monitoring land cover change and disturbance of the Mount Wutai World cultural landscape heritage protected area, based on remote sensing time-series images from 1987 to 2018. Remote Sens. 2019, 11, 1332. [Google Scholar] [CrossRef] [Green Version]
  24. Yue, H.; Liu, Y.; Li, Y.; Lu, Y. Eco-environmental quality assessment in china’s 35 major cities based on remote sensing ecological index. IEEE Access 2019, 7, 51295–51311. [Google Scholar] [CrossRef]
  25. Ji, J.; Wang, S.; Zhou, Y.; Liu, W.; Wang, L. Spatiotemporal Change and Landscape Pattern Variation of Eco-Environmental Quality in Jing-Jin-Ji Urban Agglomeration from 2001 to 2015. IEEE Access 2020, 8, 125534–125548. [Google Scholar] [CrossRef]
  26. Wen, X.; Ming, Y.; Gao, Y.; Hu, X. Dynamic monitoring and analysis of ecological quality of pingtan comprehensive experimental zone, a new type of sea island city, based on RSEI. Sustainability 2020, 12, 21. [Google Scholar] [CrossRef] [Green Version]
  27. Karbalaei Saleh, S.; Amoushahi, S.; Gholipour, M. Spatiotemporal ecological quality assessment of metropolitan cities: A case study of central Iran. Environ. Monit. Assess. 2021, 193, 305. [Google Scholar] [CrossRef]
  28. Li, Y.; Wu, L.; Han, Q.; Wang, X.; Zou, T.; Fan, C. Estimation of remote sensing based ecological index along the Grand Canal based on PCA-AHP-TOPSIS methodology. Ecol. Indic. 2020, 122, 107214. [Google Scholar] [CrossRef]
  29. Wu, S.; Gao, X.; Lei, J.; Zhou, N.; Guo, Z.; Shang, B. Ecological environment quality evaluation of the Sahel region in Africa based on remote sensing ecological index. J. Arid Land 2022, 14, 14–33. [Google Scholar] [CrossRef]
  30. Sun, J.; Hu, Y.; Li, Y.; Weng, L.; Bai, H.; Meng, F.; Wang, T.; Du, H.; Xu, D.; Lu, S. A Temporospatial Assessment of Environmental Quality in Urbanizing Ethiopia. arXiv 2022, arXiv:4051452. [Google Scholar] [CrossRef]
  31. Zhang, T.; Yang, R.; Yang, Y.; Li, L.; Chen, L. Assessing the urban eco-environmental quality by the remote-sensing ecological index: Application to Tianjin, North China. ISPRS Int. J. Geo Inf. 2021, 10, 475. [Google Scholar] [CrossRef]
  32. Yang, X.; Bai, Y.; Che, L.; Qiao, F.; Xie, L. Incorporating ecological constraints into urban growth boundaries: A case study of ecologically fragile areas in the Upper Yellow River. Ecol. Indic. 2021, 124, 107436. [Google Scholar] [CrossRef]
  33. Zhu, Q.; Guo, J.; Guo, X.; Chen, L.; Han, Y.; Liu, S. Relationship between ecological quality and ecosystem services in a red soil hilly watershed in southern China. Ecol. Indic. 2021, 121, 107119. [Google Scholar] [CrossRef]
  34. Yuan, B.; Fu, L.; Zou, Y.; Zhang, S.; Chen, X.; Li, F.; Deng, Z.; Xie, Y. Spatiotemporal change detection of ecological quality and the associated affecting factors in Dongting Lake Basin, based on RSEI. J. Clean. Prod. 2021, 302, 126995. [Google Scholar] [CrossRef]
  35. Hang, X.; Luo, X.-C.; Cao, Y.; Li, Y.-C. Ecological quality assessment and the impact of urbanization based on RSEI model for Nanjing, Jiangsu Province, China. Ying Yong Sheng Tai Xue Bao J. Appl. Ecol. 2020, 31, 219–229. [Google Scholar] [CrossRef]
  36. Yang, H.; Wang, Z.; Zhao, H.; Guo, Y. Water body extraction methods study based on RS and GIS. Procedia Environ. Sci. 2011, 10, 2619–2624. [Google Scholar] [CrossRef] [Green Version]
  37. Gao, B. NDWI—A normalized difference water index for remote sensing of vegetation liquid water from space. Remote Sens. Environ. 1996, 58, 257–266. [Google Scholar] [CrossRef]
  38. Liao, W.; Nie, X.; Zhang, Z. Interval association of remote sensing ecological index in China based on concept lattice. Environ. Sci. Pollut. Res. 2022, 29, 34194–34208. [Google Scholar] [CrossRef]
  39. Xue, L.; Yang, F.; Yang, C.; Wei, G.; Li, W.; He, X. Hydrological simulation and uncertainty analysis using the improved TOPMODEL in the arid Manas River basin, China. Sci. Rep. 2018, 8, 452. [Google Scholar] [CrossRef] [Green Version]
  40. Zhu, D.; Chen, T.; Wang, Z.; Niu, R. Detecting ecological spatial-temporal changes by Remote Sensing Ecological Index with local adaptability. J. Environ. Manag. 2021, 299, 113655. [Google Scholar] [CrossRef]
  41. Samuel, K.K.; Anthony, E.; Justine, N.; Patrick, B.; David, M.; Paul, M. Anthropogenic induced land use/cover change dynamics of Budongo-Bugoma landscape in the Albertine region, Uganda. Egypt. J. Remote Sens. Space Sci. 2022, 25, 639–649. [Google Scholar]
  42. Quan, W.; Wang, H. Spatiotemporal dynamics and evolution relationships between land-use/land cover change and landscape pattern in response to rapid urban sprawl process: A case study in Wuhan, China. Ecol. Eng. 2022, 182, 106716–106736. [Google Scholar]
  43. Wang, Q.Z.; Gao, M.F.; Zhang, H.J. Agroecological Efficiency Evaluation Based on Multi-Source Remote Sensing Data in a Typical County of the Tibetan Plateau. Land 2022, 11, 561. [Google Scholar] [CrossRef]
  44. Yang, X.; Meng, F.; Fu, P.; Zhang, Y.; Liu, Y. Spatiotemporal change and driving factors of the Eco-Environment quality in the Yangtze River Basin from 2001 to 2019. Ecol. Indic. 2021, 131, 108214–108226. [Google Scholar] [CrossRef]
  45. Huang, H.; Chen, W.; Zhang, Y.; Qiao, L.; Du, Y. Analysis of ecological quality in Lhasa Metropolitan Area during 1990–2017 based on remote sensing and Google Earth Engine platform. J. Geogr. Sci. 2021, 31, 265–280. [Google Scholar] [CrossRef]
  46. Yang, H.; Zhong, X.; Deng, S.; Nie, S. Impact of LUCC on landscape pattern in the Yangtze River Basin during 2001–2019. Ecol. Inform. 2022, 69, 101631–101645. [Google Scholar] [CrossRef]
  47. Gao, Y.; Li, Y.; Xu, H. Assessing Ecological Quality Based on Remote Sensing Images in Wugong Mountain. Earth Space Sci. 2022, 9, 001918. [Google Scholar] [CrossRef]
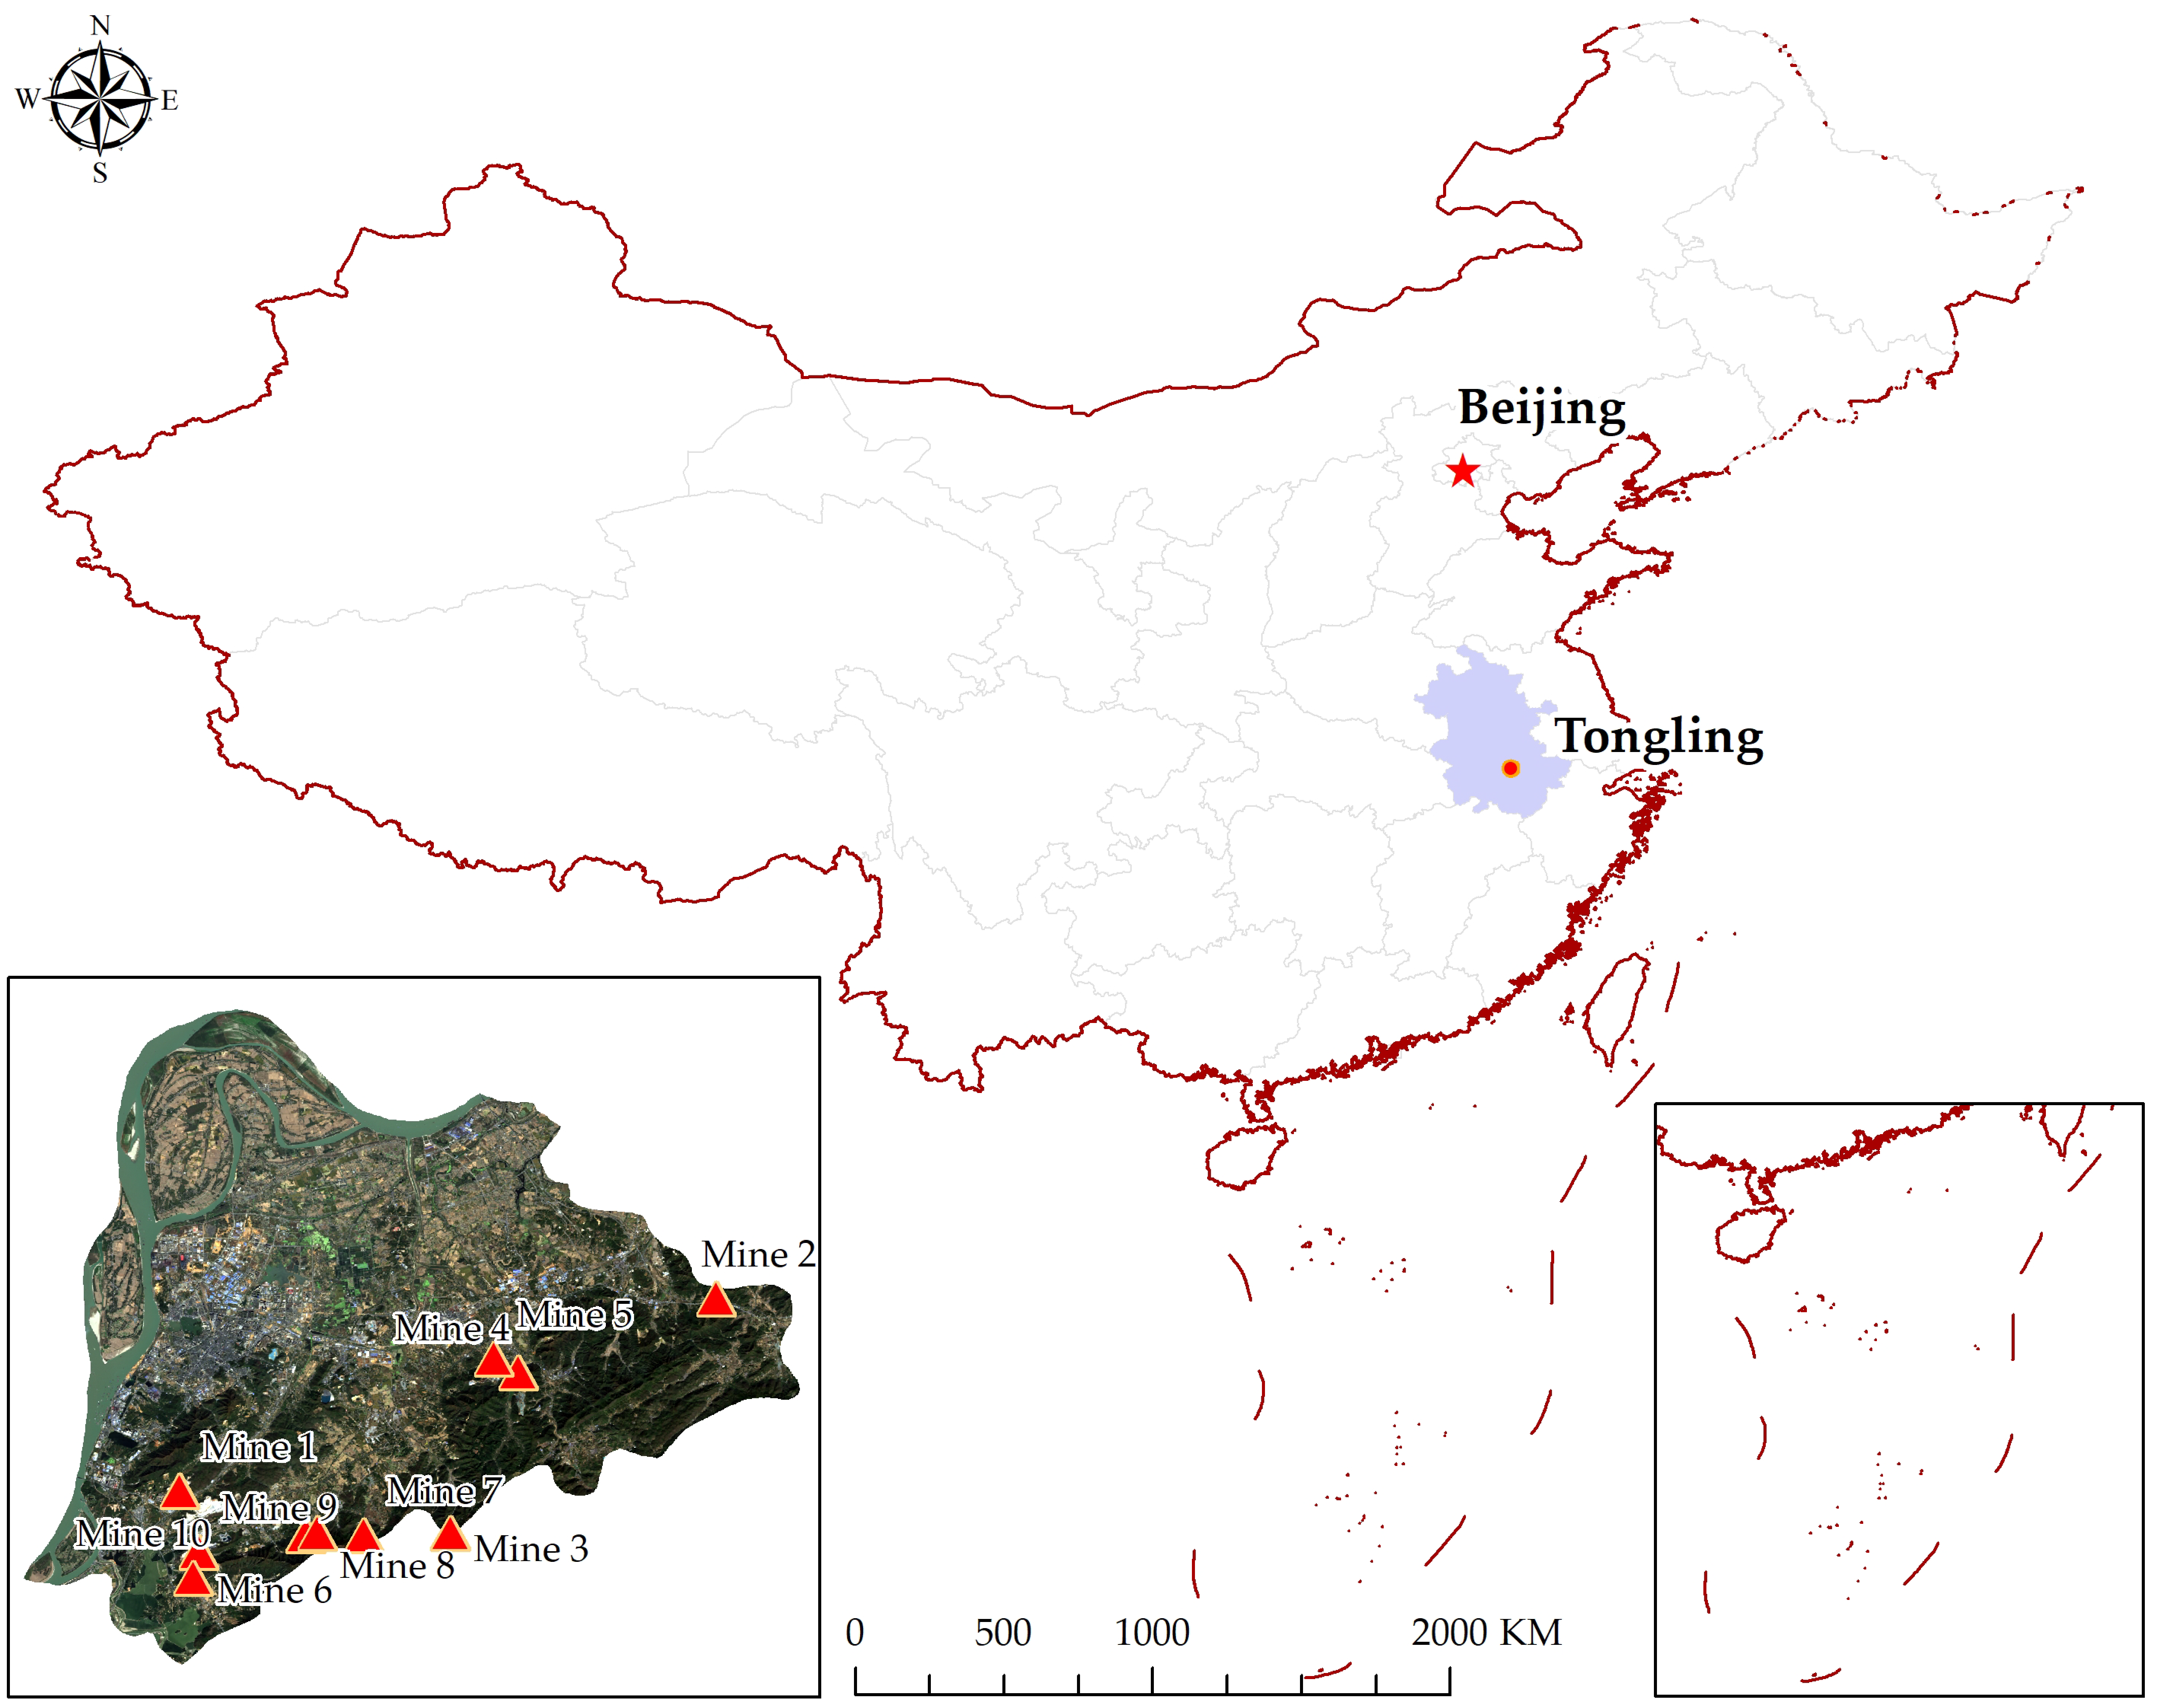
Figure 1. Location map of study area.
Sustainability 14 12694 g001
Figure 2. Data resources and data processing procedure.
Sustainability 14 12694 g002
Figure 3. Spatial distribution of RSEI in Tongling City: (a) RSEI of 2000; (b) RSEI of 2010; (c) RSEI of 2020.
Sustainability 14 12694 g003aSustainability 14 12694 g003b
Figure 4. Spatial distribution map of BAI in Tongling City: (a) BAI of 2000; (b) BAI of 2010; (c) BAI of 2020.
Sustainability 14 12694 g004aSustainability 14 12694 g004b
Figure 5. Spatial distribution map of land cover in Tongling City: (a) Land cover of 2000; (b) land cover of 2010; (c) land cover of 2020.
Sustainability 14 12694 g005aSustainability 14 12694 g005b
Figure 6. Relationships between six landscape-level metrics changes and the area percentage of RSEI Inferior, Medium, Good, and Excellent grades. (a1a4) show four RSEI grades and IJI. (b1b4) show four RSEI grades and CONTAG. (c1c4) show four RSEI grades and AI. (d1d4) show four RSEI grades and SHDI. (e1e4) show four RSEI grades and SHAPE_MN. (f1f4) show four RSEI grades and FRAC_MN.
Sustainability 14 12694 g006aSustainability 14 12694 g006b
Figure 7. The changes in four indicators and RSEI in Mine 1 and Mine 2 from 2000−2020: (a) Mine 1; (b) Mine 2.
Sustainability 14 12694 g007
Table 1. Name and establishment time of mining area.
Mine NumberNameTime of
Establishment
Mine 1Cement of Hushan, Anhui Tongling Conch Cement Company2011
Mine 2Tongling Fengrun earth mining corporation Ltd.2003
Mine 3Tongling Xiaoxiang mining corporation Ltd.2003
Mine 4Anhui Niushan mining corporation Ltd.2001
Mine 5TCIGCL Xinqiao mining corporation Ltd.2001
Mine 6Limestone mine, Tongling Maodi mining corporation Ltd.2009
Mine 7Tongling Yipin mining corporation Ltd.2005
Mine 8Tongling Yuanda mining corporation Ltd.2004
Mine 9Limestone mine of wulishan, Tongling Shangfeng Cement Co., Ltd.2003
Mine 10Cement of Xiaochong, Tongling Shangfeng Cement Co., Ltd.2009
Table 2. Correlation matrix among RSEI and four factors.
NDVIWETNDBSILSTRSEI
NDVI1
Wet0.258011
NDBSI−0.98998−0.286431
LST−0.81658−0.296190.7927691
RSEI0.9718310.284334−0.97835−0.681641
Table 3. Area classification of ecological environment.
Grade IndexDescription
Poor (0 < RSEI < 0.2)The conditions are relatively poor and human life is limited.
Inferior (0.2 < RSEI < 0.4)The area has poor vegetation coverage, less precipitation and fewer species, which is easy to restrict human life.
Medium (0.4 < RSEI < 0.6)The vegetation coverage is moderate, which is more suitable for human life and restricts human life to a certain extent.
Good (0.6 < RSEI < 0.8)High vegetation coverage, rich biodiversity, suitable for human habitation.
Excellent (0.8 < RSEI < 1.0)High vegetation coverage, rich biodiversity and stable ecological environment.
Table 4. Area and percentage of each RSEI level in Tongling City.
200020102020
RESI
Mean
Area
(km2)
%RESI
Mean
Area
(km2)
%RESI
Mean
Area
(km2)
%
Poor (0~0.2)0.706000.637000.64400
Inferior (0.2~0.4)0.090.011.410.151.210.13
Medium (0.4~0.6)43.474.66206.4121.65118.5412.42
Good (0.6~0.8)523.7356.18606.8363.66756.6379.30
Excellent (0.8~1.0)364.9539.15138.5914.5477.788.15
Total932.24100953.24100954.16100
Table 5. Land cover classification matrix of Tongling city from 2000 to 2010 (km2).
20102000
WaterForest and GrasslandCroplandNon-VegetationSum
water83.772.338.148.78103.02
Forest and grassland1.09242.1718.399.93271.59
Cropland10.8038.91349.3679.76478.84
Non-vegetation13.3012.0278.8377.81181.95
Sum108.97295.44454.72176.291035.41
Table 6. Land cover classification matrix of Tongling city from 2010 to 2020 (km2).
20202010
WaterForest and GrasslandCroplandNon-VegetationSum
water86.170.4610.6312.95110.22
Forest and grassland2.36252.6181.569.28345.42
Cropland1.586.18237.3928.06273.21
Non-vegetation12.8912.74149.25131.65306.55
Sum103.02271.59478.84181.951035.41
Table 7. Six landscape-level metrics of each RSEI grade in Tongling from 2000 to 2020.
YearIJI (%)CONTAG (%)AI (%)SHDISHAPE_MN (km2)FRAC_MN
200069.249657.571394.72481.11851.38401.5092
201064.602860.345895.32421.19481.34251.0556
202068.304457.377695.20781.29051.33351.0537
Table 8. Changes in RSEI and four sub-indexes in open-pit mining areas of Tongling city from 2000 to 2020.
Open Pit Mines200020102020
NDVIWetNDBSILSTRSEINDVIWetNDBSILSTRSEINDVIWetNDBSILSTRSEI
Mine 10.75–0.09–0.180.310.840.55–0.1–0.110.320.780.26–0.090.060.220.57
Mine 20.56–0.13–0.070.360.680.19–0.220.060.540.510.21–0.060.040.470.56
Mine 30.73–0.11–0.130.330.830.27–0.170.030.450.590.29–0.020.010.360.61
Mine 40.12–0.10.080.410.570.12–0.050.090.570.460.13–0.030.050.430.58
Mine 50.26–0.10.020.50.650.19–0.080.010.370.610.24–0.01–0.010.370.61
Mine 60.81–0.08–0.190.280.860.43–0.09–0.040.210.650.2–0.04–0.020.290.61
Mine 70.77–0.08–0.160.290.850.47–0.09–0.040.230.670.16–0.060.060.460.58
Mine 80.75–0.08–0.160.250.830.42–0.07–0.010.150.630.22–0.060.060.490.58
Mine 90.72–0.01–0.150.330.840.23–0.130.020.480.580.09–0.070.060.490.55
Mine 100.79–0.11–0.190.360.870.55–0.15–0.050.380.690.29–0.090.090.420.59
Publisher’s Note: MDPI stays neutral with regard to jurisdictional claims in published maps and institutional affiliations.