
A Century of Drought in Hawaiʻi: Geospatial Analysis and Synthesis across Hydrological, Ecological, and Socioeconomic Scales

 , , , , , ,
Abstract
1. Introduction
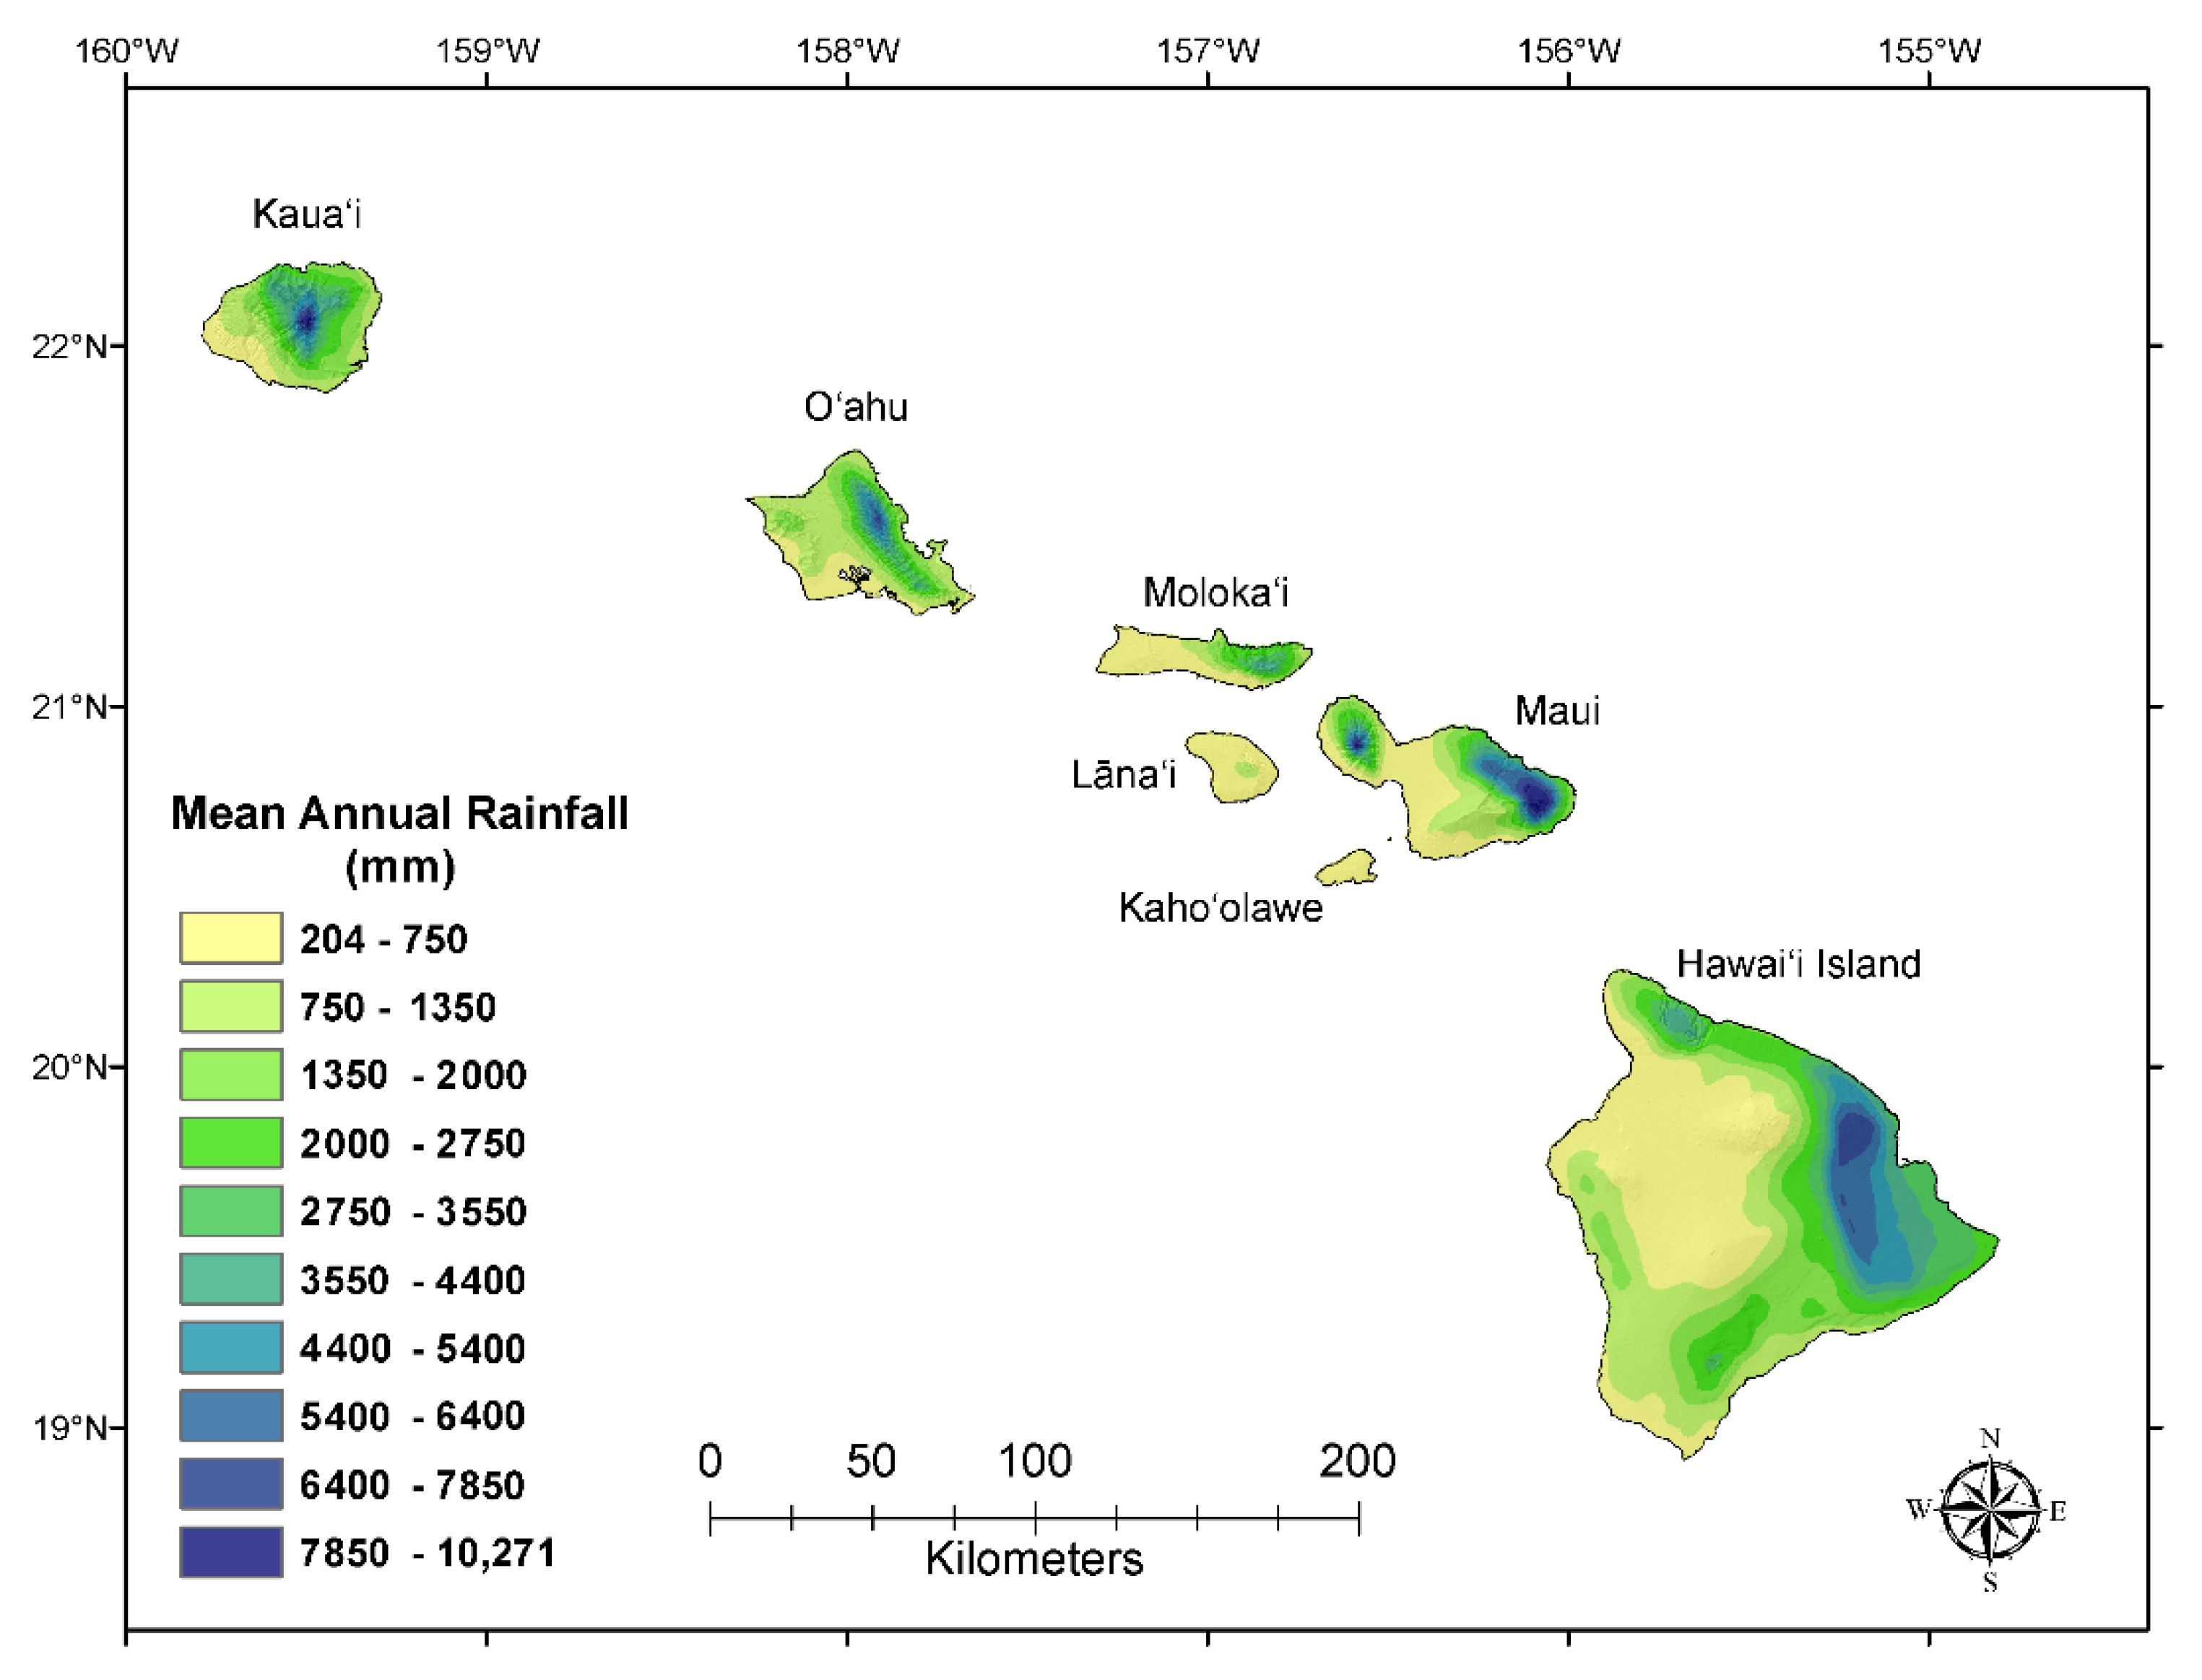
2. Study Area
3. Materials and Methods
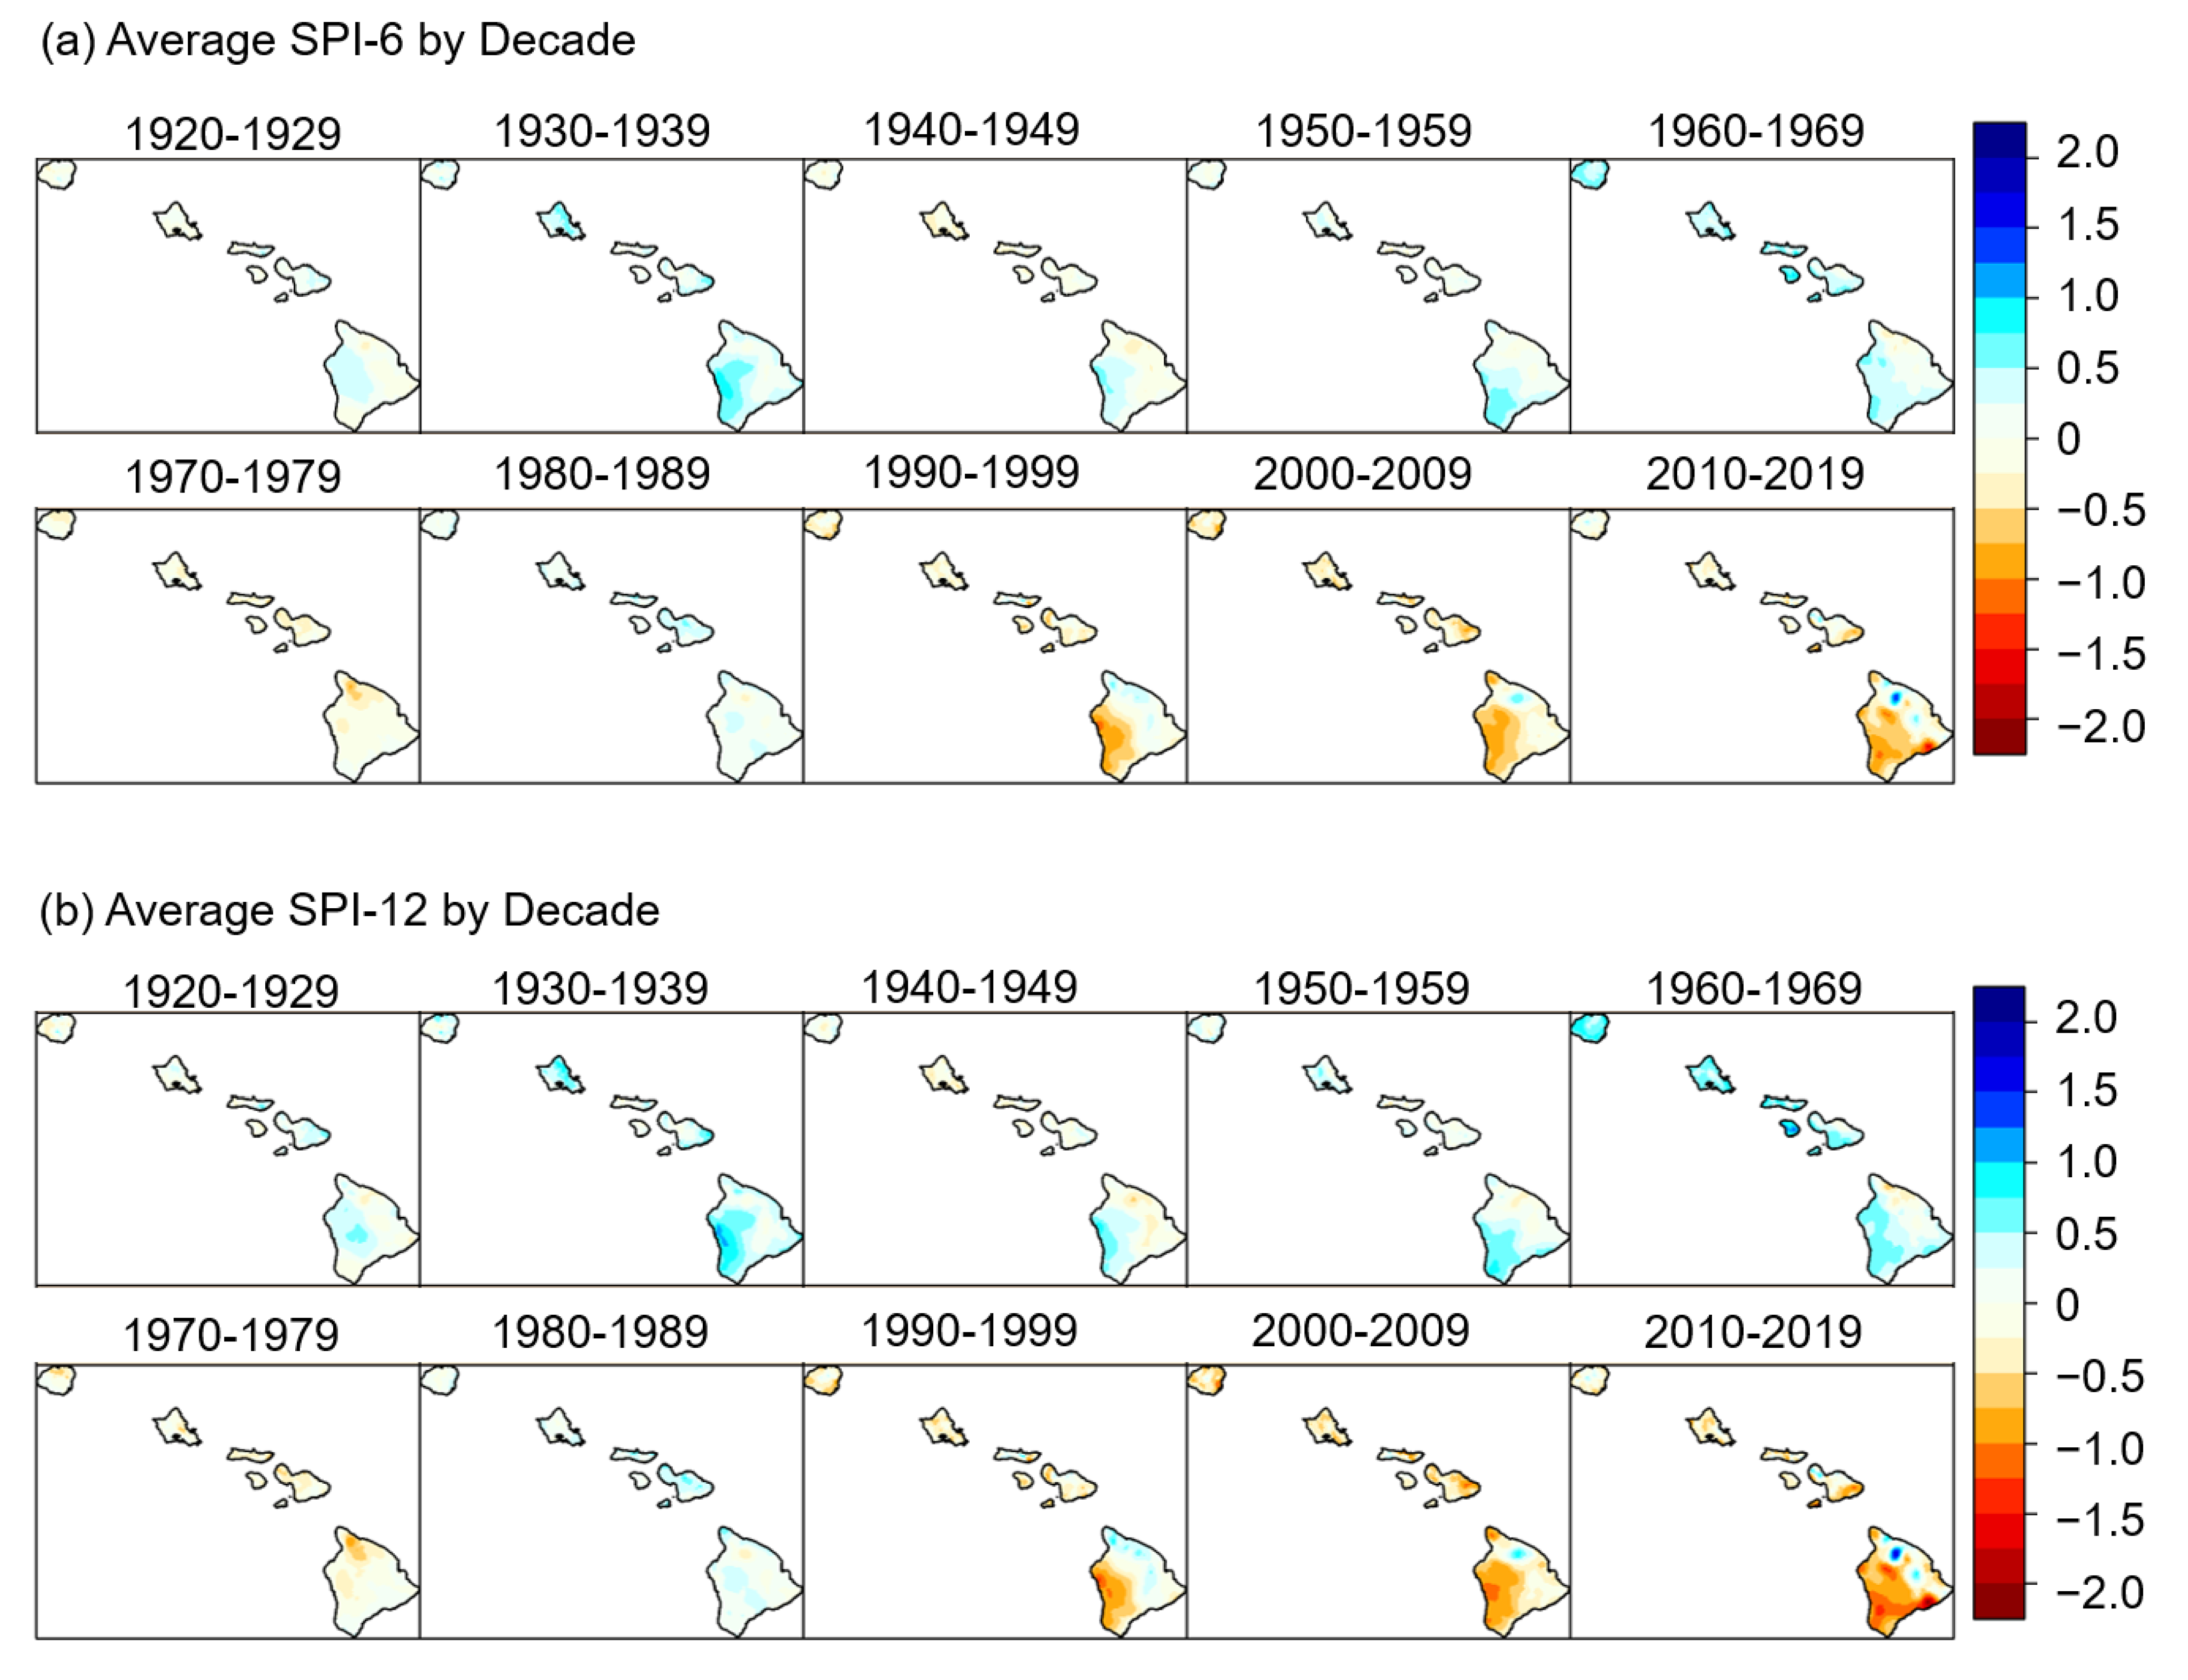
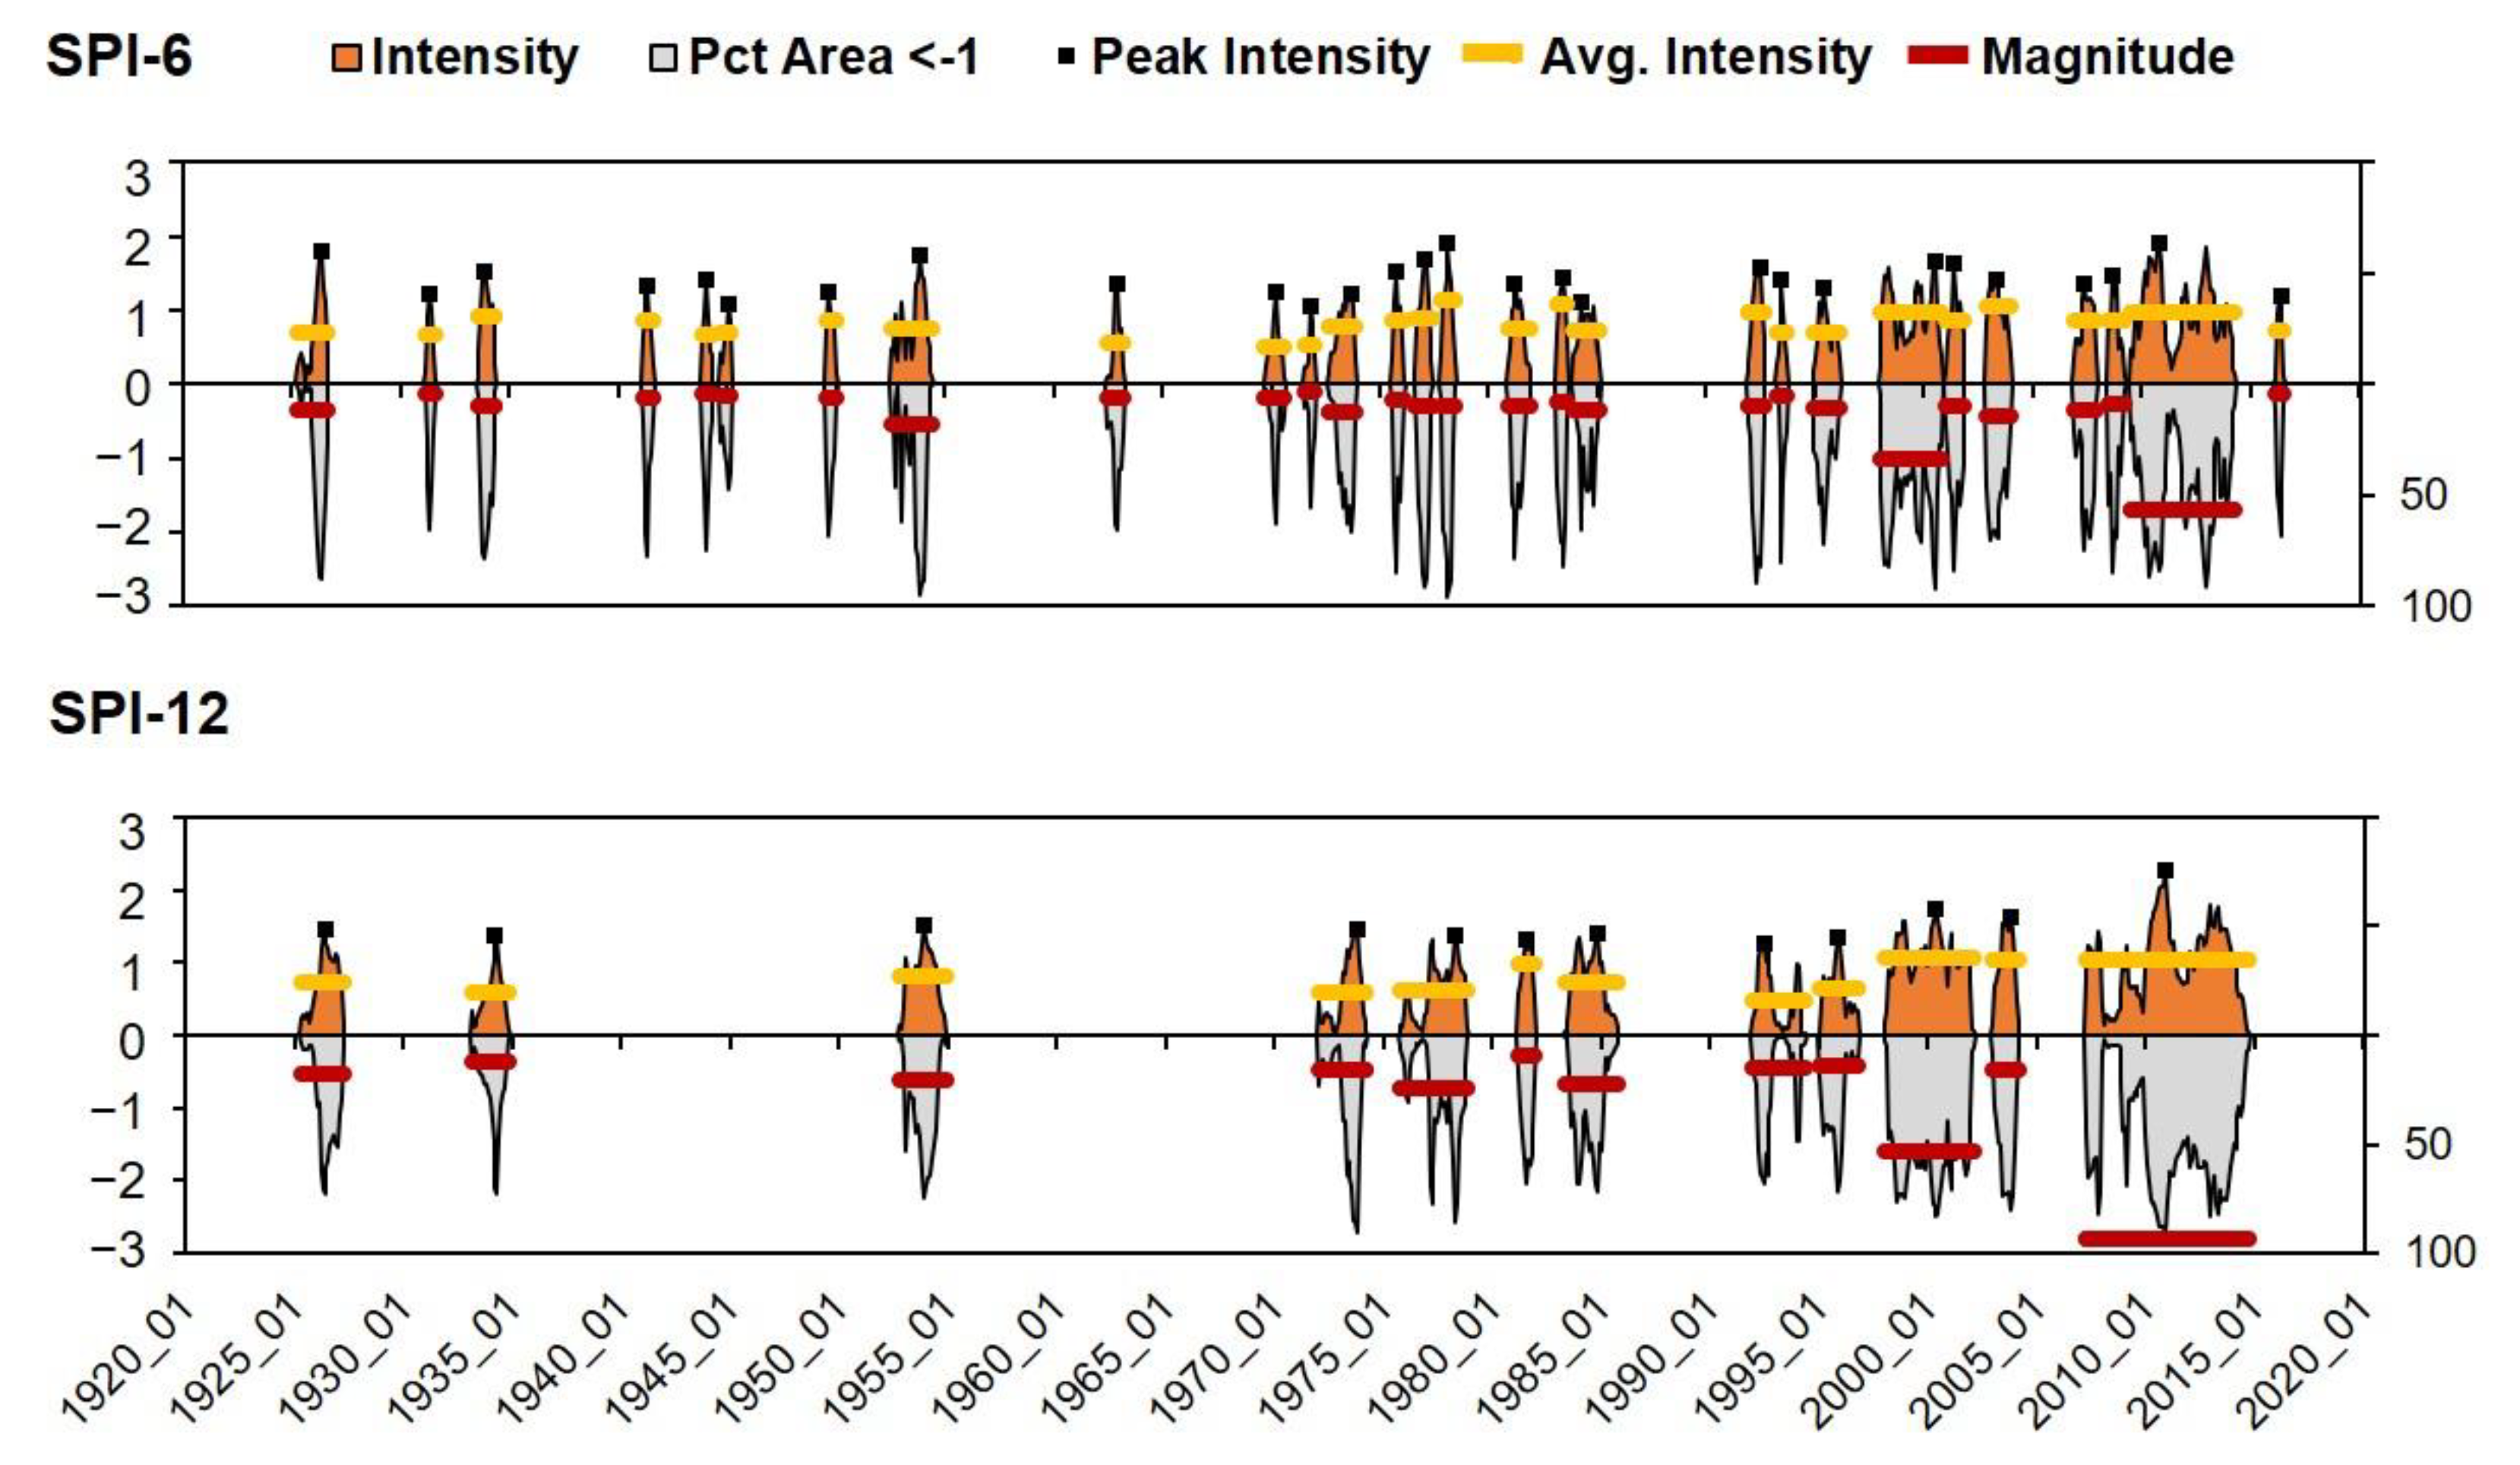
4. SPI Analysis Results
5. Synthesis and Discussion
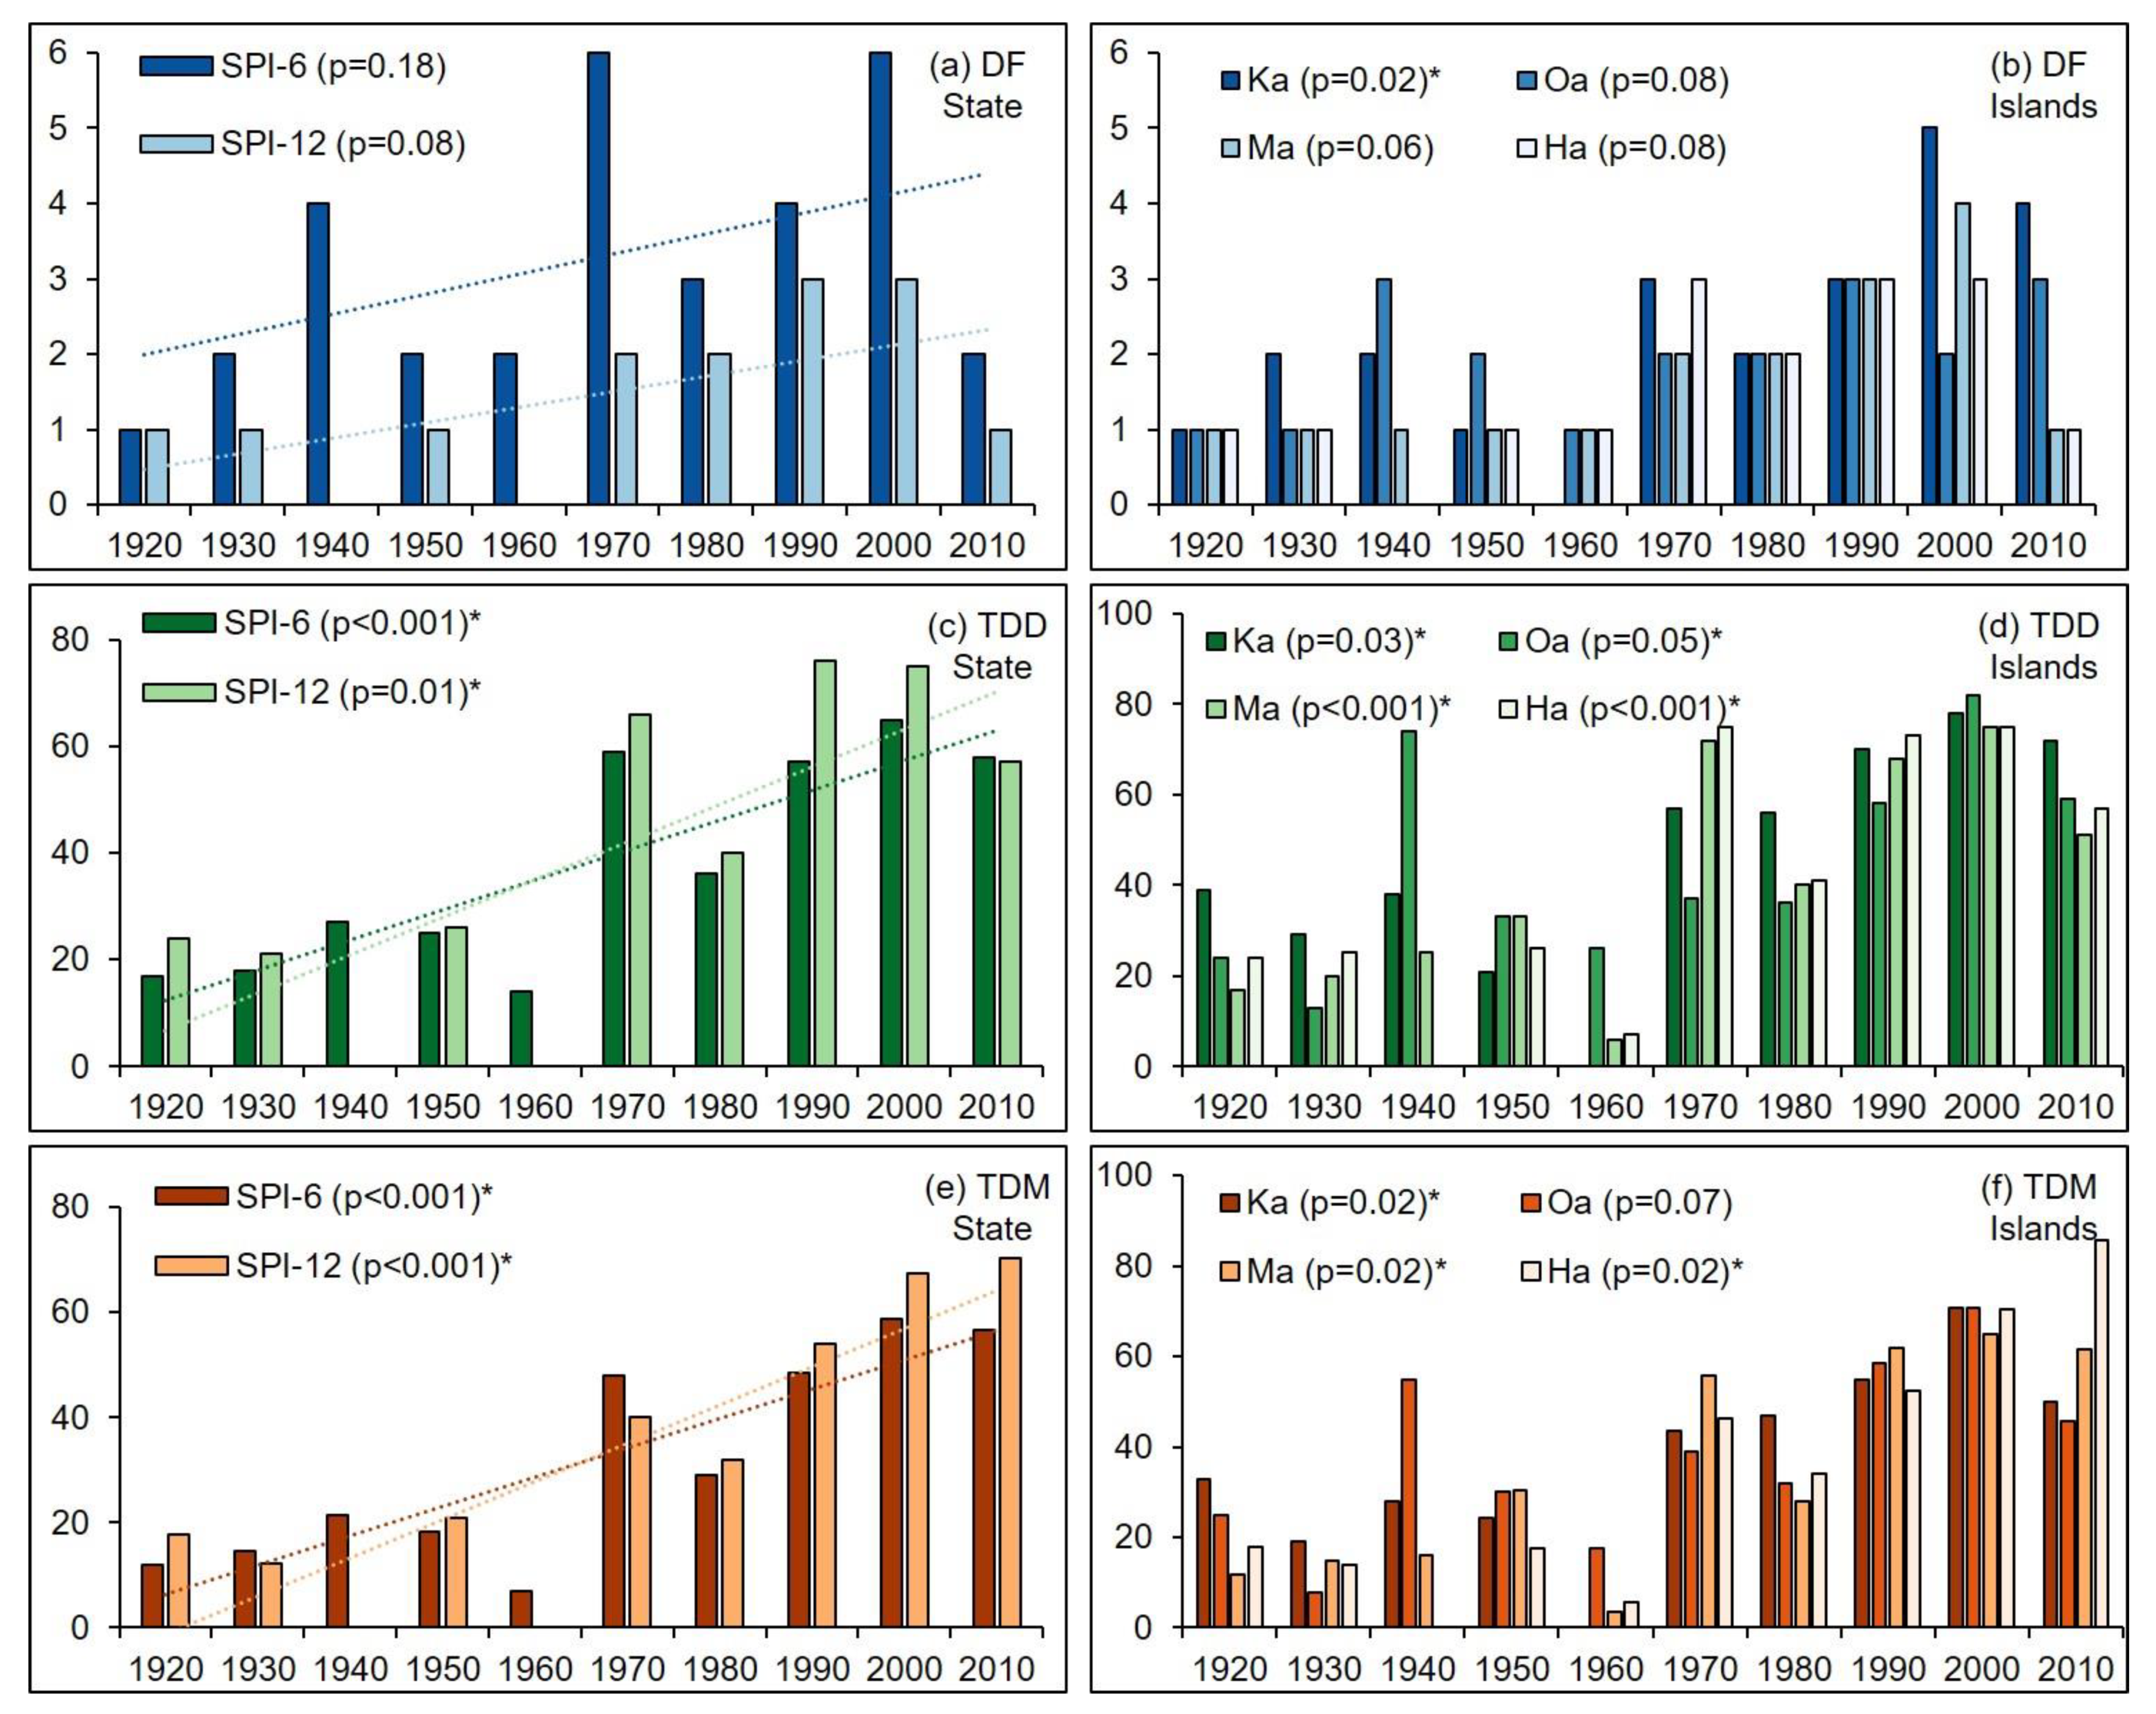
5.1. Meteorological Drought
5.2. Agricultural Drought
5.3. Hydrological Drought
5.4. Ecological Drought
5.5. Socioeconomic Drought
5.6. Looking Ahead
6. Conclusions
Supplementary Materials
Author Contributions
Funding
Institutional Review Board Statement
Informed Consent Statement
Data Availability Statement
Acknowledgments
Conflicts of Interest
References
- Wilhite, D.A. Drought as a Natural Hazard: Concepts and Definitions. In Drought: A Global Assessment; University of Nebraska: Lincoln, NE, USA, 2000; pp. 3–18. [Google Scholar]
- McDowell, N.; Allen, C.D.; Anderson-Teixeira, K.; Brando, P.; Brienen, R.; Chambers, J.; Christoffersen, B.; Davies, S.; Doughty, C.; Duque, A.; et al. Drivers and Mechanisms of Tree Mortality in Moist Tropical Forests. New Phytol. 2018, 219, 851–869. [Google Scholar] [CrossRef] [PubMed]
- Breshears, D.D.; Cobb, N.S.; Rich, P.M.; Price, K.P.; Allen, C.D.; Balice, R.G.; Romme, W.H.; Kastens, J.H.; Floyd, M.L.; Belnap, J.; et al. Regional Vegetation Die-Off in Response to Global-Change-Type Drought. Proc. Natl. Acad. Sci. USA 2005, 102, 15144–15148. [Google Scholar] [CrossRef] [PubMed]
- Lyon, B. The Strength of El Niño and the Spatial Extent of Tropical Drought. Geophys. Res. Lett. 2004, 31, L21204. [Google Scholar] [CrossRef]
- Polhemus, D.A. Drought in the U.S.—Affiliated Pacific Islands: A Multi-Level Assessment; Pacific Islands Climate Science Center: Honolulu, HI, USA, 2017; pp. 1–67. [Google Scholar]
- Chu, P.-S. Hawaii Rainfall Anomalies and El Niño. J. Clim. 1995, 8, 1697–1703. [Google Scholar] [CrossRef]
- Chu, P.-S.; Chen, H. Interannual and Interdecadal Rainfall Variations in the Hawaiian Islands. J. Clim. 2005, 18, 4796–4813. [Google Scholar] [CrossRef]
- Frazier, A.G.; Timm, O.E.; Giambelluca, T.W.; Diaz, H.F. The Influence of ENSO, PDO and PNA on Secular Rainfall Variations in Hawai‘i. Clim. Dyn. 2018, 51, 2127–2140. [Google Scholar] [CrossRef]
- Lyons, S.W. Empirical Orthogonal Function Analysis of Hawaiian Rainfall. J. Appl. Meteorol. 1982, 21, 1713–1729. [Google Scholar] [CrossRef]
- Kirch, P.V. Controlled Comparison and Polynesian Cultural Evolution. In Natural Experiments of History; Harvard University Press: Cambridge, MA, USA, 2010; pp. 15–52. [Google Scholar]
- CWRM. Hawaii Drought Plan. 131. Report prepared for State of Hawaii Department of Land and Natural Resources, Commission on Water Resource Management; One World One Water, LLC.: Honolulu, HI, USA, 2017.
- Keener, V.W.; Helweg, D.; Asam, S.; Balwani, S.; Burkett, M.; Fletcher, C.H.; Giambelluca, T.; Grecni, Z.N.; Nobrega-Olivera, M.; Polovina, J.; et al. Hawaiʻi and U.S.-Affiliated Pacific Islands. In Impacts, Risks, and Adaptation in the United States: Fourth National Climate Assessment; Reidmiller, D.R., Avery, C.W., Easterling, D.R., Kunkel, K.E., Lewis, K.L.M., Maycock, T.K., Stewart, B.C., Eds.; U.S. Global Change Research Program: Washington, DC, USA, 2018; Volume II, pp. 1242–1308. [Google Scholar]
- McKenzie, M.M.; Giambelluca, T.W.; Diaz, H.F. Temperature Trends in Hawaiʻi: A Century of Change, 1917–2016. Int. J. Climatol. 2019, 39, 3987–4001. [Google Scholar] [CrossRef]
- Timm, O.E.; Giambelluca, T.W.; Diaz, H.F. Statistical Downscaling of Rainfall Changes in Hawai‘I Based on the CMIP5 Global Model Projections. J. Geophys. Res. Atmos. 2015, 120, 92–112. [Google Scholar] [CrossRef]
- Frazier, A.G.; Giambelluca, T.W. Spatial Trend Analysis of Hawaiian Rainfall from 1920 to 2012. Int. J. Climatol. 2017, 37, 2522–2531. [Google Scholar] [CrossRef]
- Mishra, A.K.; Singh, V.P. A Review of Drought Concepts. J. Hydrol. 2010, 391, 202–216. [Google Scholar] [CrossRef]
- Giri, S.; Mishra, A.; Zhang, Z.; Lathrop, R.; Alnahit, A. Meteorological and Hydrological Drought Analysis and Its Impact on Water Quality and Stream Integrity. Sustainability 2021, 13, 8175. [Google Scholar] [CrossRef]
- Li, M.; Cao, F.; Wang, G.; Chai, X.; Zhang, L. Evolutional Characteristics of Regional Meteorological Drought and Their Linkages with Southern Oscillation Index across the Loess Plateau of China During 1962–2017. Sustainability 2020, 12, 7237. [Google Scholar] [CrossRef]
- Uwimbabazi, J.; Jing, Y.; Iyakaremye, V.; Ullah, I.; Ayugi, B. Observed Changes in Meteorological Drought Events During 1981–2020 over Rwanda, East Africa. Sustainability 2022, 14, 1519. [Google Scholar] [CrossRef]
- Zargar, A.; Sadiq, R.; Naser, G.; Khan, F.I. A Review of Drought Indices. Environ. Rev. 2011, 19, 333–349. [Google Scholar] [CrossRef]
- Crausbay, S.; Ramirez, A.R.; Carter, S.L.; Cross, M.S.; Hall, K.R.; Bathke, D.J.; Betancourt, J.L.; Colt, S.; Cravens, A.E.; Dalton, M.S.; et al. Defining Ecological Drought for the Twenty-First Century. Bull. Am. Meteorol. Soc. 2017, 98, 2543–2550. [Google Scholar] [CrossRef]
- Wilhite, D.A.; Glantz, M.H. Understanding: The Drought Phenomenon: The Role of Definitions. Water Int. 1985, 10, 111–120. [Google Scholar] [CrossRef]
- Wilhite, D.A.; Buchanan-Smith, M. Drought as Hazard: Understanding the Natural and Social Context. Drought Water Cris. Sci. Technol. Manag. Issues 2005, 3, 29. [Google Scholar]
- Allen, C.D.; Breshears, D.D. Drought-Induced Shift of a Forest-Woodland Ecotone: Rapid Landscape Response to Climate Variation. Proc. Natl. Acad. Sci. USA 1998, 95, 14839–14842. [Google Scholar] [CrossRef]
- McDowell, N.; Pockman, W.T.; Allen, C.D.; Breshears, D.D.; Cobb, N.; Kolb, T.; Plaut, J.; Sperry, J.; West, A.; Williams, D.G.; et al. Mechanisms of Plant Survival and Mortality During Drought: Why Do Some Plants Survive While Others Succumb to Drought? New Phytol. 2008, 178, 719–739. [Google Scholar] [CrossRef]
- Chu, P.-S.; Yan, W.; Fujioka, F. Fire-Climate Relationships and Long-Lead Seasonal Wildfire Prediction for Hawaii. Int. J. Wildland Fire 2002, 11, 25. [Google Scholar] [CrossRef]
- McKee, T.B.; Doesken, N.J.; Kleist, J. The Relationship of Drought Frequency and Duration to Time Scales. In Proceedings of the Eighth Conference on Applied Climatology, Anaheim, CA, USA, 17–22 January 1993. [Google Scholar]
- Palmer, W.C. Meteorological Drought; Res. Pap. No. 45.; US Department of Commerce, Weather Bureau: Washington, DC, USA, 1965; Volume 58.
- Vicente-Serrano, S.M.; Beguería, S.; López-Moreno, J.I. A Multiscalar Drought Index Sensitive to Global Warming: The Standardized Precipitation Evapotranspiration Index. J. Clim. 2010, 23, 1696–1718. [Google Scholar] [CrossRef]
- Keetch, J.J.; Byram, G.M. A Drought Index for Forest Fire Control. In Research Paper; US Department of Agriculture, Forest Service, Southeastern Forest Experiment Station: Asheville, NC, USA, 1968; Volume 35. [Google Scholar]
- Palmer, W.C. Keeping Track of Crop Moisture Conditions, Nationwide: The New Crop Moisture Index. Weatherwise 1968, 21, 156–161. [Google Scholar] [CrossRef]
- Mark, S.; Lecomte, D.; Hayes, M.; Heim, R.; Gleason, K.; Angel, J.; Rippey, B.; Tinker, R.; Palecki, M.; Stooksbury, D.; et al. The Drought Monitor. Bull. Am. Meteorol. Soc. 2002, 83, 1181–1190. [Google Scholar] [CrossRef]
- Giambelluca, T.W.; Nullet, M.A.; Ridgley, M.A.; Eyre, P.R.; Moncur, J.E.T.; Price, S. Drought in Hawaii; Department of Land and Natural Resources, Commission on Water Resource Management: Honolulu, HI, USA, 1991; Volume 232. [Google Scholar]
- Frazier, A.G.; Giambelluca, T.W.; Diaz, H.F.; Needham, H.L. Comparison of Geostatistical Approaches to Spatially Interpolate Month-Year Rainfall for the Hawaiian Islands. Int. J. Climatol. 2016, 36, 1459–1470. [Google Scholar] [CrossRef]
- Longman, R.J.; Frazier, A.G.; Newman, A.J.; Giambelluca, T.W.; Schanzenbach, D.; Kagawa-Viviani, A.; Needham, H.; Arnold, J.R.; Clark, M.P. High-Resolution Gridded Daily Rainfall and Temperature for the Hawaiian Islands (1990–2014). J. Hydrometeorol. 2019, 20, 489–508. [Google Scholar] [CrossRef]
- Lucas, M.P.; Longman, R.J.; Giambelluca, T.W.; Frazier, A.G.; Mclean, J.; Cleveland, S.B.; Huang, Y.-F.; Lee, J. Optimizing Automated Kriging to Improve Spatial Interpolation of Monthly Rainfall over Complex Terrain. J. Hydrometeorol. 2022, 23, 561–572. [Google Scholar] [CrossRef]
- Vose, J.M.; Peterson, D.L.; Luce, C.H.; Patel-Weynand, T. Effects of Drought on Forests and Rangelands in the United States: Translating Science into Management Responses; U.S. Department of Agriculture Forest Service, Washington Office: Washington, DC, USA, 2019; pp. 1–227.
- Lucas, M.P.; Trauernicht, C.; Frazier, A.G.; Miura, T. Long-Term, Gridded Standardized Precipitation Index for Hawai‘i. Data 2020, 5, 109. [Google Scholar] [CrossRef]
- Giambelluca, T.W.; Chen, Q.; Frazier, A.; Price, J.P.; Chen, Y.-L.; Chu, P.-S.; Eischeid, J.K.; Delparte, D.M. Online Rainfall Atlas of Hawaiʻi. Bull. Am. Meteorol. Soc. 2013, 94, 313–316. [Google Scholar] [CrossRef]
- Giambelluca, T.W.; Nullet, M.A.; Schroeder, T.A. Rainfall Atlas of Hawaii; Department of Land and Natural Resources, Division of Water and Land Development: Honolulu, HI, USA, 1986; Volume 267. [Google Scholar]
- Perroy, R.L.; Melrose, J.; Cares, S. The Evolving Agricultural Landscape of Post-Plantation Hawaii. Appl. Geogr. 2016, 76, 154–162. [Google Scholar] [CrossRef]
- Asner, G.; Elmore, A.; Flinthughes, R.; Warner, A.; Vitousek, P. Ecosystem Structure Along Bioclimatic Gradients in Hawaii from Imaging Spectroscopy. Remote Sens. Environ. 2005, 96, 497–508. [Google Scholar] [CrossRef]
- Juvik, S.P.; Juvik, J.O. Atlas of Hawaii; University of Hawaii Press: Honolulu, HI, USA, 1998. [Google Scholar]
- Sakai, A.K.; Wagner, W.L.; Mehrhoff, L.A. Patterns of Endangerment in the Hawaiian Flora. Syst. Biol. 2002, 51, 276–302. [Google Scholar] [CrossRef] [PubMed]
- Camp, R.J.; Loh, R.; Berkowitz, S.P.; Brinck, K.W.; Jacobi, J.D.; Price, J.; McDaniel, S.; Fortini, L.B. Potential Impacts of Projected Climate Change on Vegetation Management Strategies in Hawaii Volcanoes National Park. Park Sci. 2018, 34, 22–31. [Google Scholar]
- Lucas, F.; Price, J.; Jacobi, J.; Vorsino, A.; Burgett, J.; Brinck, K.; Gon, S.; Koob, G.; Paxton, E. A Landscape-Based Assessment of Climate Change Vulnerability for All Native Hawaiian Plants. In Technical Report HCSU-044; Hawaii Cooperative Studies Unit University of Hawaii at Hilo: Hilo, HI, USA, 2013; Volume 134. [Google Scholar]
- Vorsino, A.E.; Fortini, L.B.; Amidon, F.A.; Miller, S.E.; Jacobi, J.D.; Price, J.P.; Gon, S., 3rd; Koob, G.A. Modeling Hawaiian Ecosystem Degradation Due to Invasive Plants under Current and Future Climates. PLoS ONE 2014, 9, e95427. [Google Scholar] [CrossRef] [PubMed]
- Michael, H.; Svoboda, M.; Wall, N.; Widhalm, M. The Lincoln Declaration on Drought Indices: Universal Meteorological Drought Index Recommended. Bull. Am. Meteorol. Soc. 2011, 92, 485–488. [Google Scholar] [CrossRef]
- Beguería, S.; Vicente-Serrano, S.M. SPEI: Calculation of the Standardised Precipitation-Evapotranspiration Index; R Package Version 1.7; R Project: Vienna, Austria, 2017. [Google Scholar]
- R Core Team. R: A Language and Environment for Statistical Computing; R Foundation for Statistical Computing: Vienna, Austria, 2013. [Google Scholar]
- World Meteorological Organization. Standardized Precipitation Index User Guide; Svoboda, M., Hayes, M., Wood, D., Eds.; WMO-No. 1090; World Meteorological Organization: Geneva, Switzerland, 2012. [Google Scholar]
- McGree, S.; Schreider, S.; Kuleshov, Y. Trends and Variability in Droughts in the Pacific Islands and Northeast Australia. J. Clim. 2016, 29, 8377–8397. [Google Scholar] [CrossRef]
- Wolter, K.; Timlin, M.S. El Niño/Southern Oscillation Behaviour since 1871 as Diagnosed in an Extended Multivariate ENSO Index (MEI.Ext). Int. J. Climatol. 2011, 31, 1074–1087. [Google Scholar] [CrossRef]
- Selmants, P.C.; Sleeter, B.M.; Liu, J.; Wilson, T.S.; Trauernicht, C.; Frazier, A.G.; Asner, G.P. Ecosystem Carbon Balance in the Hawaiian Islands under Different Scenarios of Future Climate and Land Use Change. Environ. Res. Lett. 2021, 16, 104020. [Google Scholar] [CrossRef]
- Dunn, O.J. Multiple Comparisons Using Rank Sums. Technometrics 1964, 6, 241–252. [Google Scholar] [CrossRef]
- Diaz, H.F.; Giambelluca, T.W. Changes in Atmospheric Circulation Patterns Associated with High and Low Rainfall Regimes in the Hawaiian Islands Region on Multiple Time Scales. Glob. Planet. Chang. 2012, 98–99, 97–108. [Google Scholar] [CrossRef]
- Diaz, H.F.; Wahl, E.R.; Zorita, E.; Giambelluca, T.; Eischeid, J.K. A Five-Century Reconstruction of Hawaiian Islands Winter Rainfall. J. Clim. 2016, 29, 5661–5674. [Google Scholar] [CrossRef]
- Kruk, M.C.; Levinson, D.H. Evaluating the Impacts of Climate Change on Rainfall Extremes for Hawaii and Coastal Alaska. In Proceedings of the 24th Conference on Severe Local Storms, Savannah, GA, USA, 27–31 October 2008. [Google Scholar]
- Longman, R.J.; Diaz, H.F.; Giambelluca, T.W. Sustained Increases in Lower-Tropospheric Subsidence over the Central Tropical North Pacific Drive a Decline in High-Elevation Rainfall in Hawaii. J. Clim. 2015, 28, 8743–8759. [Google Scholar] [CrossRef]
- O’Connor, C.F.; Chu, P.-S.; Hsu, P.-C.; Kodama, K. Variability of Hawaiian Winter Rainfall During La Niña Events since 1956. J. Clim. 2015, 28, 7809–7823. [Google Scholar] [CrossRef]
- Chu, P.-S.; Chen, Y.R.; Schroeder, T.A. Changes in Precipitation Extremes in the Hawaiian Islands in a Warming Climate. J. Clim. 2010, 23, 4881–4900. [Google Scholar] [CrossRef]
- Kruk, M.C.; Lorrey, A.M.; Griffiths, G.M.; Lander, M.; Gibney, E.J.; Diamond, H.J.; Marra, J.J. On the State of the Knowledge of Rainfall Extremes in the Western and Northern Pacific Basin. Int. J. Climatol. 2015, 35, 321–336. [Google Scholar] [CrossRef]
- Krushelnycky, P.D.; Loope, L.L.; Giambelluca, T.W.; Starr, F.; Starr, K.; Drake, D.R.; Taylor, A.D.; Robichaux, R.H. Climate-Associated Population Declines Reverse Recovery and Threaten Future of an Iconic High-Elevation Plant. Glob. Chang. Biol. 2013, 19, 911–922. [Google Scholar] [CrossRef]
- Koch, F.H.; Smith, W.D.; Coulston, J.W. Drought Patterns in the Conterminous United States and Hawaii. In Forest Health Monitoring: National Status, Trends, and Analysis 2012; Potter, K.M., Conkling, B.L., Eds.; Asheville, North Carolina: Gen. Tech. Rep. SRSGTR-198; US Department of Agriculture, Forest Service, Southern Research Station: Ashville, NC, USA, 2014; pp. 49–72. [Google Scholar]
- Chu, P.-S. Hawaiian Drought and the Southern Oscillation. Int. J. Climatol. 1989, 9, 619–631. [Google Scholar] [CrossRef]
- Chu, P.-S.; Wang, J. Tropical Cyclone Occurrences in the Vicinity of Hawaii: Are the Differences between El Niño and Non-El Niño Years Significant? J. Clim. 1997, 10, 2683–2689. [Google Scholar] [CrossRef]
- Chu, P.-S.; Nash, A.J.; Porter, F.-Y. Diagnostic Studies of Two Contrasting Rainfall Episodes in Hawaii: Dry 1981 and Wet 1982. J. Clim. 1993, 6, 1457–1462. [Google Scholar] [CrossRef]
- Luo, X.; Wang, B.; Frazier, A.G.; Giambelluca, T.W. Distinguishing Variability Regimes of Hawaiian Summer Rainfall: Quasi-Biennial and Interdecadal Oscillations. Geophys. Res. Lett. 2020, 47, 23. [Google Scholar] [CrossRef]
- Hsiao, F. Island Effects on Rainfall over the Hawaiian Islands with Mountaintops Below Trade Wind Inversion. Ph.D. Thesis, University of Hawaii at Mānoa, Honolulu, HI, USA, 2020. [Google Scholar]
- Lu, B.-Y.; Chu, P.-S.; Kim, S.-H.; Karamperidou, C. Hawaiian Regional Climate Variability During Two Types of El Niño. J. Clim. 2020, 33, 9929–9943. [Google Scholar] [CrossRef]
- Frazier, A.G. The Influence of Large-Scale Modes of Climate Variability on Spatiotemporal Rainfall Patterns and Vegetation Response in Hawaii. Ph.D. Thesis, University of Hawaii at Mānoa, Manoa, HI, USA, 2016. [Google Scholar]
- Coats, S.; Smerdon, J.E.; Cook, B.I.; Seager, R. Stationarity of the Tropical Pacific Teleconnection to North America in CMIP5/PMIP3 Model Simulations. Geophys. Res. Lett. 2013, 40, 4927–4932. [Google Scholar] [CrossRef]
- Eischeid, J.K.; Hoerling, M.P.; Quan, X.-W.; Diaz, H.F. Diagnosing Hawaii’s Recent Drought. J. Clim. 2022, 35, 3997–4012. [Google Scholar] [CrossRef]
- McAfee, S.A. Consistency and the Lack Thereof in Pacific Decadal Oscillation Impacts on North American Winter Climate. J. Clim. 2014, 27, 7410–7431. [Google Scholar] [CrossRef]
- Wang, B.; Luo, X.; Liu, J. How Robust Is the Asian Precipitation–ENSO Relationship During the Industrial Warming Period (1901–2017)? J. Clim. 2020, 33, 2779–2792. [Google Scholar] [CrossRef]
- Yeh, S.-W.; Cai, W.; Min, S.-K.; McPhaden, M.J.; Dommenget, D.; Dewitte, B.; Collins, M.; Ashok, K.; An, S.-I.; Yim, B.-Y.; et al. ENSO Atmospheric Teleconnections and Their Response to Greenhouse Gas Forcing. Rev. Geophys. 2018, 56, 185–206. [Google Scholar] [CrossRef]
- Wang, B.; Luo, X.; Yang, Y.-M.; Sun, W.; Cane, M.A.; Cai, W.; Yeh, S.-W.; Liu, J. Historical Change of El Nino Properties Sheds Light on Future Changes of Extreme El Nino. Proc. Natl. Acad. Sci. USA 2019, 116, 22512–22517. [Google Scholar] [CrossRef]
- Wang, G.; Cai, W.; Gan, B.; Wu, L.; Santoso, A.; Lin, X.; Chen, Z.; McPhaden, M.J. Continued Increase of Extreme El Niño Frequency Long after 1.5 °C Warming Stabilization. Nat. Clim. Chang. 2017, 7, 568–572. [Google Scholar] [CrossRef]
- KHNL. Drought Conditions Plaguing Parts of Maui County, Big Island. 2012. Available online: https://www.hawaiinewsnow.com/story/17354594/drought-conditions-plaguing-parts-of-maui-county-big-island/ (accessed on 30 August 2020).
- Reyes, J.J.; Elias, E. Spatio-Temporal Variation of Crop Loss in the United States from 2001 to 2016. Environ. Res. Lett. 2019, 14, 074017. [Google Scholar] [CrossRef]
- USDA. U.S. Department of Agriculture Farm Service Agency (FSA) Disaster Assistance Program; USDA: Washington, DC, USA, 2019.
- Rehkamp, S.; Roberts, M.J.; MacDonald, J.M. The Agricultural Economic Landscape in Hawaii and the Potential for Future Economic Viability; UHERO Brief: Honolulu, HI, USA, 2021. [Google Scholar]
- Strauch, A.M.; Giardina, C.P.; MacKenzie, R.A.; Heider, C.; Giambelluca, T.W.; Salminen, E.; Bruland, G.L. Modeled Effects of Climate Change and Plant Invasion on Watershed Function across a Steep Tropical Rainfall Gradient. Ecosystems 2017, 20, 583–600. [Google Scholar] [CrossRef]
- Strauch, A.M.; MacKenzie, R.A.; Giardina, C.P.; Bruland, G.L. Climate Driven Changes to Rainfall and Streamflow Patterns in a Model Tropical Island Hydrological System. J. Hydrol. 2015, 523, 160–169. [Google Scholar] [CrossRef]
- Strauch, A.M.; MacKenzie, R.A.; Bruland, G.L.; Tingley, R.; Giardina, C.P. Climate Change and Land Use Drivers of Fecal Bacteria in Tropical Hawaiian Rivers. J. Environ. Qual. 2014, 43, 1475. [Google Scholar] [CrossRef] [PubMed]
- Engott, J.A. A Water-Budget Model and Assessment of Groundwater Recharge for the Island of Hawaii; U.S. Geological Survey Scientific Investigations Report 2011–5078; Department of the Interior, US Geological Survey: Washington, DC, USA, 2011; Volume 53.
- Engott, J.A.; Johnson, A.G.; Bassiouni, M.; Izuka, S.K.; Rotzoll, K. Spatially Distributed Groundwater Recharge for 2010 Land Cover Estimated Using a Water-Budget Model for the Island of Óahu, Hawaii; U.S. Geological Survey Scientific Investigations Report 2015–5010; Department of the Interior, US Geological Survey: Washington, DC, USA, 2017; Volume 49.
- Johnson, A.G.; Engott, J.A.; Bassiouni, M.; Rotzoll, K. Spatially Distributed Groundwater Recharge Estimated Using a Water-Budget Model for the Island of Maui, Hawaii, 1978–2007; U.S. Geological Survey Scientific Investigations Report 2014–5168; Department of the Interior, US Geological Survey: Washington, DC, USA, 2018; Volume 64. [CrossRef]
- Oki, D.S.; Engott, J.A.; Rotzoll, K. Numerical Simulation of Groundwater Availability in Central Molokaí, Hawaii; U.S. Geological Survey Scientific Investigations Report 2019–5150; U.S. Geological Survey: Menlo Park, CA, USA, 2020; Volume 95. [CrossRef]
- Izuka, S.K. Effects of Irrigation, Drought, and Ground-Water Withdrawals on Ground-Water Levels in the Southern Lihue Basin, Kauai, Hawaii; U.S. Geological Survey Scientific Investigations Report 2006-5291; U.S. Geological Survey: Menlo Park, CA, USA, 2006; p. 52. [CrossRef]
- Gingerich, S.B.; Engott, J.A. Groundwater Availability in the Lahaina District, West Maui, Hawaii; U.S. Geological Survey Scientific Investigations Report 2012–5010; U.S. Geological Survey: Menlo Park, CA, USA, 2012; Volume 90. [CrossRef]
- Bassiouni, M.; Oki, D.S. Trends and Shifts in Streamflow in Hawaii, 1913-2008. Hydrol. Process. 2013, 27, 1484–1500. [Google Scholar] [CrossRef]
- Dolling, K.; Chu, P.-S.; Fujioka, F. A Climatological Study of the Keetch/Byram Drought Index and Fire Activity in the Hawaiian Islands. Agric. For. Meteorol. 2005, 133, 17–27. [Google Scholar] [CrossRef]
- Dolling, K.; Chu, P.-S.; Fujioka, F. Natural Variability of the Keetch–Byram Drought Index in the Hawaiian Islands. Int. J. Wildland Fire 2009, 18, 459–475. [Google Scholar] [CrossRef]
- Trauernicht, C.; Pickett, E.; Giardina, C.P.; Litton, C.M.; Cordell, S.; Beavers, A. The Contemporary Scale and Context of Wildfire in Hawaii. Pac. Sci. 2015, 69, 427–444. [Google Scholar] [CrossRef]
- Hawbaker, T.J.; Trauernicht, C.; Howard, S.M.; Litton, C.M.; Giardina, C.P.; Jacobi, J.D.; Fortini, L.B.; Hughes, R.F.; Selmants, P.C.; Zhu, Z. Wildland Fires and Greenhouse Gas Emissions in Hawaii. In Baseline and Projected Future Carbon Storage and Carbon Fluxes in Ecosystems of Hawaii; US Geological Survey Professional Paper 1834; U.S. Geological Survey: Menlo Park, CA, USA, 2017; pp. 57–73. [Google Scholar] [CrossRef]
- Frazier, A.G.; Deenik, J.L.; Fujii, N.D.; Funderburk, G.R.; Giambelluca, T.W.; Giardina, C.P.; Helweg, D.A.; Keener, V.W.; Mair, A.; Marra, J.J.; et al. Chapter 5: Managing Effects of Drought in Hawaii and U.S.-Affiliated Pacific Islands. In Effects of Drought on Forests and Rangelands in the United States: Translating Science into Management Responses; Peterson, J.M., Luce, D.L., Patel-Weynand, C.H., Vose, T., Eds.; U.S. Department of Agriculture Forest Service, Washington Office: Washington, DC, USA, 2019; pp. 95–121. [Google Scholar]
- Tunison, J.T.; D’Antonio, C.M.; Loh, R.K. Fire and Invasive Plants in Hawaii Volcanoes National Park. In Proceedings of the Invasive Species Workshop: The Role of Fire in the Control and Spread of Invasive Species, Fire Conference 2000: The First National Congress on Fire Ecology, Prevention, and Management, Tallahassee, FL, USA, 27 November–1 December 2000. [Google Scholar]
- Nugent, A.D.; Longman, R.J.; Trauernicht, C.; Lucas, M.P.; Diaz, H.F.; Giambelluca, T.W. Fire and Rain: The Legacy of Hurricane Lane in Hawaii. Bull. Am. Meteorol. Soc. 2020, 101, E954–E967. [Google Scholar] [CrossRef]
- Trauernicht, C. Vegetation-Rainfall Interactions Reveal How Climate Variability and Climate Change Alter Spatial Patterns of Wildland Fire Probability on Big Island, Hawaii. Sci. Total Environ. 2018, 650, 459–469. [Google Scholar] [CrossRef]
- Trauernicht, C. El Niño and Long-Lead Fire Weather Prediction for Hawaii and Us-Affiliated Pacific Islands. Pacific Fire Exchange (PFX), PFX Fact Sheet 2015_1. 2015. Available online: http://www.c4gts.org/wp-content/uploads/2020/05/El-nino-Pacific-Island-wildfires-Pacific-Fire-Exchange-2015.pdf (accessed on 30 August 2020).
- Brasher, A.M.; Wolff, R.H.; Luton, C.D. Associations among Land Use, Habitat Characteristics, and Invertebrate Community Structure in Nine Streams on the Island of Oahu, Hawaii, 1999–2001; U.S. Geological Survey, National Water-Quality Assessment Program: Reston, VA, USA, 2004; pp. 1–47.
- Stender, Y.; Jokiel, P.L.; Rodgers, K.S. Thirty Years of Coral Reef Change in Relation to Coastal Construction and Increased Sedimentation at Pelekane Bay, Hawai’i. PeerJ 2014, 2, e300. [Google Scholar] [CrossRef]
- Clilverd, H.M.; Tsang, Y.-P.; Infante, D.M.; Lynch, A.J.; Strauch, A.M. Long-Term Streamflow Trends in Hawaii and Implications for Native Stream Fauna. Hydrol. Process. 2019, 33, 699–719. [Google Scholar] [CrossRef]
- Hau, S. Hīhīwai (Neritina Granosa Sowerby) Recruitment in ‘Īao and Honomanū Streams on the Island of Maui, Hawaii. Bish. Mus. Bull. Cult. Environ. Stud. 2007, 3, 171–181. [Google Scholar]
- McIntosh, M.D.; Benbow, M.E.; Burky, A.J. Effects of Stream Diversion on Riffle Macroinvertebrate Communities in a Maui, Hawaii, Stream. River Res. Appl. 2002, 18, 569–581. [Google Scholar] [CrossRef]
- Strauch, A.M.; MacKenzie, R.A.; Tingley, R.W. Base Flow-Driven Shifts in Tropical Stream Temperature Regimes across a Mean Annual Rainfall Gradient. Hydrol. Process. 2017, 31, 1678–1689. [Google Scholar] [CrossRef]
- Tsang, Y.-P.; Tingley, R.W.; Hsiao, J.; Infante, D.M. Identifying High Value Areas for Conservation: Accounting for Connections among Terrestrial, Freshwater, and Marine Habitats in a Tropical Island System. J. Nat. Conserv. 2019, 50, 125711. [Google Scholar] [CrossRef]
- Tribble, G.W. Ground Water on Tropical Pacific Islands: Understanding a Vital Resource; Geological Survey: Reston, VA, USA, 2008; Volume 1312. [Google Scholar]
- Pau, S.; Okin, G.; Gillespie, T.W. Asynchronous Response of Tropical Forest Leaf Phenology to Seasonal and El Niño-Driven Drought. PLoS ONE 2010, 5, e11325. [Google Scholar] [CrossRef] [PubMed]
- Barbosa, J.M.; Asner, G.P. Effects of Long-Term Rainfall Decline on the Structure and Functioning of Hawaiian Forests. Environ. Res. Lett. 2017, 12, 094002. [Google Scholar] [CrossRef]
- Crausbay, S.D.; Frazier, A.G.; Giambelluca, T.W.; Longman, R.J.; Hotchkiss, S.C. Moisture Status During a Strong El Niño Explains a Tropical Montane Cloud Forest’s Upper Limit. Oecologia 2014, 175, 273–284. [Google Scholar] [CrossRef]
- Christoph, L.; Schulte, M. Microclimatological Investigations in the Tropical Alpine Scrub of Maui, Hawaii: Evidence for a Drought-Induced Alpine Timberline. Pac. Sci. 1991, 45, 152–168. [Google Scholar]
- Krushelnycky, P.D.; Starr, F.; Starr, K.; Longman, R.J.; Frazier, A.G.; Loope, L.L.; Giambelluca, T.W. Change in Trade Wind Inversion Frequency Implicated in the Decline of an Alpine Plant. Clim. Chang. Responses 2016, 3, 1. [Google Scholar] [CrossRef]
- Lohse, K.A.; Nullet, D.; Vitousek, P.M. Effects of Extreme Drought on Vegetation of a Lava Flow on Mauna Loa, Hawaii. Pac. Sci. 1995, 49, 212–220. [Google Scholar]
- Weller, S.G.; Cabin, R.J.; Lorence, D.H.; Perlman, S.; Wood, K.; Flynn, T.; Sakai, A.K. Alien Plant Invasions, Introduced Ungulates, and Alternative States in a Mesic Forest in Hawaii. Restor. Ecol. 2011, 19, 671–680. [Google Scholar] [CrossRef]
- Goergen, E.; Daehler, C.C. Factors Affecting Seedling Recruitment in an Invasive Grass (Pennisetum Setaceum) and a Native Grass (Heteropogon Contortus) in the Hawaiian Islands. Plant Ecol. 2002, 161, 147–156. [Google Scholar] [CrossRef]
- Barton, K.E.; Jones, C.; Edwards, K.F.; Shiels, A.B.; Knight, T. Shiels, and Tiffany Knight. Local Adaptation Constrains Drought Tolerance in a Tropical Foundation Tree. J. Ecol. 2020, 108, 1540–1552. [Google Scholar] [CrossRef]
- Westerband, A.C.; Bialic-Murphy, L.; Weisenberger, L.A.; Barton, K.E. Intraspecific Variation in Seedling Drought Tolerance and Associated Traits in a Critically Endangered, Endemic Hawaiian Shrub. Plant Ecol. Divers. 2020, 13, 159–174. [Google Scholar] [CrossRef]
- Craven, D.; Gulamhussein, S.; Berlyn, G. Physiological and Anatomical Responses of Acacia Koa (Gray) Seedlings to Varying Light and Drought Conditions. Environ. Exp. Bot. 2010, 69, 205–213. [Google Scholar] [CrossRef]
- Michaud, J.; Cordell, S.; Cole, T.C.; Ostertag, R. Drought in an Invaded Hawaiian Lowland Wet Forest. Pac. Sci. 2015, 69, 367–383. [Google Scholar] [CrossRef]
- Krushelnycky, P.D.; Felts, J.M.; Robichaux, R.H.; Barton, K.E.; Litton, C.M.; Brown, M.D. Clinal Variation in Drought Resistance Shapes Past Population Declines and Future Management of a Threatened Plant. Ecol. Monogr. Ecol. Monogr. 2019, 90, 1. [Google Scholar] [CrossRef]
- Banko, P.C.; Camp, R.; Farmer, C.; Brinck, K.W.; Leonard, D.L.; Stephens, R.M. Response of Palila and Other Subalpine Hawaiian Forest Bird Species to Prolonged Drought and Habitat Degradation by Feral Ungulates. Biol. Conserv. 2013, 157, 70–77. [Google Scholar] [CrossRef]
- Banko, P.C.; Hess, S.C.; Scowcroft, P.G.; Farmer, C.; Jacobi, J.D.; Stephens, R.M.; Camp, R.J.; Leonard, D.L.; Brinck, K.W.; Juvik, J.O.; et al. Evaluating the Long-Term Management of Introduced Ungulates to Protect the Palila, an Endangered Bird, and Its Critical Habitat in Subalpine Forest of Mauna Kea, Hawaii. Arct. Antarct. Alp. Res. 2014, 46, 871–889. [Google Scholar] [CrossRef][Green Version]
- Smith, C.D.M. 2016 Water Master Plan; Honolulu Board of Water Supply: Honolulu, HI, USA, 2016; Volume 216. [Google Scholar]
- Anderson, C.L.; Piscolish, M.; Henly-Shepard, S. Summary Report: Outcomes from Integrating Socioeconomic Assessments to Build Community Resilience in Mitigating Drought in Hawaii. In Proceedings of the 92nd American Meteorological Society Annual Meeting, New Orleans, LA, USA, 22–26 January 2012; pp. 1–9. [Google Scholar]
- Reyes, J.J.; Elias, E.; Haacker, E.; Kremen, A.; Parker, L.; Rottler, C. Assessing Agricultural Risk Management Using Historic Crop Insurance Loss Data over the Ogallala Aquifer. Agric. Water Manag. 2020, 232, 106000. [Google Scholar] [CrossRef]
- Macomber, P. Guidelines on Rainwater Catchment Systems for Hawaii; College of Tropical Agriculture and Human Resources, University of Hawaii at Mānoa: Manoa, HI, USA, 2010. [Google Scholar]
- Gingerich, S.B.; Oki, D.S. Ground Water in Hawaii; U.S. Geological Survey: Menlo Park, CA, USA, 2000; Volume 6.
- Holding, S.; Allen, D.M.; Foster, S.; Hsieh, A.; Larocque, I.; Klassen, J.; Van Pelt, S.C. Groundwater Vulnerability on Small Islands. Nat. Clim. Chang. 2016, 6, 1100–1103. [Google Scholar] [CrossRef]
- Karnauskas, K.B.; Donnelly, J.P.; Anchukaitis, K.J. Future Freshwater Stress for Island Populations. Nat. Clim. Chang. 2016, 6, 720–725. [Google Scholar] [CrossRef]
- Mair, A.; Johnson, A.G.; Rotzoll, K.; Oki, D.S. Estimated Groundwater Recharge from a Water-Budget Model Incorporating Selected Climate Projections, Island of Maui, Hawaii; U.S. Geological Survey Scientific Investigations Report 2019–5064; CABI Publishing: New York, NY, USA, 2019; Volume 46. [Google Scholar]
- Kolivras, K.N. Changes in Dengue Risk Potential in Hawaii, USA, Due to Climate Variability and Change. Clim. Res. 2010, 42, 1–11. [Google Scholar] [CrossRef]
- Finucane, M.L.; Peterson, J. Human Dimensions of Drought in Hawaii. An Exploratory Study of Perceptions of and Responses to Drought Risk; East-West Center: Honolulu, HI, USA, 2010; pp. 1–12. [Google Scholar]
- Sproat, D.K. An Indigenous People’s Right to Environmental Self-Determination: Native Hawaiians and the Struggle against Climate Change Devastation. Stanf. Environ. Law J. 2016, 35, 157. [Google Scholar]
- Allen, C.D.; Breshears, D.D.; McDowell, N.G. On Underestimation of Global Vulnerability to Tree Mortality and Forest Die-Off from Hotter Drought in the Anthropocene. Ecosphere 2015, 6, 1–55. [Google Scholar] [CrossRef]
- Otkin, J.A.; Svoboda, M.; Hunt, E.D.; Ford, T.W.; Anderson, M.C.; Hain, C.; Basara, J. Flash Droughts: A Review and Assessment of the Challenges Imposed by Rapid-Onset Droughts in the United States. Bull. Am. Meteorol. Soc. 2018, 99, 911–919. [Google Scholar] [CrossRef]
- Van Loon, A.F.; Gleeson, T.; Clark, J.; Van Dijk, A.; Stahl, K.; Hannaford, J.; Di Baldassarre, G.; Teuling, A.; Tallaksen, L.M.; Uijlenhoet, R.; et al. Drought in the Anthropocene. Nat. Geosci. 2016, 9, 89–91. [Google Scholar] [CrossRef]
- Crausbay, S.D.; Betancourt, J.; Bradford, J.; Cartwright, J.; Dennison, W.C.; Dunham, J.; Enquist, C.A.; Frazier, A.G.; Hall, K.R.; Littell, J.S.; et al. Unfamiliar Territory: Emerging Themes for Ecological Drought Research and Management. One Earth 2020, 3, 337–353. [Google Scholar] [CrossRef]
- McLean, J.; Cleveland, S.B.; Dodge, M.; Lucas, M.P.; Longman, R.J.; Giambelluca, T.W.; Jacobs, G.A. Building a Portal for Climate Data—Mapping Automation, Visualization, and Dissemination. Concurr. Comput. Pract. Exp. 2021, e6727. [Google Scholar] [CrossRef]
- McGree, S.; Herold, N.; Alexander, L.; Schreider, S.; Kuleshov, Y.; Ene, E.; Finaulahi, S.; Inape, K.; MacKenzie, B.; Malala, H.; et al. Recent Changes in Mean and Extreme Temperature and Precipitation in the Western Pacific Islands. J. Clim. 2019, 32, 4919–4941. [Google Scholar] [CrossRef]
- Brewington, L.; Keener, V.; Mair, A. Simulating Land Cover Change Impacts on Groundwater Recharge under Selected Climate Projections, Maui, Hawaii. Remote Sens. 2019, 11, 3048. [Google Scholar] [CrossRef]
- Adhikari, M.; Longman, R.J.; Giambelluca, T.W.; Lee, C.N.; He, Y. Climate Change Impacts Shifting Landscape of the Dairy Industry in Hawaii. Transl. Anim. Sci. 2022, 6, xac064. [Google Scholar] [CrossRef] [PubMed]
- Longman, R.J.; Peterson, C.L.; Baroli, M.; Frazier, A.G.; Cook, Z.; Parsons, E.W.; Dinan, M.; Kamelamela, K.L.; Steele, C.; Burnett, R.; et al. Climate Adaptation for Tropical Island Land Stewardship: Adapting a Workshop Planning Process to Hawaii. Bull. Am. Meteorol. Soc. 2022, 103, E402–E409. [Google Scholar] [CrossRef]
- Kagawa, A.K.; Vitousek, P.M. The Ahupuáa of Puanui: A Resource for Understanding Hawaiian Rain-Fed Agriculture. Pac. Sci. 2012, 66, 161–172. [Google Scholar] [CrossRef]
- Lincoln, N.; Ladefoged, T. Agroecology of Pre-Contact Hawaiian Dryland Farming: The Spatial Extent, Yield and Social Impact of Hawaiian Breadfruit Groves in Kona, Hawaii. J. Archaeol. Sci. 2014, 49, 192–202. [Google Scholar] [CrossRef]
- Longman, R.J.; Frazier, A.G.; Giardina, C.P.; Parsons, E.W.; McDaniel, S. The Pacific Drought Knowledge Exchange: A Co-Production Approach to Deliver Climate Resources to User Groups. Sustainability 2022, 14, 10554. [Google Scholar] [CrossRef]
- Meadow, A.M.; Ferguson, D.B.; Guido, Z.; Horangic, A.; Owen, G.; Wall, T. Moving toward the Deliberate Coproduction of Climate Science Knowledge. Weather Clim. Soc. 2015, 7, 179–191. [Google Scholar] [CrossRef]


| Overall Rank | Start | End | Avg. Intensity | Peak Intensity | Duration | Magnitude | Max. Pct. Area |
|---|---|---|---|---|---|---|---|
| 1 | March 2007 | September 2014 | 1.03 | −2.28 | 91 | −93.3 | 92.4 |
| 2 | January 1998 | February 2002 | 1.07 | −1.73 | 50 | −53.7 | 83.0 |
| 3 | September 1975 | November 1978 | 0.62 | −1.37 | 39 | −24.2 | 85.5 |
| 4 | October 1952 | November 1954 | 0.81 | −1.51 | 26 | −21.0 | 75.0 |
| 5 | December 2002 | February 2004 | 1.05 | −1.63 | 15 | −15.7 | 80.0 |
| 6 | January 1972 | March 1974 | 0.59 | −1.45 | 27 | −15.8 | 90.6 |
| 7 | April 1983 | September 1985 | 0.74 | −1.39 | 30 | −22.2 | 72.4 |
| 8 | April 1925 | March 1927 | 0.73 | −1.45 | 24 | −17.6 | 73.3 |
| 9 | January 1995 | October 1996 | 0.65 | −1.36 | 22 | −14.2 | 71.7 |
| 10 | December 1991 | May 1994 | 0.49 | −1.25 | 30 | −14.6 | 68.1 |
| 11 | February 1933 | October 1934 | 0.58 | −1.36 | 21 | −12.3 | 72.6 |
| 12 | March 1981 | December 1981 | 0.98 | −1.32 | 10 | −9.8 | 67.9 |
Publisher’s Note: MDPI stays neutral with regard to jurisdictional claims in published maps and institutional affiliations. |
© 2022 by the authors. Licensee MDPI, Basel, Switzerland. This article is an open access article distributed under the terms and conditions of the Creative Commons Attribution (CC BY) license (https://creativecommons.org/licenses/by/4.0/).
Share and Cite
Frazier, A.G.; Giardina, C.P.; Giambelluca, T.W.; Brewington, L.; Chen, Y.-L.; Chu, P.-S.; Berio Fortini, L.; Hall, D.; Helweg, D.A.; Keener, V.W.; et al. A Century of Drought in Hawaiʻi: Geospatial Analysis and Synthesis across Hydrological, Ecological, and Socioeconomic Scales. Sustainability 2022, 14, 12023. https://doi.org/10.3390/su141912023
Frazier AG, Giardina CP, Giambelluca TW, Brewington L, Chen Y-L, Chu P-S, Berio Fortini L, Hall D, Helweg DA, Keener VW, et al. A Century of Drought in Hawaiʻi: Geospatial Analysis and Synthesis across Hydrological, Ecological, and Socioeconomic Scales. Sustainability. 2022; 14(19):12023. https://doi.org/10.3390/su141912023
Chicago/Turabian StyleFrazier, Abby G., Christian P. Giardina, Thomas W. Giambelluca, Laura Brewington, Yi-Leng Chen, Pao-Shin Chu, Lucas Berio Fortini, Danielle Hall, David A. Helweg, Victoria W. Keener, and et al. 2022. "A Century of Drought in Hawaiʻi: Geospatial Analysis and Synthesis across Hydrological, Ecological, and Socioeconomic Scales" Sustainability 14, no. 19: 12023. https://doi.org/10.3390/su141912023
APA StyleFrazier, A. G., Giardina, C. P., Giambelluca, T. W., Brewington, L., Chen, Y.-L., Chu, P.-S., Berio Fortini, L., Hall, D., Helweg, D. A., Keener, V. W., Longman, R. J., Lucas, M. P., Mair, A., Oki, D. S., Reyes, J. J., Yelenik, S. G., & Trauernicht, C. (2022). A Century of Drought in Hawaiʻi: Geospatial Analysis and Synthesis across Hydrological, Ecological, and Socioeconomic Scales. Sustainability, 14(19), 12023. https://doi.org/10.3390/su141912023