Article

The Description and Application of BRDF Based on Shape Vectors for Typical Landcovers

1
School of Geomatics, Liaoning Technical University, Fuxin 123000, China
2
School of Environment Science and Spatial Informatics, China University of Mining and Technology, Xuzhou 221116, China
*
Author to whom correspondence should be addressed.
Sustainability 2022, 14(19), 11883; https://doi.org/10.3390/su141911883
Submission received: 25 July 2022 / Revised: 18 September 2022 / Accepted: 19 September 2022 / Published: 21 September 2022

Abstract

:
As the inherent attribute of land cover, anisotropy leads to the heterogeneity of directional reflection; meanwhile, it creates the opportunity for retrieving characteristics of land surface based on multi-angle observations. BRDF (Bidirectional Reflectance Distribution Function) is the theoretical expression of anisotropy and describes the reflectance in terms of incident-view geometry. Prior BRDF knowledge is used to achieve the multi-angle retrieval for earth observation systems with a narrow FOV (Field of View). Shape indicators are a feasible way to capture the characteristics of BRDF or to build an a priori database of BRDF. However, existing shape indicators based on the ratio of reflectance or the weight of scattering effects are too rough to describe the BRDF’s shape. Thus, it is necessary to propose new shape vectors to satisfy the demand. We selected six typical land covers from MODIS-MCD12 on the homogeneous underlayers as the study sites in North America. The daily BRDF is retrieved by MODIS-BRDF parameters and the RossThick-LiSparseR model. When the SZA (Solar Zenith Angle) is set at 45°, seven directions (−70°, −45°, −20°, 0°, 20°, 45°, and 70°) including edge spot, zenith spot, hot spot and approximate dark spot of the BRDF principal plane were selected to construct two vectors by the change rate of reflectance and angle formulation: Partial Anisotropic Vector (PAV) and Angular Effect Vector (AEV). Then, we assessed the effectiveness of PAV and AEV compared with ANIX (Anisotropic Index), ANIF (Anisotropic Factor) and AFX (Anisotropic Flat Index) by two typical BRDF shapes. The representativeness of PAV and AEV for the original BRDF was also assessed by cosine similarity and error transfer function. Lastly, the application of hot spot components in AEV for land cover classification, the monitoring of land cover in mining areas and the adjustment effect by NDVI (Normalized Difference Vegetation Index) were investigated. The results show that (1) the shape vectors have good representativeness compared with original BRDF. The representativeness of PAV assessed by cosine similarity is 0.980, 0.979 and 0.969, and the representativeness of AEV assessed by error transfer function is 0.987, 0.991 and 0.994 in the three MODIS broadbands of Near Infrared (NIR, 0.7–5.0 µm), Short Wave (SW, 0.3–5.0 µm) and Visible (VIS, 0.3–0.7 µm). (2) Some components of shape vectors have high correlation with AFX. The correlation coefficient between hot spot components in AEV and AFX is 0.936, 0.945 and 0.863, respectively, in NIR, SW and VIS bands. (3) The shape vectors show potentiality for land cover classification and the monitoring of land cover in mining areas. The correlation coefficients of hot spot components in AEV for MODIS-pixels with the same types (0.557, 0.561, 0.527) are significantly higher than MODIS-pixels with various types (0.069, 0.055, 0.051) in NIR, SW and VIS bands. The coefficients of variation for hot spot components are significantly higher after land reclamation (0.0071, 0.0099) than before land reclamation (0.0020, 0.0028). (4) The correlation between NDVI and the BRDF shapes is poor in three MODIS broad bands. The correlation coefficients between NDVI and the BRDF shapes in three temporal scales of annual, seasonal and monthly phases are only 0.134, 0.063 and 0.038 (NIR), 0.199, 0.185 and 0.165 (SW), and 0.323, 0.320 and 0.337 (VIS), on average.

1. Introduction

Anisotropy is defined as the heterogeneity of the reflectance from land cover as confirmed by ground, airborne and spaceborne observations [1,2,3]. As the inherent attribute of the surface, anisotropy is closely related to the spatial structure and material composition of land cover. The type of land cover is the direct embodiment of the morphological characteristics and dynamic changes of the land surface; it focuses on describing the physical and biological properties of land cover and has specific spatiotemporal characteristics [4,5,6]. Utilizing the remote sensing data to extract and quantify the spectral reflectance of land cover to identify specific types is an important method for global land cover classification. It has produced a variety of global land cover classification productions, such as the Global Land Cover production based on AVHRR (Advanced Very High Resolution Radiometer), the MCD12 series based on MODIS (Moderate-Resolution Imaging SpectroRadiometer) and the FROM-GLC (Finer Resolution Observation and Monitoring of Global Land Cover) dataset based on Landsat satellites [7,8,9,10]. It is a feasible way to select specific land cover types from classification production and combine their biological and physical characteristics with anisotropic information to explore the characteristics of spatiotemporal variation for anisotropy.
Anisotropy affects directional reflectance, which results in the variation of reflectance for fixed surfaces and disturbs the information for land cover. Due to anisotropy, the variation of NDVI based on multi-angle reflectance for fixed land surfaces could be as high as 12–25% [11]. For crops in mature stages, the relative differences of vegetation indexes obtained from multi-angle observations may exceed 50% [12]. Thus, anisotropy should be normalized to weaken or eliminate the influence [13,14,15]. In addition, anisotropy also enriches the reflected information of fixed land surfaces. Gao used the heterogeneity of directional reflectance in NIR and Red band to detect the types and structures of land cover [16]. Wang utilized anisotropic remote sensing data and airborne Lidar to obtain structure parameters of forests in a large area [17]. Land surface parameters or categories could be identified accurately by the algorithm founded by anisotropic theory [18,19,20,21,22]. Thus, anisotropy is of great significance for detecting spatial structures and retrieving the parameters of land cover.
As the theoretical expression of anisotropy, BRDF (Bidirectional Reflectance Distribution Function) has been widely used in the fields of the retrieval of spatial structures and parameters for land cover, the normalization of angular effects and land cover classification. Since Nicodemus first put forward the concept of BRDF [23], many studies have investigated the construction of a BRDF model. From the perspective of the mechanism, BRDF models can be divided into empirical models, radiative transfer models, geometric-optical models and semi-empirical models. (1) Empirical models directly establish the statistical relationship between the parameters and observations of land cover. As a classic empirical model, Walthall was established for soil; its simulation effect for soybean was also found to be good [24,25,26]. (2) Radiative transfer models are a kind of physical model based on radiative transfer equations and the theory of average canopy transmission. The model is applicable to the land cover with uniform canopy and limited changes in vertical direction, such as grassland and crops. The characteristic of the radiative transfer model is that it considers the multiple-scattering effect in the radiative transfer process, and the theory is rigorous. However, the solution for the radiative transfer model is tedious, and it is necessary to determine the upper and lower boundary conditions of the canopy, which usually need to be solved based on the KM (Kubelka Munk) theory [27,28,29,30,31,32]. (3) The geometric-optical model abstracts the canopy as crowns with a certain geometry and random distribution [33,34,35]. According to the method of landscape synthesis, the geometric-optical model is constructed by four components: illuminated vegetation, illuminated ground, shadow vegetation and shadow ground. (4) The semi-empirical model describes directional reflectance as a combination of parameters with certain physical significance, such as RPV (Rahman Pinty Verstraete) and the kernel-driven model [36,37]. The semi-empirical model has good operability and is widely used in the batch processing of satellite data or the retrieval of global parameters. Lucht proposed AMBRALS (Algorithm for Model Bidirectional Reflectance Anisotropies of the Land Surface), based on the kernel-driven RossThick-LiSparseR model [37], which effectively solved the scientific problem of the retrieval of BRDF/albedo for MODIS data.
The establishment of BRDF depends on the acquisition of multi-angle observations. The existing multi-angle sensors could acquire multi-angle observations using swath overlapping, such as MODIS, MISR (Multi-angle Imaging SpectroRadiometer) and POLDER (Polarization and Directionality of the Earth’s Reflectances) [38,39,40], but their spatial resolutions from hundreds of meters to several kilometers have difficulty capturing most of the disturbances caused by natural or human activities. Due to the narrow FOV (Field of View), the sensors of earth observation systems with a finer scale could not obtain multi-angle observations, such as the satellites of Landsat series, Sentinel series and GF (Gao Fen) series [41,42,43]. The introduction of a priori BRDF knowledge is an effective way to solve the multi-angle problem for earth observation systems with a finer scale. To build a priori BRDF knowledge, it is necessary to obtain the parameters that can describe the shape of BRDF effectively and track the change of BRDF’s shape in spatiotemporal dimensions. Currently, there are three main ideas for constructing a priori BRDF knowledge. (1) Shuai directly constructed a priori BRDF knowledge based on MODIS-500 m pixels in homogeneous land cover, and the BRDF was used for Landsat-30 m pixels with the same type [44,45]; (2) Franch used NDVI (Normalized Difference Vegetation Index) to adjust the shape of BRDF for MODIS-5.6 km pixels and then decomposed it to 30 m pixels to estimate the parameters of land cover [46,47]; (3) Jiao established a BRDF archetype database by using a clustering algorithm and spectral normalization based on AFX [48,49]. For the method of constructing a priori BRDF knowledge based on BRDF shape indicators, although the classical BRDF shape indicators could describe the BRDF’s shape to a certain extent, the mechanism based on the ratio of a few scattering directions or the weight of scattering effects has difficulty reflecting the variation of BRDF comprehensively and effectively. It is necessary to construct shape vectors based on new shape indicators that can describe the variation of BRDF’s shape effectively and accurately.
The variety of spatial structures and spectral characteristics of land cover determines the various shapes of BRDF for various land cover types. Many studies have discussed BRDF’s shape from the perspective of shape indicators and taken them as a feasible way to describe the characteristics of BRDF’s shape. Typical BRDF shape indicators include: ANIF (Anisotropic Factor), ANIX (Anisotropic Index), NDAX (Normalized Difference between Anisotropic Index), SSI (Structural Scattering Index), AFX (Anisotropic Flat Index) and NDHD (Normalized Difference between Hot spot and Dark spot) [50]. These shape indicators express the angular effect through the ratio of reflectance between typical scattering directions of BRDF or the weight of scattering effects. Sandmeier showed that broadband and hyperspectral data have the same physical mechanism of surface bidirectional reflection and pointed out that BRDF had the potentiality to retrieve the structural parameters of vegetation canopy based on ANIF and ANIX [51,52]. Chen retrieved the global clumping index map by exploring the correlation between NDHD and the clumping index of vegetation [53]. Gao used the SSI to detect the type and spatial structure of land cover [16]. Jiao proved that shape indicators have the potentiality to inverse the structure of land cover and pointed out that the AFX has the ability to capture the variation of BRDF [50]. Thus, shape indicators provide a feasible way to study BRDF’s shape and the retrieval of land cover parameters.
In this study, we selected six typical land covers from MODIS-MCD12 on the homogeneous underlayers as study sites in North America, and their daily MODIS-BRDF shape was retrieved by MODIS-MCD43 and the Rossthick-LisparseR model. PAV (Partial Anisotropic Vector) and AEV (Angular Effect Vector) were proposed to describe the BRDF’s shape completely. Then, we assessed the effectiveness of PAV and AEV compared with ANIX, ANIF and AFX using two typical BRDF shapes. The representativeness of PAV and AEV for the original BRDF was also assessed by cosine similarity and error transfer function. Finally, we investigated the application of hot spot components in AEV for land cover classification, the monitoring of land cover in mining areas and the assessment of the correlation between this and NDVI.

2. Data

2.1. MODIS Classification Dataset

MODIS-MCD12 datasets provide two classification products of land cover with different spatial resolution, MCD12Q1 (500 m) and MCD12C1 (5.6 km). MCD12Q1 extracts the information of land cover by monitoring and classifying the reflectance in the zenith direction, then further refines the specific category by combining the prior knowledge and auxiliary information of land cover. MCD12Q1 is organized by tile images, taking the earth as the reference frame. The land surface is divided into more than 600 tiles, with a range of 1200 km × 1200 km, and each tile image is given a horizontal number and a vertical number. Among these tile products, 9 MODIS golden tiles are selected over areas that are expected to be representative of the variability of the majority for the MODIS land products. MCD12C1 provides a global land cover classification production, with the resolution of 0.05 degrees (5.6 km) at an annual step. MCD12C1 is produced by means of re-projection and aggregation based on MCD12Q1. The overall accuracy of MODIS land cover type products is 75% [54]. MODIS-MCD12 datasets in 2019 were selected as the basic data for the selection of study sites. MODIS-MCD12 datasets were downloaded from https://ladsweb.modaps.eosdis.nasa.gov/search/ (accessed on 30 January 2021).
We chose the golden tile located in the Southwestern United States, which includes almost all land types from IGBP (International Geosphere-Biosphere Programme) and seasonal dynamics of plant diversity, as the study region (No. H09V05, 92.38° W to 117.49° W, 30° N to 40° N). In the study area, we selected six typical land cover samples with high confidence (98%, 93%, 89%, 96%, 97% and 92%), which are Evergreen Broadleaf Forests (EBF), Deciduous Broadleaf Forests (DBF), Savannas, Grassland, Cropland and Evergreen Needleleaf Forests (ENF) (Figure 1). Then, MODIS pixels (5.6 km) were re-projected to MCD12Q1, and MODIS-500 m pixels were selected as the study sites on the homogeneous underlayer; the adjacent 8 MODIS-500 m pixels around each study site were the same type (Figure 2). Study sites with the corresponding datasets of MODIS and CDL (Cropland Data Layer) were used to analyze problems of land surface albedo in Ref. [55]; these sites together with neighbor pixels around them were used in this research.

2.2. MODIS BRDF Dataset

The operational MODIS-BRDF dataset was produced on the Rossthick-LisparseR model and weighted multi-angle observations, then the parameters of MODIS-BRDF were estimated by the method of data fitting [37]. The Rossthick-LisparseR model is a semi-empirical model, and the reflectance of landcover is composed of three kernels (Isotropic kernel, Volumetric kernel, Geometric kernel) and their coefficients. Combined with the multi-angle observations, the coefficients of three scattering kernels can be fitted under the principle of least square to determine a MODIS-BRDF model. The reflectance of a fixed land cover under any incident-view geometry can be inversed through the MODIS-BRDF model. The MCD43A1 dataset is a daily product of BRDF parameters with a spatial resolution of 500 m. MCD43A1 assumes that the land surface has no change in a period of 16 days and obtains sufficient observations by weighting the multi-angle observations in 16 days to the 9th day.
The science data sets (SDS) of quality flags in MCD43A1 can reflect the quality of MODIS-BRDF (Full BRDF inversions and Magnitude BRDF inversions), which also reflects the uncertainty in the fitting process of BRDF and the applicability of sampling observations. Full BRDF inversions mean the fitting process is under sufficient and high-quality observations, while in magnitude BRDF inversions, BRDF is produced through a back-up algorithm integrating a priori knowledge for insufficient and poor observations [37]. MODIS-BRDF parameters of NIR (0.7–5.0 μm), SW (0.3–5.0 μm) and VIS (0.3–0.7 μm) for study sites in 2019 from the MCD43A1 dataset were selected to retrieve BRDF’s shape. The MODIS-BRDF can also be used to adjust the reflectance from the original angle to the zenith direction, and the MCD43A4 dataset is composed by the zenith reflectance. These datasets were downloaded from https://ladsweb.modaps.eosdis.nasa.gov/search/ (accessed on 30 January 2021).

2.3. CDL Dataset

The CDL database in 2019 was used to provide data for the detailed analysis of MODIS-500 m pixels, which is helpful to understand the mixture of MODIS pixels. Since 1997, the NASS (National Agricultural Statistics Service) has implemented the CDL program, which is based on a land cover classification map (30 m) covering the United States from the USGS (United States Geological Survey). CDL strengthens the agricultural resource and is based on field surveys and samplings, with the accuracy of agricultural types ranging from 85% to 95% [56] and non-agricultural types ranging from 82% to 89% [57]. The CDL dataset is downloaded from https://nassgeodata.gmu.edu/CropScape/ (accessed 28 March 2022).

2.4. Data Preprocessing

Data preprocessing includes re-projection between datasets, screening of BRDF with no snow or ice coverage, obtaining the MODIS-BRDF parameters with a high quality and evaluation of MODIS-500 m pixels in detail by CDL. The projections of MODIS-MCD12, MCD43 and CDL are various [56,58,59,60], while re-projection processing is needed for the conversion between these datasets.
The scattering effect for snow in the forward direction is higher, which is different from the natural land surface. As snow could produce interference with the analysis of natural BRDF, it is necessary to remove the DOY (Day of Year) with snow from MODIS datasets, and it can be judged by the SDS of snow. In addition, the quality of MCD43A1 may interfere the correlation between pixels with the same and various types; thus, we selected the DOYs with “full BRDF inversions” based on a QA (Quality Assurance) layer to explore the potentiality of BRDF’s shape for land cover classification. The CDL (30 m) in 2019 was selected as the basic data to conduct a detailed analysis of the land cover within the MODIS-500 m pixel, which is helpful to understand the mixture of land cover.

3. Method

3.1. The Retrieval of BRDF Principal Planes

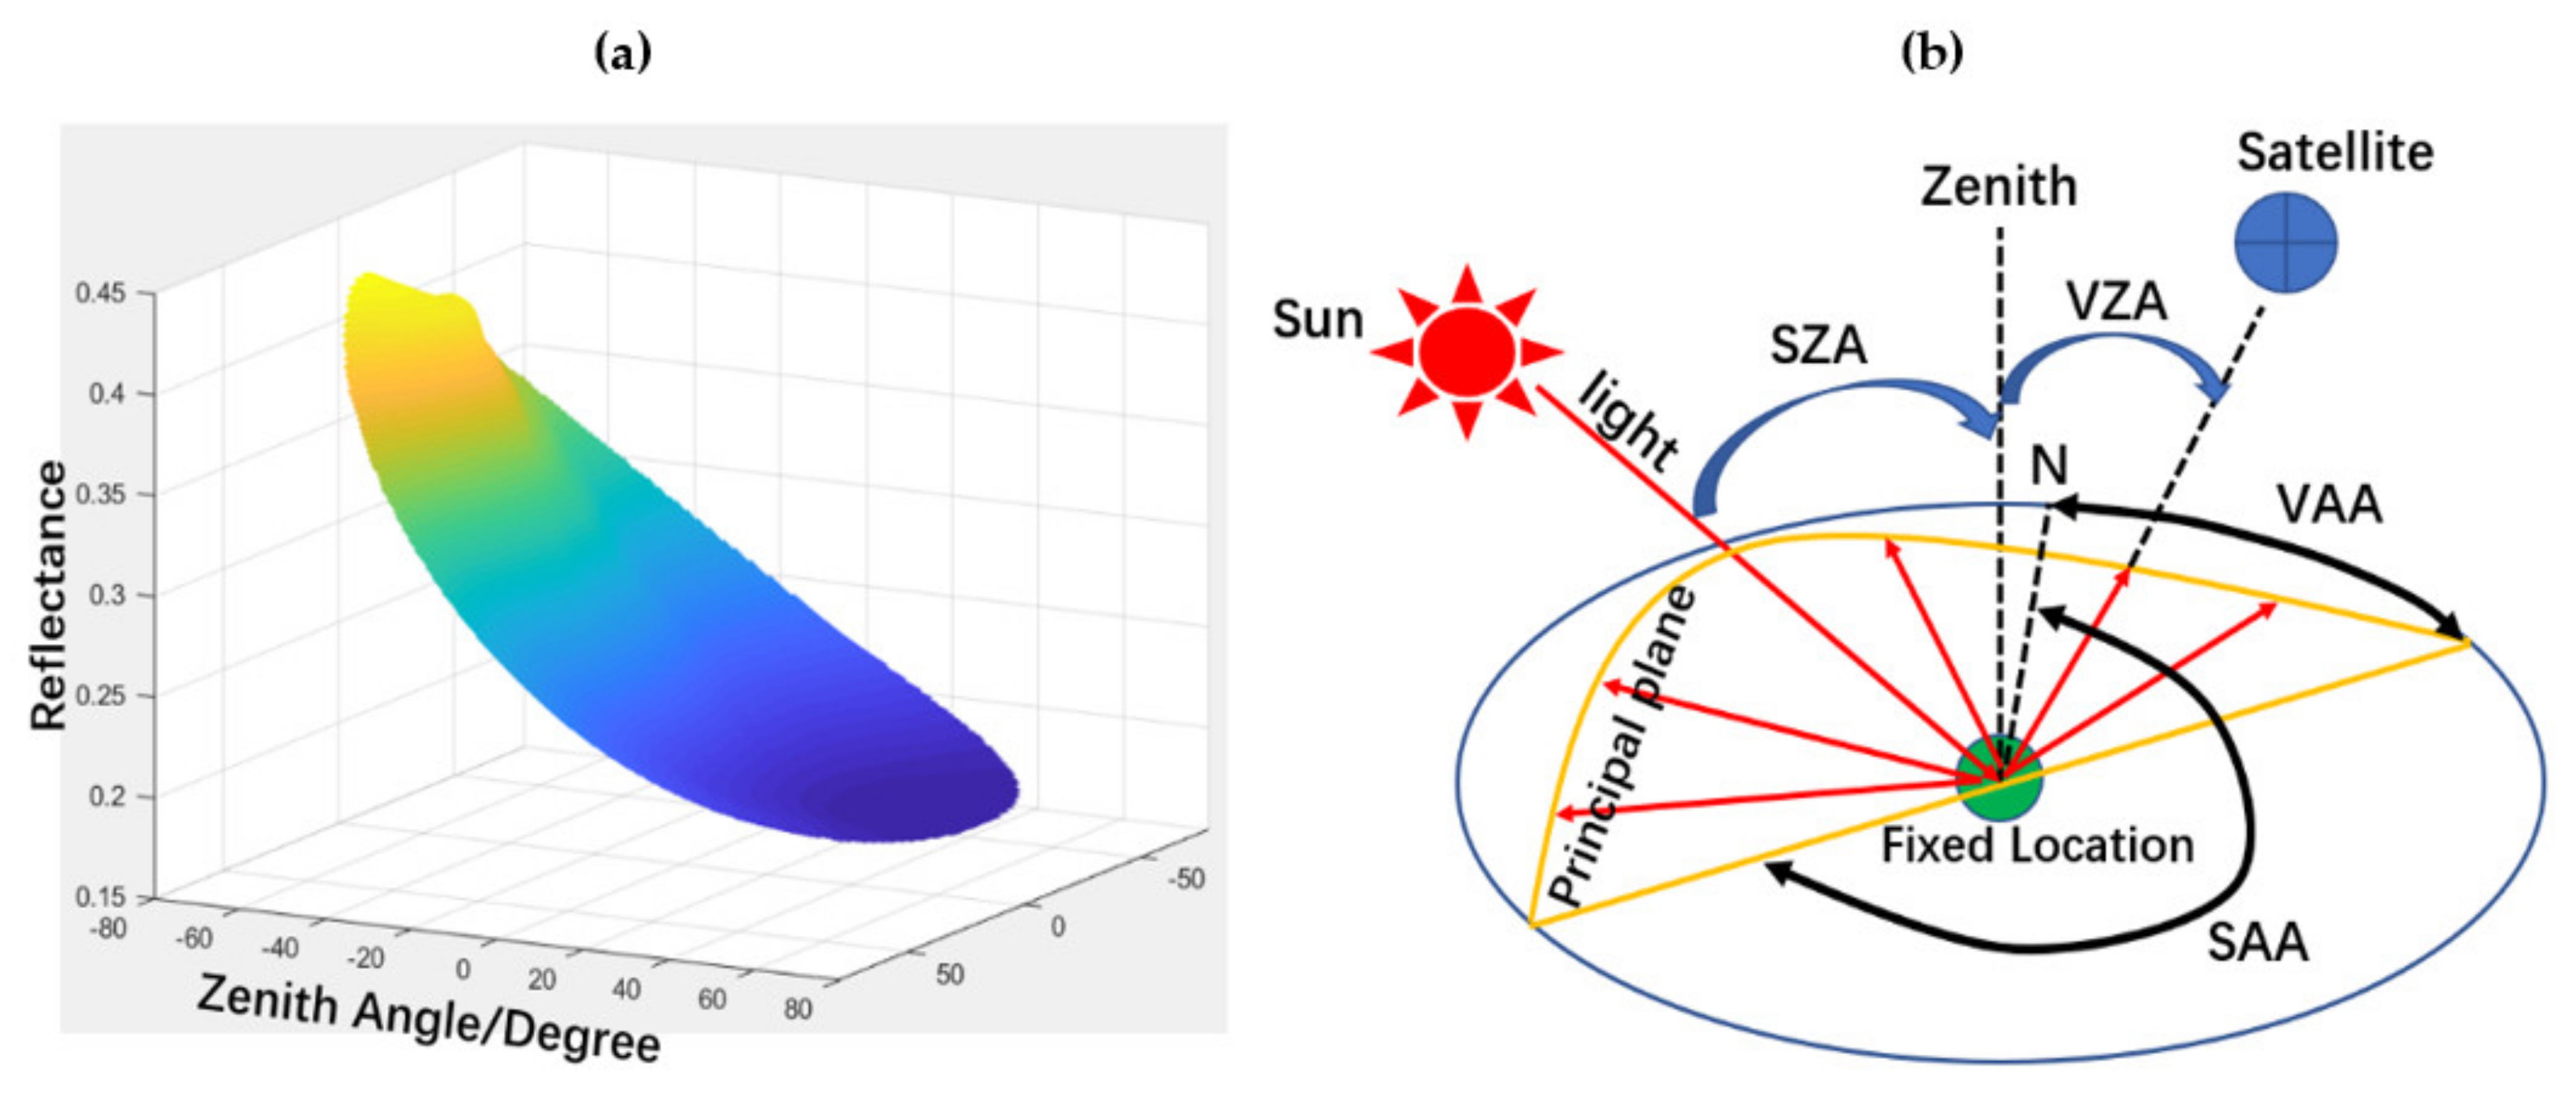
BRDF expresses the heterogeneity of surface directional reflection through incident-view geometry, which is of significance for correcting the angular effect of surface reflectance and improving the inversion accuracy of land surface parameters, such as albedo. For MODIS-BRDF, the AMBRALS is the operational algorithm based on the kernel driven and linear Rossthick-LisparseR model [37,61,62]. In general, the MODIS-BRDF model can be operated in two ways: forward and inverse modes. In the forward mode, the surface reflectance under a fixed incident-view geometry can be obtained by the BRDF model parameters. In the inverse mode, the BRDF model parameters can be fitted by the surface reflectance under various incident-view geometries. Thus, we selected the forward mode to obtain the surface reflectance for various directions based on the BRDF parameters. As BRDF is the continuous function in three-dimensional space, its unique feature and the spatial distribution brought challenges to the quantitative assessment (Figure 3a). The BRDF principal plane is determined by the incident light from the sun and outgoing light to the satellite that intersected at a fixed location (Figure 3b). The BRDF principal plane can not only reflect the angle effect brought by the incident-view geometry, but also implies typical anisotropy features, such as hot spots, dark spots and zenith spots. We utilized the research version of AMBRALS provided by Boston University to retrieve the BRDF principal plane from backward −70° to forward 70°. Backward is the side with the sun; forward is the side without the sun.
According to MODIS-BRDF parameters and incident-view geometry, the shape of BRDF’s principal plane under any SZA (Solar Zenith Angle) could be retrieved. With the SZA changing over time, characteristic directions of the BRDF principal plane will also produce continuous changes. Thus, the solar zenith angle is an interference for the comparison of various BRDF shapes. As the SZA is set to 45° for the MODIS BRDF indicators of ANIF and ANIX, we also unify the characteristic directions of BRDF principal planes under the SZA of 45°.

3.2. Classic BRDF Shape Indicators

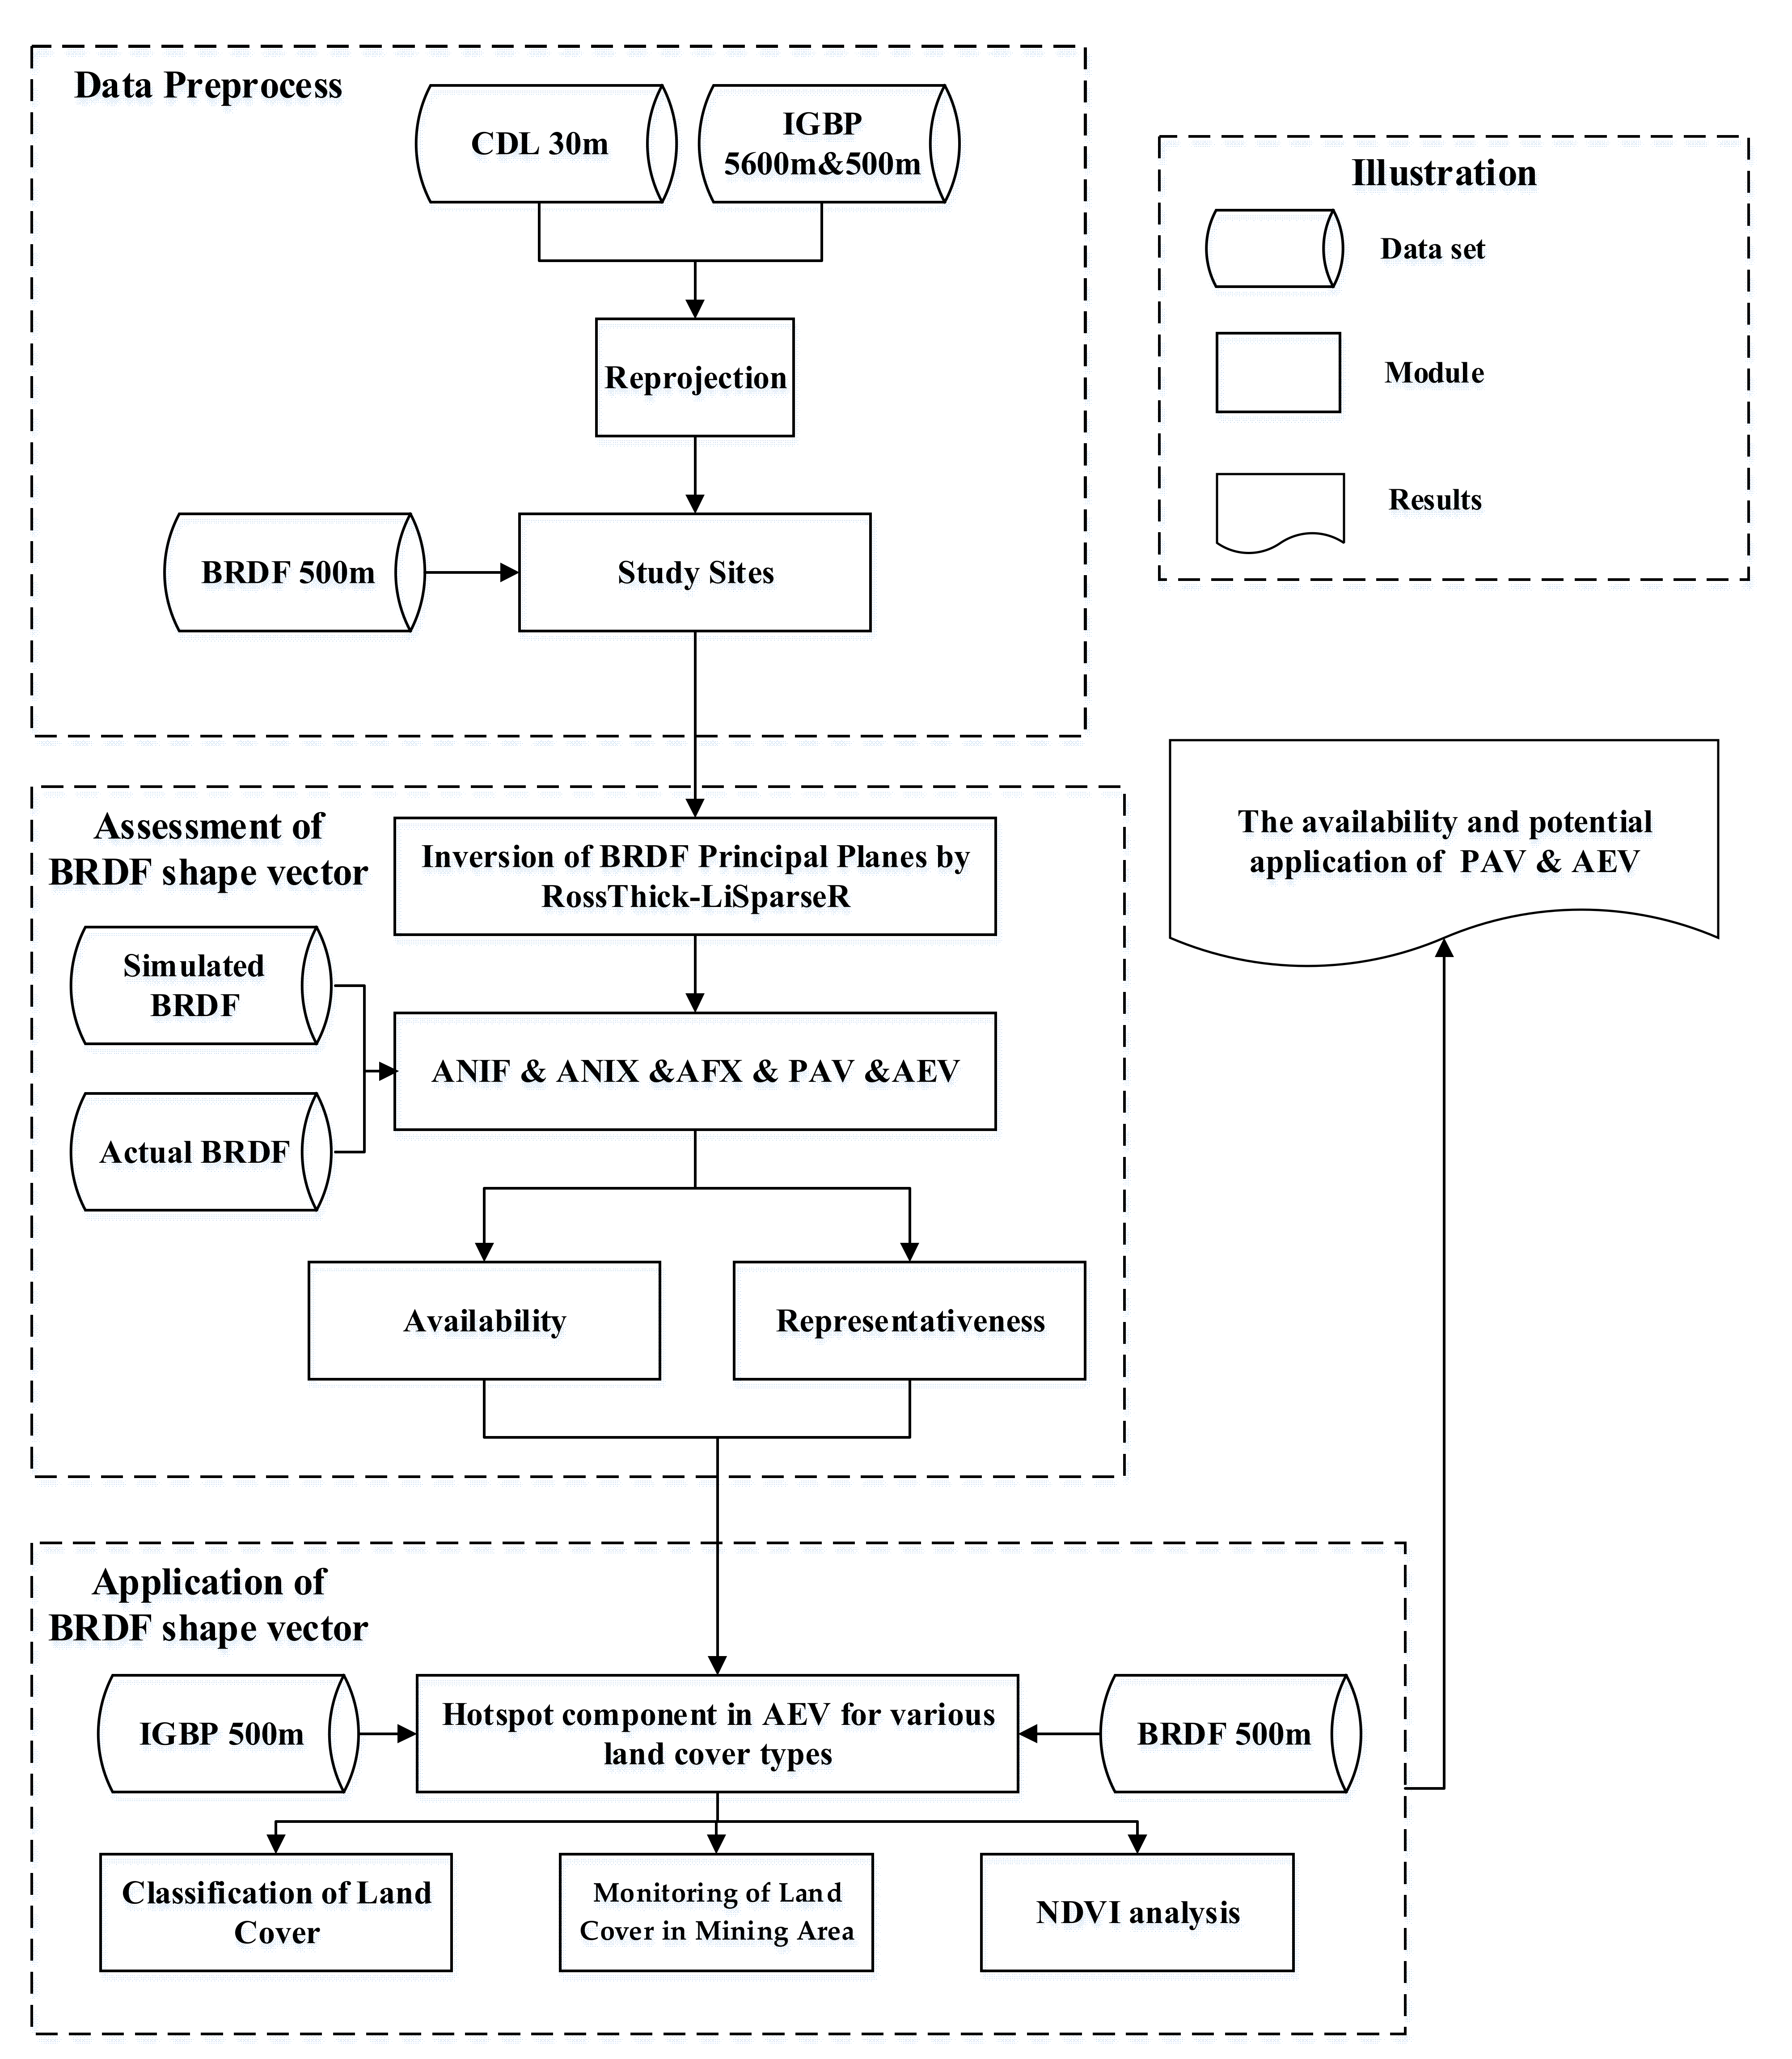
As BRDF is a complex three-dimensional surface, it is always a challenge to describe its features with some parameters. Thus, researchers have tried to describe the shape of BRDF by shape indicators based on the ratio of some typical directions for BRDF or the weight coefficient for different scattering effects. Some studies have shown that it is a potential and feasible way to describe the shape of BRDF and retrieve land parameters by shape indicators [16,50,51,52,53]. Among these classical BRDF shape indicators, some are constructed to extract parameters or identify categories of land cover; these factors do not have indications for the shape of BRDF, such as NDAX and SSI. The NDAX is the normalization of ANIX in the red and NIR band, while SSI is constructed by the volumetric parameter in the NIR band and the geometric parameter in the red band [50]. However, ANIF (Equation (1), λ is spectral band, R e f l e c t a n c e 0 ° is the reflectance of zenith, R e f l e c t a n c e 45 ° is the reflectance of forward 45°), ANIX (Equation (2), R e f l e c t a n c e 45 ° is the reflectance of backward −45°) and AFX (Equation (3), 0.189184 and 1.377622 are the integral value in two hemispheres for the RossThick and LiSparseR kernel) could directly describe the shape of BRDF. Thus, we utilized three classical shape indicators (ANIF, ANIX and AFX) to describe the shape of BRDF quantitatively compared with the shape vectors (PAV and AEV) proposed by this study. The workflow of this paper is shown in Figure 4.
A N I F = R e f l e c t a n c e 0 ° ( λ ) R e f l e c t a n c e 45 ° ( λ )
A N I X = R e f l e c t a n c e 45 ° ( λ ) R e f l e c t a n c e 45 ° ( λ )
A F X = 1 + f v o l ( λ ) f i s o ( λ ) × 0.189184 f g e o ( λ ) f i s o ( λ ) × 1.377622
The existing ANIF and ANIX are constructed based on the ratio of reflectance for a few typical scattering directions. While the BRDF principal plane is complex, it is too rough to describe its variation by relying on the reflectance of 45°, −45° and 0°, especially for the edge region ranges from ±45° to ±70°. AFX normalizes the volumetric and geometrical-optical effect by isotropic parameters and utilizes the weight between scattering effects to express the whole shape of BRDF. For the land cover with obvious gap effects, BRDF shows a typical bell shape (Figure 5a), and the geometric-optical effect is greater than the volumetric effect (AFX < 1). For the flat and dense vegetation, the volumetric effect is greater than geometric-optical effect (AFX > 1), and the BRDF shows a typical bowl shape (Figure 5b). The physical mechanism of AFX is clear, and the shape of BRDF is judged by the weight between the volumetric effect and geometric-optical effect. However, the description of BRDF’s shape by AFX is rough, and the AFX utilized the isotropic effect for normalization. When the volumetric effect and geometric-optical effect are the same while the isotropic effect is different for BRDFs, different AFX may limit the ability to capture BRDFs with the same shape but different magnitudes.

3.3. 6-Component Partial Anisotropic Vector

As the classical shape indicators depend on the ratio of reflectance for a few scattering directions or the weight of scattering effects, they could not describe the shape of BRDF comprehensively; thus, we proposed the PAV with 6 components based on the change rate of reflectance between multiple typical scattering directions to describe the shape of BRDF comprehensively. First, the BRDF principal plane is retrieved based on MODIS-BRDF parameters by the RossThick-LiSparseR model. Edge Spot (±70°), zenith spot (0°), hot spot (−45°) and approximate dark spot (45°) are selected as characteristic directions, and ±20° characteristic directions are encrypted between ±45° and the zenith (0°) to control the range of components (Figure 5a,b). Then, based on the change rate of reflectance between two adjacent typical directions, 6 components (F1 F2 F3 F4 F5 F6) are constructed to describe the variation of BRDF’s shape (Equations (4)–(9)). Lastly, a vector is formed by 6 components. Different from the indicator based on the ratio of reflectance, the change rate of reflectance can directly reflect the shape between two adjacent scattering directions and make the mathematical mechanism clearer. The change of BRDF’s shape is directly reflected in the value of some components in PAV. If the component is greater or less than 0, it means that the BRDF’s shape shows an upward or downward trend; meanwhile, the absolute value of the component represents the degree of the trend.
F 1 = ( R e f l e c t a n c e 45 ° R e f l e c t a n c e 70 ° ) / ( 70 45 )
F 2 = ( R e f l e c t a n c e 20 ° R e f l e c t a n c e 45 ° ) / ( 45 20 )
F 3 = ( R e f l e c t a n c e 0 ° R e f l e c t a n c e 20 ° ) / ( 20 0 )
F 4 = ( R e f l e c t a n c e 20 ° R e f l e c t a n c e 0 ° ) / ( 20 0 )
F 5 = ( R e f l e c t a n c e 45 ° R e f l e c t a n c e 20 ° ) / ( 45 20 )
F 6 = ( R e f l e c t a n c e 70 ° R e f l e c t a n c e 45 ° ) / ( 70 45 )

3.4. Three-Component Angular Effect Vector

According to previous studies, the effect of characteristic spots in the BRDF principal plane, such as hot spots, are of great significance for describing BRDFs’ shapes and the retrieval of the spatial structure [63,64]. Thus, we constructed AEV with 3 components for hot spot, zenith spot and approximate dark spot (Figure 5a,b). The method to construct three components (D1, D2, D3) is the angle formulation combined with every two adjacent components in PAV (Equations (10)–(12)). The PAV and AEV proposed in this paper could describe the variation of BRDF’s shape by the form of vector comprehensively.
H o t   S p o t = D 1 = f ( F 1 , F 2 ) = a r c t a n ( F 2 F 1 1 + F 2 F 1 )
Z e n i t h   S p o t = D 2 = f ( F 3 , F 4 ) = a r c t a n ( F 4 F 3 1 + F 4 F 3 )
A p p r o x i m a t e   D a r k   S p o t = D 3 = f ( F 5 , F 6 ) = a r c t a n ( F 6 F 5 1 + F 6 F 5 )

3.5. Cosine Similarity

Cosine similarity measures the similarity between two vectors by the cosine value of the angle between them. This method is especially suitable for vectors with high dimensions, and its value can determine whether the two vectors point in the same direction. If two vectors have the same direction completely, the cosine similarity value is 1. The closer the cosine similarity is to 1, the more similar these vectors are. This study used cosine similarity as a measurement for the representativeness of PAV. Since the PAV expresses the original shape of BRDF through the change rate of reflectance between two adjacent characteristic directions, it is necessary to evaluate the representativeness of the PAV for the original shape of the BRDF quantitatively. First, we sampled the original BRDF principal plane from −70° to +70° by the interval of 1° (Equations (13) and (14), ΔT is 1°, i = −70° to +69°). A vector with 140 components is generated as the expression of the original shape of BRDF. Then, we extended PAV with 6 components to a vector with 140 components from −70° to +70°, while the change rate of reflectance for each 1° between two adjacent typical directions is defined as the corresponding component of PAV (Equation (15)). Finally, the Cosine Similarity between the two vectors with 140 components is used to evaluate the representativeness of the PAV for the original BRDF’s shape (Equation (16)).
S i = R e f l e c t a n c e ( i + Δ t ) R e f l e c t a n c e ( i ) Δ t
B R D F 1 = ( S 1 , S 2 , S 3 , , S 140 )
B R D F 2 = ( T 1 , T 2 , T 3 , , T 140 )
R P A V = B R D F 1 · B R D F 2 | B R D F 1 | | B R D F 2 | = S 1 T 1 + S 2 T 2 + + S 140 T 140 S 1 2 + S 2 2 + + S 140 2 T 1 2 + T 2 2 + + T 140 2

3.6. Error Transfer Function

In the research process, the acquisition of the target variable is dependent on the mathematical relationship of the other related variables. For example, the vegetation index depends on the spectral reflectance and the composition function. In the process of deriving the target variable through the mathematical functional relationship, the error in the related variables will be transferred to the target value through the error equation. Therefore, we can use the error in the components of PAV and the error transfer equation to determine the error of AEV. The AEV is derived from the components of PAV (Equations (10)–(12)). As actual change rate of reflectance for each angle at the interval of 1° within the range of one component for PAV (Equation (13)) is different from the average rate, the mean square error for each component in PAV can be calculated (Equation (17), σ is the mean square error, F j is the component of PAV, and N is the number of intervals at 1° within the range of corresponding component). As the components F j and F i are independent, for there is no intersection of their coverage, the error of mean square for components in PAV can be transferred to the AEV through angle formulation (Equations (18)–(20)).
σ j = i = 1 N ( S j i F j ) 2 N 1
D = f ( F i , F j ) = a r c t a n ( F j F i 1 + F j F i ) = a r c t a n ( v u )
v = F j F i
u = 1 + F j F i
Error transfer function is the linearization of angle formulation (Equations (21)–(24), σ D is the mean square error of the angle effect indicator, σ F i and σ F j are the mean square error of the two components in PAV). The average error of the component in AEV is calculated based on the mean square error (Equation (25)), and the representativeness of each component in AEV could be obtained by Equation (26).
d D = f ( F i , F j ) F i d F i + f ( F i , F j ) F j d F j
σ D 2 = ( f ( F i , F j ) F i ) 2 σ F i 2 + ( f ( F i , F j ) F j ) 2 σ F j 2
f ( F i , F j ) F i = 1 F j 2 ( 1 + F j F i ) 2 + ( F j F i ) 2
f ( F i , F j ) F j = 1 + F i 2 ( 1 + F j F i ) 2 + ( F j F i ) 2
θ = 2 π σ D
R A E V = 1 θ / a r c t a n ( F j F i 1 + F j F i )

3.7. Coefficient of Variation

Mining areas are a kind of land surface that have been mined; thus, we investigated the potentiality of BRDF shape vectors for monitoring the land cover before and after land reclamation. The Fuxin mining area is located in Liaoning Province, China; there are 20 subsidence basins, 2 open pits, and more than 240 gangue hills in Fuxin. In 2005, after the closure of the Haizhou open-pit mine in Fuxin, the Haizhou National Mine Park (121.678° E, 41.998° N) was established on a huge pit with a length of 4 km and a width of 2 km. We selected the MODIS-500 m pixel located in the Haizhou National Mine Park with Sample No. 102 and Line No. 1920 in H27V04, then investigated the potentiality of the BRDF shape vector (taking hot spot components in AEV as an example) for land cover monitoring in mining areas based on the MODIS-MCD43A1 dataset in the NIR band before and after land reclamation. The coefficient of variation (CV) is the ratio of the standard deviation (SD) to the average of hot spot components, which was used to reflect the discreteness of hot spot components in AEV before and after land reclamation.

4. Results and Analysis

4.1. Effectiveness of Shape Vectors

Taking the Savannas site as an example, the DOY006 (Day of year) with the minimum volumetric effect and the DOY255 with the minimum geometric-optical effect in the NIR band were selected as the original BRDF parameters for two typical BRDF shapes. BRDF parameters of these DOYs are shown in the item ‘Data Mode-1′ in Table 1. Then, we set the isotropic parameters of the two typical BRDF shapes to the minimum (0.197) and maximum (0.368) in 2019, maintaining the volumetric parameters and geometric-optical parameters to simulate the BRDFs with the same shape but different magnitudes, as shown in the item ‘Data Mode-2 & 3′ in Table 1. Finally, we increased the parameters of dominant effect for the two typical BRDF shapes from the minimum to the maximum in 2019, which simulates the changing process of the typical BRDF shapes, as shown in the item ‘Data Mode-4 & 5′ in Table 1. For the shape of the bell, the geometric-optical parameter increases from 0.050 to 0.110; for the shape of the bowl, the volumetric parameter increases from 0.157 to 0.265. To explore the effectiveness of shape vectors, the BRDF parameters and their variations for two typical BRDF shapes shown in Table 1 are used to retrieve BRDF principal planes by the RossThick-LiSparseR model.
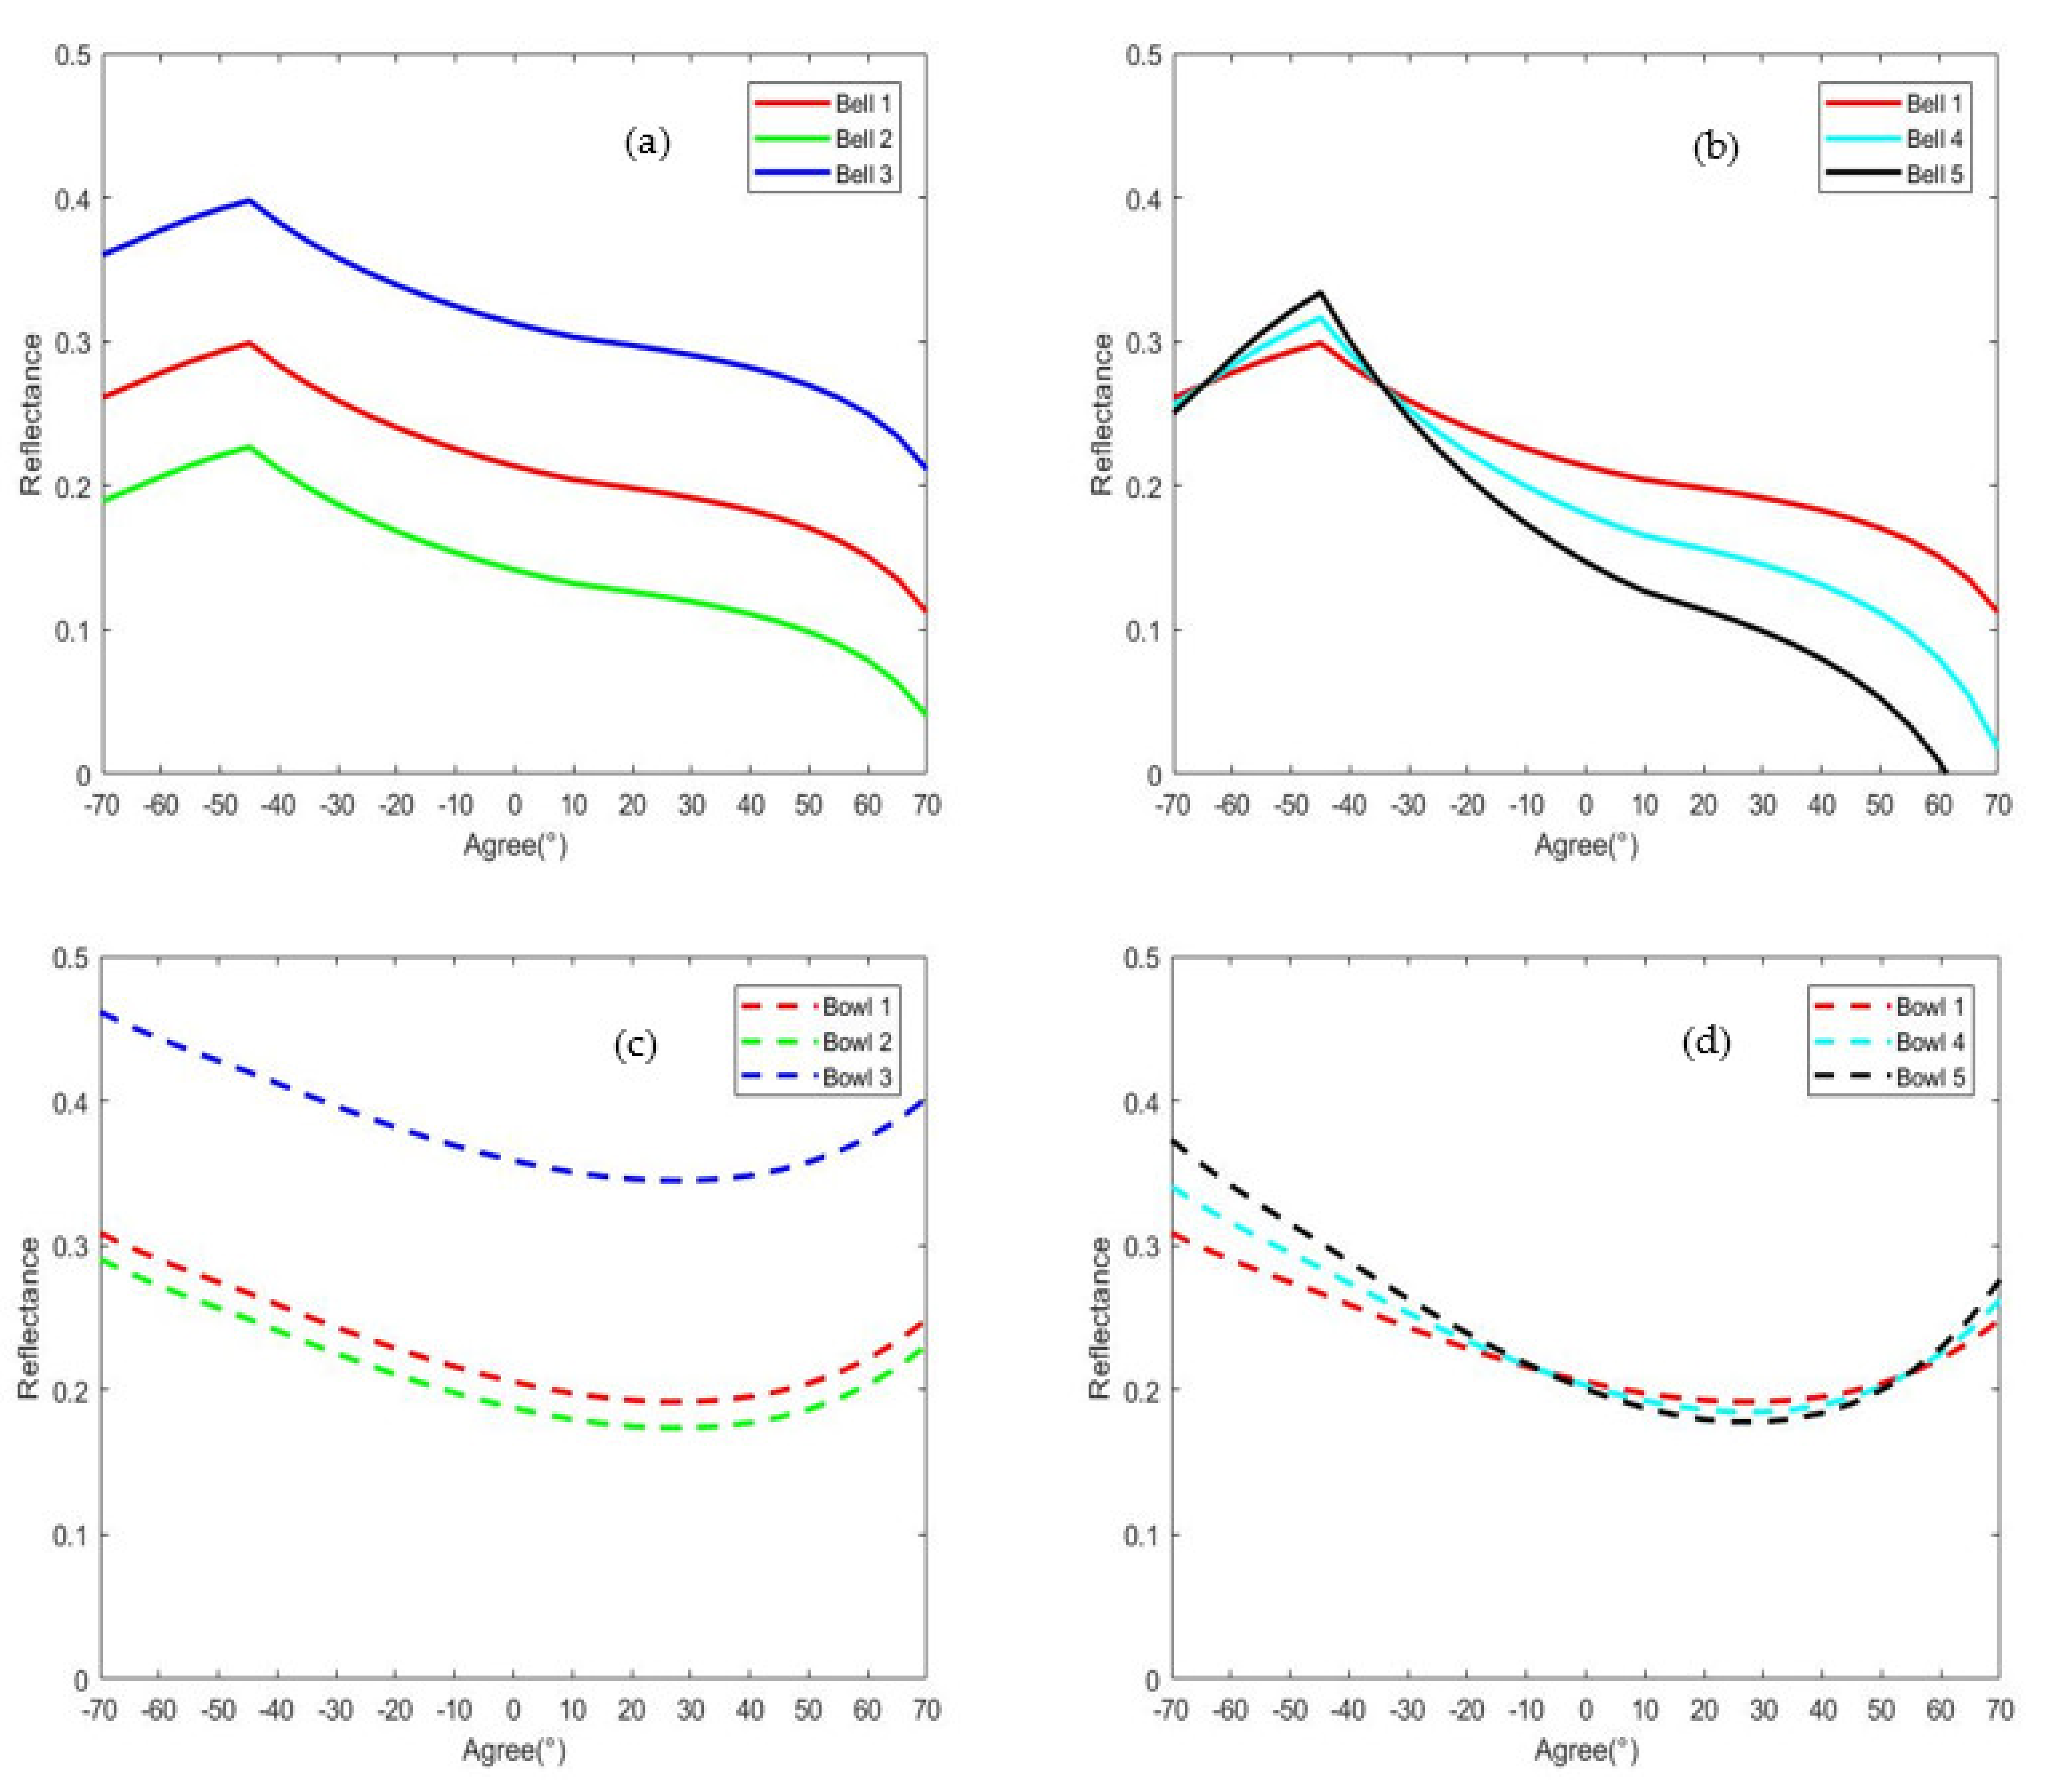
The two typical BRDF shapes show the same shape with different magnitudes, and their magnitudes increase with the increase of isotropic parameters (Figure 6a,c). This indicates that the isotropic parameters of BRDF have no effect on the variation of shape but do for the magnitude, while the specific shape of BRDF depends on the volumetric and the geometric-optical parameters. The typical shape of the bell gradually changed with the increase of geometric-optical parameters (Figure 6b). From bell 1, bell 4 to bell 5, the angle effect of the hot spot (−45°) gradually sharpens; meanwhile, the variation in the forward (+45° to +70°) and backward (−45° to −70°) edge regions descends more steeply. From bowl 1, bowl 4 to bowl 5, the variation in the forward (+45° to +70°) and backward (−45° to −70°) edge regions gradually rises more steeply with the increasing of the volumetric parameters (Figure 6d). Thus, the shapes of BRDF change significantly with the variation of geometric-optical or volumetric parameters.
The shapes of three bell BRDFs (bells 1, 2, 3) or three bowl BRDFs (bowls 1, 2, 3) are the same (Table 2, Figure 6a,c), while their magnitudes are various. Meanwhile, three classical shape indicators AFX (0.745, 0.652, 0.814), ANIF (1.204, 1.343, 1.131) and ANIX (1.685, 2.153, 1.440) for bells 1, 2 and 3 in Figure 6a are various. Three classical shape indicators AFX (1.125, 1.137, 1.073), ANIF (1.033, 1.036, 1.019) and ANIX (1.343, 1.377, 1.194) for bowls 1, 2 and 3 in Figure 6c are also various. The values of components in PAV (F1, F2, F3, F4, F5, F6) and AEV (D1, D2, D3) are consistent with Figure 6a,c. This indicates that the classical shape indicators (ANIF, ANIX and AFX) are detective when evaluating the BRDFs with the same shape but various magnitudes. The mathematical mechanism of PAV and AEV based on the change rate of reflectance between multiple typical scattering directions is clearer, which is suitable for evaluating the BRDFs with the same shape but various magnitudes.
With the increase of geometric-optical parameters (Table 2 and Figure 6b), the principal planes with bell shape changed significantly near the hot spot (−45°), zenith spot (0°) and approximate dark spot (45°). Taking the trend of the hot spot as an example, we investigated the effectiveness of shape indicators and vectors for the description of bell shapes. From bell 1, bell 4 to bell 5, the variation near the hot spot (−45°) becomes more significant. Through the ANIF and ANIX, we could only judge the ratio of reflectance among the hot spot (−45°), zenith spot (0°) and approximate dark spot (+45°). The AFX can only roughly describe the weight of the scattering effects, thus they (ANIF, ANIX and AFX) are unable to evaluate the variation near the hot spot quantitatively. From bell 1, bell 4 to bell 5, the F1 and F2 in PAV are (0.151, 0.243, 0.335) and (−0.234, −0.374, −0.514), respectively. These values effectively describe the magnitudes and directions of the variations for BRDF shapes near the hot spot, which are consistent with the situation shown in Figure 6b. From bell 1, bell 4 to bell 5, the angle effect of hot spot shows a trend of sharpening. The hot spot component (D1) in AEV is 158.214°, 145.833° and 134.295°, respectively, which are consistent with the trend of hot spots shown in Figure 6b.
With the increase of volumetric parameters (Table 2 and Figure 6d), the principal planes with the bowl shape changed significantly in the forward and backward edge region (−45° to −70° and +45° to +70°). Taking the trend of variation near the approximate dark spot as an example, we investigated the effectiveness of shape indicators and vectors for the description of bowl shapes. From bowl 1, bowl 4, to bowl 5, the ANIF, ANIX and AFX could not evaluate the variations near the approximate dark spot quantitatively. From bowl 1, bowl 4 to bowl 5, the F5 and F6 in PAV are (0.025, 0.034, 0.044) and (0.198, 0.270, 0.342) respectively, while the approximate dark spot in AEV is 170.202°, 166.856° and 163.647° respectively. These data are consistent with the trend near the approximate dark spot shown in Figure 6d.
Above all, the PAV and AEV based on the change rate of reflectance between typical scattering directions proposed in this paper could effectively describe and track the change of the BRDF’s shape compared with the classical shape indicators. PAV and AEV describe the shape of BRDF using the form of vector comprehensively, and their components can describe the reginal variation of BRDF accurately and quantitatively.

4.2. Representativeness of Shape Vectors

4.2.1. Representativeness of PAV

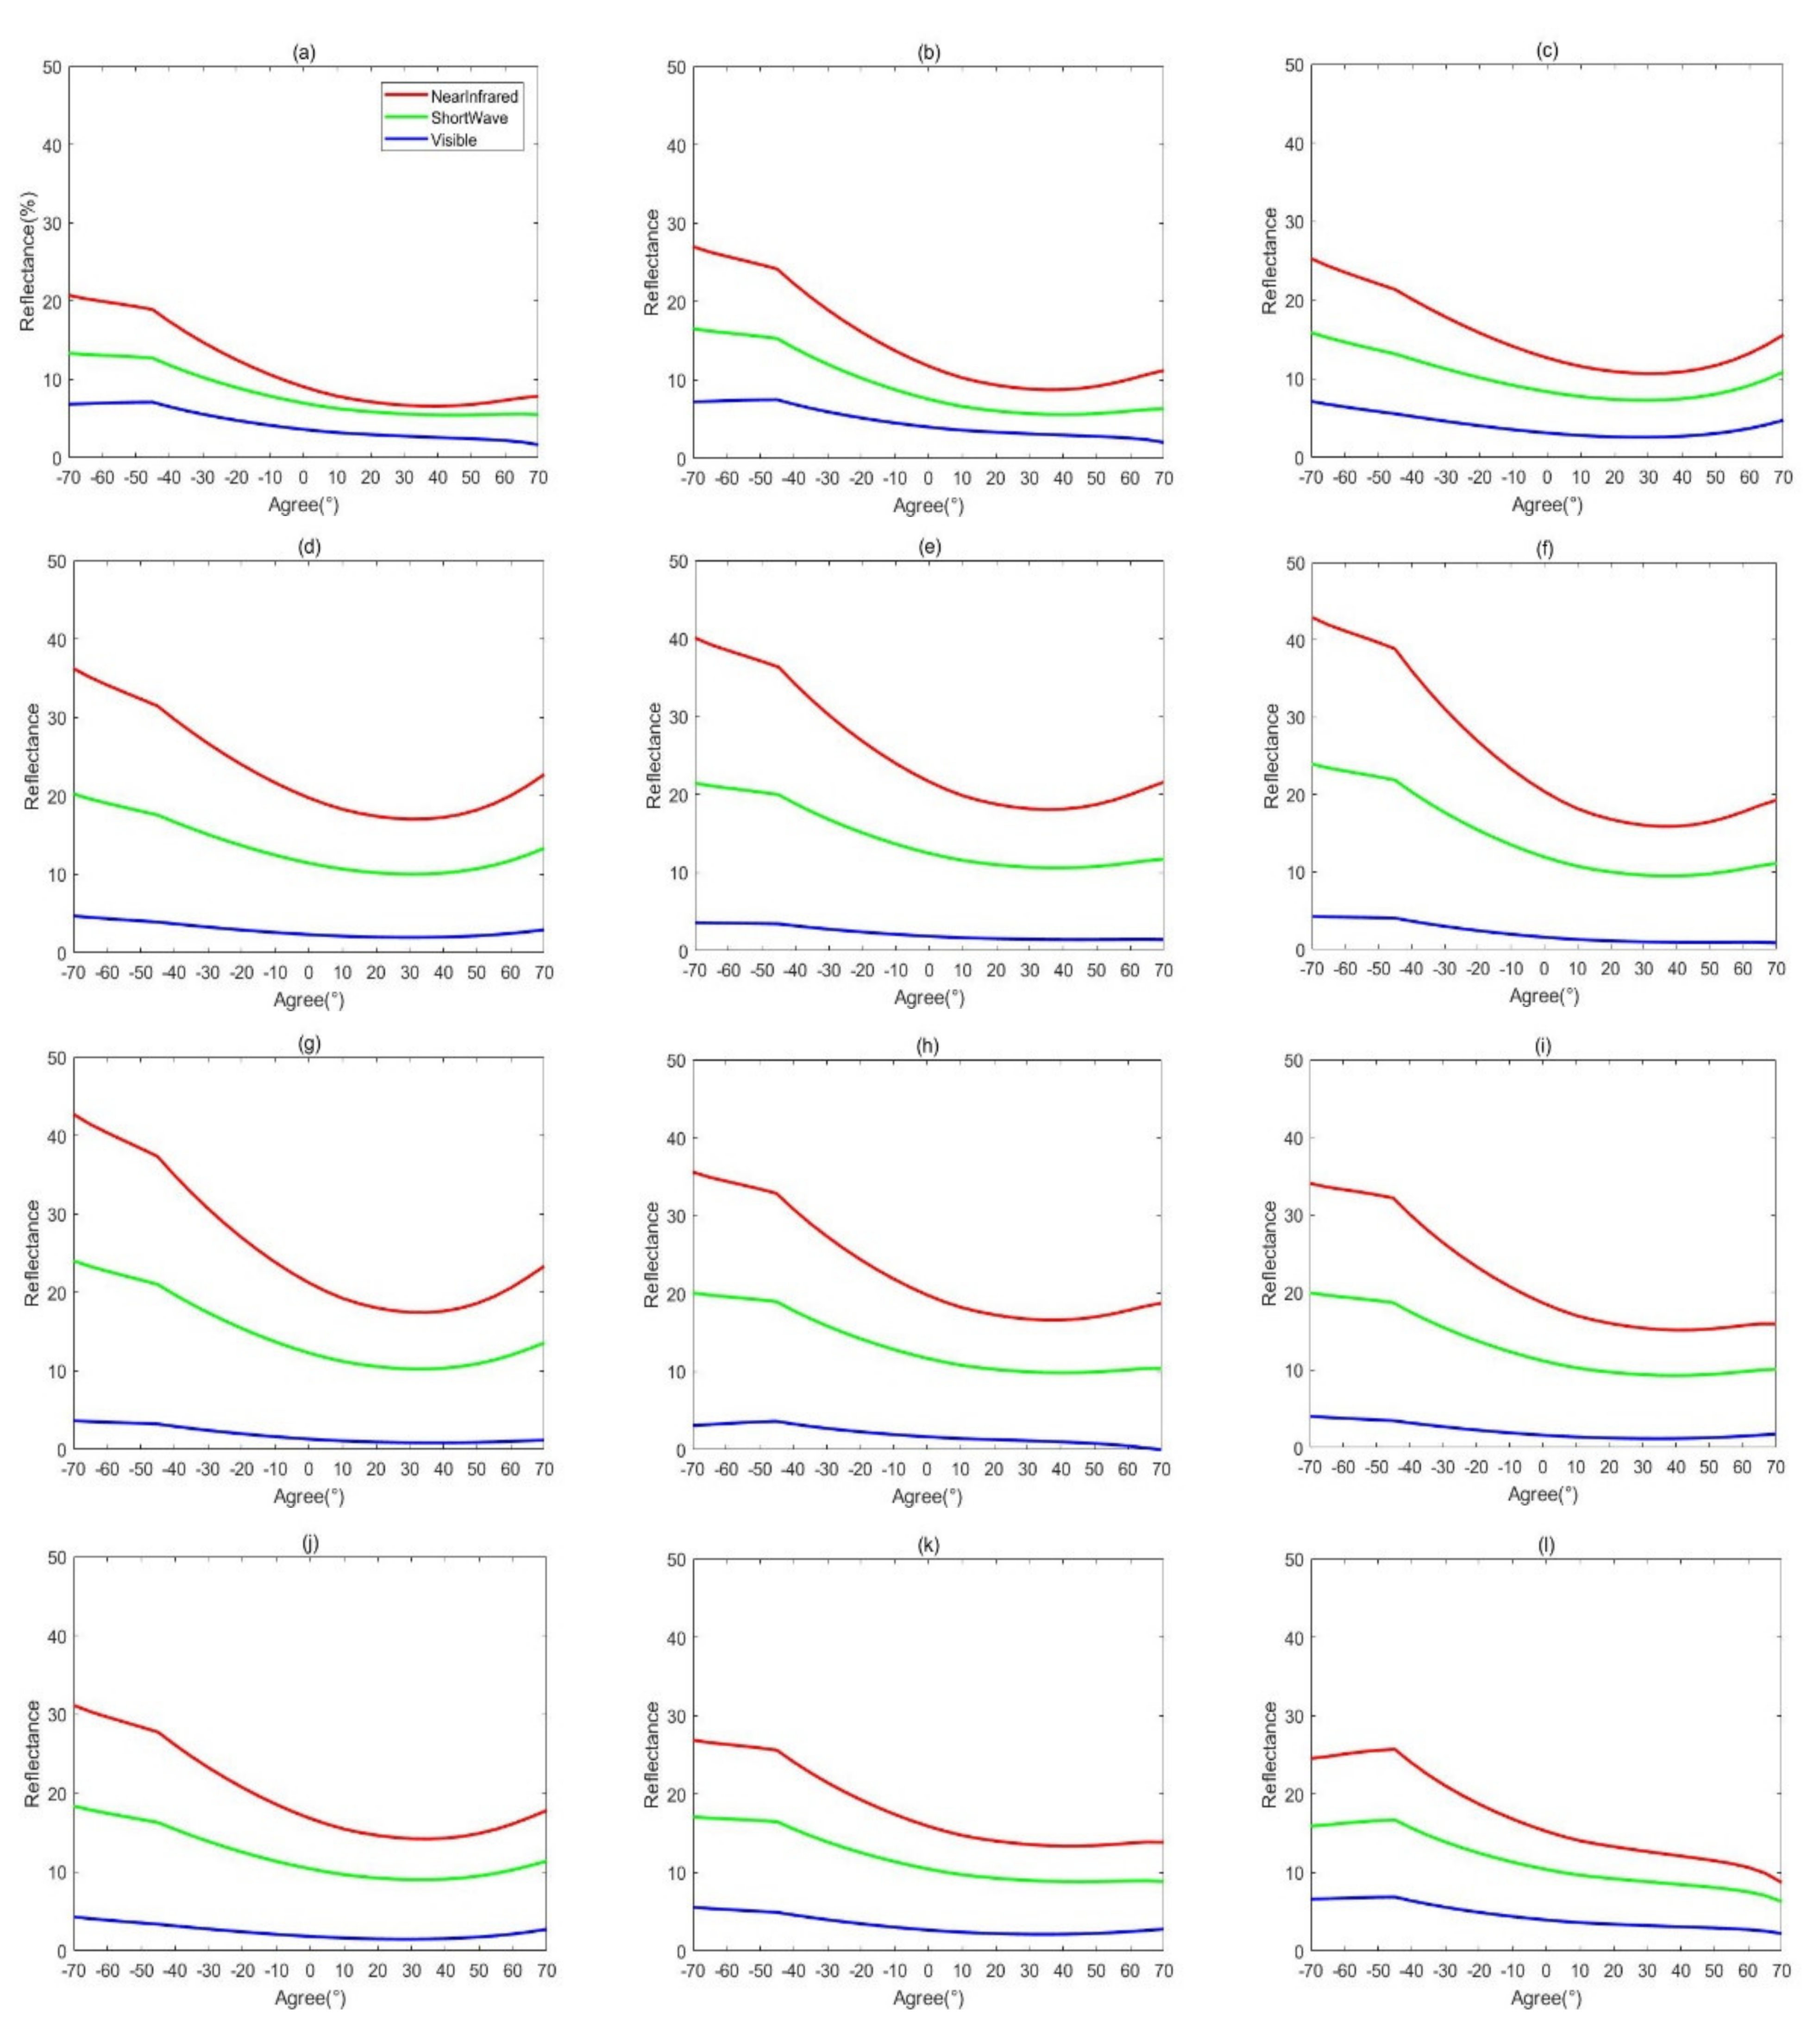
The BRDF principal planes in three broad bands (NIR, SW and VIS) show that the BRDF’s shape gradually changed from January to December (Figure 7). We evaluated the representativeness of PAV and AEV based on the BRDF shapes at monthly steps in three broad bands at each selected site.
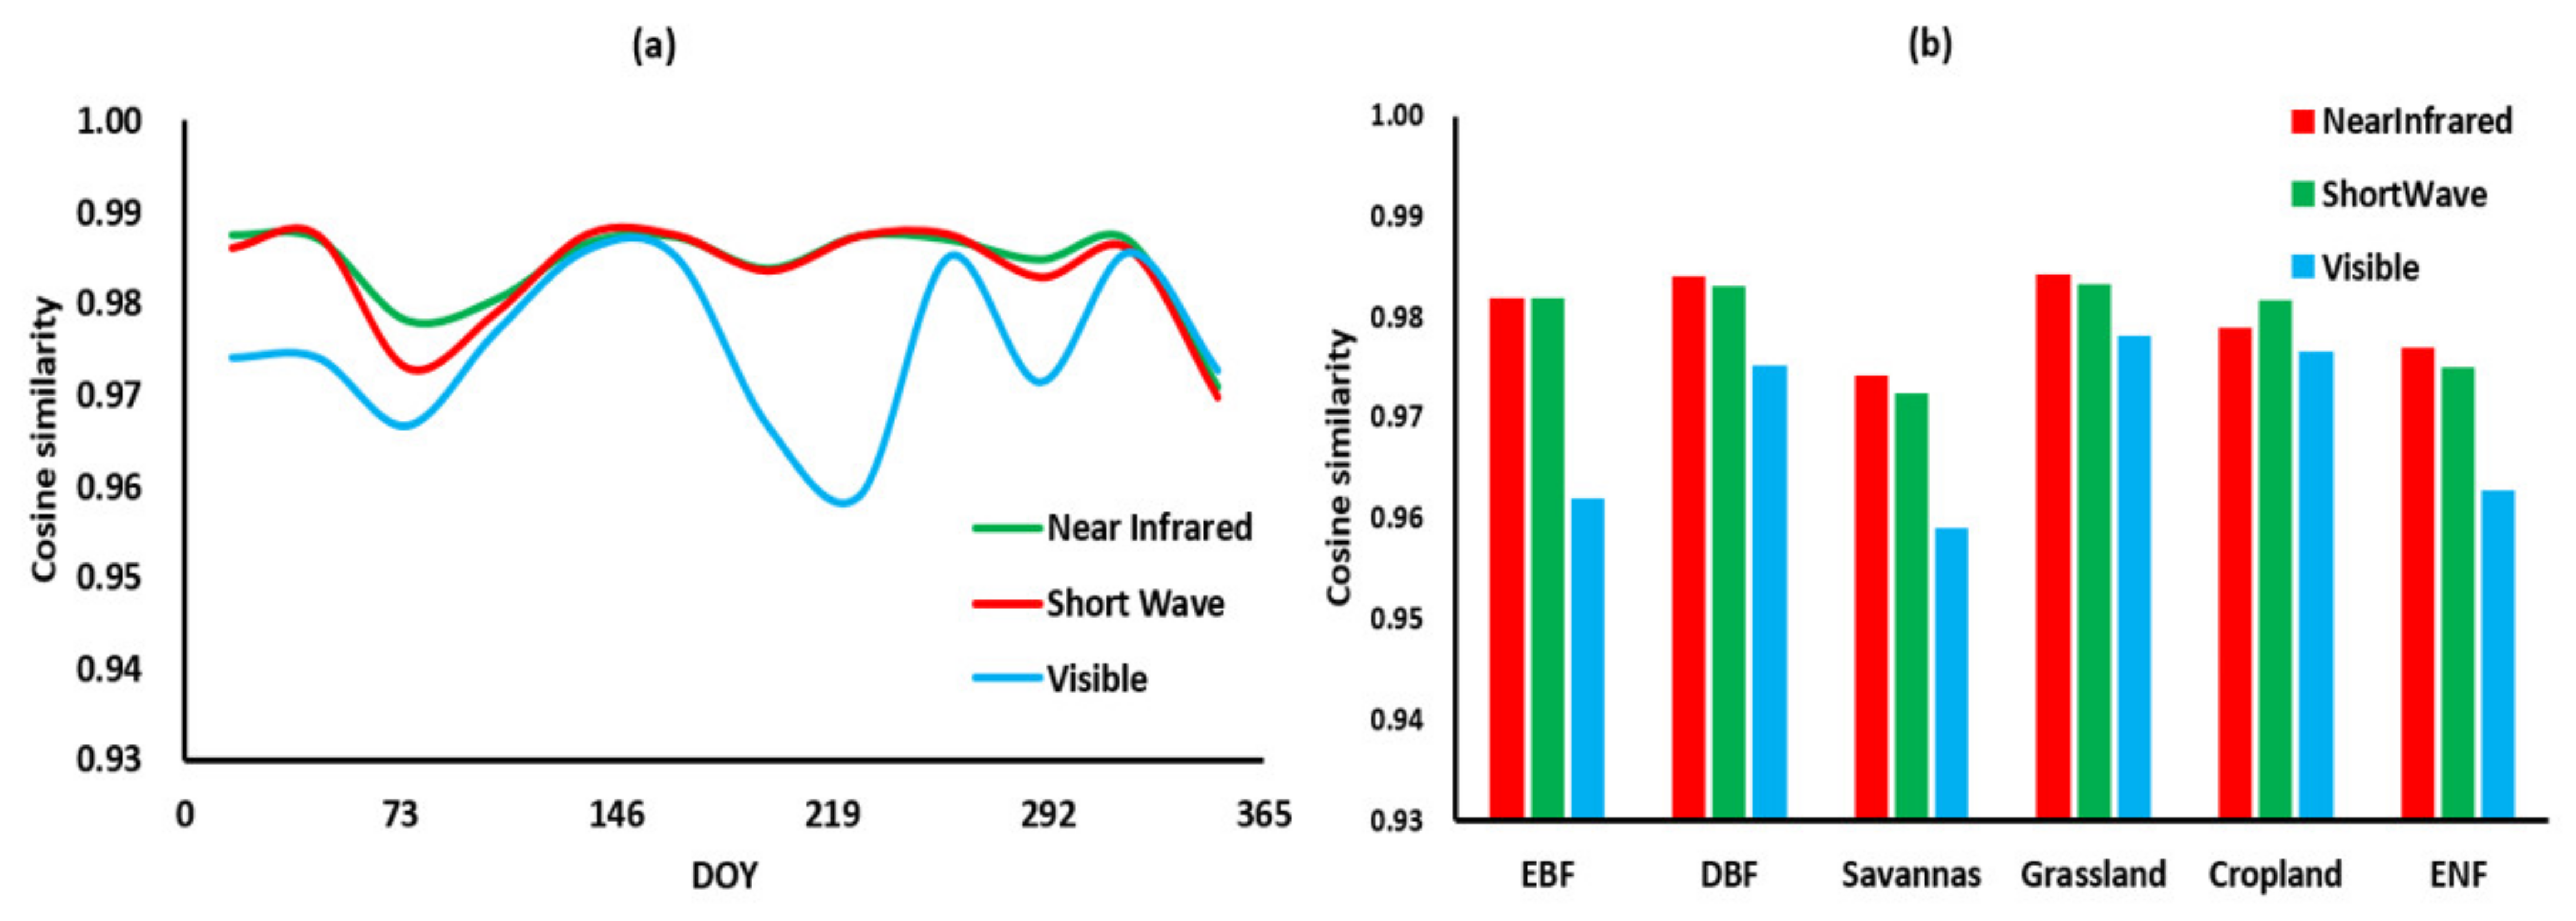
The representativeness of PAV (Equation (16)) in three broad bands (NIR, SW and VIS) is 0.984, 0.983 and 0.975, on average, for the DBF site (Figure 8a). Figure 8b shows the statistics of the representativeness for six selected sites, while the average representativeness of PAV in the NIR, SW and VIS band is 0.980, 0.979 and 0.969, respectively. Thus, the six-component PAV has high representativeness for original BRDF in the NIR, SW and VIS band.

4.2.2. Representativeness of AEV

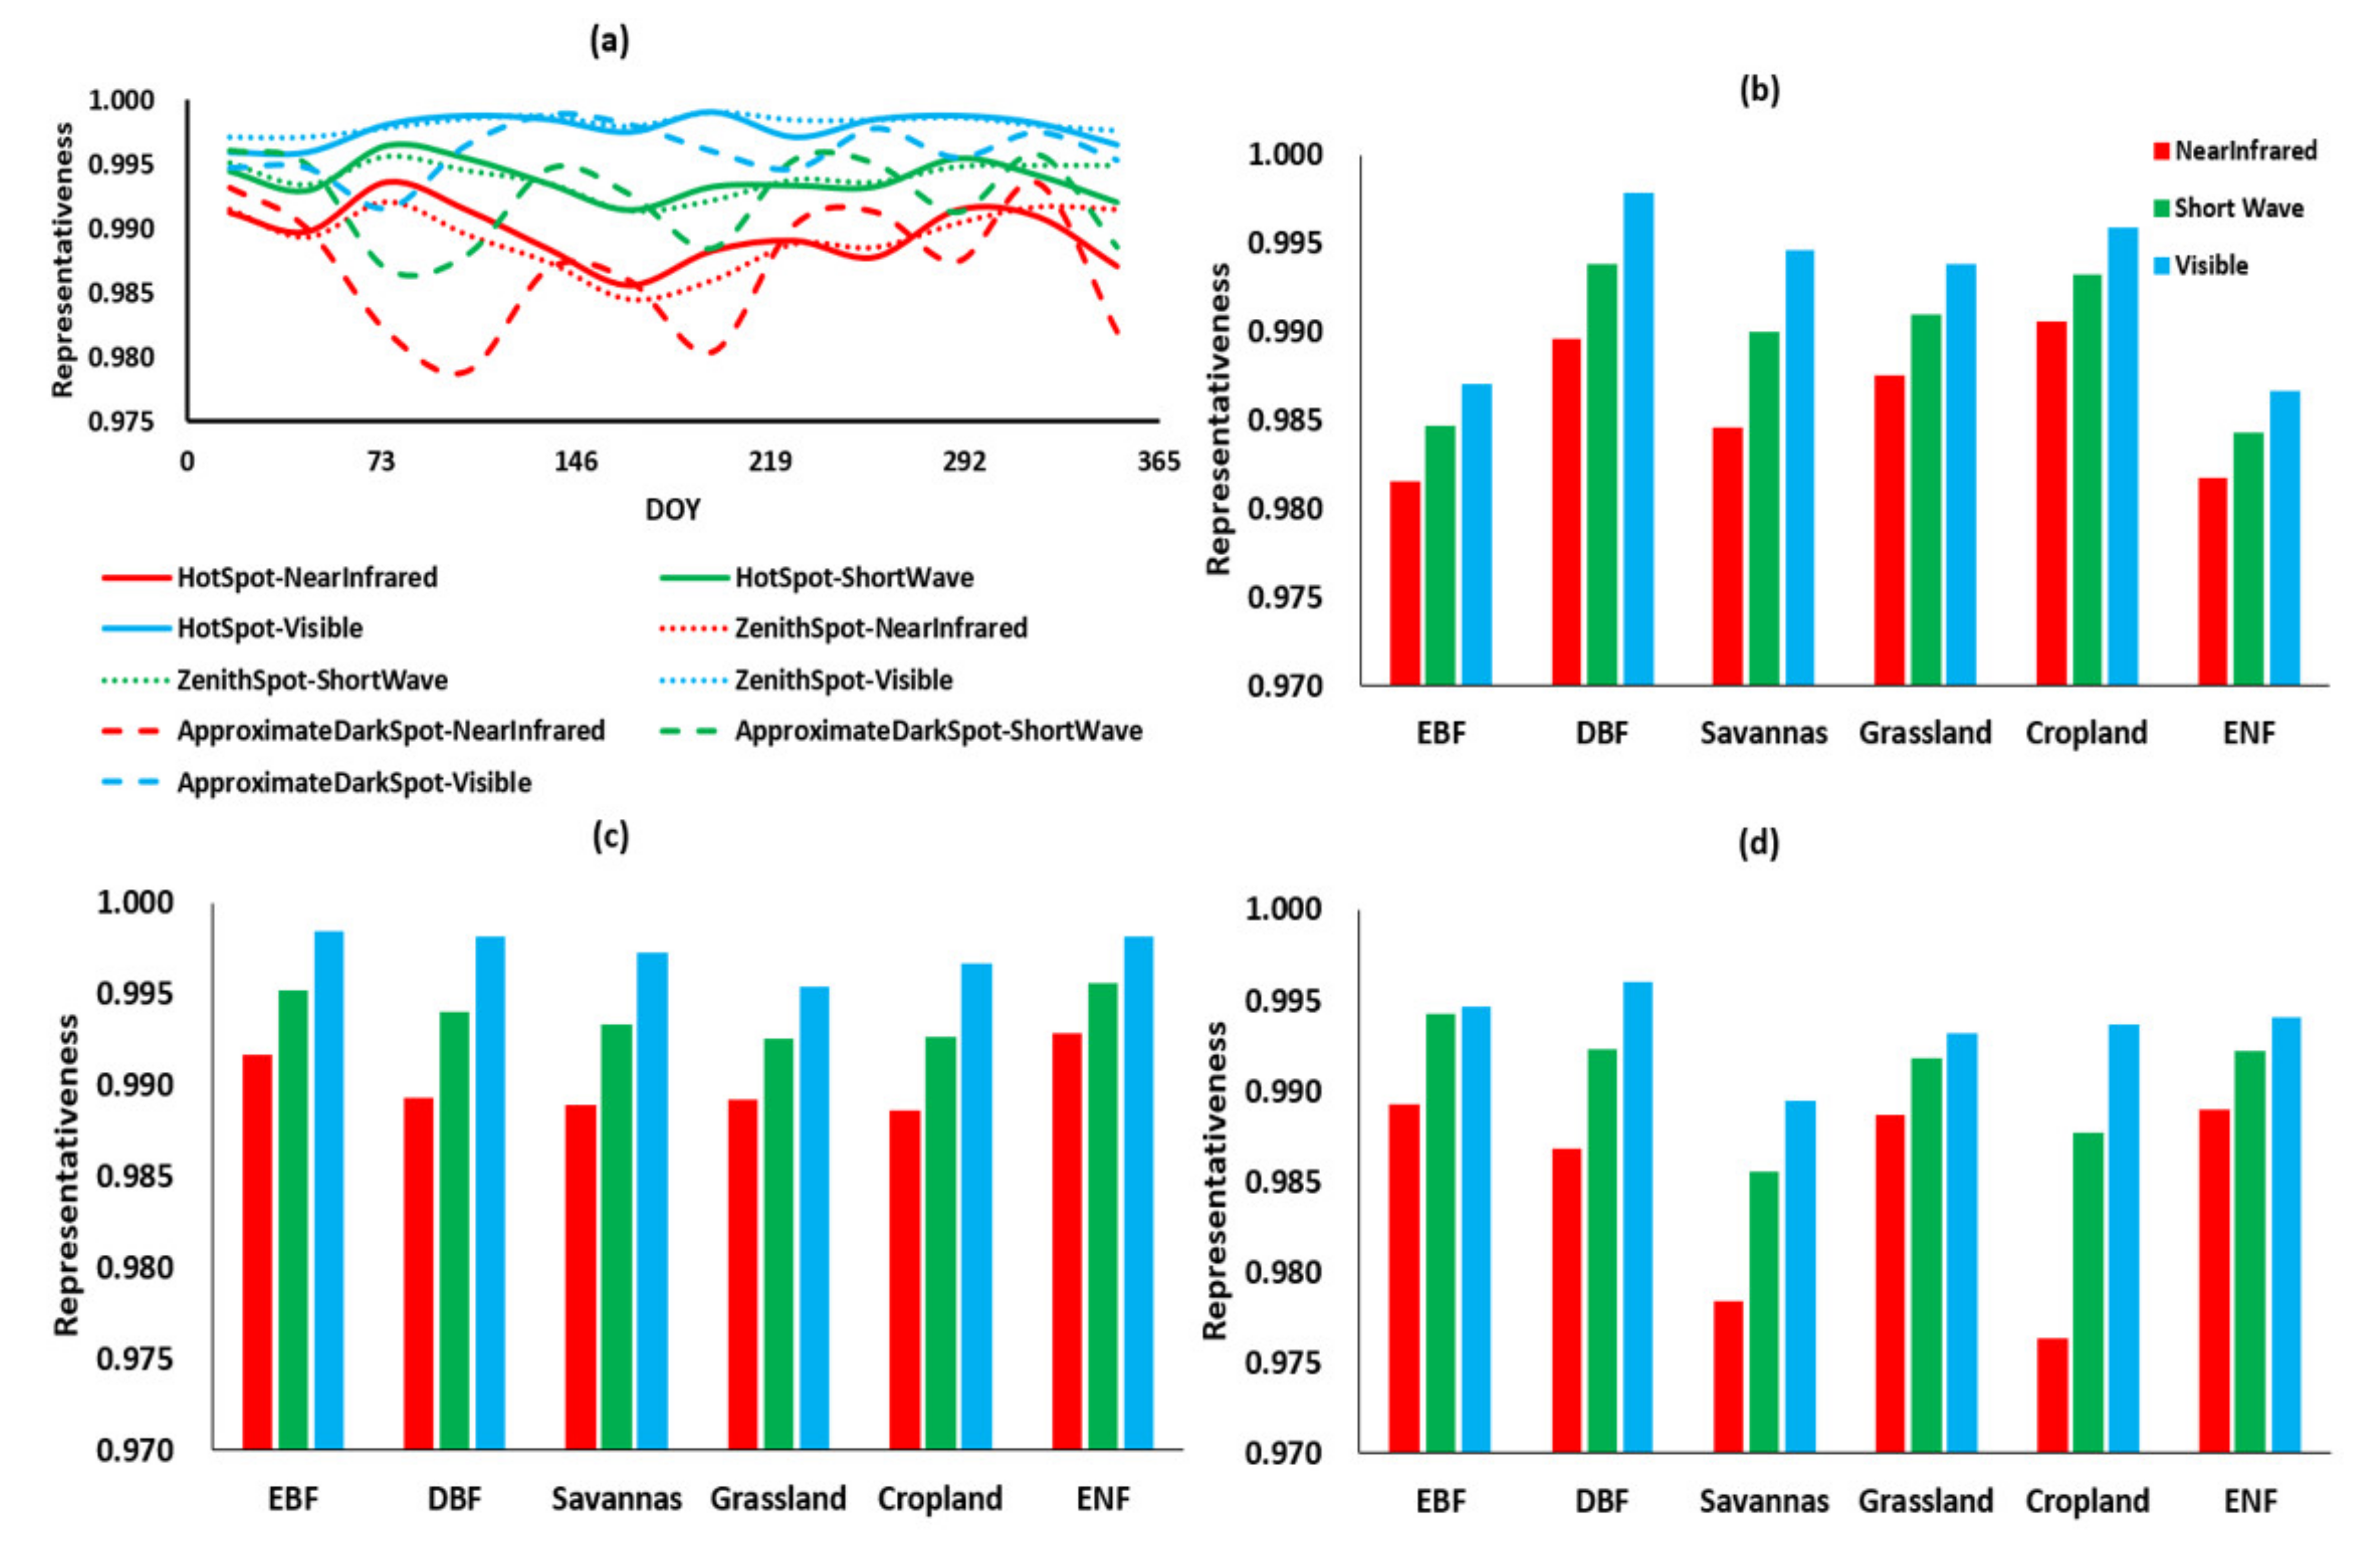
The representativeness of the hot spot, zenith spot and approximate dark spot component (Equation (26)) in AEV within three broadbands (NIR, SW, VIS) is 0.989, 0.993 and 0.997, on average, for the DBF site (Figure 9a). Figure 9b–d shows the statistics of the representativeness of the components in AEV for six selected study sites. The average representativeness of the hot spot, zenith spot and approximate dark spot component is 0.987, 0.991 and 0.994 in the NIR, SW and VIS band for the six study sites. Thus, the representativeness of AEV is also high in three broadbands.

4.3. Shape Vectors and AFX

As AFX is used to capture the overall shape of BRDF and provide the input for building the a priori database of archetypal BRDF shapes, it is necessary to investigate the ability of the shape vectors to capture the weight of the scattering effect, and it is helpful to provide more choices for building the a priori database of BRDF. The correlations between the hot spot component in AEV and AFX for the DBF site are high, with the correlation coefficients of 0.914, 0.941 and 0.865, respectively, in the three broadbands (NIR, SW, VIS) (Figure 10a). The average correlation coefficients for the six study sites in the three broad bands (NIR, SW, VIS) could reach 0.936, 0.945 and 0.863 (Figure 10b). However, the correlation coefficients for the zenith spot and the approximate dark spot component between AFX are 0.063, 0.158, 0.210 and −0.220, −0.098, 0.298 in the three broadbands (NIR, SW, VIS), respectively. This indicates that the hot spot component in AEV shows the highest correlation with the weight of the scattering effects, and the BRDF shape near the hot spot contains information to judge the overall shape of the BRDF.
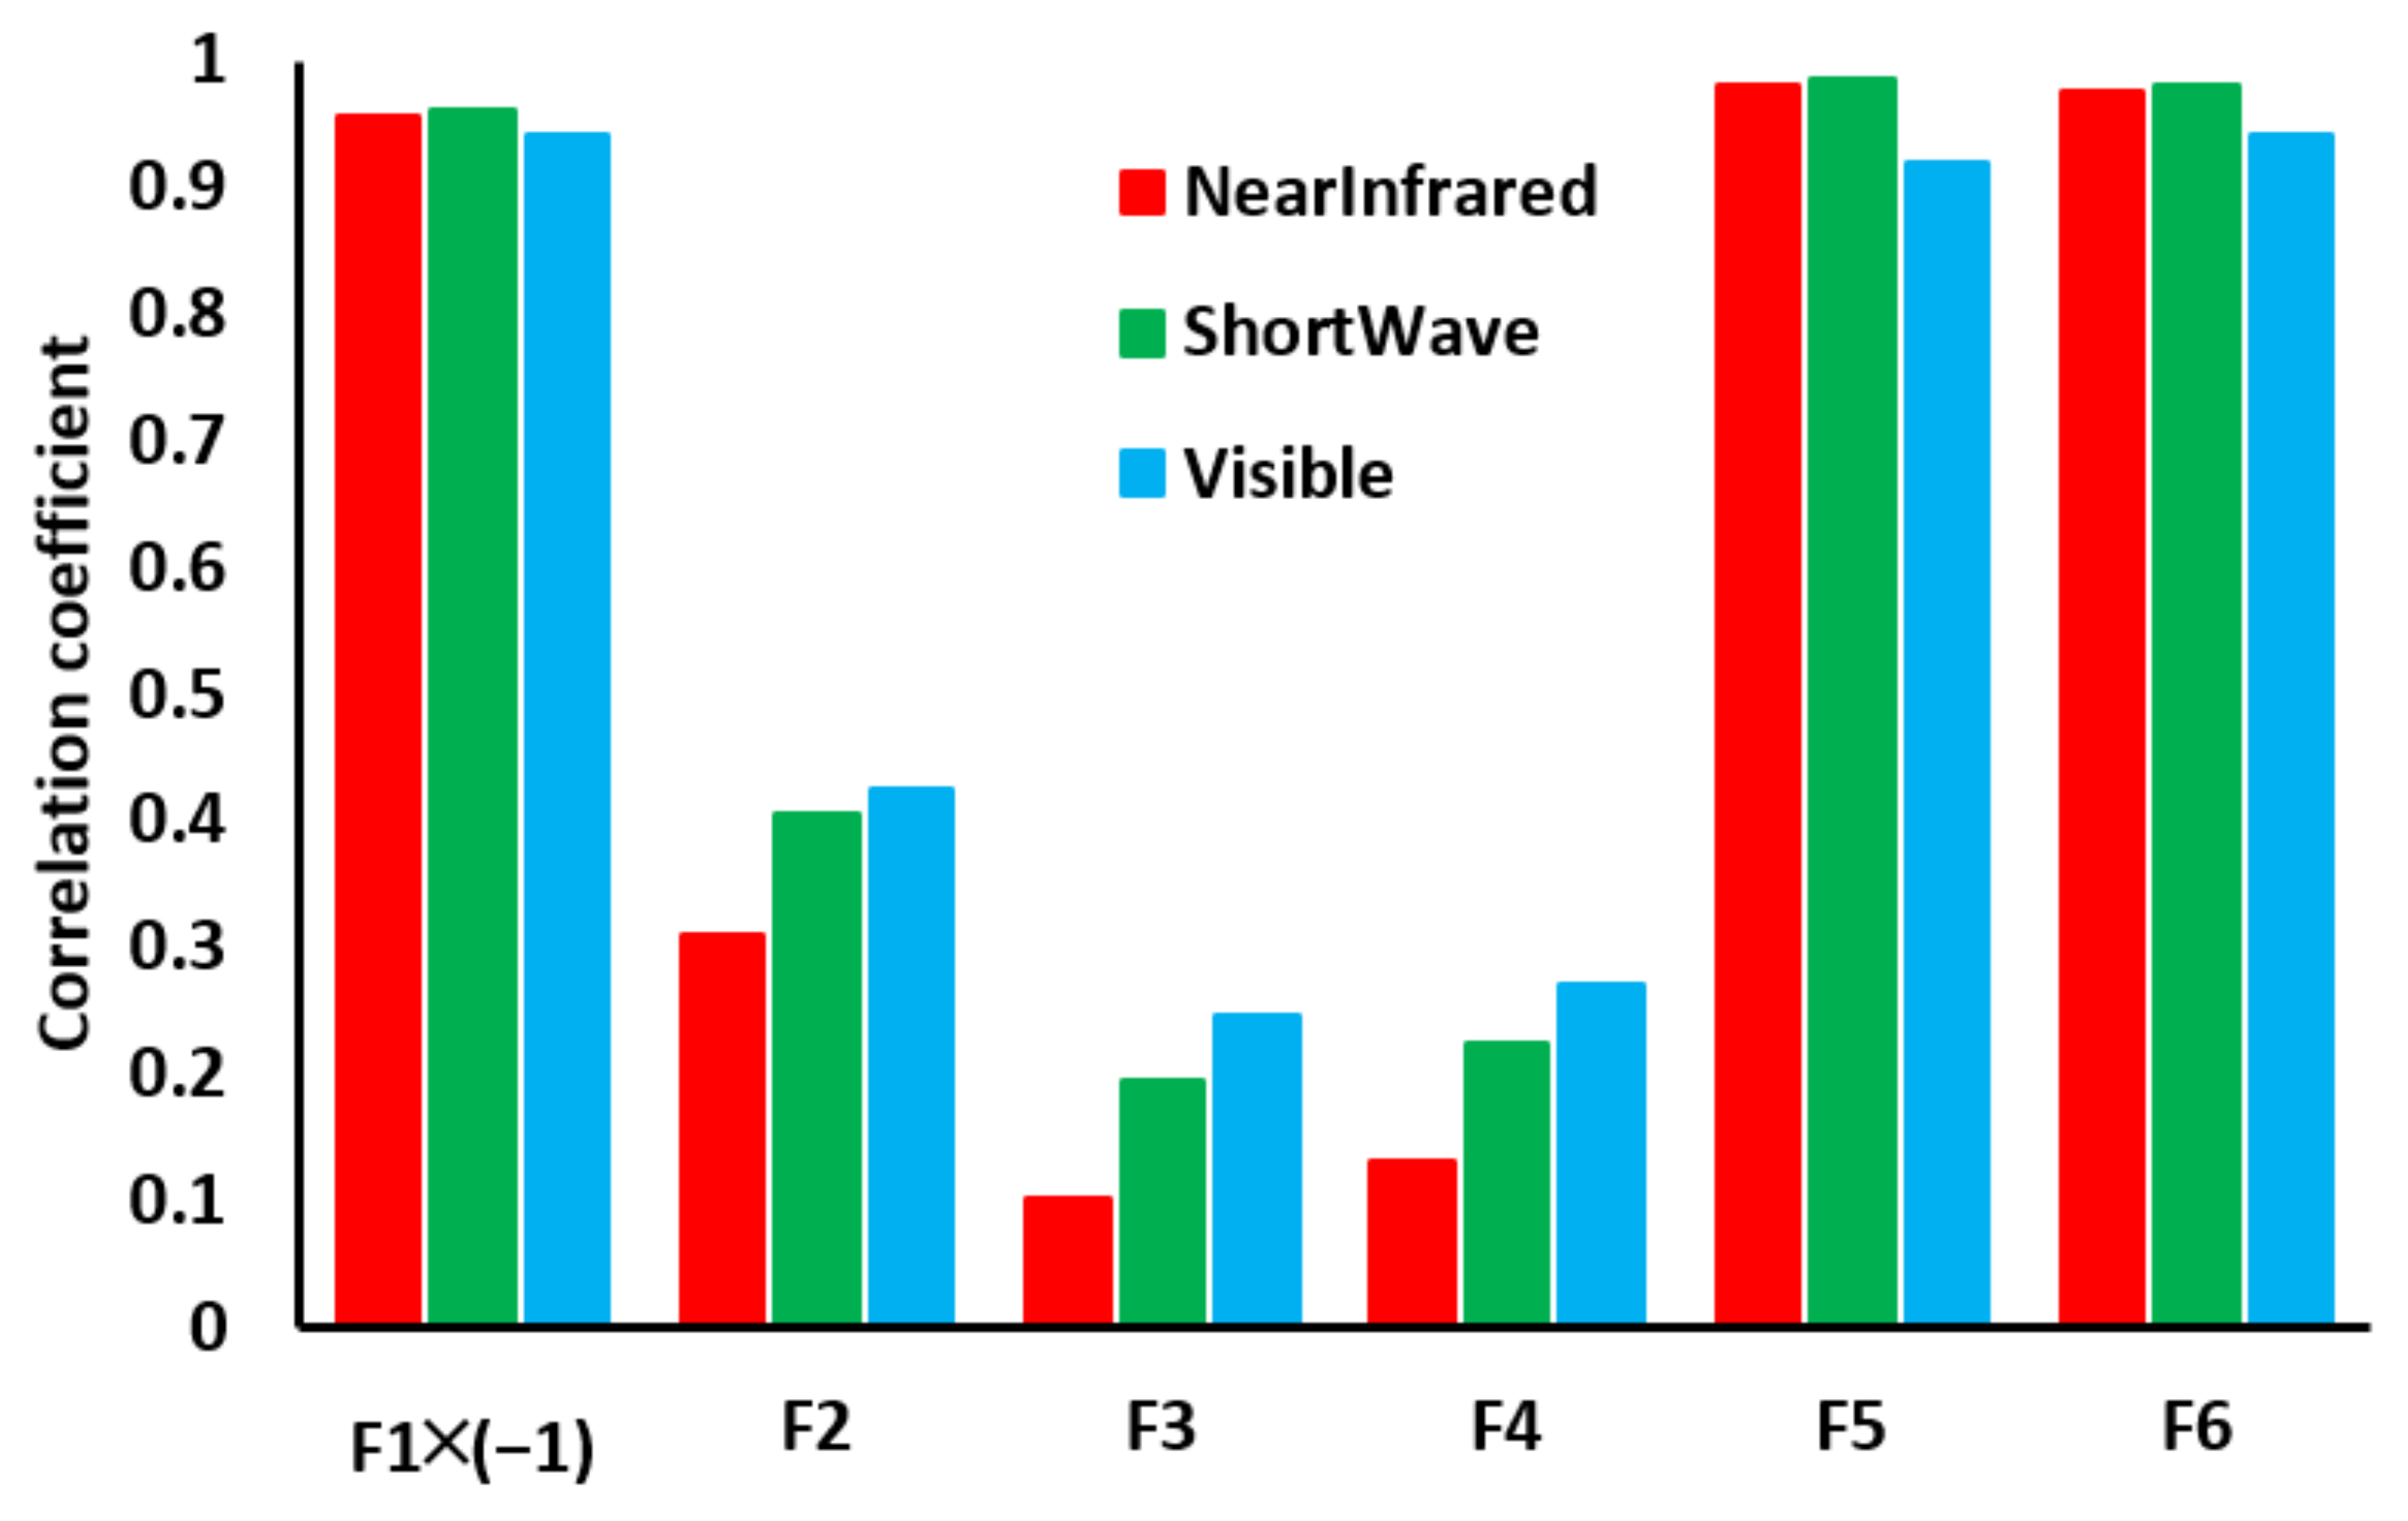
The average correlation coefficient between the six components of PAV and AFX in the three broadbands (NIR, SW, VIS) is −0.953, 0.380, 0.181, 0.209, 0.961 and 0.966, respectively (Figure 11). The correlation coefficients of F1, F5 and F6 in the forward and backward edge regions of BRDF are significantly higher than those in F3 and F4 near the zenith. This indicates that the components of F1, F5 and F6 in PAV show higher correlation with the weight of scattering effects and have potentiality to capture the weight of scattering effects.

4.4. Application of Shape Vectors

For the components in shape vectors, the hot spot component in AEV can not only express the variation of shape near the hot spot but also capture the weight of scattering effects. Some studies have also shown that the rich information contained in the hot spot is of great significance for the inversion of land parameters [63,64]. Taking the hot spot component in AEV as an example, we discussed the potentiality of BRDF vectors for land cover classification and utilized the hot spot component to verify the correlation between NDVI and the BRDF’s shape.

4.4.1. Land Cover Classification

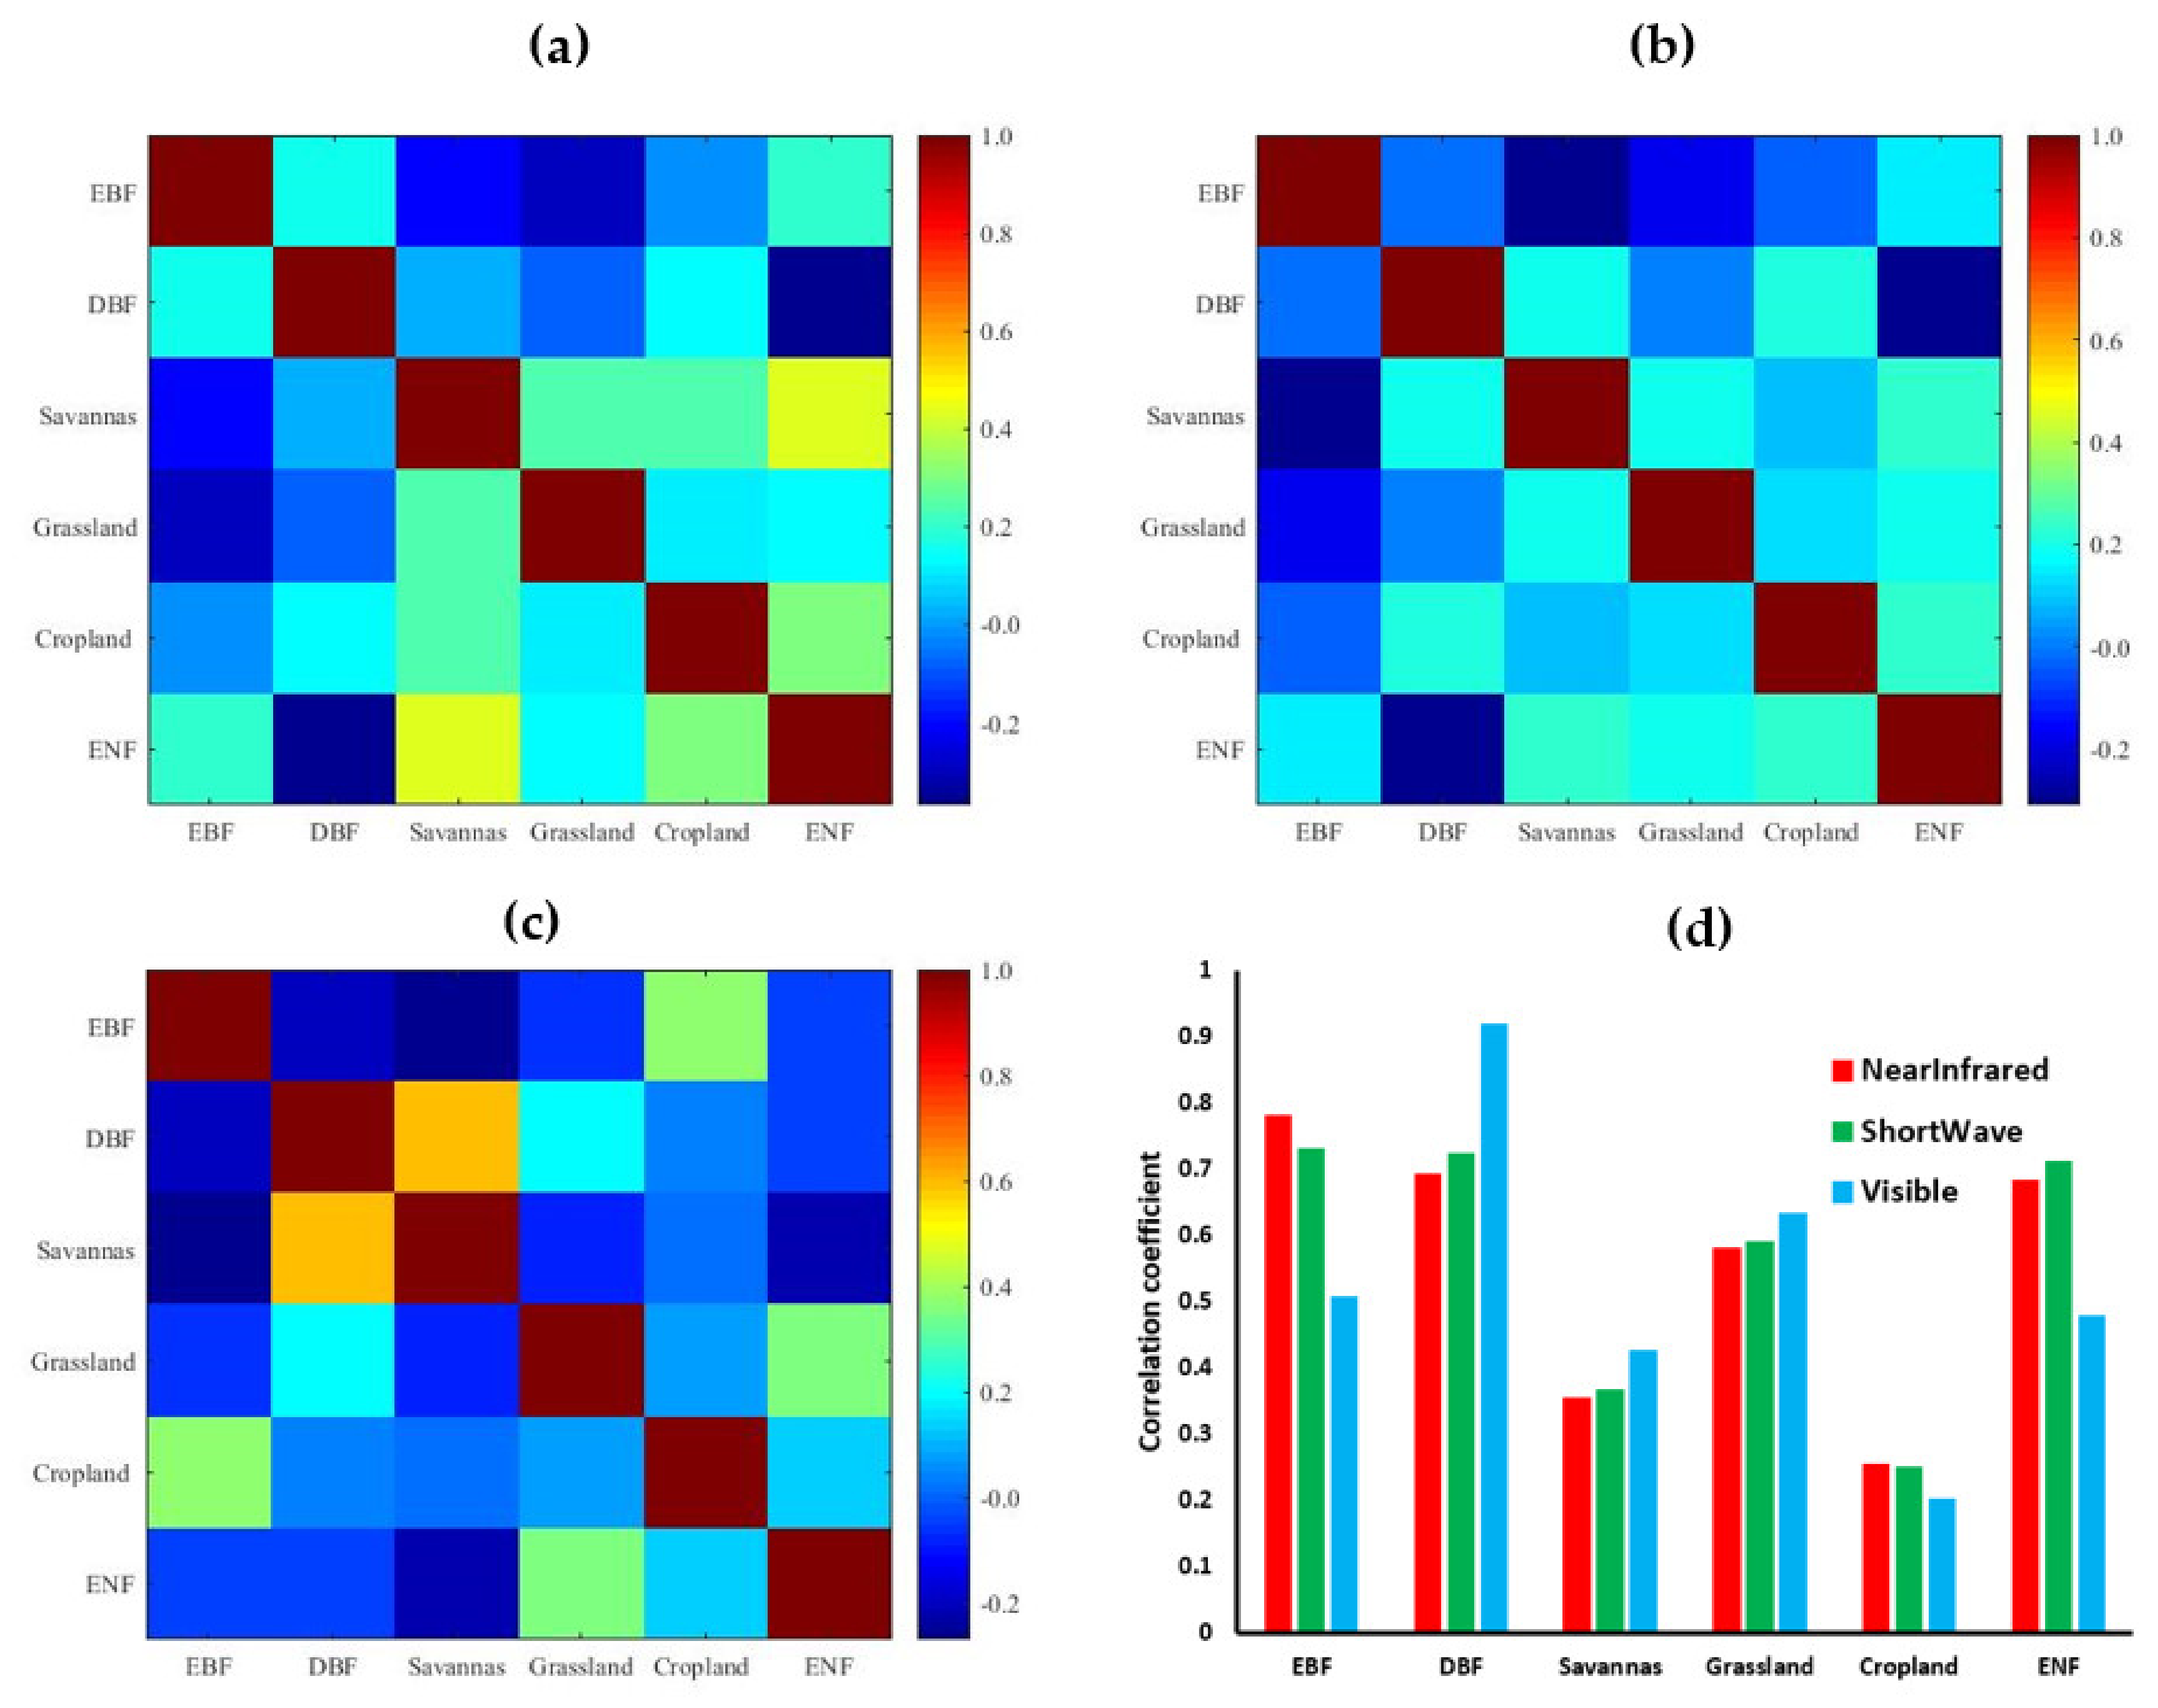
The correlation coefficient of hot spot components for the pixels with the various types is only 0.069, 0.055 and 0.051, on average, in the three broad bands of NIR, SW and VIS, respectively (Figure 12a–c). This indicates that the correlation of BRDF’s shapes for pixels with various types is low in general. The correlation coefficient of hot spot components for the pixels with the same types is 0.557, 0.561 and 0.527 in the NIR, SW and VIS band (Figure 12d). The pixels of the study sites and their adjacent pixels with the same type can be seen in Figure 2. It indicates that the correlations of BRDF’s shapes for the pixels with the same types are significantly higher than those pixels with various types; thus, the BRDF shapes have the potentiality for land cover classification. Among all the study sites, cropland has the lowest correlation coefficients, 0.254, 0.248 and 0.201 in the three broad bands (NIR, SW and VIS), respectively. Thus, we conducted a further analysis for the cropland site and its adjacent 8 MODIS−500 m pixels based on the CDL data.
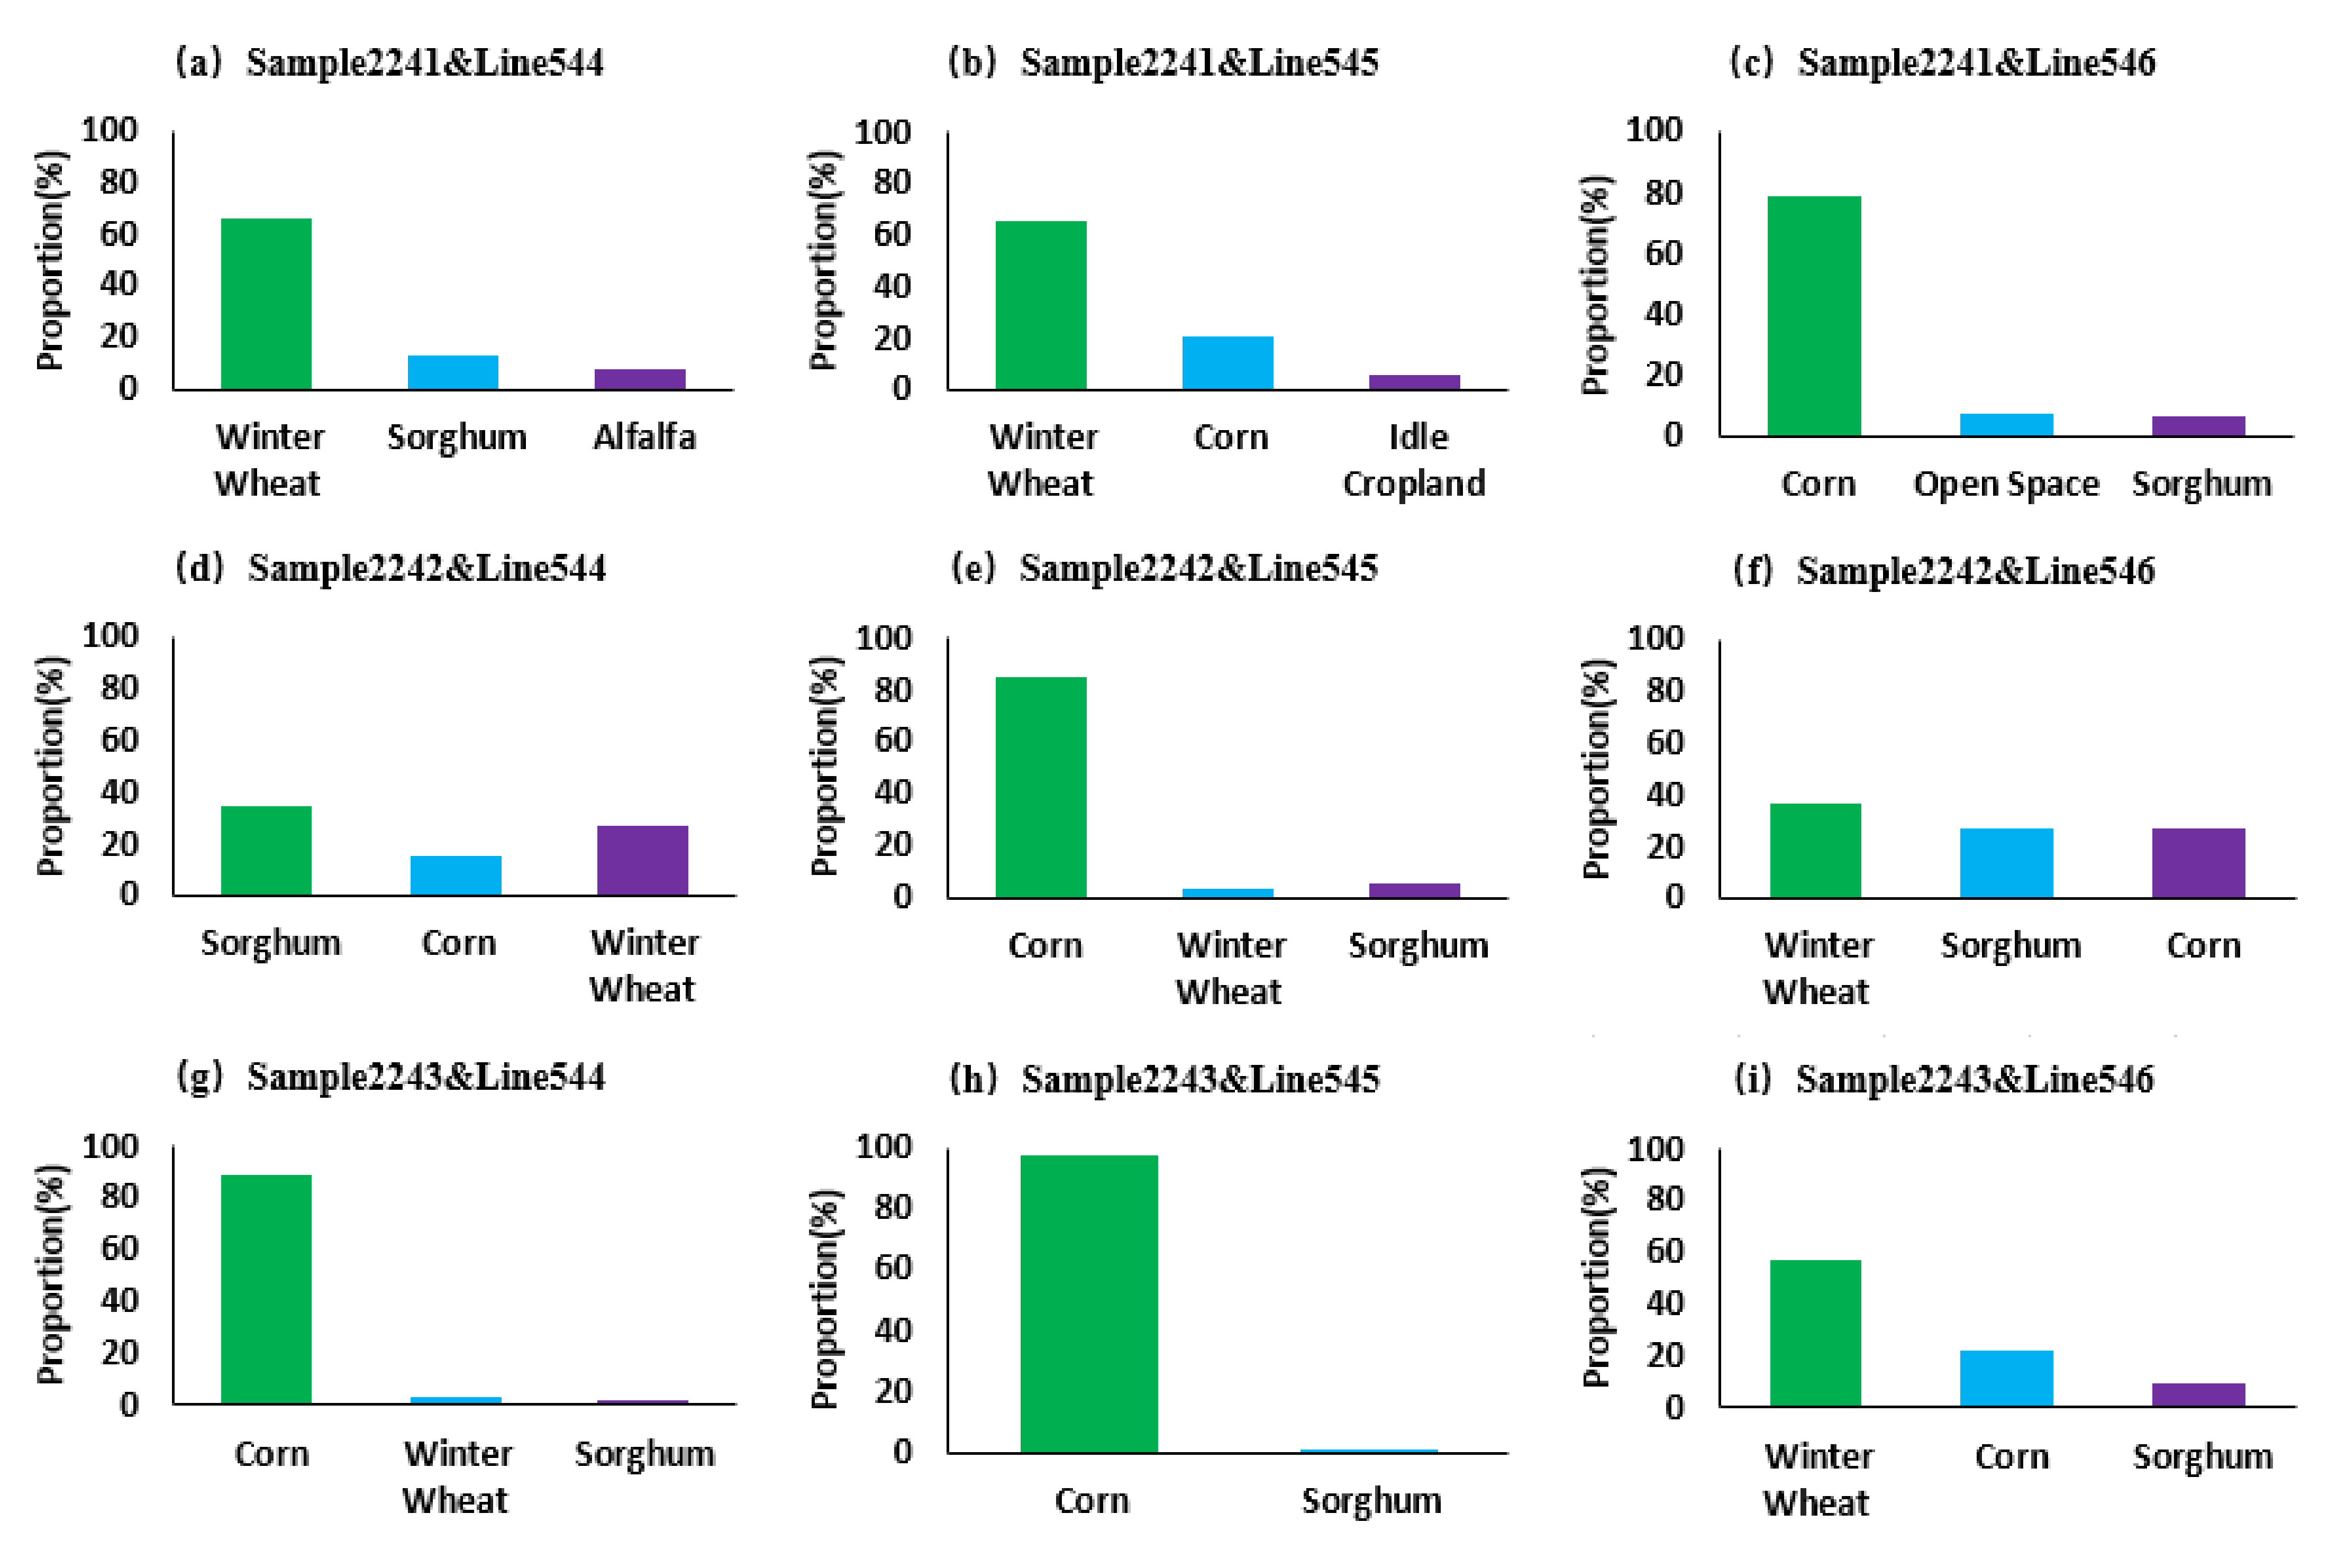
The variations are significant in specific crop types at a finer scale for MODIS-500 m pixels, and the proportions of the three main categories (corn, winter wheat, sorghum) in each MODIS-500 m pixel are various (Figure 13). Within the 9 MODIS-500 m pixels, the main category and their proportions are winter wheat (66.8%), winter wheat (66.5%), corn (79.1%), sorghum (34.7%), corn (85.7%), winter wheat (37.6%), corn (89.5%), corn (98.3%), and winter wheat (58.3%). However, the growing periods of different crops are various, which may lead to a significant variation in BRDF’s characteristics among MODIS-500 m pixels and affect the correlation of BRDF’s shapes.

4.4.2. NDVI and BRDF Shape Vector

The correlation curves in three temporal scales for the selected sites show no obvious trend in three broadbands (NIR, SW, VIS) (Figure 14). Taking the seasonal correlation coefficients as an example, the coefficients range from −0.258 to 0.487, −0.173 to 0.497 and 0.055 to 0.494, respectively, in the NIR, SW and VIS band. This indicates that the variations of seasonal correlation coefficients are significant; thus, it is unstable to adjust BRDF’s shape based on NDVI. The average correlation coefficients between BRDF’s shape and NDVI for the six selected sites at three temporal scales of annual, seasonal, and monthly phases are 0.134, 0.063, 0.038 (NIR); 0.199, 0.185, 0.165 (SW); 0.323, 0.320, 0.337 (VIS) (Figure 14d). This indicates that the ability of adjusting BRDF’s shape using NDVI is generally poor in the three broadbands, especially in NIR band.
In general, the reliability of adjusting BRDF’s shape by NDVI is poor and unstable; thus, NDVI could not satisfy the demand of tracking BRDF’s shape. The shape of BRDF is mainly determined by the weight of geometric-optical and volumetric effects, while the NDVI based on the zenith reflectance in the Red and NIR band could not capture the variation of scattering effects in the mechanism effectively.

4.4.3. Monitoring of Land Cover in Mining Area

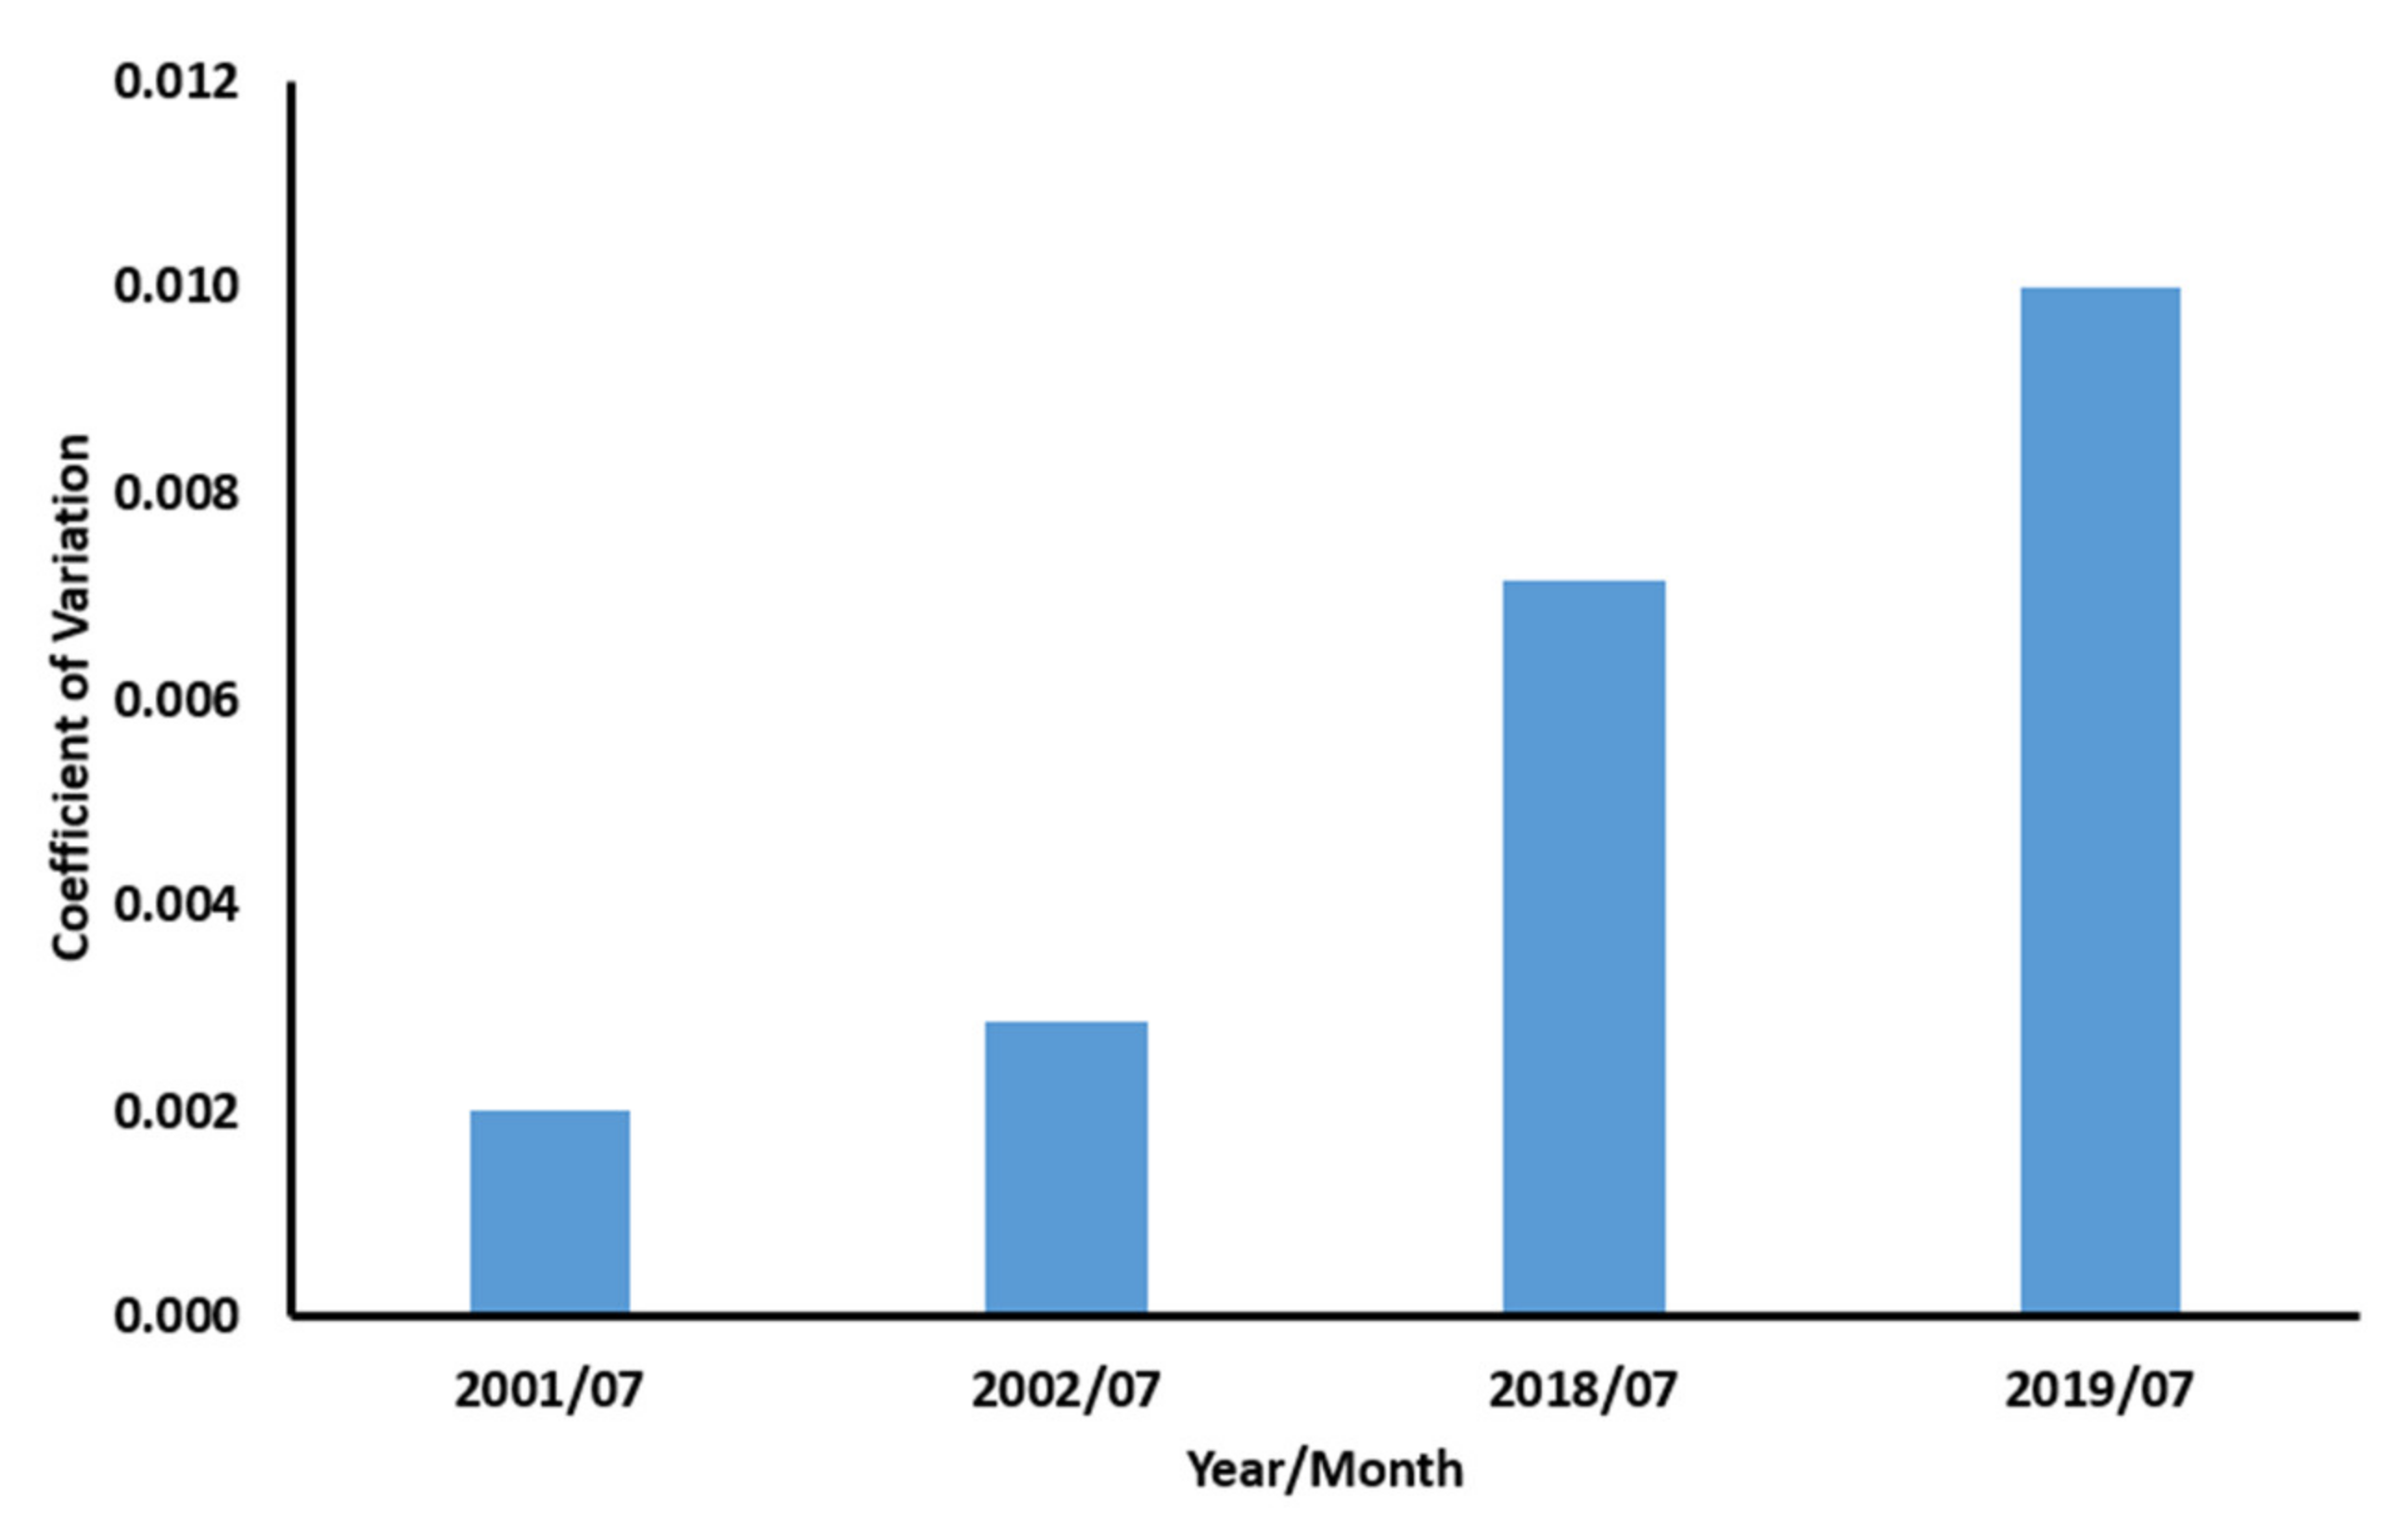
The coefficients of variations for hot spot components in July 2001 and 2002 are lower (0.0020 and 0.0028) (Figure 15). This indicates that the variations of BRDFs before land reclamation and without vegetation are relatively lower. The coefficients of variations for hot spot components are significantly higher in 2018 and 2019 (0.0071 and 0.0099), which indicates that the variations of BRDFs are relatively higher after land reclamation due to the influence of vegetation. Thus, BRDF shape vectors have the potentiality to monitor the land cover in mining area.

5. Discussion

The spatial resolution of multi-angle sensors ranges from hundreds of meters to several kilometers; for example, the spatial resolutions of MODIS in various bands are from 250 m to 1 km, and the POLDER has a 6 km by 7 km spatial scale at nadir, which makes it difficult to capture the disturbance for land cover caused by various natural or human activities. The earth observation systems with finer scale are limited by the narrow angle of FOV; for example, the Landsat-8 OLI provides FOV with 15° for the 185 km across-track ground swath, while the FOV for SENTINEL-2 MSI is 20.6° to obtain a swath width of 290 km on the ground track. Thus, they cannot obtain multi-angle observations directly nor by the method of strip overlapping. The introduction of a priori BRDF knowledge is an effective way to solve the multi-angle retrieval of land parameters for the earth observation systems with finer scales [44,45,46,47]. To build the database of a priori BRDF knowledge, it is necessary to describe and track the shape of BRDF accurately.
Classical indicators based on the ratio of reflectance for a few typical scattering directions or the weight of scattering effects are too rough to capture the characteristics of BRDF and could not satisfy the demand. The accuracy of ANIF, ANIX and AFX in capturing the BRDFs with the same shape but different magnitudes is poor. For example, the relative variations of AFX, ANIF and ANIX in Figure 6a could reach as high as 22.0%, 17.3% and 40.5%. Thus, we proposed two shape vectors, PAV and AEV, to describe the BRDF comprehensively and accurately. Compared with the ratio of reflectance, the change rate of reflectance can directly reflect the shape between two adjacent scattering directions and make the mathematical mechanism clearer. We verified that the PAV and AEV were suitable for evaluating the BRDFs with the same shape but different magnitudes, for their values were consistent. We counted the number of DOYs with the same shape but different magnitudes in 2019 for the selected study sites; there were 77–89, 80–114 and 101–145 days, respectively, in the NIR, SW and VIS band, and the average number of DOYs under this situation account for 22.37%, 26.35% and 33.01% of the whole year in three broad bands. Thus, it is important for PAV and AEV to describe BRDF with high accuracy. Both PAV and AEV could effectively describe and track the change of typical BRDF shapes compared with the classical shape indicators. In addition, the representativeness of PAV and AEV were assessed by cosine similarity and error transfer function. The results showed they could capture the original BRDF with high accuracy. The comprehensive description of the BRDF’s shape is very important for the study of a priori BRDF knowledge, as the different region in BRDF could perform various characteristics. Although Jiao utilized AFX to establish the database of a priori BRDF knowledge, the PAV and AEV may provide more detailed shape information [48,49]. Thus, the PAV and AEV will be helpful for the establishment of the database for a priori BRDF knowledge in the future.
Although some researchers have verified the classical shape indicators helpful for the accuracy of land cover classification, the results showed that the improvements were limited and not consistent for all land cover types [51,52]. Cui used the classical indicators to estimate the canopy height with the fitting RMSE (Root Mean Square Error) of 3.27 m [65]. The incomplete description of anisotropy may be the reason for the limited ability of classical shape indicators. PAV and AEV could describe the detailed regional information of BRDF; they may have the potentiality to improve the accuracy of land cover classification and the retrieval of land parameters. In addition, the PAV and AEV were obtained under the SZA of 45°, and the SZA may change with the season or other factors. With the change of SZA, some characteristic directions of BRDF may also change, such as hot spots. Thus, it is necessary to study the method for PAV and AEV under various SZAs in future.

6. Conclusions

We proposed two shape vectors based on the change rate of reflectance for multiple typical scattering directions and angle formulations: 6-component PAV and 3-component AEV. The effectiveness and representativeness of the two shape vectors were verified by the simulated and actual BRDF data. In addition, the potentiality of BRDF’s shape for land cover classification and monitoring of land cover in mining areas and the ability of NDVI to adjust BRDF’s shape were investigated by hot spot component in AEV. The conclusions of this study are: (1) The PAV and AEV could describe the BRDF’s shape more effectively, for their mathematical mechanisms are clearer. (2) The PAV and AEV have good representativeness for the original BRDF. (3) The hot spot component in AEV has the potentiality for land cover classification and the monitoring of land cover in mining areas. (4) The adjustment for BRDF’s shape by NDVI is unreliable. In future, BRDF shape vectors can be used to capture and track the anisotropy characteristics effectively in space–time dimensions, which may provide a feasible way to establish the database of a priori BRDF knowledge; they also can be used in land cover classification or the monitoring of land cover.

Author Contributions

Conceptualization, J.Y.; program and process, J.Y.; data organization, J.D.; writing—original draft preparation, J.Y. and J.H.; writing—review and editing, J.H., H.F., X.M. All authors have read and agreed to the published version of the manuscript.

Funding

This work was supported by the National Key Research and Development Program of China (No. 2020YFA0608501), and the Project Supported Discipline Innovation Team of Liaoning Technical University (No. LNTU20TD-23).

Data Availability Statement

Publicly available datasets were analyzed in this study. These datasets can be found here: https://ladsweb.modaps.eosdis.nasa.gov/search/ (accessed on 30 January 2021); https://nassgeodata.gmu.edu/CropScape/ (accessed on 28 March 2022).

Acknowledgments

The authors are grateful for the advice and guidance from Yanmin Shuai at Liaoning Technical University & Chinese Academy of Sciences. The authors would like to thank the researchers at Boston University for providing AMBRALS codes.

Conflicts of Interest

The authors declare no conflict of interest.

References

  1. Song, F.; Fan, W.; Liu, Q.; Xu, X. A Method of Acquiring BRDF of Objects in the Field. J. Remote Sens. 2007, 11, 296–302. [Google Scholar] [CrossRef]
  2. Zhu, G.L.; Ju, W.M.; Chen, J.M.; Liu, Y.B.; Zhu, J.F.; Xing, B.L. Validation of MODIS BRDF model parameters product and the Ross-Li model with POLDER data. J. Remote Sens. 2011, 15, 875–894. [Google Scholar] [CrossRef]
  3. He, D.D.; Jiao, Z.T.; Dong, Y.D.; Zhang, X.N.; Ding, A.X.; Yin, S.Y.; Cui, L.; Chang, Y.X. Preliminary verification of Landsat satellite albedo from airborne WIDAS data. J. Remote Sens. 2019, 23, 53–61. [Google Scholar] [CrossRef]
  4. Wang, Q.F.; Li, J.Y.; Chen, B.M. Land Cover Classification System Based on Spectrum in Poyang Lake Basin. Acta Geogr. Sin. 2006, 61, 359–368. [Google Scholar] [CrossRef]
  5. Li, C.C.; Wang, J.; Wang, L.; Hu, L.Y.; Gong, P. Comparison of classification algorithms and training sample sizes in urban land classification with landsat thematic mapper imagery. Remote Sens. 2014, 6, 964–983. [Google Scholar] [CrossRef]
  6. Yu, L.; Liang, L.; Wang, J.; Zhao, Y.; Cheng, Q.; Hu, L.; Liu, S.; Yu, L.; Wang, X.; Zhu, P.; et al. Meta-discoveries from a synthesis of satellite-based land-cover mapping research. Int. J. Remote Sens. 2014, 35, 4573–4588. [Google Scholar] [CrossRef]
  7. DeFries, R.S.; Townshend, G. NDVI-derived land cover classifications at a global scale. Int. J. Remote Sens. 1994, 15, 3567–3586. [Google Scholar] [CrossRef]
  8. Loveland, T.R.; Belward, A.S. The IGBP-DIS global 1 km land cover data set, DISCover: First results. Int. J. Remote Sens. 1997, 18, 3289–3295. [Google Scholar] [CrossRef]
  9. Friedl, M.; McIver, D.; Hodges, J.; Zhang, X.; Muchoney, D.; Strahler, A.; Woodcock, C.; Gopal, S.; Schneider, A.; Cooper, A.; et al. Global land cover mapping from MODIS: Algorithms and early results. Remote Sens. Environ. 2002, 83, 287–302. [Google Scholar] [CrossRef]
  10. Gong, P.; Wang, J.; Yu, L.; Zhao, Y.; Zhao, Y.; Liang, L.; Niu, Z.; Huang, X.; Fu, H.; Liu, S.; et al. Finer resolution observation and monitoring of global land cover: First mapping results with Landsat TM and ETM+ data. Int. J. Remote Sens. 2013, 34, 2607–2654. [Google Scholar] [CrossRef] [Green Version]
  11. Qi, J.; Moran, M.S.; Cabot, F.; Dedieu, G. Normalization of sun/view angle effects using spectral albedo-based vegetation indices. Remote Sens. Environ. 1995, 52, 207–217. [Google Scholar] [CrossRef]
  12. Gu, L.; Shuai, Y.; Shao, C.; Xie, D.; Zhang, Q.; Li, Y.; Yang, J. Angle Effect on Typical Optical Remote Sensing Indices in Vegetation Monitoring. Remote. Sens. 2021, 13, 1699. [Google Scholar] [CrossRef]
  13. Shuai, Y.M.; Yang, J.; Wu, H.; Shao, C.Y.; Xu, X.C.; Liu, M.Y.; Liu, T.; Liang, J. Variation of multi-angle reflectance collected by UAV over quadrats of paddy-field canopy. Remote Sens. Technol. Appl. 2021, 36, 342–352. [Google Scholar] [CrossRef]
  14. Petri, C.A.; Lênio, S.G. Sensitivity of Seven MODIS Vegetation Indices to BRDF Effects during the Amazonian Dry Season. Remote. Sens. 2019, 11, 1650. [Google Scholar] [CrossRef]
  15. Bhandari, S.; Phinn, S.; Gill, T. Assessing viewing and illumination geometry effects on the MODIS vegetation index (MOD13Q1) time series: Implications for monitoring phenology and disturbances in forest communities in Queensland, Australia. Int. J. Remote Sens. 2011, 32, 7513–7538. [Google Scholar] [CrossRef]
  16. Gao, F.; Schaaf, C.B.; Strahler, A.H.; Jin, Y.; Li, X. Detecting Vegetation Structure using a Kernel-based BRDF Model. Remote Sens. Environ. 2003, 86, 198–205. [Google Scholar] [CrossRef]
  17. Wang, Q.; Ni-Meister, W. Forest Canopy Height and Gaps from Multiangular BRDF, Assessed with Airborne LiDAR Data. Remote. Sens. 2019, 11, 2566. [Google Scholar] [CrossRef]
  18. Yao, Y.; Yan, G.; Wang, J. The Approach on Leaf Area Index Inversion Using Multiangular and Multispectral Data Sets. J. Remote Sens. 2005, 9, 117–122. [Google Scholar] [CrossRef]
  19. Yang, G.J.; Huang, W.J.; Wang, J.H.; Xing, Z.R. Inversion of forest leaf area index calculated from multi-source and multi-angle remote sensing data. Chin. Bull. Bot. 2010, 45, 566–578. [Google Scholar] [CrossRef]
  20. Yang, X.F.; Wang, X.M. Classification of MISR multi- angle imagery based on decision tree classifier. J. Geo-Inf. Sci. 2016, 18, 416–422. [Google Scholar] [CrossRef]
  21. Dickinson, R.E. Land surface processes and climate-Surface albedos and energy balance. In Advances in Geophysics; Elsevier: Amsterdam, The Netherlands, 1983; Volume 25, pp. 305–353. [Google Scholar] [CrossRef]
  22. Kimes, D.S.; Sellers, P.J. Inferring hemispherical reflectance of the earth’s surface for global energy budgets from remotely sensed nadir or directional radiance values. Remote Sens. Environ. 1985, 18, 205–223. [Google Scholar] [CrossRef]
  23. Nicodemus, F.E.; Richmond, J.C.; Hsia, J.J.; Ginsberg, I.W.; Limperis, T. Geometrical Considerations and Nomenclature for Reflectance; Nation Bur. Stand.: Washington, DC, USA, 1977; pp. 1–50. [Google Scholar] [CrossRef]
  24. Walthall, C.L.; Norman, J.M.; Welles, G.C.; Blad, B.L. Simple equation to approximate the bidirectional reflectance from vegetation canopies and bare soil surfaces. Appl. Opt. 1985, 24, 383–387. [Google Scholar] [CrossRef] [PubMed]
  25. Nilson, T.; Kuusk, A. A reflectance model for the homogeneous plant canopy and its inversion. Remote Sens. Environ. 1989, 27, 157–167. [Google Scholar] [CrossRef]
  26. Liang, S.; Strahler, A.H. Retrieval of surface BRDF from multiangle remotely sensed data. Remote Sens. Environ. 1994, 50, 18–30. [Google Scholar] [CrossRef]
  27. Allen, W.A.; Gayle, T.V.; Richardson, A.J. Plant-Canopy Irradiance Specified by the Duntley Equations. J. Opt. Soc. Am. 1970, 60, 372–376. [Google Scholar] [CrossRef]
  28. Suits, G.H. The calculation of the directional reflectance of a vegetative canopy. Remote Sens. Environ. 1972, 2, 117–125. [Google Scholar] [CrossRef]
  29. Verhoef, W. Light scattering by leaf layers with application to canopy reflectance modeling: The SAIL model. Remote Sens. Environ. 1984, 16, 125–141. [Google Scholar] [CrossRef]
  30. Marshak, A.L. The effect of the hot spot on the transport equation in plant canopies. J. Quant. Spectrosc. Radiat. Transf. 1989, 42, 615–630. [Google Scholar] [CrossRef]
  31. Qin, W.; David, L.B. An analytical and computationally efficient reflectance model for leaf canopies. Agric. For. Meteorol. 1993, 66, 31–64. [Google Scholar] [CrossRef]
  32. Liang, S.; Strahler, A.H. An analytic BRDF model of canopy radiative transfer and its inversion. IEEE Trans. Geosci. Remote Sens. 1993, 31, 1081–1092. [Google Scholar] [CrossRef]
  33. Li, X.; Strahler, A.H. Geometric-Optical Modeling of a Conifer Forest Canopy. IEEE Trans. Geosci. Remote Sens. 1985, 23, 705–721. [Google Scholar] [CrossRef]
  34. Li, X.; Strahler, A.H. Geometric-Optical Bidirectional Reflectance Modeling of a Conifer Forest Canopy. IEEE Trans. Geosci. Remote Sens. 1986, 24, 906–919. [Google Scholar] [CrossRef]
  35. Li, X.; Strahler, A.H. Geometric-optical bidirectional reflectance modeling of the discrete crown vegetation canopy: Effect of crown shape and mutual shadowing. IEEE Trans. Geosci. Remote Sens. 1992, 30, 276–292. [Google Scholar] [CrossRef]
  36. Rahman, H.; Pinty, B.; Verstraete, M.M. Coupled Surface-Atmosphere Reflectance (CSAR) Model 2. Semiempirical Surface Model Usable with NOAA Advanced Very High Resolution Radiometer Data. J. Geophys. Res. Atmos. 1993, 98, 20791–20801. [Google Scholar] [CrossRef]
  37. Lucht, W.; Schaaf, C.; Strahler, A. An algorithm for the retrieval of albedo from space using semiempirical BRDF models. IEEE Trans. Geosci. Remote Sens. 2000, 38, 977–998. [Google Scholar] [CrossRef]
  38. Justice, C.O.; Vermote, E.; Townshend, J.R.G.; Defries, R.; Roy, D.P.; Hall, D.K.; Salomonson, V.V.; Privette, J.L.; Riggs, G.; Strahler, A.; et al. The Moderate Resolution Imaging Spectroradiometer (MODIS): Land remote sensing for global change research. IEEE Trans. Geosci. Remote Sens. 1998, 36, 1228–1249. [Google Scholar] [CrossRef]
  39. Diner, D.; Beckert, J.; Reilly, T.; Bruegge, C.; Conel, J.; Kahn, R.; Martonchik, J.; Ackerman, T.; Davies, R.; Gerstl, S.; et al. Multiangle Imaging Spectro Radiometer (MISR) description and experiment overview. IEEE Trans. Geosci. Remote Sens. 1998, 36, 1072–1087. [Google Scholar] [CrossRef]
  40. Deschamps, P.Y.; Bréon, F.M.; Leroy, M.; Podaire, A.; Bricaud, A.; Buriez, J.C.; Seze, G. The POLDER mission: Instrument characteristics and scientific objectives. IEEE Trans. Geosci. Remote Sens. 1994, 32, 598–615. [Google Scholar] [CrossRef]
  41. Roy, D.P.; Wulder, M.A.; Loveland, T.R.; Woodcock, C.E.; Allen, R.G.; Anderson, M.C.; Helder, D.; Irons, J.R.; Johnson, D.M.; Kennedy, R.; et al. Landsat-8: Science and Product Vision for Terrestrial Global Change Research. Remote Sens. Environ. 2014, 145, 154–172. [Google Scholar] [CrossRef]
  42. Drusch, M.; Del Bello, U.; Carlier, S.; Colin, O.; Fernandez, V.; Gascon, F.; Hoersch, B.; Isola, C.; Laberinti, P.; Martimort, P.; et al. Sentinel-2: ESA’s Optical High-Resolution Mission for GMES Operational Services. Remote Sens. Environ. 2012, 120, 25–36. [Google Scholar] [CrossRef]
  43. Yang, A.; Zhong, B.; Lv, W.; Wu, S.; Liu, Q. Cross-Calibration of GF-1/WFV over a Desert Site Using Landsat-8/OLI Imagery and ZY-3/TLC Data. Remote Sens. 2015, 7, 10763–10787. [Google Scholar] [CrossRef]
  44. Shuai, Y.; Masek, J.; Gao, F.; Schaaf, C. An algorithm for the retrieval of 30-m snow-free albedo from Landsat surface reflectance and MODIS BRDF. Remote Sens. Environ. 2011, 115, 2204–2216. [Google Scholar] [CrossRef]
  45. Shuai, Y.; Masek, J.; Gao, F.; Schaaf, C.; He, T. An Approach for the Long-Term 30-m Land Surface Snow-Free Albedo Retrieval from Historic Landsat Surface Reflectance and MODIS-based A Priori Anisotropy Knowledge. Remote Sens. Environ. 2014, 152, 467–479. [Google Scholar] [CrossRef]
  46. Franch, B.; Vermote, E.; Claverie, M. Intercomparison of Landsat albedo retrieval techniques and evaluation against in situ measurements across the US SURFRAD network. Remote Sens. Environ. 2014, 152, 627–637. [Google Scholar] [CrossRef]
  47. Vermote, E.; Justice, C.; Bréon, F. Towards a Generalized Approach for Correction of the BRDF Effect in MODIS Directional Reflectances. IEEE Trans. Geosci. Remote Sens. 2009, 47, 898–908. [Google Scholar] [CrossRef]
  48. Jiao, Z.; Zhang, H.; Li, X. To derive a prior database of archetypal BRDF shapes from ground measurements using anisotropic flat index (AFX). In Proceedings of the 2012 IEEE International Geoscience and Remote Sensing Symposium, Munich, Germany, 22–27 July 2012; pp. 6753–6756. [Google Scholar] [CrossRef]
  49. Jiao, Z.; Michael, J.H.; Crystal, S.; Zhang, H.; Wang, Z.; Li, X. An Anisotropic Flat Index (AFX) to derive BRDF archetypes from MODIS. Remote Sens. Environ. 2014, 141, 168–187. [Google Scholar] [CrossRef]
  50. Jiao, Z.; Li, X.; Wang, J.; Zhang, H. Assessment of MODIS BRDF shape indicators. J. Remote Sens. 2011, 15, 432–456. [Google Scholar] [CrossRef]
  51. Sandmeier, S.R.; Muller, C.; Hosgood, B.; Andreoli, G. Physical Mechanisms in Hyperspectral BRDF Data of Grass and Watercress. Remote Sens. Environ. 1998, 66, 222–233. [Google Scholar] [CrossRef]
  52. Sandmeier, S.R.; Deering, D.W. Structure Analysis and Classification of Boreal Forest Using Airborne Hyperspectral BRDF Data from ASAS. Remote Sens. Environ. 1999, 69, 281–295. [Google Scholar] [CrossRef]
  53. Chen, J.M.; Menges, C.H.; Leblanc, S.G. Global mapping of foliage clumping index using multi-angular data. Remote Sens. Environ. 2005, 97, 447–457. [Google Scholar] [CrossRef]
  54. Friedl, M.A.; Sulla-Menashe, D.; Tan, B.; Schneider, A.; Ramankutty, N.; Sibley, A.M.; Huang, X. MODIS Collection 5 global land cover: Algorithm refinements and characterization of new datasets. Remote Sens. Environ. 2010, 114, 168–182. [Google Scholar] [CrossRef]
  55. Yang, J.; Shuai, Y.; Duan, J.; Xie, D.; Zhang, Q.; Zhao, R. Impact of BRDF Spatiotemporal Smoothing on Land Surface Albedo Estimation. Remote. Sens. 2022, 14, 2001. [Google Scholar] [CrossRef]
  56. Boryan, C.; Yang, Z.; Mueller, R.; Craig, M. Monitoring US agriculture: The US Department of Agriculture, National Agricultural Statistics Service, Cropland Data Layer Program. Geocarto Int. 2011, 26, 341–358. [Google Scholar] [CrossRef]
  57. Wickham, J.D.; Stehman, S.V.; Gass, L.; Dewitz, J.; Sorenson, D.G.; Granneman, B.; Poss, R.V.; Baer, L.A. Thematic accuracy assessment of the 2011 National Land cover Database (NLCD). Remote Sens. Environ. 2017, 191, 328–341. [Google Scholar] [CrossRef] [PubMed]
  58. Wolfe, R.; Roy, D.; Vermote, E. MODIS land data storage, gridding, and compositing methodology: Level 2 grid. IEEE Trans. Geosci. Remote Sens. 1998, 36, 1324–1338. [Google Scholar] [CrossRef]
  59. Yang, K.; Wolfe, R. MODIS level 2 grid with the ISIN map projection. In Proceedings of the IEEE 2001 International Geoscience and Remote Sensing Symposium, Sydney, Australia, 9–13 July 2001; pp. 3291–3293. [Google Scholar] [CrossRef]
  60. Gao, F. MODIS bidirectional reflectance distribution function and albedo Climate Modeling Grid products and the variability of albedo for major global vegetation types. J. Geophys. Res. Atmos. 2005, 110, D01104. [Google Scholar] [CrossRef] [Green Version]
  61. Wanner, W.; Li, X.; Strahler, A.H. On the derivation of kernels for kernel-driven models of bidirectional reflectance. J. Geophys. Res. Atmos. 1995, 100, 21077–21089. [Google Scholar] [CrossRef]
  62. Wanner, W.; Strahler, A.H.; Hu, B.; Lewis, P.; Muller, J.P.; Li, X.; Barker Schaaf, C.L.; Barnsley, M.J. Global retrieval of bidirectional reflectance and albedo over land from EOS MODIS and MISR data: Theory and algorithm. J. Geophys. Res. 1997, 102, 17143–17162. [Google Scholar] [CrossRef]
  63. Yan, G.J.; Jiang, H.L.; Yan, K.; Cheng, S.; Song, W.; Tong, Y.; Liu, Y.; Qi, J.; Mu, X.; Zhang, W.M.; et al. Review of optical multi-angle quantitative remote sensing. Natl. Remote Sens. Bull. 2021, 25, 83–108. [Google Scholar] [CrossRef]
  64. Chang, Y.X.; Jiao, Z.T.; Dong, Y.D.; Zhang, X.N.; He, D.D.; Yin, S.Y.; Cui, L.; Ding, A.X. Parameterization and correction of hotspot parameters of Ross-Li kernel driven models on POLDER dataset. J. Remote Sens. 2019, 23, 661–672. [Google Scholar] [CrossRef]
  65. Cui, L.; Jiao, Z.; Dong, Y.; Zhang, X.; Sun, M.; Yin, S.; Chang, Y.; He, D.; Ding, A. Forest Vertical Structure from MODIS BRDF Shape Indicators. In Proceedings of the IEEE International Geoscience and Remote Sensing Symposium, Valencia, Spain, 23 July 2018. [Google Scholar] [CrossRef]
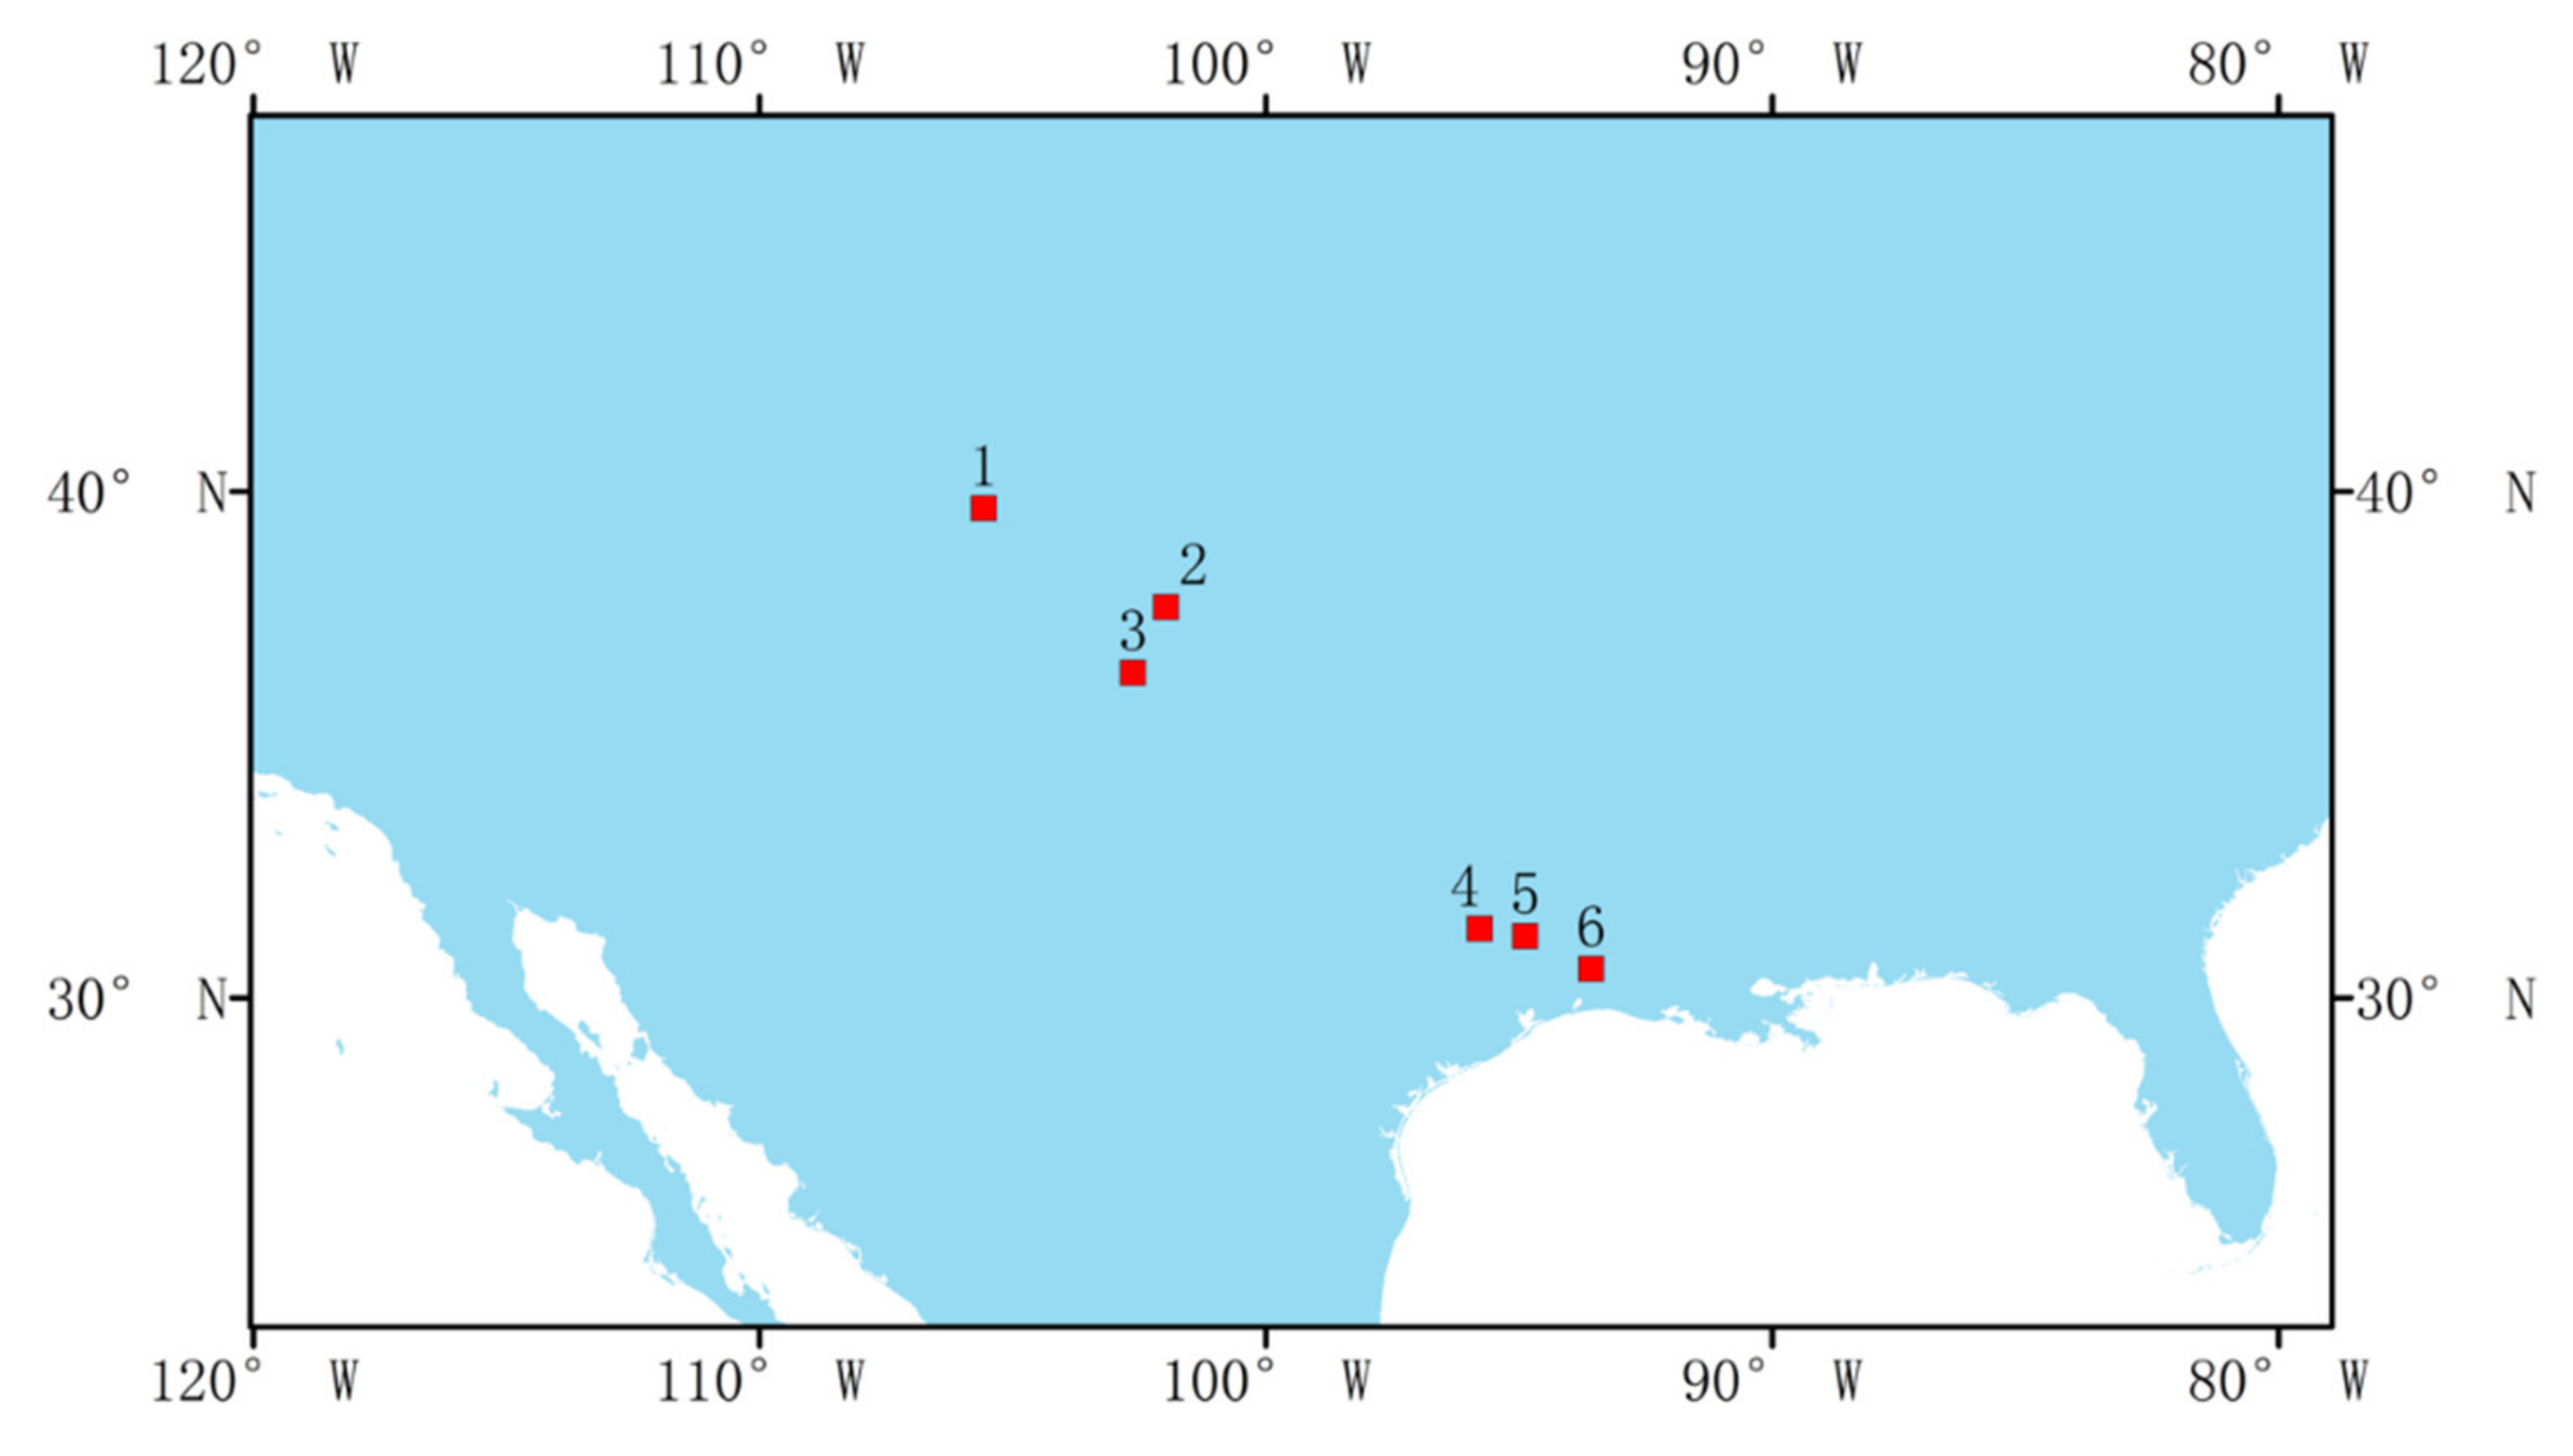
Figure 1. The geographical locations of study sites (Nos. 1–6 represent ENF, Cropland, Grassland, Savannas, DBF and EBF, respectively).
Sustainability 14 11883 g001
Figure 2. The schematic diagram of the selection of study sites. (The study site and neighbor pixels are type 1, which is the major type of 5600 m pixel).
Sustainability 14 11883 g002
Figure 3. The spatial distribution and incident−view geometry of BRDF. (a) Spatial distribution of BRDF; the BRDF parameters are from DOY205 of the Savanna site in the NIR band; (b) incident−view geometry of BRDF. VZA is View Zenith Angle, SAA is Solar Azimuth Angle, VAA is View Azimuth Angle, N is the north direction.
Sustainability 14 11883 g003
Figure 4. The workflow chart.
Sustainability 14 11883 g004
Figure 5. BRDF principal planes and characteristic directions. (a) BRDF principal plane with Bell shape, (b) BRDF principal plane with Bowl shape.
Sustainability 14 11883 g005
Figure 6. The BRDF principal planes based on simulated data. (a,b) The BRDF principal planes with Bell shapes; Bell 1 to Bell 5 correspond to the Data Modes 1 to 5 of Bell shapes in Table 1; (c,d) the BRDF principal planes with Bowl shapes; Bowl 1 to Bowl 5 correspond to the Data Modes 1 to 5 of the Bowl shapes in Table 1.
Sustainability 14 11883 g006
Figure 7. The temporal series of BRDF principal planes for DBF site: (al) the BRDF principal planes of DOY016, 045, 075, 105, 136, 166, 197, 228, 258, 289, 319, 349 in NIR, SW, VIS bands, respectively.
Sustainability 14 11883 g007
Figure 8. Statistics of representativeness for PAV. (a) The statistic of cosine similarity for DBF, (b) the statistic of cosine similarity for 6 selected sites.
Sustainability 14 11883 g008
Figure 9. Statistics of representativeness of AEV. (a) The statistic of representativeness for the DBF site; (b) the statistic of representativeness for the hot spot in AEV; (c) the statistic of representativeness for the zenith spot in AEV; (d) the statistic of representativeness for the approximate dark spot in AEV.
Sustainability 14 11883 g009
Figure 10. Statistics of the correlation between the hot spot component in AEV and AFX. (ac) the statistics for the DBF site in NIR, SW, VIS bands, respectively; the dotted line is the trend line. (d) The statistic of correlation for the six selected study sites.
Sustainability 14 11883 g010
Figure 11. Statistics of correlation coefficients between PAV and AFX.
Sustainability 14 11883 g011
Figure 12. The statistics of the correlation of hot spot components in AEV for the study sites. (ac) The correlation for pixels with various types in NIR, SW and VIS band, respectively; (d) the statistic of the correlation for pixels with the same types.
Sustainability 14 11883 g012
Figure 13. The proportion of categories in MODIS pixels (500 m) for cropland site and the adjacent pixels based on CDL (first three categories). (ai) the sample and line is the location of MODIS pixel in the Tile image.
Sustainability 14 11883 g013
Figure 14. Statistics of correlation coefficients between hot spot component in AEV and NDVI. (ac) The correlation curves of the three temporal scales for the selected sites in NIR, SW and VIS band, respectively; (d) the average correlation coefficients between BRDF’s shape and NDVI for the six selected sites at three temporal scales of annual, seasonal, monthly phases in NIR, SW and VIS band.
Sustainability 14 11883 g014
Figure 15. Statistic of coefficients of variations for hot spot components in AEV before and after land reclamation in mining area.
Sustainability 14 11883 g015
Table 1. Parameters of BRDF and their variation for typical shapes. (P1, P2 and P3 are the parameters for Isotropic kernel, Volumetric kernel and Geometric kernel, respectively).
ShapeParameterData Mode
12345
BellP10.2690.1970.3680.2690.269
P20.0020.0020.0020.0020.002
P30.0500.0500.0500.0800.110
BowlP10.2150.1970.3680.2150.215
P20.1570.1570.1570.2110.265
P30.0020.0020.0020.0020.002
Table 2. Comparison of shape indicators and vectors for two classical BRDF shapes.
ItemBellBowl
1234512345
AFX0.7450.6520.8140.5920.4381.1251.1371.0731.1731.220
ANIF1.2041.3431.1311.4722.1731.0331.0361.0191.0431.053
ANIX1.6852.1531.4402.5824.9341.3431.3771.1941.4621.587
F1(%/°)0.1510.1510.1510.2430.335−0.165−0.165−0.165−0.224−0.282
F2(%/°)−0.234−0.234−0.234−0.374−0.514−0.154−0.154−0.154−0.203−0.253
F3(%/°)−0.134−0.134−0.134−0.213−0.293−0.116−0.116−0.116−0.155−0.193
F4(%/°)−0.076−0.076−0.076−0.121−0.166−0.064−0.064−0.064−0.084−0.105
F5(%/°)−0.084−0.084−0.084−0.134−0.1850.0250.0250.0250.0340.044
F6(%/°)−0.261−0.261−0.261−0.418−0.5760.1980.1980.1980.2700.342
D1(°)158.214158.214158.214145.833134.295179.375179.375179.375178.885178.423
D2(°)176.730176.730176.730174.877173.137177.005177.005177.005176.045175.105
D3(°)170.185170.185170.185164.939160.507170.202170.202170.202166.856163.647
Publisher’s Note: MDPI stays neutral with regard to jurisdictional claims in published maps and institutional affiliations.