Article

Hydrogen Production from Surplus Electricity Generated by an Autonomous Renewable System: Scenario 2040 on Grand Canary Island, Spain

by
César Berna-Escriche
,
Carlos Vargas-Salgado
*,
David Alfonso-Solar
and
Alberto Escrivá-Castells
Instituto Universitario de Investigación en Ingeniería Energética, Universitat Politècnica de València (UPV), Camino de Vera 14, 46022 Valencia, Spain
*
Author to whom correspondence should be addressed.
Sustainability 2022, 14(19), 11884; https://doi.org/10.3390/su141911884
Submission received: 26 July 2022 / Revised: 2 September 2022 / Accepted: 14 September 2022 / Published: 21 September 2022
(This article belongs to the Special Issue Smartgrids and Microgrids Based on Renewable Sources)

Abstract

:
The electrification of final energy uses is a key strategy to reach the desired scenario with zero greenhouse gas emissions. Many of them can be electrified with more or less difficulty, but there is a part that is difficult to electrify at a competitive cost: heavy road transport, maritime and air transport, and some industrial processes are some examples. For this reason, the possibility of using other energy vectors rather than electricity should be explored. Hydrogen can be considered a real alternative, especially considering that this transition should not be carried out immediately because, initially, the electrification would be carried out in those energy uses that are considered most feasible for this conversion. The Canary Islands’ government is making considerable efforts to promote a carbon-free energy mix, starting with renewable energy for electricity generation. Still, in the early–mid 2030s, it will be necessary to substitute heavy transport fossil fuel. For this purpose, HOMER software was used to analyze the feasibility of hydrogen production using surplus electricity produced by the future electricity system. The results of previous research on the optimal generation MIX for Grand Canary Island, based exclusively on renewable sources, were used. This previous research considers three possible scenarios where electricity surplus is in the range of 2.3–4.9 TWh/year. Several optimized scenarios using demand-side management techniques were also studied. Therefore, based on the electricity surpluses of these scenarios, the optimization of hydrogen production and storage systems was carried out, always covering at least the final hydrogen demand of the island. As a result, it is concluded that it would be possible to produce 3.5 × 10⁴ to 7.68 × 10⁴ t of H2/year. In these scenarios, 3.15 × 10⁵ to 6.91 × 10⁵ t of water per year would be required, and there could be a potential production of 2.8 × 10⁵ to 6.14 × 10⁵ t of O2 per year.

1. Introduction

Over the last two centuries, the continuous growth of the human population along with its energy needs has posed considerable challenges. Remarkably, the continued increase in fossil fuels used for energy consumption is leading to a disproportionate emission of greenhouse gases [1]. If this trend is to be halted, all energy generation must be renewable. Following this path, the European Union and Spain are intensifying their efforts to decarbonize the economy, accelerating their plans to boost the energy transition and placing it at the top of the political agenda, including in the post-COVID-19 context, as an economic stimulus [2,3]. In the last decades, there have been important advances in the development of renewable energy sources, mainly solar photovoltaic and wind power. These energies are of particular interest to reduce greenhouse gas emissions and consequently reduce the impact of climate change on our planet. The total electrification of all energy consumption is the most widely extended option to reach a zero greenhouse gas emission scenario [4]. Since electricity is today’s almost unique energy carrier, it allows energy to be transported from power production plants to user consumption through the electricity grid, although it is difficult to store, which presents serious challenges.
The storage of electricity has to be carried out with other systems; nowadays, only pumping storage and batteries are mature enough technologies [5]. However, currently, there is an insufficient capacity for electricity storage (less than 5%), a drawback that implies that generation and consumption must be synchronized. This means that generation plants must be switched on and off according to consumption forecasts, which must also be constantly updated. This strategy applies if the generation is highly reliable, as with most fossil fuel technologies. But if wind and solar photovoltaic energies are used massively, due to their variability [6], the current strategy would not be adequate, and the current storage capacity would have to be strongly increased [7].
As previously mentioned, the massive implementation of renewable energy production plants requires a huge deployment of the previously mentioned storage systems and/or the development of new forms because of their intermittent nature. However, even with this large storage capacity, there will be periods when excess generation will occur [4]. So, this proportion of wasted energy, together with an appreciable part of the final energy consumption that is hardly electrifiable, makes it possible to use another energy vector to store these excesses and then be used in these hardly electrifiable uses. In particular, some transport (e.g., heavy vehicles, maritime, and aviation) and certain industrial processes are uses that are difficult to electrify. Hydrogen could be used in these sectors, although a significant reduction in its production, transport, and storage costs is required [8,9,10]. In any case, decisions on the technology that should support this last part of final energy consumption will not be made until at least the beginning of the 2030s. They will have to be made depending on the technological development and economic viability of the different options available, although there is currently a solid commitment to hydrogen [11,12].
On the other side, molecular hydrogen (H2) is a fuel that, when combined with oxygen, generates a large amount of energy (120 MJ/kg), and the only residue is water [13]. However, hydrogen must be produced from other compounds, using a certain amount of energy, because it is not present as hydrogen deposits. This energy is stored in the form of chemical bonds in the hydrogen molecule, and part of them can be recovered later by combustion. Then, another possibility could be the use of hydrogen as an energy carrier instead of electricity. First, the energy to be stored, which comes from the energy surpluses of renewable power plants, could be used to decompose water molecules in oxygen and hydrogen molecules. In this way, a part of this energy is stored in the chemical bonds in newly formed chemical bonds. Once these two gases have been separated, the oxygen can be sent directly to the atmosphere or recovered for other applications. At the same time, the hydrogen must be stored adequately for later transport and/or used later. This storage process may require a prior gas compression or liquefaction, or it may be done directly, depending on the storage method used.
One of the advantages of this hydrogen–water energy cycle is that water is a very abundant raw material, which makes it susceptible to accumulating large amounts of energy with a very low environmental impact. In addition, the technology on which the various components of the hydrogen cycle are based is quite mature; for instance, electrolyzers, separators, accumulators, fuel cells, etc. are well-known devices [13]. However, their large-scale implementation requires new developments in materials science since each process uses specific materials with well-defined properties. Nowadays, most of these processes have relatively high efficiencies. Still, the main problem lies in the cost of the materials since, in many cases, noble materials are used (such as Pt, Pd, etc.). Therefore, one of the main objectives at present is the research into new devices based on abundant and cheap materials with high efficiencies in the hydrogen generation cycle to make hydrogen economically competitive. Another possible way is to generate hydrogen through biophotolysis (dark fermentation and photofermentation) and microbial electrolysis cells [14].
Once hydrogen has been produced, it must be stored. Unlike in other systems where energy is often stored in the form of liquid or solid fuels (gasoline, coal, etc.), hydrogen is a gas under normal conditions of pressure and temperature. Therefore, its accumulation poses challenges closely related to the increase in its energy density per unit volume and its safety [15]. Thus, the accumulation of 1 kg of hydrogen implies, by various means, a drastic reduction in the large volume it occupies, from around 11 m3 as a gas at 25 °C and 1 bar. This reduction must also maintain certain safety and economic requirements depending on the application in which it will be used. One option may be its accumulation in reservoirs under high pressures (up to pressures of about 1000 bar), allowing volumetric density values of 50 kgH2/m3 to be achieved. A second option is its accumulation in the liquid state; then, it is necessary to keep the hydrogen inside reservoirs at a temperature below −251 °C. Under these circumstances, the volumetric capacity is higher than that obtained at a high pressure (about 75 kgH2/m3). However, the high energy costs of the hydrogen liquefaction process and the need to thermally insulate the cylinders to avoid evaporation drastically restrict its use to those systems where the cost of hydrogen is not important and where it is consumed in not a very long period of time. There is a third method to store molecular hydrogen, through the phenomenon of physisorption, consisting of taking advantage of the interaction between the atoms on the surface of the solid and the hydrogen molecules (employing Van der Waals forces) that lead to H2 molecules being adsorbed on its surface [16]. In this field, research is focused on materials, such as carbon nanotubes, zeolites, or porous organometallic compounds (MOFs), which have volumetric capacities similar to those shown by the accumulation in the liquid state and stored between 5 and 10 wt% of hydrogen. Their main problem is that, due to the very weak nature of the chemical bond (1–10 kJ/mol), it is only possible to achieve these accumulation values using moderately high pressures (above 100 bar) and low temperatures (below −173 °C) posing cost and handling problems, which means that this accumulation method is still in the basic research phase. There is another way to accumulate hydrogen, in the form of atomic hydrogen, also called solid-state accumulation, for which hydrogen is stored inside a metal or metal alloy (ABHx). Depending on the metals used, there are problems of stability, reaction kinetics, existence of several stages in the reaction, etc., so, all of them have some drawbacks. The conclusion is that there are several methods of H2 storage, but all of them have reduced efficiency in the process of storage and subsequent energy transfer, which leads to roundtrip efficiencies in the order of 10–20%.
Consequently, one alternative focuses on solving these problems intrinsic to the production, storage, and distribution of hydrogen, but in recent years, another possible candidate as an energy vector is emerging, ammonia, since its storage and distribution is much simpler (relatively high energy density with simple storage requirements) [17]. This green ammonia could be produced from the hydrogen previously obtained through water electrolysis, air, and sustainable electricity [18]. The first steps towards a large-scale green ammonia supply chain are being driven by the decarbonization of ammonia production in the fertilizer sector [19], in parallel to which studies are being carried out for emerging energy uses, such as shipping [20] and heavy-duty vehicles [18]. The feasibility of green ammonia production on an industrial scale is currently being evaluated in several countries, such as Australia, New Zealand, Norway, Chile, and Saudi Arabia [17]. Currently, ammonia roundtrip efficiency is also around 10–20%, but with the inherent benefits of being a liquid fuel.
Then, with the previously described objectives, the paper is structured in the following way: Section 2 provides information on the possible future generation–demand balance; Section 3 describes the renewable generation system and the estimations of the energy generation by 2040 and the excess of energy produced by such a system, while Section 4 explains the applied methodology. Section 5 comments on the analyzed scenarios; Section 6 describes the inputs required by the simulation; Section 7 comments on the results, and finally Section 8 is dedicated to the discussion and conclusions of the present study.

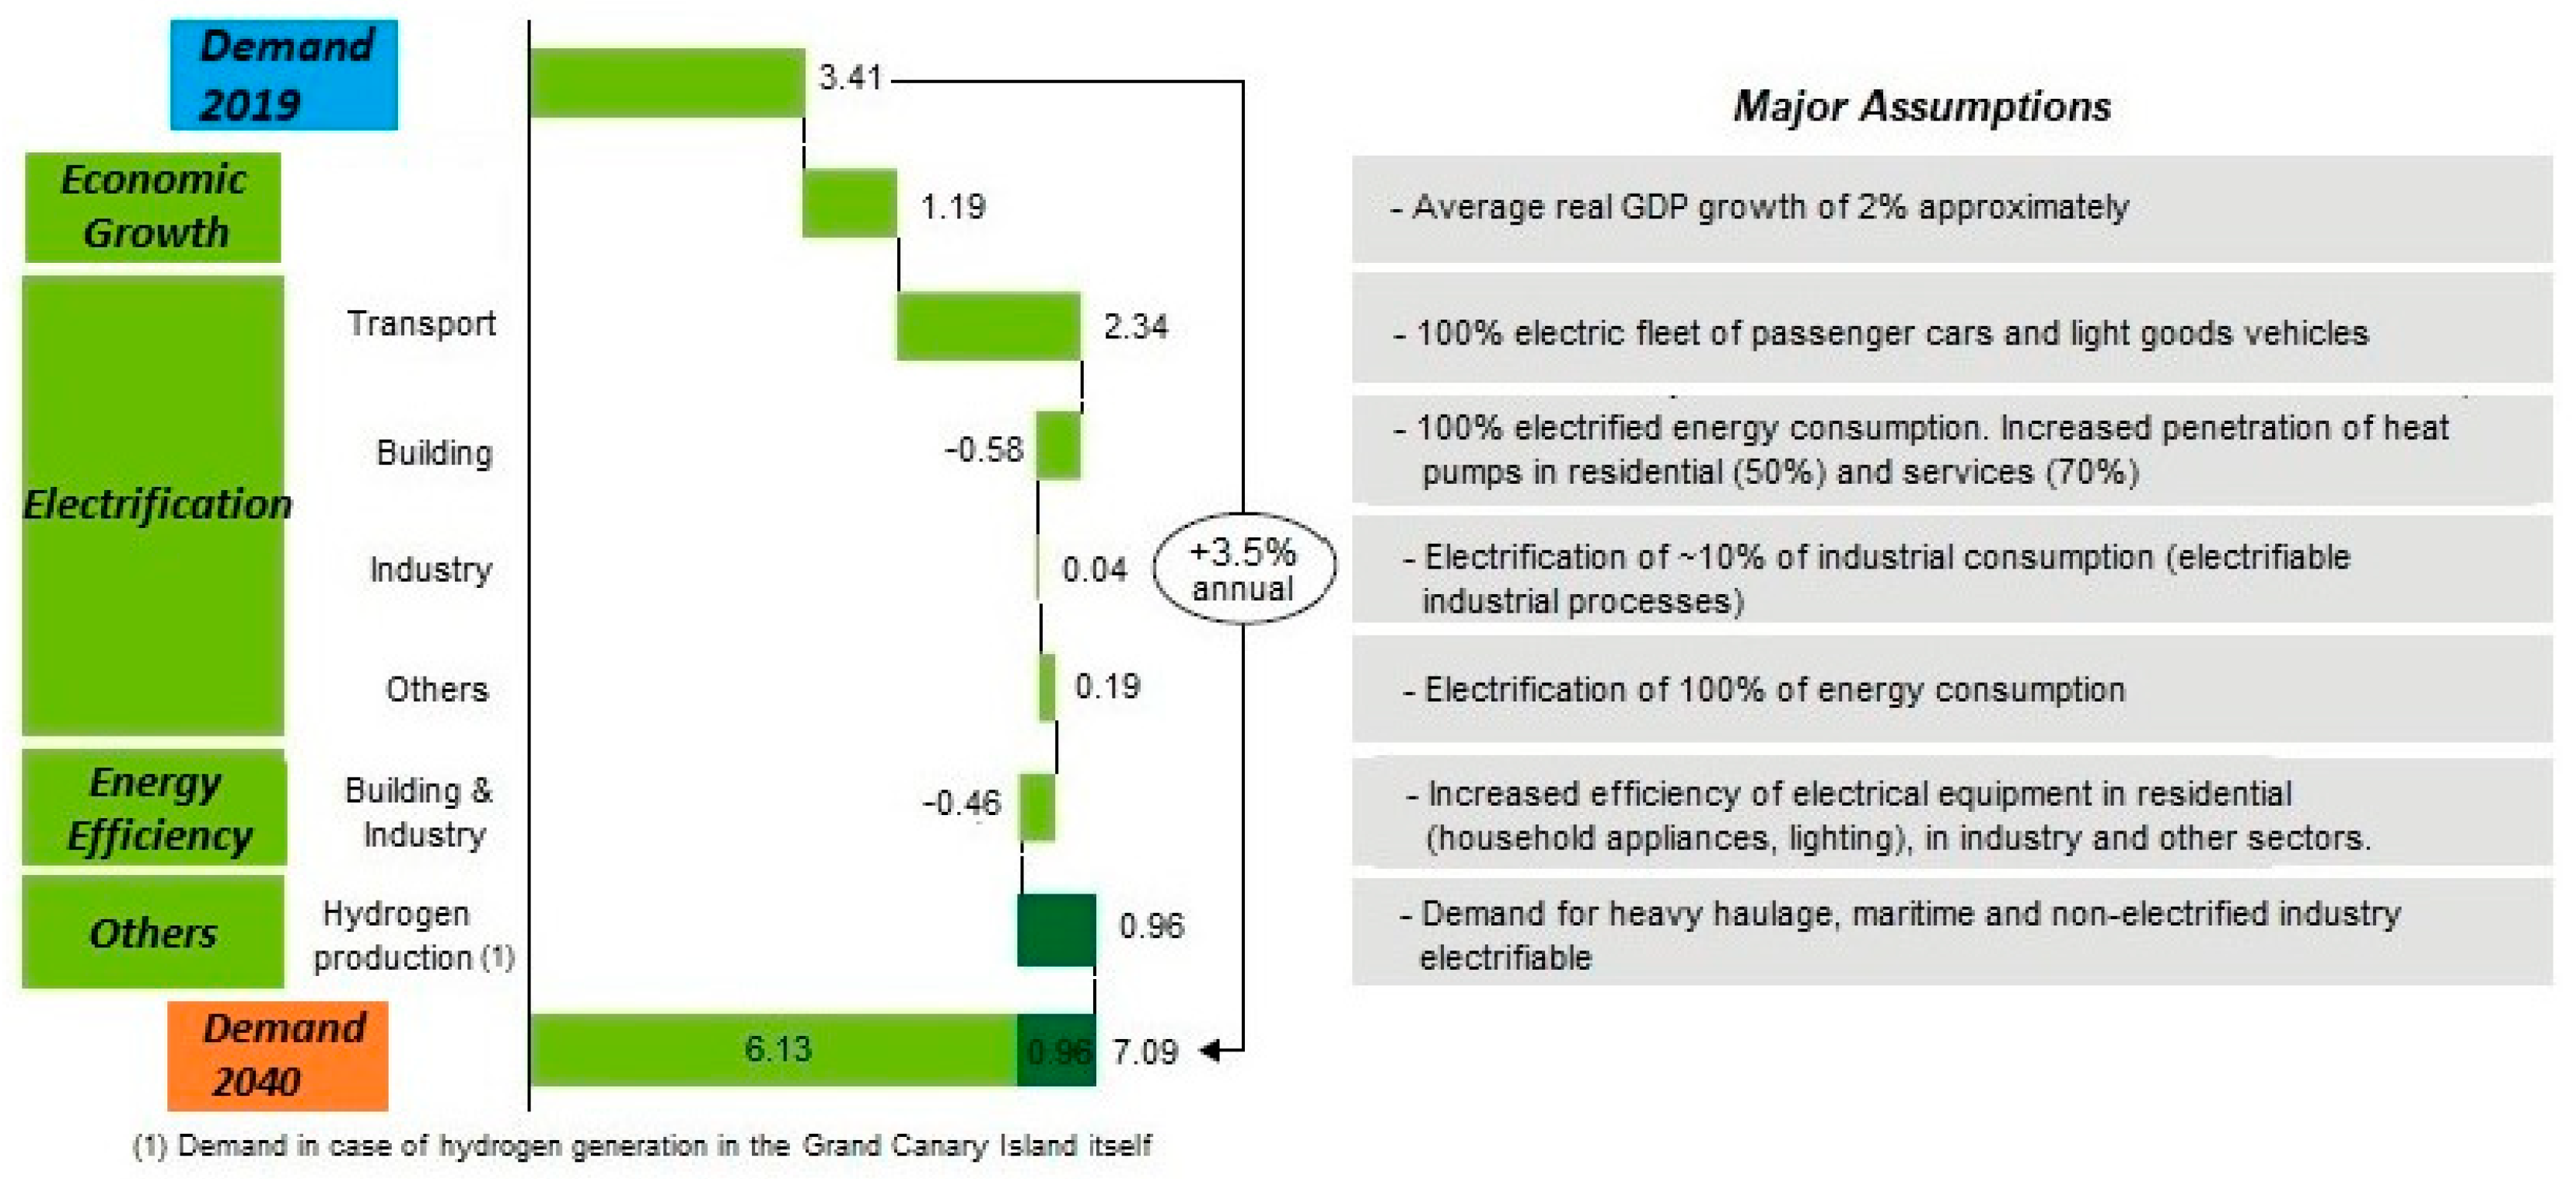
2. Future Generation–Demand Balance

The total decarbonization of the European Union economy must be a fact by 2050. Full electrification of energy consumption is included in the decarbonization plan. Spain must assume this important challenge and want to go further in its island territories. The Government of the Canary Islands wants to have its economy decarbonized by 2040. To this end, these territories must implement an ecological transition and a decarbonized energy system, which implies a total penetration of renewable energies and a substantial increase in storage capacity, to manage the inevitable energy surpluses caused by the inherent variability of renewable energies [21]. Within this strategy to promote renewable energies, the Canary Islands’ government has developed three scenarios: to encourage self-consumption, increase storage capacity, and use electric vehicles. The entire Canary Islands Archipelago is working on the necessary strategy to reduce its strong dependence on fossil fuels so that by 2040 this dependence will be zero. Focusing the problem on the island of Gran Canaria, around 85% of the total installed power is nonrenewable, with more than 90% of its electricity generation coming from fossil fuels. However, all the Canary Islands have immense possibilities to favor renewable energies due to their abundant natural resources, the sun and the wind. To achieve this scenario of decarbonization of the economy, the Government of the Canary Islands has a clear strategy [22]. Therefore, the vast natural resources on the islands must be exploited. Still, this harnessing is not enough, as it must be accompanied by a great capacity to manage these resources with such a large inherent variability, which implies the extensive use of storage systems to support them.
Along these lines, in general, the total electrification of the different energy consumptions of the islands would be the desired scenario for the nearest possible future. Of course, the use of fossil fuels in their generation should be avoided at all costs. However, the step from an energy generation system almost entirely based on fossil fuels to one based on renewable energies, and with total electrification of the final energy consumption, is a significant leap. This scenario entails an enormous increase in electricity demand, mainly due to the electrification of transport, specifically on Gran Canaria, from the current 3.5 TWh per year to almost double (estimates of the Government of the Canary Islands [23]).
Since full electrification is not a realistic objective in several sectors, total electrification of energy consumption would not be sufficient to reach zero greenhouse gas emissions. For instance, heavy land transport, maritime transport, air transport, and some processes in the industry sector are not electrifiable, or their electrification would involve major challenges, with consequent unavoidable costs. Consequently, other possibilities must be explored, and, as discussed in depth later, hydrogen is the most consolidated option to cover these “non-electrifiable” consumptions at present.

3. The Renewable Generation

The solar resource on Grand Canary Island could be an essential electric generation source. The Canary Archipelago has the highest insolation in Spain, so its weight in a fully renewable system should be increased. The island’s available sun energy can be forecasted from the European photovoltaic geographical information system (PVGIS) [24]. In the case of Grand Canary Island, this energy represents a potential global horizontal irradiance of more than 1800 ESH/year (equivalent sun hours), a value that can be increased up to around 2500 ESH/year by the use of solar trackers on the photovoltaic panels. These data will be used assuming that this irradiation is maintained throughout the time period analyzed in this study.
The wind resource on Grand Canary Island is as necessary as the solar resource. This wind resource can be estimated using the global wind data of the second Modern-Era Retrospective analysis for Research and Applications (MERRA-2), which was developed by NASA [25]. If Gran Canaria is studied, there are many suitable locations for installing wind generators, both onshore and offshore. The appropriate sites available on the island’s east and southeast, especially between 3 and 10 km from the coast, are of particular interest.

3.1. The Centralized Storage Systems

Two possible technologies are currently candidates to participate in large generation/storage systems: pumping storage and battery systems [5]. A reversible pumped storage hydropower station is planned for commissioning between 2026 and 2027. This Chira-Soria plant is expected to have an electric generation power of 200 MW and a storage capacity of around 3.2–3.6 GWh, which means that the system would be capable of working up to 16 h at total capacity. The project consists of constructing the plant and the seawater desalination plan. The construction work and the required facilities for its connection to the transport network mean a budget of EUR 400 M. Reverse-pumped storage stations are by far the most commonly used form of electric power storage, representing about 95% of all storage facilities in the world. The energy efficiency of the complete cycle (pumping plus turbining) varies from 70% to 85%, depending on the facility [26,27].
Furthermore, not only is the construction of this power plant planned, but at least another almost identical facility, the Las Niñas-Soria pumping station, is also planned. In addition, several other alternatives could house pumped storage plants, for example, the Parralillo-Siberio and El Parralillo-El Caidero de las Niñas plants, with power capacities of around 40 MWh and storage energy capacities of 700 and 625 MWh, respectively. In total, no less than 10 more reverse storage facilities are considered viable on the island of Gran Canaria, with a cumulative power capacity of just over 600 MW and a total stored energy of approximately 10 GWh [28].

3.2. The Full Electrification of the Final Energy Consumptions

The historical data for the island of Gran Canaria indicate that there have not been major changes in the demand curves over the past decade [29]. But when facing the total decarbonization of the whole energy system, which would represent a significant change, the present generation and demand profiles would change. Under the described scenario, it would not be enough to decarbonize the electricity generation; instead, the whole economic system (industry, transport, households, services, etc.) would have to be decarbonized. Therefore, it would imply a remarkable increase in the demand, not only in the total values but also in the hourly demand profiles. In addition, if renewable energies are used as the only generation source, there will be an additional problem: the generation–demand mismatch, making managing the current problem extremely complicated. Therefore, to cover this significant increase in demand and address the problems of decoupling between generation and demand, a solid commitment to renewable energies is necessary, together with the installation of large storage capacities. However, it would require developing several measures to implement significant changes in various aspects concerning generation and demand management.
This transition towards a fully renewable generation system and total electrification of energy consumption must be carried out gradually. This transition must be achieved with a clear commitment to this approach over relatively long periods and implemented in several stages. Obviously, in order to reach these challenging objectives, a number of steps need to be taken, the foremost of which would be the creation of a general legislative framework for energy transition planning, with the establishment of energy transition plans and climate change laws, so that this general legal framework can be applied in each region; in particular, the listed measures should be implemented: transport planning of electricity penetration in passenger transport; stimulate electric vehicles in both private and business sectors; provide the necessary charging infrastructures for the increasing electric transport; favor the replacement of old thermal equipment for DHW (Domestic Hot Water) and the use of heat pumps for air conditioning in the hotel sector; create corporate tax reductions for investments aligned with the energy transition; favor renewable generation with the elimination of administrative obstacles and/or simplification of the administrative procedures, providing legal and juridical guarantees to accelerate investments, etc.; favor the deployment of storage and demand response systems; adapt electricity tariffs to promote electrification and to shift demand to the most appropriate hours; or any other measures that can help to carry out the unavoidable change to clean energies.
The electrification of all end-use energy consumption by the year 2040 will significantly increase demand; a detailed view of the major contributions to the electric demand is displayed in Figure 1 (considered assumptions can be consulted in references [4,21]). The total investment needed to meet this demand forecast is between 18 and 22 thousand million euros [21], which was carried out for the whole Canary Archipelago.
Therefore, assuming that the present ratio between Gran Canaria’s consumption and that of the whole Archipelago (slightly less than 40%) is preserved, it would imply that of the 16.1 TWh/year of the whole Archipelago’s consumption predicted for 2040 (without taking into account the production of hydrogen necessary to supply “non-electrifiable” energy end-uses), the island would demand approximately 6.4 TWh/year. These figures are similar to the estimates made by the Government of the Canary Islands [23]. The estimates are based on the current stabilized consumption (From 2010 it has remained stable, except for the drop caused by the COVID-19 pandemic), adding the estimated increase in consumption for electric vehicles and the other minor contributions shown in the figure, leading to an increase from almost 3.5 TWh per year in 2019 to around 6.5 TWh per year by 2040.
As shown in the figure, transport is responsible for most of this increase in electric energy consumption, with passenger transport being the main contributor by far. According to the study of the Canary Islands’ Government focused on the strategies for the implementation of electric vehicles on the islands [23] and also extrapolating the transport contribution from the whole Canary Archipelago to Grand Canary Island (Figure 1), forecasts of the increase in electricity consumption of about 2.2 TWh per year will be reached. The investment in recharging points to supply the fleet of electric vehicles is around EUR 1250 M; which would be the most significant investment to be made, in addition to the installation of renewable generation sources to cover this considerable increase in demand.
The hourly demand forecast will change due to the high electric car fleet. According to the type of recharging point used, the consumption pattern is different (private homes, workplaces, shopping centers, service stations, etc.) [23]. The final demand curve is the aggregation of all these different demand curves. Figure 2 displays the aggregate hourly demand forecasting profile of the island of Gran Canaria by 2040 [23]. As shown in the figure, a significant increase in demand during nighttime compared to the current one occurs and flattens the demand curve. In principle, this flattened curve would be favorable for the management of the electricity system. However, if solar photovoltaic generation is significant, the generation curve sharpens during the middle of the day, and, as a consequence, a substantial generation–demand gap is shown. This must be reduced as much as reasonably possible; how to solve this drawback will be discussed in later sections.

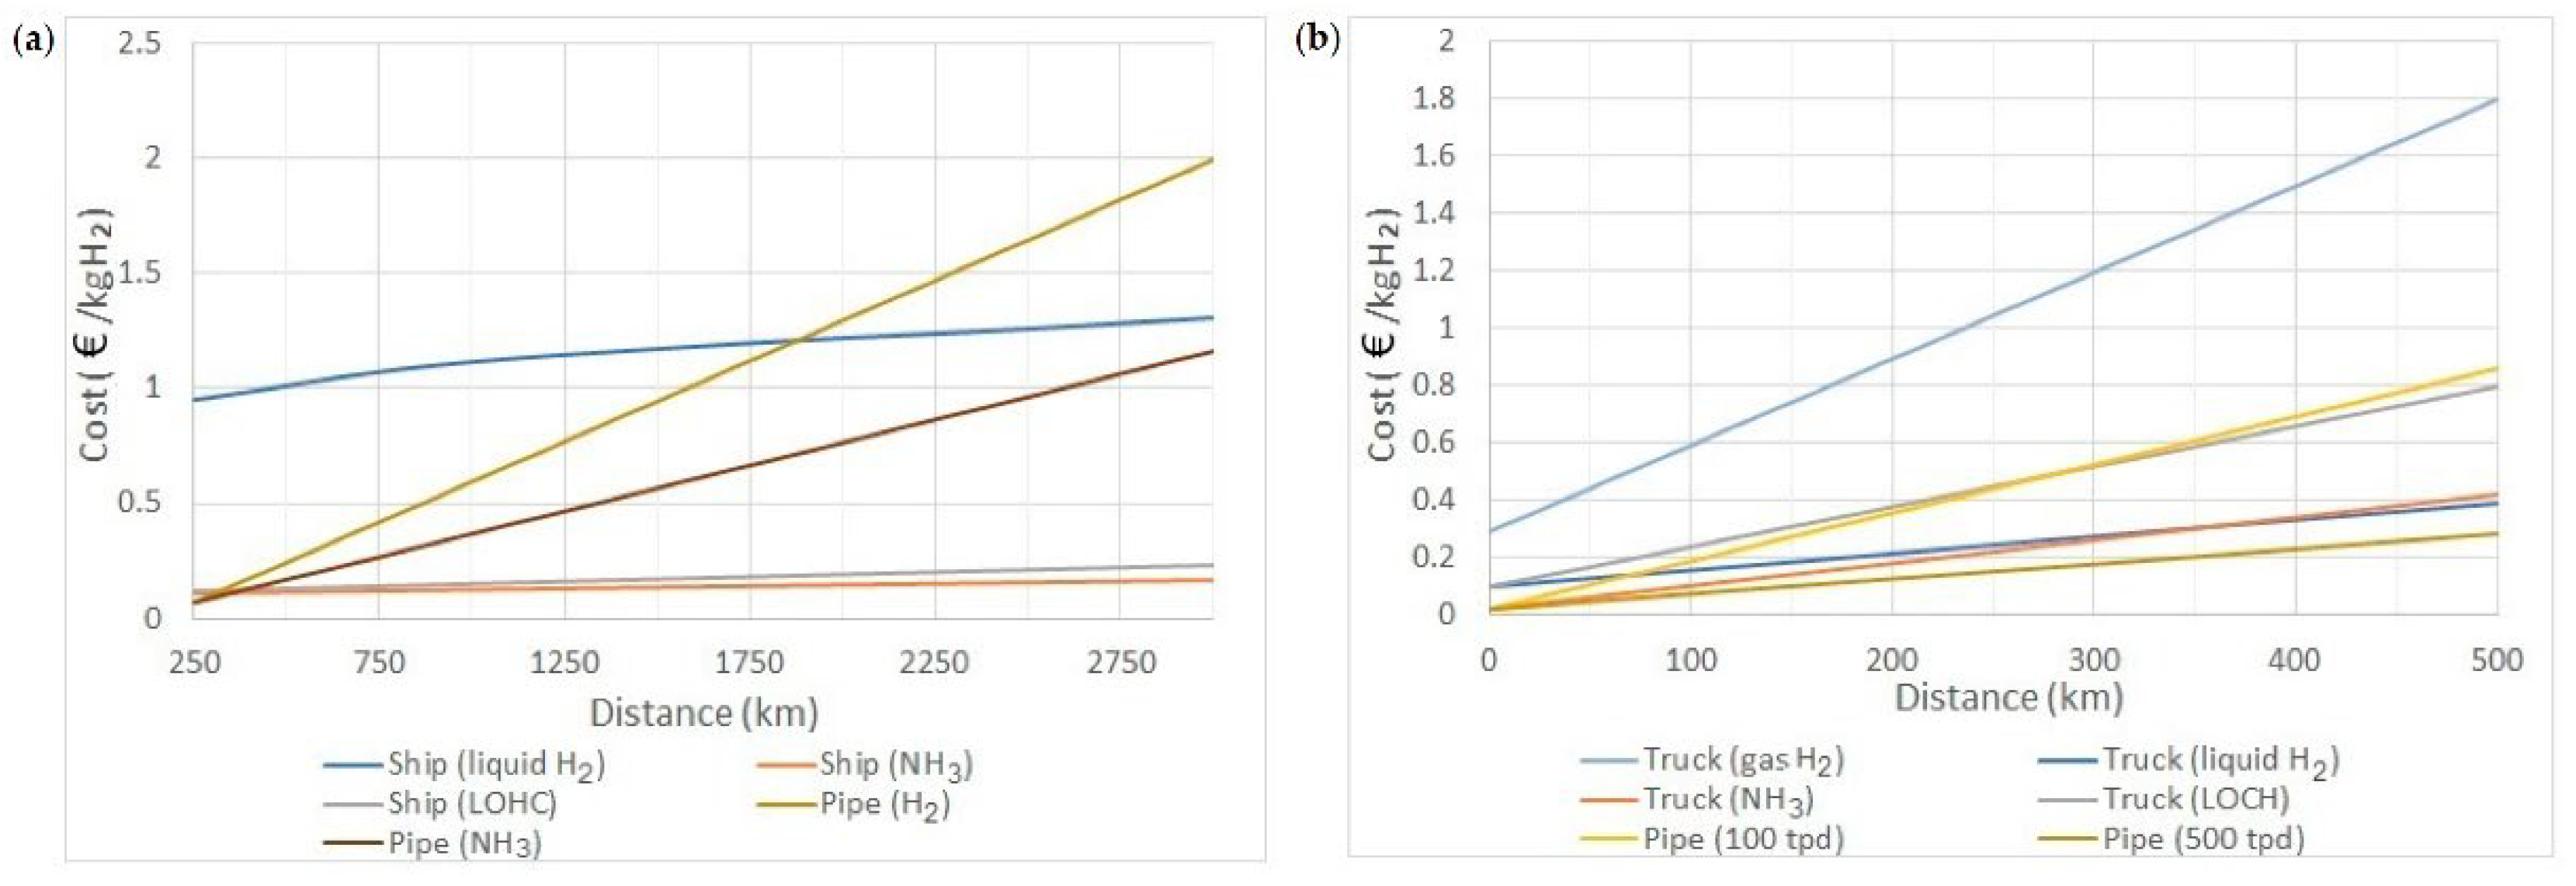
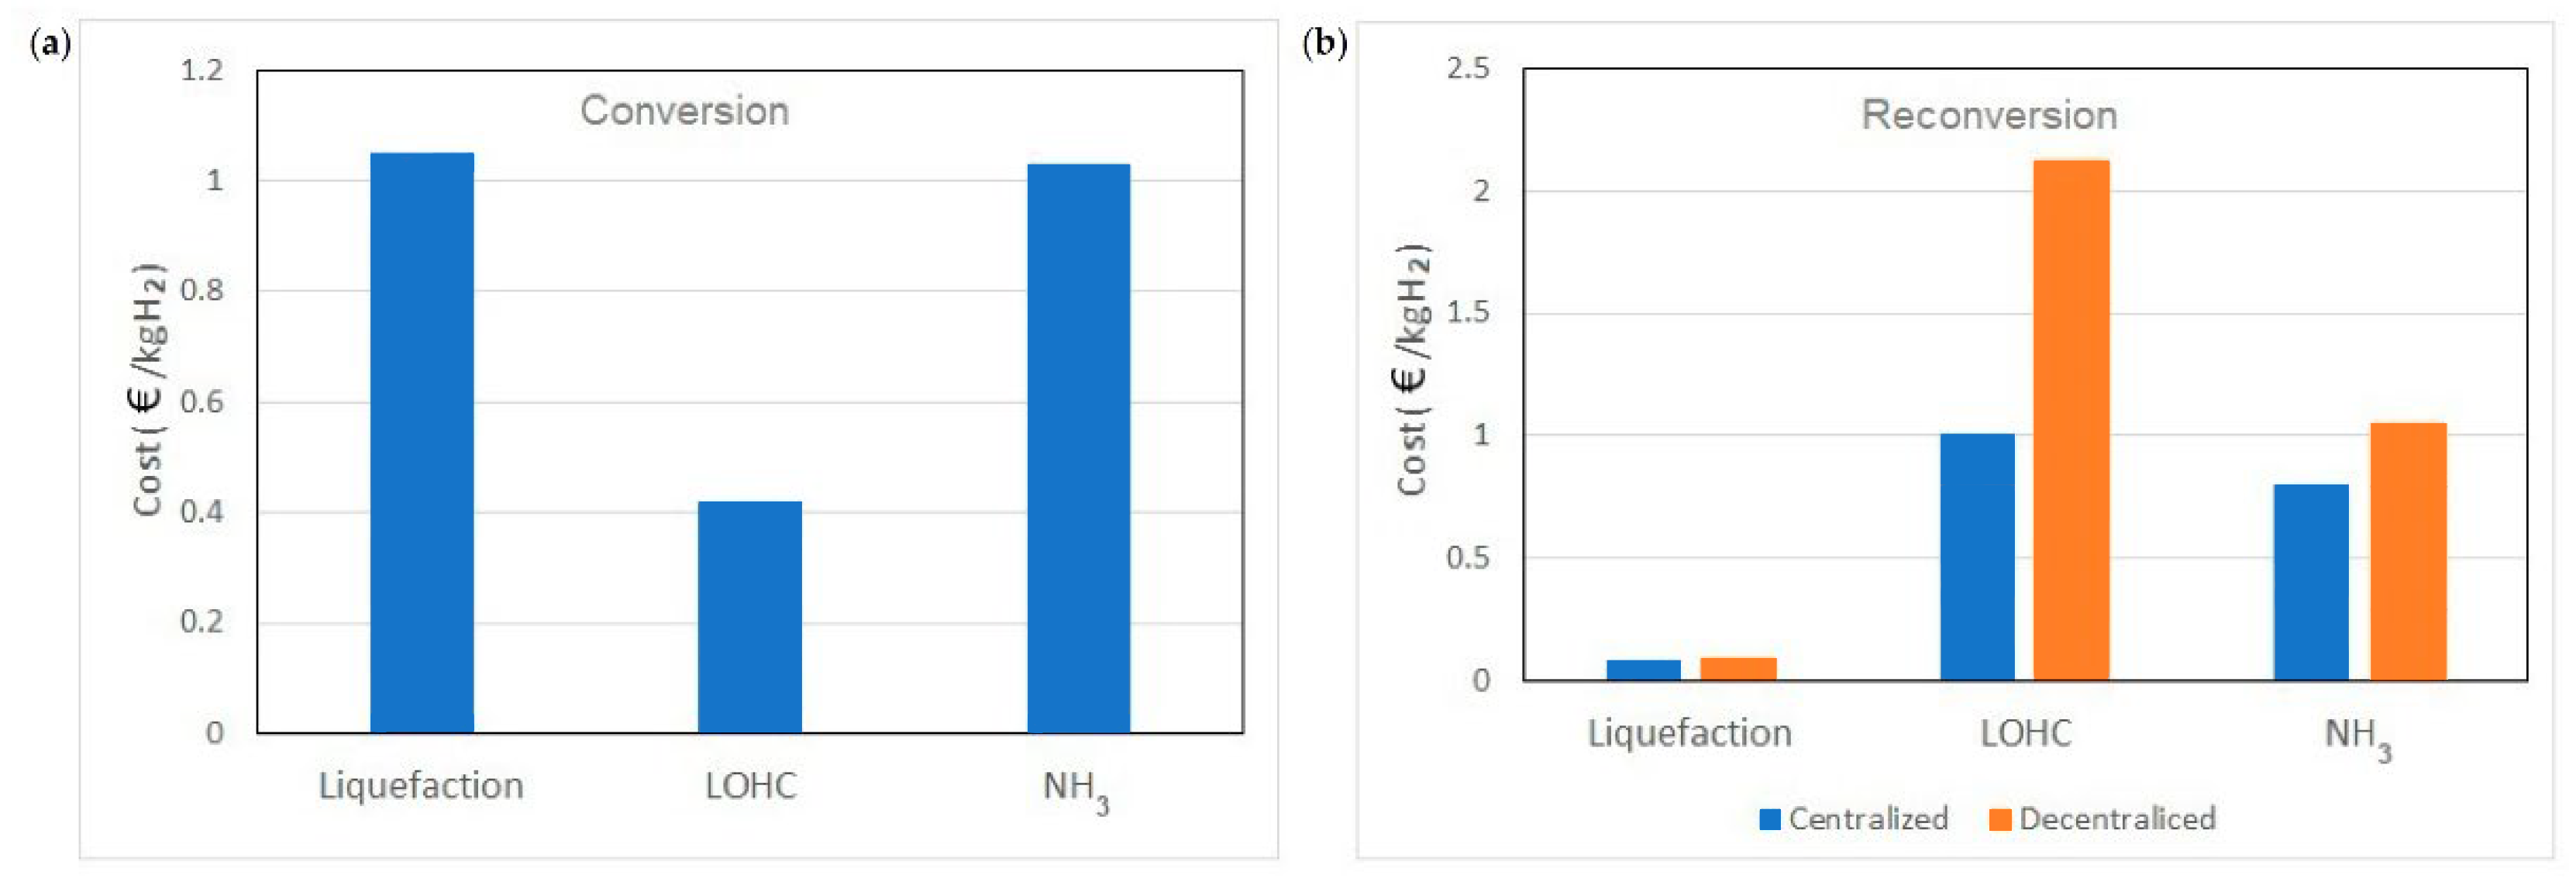
3.3. Hydrogen or Ammonia as Energy Vectors

Analyzing the information provided in Figure 1 for the whole Canary Archipelago, considering a scenario of total electrification of the economy, several contributions will shape the final energy demand for the year 2040. According to the Deloitte and Endesa report [21], there will be an increase in electricity consumption (due to the economy’s growth and population and another due to the electrification of the economy). There will also be another contribution, negative in this case, due to the implementation of efficiency measures and, finally, the other category. In this last category are those energy consumptions that are “non-electrifiable”, so the report’s authors propose using hydrogen as a possible energy vector to cover these consumptions. These “non-electrifiable” energy end-consumptions come mainly from transport (heavy-duty vehicles, marine, and aviation) and some industrial sectors [8,9,10].
The technologies for the complete decarbonization of heavy road transport do not present a single feasible solution, such as the electric or hydrogen fuel cell truck, although both still have a relatively low degree of maturity. For example, some pilot projects on the usage of these technologies, such as the electric Tesla Semi or the Hydrogen Nikola One and Two, have taken place over the last few years, but significant commercialization of electric and hydrogen trucks is not expected until 2025, nor are they expected to be cost-competitive until after 2030, according to leading industry analysts. In this analysis, based on the results provided in previous research [4], it has been considered that hydrogen as an energy source for heavy-duty vehicles will eventually prevail, or at least the combined use of electricity and hydrogen.
In interisland maritime transport, there is the possibility of electrifying those routes with a fixed route between two ports with a distance of approximately less than 100 km. There are already some international examples (Norway, Denmark, Canada, and Malta) of ferries that operate regularly with this technology, combined with the existence of many ambitious projects, such as the “Europa Seaways” ferry, which is planned to be powered by a 23 MW fuel cell and will connect Copenhagen to Oslo in a roughly 48 h long roundtrip [30]. On the Canary Islands, fewer than 100 km distance ferry journeys account for 85% of all interisland ferry journeys. Therefore, these lines could potentially be electrified with current technology. However, investments for their adaptation, both in the electric vessels themselves and in the recharging infrastructure at the ports, still need to be developed. The profitability for shipowners developing this technology will still require a reduction in battery costs or other supporting measures. But, decarbonization must rely on other technology options for ships that cover other types of longer sea voyages or require greater flexibility (i.e., that do not have a fixed port of departure and destination). Natural gas is already a viable option in those ports where such fuel is accessible, achieving a reduction in emissions compared to the fuels used today, which is a suitable option during the transition period to a green economy. Therefore, hydrogen can provide a completely emission-free solution in the longer term, at least on these longer distances and/or more flexible routes.
Interisland air transport does not have nonemitting solutions available in the short to medium term due to the more significant technical limitations, centered above all on the higher power-to-weight ratio required for this use, and therefore especially conditioned by the restrictions related to the weight of the batteries in the case of electric aircraft and to the weight of the fuel tank in the case of hydrogen aircraft. However, in the long term, hydrogen is likely to offer a real option of applicability in this sector.
Significant quantities of hydrogen are currently produced, but almost all of it is produced from fossil fuels, so large amounts of CO2 are emitted in the process. However, hydrogen can be made by water electrolysis from electricity generated through renewable sources. Then, this hydrogen is called “green hydrogen”. Figure 3 displays a “green hydrogen” production, storage, distribution, and consumption diagram. In the current study, the electricity surpluses have been used to produce H2, so the island could be self-sufficient and greenhouse-gas-neutral. The H2 production would be maximized in different scenarios and compared to the forecasted H2 demand, demonstrating the capacity to generate the needed quantity.
The efficiencies of current commercial options of electrolyzers (particularly Alkaline Electrolysis/AEL and Proton Exchange Membrane/PEM systems) are around 60%, with relative low degradations and high lifetimes (degradation of 1.5 and 2.5% per year and lifetimes between 55–120 and 60–100 thousand hours of operation, respectively), which means 10–15 years of operation [31]. Regarding estimations of the costs of hydrogen generated from renewable electricity, those are approximately between USD$ 1.5 and USD% 6/kgH2 depending on the part of the world. For Europe, in the long term, costs are expected to reduce to around USD 3/kgH2 [32]. By 2050, the minimum production costs for hydrogen from renewable energy sources could fall to USD 1.5/kg and below USD 1/kg under optimistic assumptions in some regions [33].
Currently, several projects at the European and Spanish levels are developing for the generation and use of green hydrogen. For example, Iberdrola is presently working on the start-up of its Puertollano plant [34], consisting of a 100 MW solar photovoltaic plant, a lithium-ion battery system with a storage capacity of 20 MWh, and a 20 MW hydrogen production system through electrolysis. Enagas and Naturgy are studying the production of green hydrogen from 350 MW of wind energy in Asturias [35]. This project is contemplating the production of green hydrogen from a 250 MW offshore wind farm and a 100 MW onshore wind farm for consumption by the Asturian industry, thus decarbonizing sectors, such as steel and shipyards. It is also planned that this hydrogen will be distributed on a large scale through the gas network and exported to Europe. Acciona and Enagás, together with Cemex, Redexis, the Institute for Energy Diversification and Saving (IDAE), and the Balearic Government, are promoting the project “Power to Green Hydrogen Mallorca” [36], which includes the construction of an electrolysis plant, the development of two photovoltaic plants that feed it, and a green hydrogen service station on the island. The solar installations located in the municipalities of Lloseta and Petra will have 6.9 MW and 6.5 MW of power, respectively. Both will produce the renewable energy needed for the green hydrogen plant, generating and distributing more than 300 tons of H2 per year. This green hydrogen is expected to drive the decarbonization of the islands, specifically its use in public bus fleets and rental vehicles; heat and power generation for public and commercial buildings; and auxiliary power supply for ferries and port operations. Even on the Canary Islands, there are projects related to hydrogen. Enagás and the DISA Group have joined forces to promote the production, distribution, and commercialization of green hydrogen through the “Canarian Renewable Hydrogen Hub Cluster” project to contribute to the progressive decarbonization of the Archipelago [37]. In this project, 20 institutions are brought together, including companies and public organizations, leading private companies in their sector, technology centers, and academic institutions. In its first phase, the project requires an investment of 100 million euros and may reach up to 1000 million in 2030, depending on the growth in the consumption of green hydrogen as a clean energy alternative. In addition, part of this renewable hydrogen will be injected into the island’s gas network, mixed with natural gas, reducing the total CO2 emissions.
Regarding the different Canarian transport and industrial sectors, it should be said that heavy-duty vehicles, marine, and aviation are a sector with relatively high importance in the Archipelago. At the same time, the subsectors of metallic and nonmetallic mineral products (manufacturing glass, cement, ceramics, etc.) comprise more than 50% of industrial energy consumption [21]. All these industrial sectors have processes that require high temperatures, such as clinkerization in the cement industry, high-temperature furnace processing in the glass industry, or calcination and heat treatment processes in the metal products industry. Consequently, the decarbonization of these nonelectrifiable transport and industrial sectors must rest on the distant horizon of the deployment of hydrogen.
The decarbonization of the last-mentioned percentage of the final energy consumption with electricity, would require an unaffordable additional investment (around 19–20 thousand million euros for the whole Canary Archipelago, according to the Deloitte and Endesa report [21]). As a result, another technology is needed to provide cost-effective seasonal back-up, such as hydrogen (3–9 thousand million euros of investment to cover this last percentage [21]), although this technology is still under development. In any case, decisions in this regard will not be made until at least well into the 2030s and may be accepted depending on the maturity of the options available. Consequently, considering that the present proportion of final energy demand between the island of Gran Canaria and the whole Canary Archipelago remains practically constant over time (around 40%), it would imply that of the 2.5 TWh/year of “non-electrifiable” final energy consumption of the whole Archipelago (Figure 1), approximately1 TWh/year would come from the island of Gran Canaria. Then, hydrogen could be used to cover this last quantity; this production could be obtained from the electricity generation surpluses. So, in numbers, this TWh of final energy consumption would be converted into a hydrogen demand of 3 × 10⁷ kg per year, which means considering that the hydrogen demand is quite constant over a year, consumption of approximately 8.2 × 10⁴ kg per day. Additional costs to desalinate the water needed for the hydrolysis process have to be considered since the hydric resources are very limited on Grand Canary Island. The total amount of water would be around 3 × 10⁵ m3, meaning less than 10% of the desalination capacity of the recently projected plant associated with the Chira-Soria project [28]. The total costs of this facility are around EUR 20 million, and typical desalination costs are in the order of EUR 1/m3 [38], which means that these costs have to be considered, even though they are reduced compared with the rest of the hydrogen generation costs (EUR ~1 cent/kgH2 produced). But the energy required to bring this hydrogen available for consumption will be much higher given the current poor yields (electrolyzation process efficiency, storage and transport losses, etc.). However, this technology does not need to be available immediately, as this “non-electrifiable” part of energy consumption should be the last to be addressed in the final zero-emission scenario.
The above costs of hydrogen production are not the final costs of hydrogen use, since it has to be delivered to the end users. Consequently, storage, transport, distribution, and delivery costs must be added. Then, mainly depending on the end users’ distance, another possible energy carrier vector could be considered, the use of ammonia instead of hydrogen. The main advantages and disadvantages of ammonia are described below [18], the evaluation of both of which raises the question of its use. Ammonia can be easily liquefied due to strong hydrogen bonds, which makes it suitable for handling in thermally insulated containers, and ammonia has a higher volumetric energy density, approximately up to three times higher than hydrogen. Concerning transport and storage requirements, unlike hydrogen, ammonia can be contained at moderate pressure (around ten bars, compared to hundreds for hydrogen) at ambient temperature (much like propane).
Regarding safety, ammonia presents lower risks than other fuels used in transportation, such as hydrogen, gasoline, and propane, although some precautions must be taken into account. Ammonia vapors can be toxic, corrosive, and potentially life-threatening when inhaled in high concentrations; however, leaks are easily detected because of ammonia’s strong odor and because it is lighter than air and dispersed quickly. Additionally, ammonia’s low reactivity makes it less dangerous in case of fires or accidental explosions compared to other fuels. Consequently, this low reactivity makes the combustion of pure ammonia very difficult. Then, it should be checked if there is higher efficiency in the production and use of ammonia than with the direct use of hydrogen.
On the one hand, the efficiency of storing, transporting, distributing, and consuming hydrogen should be analyzed. While on the other hand the efficiency of carrying out the intermediate step of ammonia production (producing this ammonia from electrolyzed hydrogen and nitrogen separated from air, together with the necessary electrical energy, also obtained from the excess renewable generation), storage, transport, distribution, and consumption of the ammonia will be analyzed. Then, it can be checked which of them is more efficient in each of the possible consumptions of both energetic vectors. In any case, in all probability, in the more or less near future, the excess green electricity will be used in water electrolysis. The only question to be answered will be whether it is more efficient to use green hydrogen directly or, on the contrary, if it will be more efficient to use ammonia as an additional energy carrier.
Thus, the total costs of supplying hydrogen to end users must consider the various possible stages of the supply chain. In this sense, depending on the hydrogen carriers (pressurized H2, liquid H2, ammonia, and liquid organic) and modes of transport (truck, pipeline, and ship), the costs of conversion, transmission, distribution, storage, and reconversion are very different (Figure 4 and Figure 5). Therefore, one option may be a priori the most economical for certain conditions, while a different option may be the most economical for others. Moreover, the degrees of maturity of the different technologies involved are not the same and, therefore, have very different cost reduction potentials in the future. In addition, there may be scope for synergies among power, heat, and storage needs. But in the case of relatively isolated and small islands, like the Canary Archipelago, the most suitable option is to produce H2 in situ, while the best option for storage and distribution would be as a compressed gas. Consequently, added to the production costs, the costs of distribution by pressurized trucks must be considered as the best option. According to the IES report [32], since the distances to be covered on Grand Canary Island are less than 100 km, the costs are between EUR 0.3 and EUR 0.6/kgH2 depending on the distance covered (Figure 4b).

3.4. Smart Grids and Demand Management

Smart grids are necessary for the adequate management of all the new actors joining both generation, storage, and consumption [39]. This is understood as one that incorporates information and communication technologies (ICTs) to control and manage all aspects of the generation, transmission, distribution, and consumption of electricity to meet the demand of end users while minimizing the environmental impact, improving markets, reliability, service, and efficiency; and reducing costs.
Traditionally, in distribution grids, size was the main consideration; i.e., a significant size was required to achieve a reduced cost due to the economy of scale. But the integration of renewables into the traditional generation system has encouraged the decentralization of electricity systems, promoting both distributed generation and storage.
Together with this distributed generation and storage, the management of these systems has also been developed independently, or at least partially independently, but integrated within larger grids, systems known as microgrids. Modern microgrids are integrated energy systems consisting of a localized grouping of distributed electricity generation with storage and multiple electrical loads, which can be independently controlled as its own entity or microgrid or connected to the existing power grid [40]. In cases where there is no possibility to connect to the public grid, usually because it is located in a remote or isolated location, a standalone microgrid (SAM) is an answer to the challenges of power supply.
The automation and monitoring of energy in these smart grids are usually carried out in multilevel architectures, with different studies with grids ranging from a single level to around ten [41]. So, the grid’s functionalities are controlled at different levels so that local controls are covered from the lowest levels. In contrast, the global optimization of the network is covered at the highest level.
Through ICTs, control, monitoring, and self-diagnosis of these factors, smart grids seek to achieve at least the following objectives:
  • To strengthen and automate the network, improving its operation, quality indexes, and losses.
  • To favor the integration of renewable energies, also improving the integration of intermittent renewable generation (mainly wind and solar photovoltaic) by developing new storage technologies and enhancing the existing ones.
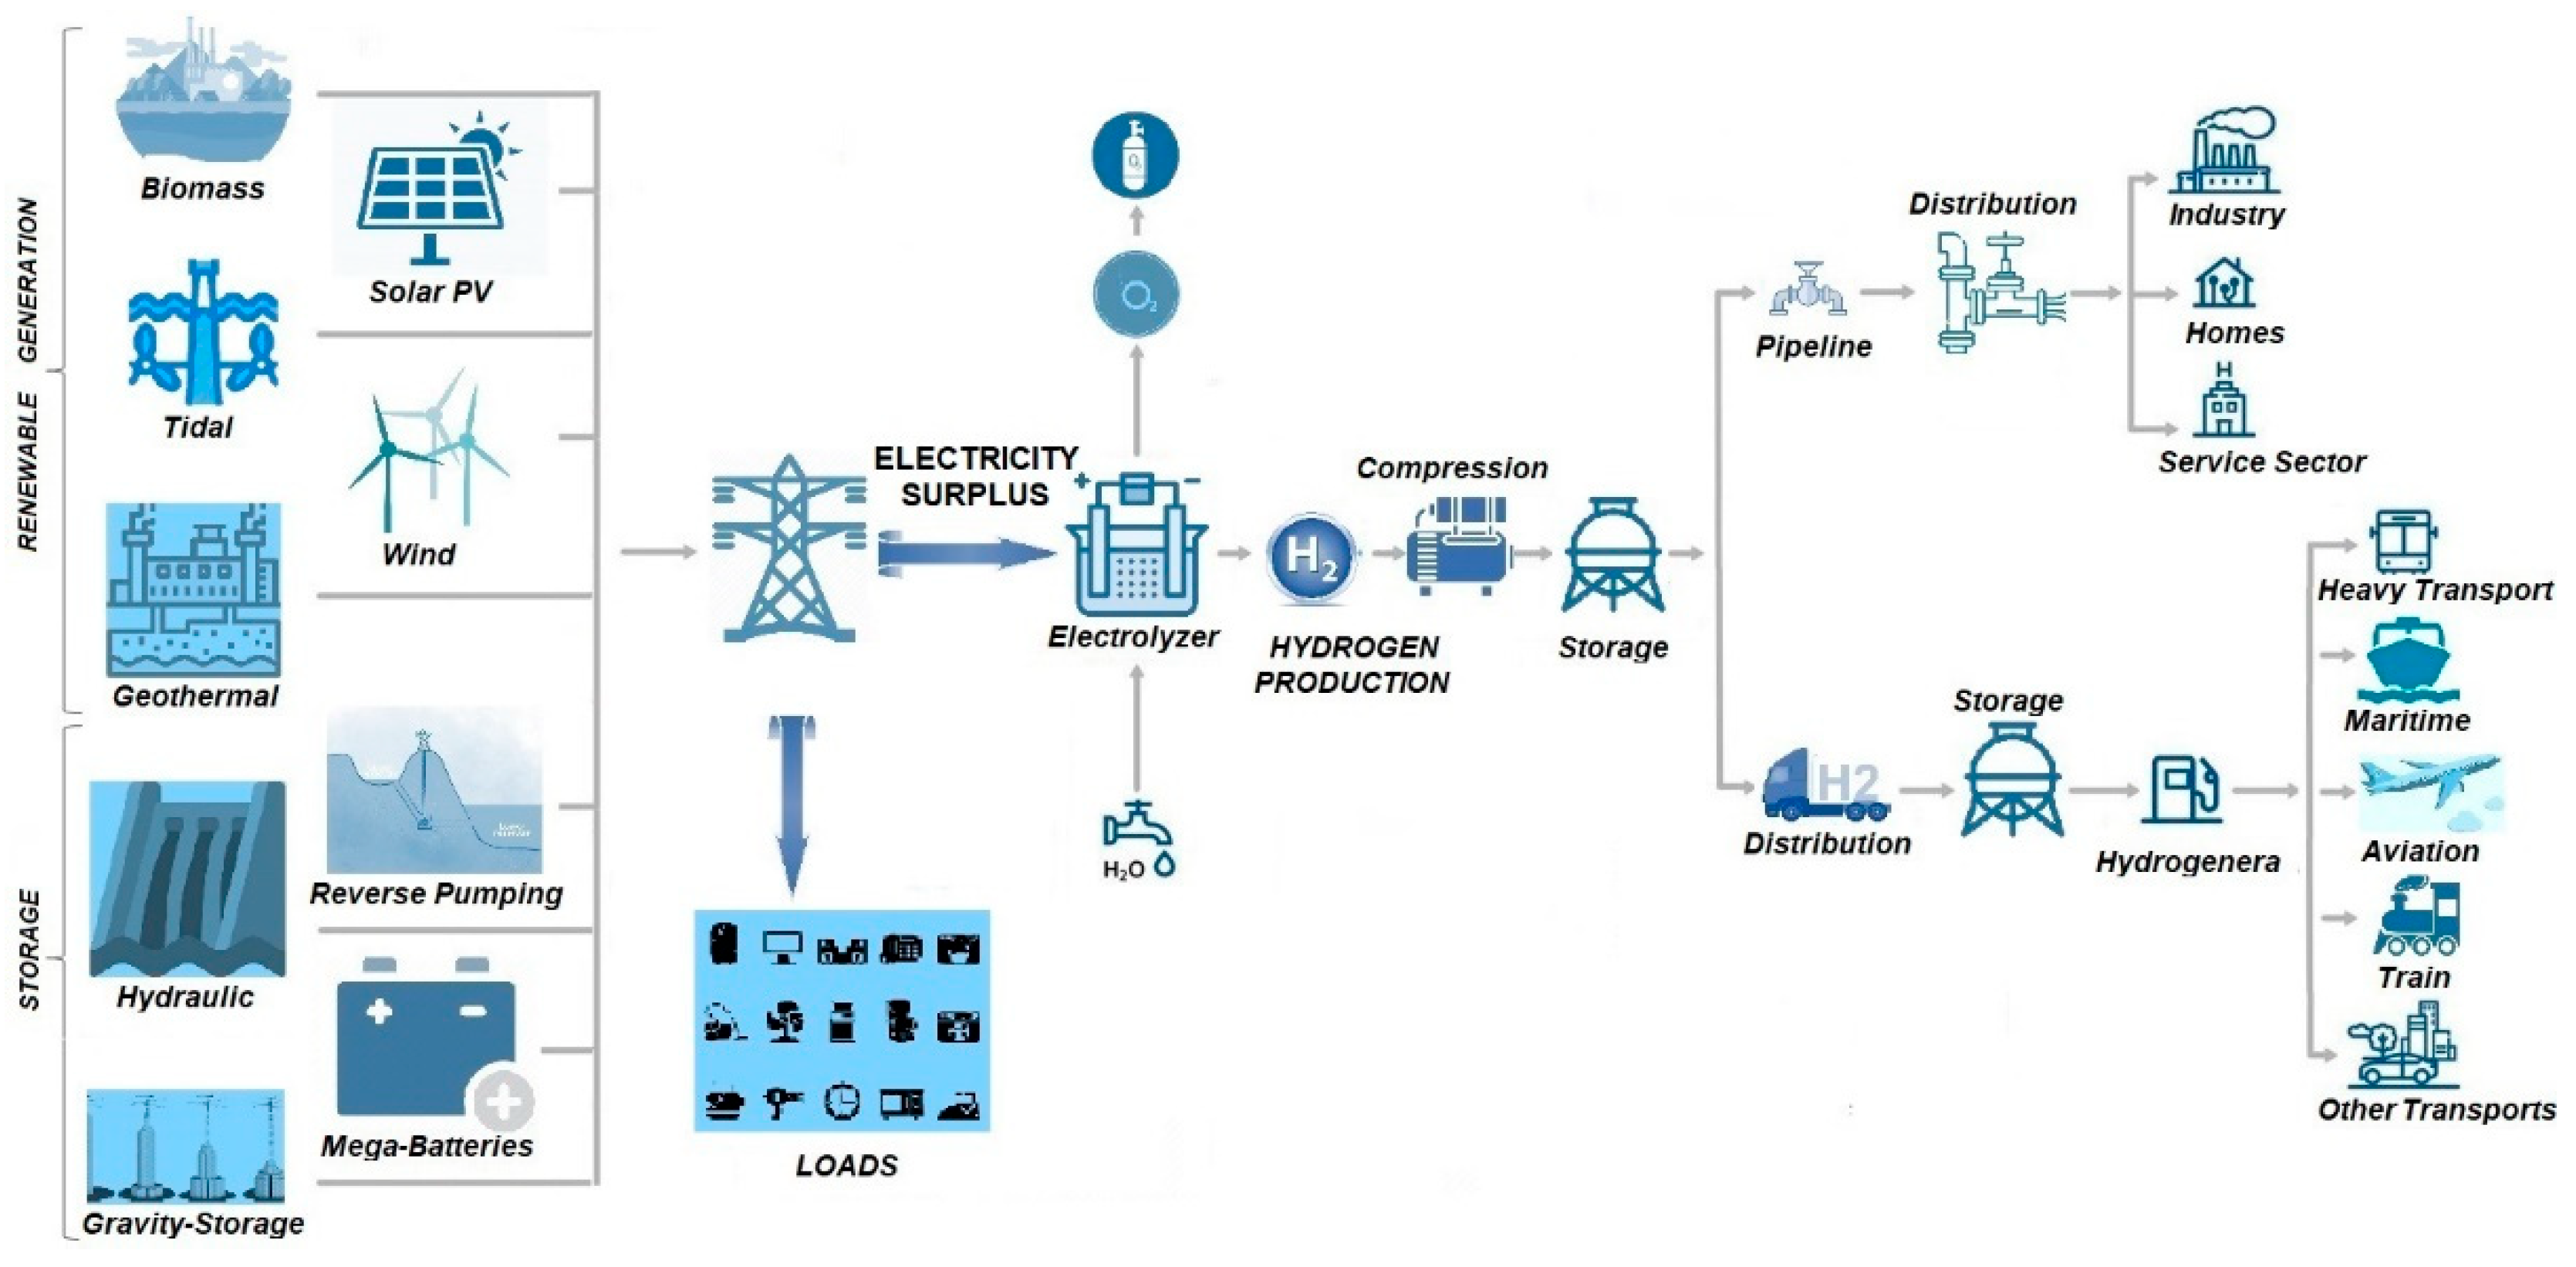
  • To favor the integration of hydrogen production, intermittent renewable generation and storage technologies aim to manage the generation–demand balance for both electric and hydrogen, using electric energy surpluses to produce hydrogen.
  • Develop decentralized generation plants or systems, allowing for the operation of smaller installations closer to the final consumer, in harmony with the rest of the system (distributed generation), which would reduce losses.
  • Active demand management, allowing consumers to manage their consumption more efficiently.
  • Incentivize active demand management by promoting energy offers with hourly tariffs that encourage consumers to incentivize users to carry out smart recharging during off-peak hours.
  • Integrate V2G technology, allowing the entry of a large amount of distributed and renewable energy and the active participation of customers in the electricity system. This technology allows bidirectional management of the grid since, on the one hand, it consumes energy from the grid, but, on the other hand, it can return it during peak demand hours. This allows advanced load control in smart grids. Even V2G policies could also be useful for supplying stationary demands, particularly home demand.
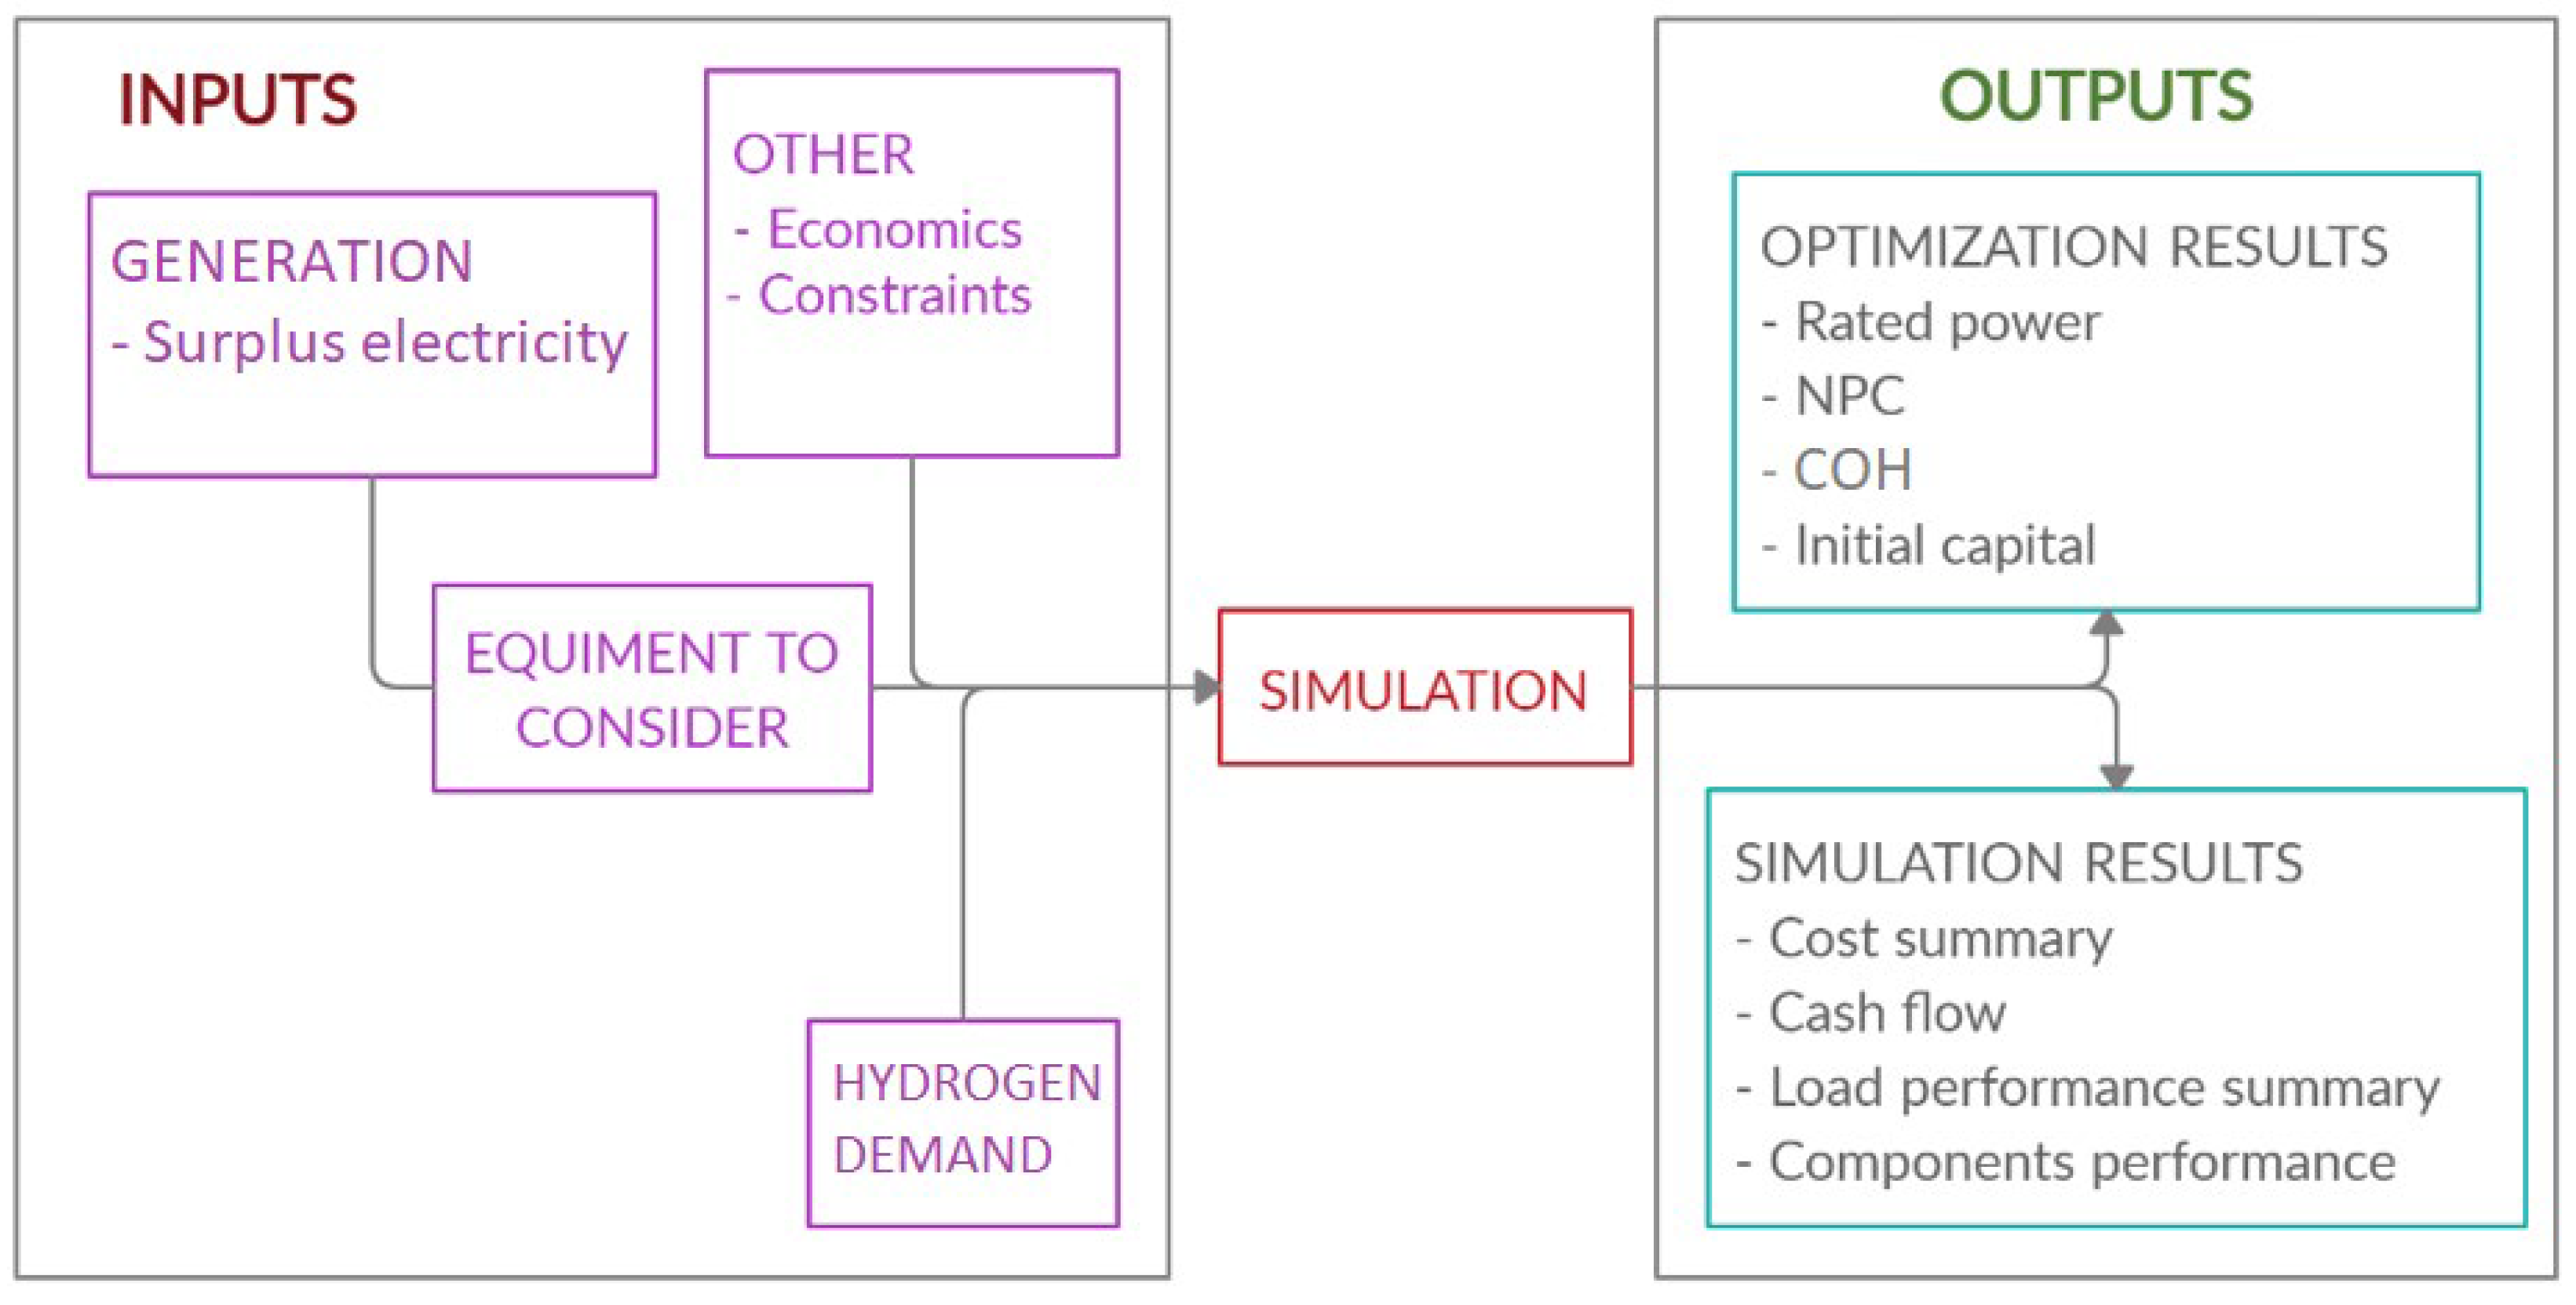
One of the key achievements of smart grids could be the implementation of demand-side management, which is a very powerful weapon to improve the performance of power systems, particularly in the current situation where there is a transition process in power systems. Demand-side management in households is possibly the most widely used strategy to shift the demand’s curve toward the generation’s one [38,42].
Until now, generation and demand estimates have been considered separately. However, it is also necessary to know how daily generation and demand are distributed, in order to try to match them as much as possible, so that the storage capacity needed to manage this inevitable decoupling can be optimized. For this reason, the generation patterns of the different renewable sources that constitute the generation mix, i.e., in our case wind and solar photovoltaic, must be analyzed. Given the predictability of solar photovoltaic generation, it fits very well with storage technologies, which makes it possible to perform a more accurate sizing of the storage capacity needed to manage it. As is well known, solar photovoltaic production is concentrated in the central day hours and always with the same pattern (except for variations among seasons, but which are also well-known), which makes the daily day–night charge and discharge cycles easier. Moreover, the irradiation on the Canary Islands in general is very high, as well as on Grand Canary Island. In addition, days with a shortage of sunshine are few and do not usually occur on consecutive days.
On the other hand, wind generation can have several days with low production periods, although it also has a good performance on the Canary Islands. These possible low wind speeds mean that greater storage capacity is required. In addition, in the opposite direction, there can be periods of several days producing practically at total capacity, which saturates the storage system and can generate substantial surpluses, which would imply its waste. However, in the case of Grand Canary Island, the winds are high and very stable. Therefore, the optimal generation MIX will probably be close to a balance of installed power with significant contributions from both technologies.
As a result, especially with high amounts of solar PV generation, appropriate demand management is imperative. These measures make it possible to bring the electricity consumption profile closer to the generation profile, reducing the required storage capacities. In a general way, it is estimated that both in the Canary Archipelago and on Grand Canary Island it is possible to displace the demand curve toward the generation curve, i.e., toward the central hours of the day, by approximately 20–30% of the total daily consumption [21]. So, through these demand management measures, it is possible to shift the demand curve from a rather flat shape to a curved shape that follows a typical fully electrified final energy consumption curve quite well. This change in the shape of the demand curve could be achieved by influencing fundamentally two aspects, firstly by favoring the recharging of electric vehicles in the central hours of the day and, secondly, by bringing household consumption (DHW and household appliances) to these same intervals.
Given that in these central hours, there is an immense generation peak produced by solar photovoltaic generation, which is impossible to absorb unless the storage system is significantly oversized, with the consequent cost overrun of the system. To this end, measures should be taken in the electricity tariff and hourly price signals to encourage consumer demand during these hours of increased renewable production. These procedures will be differentiated for each consumer, including demand aggregators, connected electric vehicle management systems, or changes in the interruptibility tariff for major consumption users. It would be necessary to develop an appropriate regulatory scheme for this service and an operational procedure that allows the system operator to handle it clearly, efficiently, and transparently.
This distributed generation and storage could be extended to hydrogen production; although this centralized mass production is more economical nowadays, the high transport costs can minimize these advantages. Consequently, integrating distributed hydrogen production on renewable energy microgrids is considered a practical and attractive way to reduce production, storage, and transportation costs. Distributed generation is becoming a possible electric generation alternative along with hydrogen production [43,44]. Examples of hybridized systems between renewable generation and hydrogen as energy carriers have been proposed for smart microgrid systems [41,44]. The current study goes one step further, as it integrates hydrogen generation within a more extensive system; i.e., it integrates hydrogen production into the island’s electric generation network. This research explores the use of electric energy surpluses to produce hydrogen, being able to cover the island’s needs, both electric energy and hydrogen (used to cover the nonelectrifiable uses).

4. Methodology

Throughout this research, a methodology consisting of searching for the input data necessary to carry out the simulations is presented, along with the optimization of the generation system through its analysis. Thus, the different scenarios under analysis can be studied using these data. Figure 4 shows a schematic summary of the method implemented in this study. The most important input data required by the program are the following:
  • Available energy resources of each generation system (solar and wind resources available on Gran Canaria);
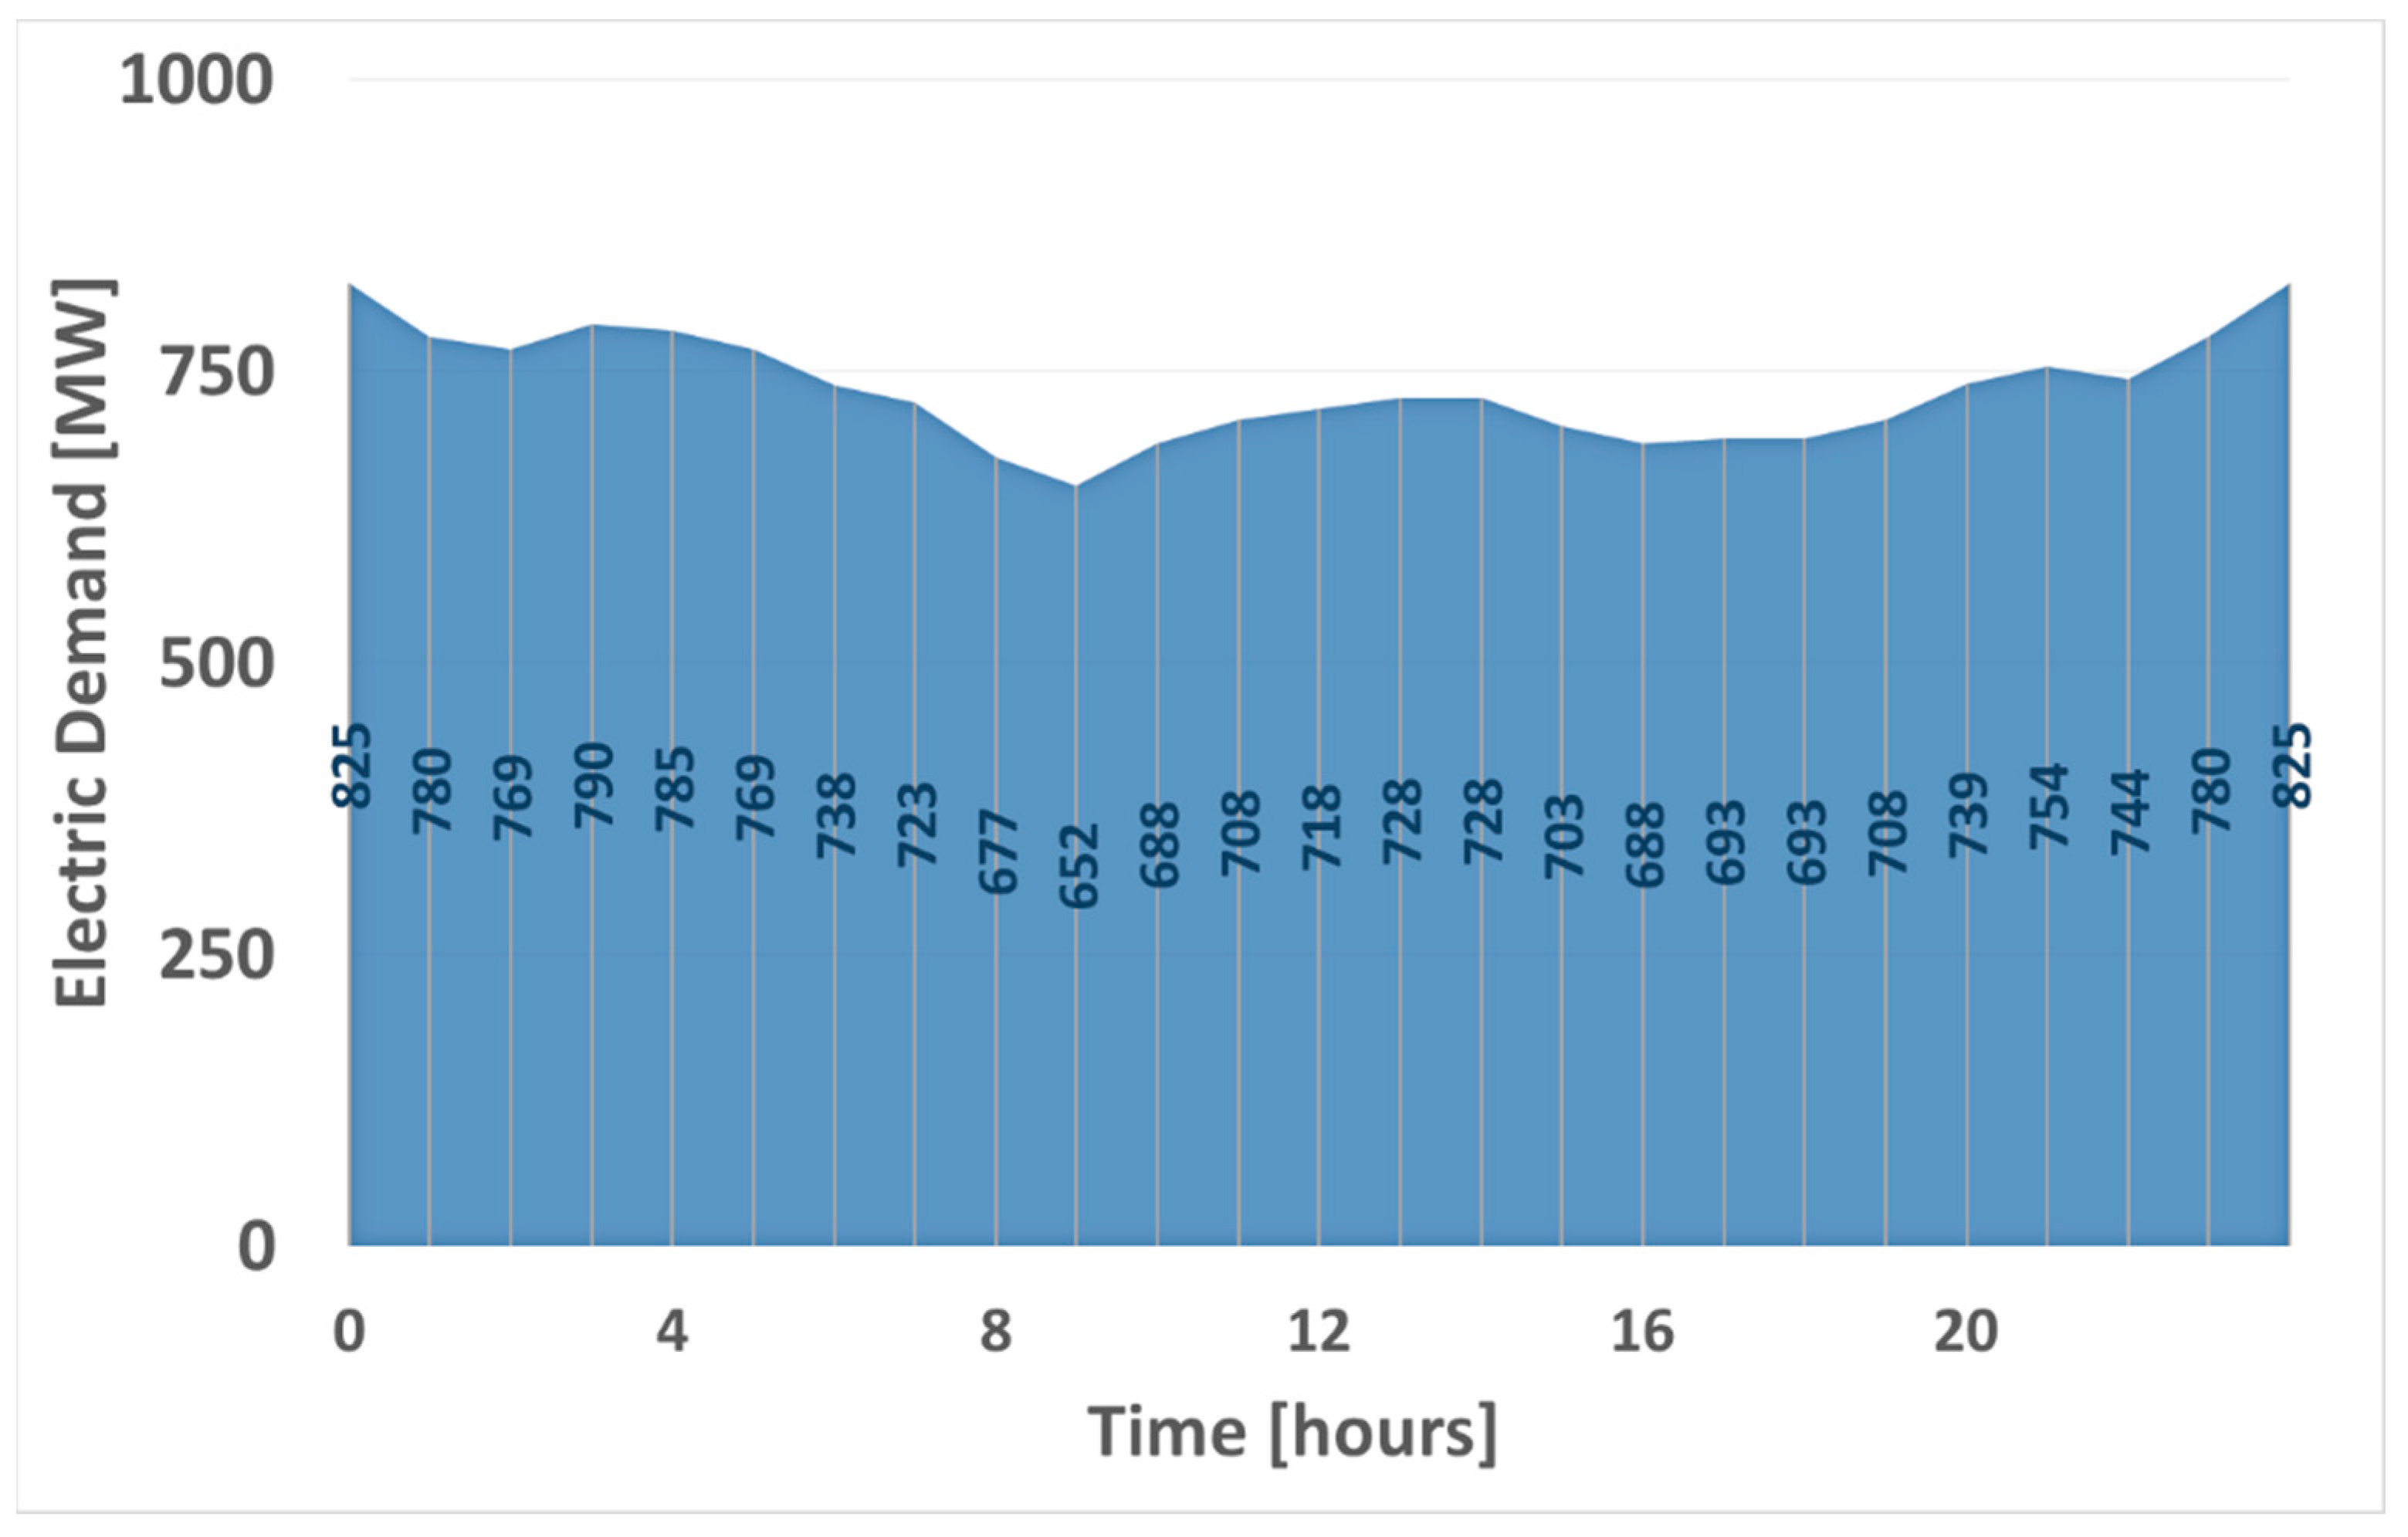
  • Annual hourly energy demand data;
  • Technical information of the renewable systems to be used;
  • Cost of the generation system to be considered (in this case, photovoltaic and wind power plants);
  • Technical information and price of the storage system (reversible pumping and EV batteries were analyzed);
  • Other economic data (such as annual interest rate and lifetime of the project);
  • Other costs of the generation and storage systems not considered in the previous points—an unforeseen expense (6%) was considered; this value includes the cost of the decommissioning facility (3%) when the plants reach the end of their useful life.
The simulation software used was HOMER (Hybrid Optimization of Multiple Electric Renewables) version 2.68 (NREL, Golden, Colorado, USA). The optimization method was based on selecting the economically best system (Electrolyzer + Hydrogen storage system). It is the one with minimum Net Present Cost (NPC) after simulating all possible system configurations (testing many different sizes of electrolyzers and storage systems, according to the excess of energy) to cover the imposed objective (produce the maximum quantity of hydrogen at the best levelized Cost of hydrogen—COH), considering the hydrogen demand curve. In this sense, the method “tests” all possible solutions. As a result, a list of solutions is obtained. The optimal solution heads the list, but other options can also be considered. The global optimum was chosen as the best solution (the one with lower NPC). In addition, capital, O&M costs, and COH were estimated. More information about the equation used to calculate the economic parameters is given in [45].
The technical inputs and technical information of the renewable systems to be used (Figure 6) are then included according to their technoeconomic feasibility:
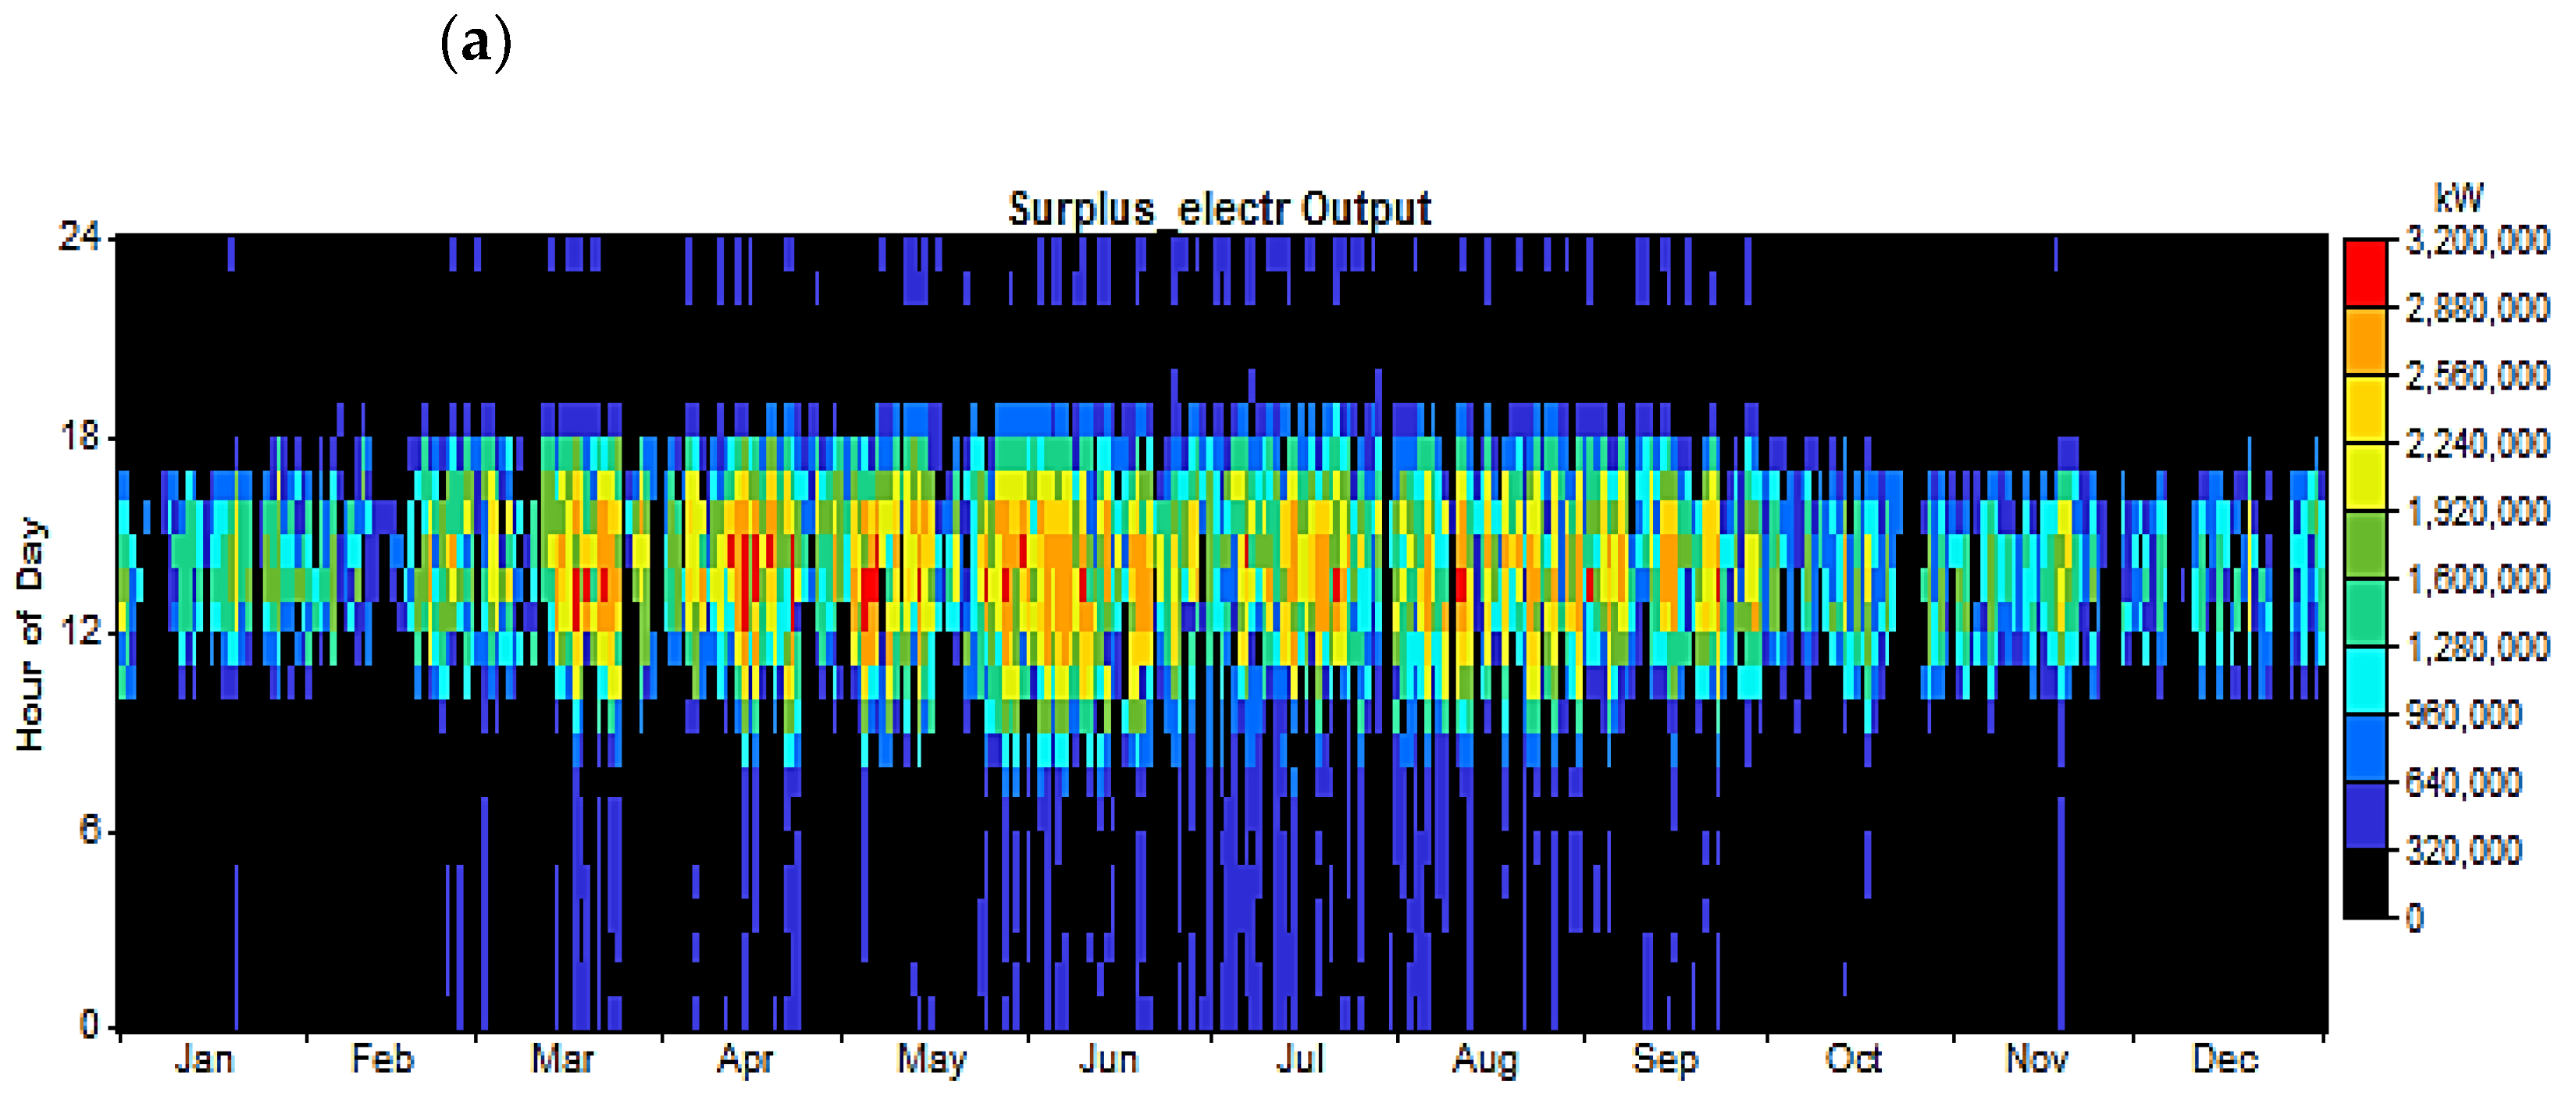
  • The excess of energy: These were obtained from [46]. A wind generator and an hourly wind velocity curve were used to simulate the excess of power in HOMER. The results are shown in Section 6.1.
  • The electrolyzer and the storage system: The excess energy is used to produce and store H2 to cover the demand. The electrolyzer and the storage system are described in Section 6.2.
In other words, different estimates can be made with the best combination options between generation and storage systems to supply the energy required in each defined scenario. The program provides detailed economic information, such as the COH (cost of hydrogen production), the initial capital, and the net present cost (NPC). Figure 6 and Figure 7 display schematically the different inputs and outputs provided by HOMER software. The pieces of equipment to consider are the electrolyzer and the hydrogen tank (The H2 storage system includes the compressor).

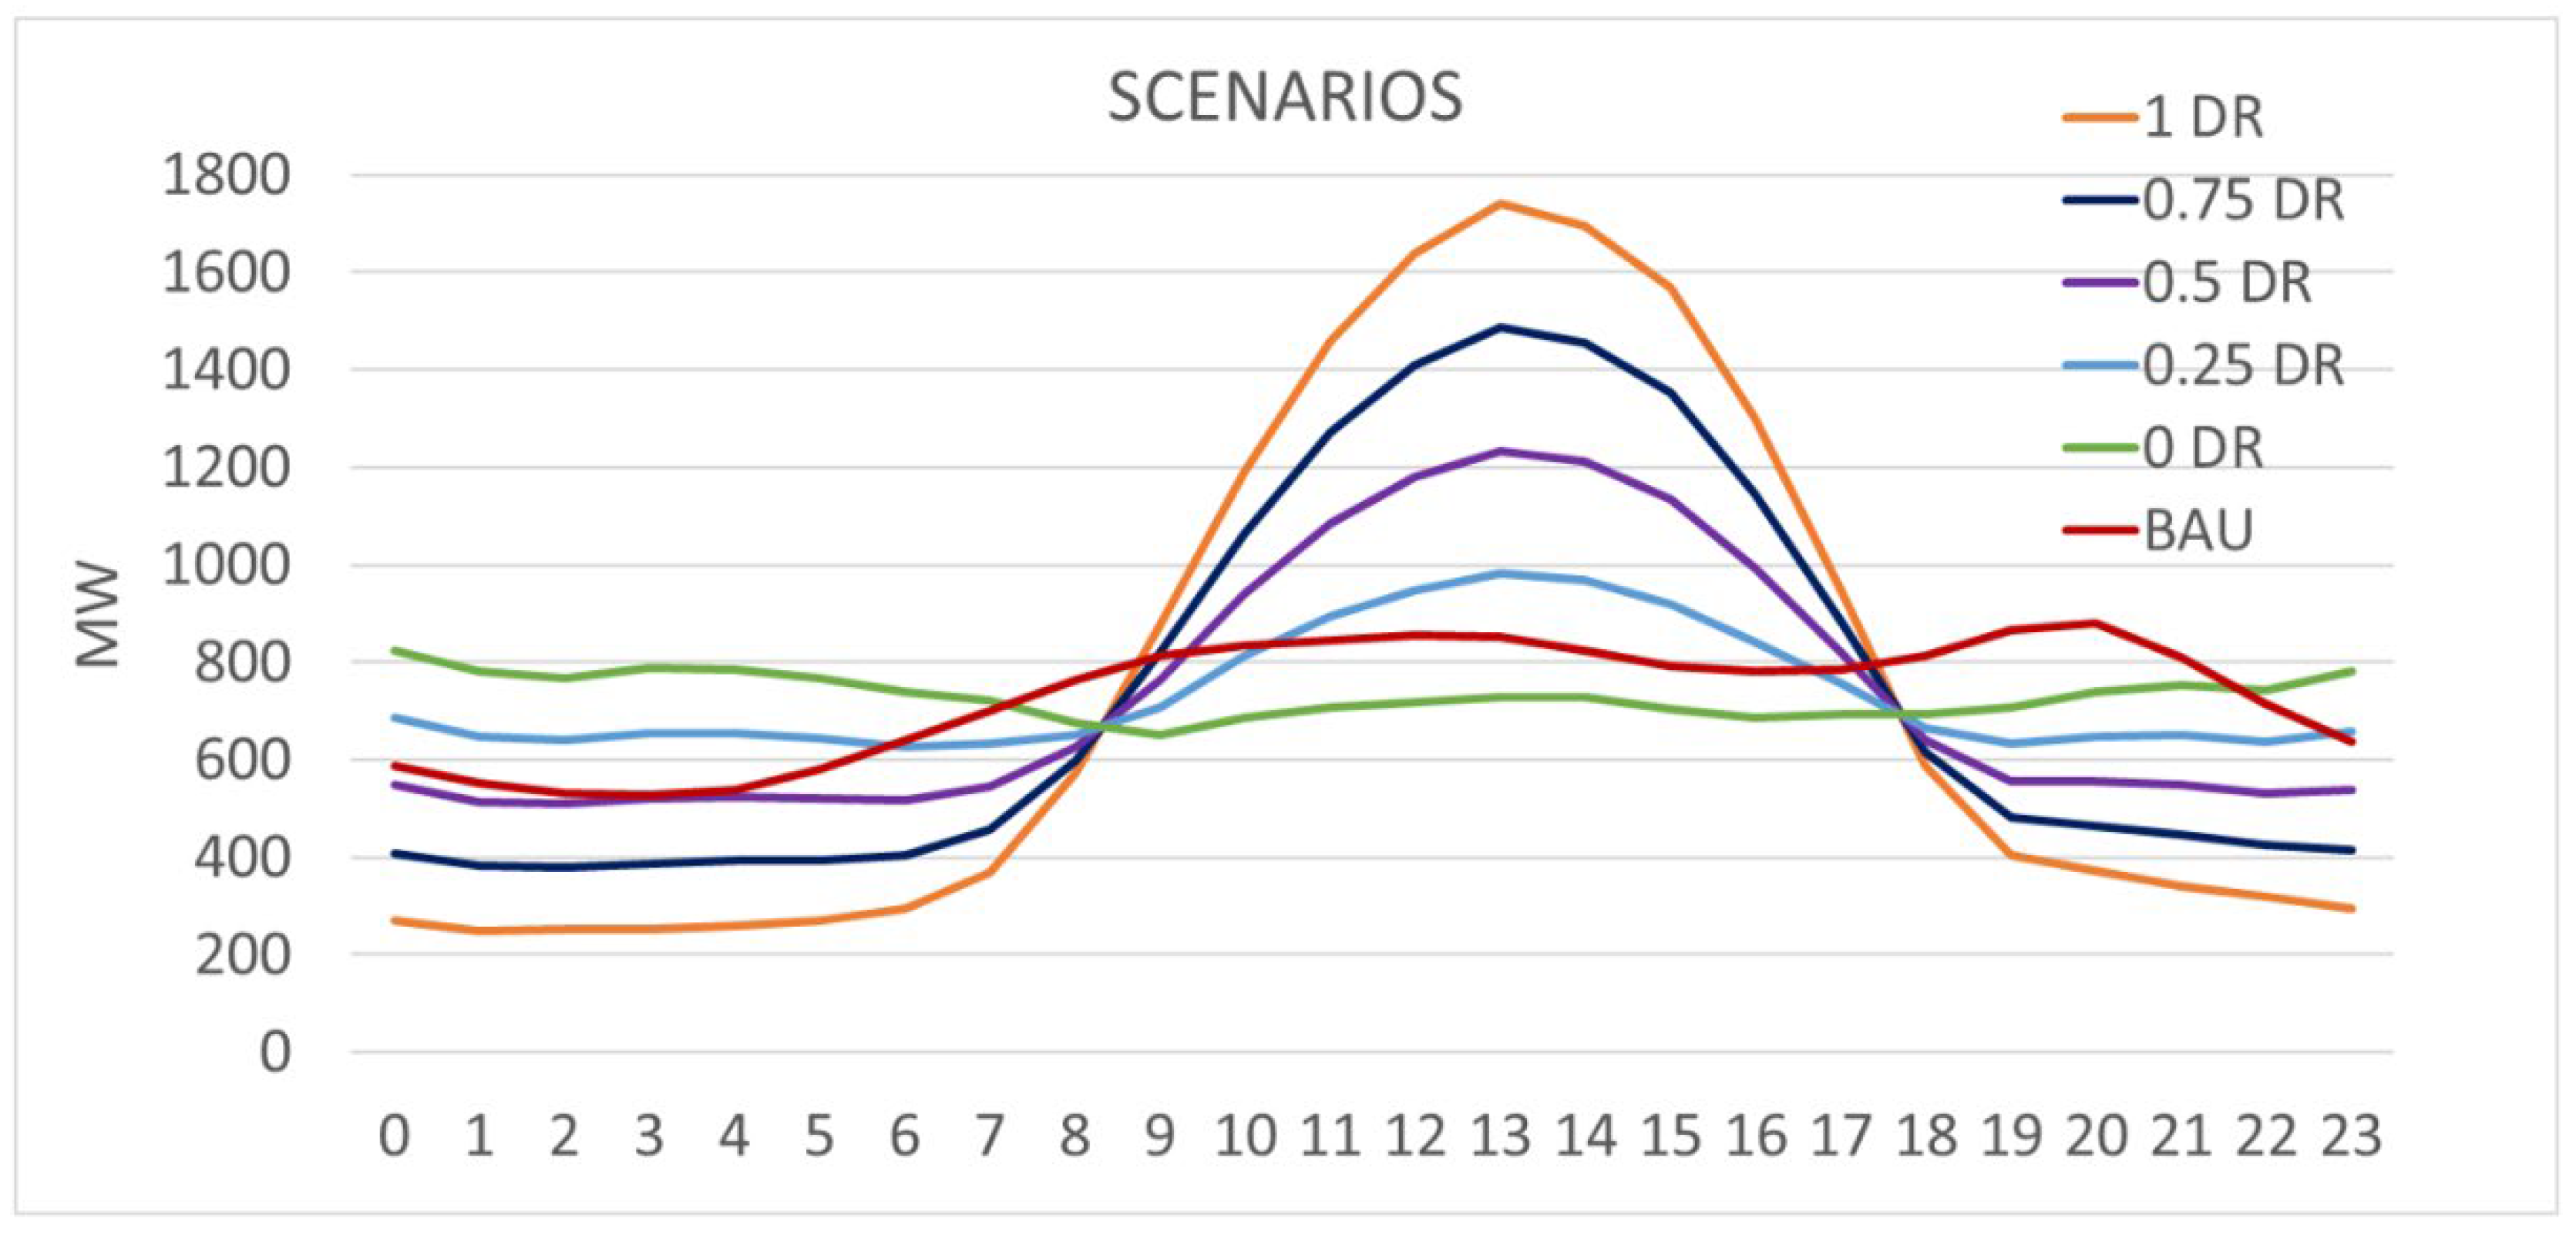
5. Analyzed Scenarios

The generation sources considered in this study were solar photovoltaic and wind. The photovoltaic generation capacity of Gran Canaria was based on the optimal estimates of the self-consumption analysis of the last report of the Canary Islands [23]. Offshore wind generation was considered, mainly according to land occupation and efficiency criteria. To estimate the storage capacity needed to handle the intrinsic variability of renewable sources, a reversible pumped storage system was adopted (depending on the island’s orography and hydraulic resources for power generation) [28]. Additionally, a battery system was also considered since an extra storage capacity would be needed. The implementation of V2G strategies was taken into account, meaning that part of the storage capacity of the huge electric vehicle fleet estimated for 2040 would be available [4,46]. Then, from the data obtained from these technologies, the base scenario of the generation system needed to cover the demand was determined. Finally, possible demand management strategies were analyzed to verify their ability to improve the energy demand balance. Specifically, three scenarios of demand management were reproduced.
The base scenario defined is the one that achieves a compromise solution among costs, minimization of energy surpluses, and acceptable land occupation with the premises described above. The proposed system is conceived to cover 100% of Gran Canarias’s energy demand with the total electrification of the “all electrifiable” final energy consumption. In this way, taking as a starting point this scenario, the effect of these demand management policies on hydrogen production was analyzed for the scenarios proposed in previous research work also applied to Grand Canary Island (Figure 8) [4]. Four Demand Response (DR) implementation degrees were simulated (Lines 0.25, 0.5, 0.75, and 1 DR). The corresponding number means the DR degree considered; the two simulations are the scenario without demand response management (0 DR) and the scenario with the highest possible demand response management (1 DR). In addition, a conservative scenario, Business As Usual (BAU), was also analyzed; this scenario replicates the current demand curve shape but scales from today’s demand to forecast one for 2040.
Thus, in three of these scenarios, a sensitivity analysis was performed on the maximum amount of hydrogen to be produced. The selected scenarios were the two extreme DR ones, 0 DR (without demand management) and 1 DR (maximum demand management implementation), and the BAU case. Figure 9 includes data on average electricity production (surplus electricity from a fully renewable hybrid system) available for hydrogen production. Dimensioning hydrogen production and storage systems is based on the maximization of hydrogen production but always covering the forecasted total hydrogen demand of the island since it has been considered that the island must be autonomous and neutral in greenhouse gas emissions in all its final energy consumptions. Additionally, the possibility of producing an excess of hydrogen was explored. This excess could be delivered to any of the neighboring Canary Archipelago islands or even to other territories.

6. Hydrogen Production System Simulation

The surplus electricity would be profitable to produce hydrogen on Grand Canary Island by 2040 (according to the scenarios analyzed by [4]). The forecasted excess electricity values are 3.792, 4.873, and 2.332 TWh/year for the BAU, 0 DR, and 1 DR scenarios, respectively. The electricity is used to feed a set of electrolyzers. The electrolyzers will produce hydrogen, which will be compressed and stored in a storage tank set, as shown in Figure 10.

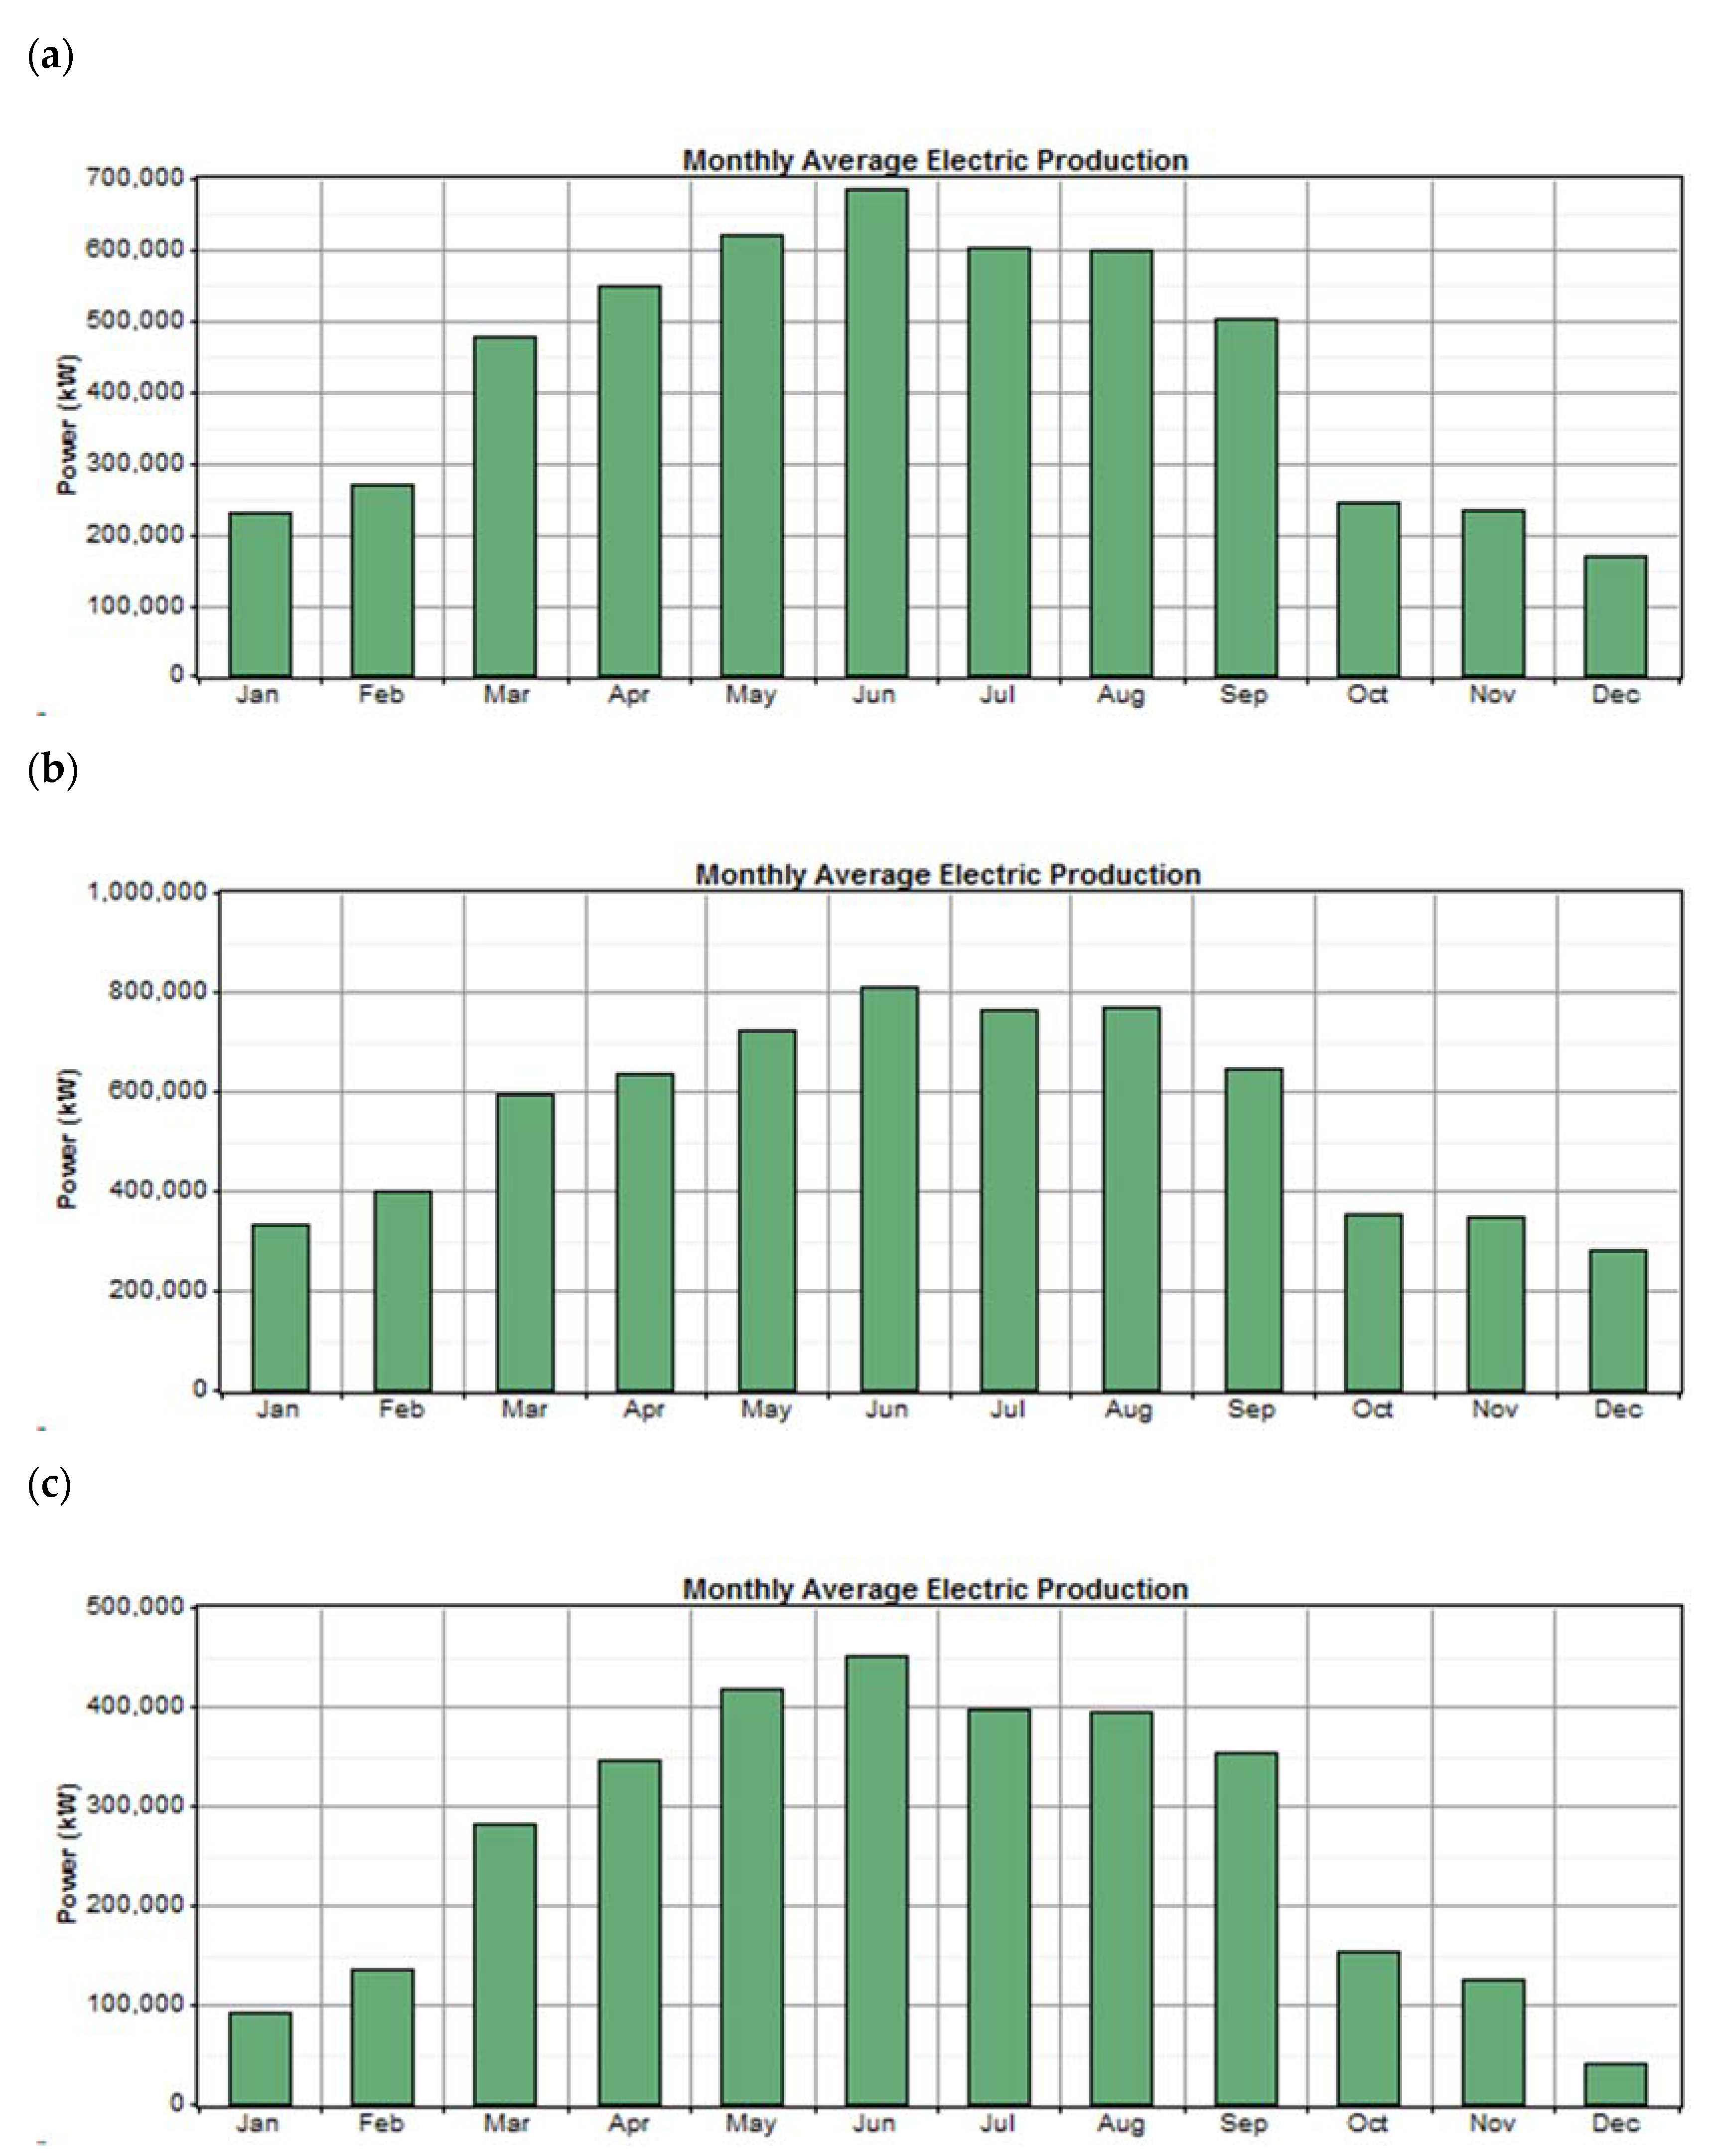
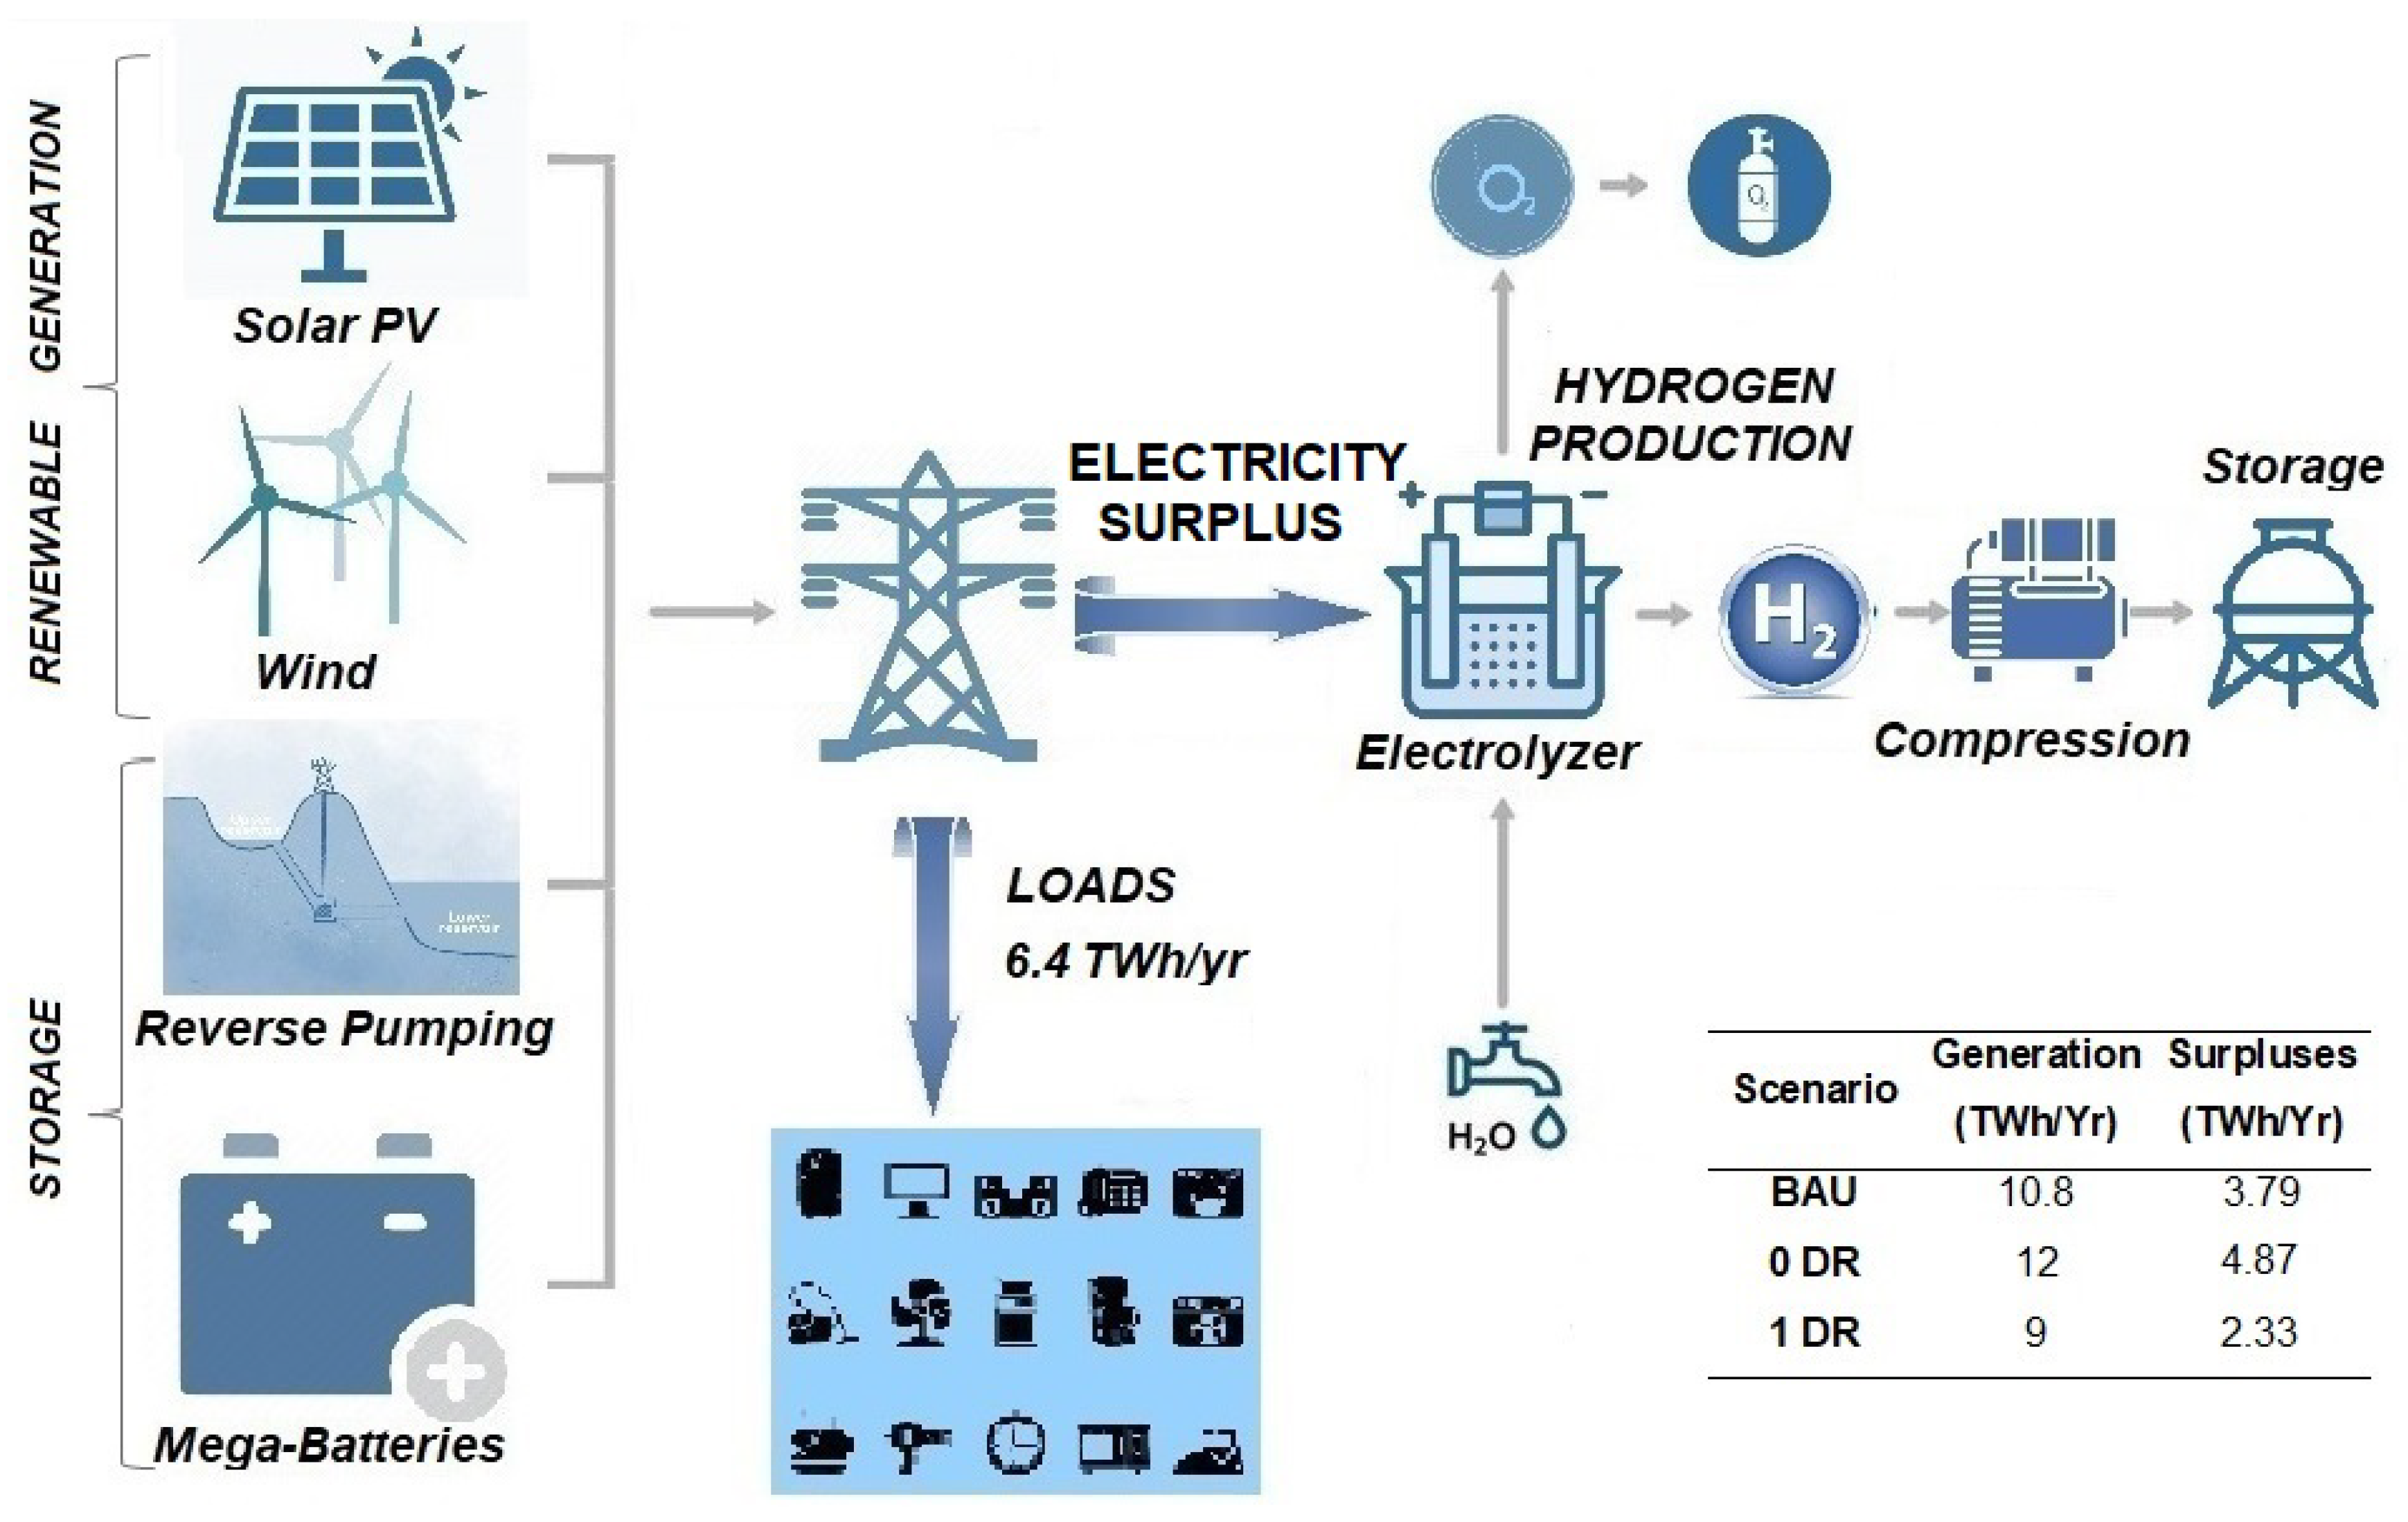
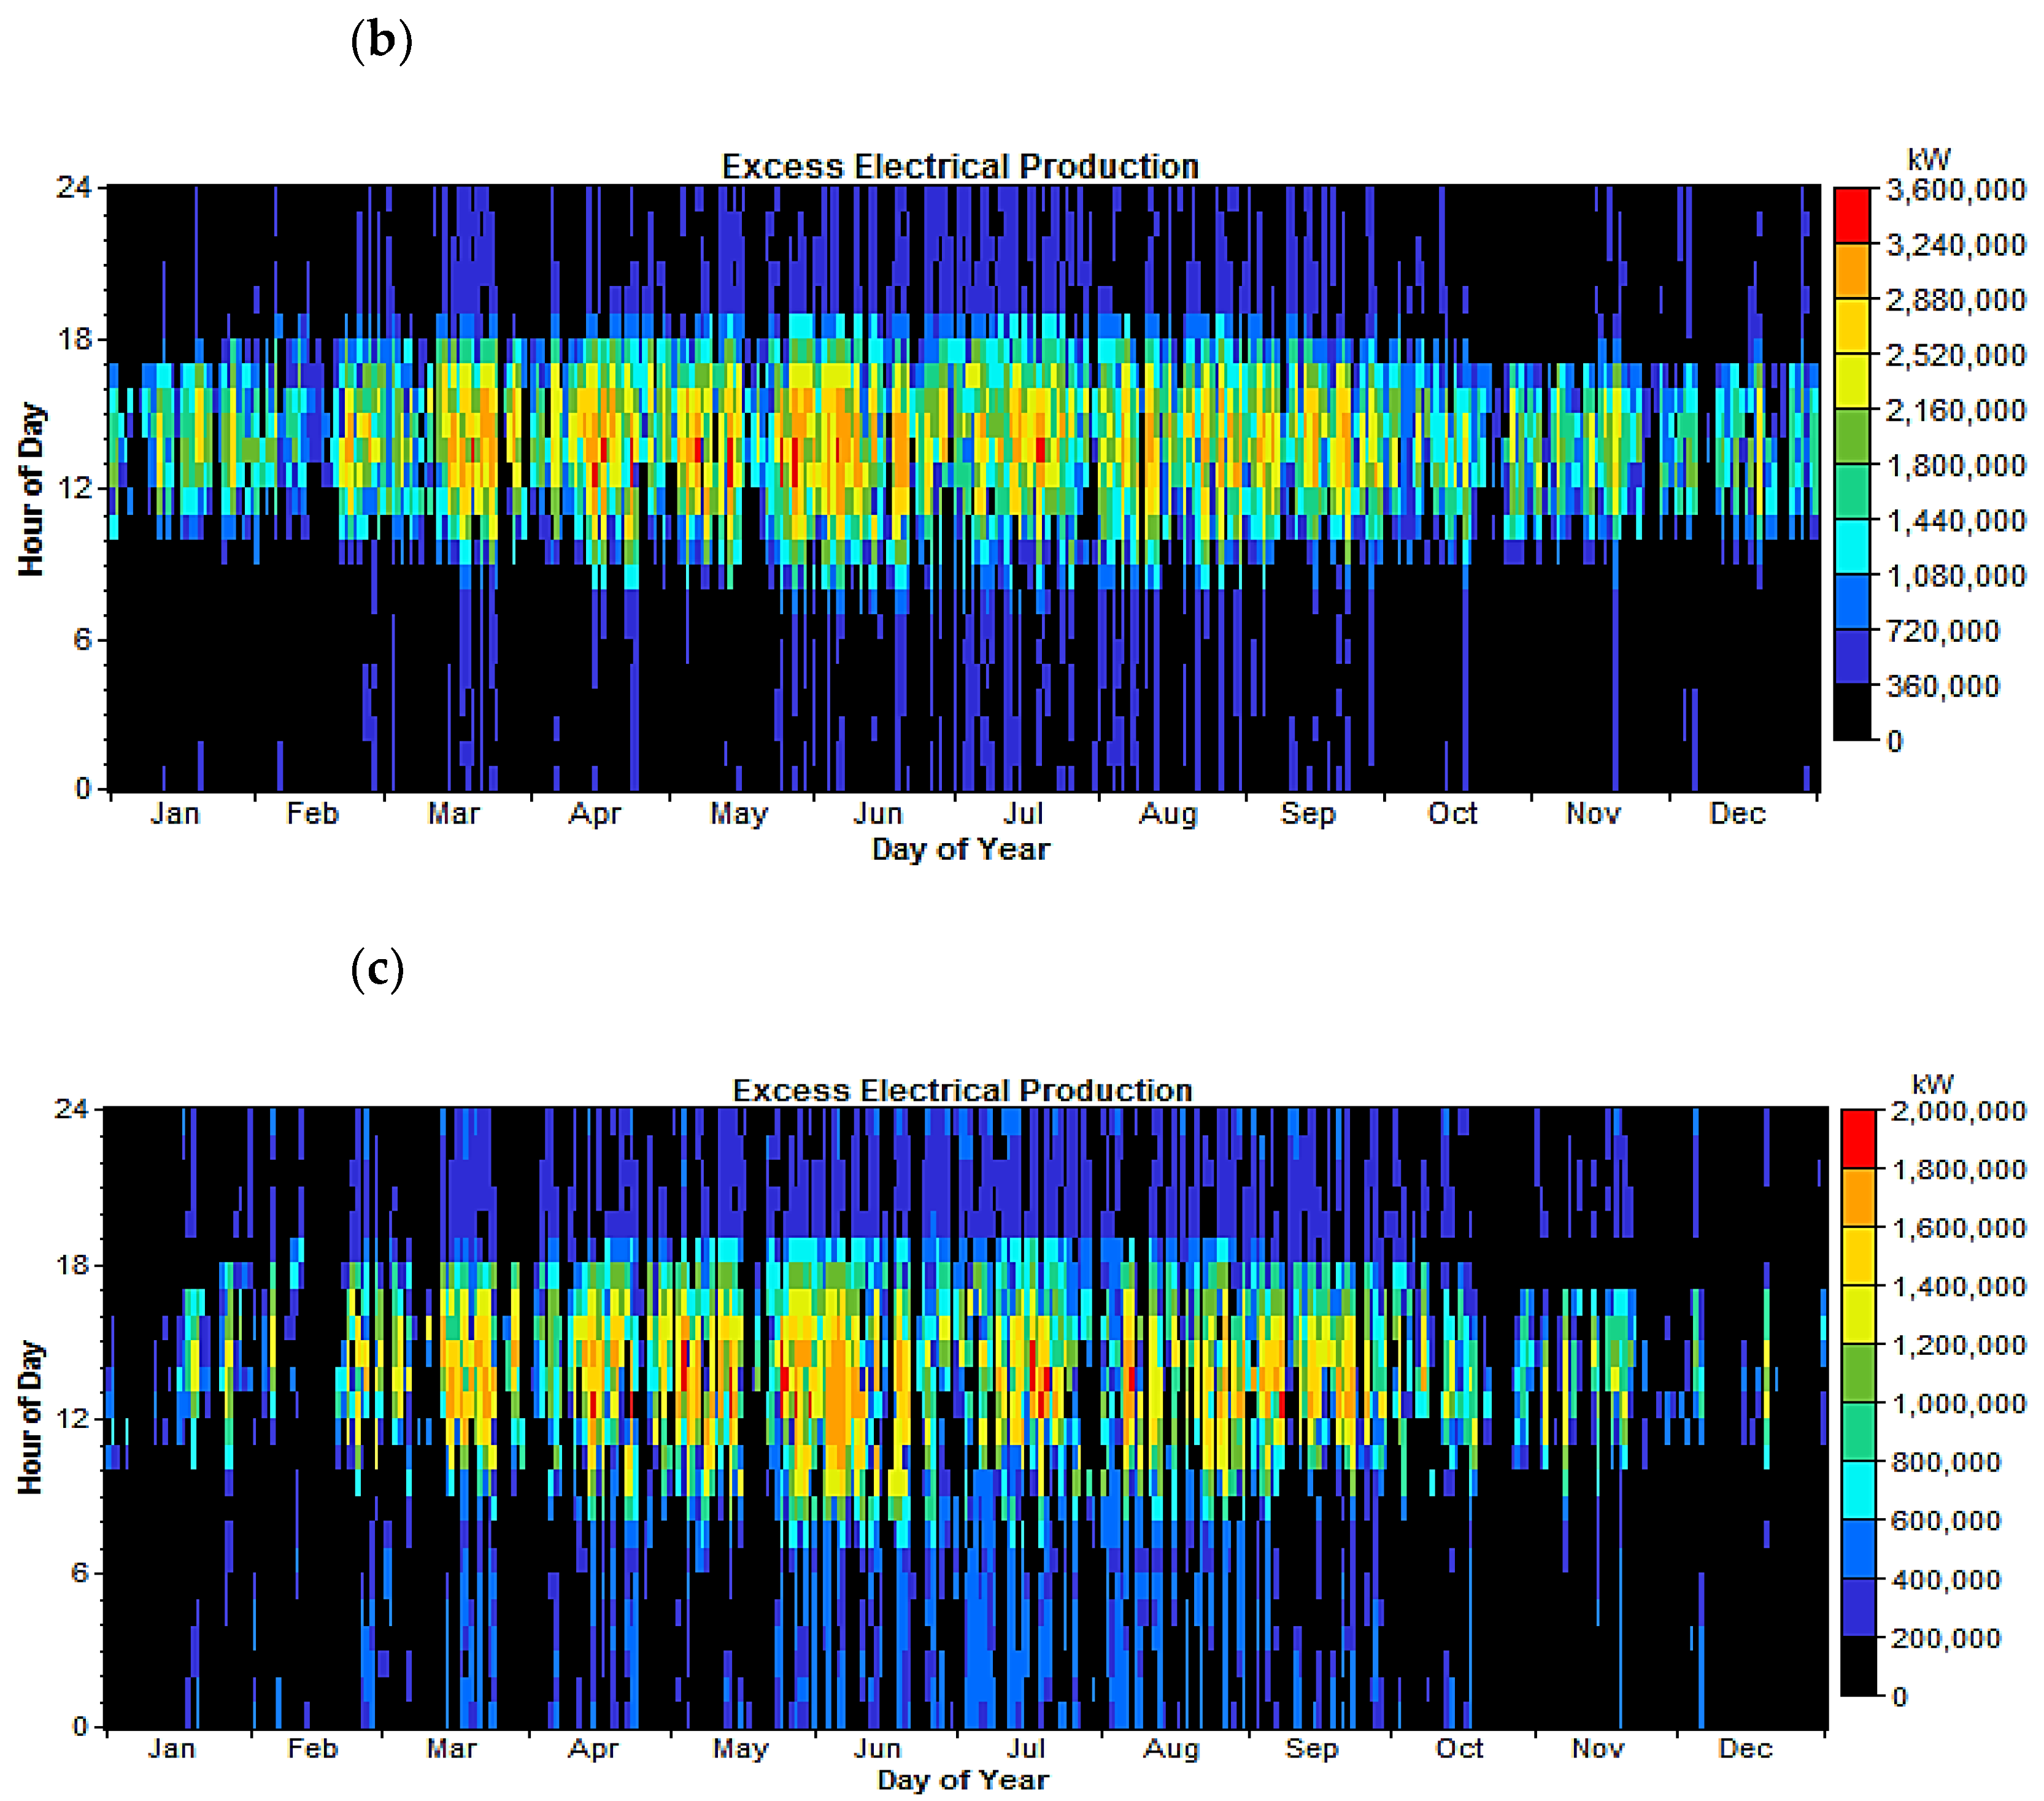
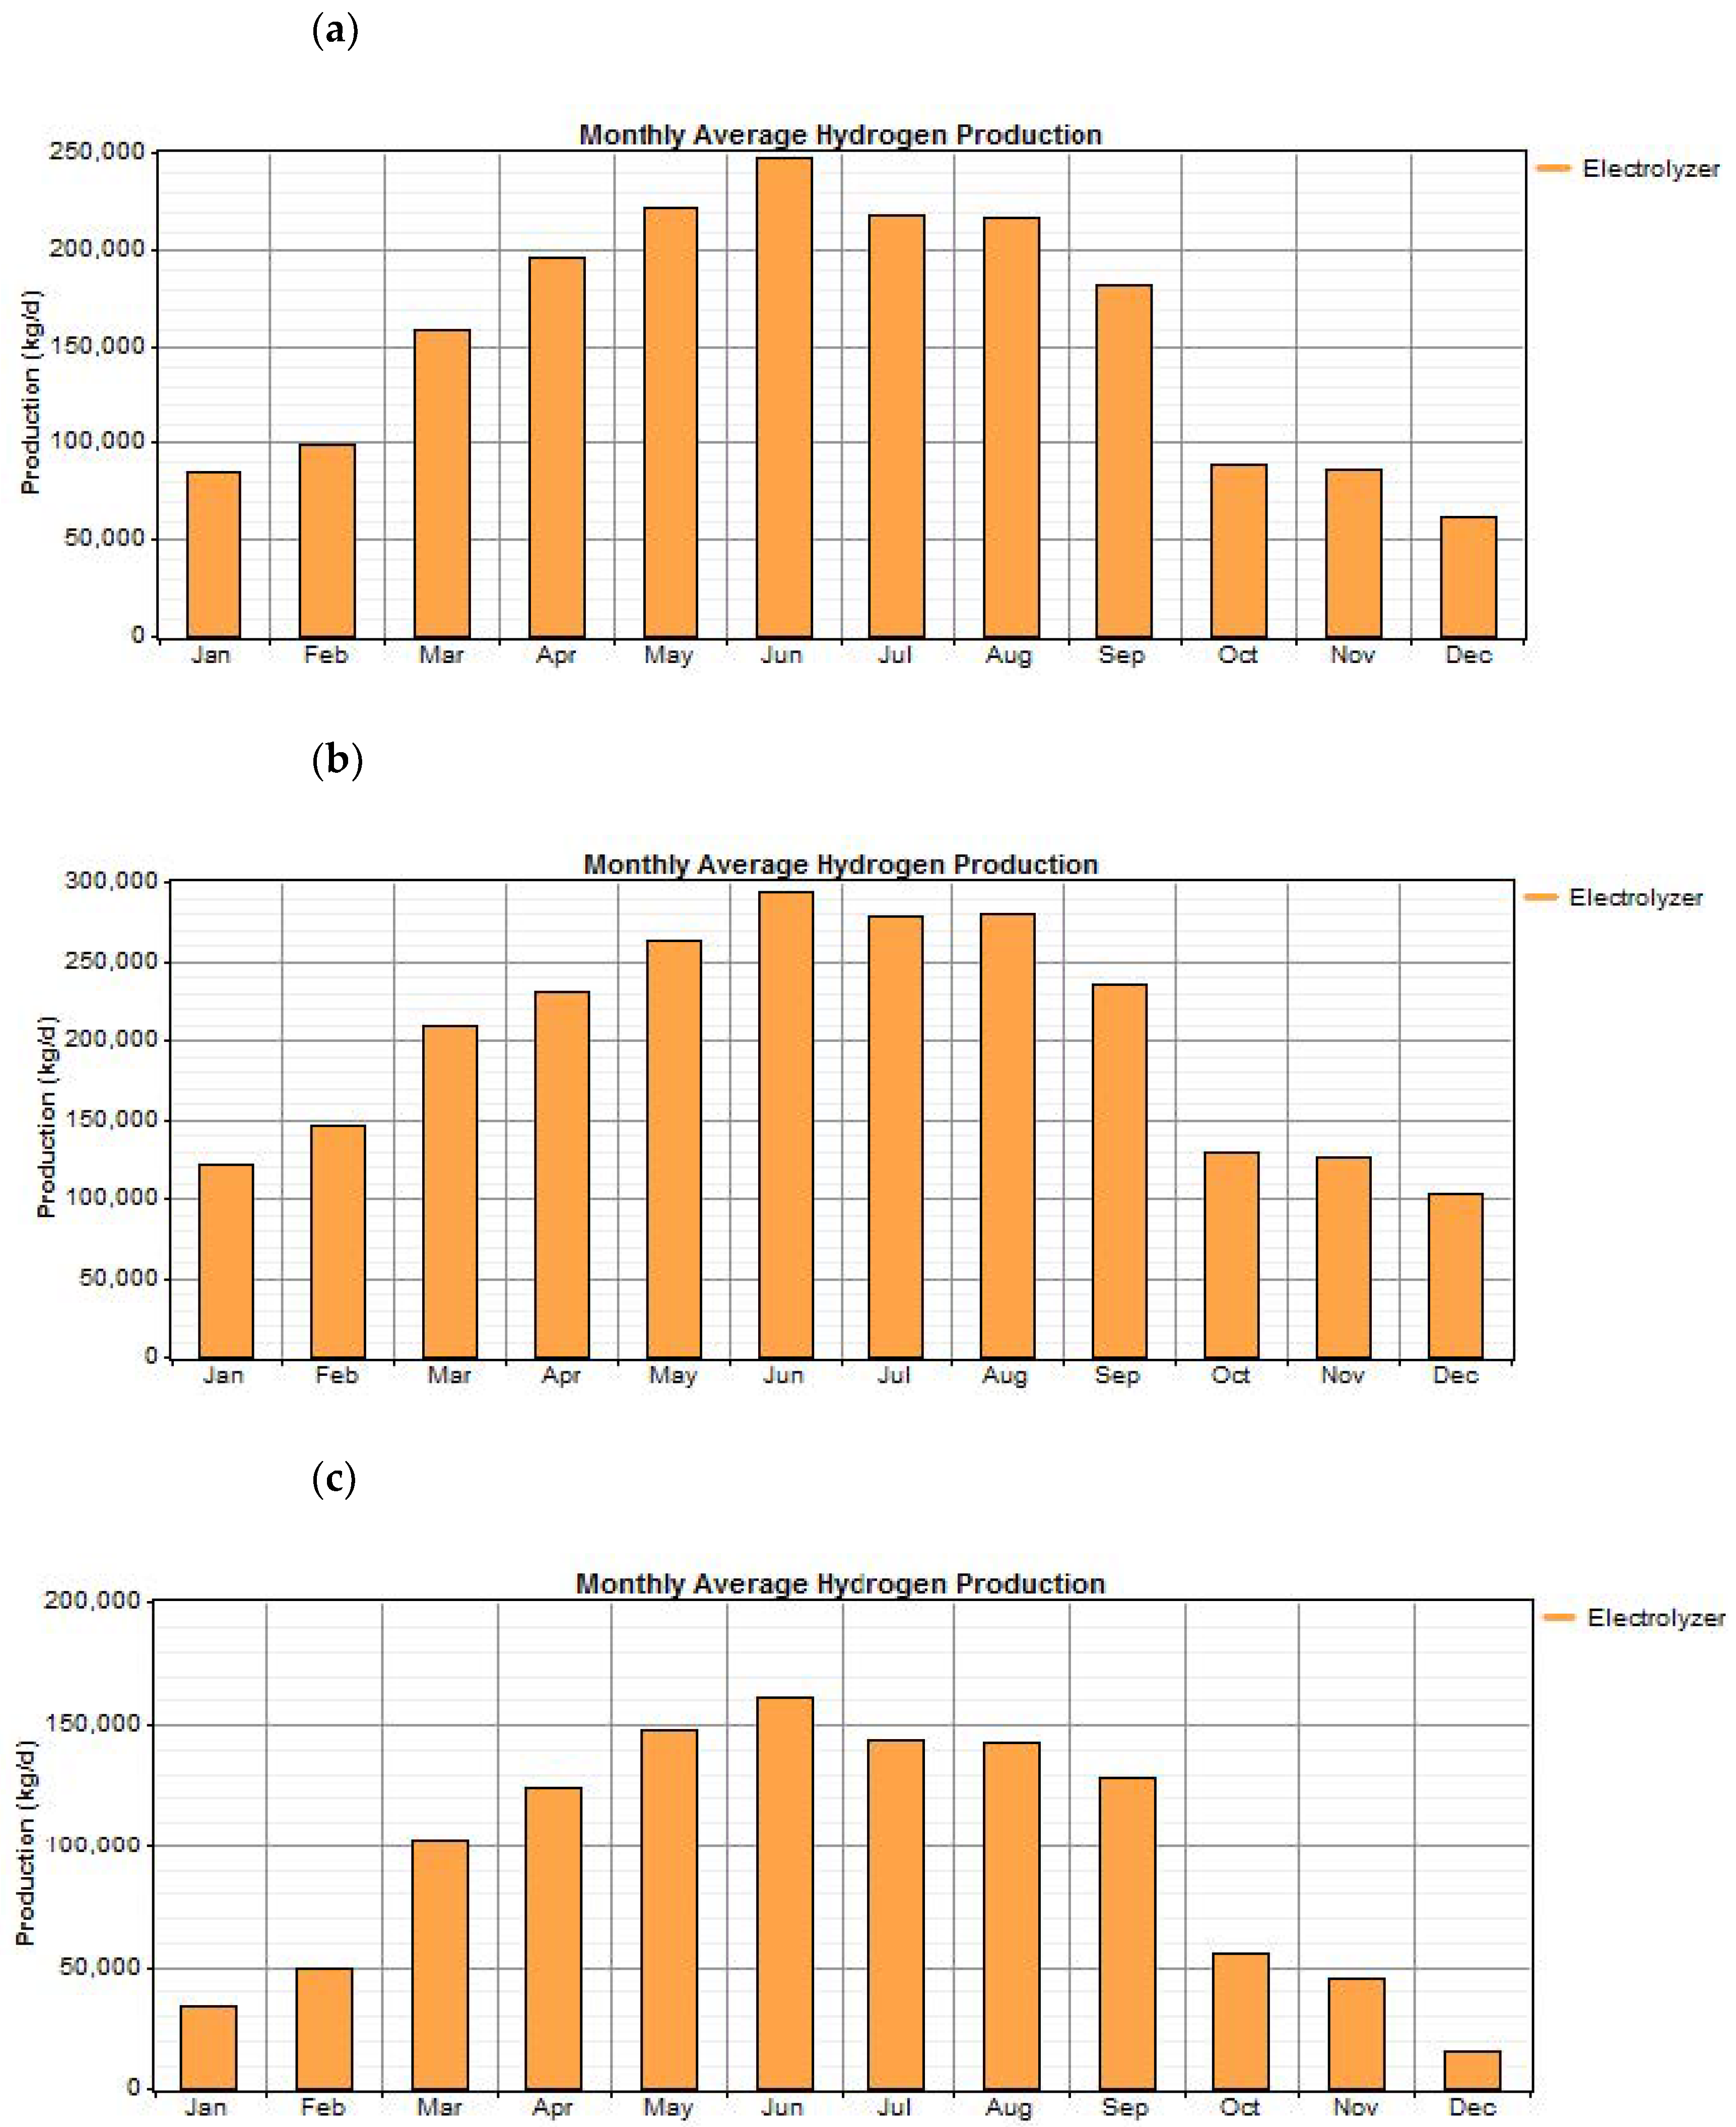
6.1. Surplus Electricity Used for Hydrogen Production

A map of the hourly available energy (surplus electricity) for hydrogen production in one entire year for the three scenarios under study is shown in Figure 11. Since scenario 0 DR has the most significant electricity excess, more hydrogen can be produced at the expense of producing it at a higher cost; in such a case, the electrolyzer set will be able to generate 4265 h/year, equivalent to 48.7% of an entire year. On the other hand, in scenario 1 DR, the electrolyzer set would generate 3691 h/year, equal to 42.1% of the year.

6.2. Electrolyzer and Hydrogen Storage Systems
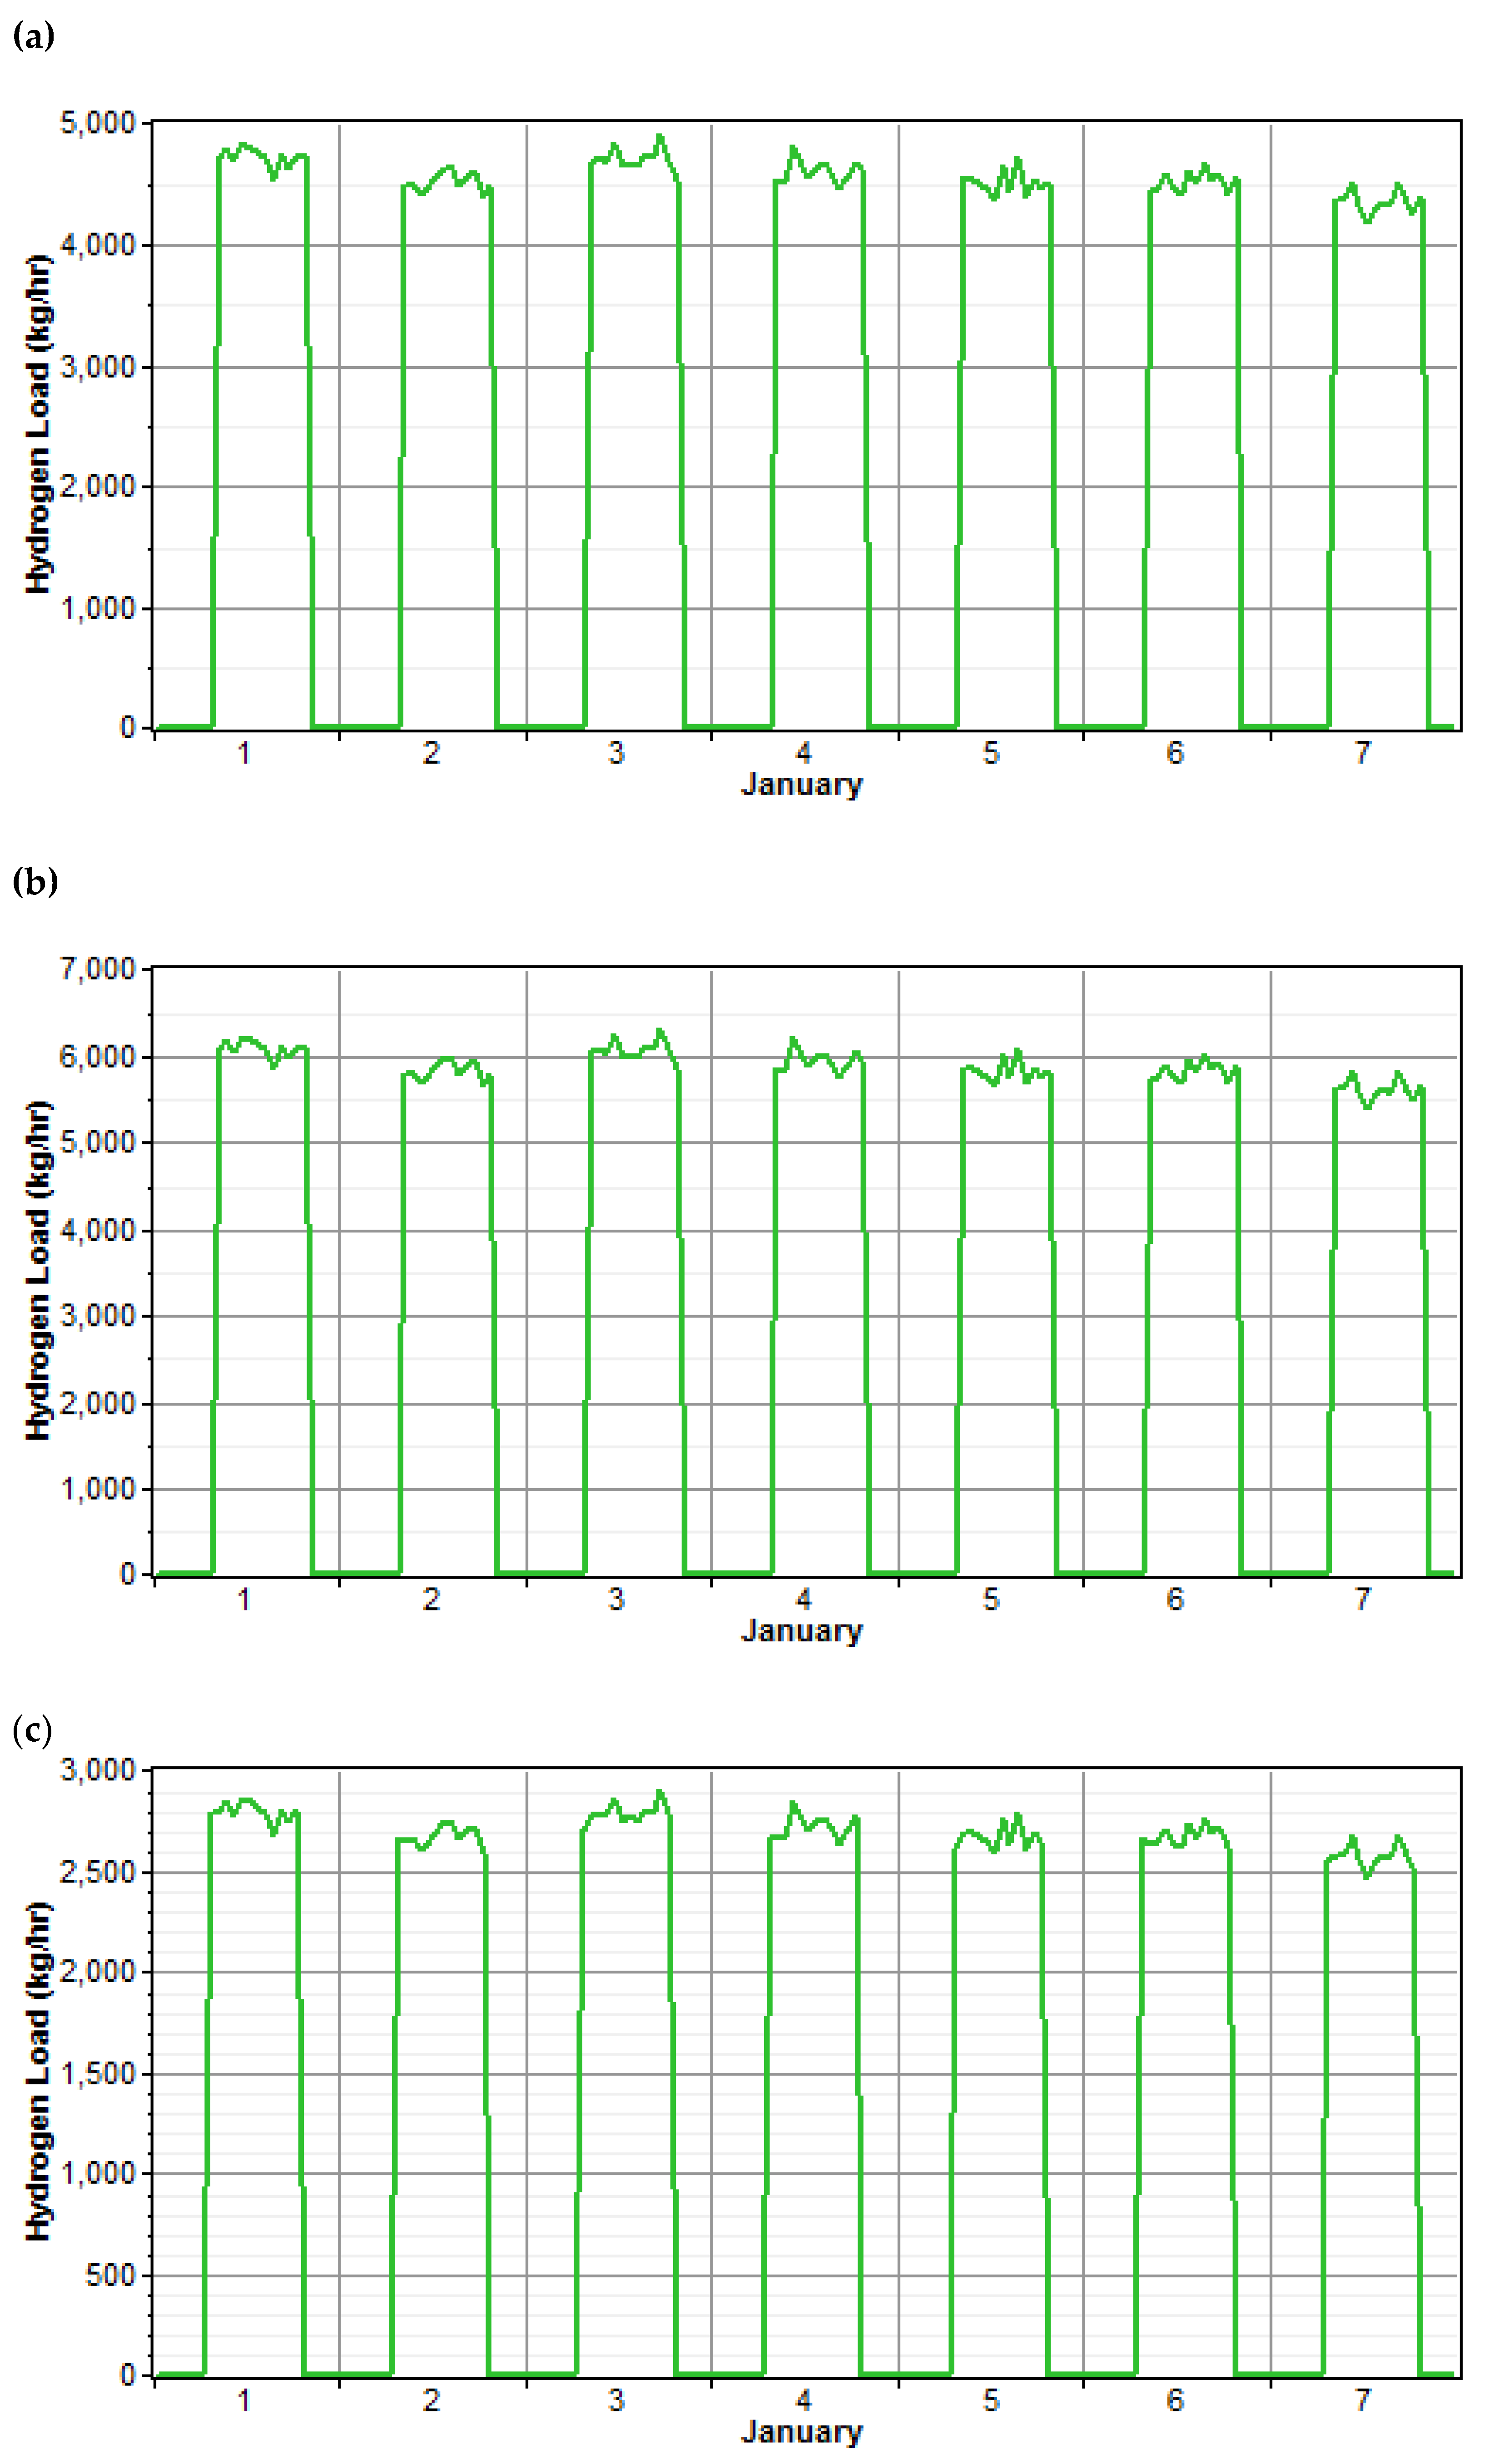
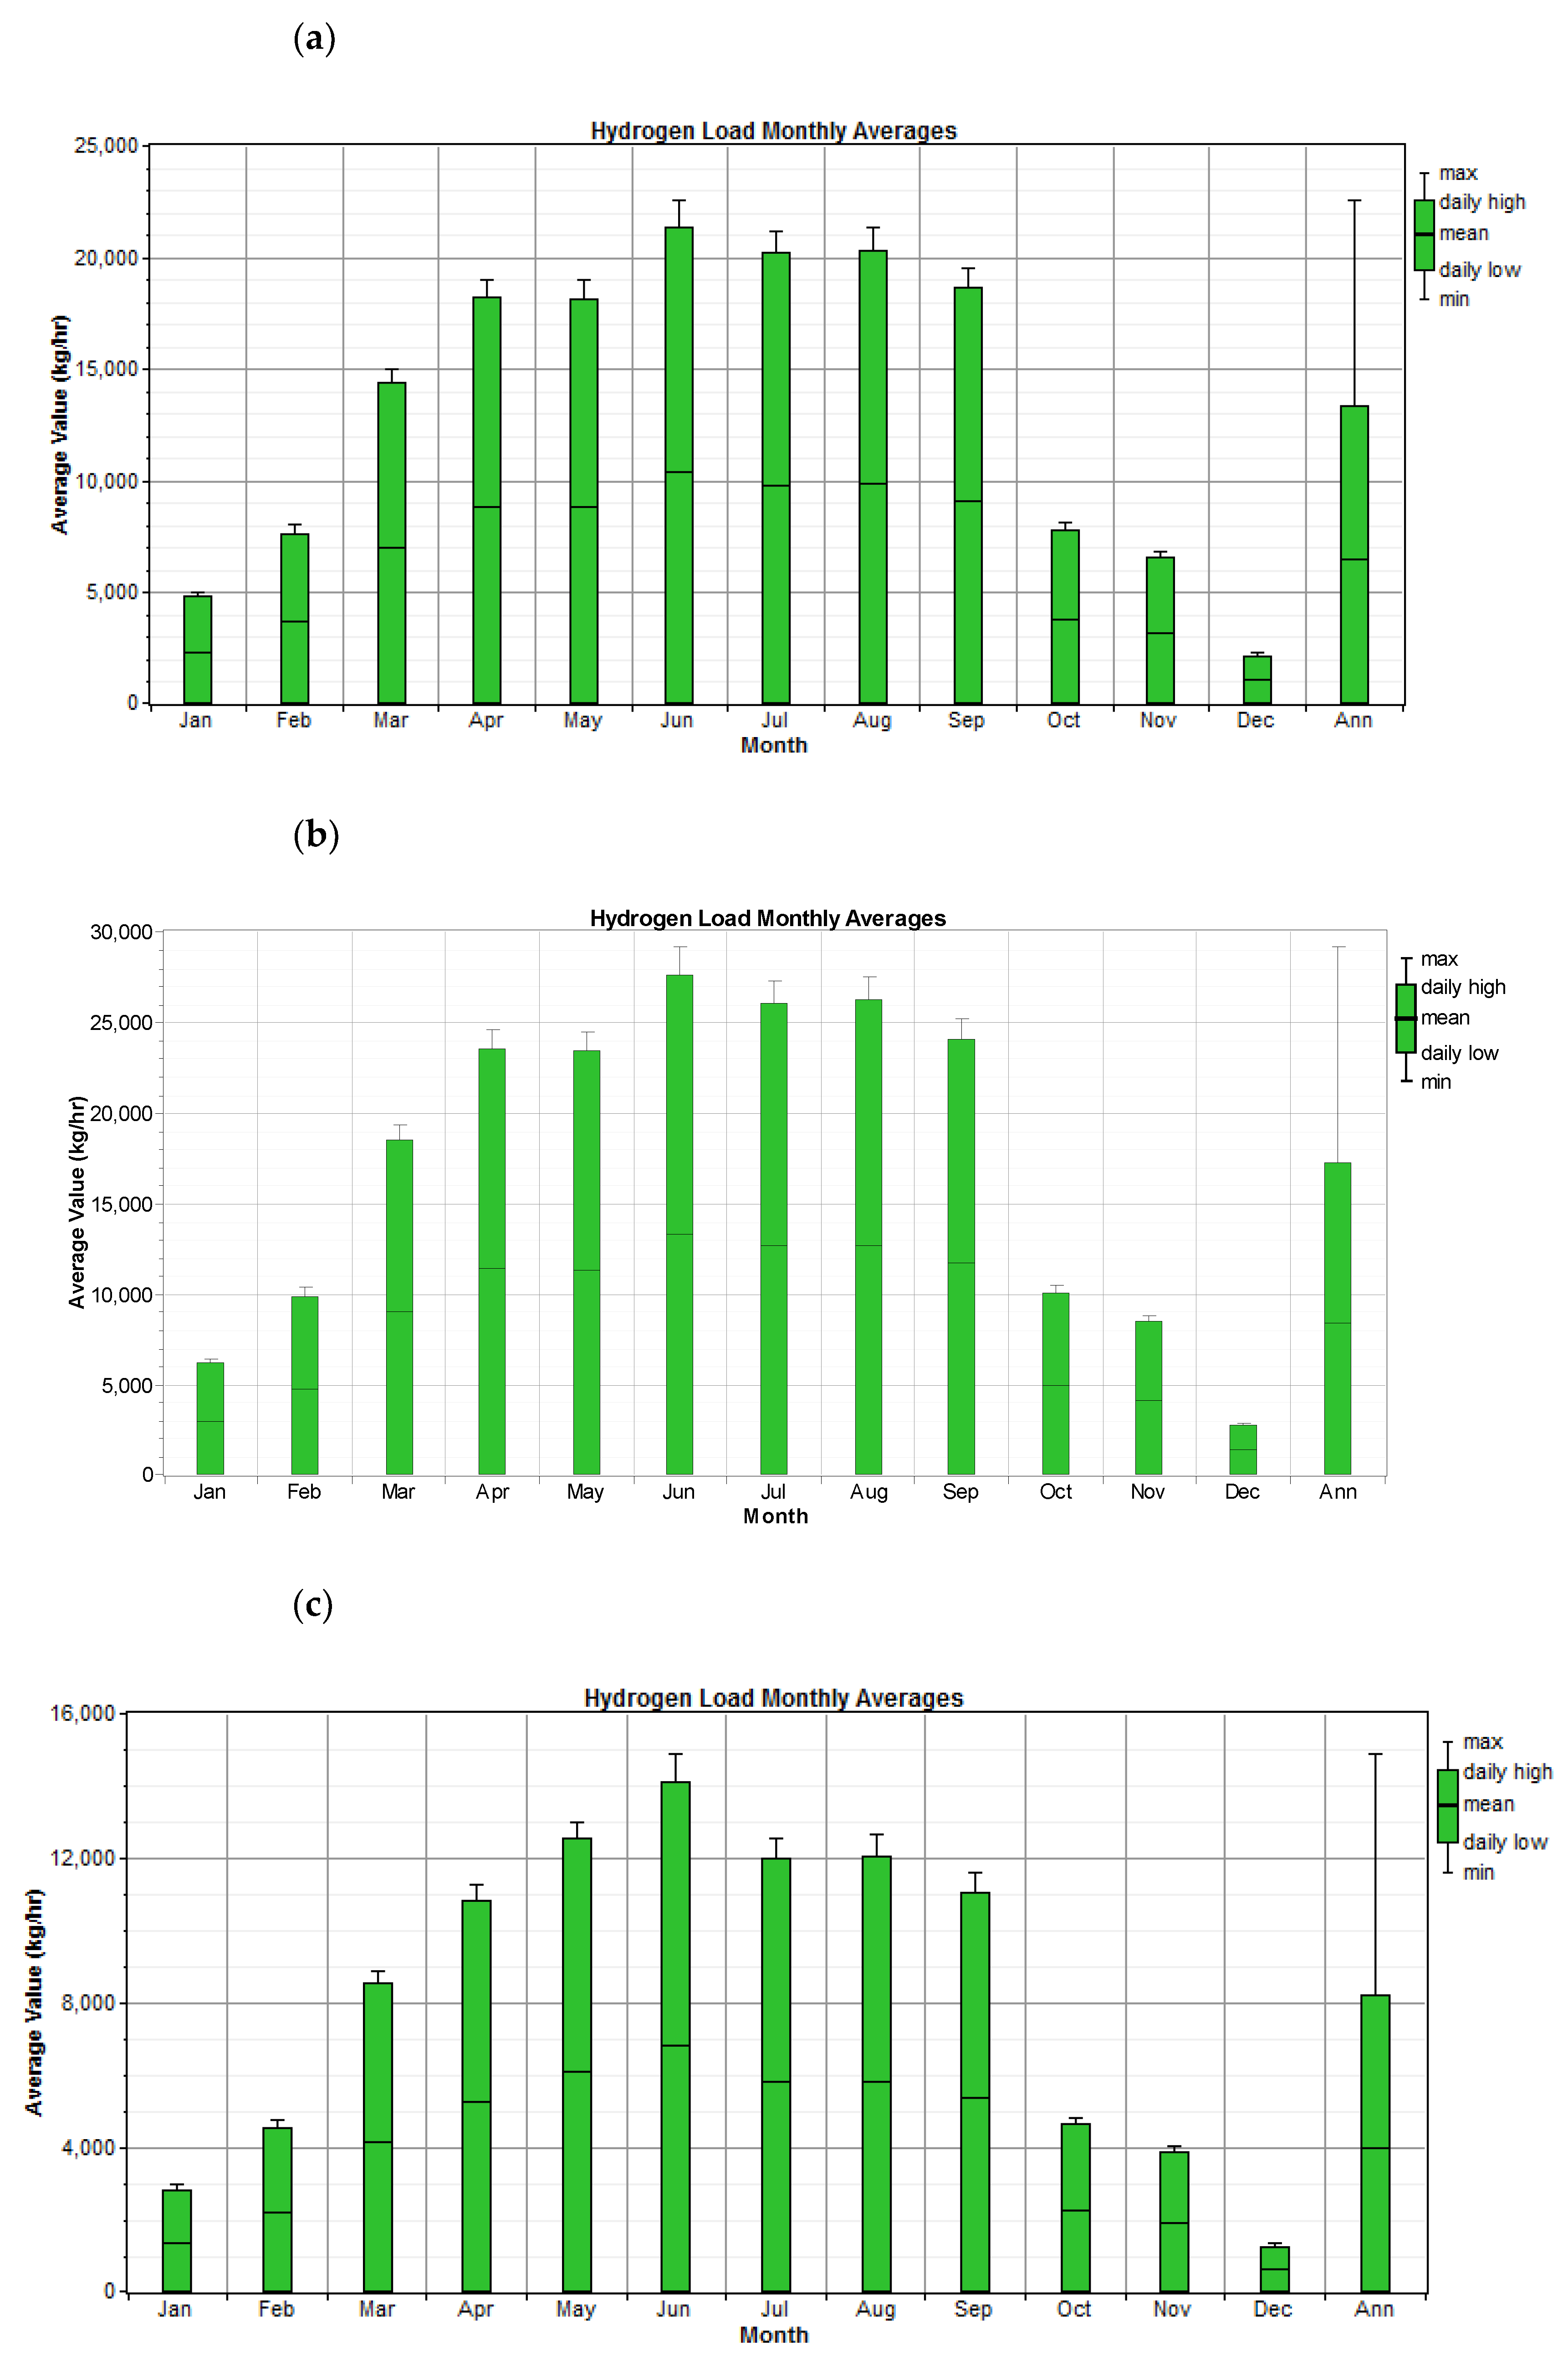
To carry out technical and economic analyses, information about the capacity and cost of the electrolyzer and the storage system is required. Table 1 shows information about the electrolyzer set and storage system used as an input for the simulations.

6.3. Hydrogen Load

Energy demand was adjusted to the energy surplus. To take profit from the excess electricity, reduce the storage system’s capacity, and consider regular business hours, the schedule for dispatching hydrogen is from 7 a.m. to 7 p.m. (Figure 12).
The average energy demand in one year is shown in Figure 13. As can be noticed, since the hydrogen demand was adjusted to the energy production, a big part of the energy comes from a PV system; in the summer, hydrogen production is more significant than in the winter.

7. Results

A summary of the simulations performed for the three scenarios under study is shown in Table 2 and Table 3. The significant aspects to highlight for each one of them are:
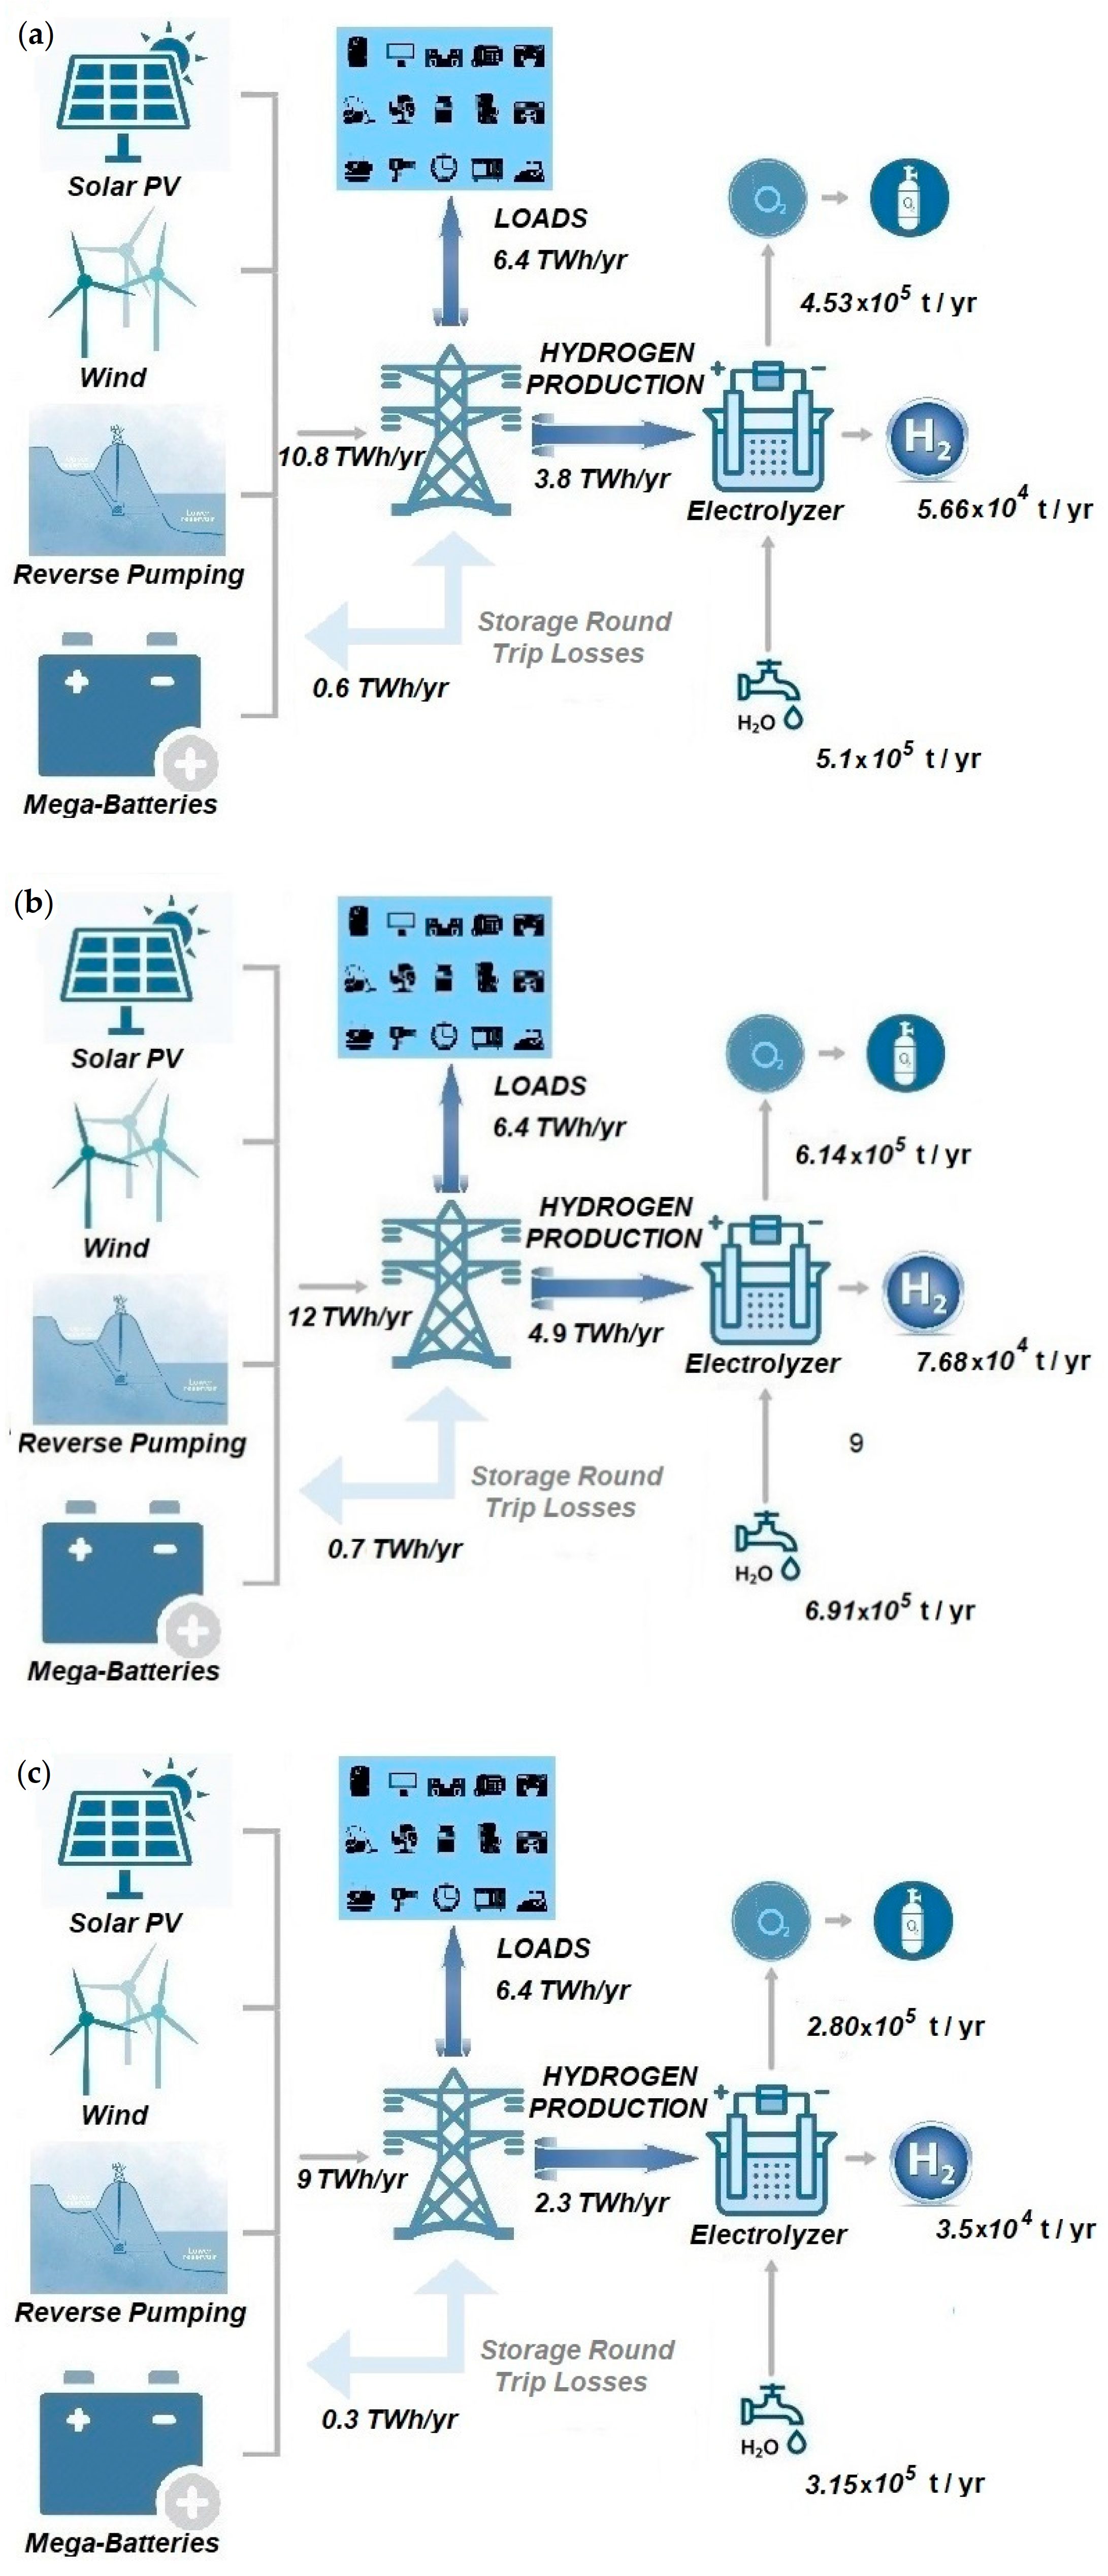
  • BAU scenario: In this scenario, there is an excess of 3.8 TWh/year, able to produce 56,600 t of hydrogen per year, equivalent to 1.9 TWh/year (in terms of lower heating values). The power required in the electrolyzer set is 250 MW. To store hydrogen profitably, a storage system with a capacity of 3000 t is needed (see Table 2). The required initial investment is EUR 2400 M; the O&M costs are around EUR 59 M/year, the COH is EUR 4.54/kg, and there is a total NPC cost of EUR 3150 M (See Table 3).
  • 0 DR scenario: In this scenario, there is an excess of 4.9 TWh, able to produce 76,600 t of hydrogen per year, equivalent to 5.56 TWh/year. The power required by the electrolyzer set is 300 MW. To store hydrogen profitably, a storage system with a capacity of 6000 t is needed (See Table 2). The required initial investment is EUR 3600 M; the O&M costs are around EUR 81 M/year, the COH is EUR 4.92/kg, and there is a total NPC cost of EUR 4600 M (See Table 3).
  • 1 DR scenario. In this scenario, there is an electricity excess of 2.3 TWh, able to produce 35,000 t of hydrogen per year, equivalent to 1.17 TWh/year. The power required in the electrolyzer set is 150 MW. To store hydrogen profitably, a storage system with a capacity of 1800 t is needed (See Table 2). The required initial investment is EUR 1500 M; the O&M costs are around EUR 34 M/year, the COH is EUR 4.06/kg, and there is a total NPC cost of EUR 1817 M (See Table 3).

7.1. Energy Analysis
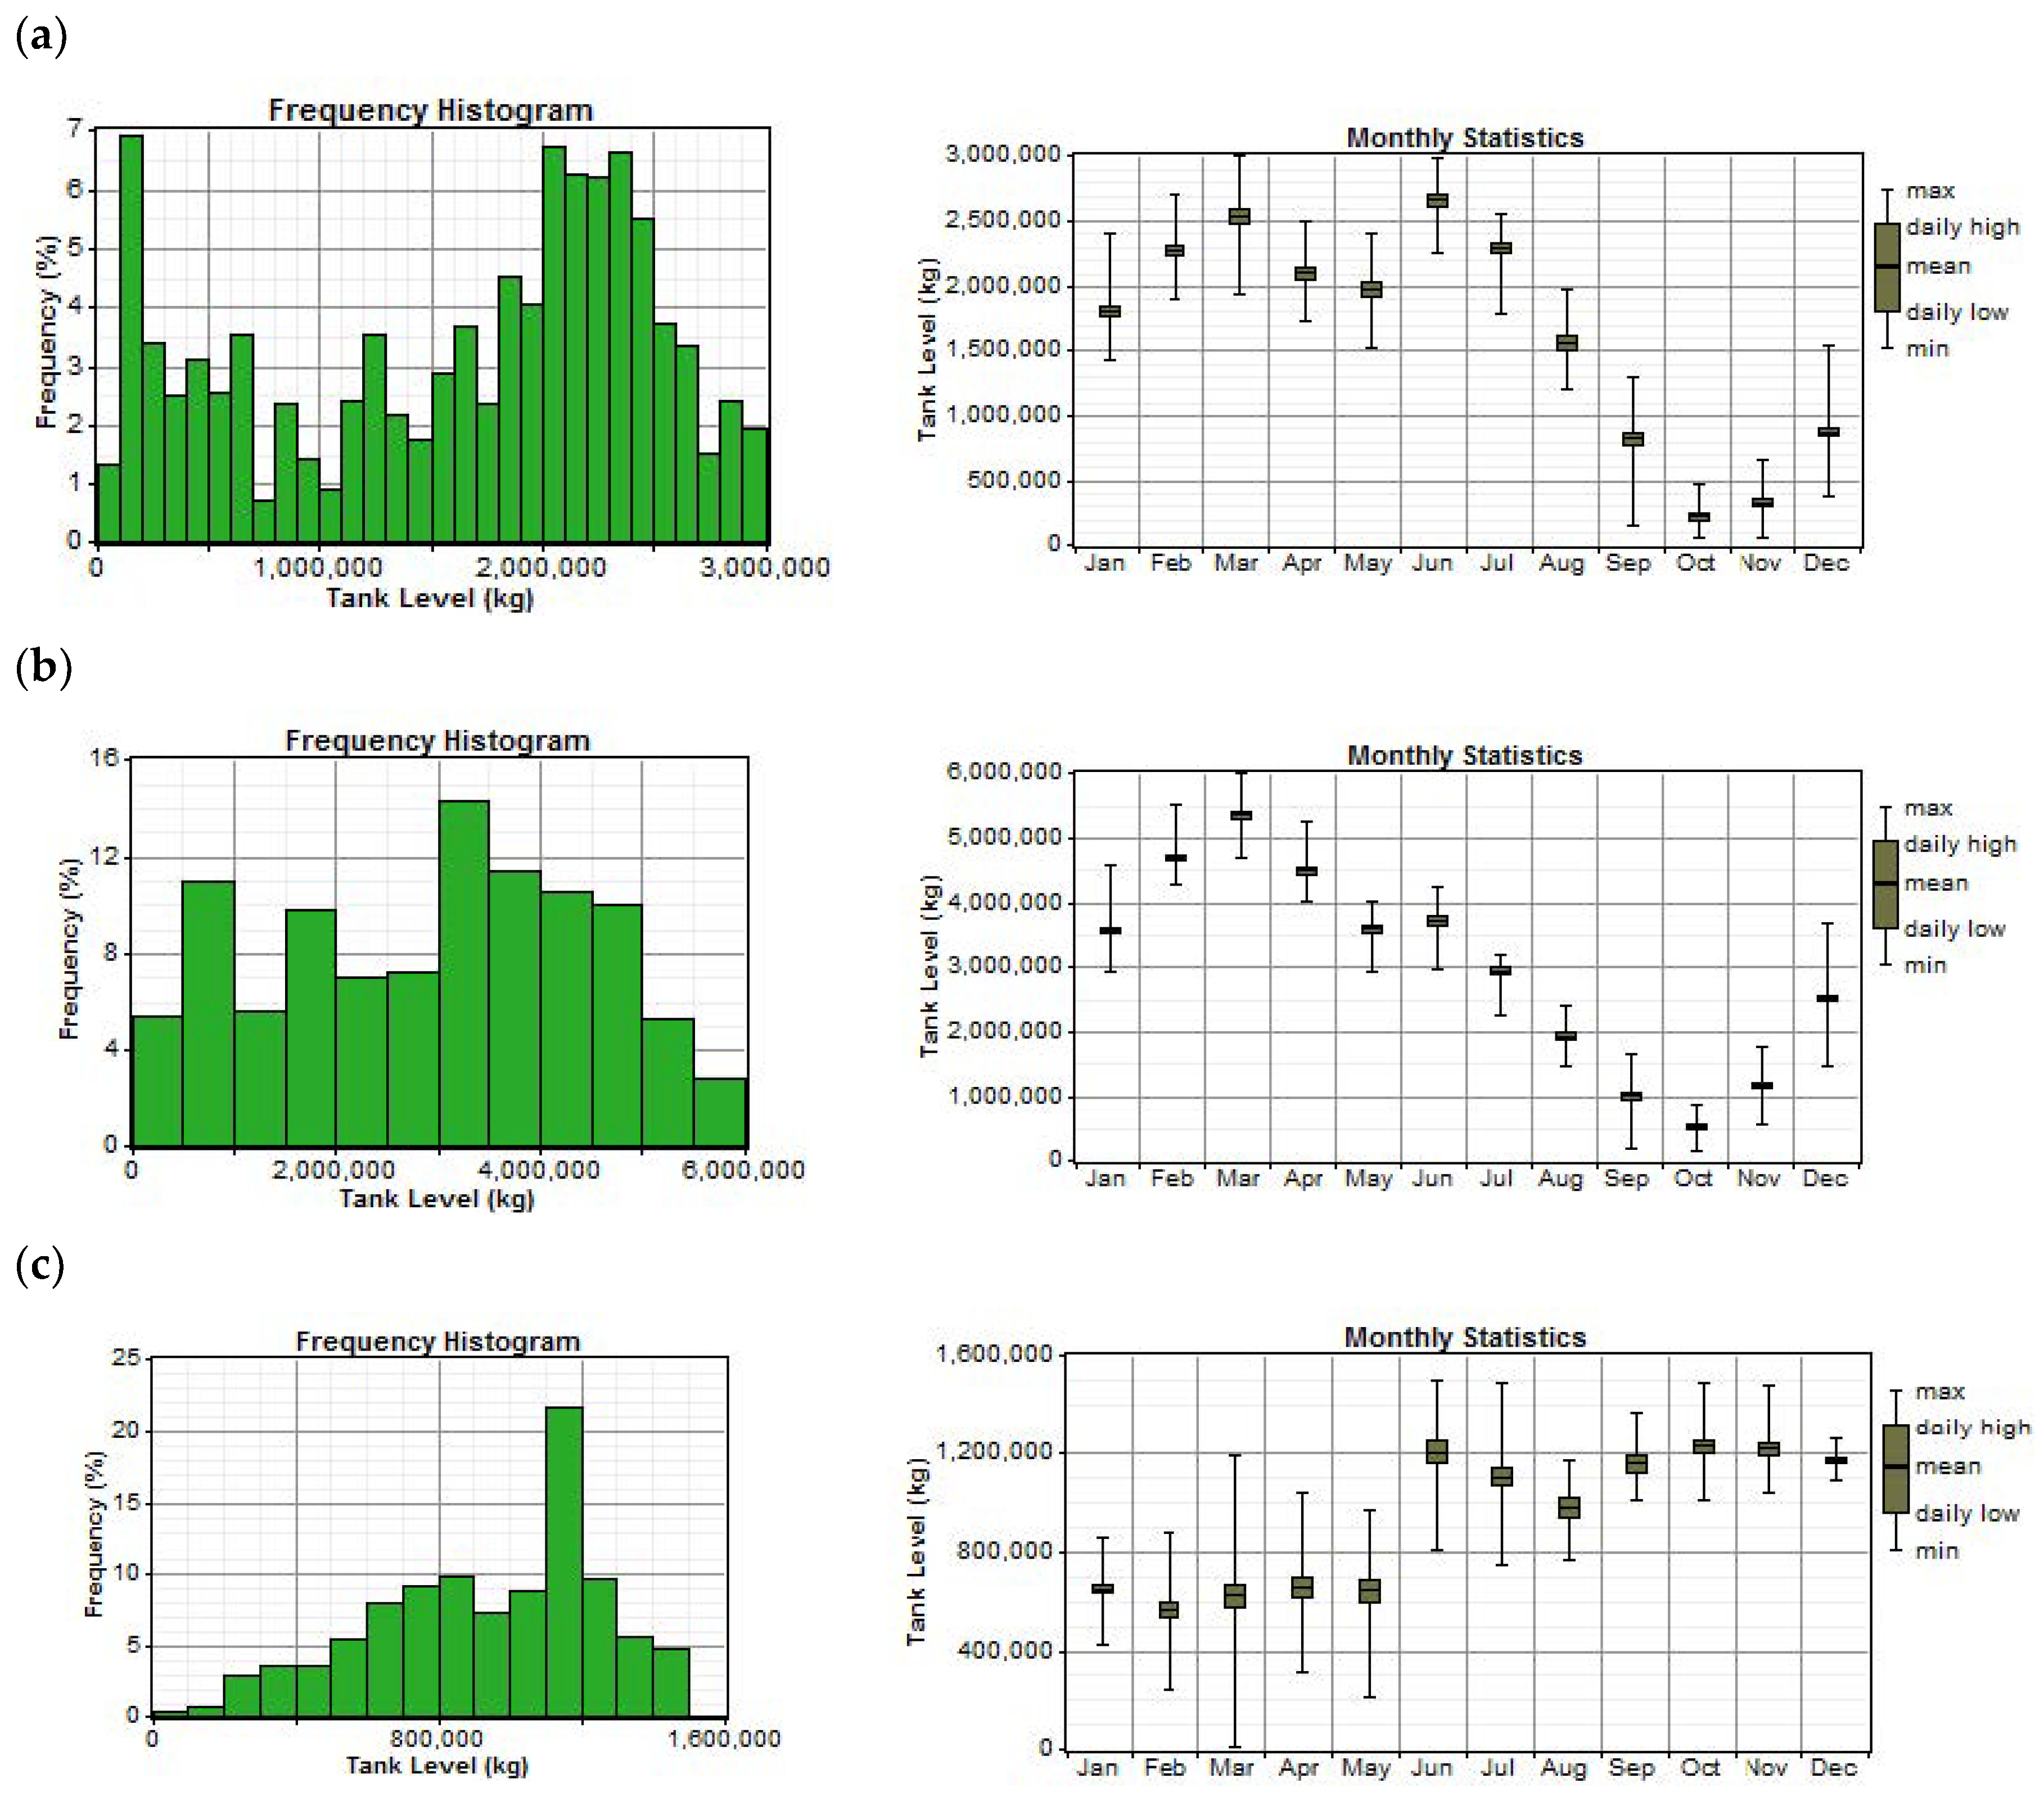
The excess of electricity, electrolyzer load, and lost energy for the three case scenarios are shown in Table 4. The lost energy is the electricity available from the excess but not used for hydrogen production. The storage system was fully charged, and the potential production was bigger than the hydrogen demanded.
The monthly hydrogen production is shown in Figure 14. In the BAU scenario, 56,600 t of H2 per year are generated, of which the majority is produced in the summer. The month with the most significant production is June, with 245 t/day on average. The worst month is December, with 65 t/day on average. In the 0 DR scenario, 76,600 t of H2 per year are produced. The month with the most significant production is June, with 295 t/day on average. The worst month is December, with 100 t/day on average. Finally, in the 1 DR scenario, 35,000 t of H2 per year are produced. The month with the most significant production is June, with 160 t/day on average. The worst month is December, with 15 t/day on average.

7.2. Storage System

The storage tank is an essential component to keep the stability of the H2 supply. On the other hand, it is a costly part of the system due to the energy consumption required to compress the H2, plus the cost of the tank. The best option cost size was obtained through HOMER for every scenario under study. The scenarios BAU and 0 DR are very similar regarding the tank levels throughout the year. In the case of the 1 DR scenario, the tank has enough capacity in the winter, but in March, the H2 demand almost used the tank’s total capacity (Figure 15).

7.3. Economic Analysis

The initial capital required to implement the systems needed for each scenario changes appreciably. The capital costs are pretty equilibrated for the three scenarios, being the initial investment divided approximately equally among all technologies. That is not the case for operation and maintenance (O&M) costs. The O&M costs of wind turbines are much higher than the rest and amount to more than half the total O&M costs.
A summary of the economic analysis is shown in Table 5. The highlight is that in all scenarios, despite the strong investments of the implemented systems, the return-on-investment periods are low. Therefore, all of them can be considered viable and profitable.
The economic results are summarized in Table 3. For the BAU scenario, the required initial investment is EUR 2400 M; the O&M costs are around EUR 59 M/year, the COH is EUR 4.54/kg, and there is a total NPC cost of EUR 3150 M. In the 0 DR scenario, the required initial investment is EUR 3600 M; the O&M costs are around EUR 81 M/year, the COH is EUR 4.92/kg, being and there is a total NPC cost of EUR 4600 M. Finally, in the 1 DR scenario, the required initial investment is EUR 1500 M; the O&M costs are around 34 EUR M/year, the COH is EUR 4.06/kg, and there is a total NPC cost of EUR 1817 M. The hydrogen cost in all the scenarios is competitive according to the literature review [47,48,49,50,51,52,53,54,55,56,57] in which the cost of hydrogen is in a broad range of EUR 6 to 21/kg.

7.4. Water Use and Oxygen Production Analysis

Since Grand Canary Island has very limited hydric resources, water desalination must be used to produce the water needed for hydrolysis. As advanced in previous sections, quantities around 3 × 10⁵ m3/year would be required to produce approximately 3 × 10⁷ kgH2/year, corresponding to the 1 TWh per year of the final energy demand of nonelectrifiable consumption. These water quantities represent less than 10% of the recently projected plants’ desalination capacity on Grand Canary Island [28]. The total costs of these desalination plants are around EUR 20 €. While typical desalination costs are EUR 1/m3 [38], these costs have to be considered, even though they are reduced compared with the rest of the hydrogen generation costs (EUR ~1 cent/kgH2 produced).
Therefore, the total amount of water demanded depends on the scenario. In particular, Table 6 displays the required water for the three scenarios analyzed, as long as the produced oxygen depends on the available electricity, i.e., the available electric energy, which determines the hydrogen generation capacity. Figure 12 summarizes the hydrogen generation data for all three scenarios, in particular, the electric energy generated and consumed by the loads and the storage round trip losses and storage available for hydrogen generation.
Regarding water demand, the BAU scenario uses the initially estimated water quantity, meaning the preliminary estimated water consumption. Even though the other two scenarios are more water-demanding, 75% and 125% higher approximately, this accounts for around 20% of the desalination capacity of the last planned facilities on the island (Figure 16). This aspect would need to be considered in case these scenarios were implemented. Even though, as advanced in the preliminary calculations, the cost increase in hydrogen production is only around EUR 1 cent/kgH2 produced.
Another aspect to consider is the production of a significant amount of oxygen as a byproduct of the water electrolyzation process. Oxygen could be recovered and stored in pressure vessels to be used later in the processes that require O2, for example, in sanitary use, welding, oxy-fuel, etc., which could be a value-added feature when implementing the electrolysis process.

8. Conclusions and Discussion

It is noteworthy that the European Union and Spain are increasing their efforts and even forcing the total decarbonization of the economy by 2050. There are plans to promote and accelerate the energy transition. Additionally, the extrapeninsular Spanish territories are fostering further legislative and energy planning developments along these lines. Specifically, an Energy Transition Plan (PTECan) is being developed to achieve full decarbonization of the Canary Islands’ economy ten years ahead of the proposed deadline.
The decarbonization of the economy presents many challenges. Due to the problems associated with their isolation, such challenges are even more significant in the case of the islands. However, they also present opportunities, such as the possibilities offered by the natural resources that are usually available. In this direction, this work closes the calculations previously carried out by the same group of researchers, in which different scenarios were analyzed to achieve a decarbonized energy system in 2040. This work shows that the decarbonization of the economy is both achievable and beneficial for the island of Gran Canaria. It should be added that the method presented can be extended to each island of the Archipelago and to other regions with similar features. A key aspect for achieving the economic decarbonization is the removal of greenhouse gases from electricity generation systems, in addition to conducting the full electrification of all energy consumption. In previous works, several scenarios of electricity generation systems based on zero-emission technologies were analyzed for the case of Grand Canary Island. But in all of them, there remained a series of final energy consumptions that cannot be electrified, or their electrification poses serious problems (maritime, air, heavy land transport, some industrial processes, etc.). To be able to reach the decarbonization of these uses, the technology that is currently best positioned is the use of hydrogen as an energy vector. In the analysis carried out in this work, the excess electricity estimated in the previous results for Grand Canary Island was used to produce the hydrogen necessary for these nonelectrifiable uses.
In the scenarios considered, the hourly curves of excess electricity were used as the input for the hydrogen generation and its storage system, using the HOMER code. Thus, the hydrogen generation capacities and associated costs were estimated, and it has been shown that only with the excess of a fully renewable system is it possible to produce the hydrogen needed to cover the final energy uses of the nonelectrifiable part of the economy. In fact, not only can this demand be covered, but depending on the future scenario considered, there is excess hydrogen that could be sold to third parties, so the investment to be carried out is more profitable.
As mentioned above, the results of previous research on the optimal generation MIX for Grand Canary Island in the scenarios considered were used. Specifically, the results of the BAU scenario, one without demand response and another with demand response, are shown, in which the energy surpluses were 3.8, 4.9, and 2.3 TWh/year, respectively. So, based on these electricity surpluses, the optimization of hydrogen production and its storage systems was carried out, always covering at least the forecasted final hydrogen demand of the island. As a result, we concluded that, in the BAU scenario, without demand response and with demand response scenarios, it is possible to produce 5.66 × 10⁴, 7.68 × 10⁴, and 3.5 × 10⁴ tons of H2/year. To feed water to these electrolyzers, it would require about 3.15 to 6.91 × 10⁵ tons of water; however, it was concluded that these quantities and associated desalination cost were entirely affordable. Oxygen is produced as a byproduct, namely 2.8 × 10⁵ to 6.14 × 10⁵ tons/year, which could be used for other purposes, with the corresponding extra benefit. H2 production and storage costs are in the range of EUR 4–5/kg in the three scenarios (4.54, 4.92, and 4.06 for the BAU, 0 DR, and 1 DR scenarios, respectively), a competitive cost. This amount should be incremented by approximately EUR 0.3–0.6/kgH2, depending on the distance to be transported within the island (from a few to 100 km at most). It should also be noted that in the first two scenarios (BAU and 0 DR), there is a considerable excess of H2, allowing for its sale to third parties to be studied.

Author Contributions

Conceptualization, C.V.-S. and C.B.-E.; methodology, C.V.-S. and C.B.-E.; software, C.V.-S., D.A.-S.; validation, A.E.-C., C.B.-E. and D.A.-S.; formal analysis, A.E.-C. and D.A.-S.; investigation, C.B.-E. and C.V.-S.; resources, A.E.-C. and D.A.-S.; data curation, C.V.-S. and C.B.-E.; writing—original draft preparation, C.V.-S. and C.B.-E.; writing—review and editing, A.E.-C. and D.A.-S.; visualization, D.A.-S.; supervision, A.E.-C.; funding acquisition, A.E.-C. and C.V.-S. All authors have read and agreed to the published version of the manuscript.

Funding

This study has been in part supported by the “Cátedra de Transición Energética Urbana, Universitat Politècnica de València”.

Acknowledgments

Thanks to the “Cátedra de Transición Energética Urbana, Universitat Politècnica de València” for the given support.

Conflicts of Interest

The authors declare no conflict of interest.

References

  1. IEA (International Energy Agency). World Energy Outlook 2020—Analysis; IEA: Paris, France, 2020; Available online: https://www.iea.org/reports/world-energy-outlook-2020 (accessed on 20 October 2021).
  2. IEA (International Energy Agency). Global Energy Review 2021—Analysis; IEA: Paris, France, 2021; Available online: https://www.iea.org/reports/global-energy-review-2021 (accessed on 20 October 2021).
  3. IEA (International Energy Agency). SDG7: Data and Projections; IEA: Paris, France, 2020; Available online: https://www.iea.org/reports/sdg7-data-and-projections (accessed on 17 May 2022).
  4. Vargas-Salgado, C.; Berna-Escriche, C.; Escrivá-Castells, A.; Díaz-Bello, D. Optimization of All-Renewable Generation Mix According to Different Demand Response Scenarios to Cover All the Electricity Demand Forecast by 2040: The Case of the Grand Canary Island. Sustainability 2022, 14, 1738. [Google Scholar] [CrossRef]
  5. Nzotcha, U.; Nsangou, J.C.; Kenfack, J.; Ngohe-Ekam, P.S.; Hamandjoda, O.; Bignom, B. Combining electric energy storage and deep-lake degassing by means of pumped hydropower. Appl. Energy 2021, 304, 117839. [Google Scholar] [CrossRef]
  6. Berna-Escriche, C.; Pérez-Navarro, Á.; Escrivá, A.; Hurtado, E.; Muñoz-Cobo, J.L.; Moros, M.C. Methodology and application of statistical techniques to evaluate the reliability of electrical systems based on the use of high variability generation sources. Sustainability 2021, 13, 10098. [Google Scholar] [CrossRef]
  7. Meng, Y.; Zhou, R.; Dinçer, H.; Yüksel, S.; Wang, C. Analysis of inventive problem-solving capacities for renewable energy storage investments. Energy Rep. 2021, 7, 4779–4791. [Google Scholar] [CrossRef]
  8. Bataille, C.; Nilsson, L.J.; Jotzo, F. Industry in a net-zero emissions world: New mitigation pathways, new supply chains, modelling needs and policy implications. Energy Clim. Chang. 2021, 2, 100059. [Google Scholar] [CrossRef]
  9. Çabukoglu, E.; Georges, G.; Küng, L.; Pareschi, G.; Boulouchos, K. Fuel cell electric vehicles: An option to decarbonize heavy-duty transport? Results from a Swiss case-study. Transp. Res. Part D Transp. Environ. 2019, 70, 35–48. [Google Scholar] [CrossRef]
  10. Bach, H.; Bergek, A.; Bjørgum, Ø.; Hansen, T.; Kenzhegaliyeva, A.; Steen, M. Implementing maritime battery-electric and hydrogen solutions: A technological innovation systems analysis. Transp. Res. Part D Transp. Environ. 2020, 87, 102492. [Google Scholar] [CrossRef]
  11. Xiang, H.; Ch, P.; Nawaz, M.A.; Chupradit, S.; Fatima, A.; Sadiq, M. Integration and economic viability of fueling the future with green Hydrogen: An integration of its determinants from renewable economics. Int. J. Hydrogen Energy 2021, 46, 38145–38162. [Google Scholar] [CrossRef]
  12. Chiefari, J.; Hornung, C. Mobile hydrogen reformers as a novel approach to decarbonise the transport sector. Curr. Opin. Chem. Eng. 2021, 34, 100756. [Google Scholar] [CrossRef]
  13. Fan, L.; Tu, Z.; Chan, S.H. Recent development of Hydrogen and fuel cell technologies: A review. Energy Rep. 2021, 7, 8421–8446. [Google Scholar] [CrossRef]
  14. Cagalitan, D.D.T.F.; Abundo, M.L.S. A review of biohydrogen production technology for application towards hydrogen fuel cells. Renew. Sustain. Energy Rev. 2021, 151, 111413. [Google Scholar] [CrossRef]
  15. Wu, Y.; Liu, F.; He, J.; Wu, M.; Ke, Y. Obstacle identification, analysis and solutions of hydrogen fuel cell vehicles for application in China under the carbon neutrality target. Energy Policy 2021, 159, 112643. [Google Scholar] [CrossRef]
  16. Shet, S.P.; Priya, S.S.; Sudhakar, K.; Tahir, M. A review on current trends in potential use of metal-organic framework for hydrogen storage. Int. J. Hydrogen Energy 2021, 46, 11782–11803. [Google Scholar] [CrossRef]
  17. Cesaro, Z.; Ives, M.; Nayak-Luke, R.; Mason, M.; Bañares-Alcántara, R. Ammonia to power: Forecasting the levelized cost of electricity from green ammonia in large-scale power plants. Appl. Energy 2021, 282, 116009. [Google Scholar] [CrossRef]
  18. Cardoso, J.S.; Silva, V.; Rocha, R.C.; Hall, M.J.; Costa, M.; Eusébio, D. Ammonia as an energy vector: Current and future prospects for low-carbon fuel applications in internal combustion engines. J. Clean. Prod. 2021, 296, 126562. [Google Scholar] [CrossRef]
  19. Sustainability Report 2021|Yara International. n.d. Available online: https://www.yara.com/this-is-yara/sustainability/sustainability-reporting/latest-sustainability-report/ (accessed on 22 June 2022).
  20. MARITIME FORECAST TO 2050, Energy Transition Outlook 2019. n.d. Available online: https://eto.dnv.com/2021/maritime-forecast-2050/about#:~:text=Offers%20shipowners%20practical%20advice%20and,demands%20from%20investors%20and%20institutions (accessed on 22 June 2022).
  21. Monitor Deloitte, Los Territorios no Peninsulares Descarbonizados en 2040, Deloitte. 2021. Available online: https://www2.deloitte.com/es/es/pages/strategy/articles/territorios-no-peninsulares-descarbonizados-2040.html (accessed on 20 October 2021).
  22. Gobierno de Canarias (GCAN); Ministerio para la Transición Energética y el Reto Demográfico (MITECO); Instituto para la Diversificación y Ahorro de la Energía (IDAE). Estrategia de Energía Sostenible en las Islas Canarias; Gobierno de Canarias (GCAN); Ministerio para la Transición Energética y el Reto Demográfico (MITECO); Instituto para la Diversificación y Ahorro de la Energía (IDAE): Madrid, Spain, 2022; Available online: https://www.lamoncloa.gob.es/serviciosdeprensa/notasprensa/transicion-ecologica/Documents/2022/160222_EstrategiaSostenible_Canarias.pdf (accessed on 5 July 2022).
  23. Gobierno de Canarias, I.T.d.C.-G. Estrategia del Vehículo Eléctrico de Canarias. 2021. Available online: https://www.gobiernodecanarias.org/energia/descargas/SDE/Portal/Planificacion/Estrategias/D3_Estrategia_Vehiculo_Electrico.pdf (accessed on 5 July 2022).
  24. European Commission. PHOTOVOLTAIC GEOGRAPHICAL INFORMATION SYSTEM—PVGIS. n.d. Available online: https://re.jrc.ec.europa.eu/pvg_tools/en/#PVP (accessed on 17 June 2022).
  25. MERRA-2. n.d. Available online: https://gmao.gsfc.nasa.gov/reanalysis/MERRA-2/docs/ (accessed on 18 May 2021).
  26. Dirección General de Energía del Gobierno de Canarias. Estrategia de Almacenamiento Energético. 2021. Available online: https://www.gobiernodecanarias.org/energia/descargas/SDE/Portal/Planificacion/Estrategias/D2_Estrategia_Almacenamiento.pdf (accessed on 5 July 2022).
  27. Letcher, T.M. Storing Energy: With Special Reference to Renewable Energy Sources; Elsevier: Amsterdam, The Netherlands, 2022; Available online: https://books.google.com/books/about/Storing_Energy.html?id=d7SBzgEACAAJ (accessed on 20 October 2021).
  28. Menéndez, J.; Fernández-Oro, J.M.; Galdo, M.; Loredo, J. Efficiency analysis of underground pumped storage hydropower plants. J. Energy Storage 2020, 28, 101234. [Google Scholar] [CrossRef]
  29. Gobierno de Canarias, ANUARIO ENERGÉTICO DE CANARIAS 2019. 2020. Available online: http://www.gobiernodecanarias.org/istac/jaxi-istac/menu.do?uripub=urn:uuid:131cf873-66a9-408d-8cfa-537d6be05067 (accessed on 14 June 2022).
  30. Denmark and Norway Team Up to Build World’s Largest Hydrogen Ferry–EURACTIV.com. n.d. Available online: https://www.euractiv.com/section/energy/news/denmark-and-norway-team-up-to-build-worlds-largest-hydrogen-ferry/ (accessed on 22 June 2022).
  31. Burton, N.A.; Padilla, R.v.; Rose, A.; Habibullah, H. Increasing the efficiency of hydrogen production from solar powered water electrolysis. Renew. Sustain. Energy Rev. 2021, 135, 110255. [Google Scholar] [CrossRef]
  32. The Future of Hydrogen—Analysis—IEA. n.d. Available online: https://www.iea.org/reports/the-future-of-hydrogen (accessed on 22 June 2022).
  33. Brändle, G.; Schönfisch, M.; Schulte, S. Estimating long-term global supply costs for low-carbon hydrogen. Appl. Energy 2021, 302, 117481. [Google Scholar] [CrossRef]
  34. Planta de hidrógeno verde de Puertollano—Iberdrola. n.d. Available online: https://www.iberdrola.com/conocenos/lineas-negocio/proyectos-emblematicos/puertollano-planta-hidrogeno-verde (accessed on 22 June 2022).
  35. Enagás y Naturgy Estudian Producir Hidrógeno verde a Partir de 350 MW de Energía Eólica en Asturias. n.d. Available online: www.enagas.es (accessed on 22 June 2022).
  36. Power to Green Hydrogen Mallorca|ACCIONA|Business as Unusual. n.d. Available online: https://www.acciona.com/es/proyectos/power-to-green-hydrogen-mallorca/?_adin=01833301559 (accessed on 22 June 2022).
  37. El Nuevo Hub de Hidrógeno Verde En Canarias. Available online: https://hidrogeno-verde.es/el-nuevo-hub-de-hidrogeno-verde-en-canarias/ (accessed on 13 September 2022).
  38. Wang, X.; Palazoglu, A.; El-Farra, N.H. Operational optimization and demand response of hybrid renewable energy systems. Appl. Energy 2015, 143, 324–335. [Google Scholar] [CrossRef]
  39. Suresh, G.; Prasad, D.; Gopila, M. An efficient approach based power flow management in smart grid system with hybrid renewable energy sources. Renew. Energy Focus 2021, 39, 110–122. [Google Scholar] [CrossRef]
  40. Dawood, F.; Shafiullah, G.M.; Anda, M. Stand-Alone Microgrid with 100% Renewable Energy: A Case Study with Hybrid Solar PV-Battery-Hydrogen. Sustainability 2020, 12, 2047. [Google Scholar] [CrossRef]
  41. González, I.; Calderón, A.J.; Portalo, J.M. Innovative Multi-Layered Architecture for Heterogeneous Automation and Monitoring Systems: Application Case of a Photovoltaic Smart Microgrid. Sustainability 2021, 13, 2234. [Google Scholar] [CrossRef]
  42. Balasubramanian, S.; Balachandra, P. Effectiveness of demand response in achieving supply-demand matching in a renewables dominated electricity system: A modelling approach. Renew. Sustain. Energy Rev. 2021, 147, 111245. [Google Scholar] [CrossRef]
  43. Wang, J.; Li, D.; Lv, X.; Meng, X.; Zhang, J.; Ma, T.; Pei, W.; Xiao, H. Two-Stage Energy Management Strategies of Sustainable Wind-PV-Hydrogen-Storage Microgrid Based on Receding Horizon Optimization. Energies 2022, 15, 2861. [Google Scholar] [CrossRef]
  44. Cecilia, A.; Carroquino, J.; Roda, V.; Costa-Castelló, R.; Barreras, F. Optimal Energy Management in a Standalone Microgrid, with Photovoltaic Generation, Short-Term Storage, and Hydrogen Production. Energies 2020, 13, 1454. [Google Scholar] [CrossRef]
  45. Vargas-Salgado, C.; Aparisi-Cerdá, I.; Alfonso-Solar, D.; Gómez-Navarro, T. Can Photovoltaic Systems Be Profitable in Urban Areas? Analysis of Regulation Scenarios for Four Cases in Valencia City (Spain). Sol. Energy 2022, 233, 461–477. [Google Scholar] [CrossRef]
  46. Berna-Escriche, C.; Vargas-Salgado, C.; Alfonso-Solar, D.; Escrivá-Castells, A. Can a fully renewable system with storage cost-effectively cover the total demand of a big scale standalone grid? Analysis of three scenarios applied to the Grand Canary Island, Spain by 2040. J. Energy Storage 2022, 52, 104774. [Google Scholar] [CrossRef]
  47. Schmidt, O.; Gambhir, A.; Staffell, I.; Hawkes, A.; Nelson, J.; Few, S. Future cost and performance of water electrolysis: An expert elicitation study. Int. J. Hydrogen Energy 2017, 42, 30470–30492. [Google Scholar] [CrossRef]
  48. E4tech Sàrl with Element Energy Ltd., Development of Water Electrolysis in the European Union Final Report. 2014. Available online: www.e4tech.com (accessed on 15 June 2022).
  49. McPherson, M.; Johnson, N.; Strubegger, M. The role of electricity storage and hydrogen technologies in enabling global low-carbon energy transitions. Appl. Energy 2018, 216, 649–661. [Google Scholar] [CrossRef]
  50. Marocco, P.; Ferrero, D.; Lanzini, A.; Santarelli, M. The role of Hydrogen in the optimal design of off-grid hybrid renewable energy systems. J. Energy Storage 2022, 46, 103893. [Google Scholar] [CrossRef]
  51. Guinot, B.; Champel, B.; Montignac, F.; Lemaire, E.; Vannucci, D.; Sailler, S.; Bultel, Y. Techno-economic study of a PV-hydrogen-battery hybrid system for off-grid power supply: Impact of performances’ ageing on optimal system sizing and competitiveness. Int. J. Hydrogen Energy 2015, 40, 623–632. [Google Scholar] [CrossRef]
  52. Silva, S.B.; Severino, M.M.; de Oliveira, M.A.G. A standalone hybrid photovoltaic, fuel cell and battery system: A case study of Tocantins, Brazil. Renew. Energy 2013, 57, 384–389. [Google Scholar] [CrossRef]
  53. IRENA, Innovation Trends in Electrolysers for Hydrogen Production. 2021, 37. Available online: https://www.irena.org/publications/2022/May/Innovation-Trends-in-Electrolysers-for-Hydrogen-Production (accessed on 19 July 2022).
  54. Christensen, A. Assessment of Hydrogen Production Costs from Electrolysis: United States and Europe, International Council on Clean Transportation (ICCT). 2020, pp. 1–73. Available online: https://theicct.org/sites/default/files/publications/final_icct2020_assessment_of%20_hydrogen_production_costs%20v2.pdf (accessed on 19 July 2022).
  55. Terlouw, T.; Bauer, C. Environmental Science electrolysis: A techno-economic and environmental assessment. Energy Environ. Sci. 2022, 15, 3583–3602. [Google Scholar] [CrossRef]
  56. IRENA. Green Hydrogen Cost Reduction, 2020. Available online: https://www.irena.org/publications/2020/Dec/Green-hydrogen-cost-reduction (accessed on 19 July 2022).
  57. Huhtanen, S. Optimal Electricity Source Mix for Hydrogen Production in an Electrolyzer. Master’s Thesis, Aalto University, School of Electrical Engineering, Espoo, Finland, 2022. [Google Scholar]
Figure 1. Forecasted evolution of the energy demand in the Canary Archipelago from 2019 to 2040 (expressed in TWh) (Adapted from [21]).
Sustainability 14 11884 g001
Figure 2. Hourly demand forecasting profile of Grand Canary Island by 2040. (Data extracted from [23]).
Sustainability 14 11884 g002
Figure 3. Possible ways to green hydrogen production and consumption.
Sustainability 14 11884 g003
Figure 4. Cost of hydrogen storage, transport, and distribution through different ways: (a) Long distances; (b) Short distances. (Estimations based on IEA report [32]. Hydrogen transported by pipeline is in gaseous form; hydrogen transported by ship is liquefied; ammonia transported by pipeline is in liquid form; LOHCs are liquid organic hydrogen carriers. Costs include the costs of transport and any storage that is required.
Sustainability 14 11884 g004
Figure 5. Costs of hydrogen carrier production: (a) Conversion; (b) Reconversion. (Estimations based on IEA report [32]).
Sustainability 14 11884 g005
Figure 6. Diagrammatic representation of inputs/outputs demanded by HOMER software.
Sustainability 14 11884 g006
Figure 7. Diagrammatic view of the designed energetic system made in HOMER.
Sustainability 14 11884 g007
Figure 8. Scenarios with different degrees of demand response penetration [4].
Sustainability 14 11884 g008
Figure 9. Available electricity for hydrogen production (surplus energy coming from the renewable system) for scenarios: (a) BAU, (b) 0 DR, and (c) 1 DR.
Sustainability 14 11884 g009
Figure 10. Main characteristics of the three simulated hydrogen production scenarios.
Sustainability 14 11884 g010
Figure 11. Available excess of electricity for H2 production. (a) BAU, (b) 0 DR, and (c) 1 DR.
Sustainability 14 11884 g011aSustainability 14 11884 g011b
Figure 12. Hydrogen dispatch schedule. (a) BAU, (b) 0 DR, and (c) 1 DR.
Sustainability 14 11884 g012
Figure 13. Seasonal hydrogen production. (a) BAU, (b) 0 DR, and (c) 1 DR.
Sustainability 14 11884 g013
Figure 14. Monthly average hydrogen production for scenarios: (a) BAU, (b) 0 DR, and (c) 1 DR.
Sustainability 14 11884 g014
Figure 15. Frequency histogram (left) and tank level statistics of the H2 tank level for scenarios: (a) BAU, (b) 0 DR, and (c) 1 DR.
Sustainability 14 11884 g015
Figure 16. Summary of electric energy and water use values for the three analyzed scenarios: (a) BAU, (b) 0 DR, and (c) 1 DR.
Sustainability 14 11884 g016
Table 1. Electrolyzer and storage tank data [32,47,48,49,50,51,52,53,54,55,56,57].
ValueUnits
ElectrolyzerCost600EUR/kW
O&M60EUR/year kW
Lifetime95,000h
Operation time3700–4260h/year
H2 Storage tank 1Cost300EUR/kg
O&M4.5EUR/year kg
Lifetime25Year
Total efficiency 260(%)
1 Including compression system to 200 bars. 2 Electricity to H2 including compression system to 200 bars.
Table 2. Summary of the analyzed scenarios—Energy aspects.
ScenarioPElectrolyzerH2 Tank Capacity H2 Tank Capacity Available Energy for Producing H2 H2 ProductionEnergy Content in the H2 Produced
(GW)(t)(GWh)(GWh/yr)(t/yr)(TWh/yr)
BAU2.53000100379256,6131.89
0 DR3.06000200487376,6582.56
1 DR1.5180060233235,0031.17
Table 3. Summary of the analyzed scenarios—Economic aspects.
ScenarioCapital Costs (EUR M)NPC Costs (EUR M)O&M Costs (EUR M/yr)COH (EUR/kg)
BAU24003148594.54
0 DR36004636814.92
1 DR13801817344.06
Table 4. Available energy (excess of energy) and energy demand in the electrolyzer set.
BAU0 DR1 DR
Available energy (from excess electricity)379248732332GWh/year
Electrolyzer load372248422301GWh/year
Lost electricity703131GWh/year
% Lost electricity1.9%0.6%1.3%
Table 5. Initial capital, O&M costs, and salvage. Total and per source.
ComponentCapital (EUR M)O&M (EUR M)Total (EUR M)
BAUSurplus_electr000
Electrolyzer15005752075
Hydrogen Tank9001731073
System24007483148
0DRSurplus_electr000
Electrolyzer18006902490
Hydrogen Tank18003452145
System360010364636
1DRSurplus_electr000
Electrolyzer9003451245
Hydrogen Tank600115715
System15004601960
Table 6. Summary of the analyzed scenarios—Water use.
ScenarioH2O DemandO2 ProducedH2 Produced
(t/yr)(t/yr)(t/yr)
BAU509,517452,90456,613
0 DR690,822614,06476,758
1 DR315,027280,02435,003
Publisher’s Note: MDPI stays neutral with regard to jurisdictional claims in published maps and institutional affiliations.

