Article

One-Dimensional Numerical Simulation of Pt-Co Alloy Catalyst Aging for Proton Exchange Membrane Fuel Cells

1
Key Laboratory of Ocean Energy Utilization and Energy Conservation of Ministry of Education, Dalian University of Technology, Dalian 116023, China
2
Materials Science and Engineering Program & Texas Materials Institute, The University of Texas at Austin, Austin, TX 78712, USA
*
Authors to whom correspondence should be addressed.
Sustainability 2022, 14(18), 11462; https://doi.org/10.3390/su141811462
Submission received: 18 August 2022 / Revised: 7 September 2022 / Accepted: 9 September 2022 / Published: 13 September 2022
(This article belongs to the Special Issue Lithium Batteries and Fuel Cells for a Sustainable Future)

Abstract

:
The service life of catalysts is a key aspect limiting the commercial development of proton exchange membrane fuel cells (PEMFCs). In this paper, a one-dimensional degradation model of a Pt-Co alloy catalyst in the cathode catalytic layer (CCL) of a PEMFC is proposed, which can track the catalyst size evolution in real time and demonstrate the catalyst degradation during operation. The results show that severe dissolution of particles near the CCL/membrane leads to uneven aging of the Pt-Co alloy catalyst along the CCL thickness direction. When the upper potential limit (UPL) is less than 0.95 V, it does not affect the catalyst significantly; however, a slight change may cause great harm to the catalyst performance and service life after UPL > 0.95 V. In addition, it is found that operating temperature increases the Pt mass loss on the carbon support near the CCL/membrane side, while it has little effect on the remaining Pt mass on the carbon support near the CCL/GDL side. These uncovered degradation mechanisms of Pt-Co alloy provide guidance for its application in PEMFCs.

1. Introduction

In recent years, people’s awareness of environmental protection has gradually increased, and electric vehicles (EVs) have gradually replaced traditional fuel cars and entered people’s lives. However, the limited driving range and long charging time of lithium-ion battery (LIB)-based EVs cannot beat traditional fuel cars. PEMFC-based EVs alleviate the above disadvantages of LIB-based EVs [1,2]. PEMFCs use H2 as fuel, converting H2 and O2 in the air into clean electricity through electrochemical reaction, and its by-product is only water without any pollution [3,4]. In addition, PEMFCs have many advantages, such as fast start-up, high energy efficiency, and good adaptability to low-temperature environments in winter [5,6]; so, currently, there is a strong interest in PEMFCs in countries around the world. In addition, it is worth mentioning that the use of a combination of energy storage and power generation systems can greatly improve the utilization and stability of renewable energy [7], where the combination of electrolytic water for hydrogen production and PEMFCs will become a very promising technology for green hydrogen energy utilization and renewable energy peaking.
However, the commercialization of PEMFCs is limited by factors such as cost and durability. The maximum power density of a PEMFC is determined by the performance of the cathode catalyst layer (CCL), proton exchange membrane (PEM), etc. [8,9]. O2 is very stable in the atmosphere, so the reduction reaction of O2 requires a large activation energy and Pt remains the material of choice for the catalytic cathodic oxygen reduction reaction (ORR) [10,11], and the rate of ORR will affect the power of PEMFC. In particular, more than 40% of the PEMFC cost is spent on Pt catalysts for ORR in the cathode [12]. Reducing the amount of Pt group metals is a constant goal for CL development [8], and Pt alloy catalysts are favored for improving the catalyst ORR activity while also reducing the amount of Pt used [5,13]; but, durability issues remain an important challenge in the development of PEMFCs [6], and PEMFCs are still not commercially available on a large scale due to poor durability. The basic principles behind Pt-based catalyst degradation are as follows: (1) Ostwald ripening leads to coarsening of the Pt-based particles on the carbon support [14,15,16]; (2) Pt coalescence and migration [17,18]; (3) catalysts detachment due to aging of the carbon support [19,20,21]; and (4) Pt dissolution, and Pt2+ transferred to the ionomer phase is reduced by H2 crossover through the membrane [22]. The model built in this paper does not deal with non-electrochemically driven Pt sintering, specifically, neither the Brownian motion of Pt particles nor the surface diffusion of Pt atoms is considered. In addition, the oxidation and dissolution of Pt dominates the performance loss of Pt-based catalysts due to carbon corrosion within the CCL, and can be neglected when the UPL ≤ 1.35 V [23].
Mathematical models can be effectively used to investigate the degradation of Pt-based catalysts by simulating complex processes, imposing conditions that cannot be achieved experimentally, and providing significant cost and resource savings [24,25,26,27,28]. Holby et al. [29] combined experimental and theoretical techniques to develop a thermodynamically consistent kinetic model of catalyst degradation coupled with particle size distribution (PSD) based on the model of Darling and Meyers [24,25], which included Pt dissolution/precipitation reactions and oxide formation/removal reactions, and showed that due to the change in Gibbs–Thomson energy, 4–5 nm diameter nanoparticles could lead to a more stable CCL compared to the commonly used 2–3 nm nanoparticles. Later, Holby et al. [30] further optimized the model, which included dissolution, coarsening, oxidation, and mass transfer, and they demonstrated the importance of PSD on the lifetime of the PEMFC cathode catalyst by the model. A one-dimensional model developed by Li et al. [31] was used to study ECSA loss and Pt degradation within CCL in PEMFCs based on Holby’s model, which included Ostwald ripening, Pt dissolution, and redeposition, and found that ECSA loss is uneven over the entire CCL. Zheng et al. [32] evaluated several gradient CCL structures using Pt/C catalysts in terms of ECSA evolution and Pt loss under voltage cycle conditions by improving the above model, and their work provided a new strategy to improve the durability of PEMFCs. Zheng et al. [33] improved the one-dimensional model of Li et al. [31] and used it for calculating Pt-Co core-shell structure catalysts; they found that the loss of ECSA near the CCL/membrane was mainly attributed to severe particle dissolution rather than the effect of changes in particle size distribution.
Many researchers have found that UPL and fuel cell operating temperature have a significant impact on catalyst degradation. Wang et al. [34] found that the equilibrium concentration of dissolved Pt increased with voltage from 0.65 V to 1.1 V. This was attributed to the fact that the Pt surface was not completely covered by oxide. However, their experiments only investigated Pt dissolution with constant potential retention and did not evaluate the effect of voltage cycle on Pt dissolution. Đukic et al. [35] experimentally found that degradation of Pt alloy catalysts could be mitigated by UPL and a lower potential limit (LPL). Yoshida et al. [36] also considered the need to limit the UPL to reduce the ECSA loss of PEMFCs during operation. Lochner et al. [37] pointed out that temperature had a dominant effect on the nanoparticle growth during the voltage cycle. The results of Ahluwalia et al. [38] showed that the dissolution and particle growth rates of Pt were affected by temperature, which in turn led to the loss of ECSA of the catalyst. The experimental results of Dubau et al. [39] also showed that the degradation of Pt-based catalysts was largely temperature dependent.
Pt alloy catalysts have recently become a popular research target due to the ability to increase the durability and improve the catalytic effect of the catalyst. Since Pt protects transition metals (Fe, Co, Ni, etc.), the dissolution of Pt in the case of Pt alloys is always accompanied by the dissolution of transition metals [40,41]. Experiments by Chen et al. [16] demonstrated that Ostwald ripening of Pt alloy particles and the reduction of Pt2+ into the membrane by H2 permeating from the anode and crossing the membrane to the Pt band, ultimately led to the loss of the catalyst ECSA, pointing out that the lower redox potential of Co/Co2+ than H2/H+ at low pH values, and the mixed enthalpy of the Pt-Co alloy, cannot significantly raise the redox potential of Co/Co2+, resulting in the dissolved Co2+ not being reduced by H2, and thus the Pt band formed in the film is almost pure Pt. Đukic et al. [35] found experimentally that a higher UPL leads to an abrupt decrease in ECSA as well as Co residual for Pt-Co alloy catalysts. In addition, it was found that Pt-Co is more stable than Pt-V, Pt-Ni, and Pt-Fe [42], and Pt-Co catalysts have been successfully used in commercial PEMFC vehicles such as Toyota Mirai [43]; so, Pt-Co alloy catalysts were also chosen as a subject in this paper.
However, the degradation mechanism of Pt-Co alloy catalysts still needs to be investigated, such as the one-dimensional uneven aging problem, the state problem of Pt alloy catalysts after aging, and the effects of temperature and UPL on the degradation problem of Pt-Co alloy catalysts. In addition, large amounts of dissolved transition metal ions diffuse from the CCL to the membrane [44], and the proton conductivity of Nafion ionomer contaminated with these transition metal ions can be severely affected [45]. The effect of Co2+ on O2 transport resistance and the proton conduction resistance has become a global focus in PEMFC-aging research [46,47,48]. Therefore, model studies are needed to further elaborate the aging mechanism of Pt-Co alloy catalysts.
In this paper, a one-dimensional aging model of a Pt-Co alloy catalyst in the CCL of a PEMFC is constructed based on Li et al. [31], and the accuracy of the model is verified using the experimental results of Chen et al. [16]. Then, the model is used to explore the Pt2+ concentration distribution and the evolution of particle size within the CCL, etc., and further evaluates the degradation of the catalyst at different locations within the CCL under a voltage cycle. Finally, the effects of UPL and fuel cell operating temperature on catalyst aging are analyzed in detail by investigating the evolution of particle size at different locations of the CCL.

2. Model Description

The schematic diagram of the one-dimensional aging model of the Pt-Co alloy catalyst along the CCL thickness direction and the detailed aging mechanism of the catalyst are depicted in Figure 1, where the thickness of the CCL is L. The CCL/membrane interface is located at x/L = 0, and the CCL/GDL interface is located at x/L =1. All catalysts on the carbon support are spherical from beginning to end. Along the x direction, the CCL is uniformly divided into I control bodies, and each control body i contains J discrete groups of particle sizes, and Di,j, Numi,j, and θi,j are the particle diameter, number of particles, and oxide coverage contained in particle size group j of control body i, respectively. The possible chemical reactions of the Pt-Co alloy catalyst particles are as follows:
The electrochemical oxidation reaction of Pt is [49]:
Pt + H 2 O PtO + 2 H + + 2 e
The electrochemical dissolution reaction of Pt is [49]:
Pt Pt 2 + + 2 e
The chemical dissolution of Pt oxide is [49]:
PtO + 2 H + Pt 2 + + H 2 O
Pt2+ near the CCL/membrane interface is reduced by the H2 permeating through the membrane from the anode [28,31]:
Pt 2 + + H 2 Pt + 2 H +
However, Equation (2) (electrochemical dissolution) is the main dissolution mode of Pt-based catalysts [50], whereas Equation (3) can be negligible [51]. Therefore, the chemical dissolution of Pt oxide can be ignored when studying the degradation of Pt [31,33].
Despite the high stability of the Pt-Co alloy catalysts, dissolution of Pt occurs in parallel with dissolution of Co. However, since the redox potential of Co/Co2+ is lower than that of H2/H+ at a lower pH and the mixing enthalpy of the Pt-Co alloy is too small to significantly increase the redox potential of Co, the dissolved Co2+ cannot be reduced by H2 [16]. The dissolution reaction of Co is as follow [33]:
Co Co 2 + + 2 e
In summary, Pt-Co alloy catalysts contain mainly Pt oxidation, Pt and Co dissolution, Pt redeposition, and Pt band formation near the CCL/membrane interface after reduction of Pt2+ by crossover H2. The performance of PEMFCs depends on the controlled size, dispersion, and density of the Pt-based nanoparticles on the carbon support [4]. Therefore, the evolution of each catalyst within the CCL is calculated using the one-dimensional degradation model for Pt-Co alloy catalysts, which, in turn, allows the prediction of parameters such as the performance of the CCL and its service life. Among them, the physical parameters involved are organized and assembled in Table 1.
Assuming the initial oxide coverage θi,j = 0 for each particle size group (i, j), the formation and removal of Pt oxide from the particle surface in this paper is based on the model of Holby and Morgan [30], and the net productivity of Pt oxide is
r n e t , o x i d e = v 1 * Γ exp 1 R T H ¯ 2 , f i t + λ θ i , j × 1 θ i , j 2 exp n 2 F 1 β 2 R T U f i t + ω θ i , j n 2 F V v 2 * v 1 * ( 10 2 p H ) exp n 2 F β 2 R T U f i t + ω θ i , j n 2 F V
where the Pt2+ concentration CPt2+ can be found by the following one-dimensional Pt ion diffusion equation.
The dissolution and redeposition of Pt under voltage cycling can affect the structural composition and particle size distribution. The net dissolution rate of Pt on nanoparticles is [29]
r n e t , P t = v 1 Γ exp H ¯ 1 , f i t R T ( 1 min ( 1 , θ i , j ) ) × exp n F 1 β 1 R T U e q 4 Ω P t γ t o t a l D i , j n F V v 2 v 1 C P t 2 + C P t 2 + r e f exp n F β 1 R T U e q 4 Ω P t γ t o t a l D i , j n F V
The total surface tension is [30]
γ t o t a l = γ + Γ θ i , j R T × log v 2 * v 1 * + log 10 2 p H + n 2 F R T U f i t V + ω θ i , j 2 R T + log θ i , j 2 + 2 θ i , j θ i , j log 1 θ i , j 2
Based on the initial PSD, the total number of initial particles is calculated for each particle size group (i, j) using the Pt loading, the catalytic layer cross-sectional area A, and the average diameter Dm. For each Pt-Co alloy catalyst:
d m i , j d t = d d t ρ i , j * 1 6 π D i , j 3 = 1 2 π D i , j 2 ρ i , j * d D i , j d t
d m P t , i , j d t = π D i , j 2 M W P t r n e t , P t
d m C o , i , j d t = π D i , j 2 M W C o r n e t , C o
When the alloy particles are dissolved:
d m P t , i , j d t / M W P t d m C o , i , j d t / M W C o = n i , j r n e t , P t = n i , j r n e t , C o
where mi,j, mPt,i,j, mCo,i,j, MWPt, MWCo, and rnet,Co are the mass of each Pt-Co alloy particle, mass of Pt in each particle, mass of Co in each particle, molar mass of Pt, molar mass of Co, and net dissolution rate of Co, respectively. ni,j is expressed as the atomic ratio of Pt to Co:
n i , j = m P t , i , j / M W P t m C o , i , j / M W C o
ρ*i,j denotes the alloy density of each particle:
ρ i , j * = n i , j M W P t + M W C o n i , j Ω P t + Ω C o
Further collation is derived:
d m i , j d t = d m P t , i , j d t + d m C o , i , j d t 1 2 π D i , j 2 ρ i , j * d D i , j d t = π D i , j 2 M W P t r n e t , P t π D i , j 2 M W C o r n e t , C o d D i , j d t = 2 M W P t r n e t , P t + M W C o r n e t , C o ρ i , j *
According to Equations (14) and (15), the rate of change of the diameter when the particle is dissolved can be deduced as
d D i , j d t = 2 M W P t r n e t , P t + M W C o 1 n i , j r n e t , P t ρ i , j * = 2 n i , j Ω P t + Ω C o r n e t , P t n i , j
As the dissolution of Co is superficial and passive due to Pt dissolution, Co cannot be deposited back to a large particle, so the size evolution in particle size group j of control body i is as follows:
When rnet,Pt > 0:
D i , j t + Δ t = D i , j t 2 n i , j Ω P t + Ω C o r n e t , P t n i , j Δ t
When rnet,Pt < 0:
D i , j t + Δ t = D i , j t 2 Ω P t r n e t , P t Δ t
The evolution of the Pt and Co mass for each particle size group j in each control body i within the CCL is as follows:
m P t , i , j t + Δ t = m P t , i , j t π D i , j 2 r n e t , P t M W P t Δ t
When rnet,Pt > 0:
m C o , i , j t + Δ t = m C o , i , j t π D i , j 2 r n e t , P t n i , j M W C o Δ t
When rnet, Pt < 0:
m C o , i , j t + Δ t = m C o , i , j t
The formation and removal of Pt oxide on the nanoparticle surface under voltage cycling does not have a direct effect on the size change of the particles, but at high potentials, the formation of Pt oxide on the nanoparticle surface suppresses the dissolution of Pt and thus has an indirect effect on the size of the particles [31]. The rate of evolution of the Pt oxide coverage on the particle surface is [29]
d ( θ i , j ) d t = r n e t , o x i d e Γ 2 θ i , j D i , j d D i , j d t
Assume CPt2+ = 0 for each control body i of the CCL at t = 0. Migration of Pt2+ may occur with potential distribution, but according to the order-of-magnitude analysis under high potentials and low Pt2+ concentrations simulated under low potentials, the effect of migration on Pt2+ is negligible under H2|N2 (anode|cathode) conditions [28,30,31,33]. The issue that Pt2+ migration can be neglected is elaborated in another study of ours [52]. As a result, it is logical to only consider diffusive transport of Pt2+ in the ionomer of the CCL. The diffusion equation for the Pt2+ concentration can be expressed as [31]
ε C P t 2 + t = ε 1.5 D P t 2 + C P t 2 + + S P t 2 +
Equation (23) is discretized by using the central difference and implicit Euler and calculated by using the tridiagonal matrix algorithm.
The source term for Pt2+ dissolution in each control body i can be expressed as
S P t 2 + , i = j = 1 J π D i , j 2 N u m i , j r n e t , P t L A / I
Pt2+ is unable to diffuse into the GDL because the GDL does not contain an ionomer, so CPt2+ at the CCL/GDL interface (x/L = 1) can be set to the following boundary condition [28,31]:
C P t 2 + x x = L = 0
As depicted in Figure 1, a fraction of H2 from the anode crosses the membrane and reaches near the CCL/membrane interface under H2|N2 (anode|cathode) conditions, and the excess H2 that does not encounter O2 reduces Pt2+ in its vicinity, producing a Pt band at the CCL/membrane interface [16,30]. The boundary condition at the CCL/membrane interface can be written as [31]
C P t 2 + x = 0 = 0
The geometric surface area of all nanoparticles can be calculated as
G S A = π i = 1 , j = 1 I , J N u m i , j D i , j 2
ECSA(t)/GSA(t) is always a constant during catalyst degradation [31], so the expression for the instantaneous electrochemical surface area ECSA(t) is
E C S A t = E C S A 0 G S A 0 G S A t
The model for the Pt-Co alloy catalyst aging simulation is composed of Equations (6)–(28), which can track the catalyst size evolution, demonstrate the catalyst degradation, and obtain the remaining ECSA and individual metal content of the catalyst during operation. It is worth mentioning that the proposed model is written in the C language and solved by running the C language program.

3. Results and Discussion

The proposed Pt-Co alloy catalyst degradation model was first validated using the experimental data of Chen et al. [16], and the model was validated using the same conditions as Chen et al. [16] in this section. Subsequently, the model is employed to simulation the evolution of Pt-Co alloy catalysts at various locations within the CCL and further analyze the reasons for catalyst aging. Lastly, the influence of different UPLs as well as operating temperatures on ECSA, remaining Co, and the Pt of the catalysts are studied to probe the influence of UPL and temperatures on the aging of Pt-Co alloy catalysts.

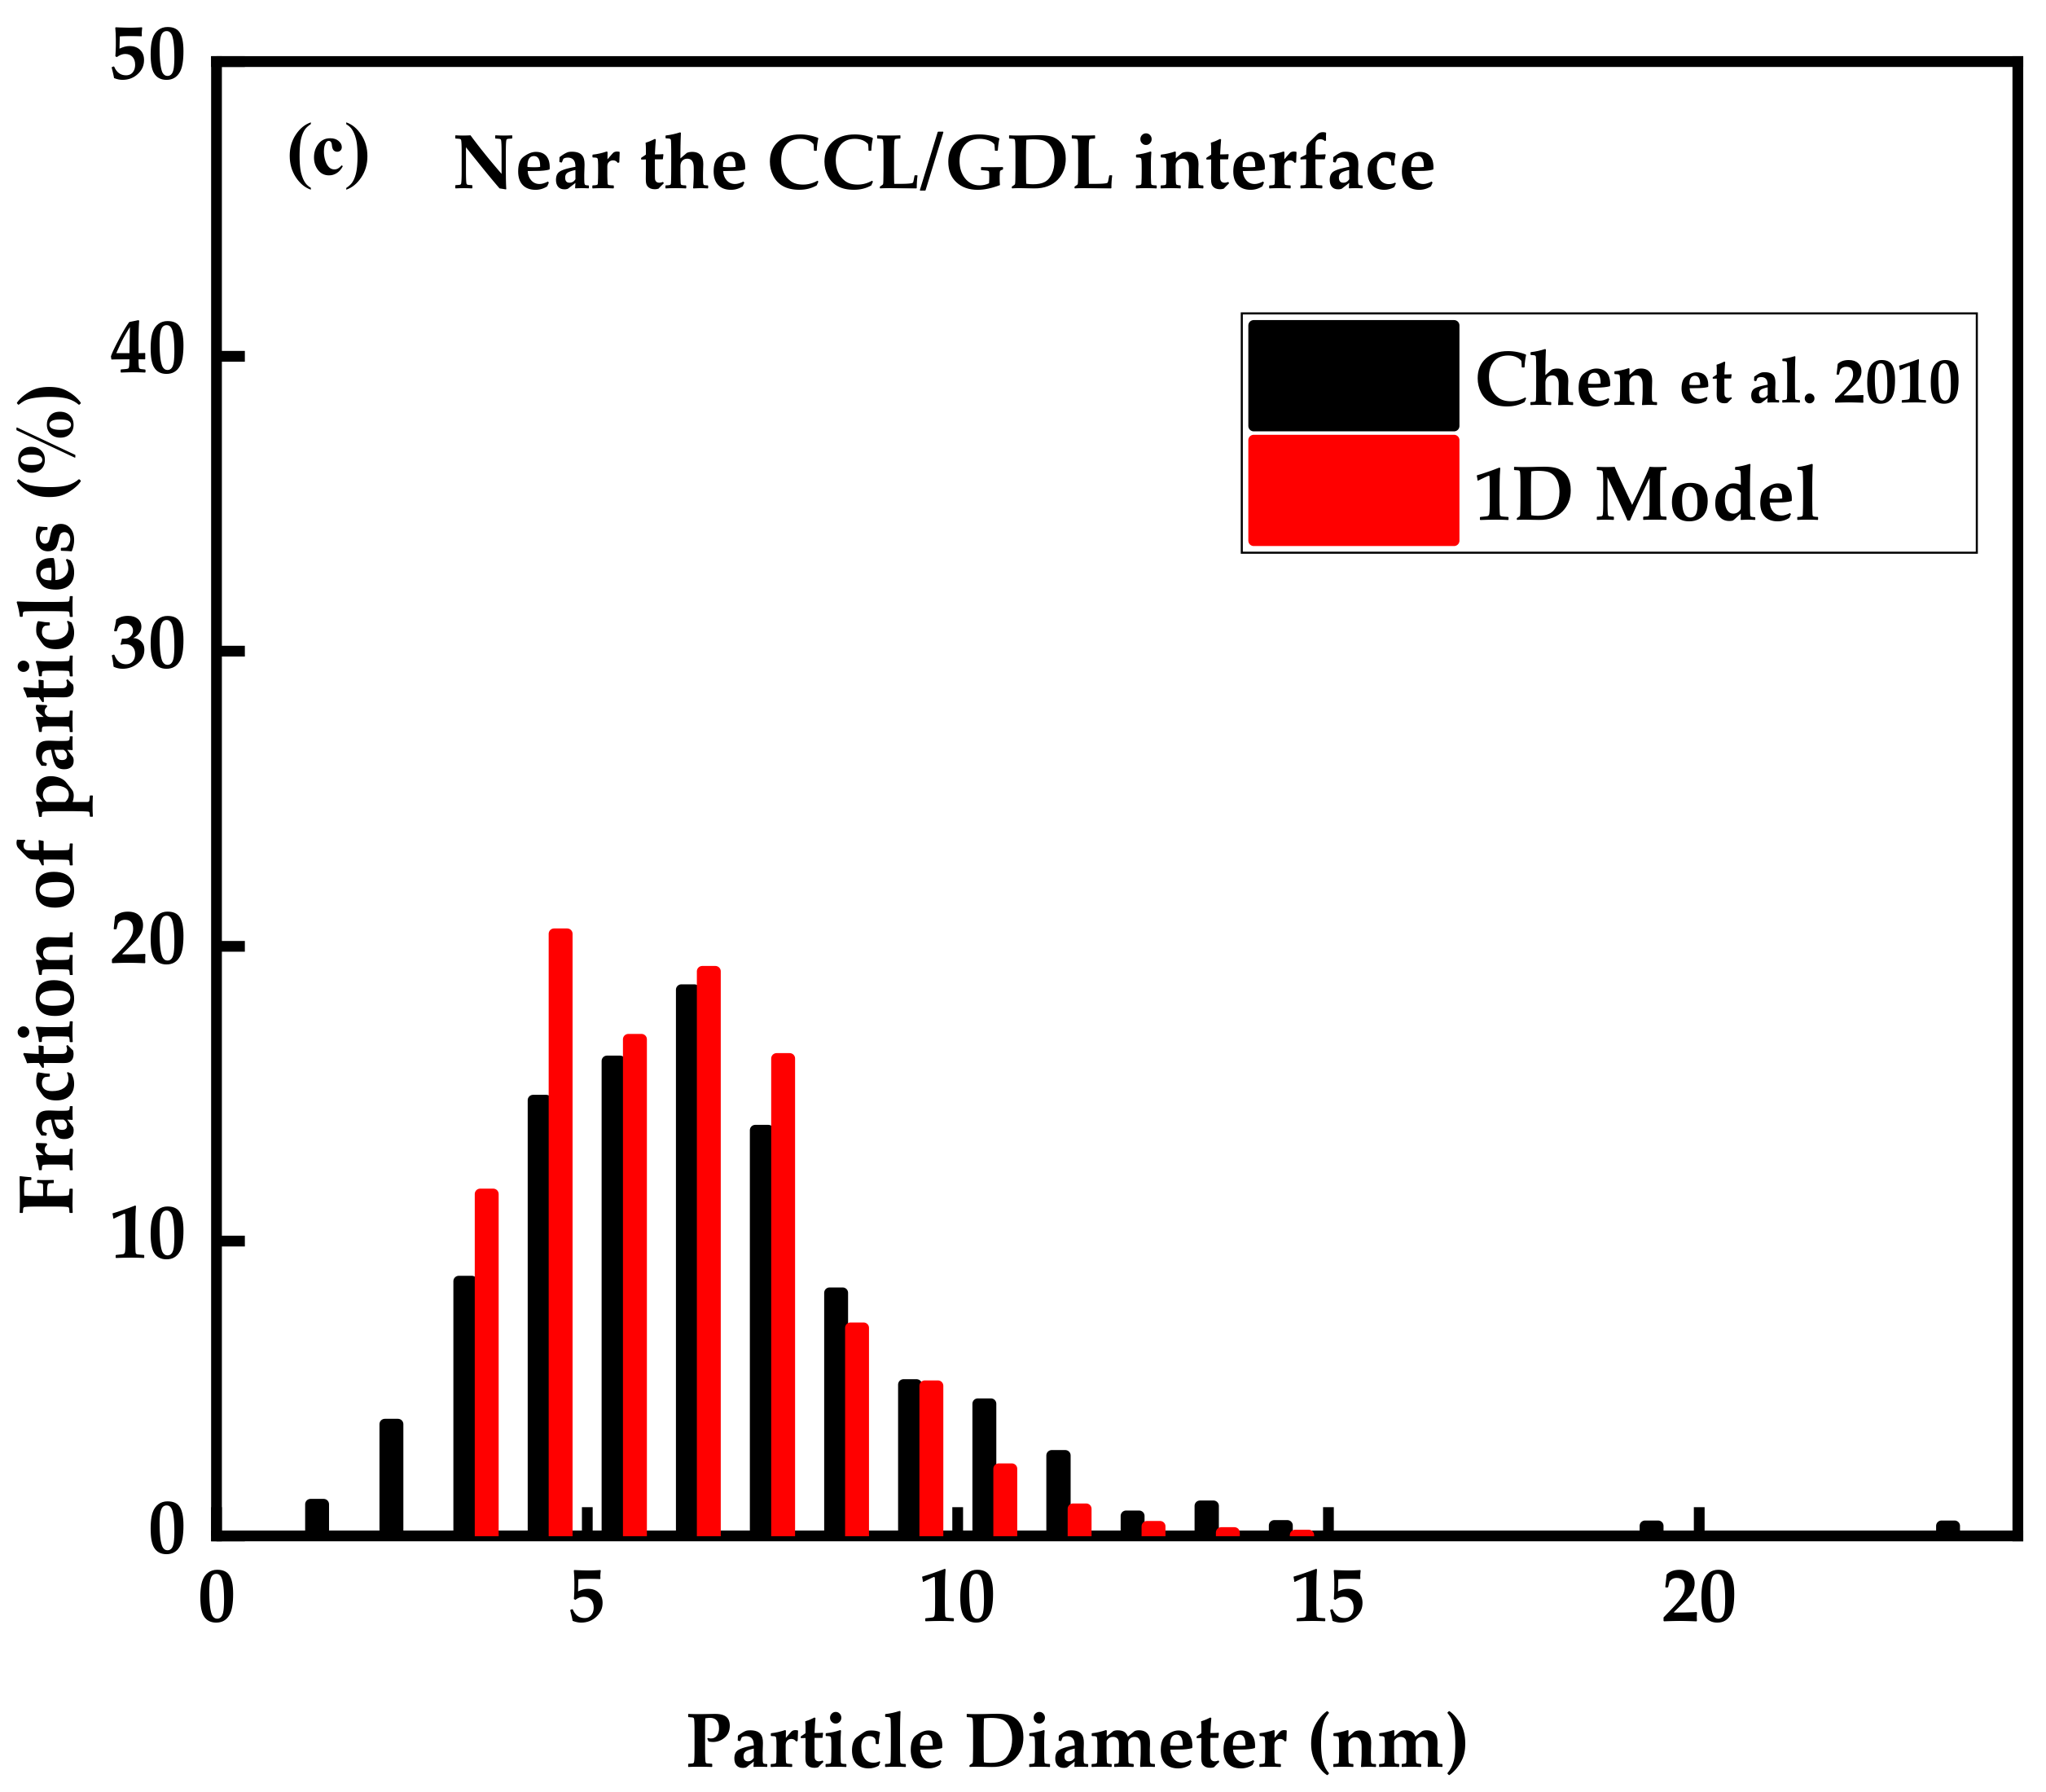
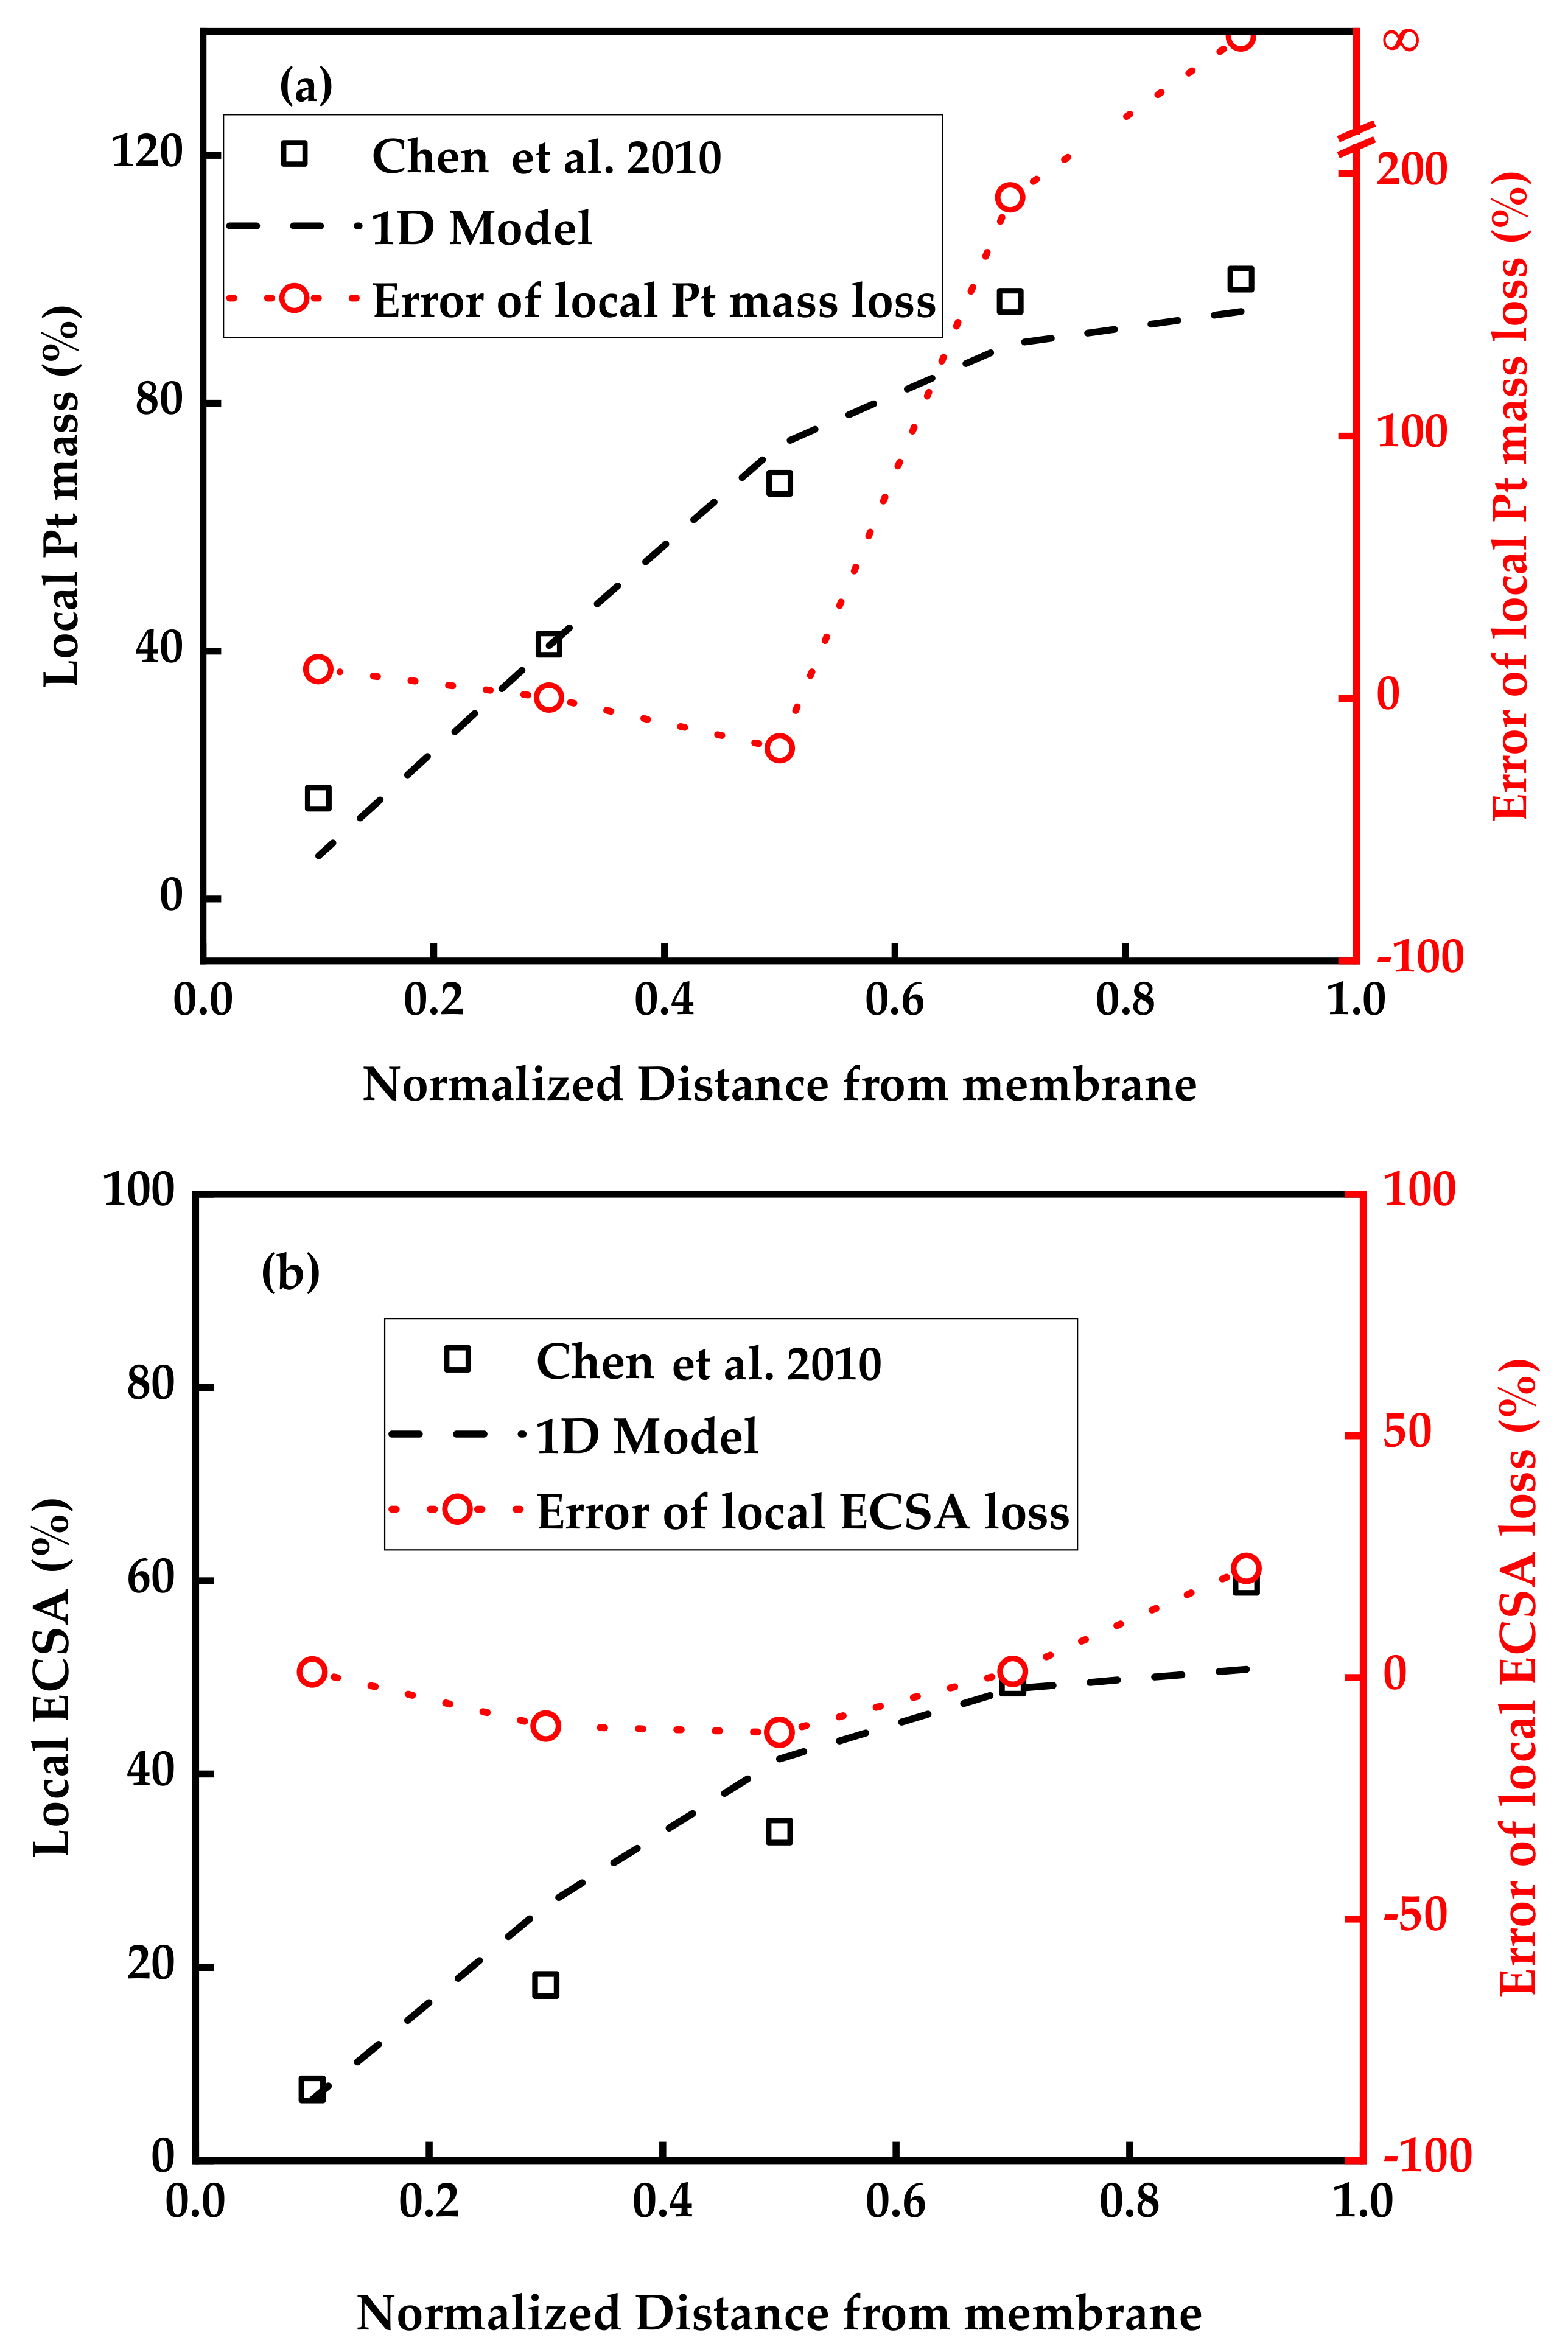
3.1. Model Validation

The numerical simulation results of the Pt-Co alloy catalysts at 0.65–1.05 V vs. RHE, 100 m V/s, 80 °C, H2|N2 (anode|cathode), and 100% RH after 10,000 voltage cycles, were compared with the experimental data of Chen et al. [16] to obtain the unknown parameters of the model and validate the model accuracy. Where the Pt loading is 0.25 mg/cm2, ni,j = 4.7 at the initial moment, and the initial PSD of the catalysts obeyed the normal distribution, with Dm = 3.6 nm and variance σ2 = 1.5 nm2. Figure 2a,b shows the comparison of the experimental and simulation results of the distribution of the remaining Pt loading and ECSA along the CCL thickness direction under the same conditions as Chen et al. [16], respectively. The performance of the CCL after the voltage cycle is significantly reduced due to Oswald ripening and the loss of Pt, especially near the CCL/membrane interface, where Pt2+ is reduced by the excess H2 permeation transported from the membrane, resulting in a much lower ECSA near the CCL/membrane interface than at other locations; it is this that causes the uneven aging of the catalyst on the CCL and severely shortens the service life of the CCL. From the comparison of the results, it can be found that the simulated results near the CCL/GDL interface are slightly lower than the experimental results in Figure 2a,b, which is mainly due to the neglect of Pt loss at this location in the experimental results, although from the comparison of the PSD evolution results near the CCL/GDL interface in Figure 2c, it can be found that the simulated PSD evolution results almost match the experimental results. In addition, the model ignores the oversize particles that account for a very small percentage of the initial PSD, thus leading to no mega-particles (>15 nm) on the CCL/GDL side in the simulation results of Figure 2c. Assuming all catalysts to be spherical also leads to some errors between the simulated ECSA loss results and the experimental results. The trend in the simulation results is the same as the experimental results; so, the model can be considered very effective.

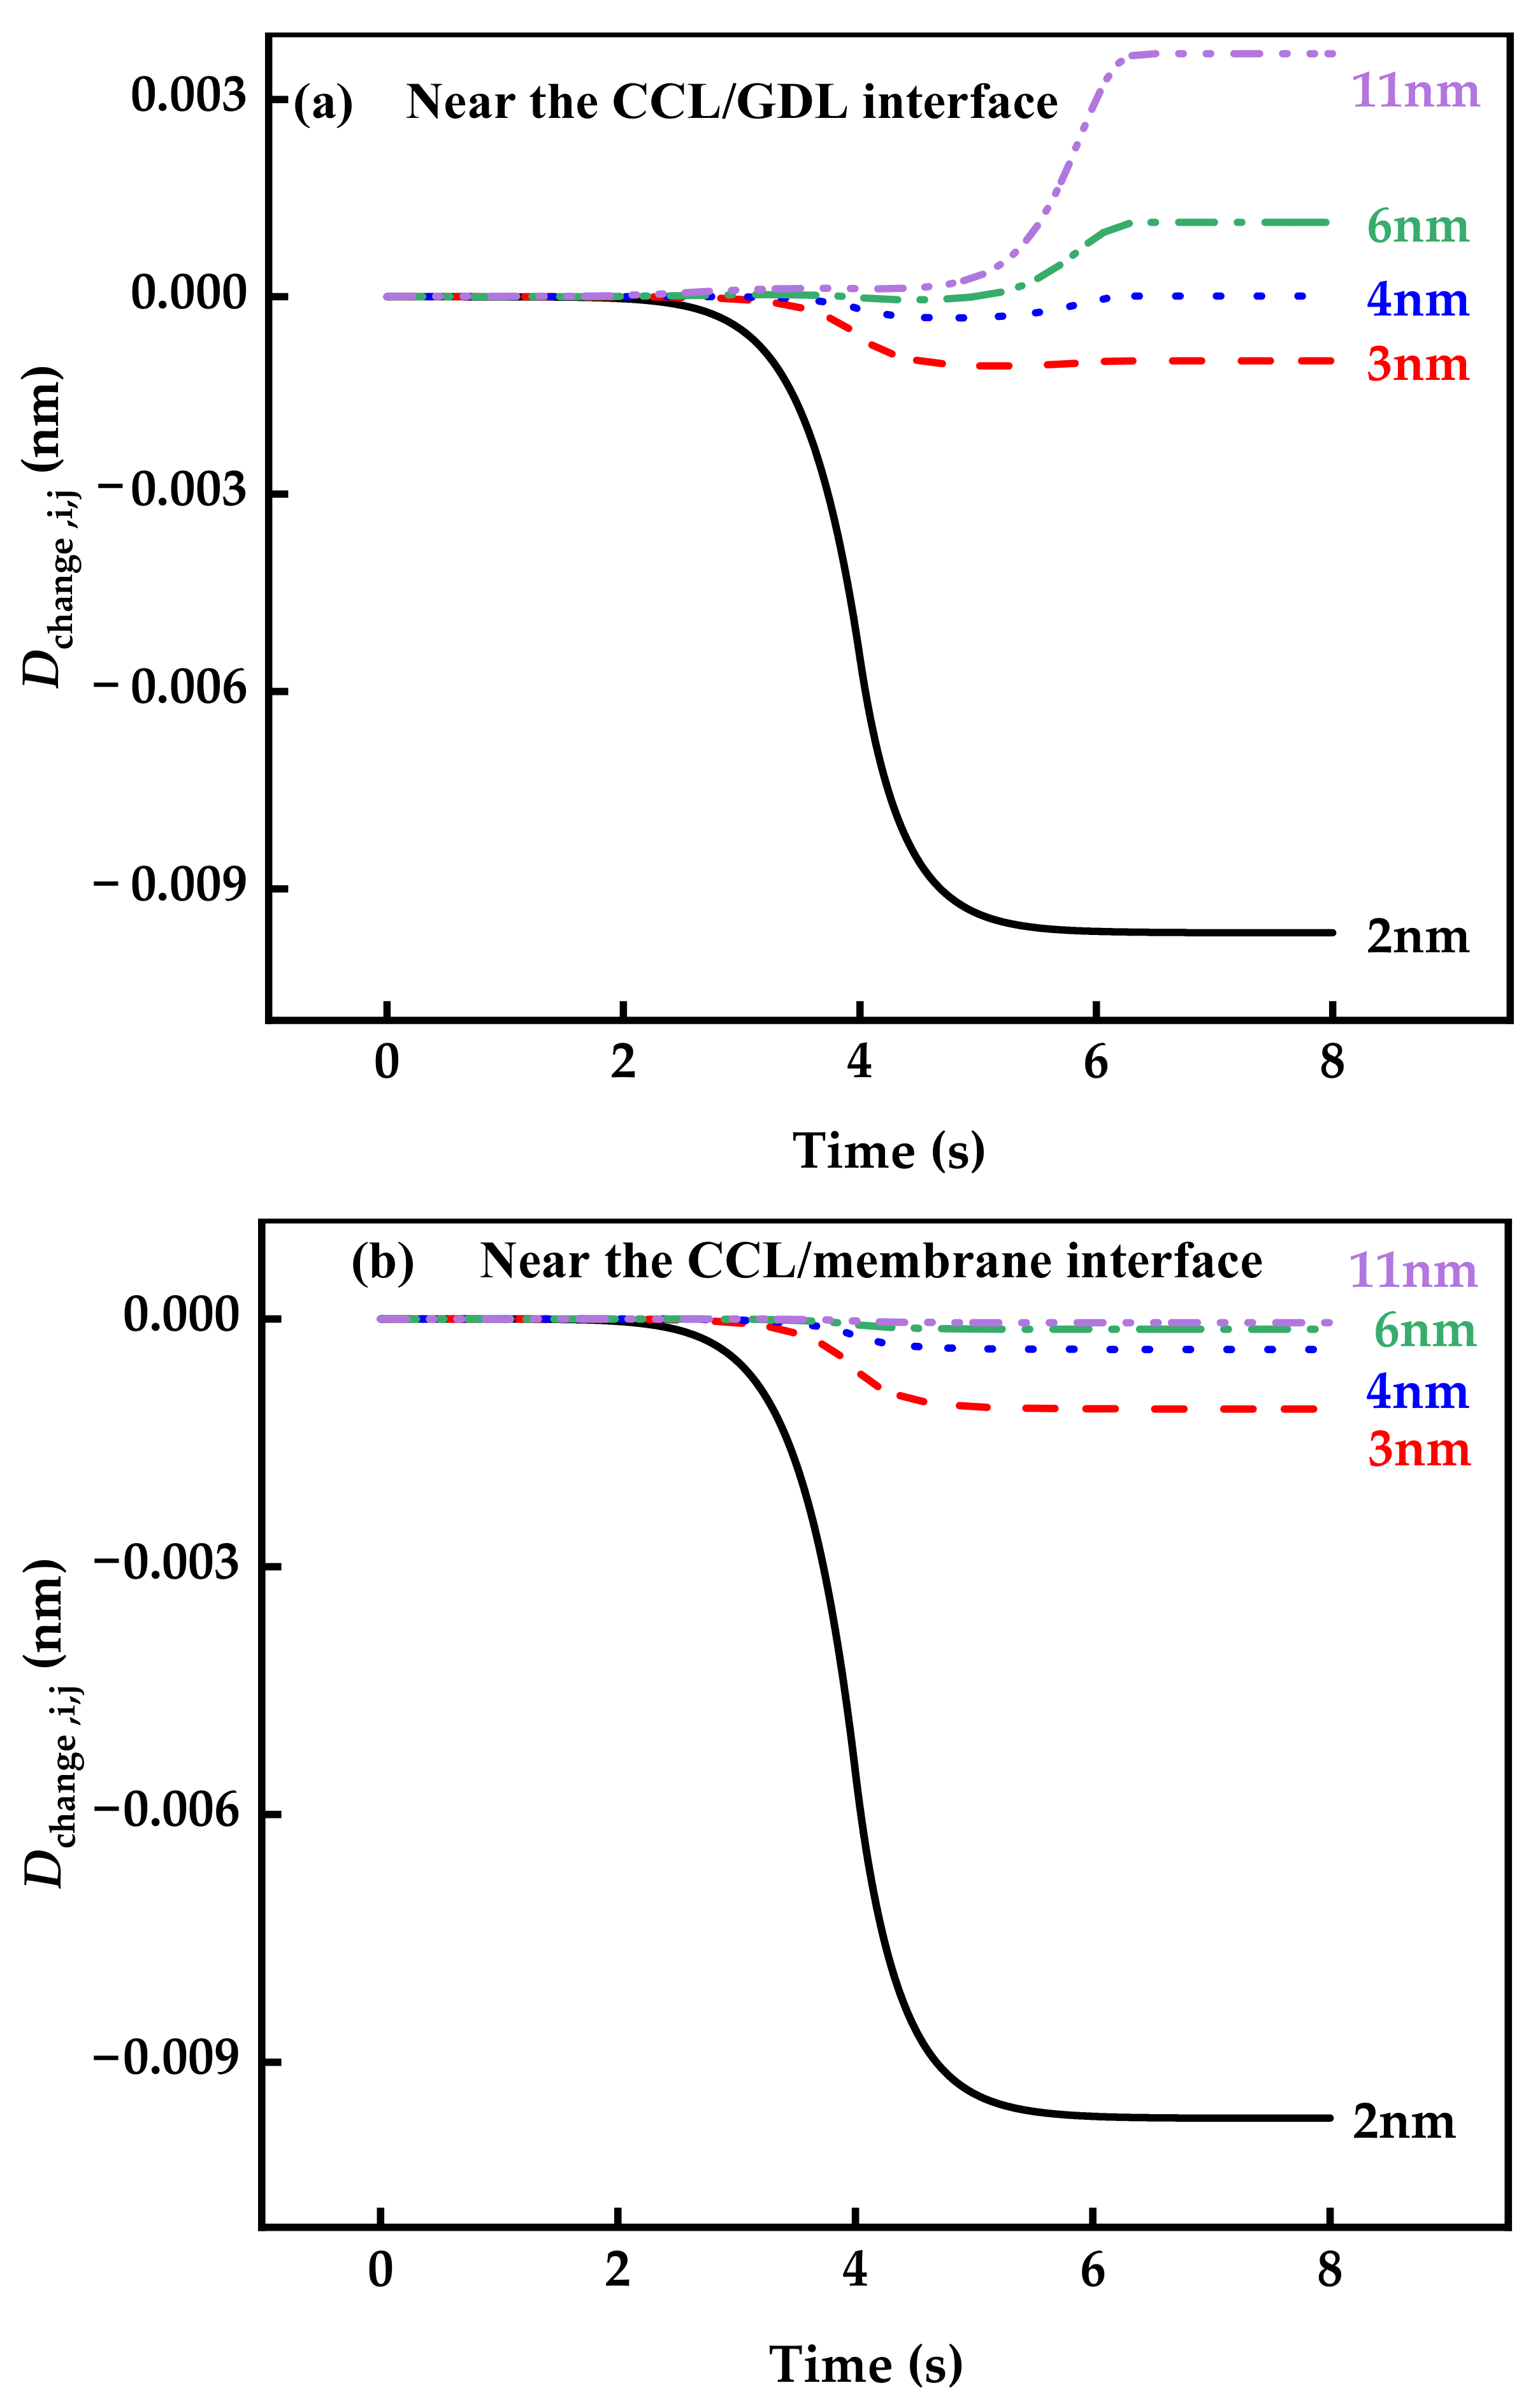
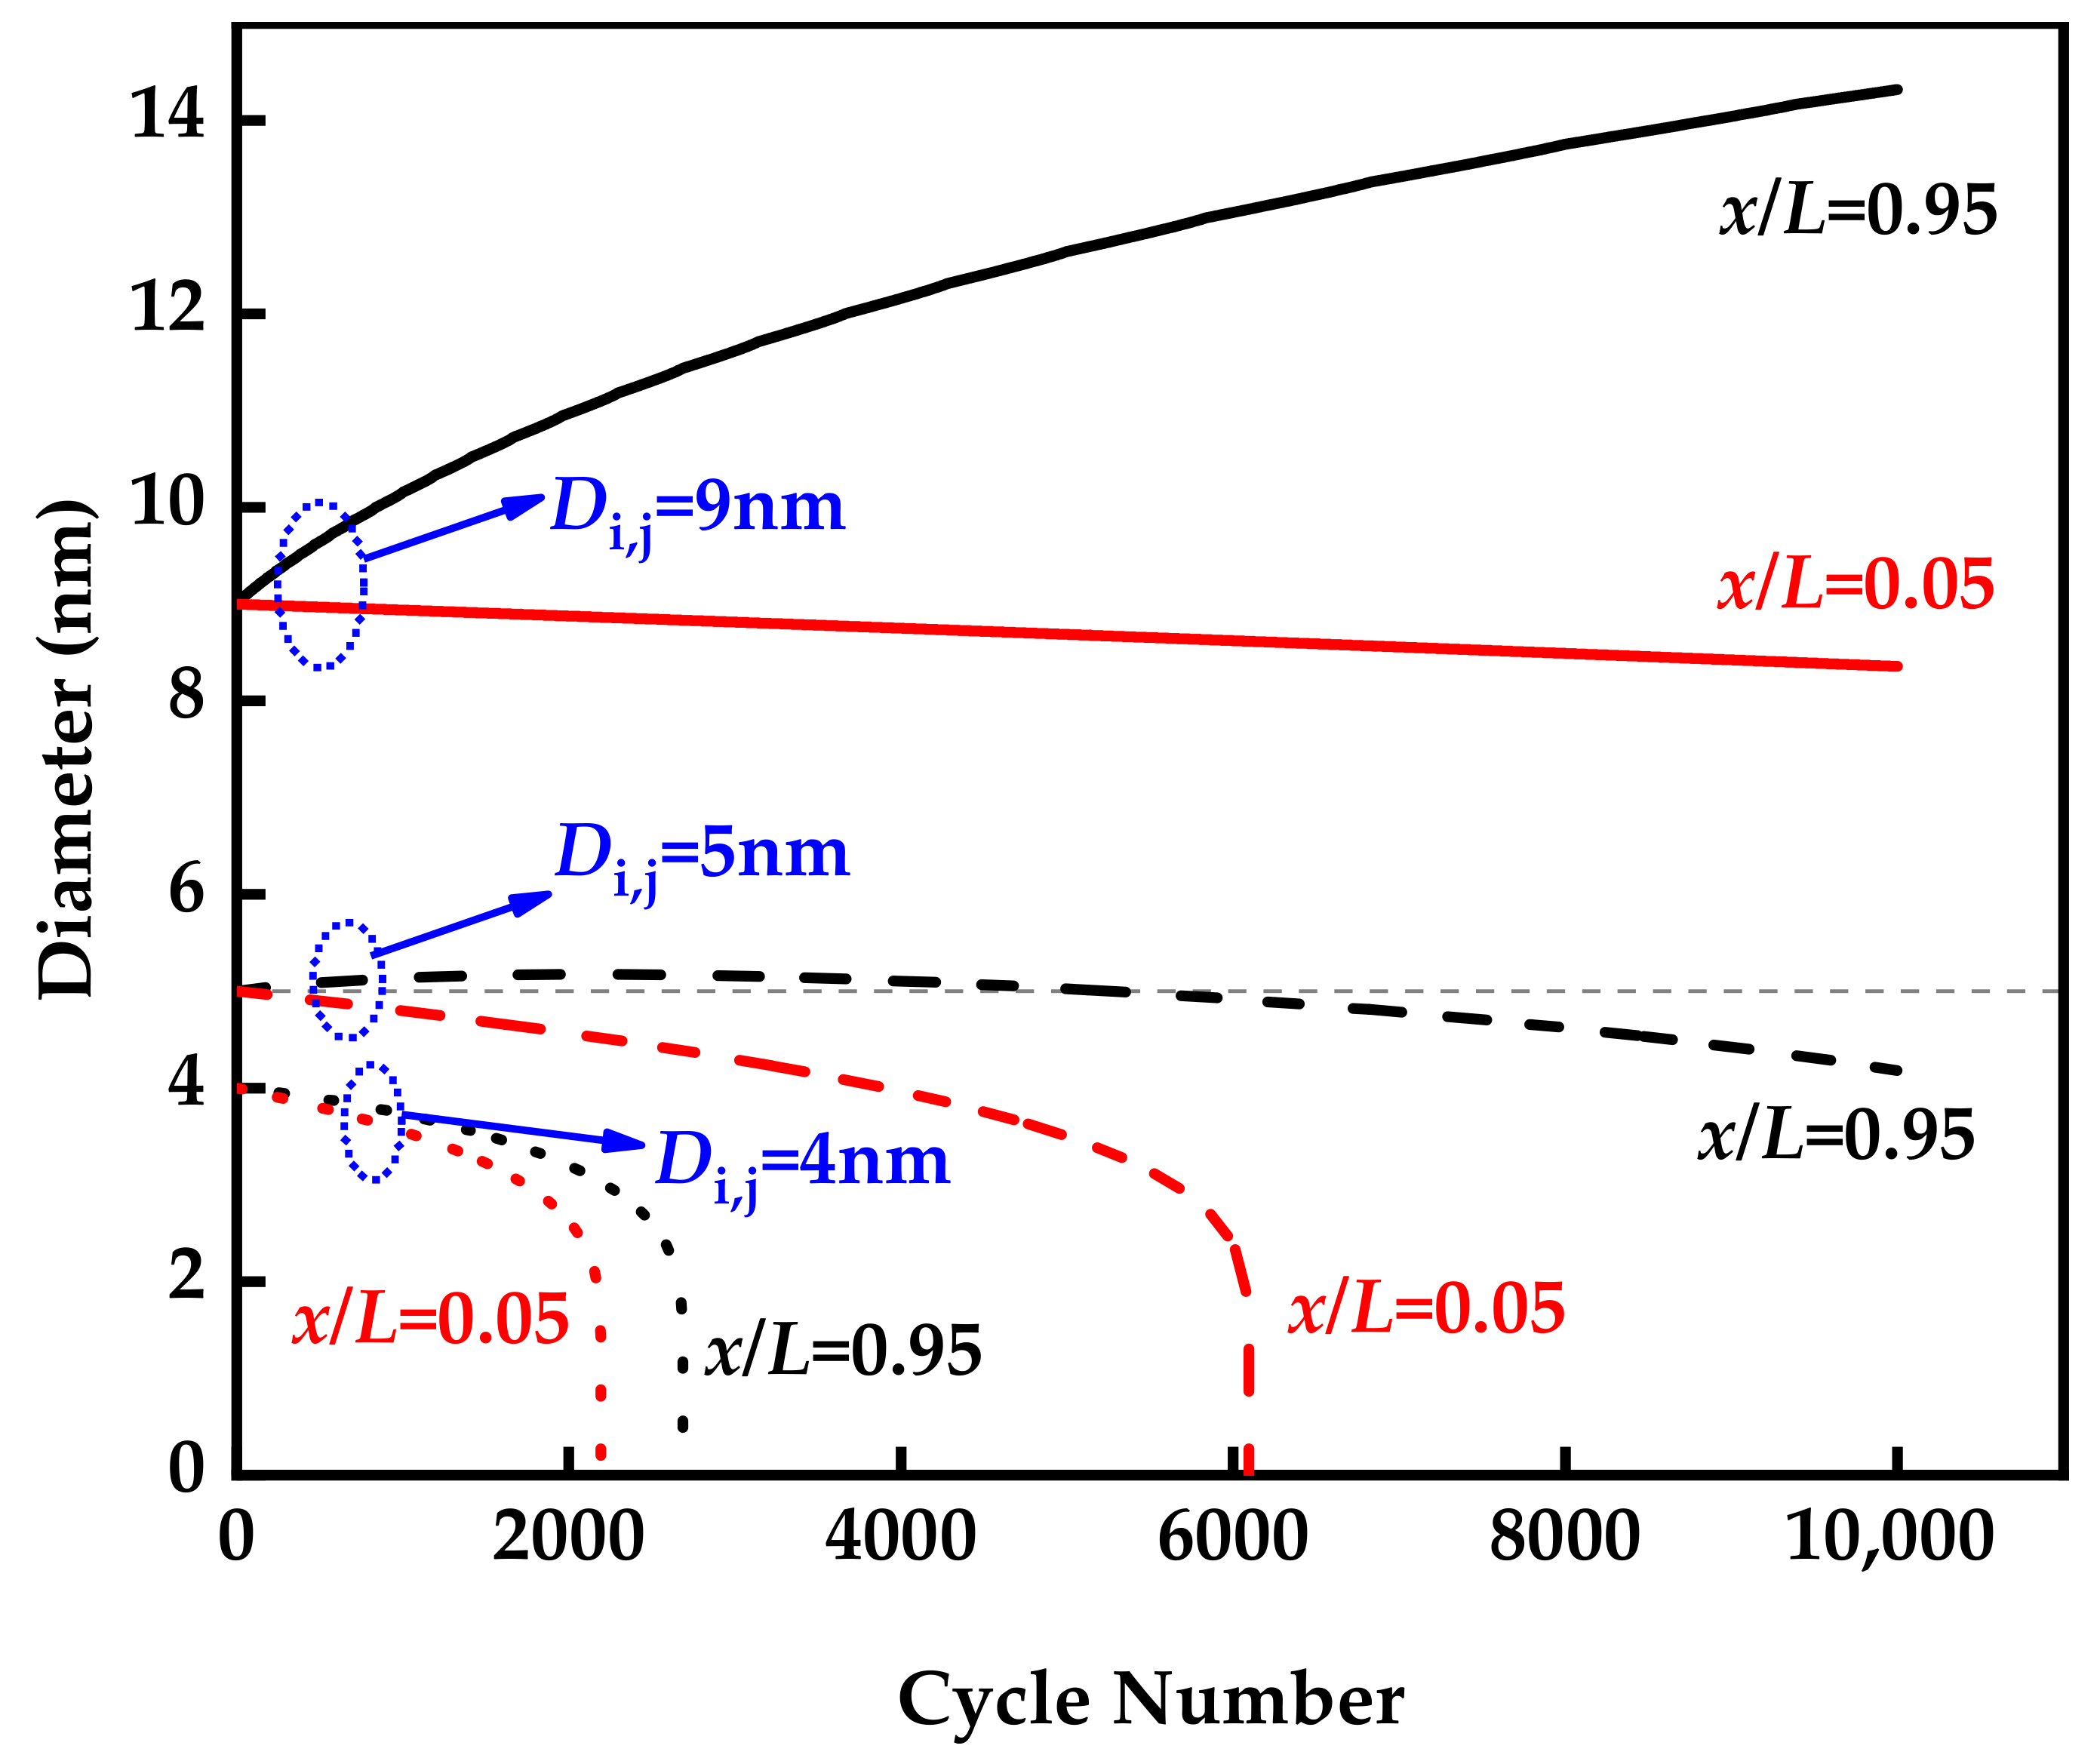
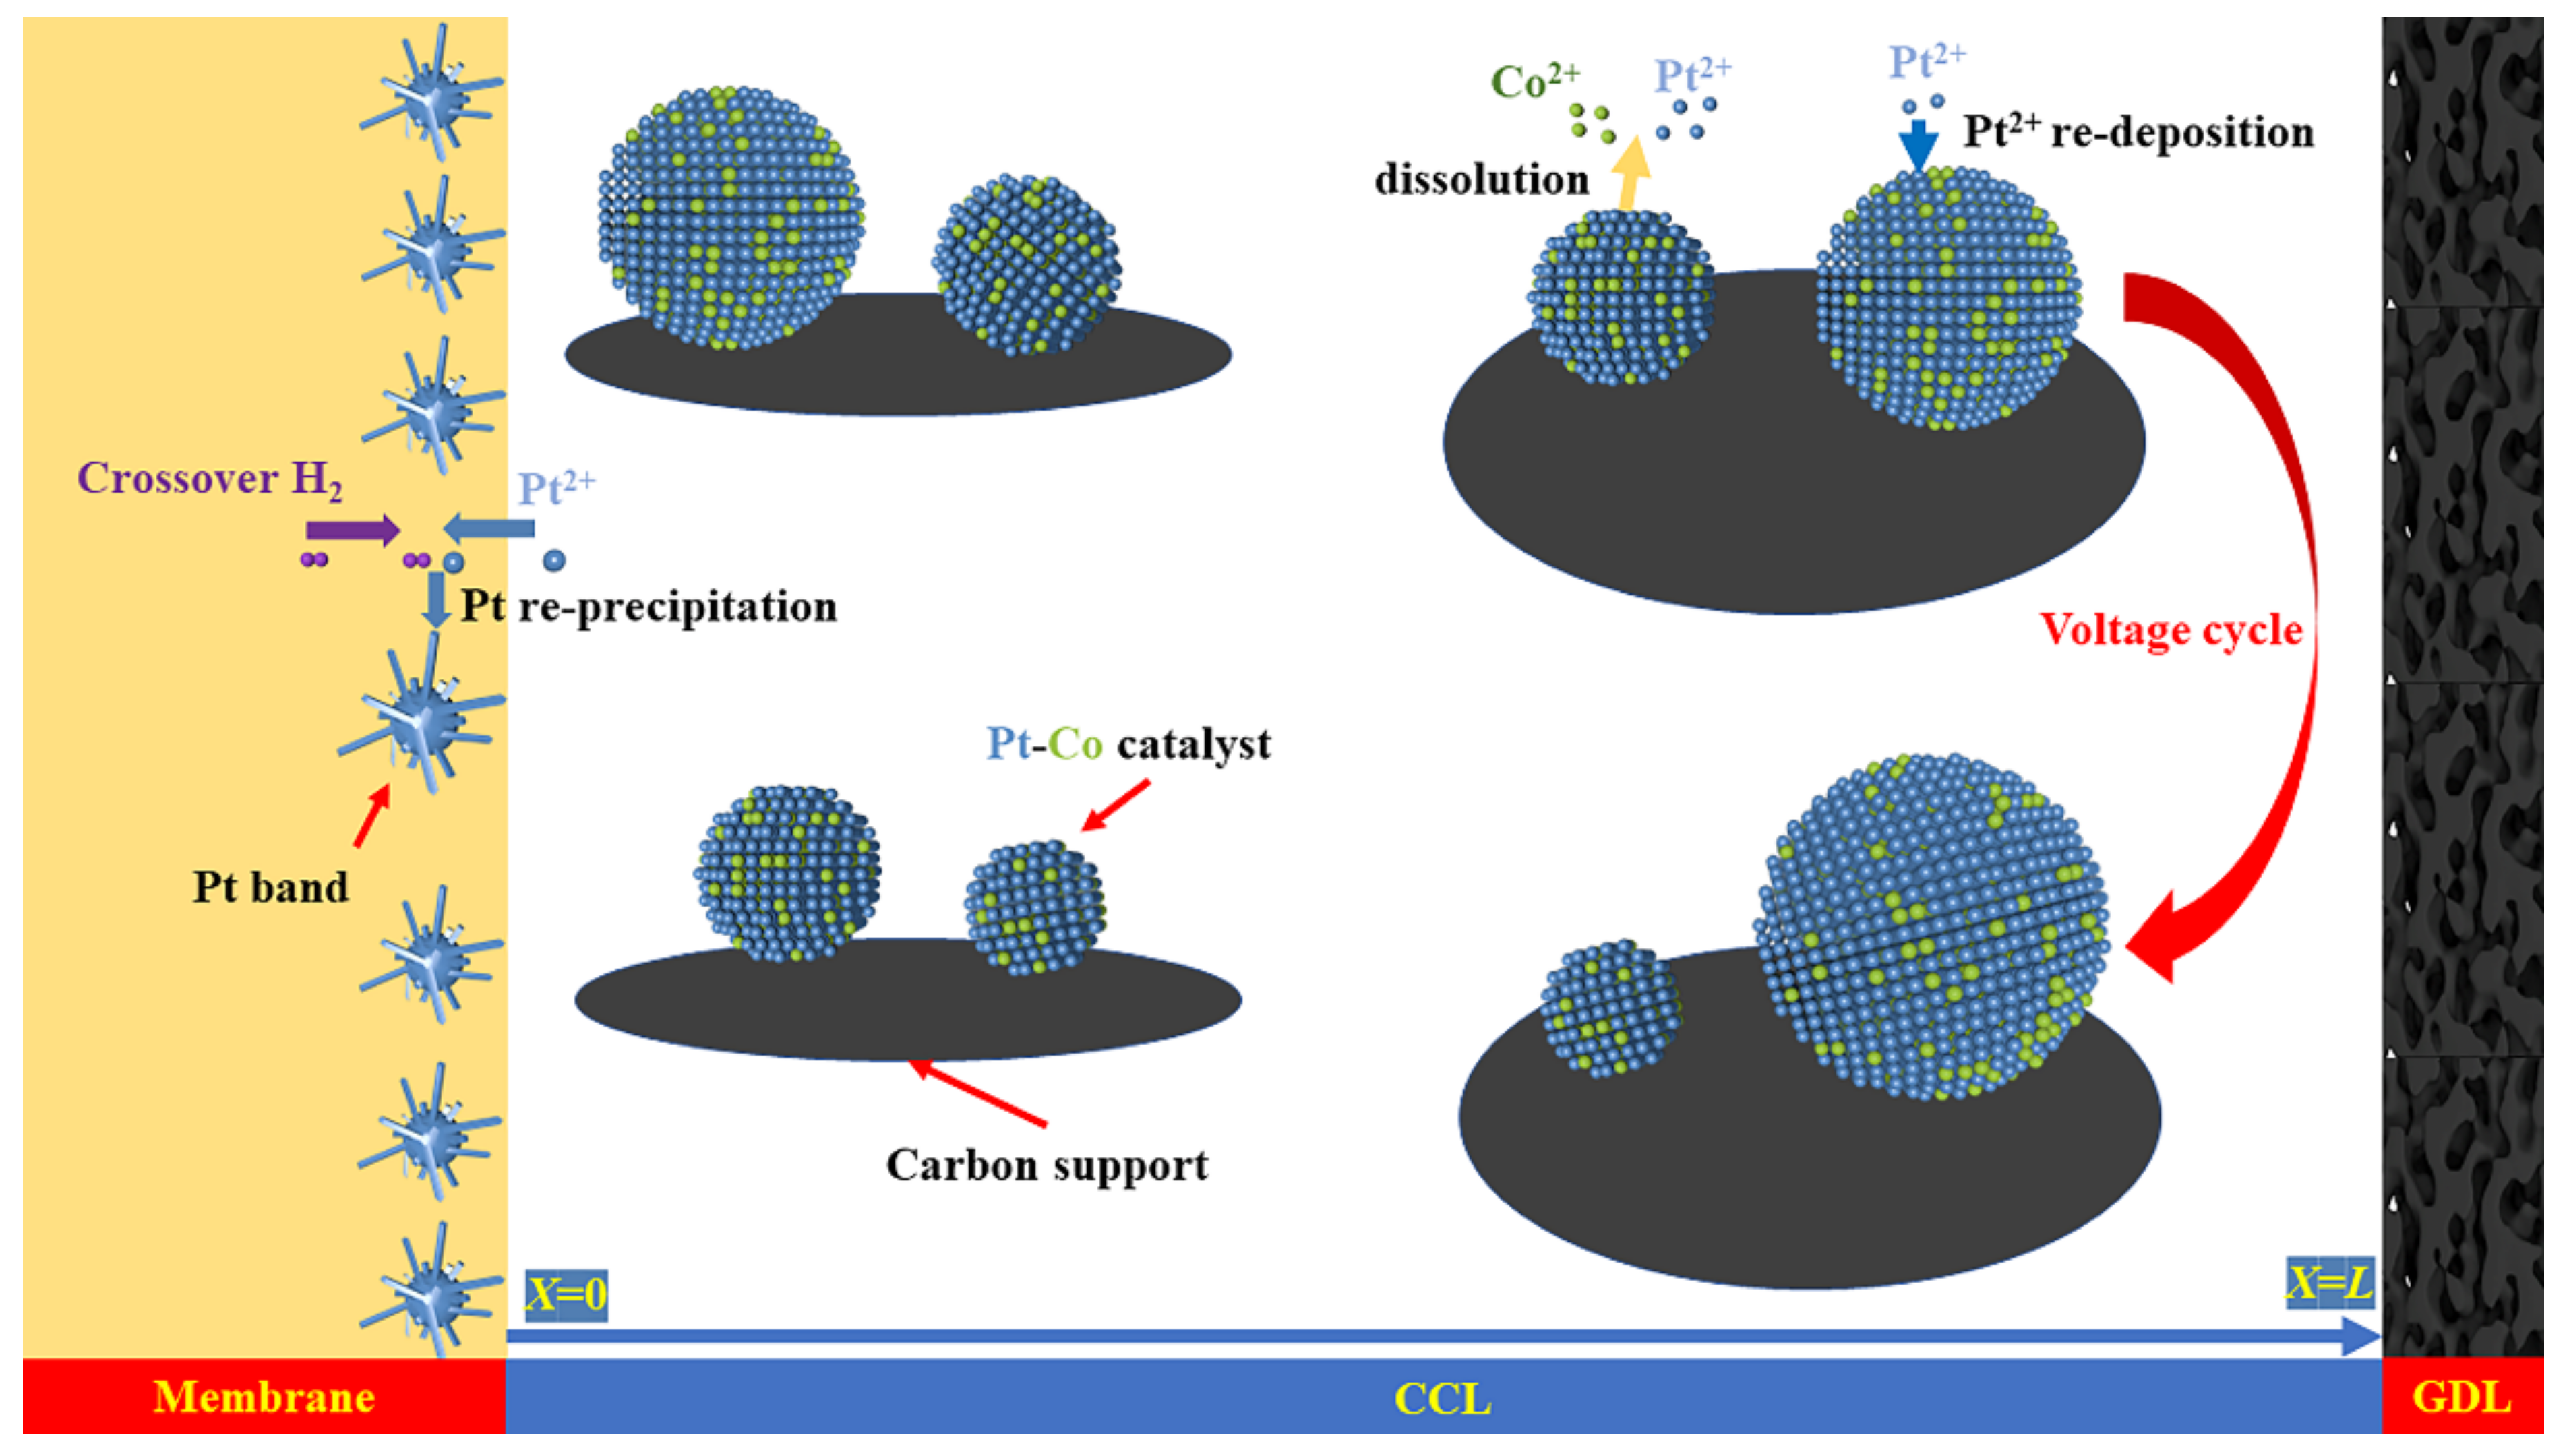
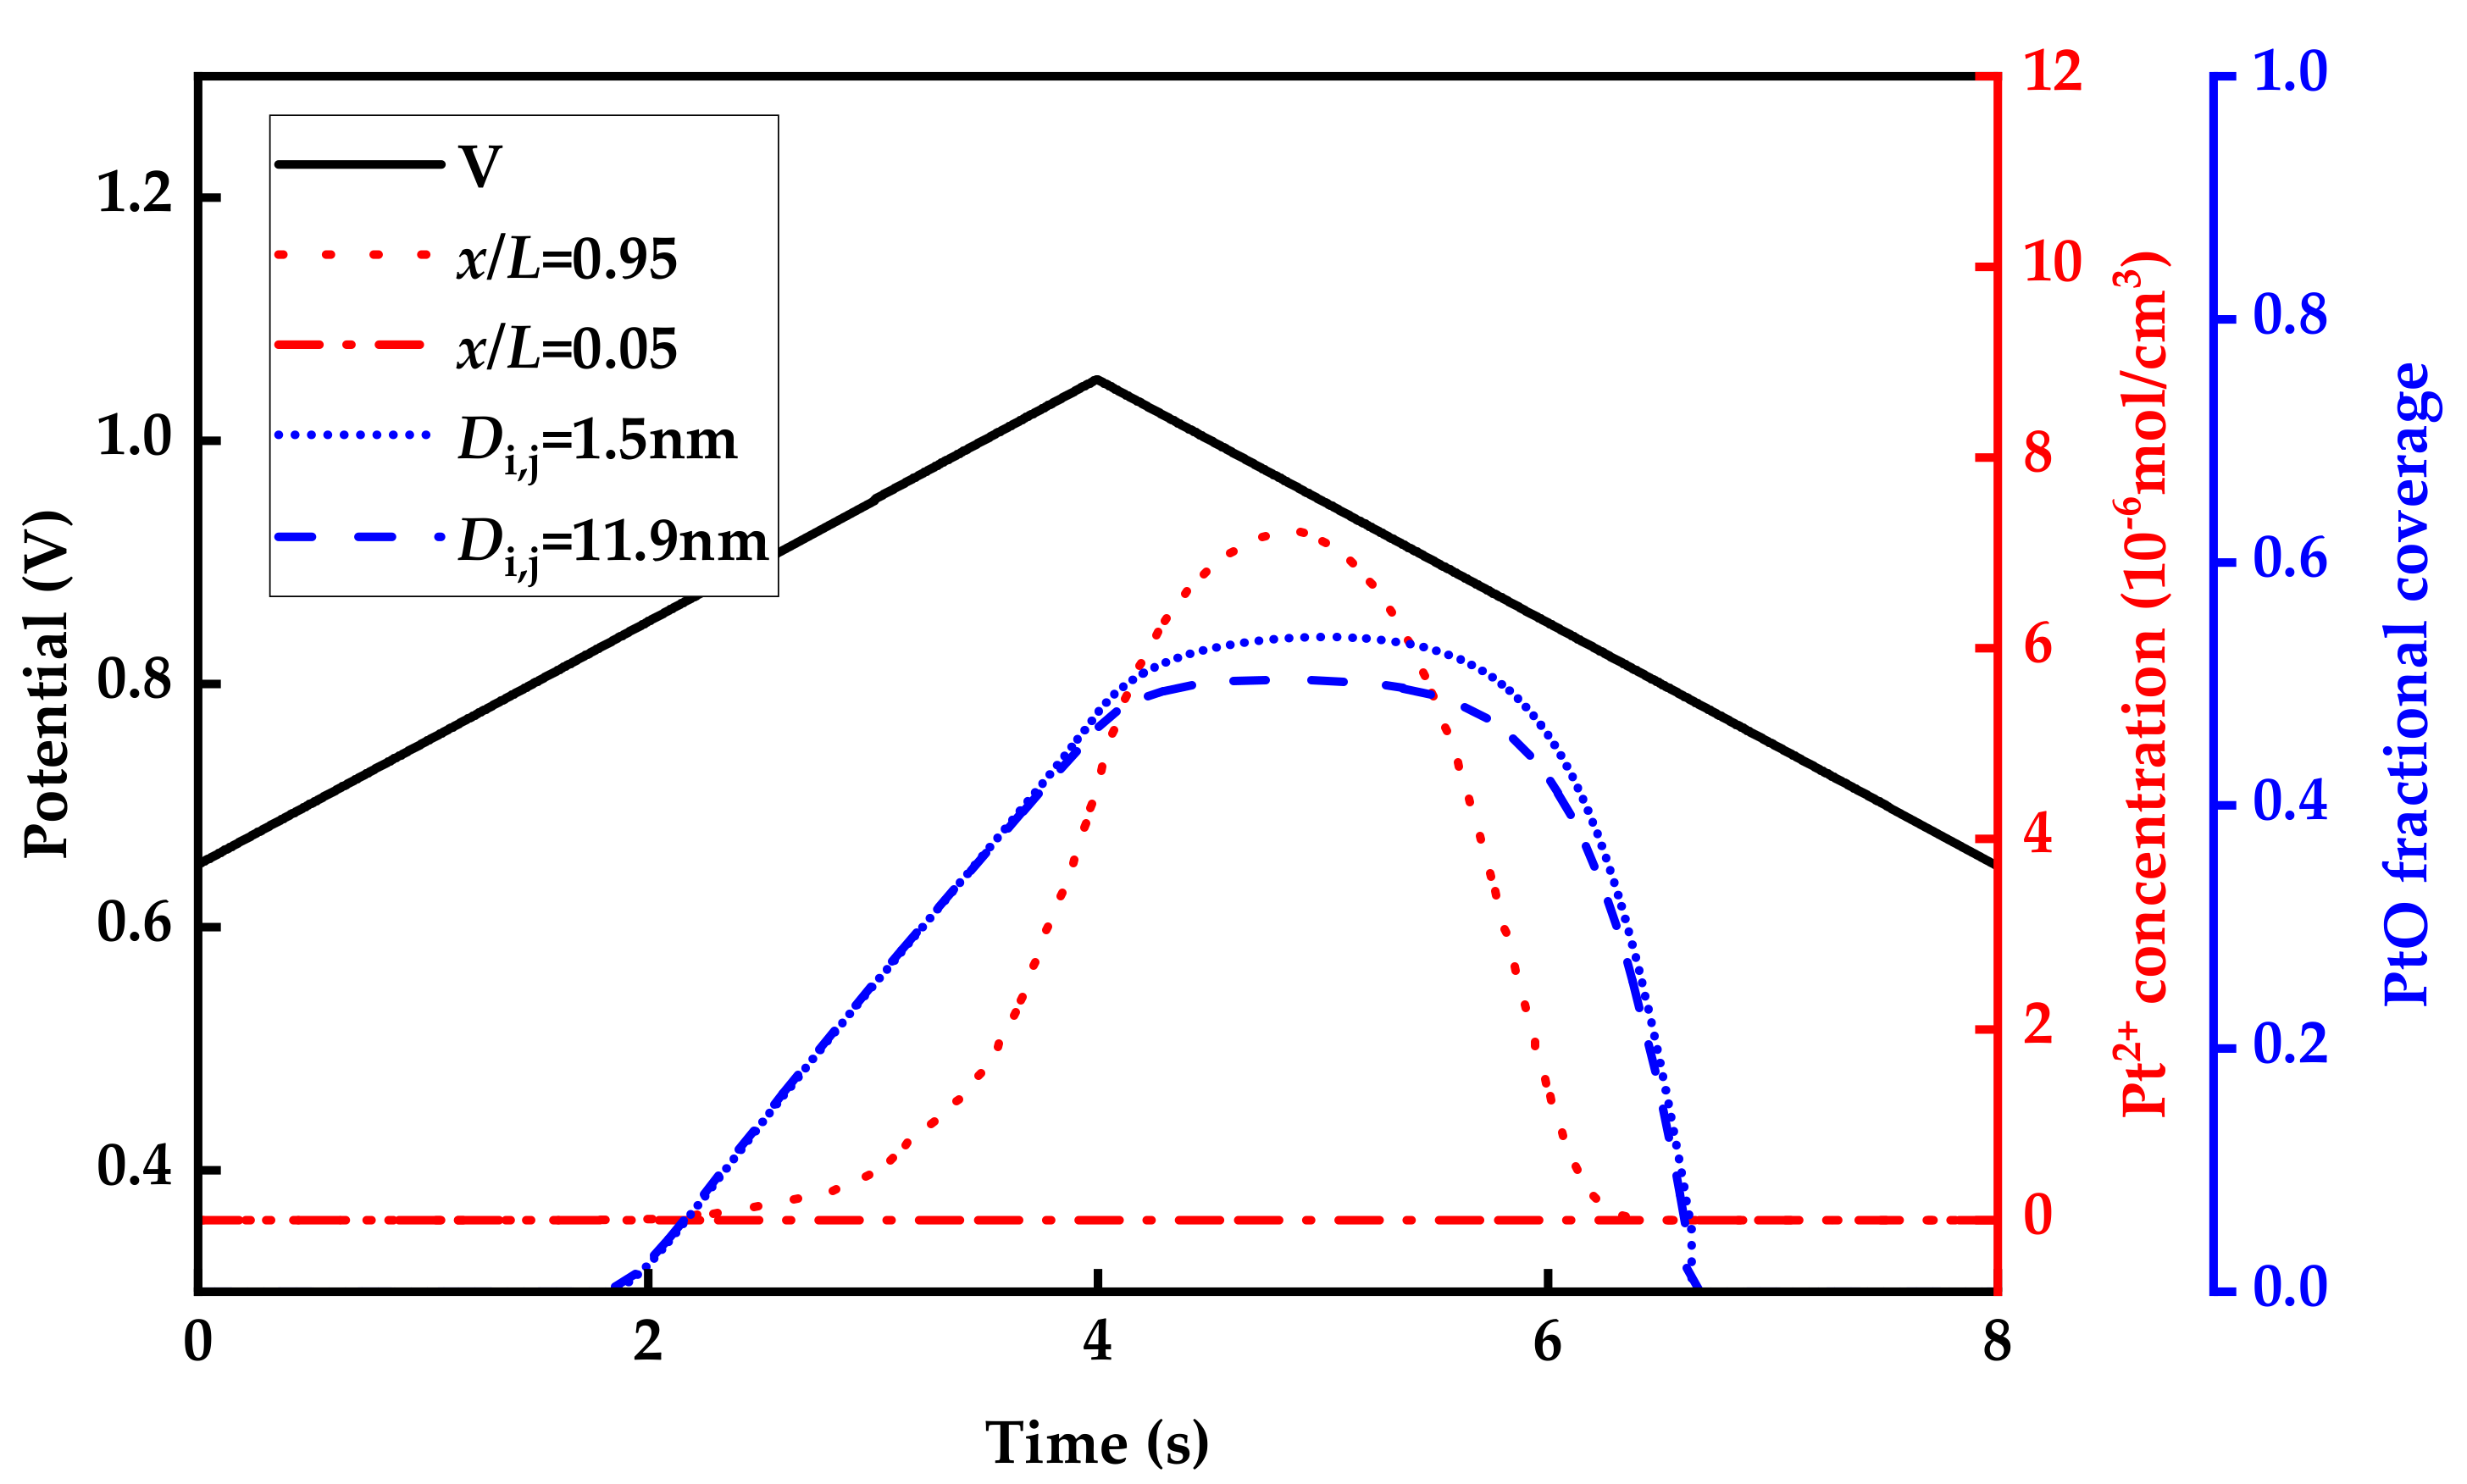
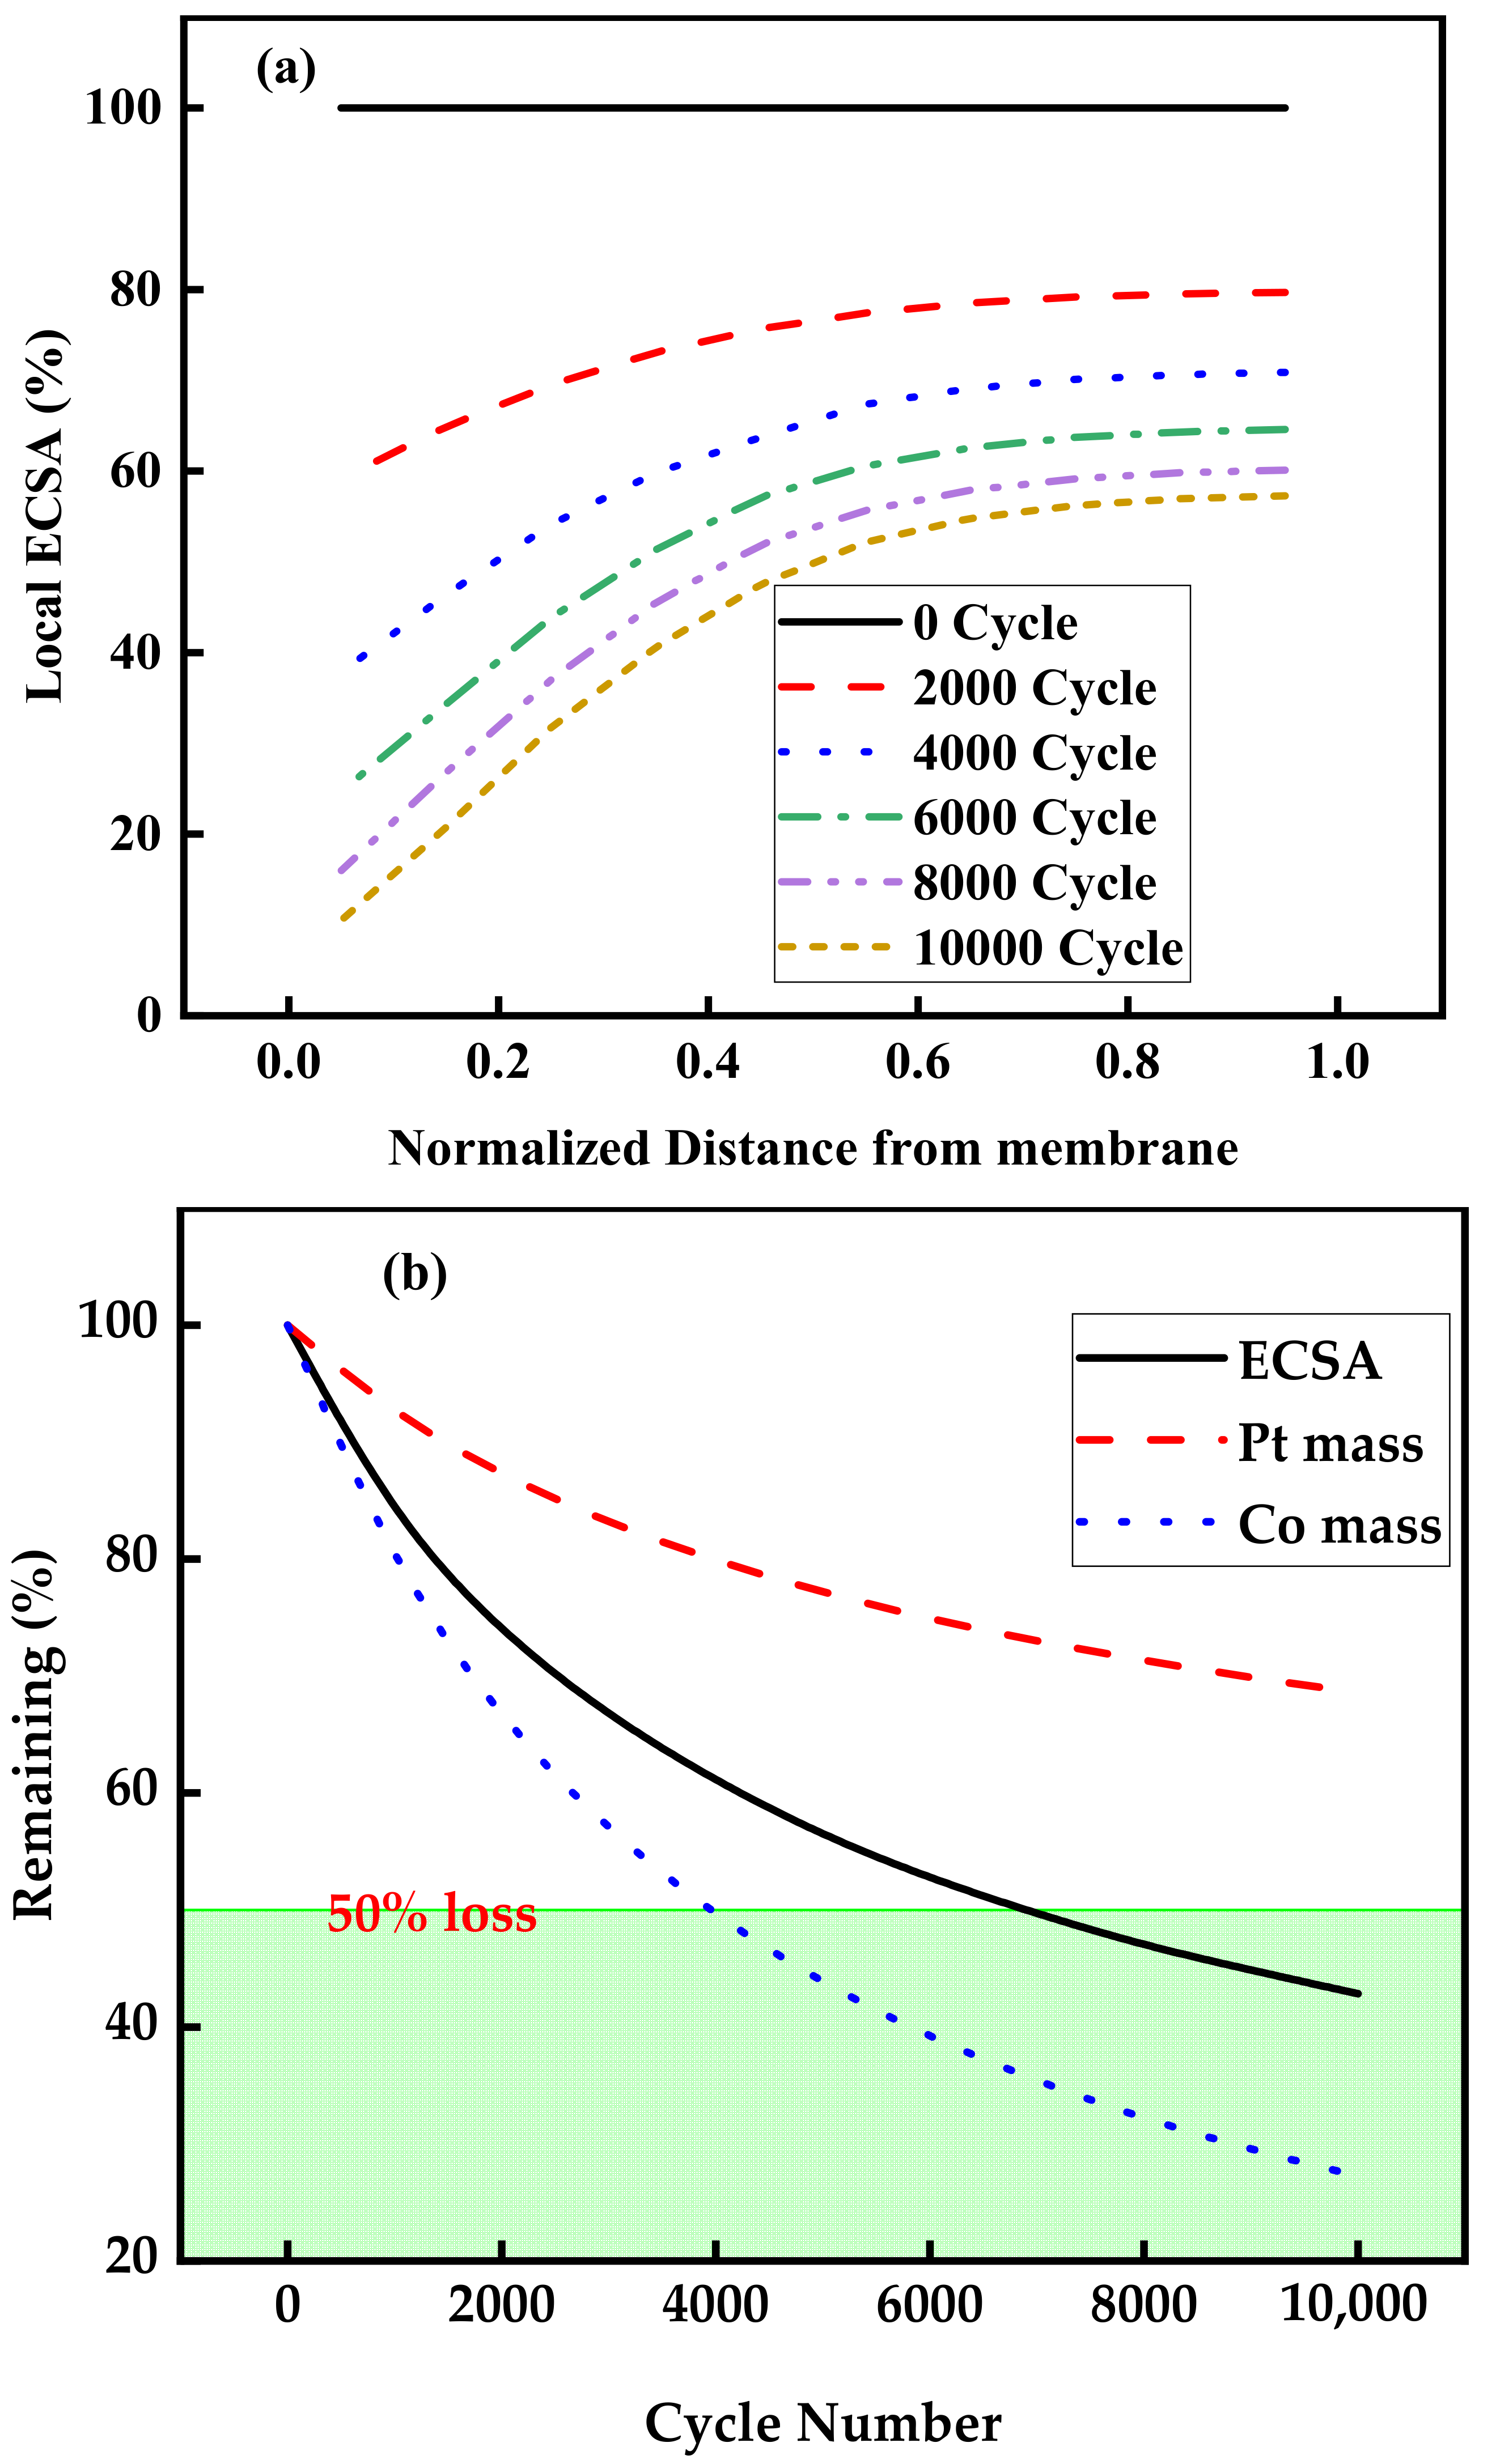
3.2. Aging of Catalysts during Voltage Cycle
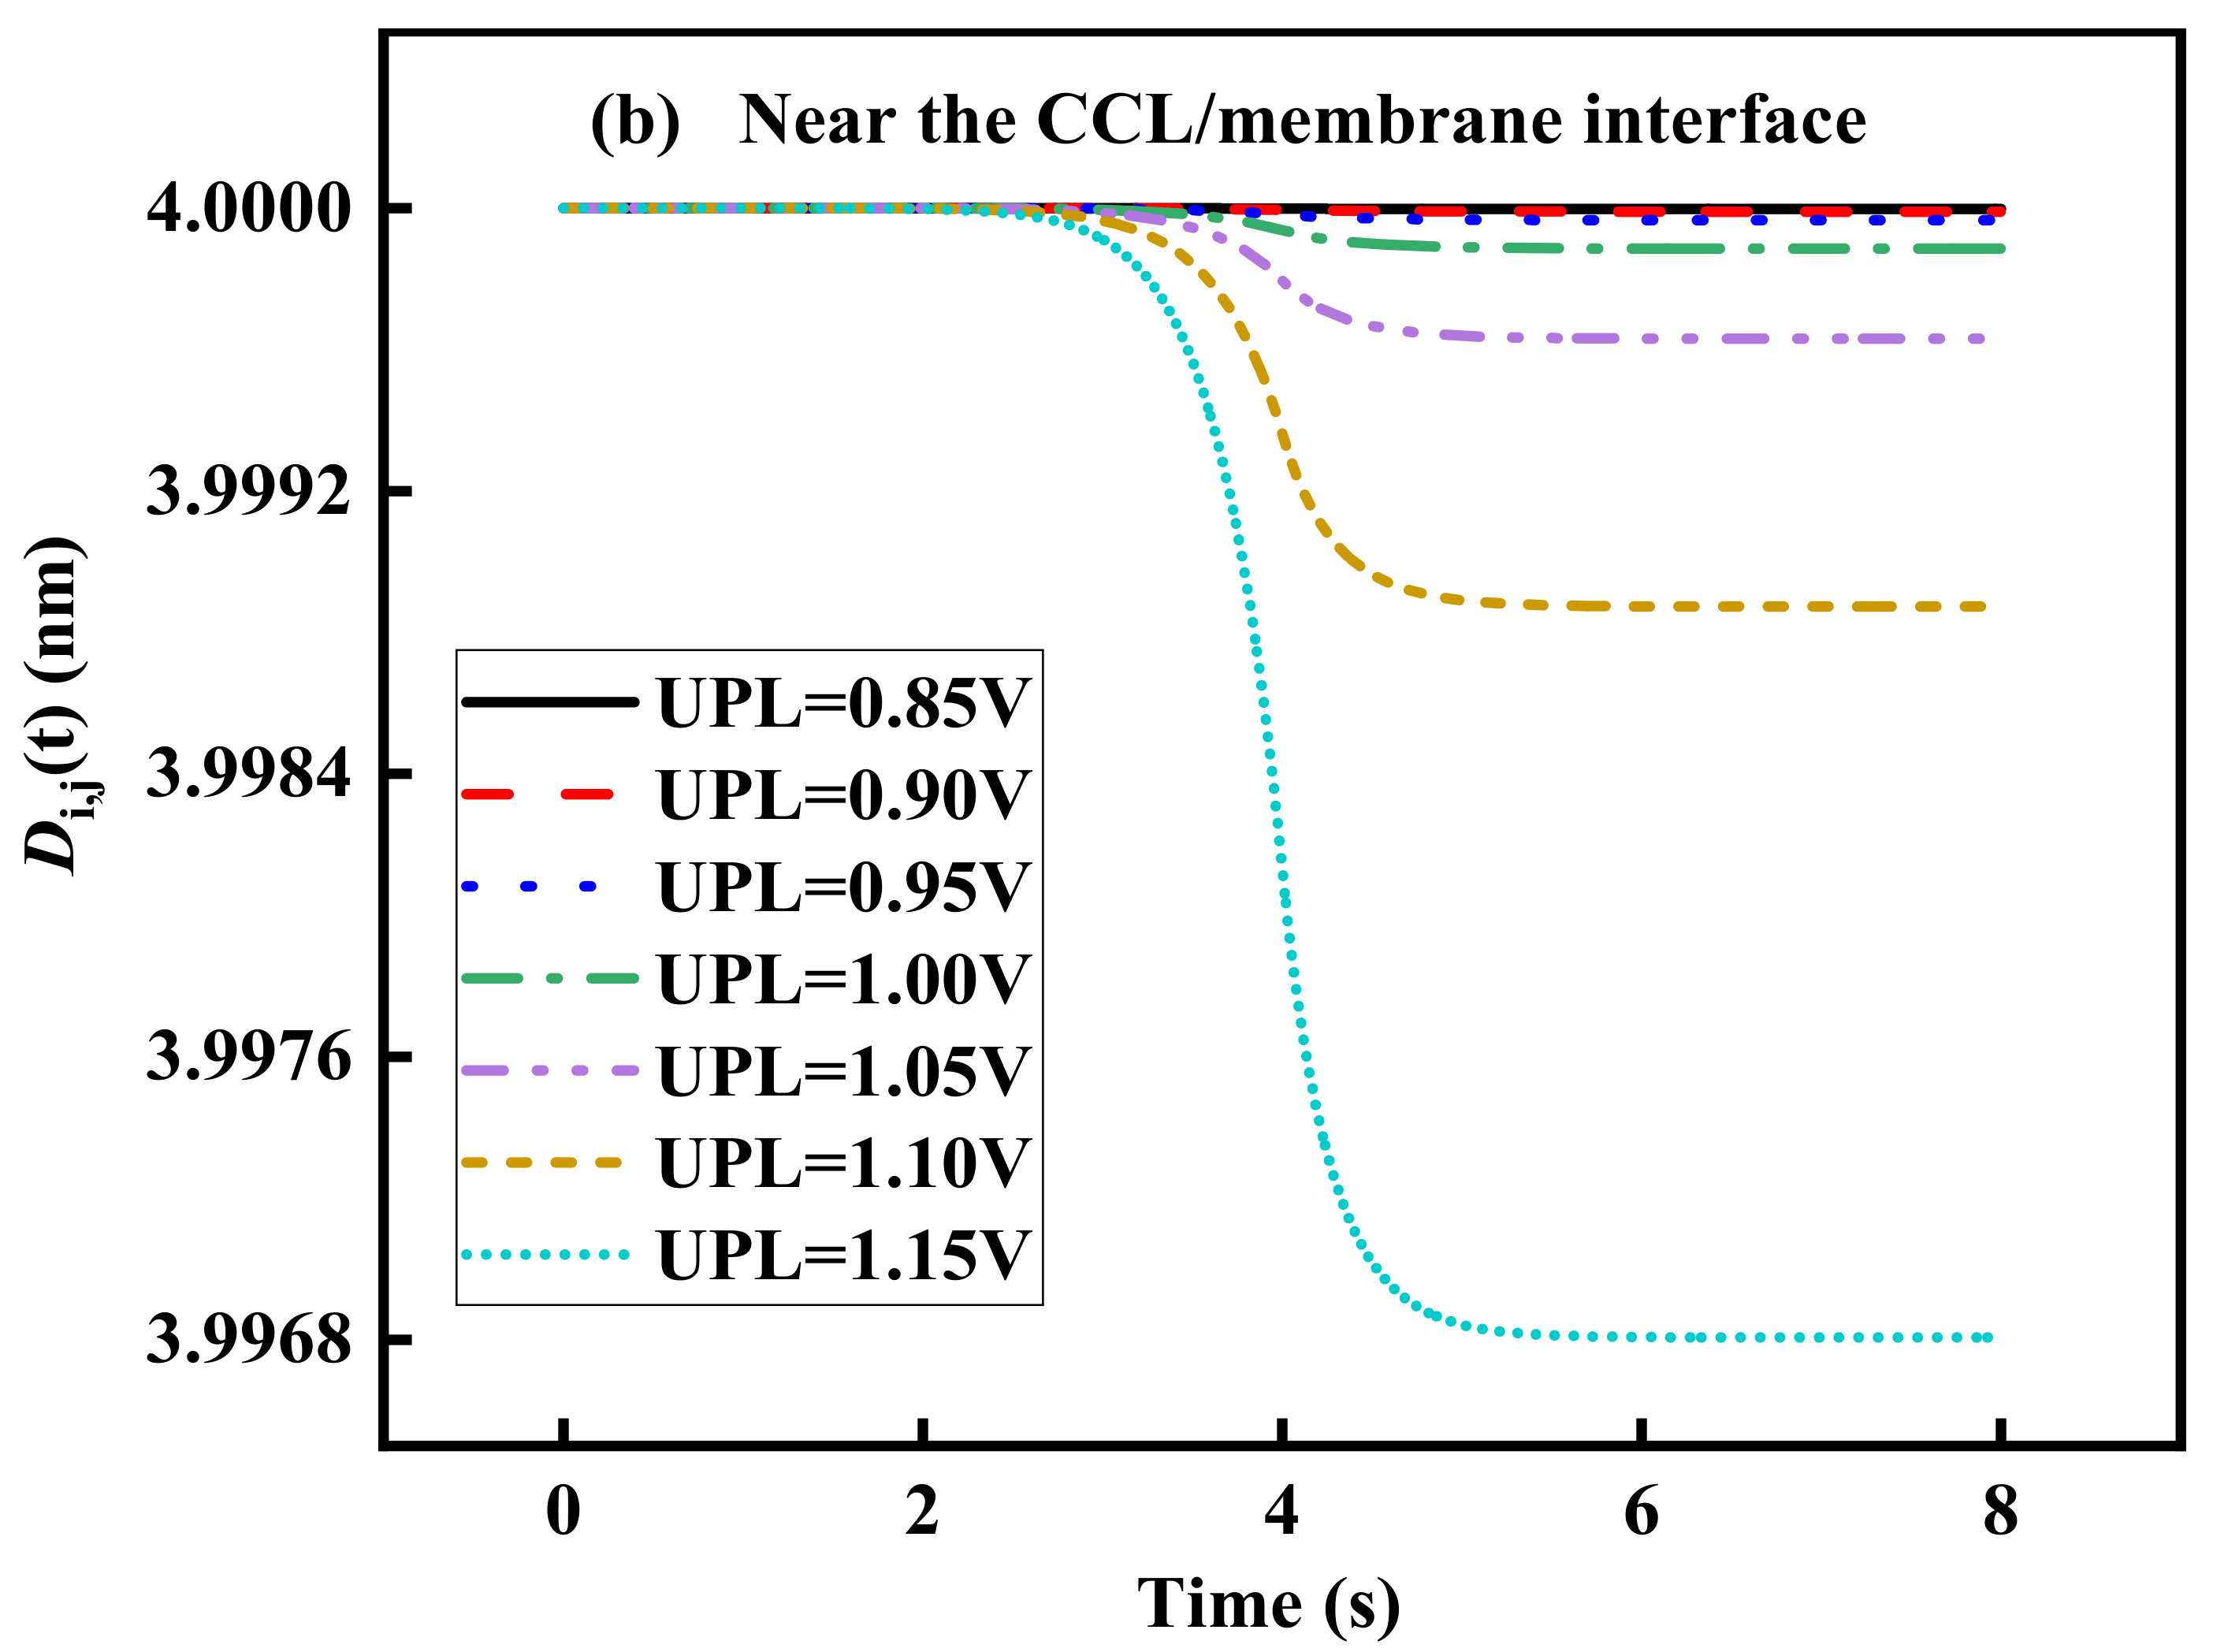
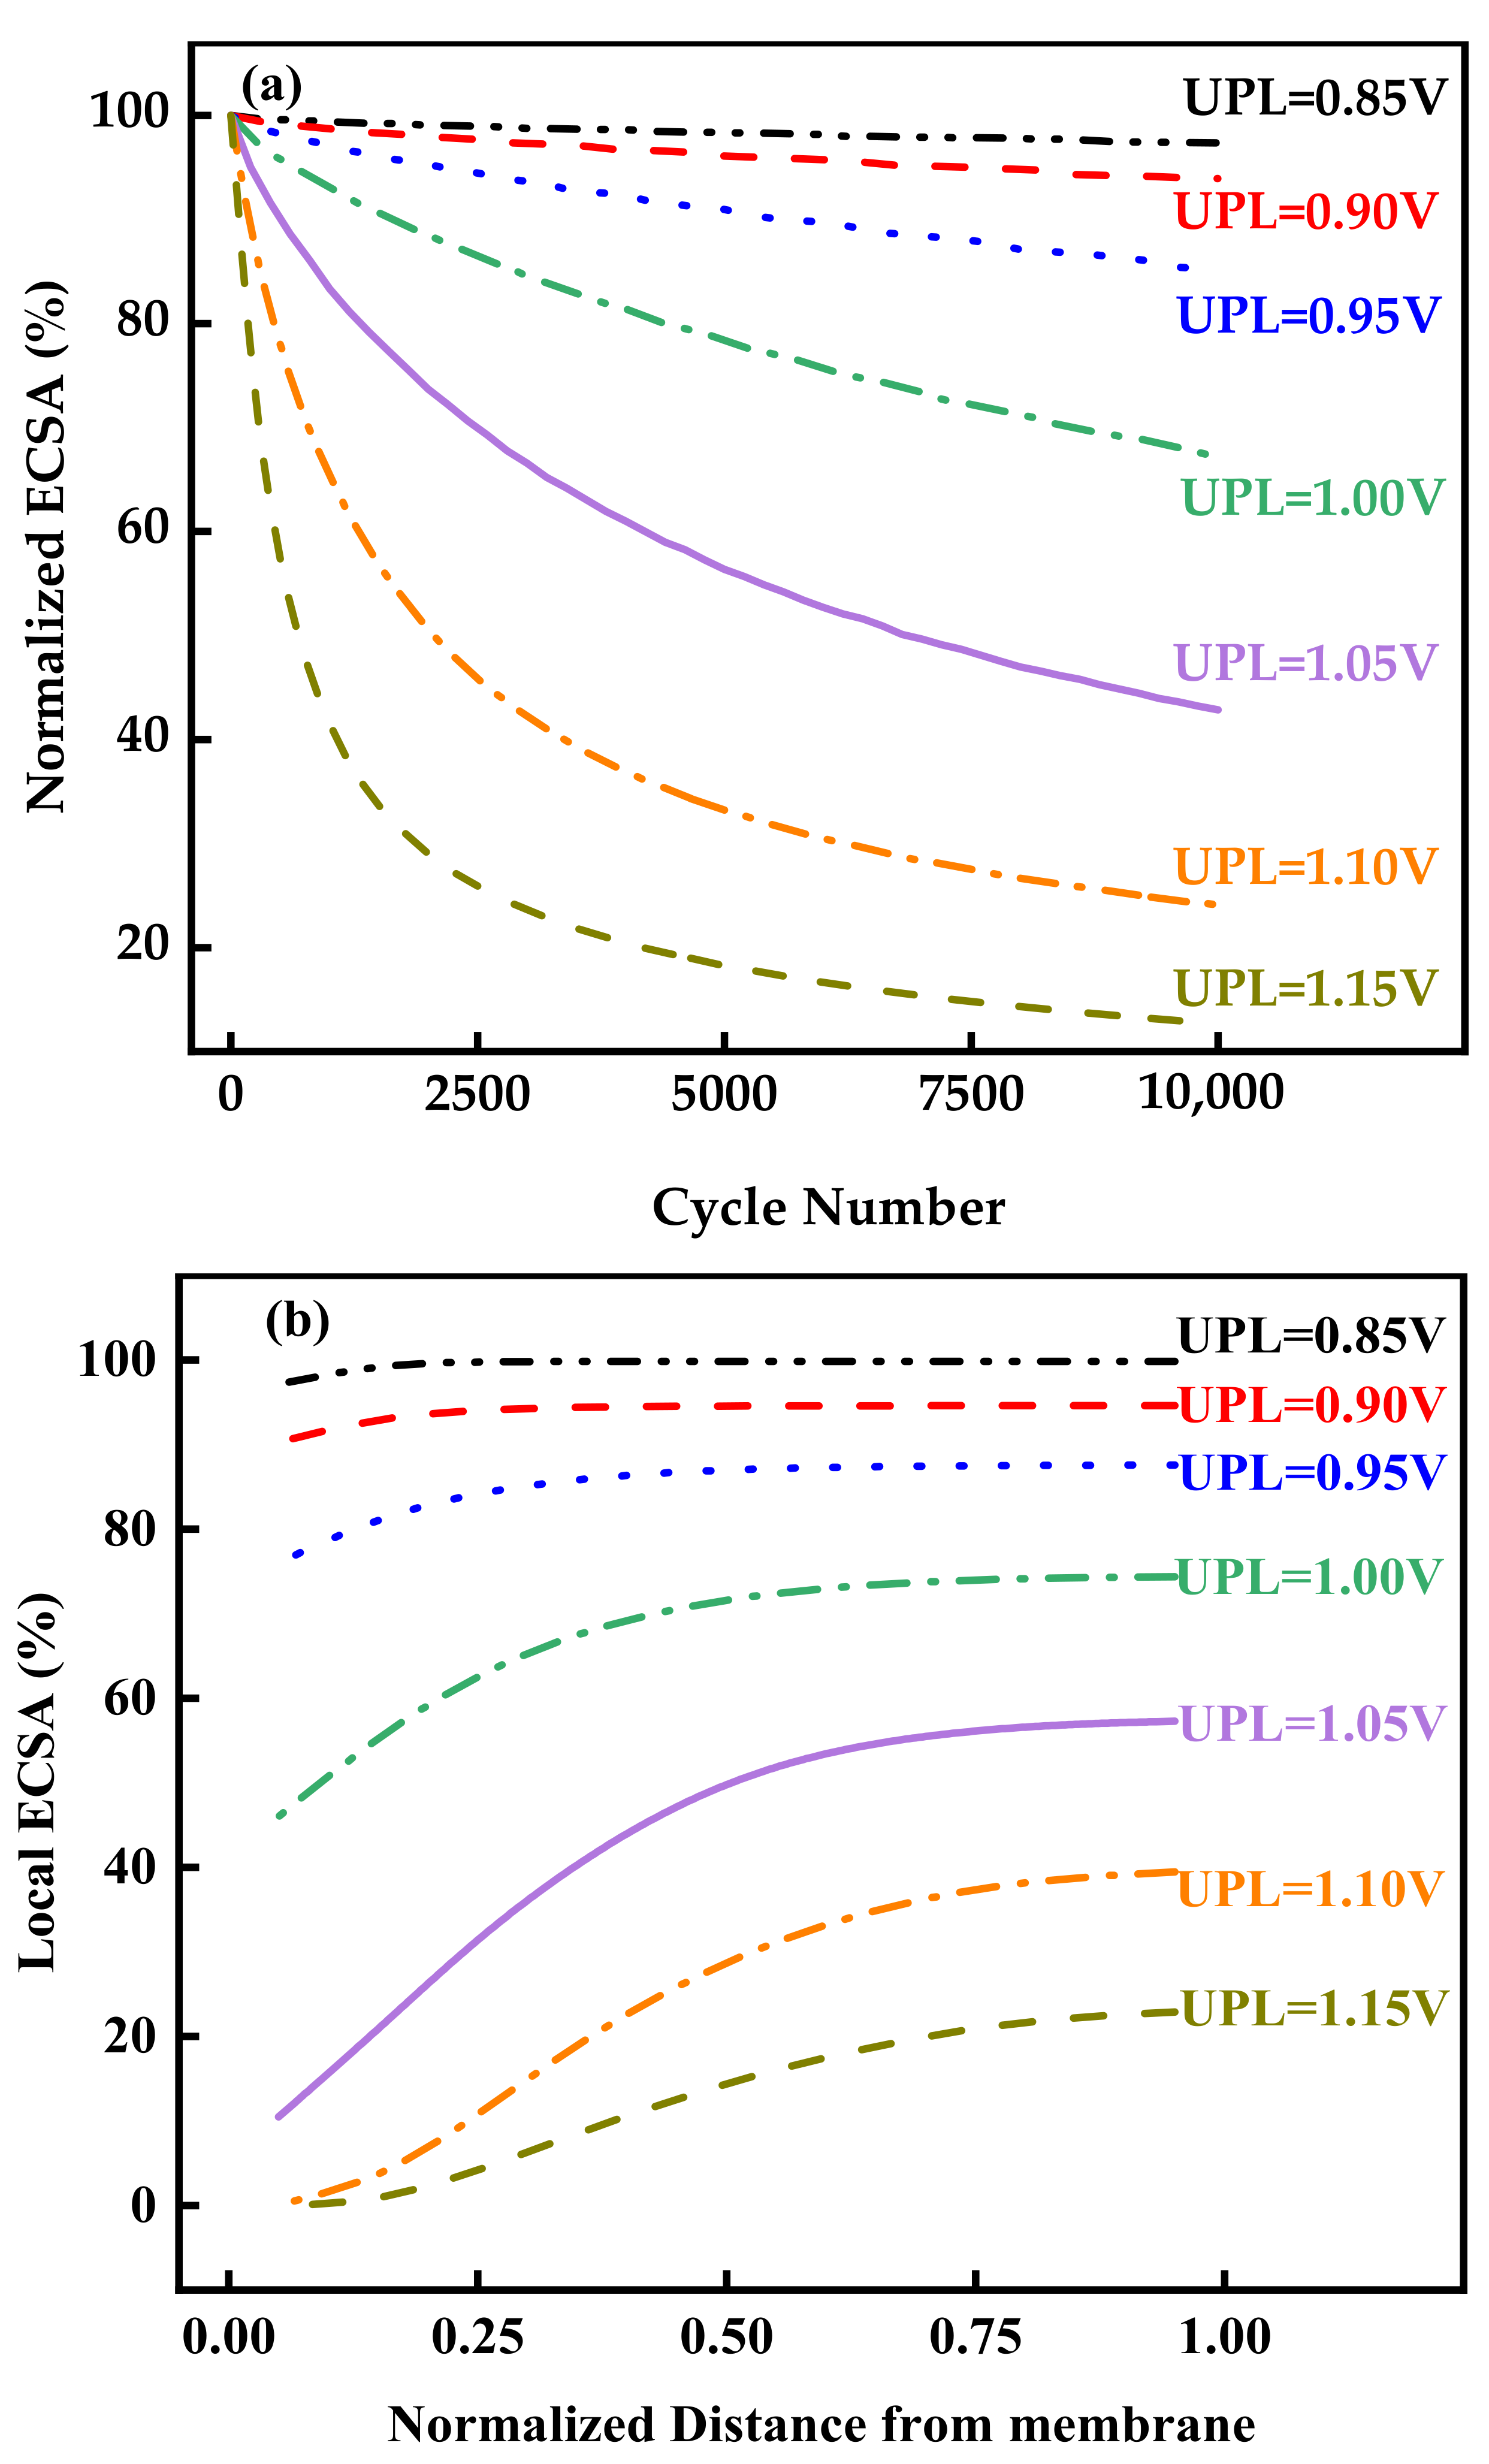
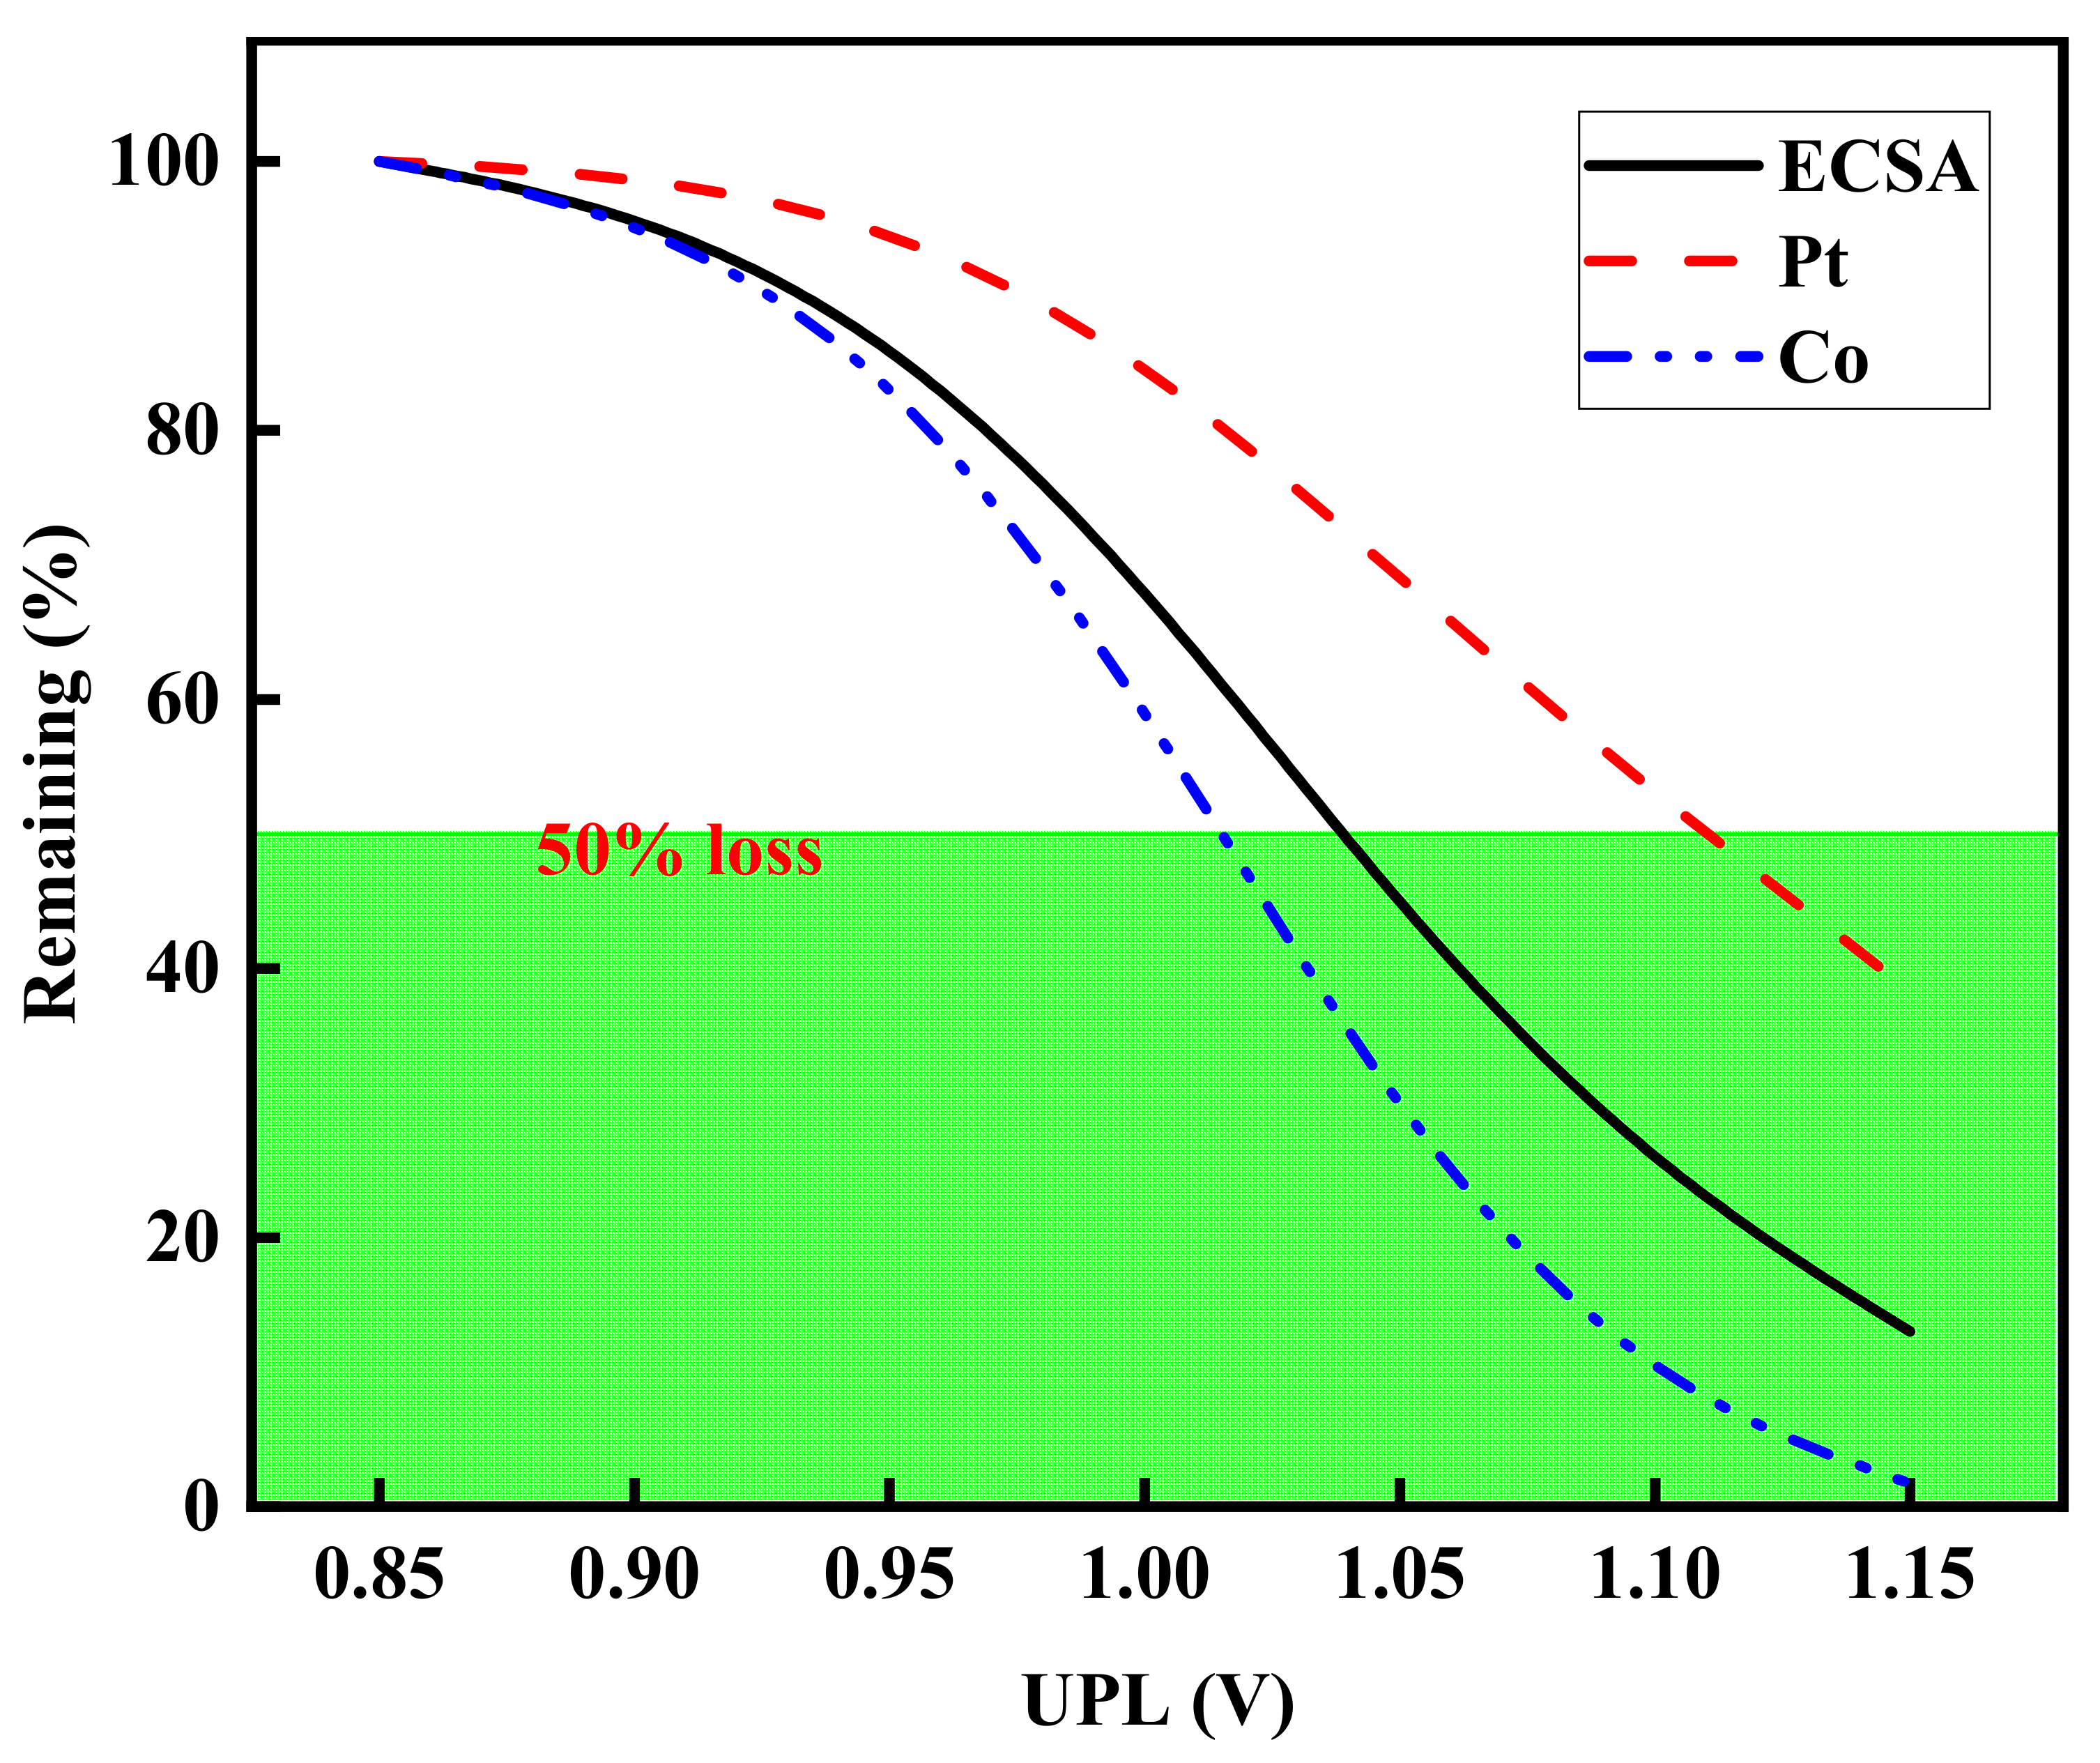
To further investigate the evolution of the Pt-Co alloy catalysts within the CCL at 0.65–1.05 V vs. RHE, 100 mV/s, 80 °C, H2|N2 (anode|cathode), and 100% RH, the initial PSD of the Pt-Co alloy catalyst within the CCL was chosen to have a normal distribution, with Dm = 4.0 nm and σ2 = 1.5 nm2, where the Pt loading was 0.25 mg/cm2, ni,j = 4.7 at the initial moment, and other parameters were kept constant. The size evolution of the particles was traced in order to understand the aging mechanism of the catalyst during the voltage cycle.
Figure 3 depicts the variation in voltage, Pt2+ concentration at both ends of the CCL, and PtO coverage on the surface of Di,j = 1.5 nm and 11.9 nm particles with time. It can be seen that near the CCL/GDL interface, the Pt2+ concentration starts to increase after the forward scanning voltage exceeds 0.8 V, indicating that the Pt on the catalyst surface starts to dissolve gradually at this time, which is also consistent with the previous results [42]. However, the Pt2+ concentration peak does not occur at the same moment as the voltage peak, but is slightly delayed, which may be due to the slow reaction rate and the inability to reach equilibrium at each time point [33]. Excess H2 reduces Pt2+ near the CCL/membrane interface [16,30], so the Pt2+ concentration here is always 0. The coverage of PtO at high voltage will indirectly affect the dissolution rate of Pt, which, in turn, indirectly affects the particle size evolution; thus, it is necessary to pay attention to the Pt oxide coverage on the particle surface. It can be seen that the Pt oxide coverage on the particle surface is almost negligible when the voltage is low, and the Pt oxide starts to form gradually on the particle surface when the voltage reaches 0.83 V; the Pt oxide coverage tends to reach the maximum value when V = 1.05 V. The PtO coverage on the catalyst surface remains stable until the voltage falls below 0.85 V during the reverse scanning voltage. In addition, it can be found from the figure that the small size particles possess a higher PtO coverage, which is also consistent with the results of Zheng et al. [33].
The uneven distribution of Pt2+ along the thickness direction of the CCL leads to a different catalyst evolution at each location within the CCL, which is mainly due to the different boundary conditions at the two ends of the CCL. Therefore, it is necessary to investigate the evolution of each particle near the interface of the CCL/GDL and CCL/membrane, so that the evolution of particles within the whole CCL can be deduced, which, in turn, can be used to elaborate the causes of catalyst aging. The evolution of the amount of change in the diameter of each particle near the interface of the CCL/GDL and CCL/membrane under the first voltage cycling is displayed in Figure 4, where the amount of diameter change is
D c h a n g e , i , j t = D i , j t D i . j 0
Near the CCL/GDL interface, the particle size of the catalyst with Di,j = 4 nm is unchanged after one voltage cycle. This does not mean that the particle structure of Di,j = 4 nm is identical before and after one voltage cycle, and the ni,j of these particles will be elevated after one voltage cycle due to the inability of Co2+ to be reduced. Large particles possess a lower Gibbs–Thomson energy [53], resulting in large size particles exhibiting lower dissolution rates during forward voltage scan. The rate of particle growing can be found to be positively correlated with diameter due to the deposition of Pt2+ on the surface of large size particles on the carbon support during reverse voltage scan. It is obvious that the size of particles with Di,j > 4 nm increases after one voltage cycle. Conversely, having a higher Gibbs–Thomson energy leads to a decrease in the size for the small particles after one voltage cycle, and their dissolution rate accelerates with the decrease in diameter. However, from the previous results, the Pt2+ concentration near the CCL/membrane interface is always 0, which prevents the Pt2+ redeposition reaction from occurring here; so, only here does the dissolution of Pt and Co occur on the surface of the particle, but the dissolution rate of the particles varies due to the different Gibbs–Thomson energy of each particle size.
To further explore the influence of voltage cycling on the size evolution of Pt-Co alloy catalysts, particles located near the GDL/membrane and GDL/CCL interfaces, with Di,j = 4 nm, 5 nm, and 9 nm, were chosen, and the size evolution of these particles were tracked during 10,000 voltage cycles, and the results are plotted in Figure 5. It can be seen that small particles with high Gibbs–Thomson energies are quickly and completely dissolved and disappear under voltage cycle, no matter where they are located in the CCL. However, as can be seen in Figure 5, the particle evolution at different positions is completely different for slightly larger size particles. For particles with Di,j = 5 nm located near the GDL/CCL interface, their sizes gradually increase in the early stage of voltage cycling, and the complete dissolution of small particles leads to a continuous decrease in the size of Di,j = 5 nm particles in the later stage of the voltage cycling, while here Di,j = 9 nm particles exhibit coarsening throughout the voltage cycle. All particles near the GDL/membrane interface are continuously dissolved during voltage cycle, and their dissolution rate is size dependent, which is also in full agreement with the results in Figure 4. Since the GDL/membrane and GDL/CCL interfaces are exactly two extreme conditions of the CCL along the thickness direction, particles of the same size at other positions will necessarily lie between the particle evolution curves at these two positions. At the same location, it is clear from Figure 4 that the evolution of different particles must also lie between the evolutionary curves of particles larger and smaller than them. Therefore, the size evolution of particles at each location within the CCL during the voltage cycling can be inferred from Figure 5.
The change in particle size of Pt-Co alloy catalysts inevitably affects the performance of PEMFCs, and it can be seen in Figure 6a that the distribution of ECSA within the CCL gradually becomes very uneven, especially around the CCL/membrane interface, where the catalysts are most severely damaged by the voltage cycle. The ECSA loss near the CCL/membrane interface reaches about 60% after 4000 voltage cycles, which is expected to lead to the first complete loss of ECSA at this position as the voltage cycles continue. As mentioned earlier, small particles will dissolve rapidly at the beginning of the voltage cycle, while the evolution rates of the remaining large particles are obviously slower; thus, the ECSA, Pt, and Co losses of the catalysts show a gradual slowdown, as seen in Figure 6b, which also coincides with Holby et al. [29]. Co has a low dissolution equilibrium voltage [33] while Pt has a high dissolution equilibrium voltage [49]; the mass loss of Pt is significantly lower than that of Co due to the redeposition reaction of the dissolved Pt on the catalyst surface. It can be found that the mass loss of Co is 50% at only 3900 voltage cycles and the loss of ECSA is 50% at 6800 voltage cycles; however, the mass loss of Pt is only 31.4% after 10,000 voltage cycles.

3.3. Effect of UPL

UPL is one of the most significant parameters of PEMFCs, and it is very helpful to limit the degradation of Pt-based catalysts in a PEMFC [35]. To further understand the effect of UPL on the degradation of Pt-Co alloy catalysts within the CCL, the initial PSD was chosen to have a normal distribution, with Dm = 4.0 nm and σ2 = 1.5 nm2, where the Pt loading was 0.25 mg/cm2, ni,j = 4.7 at the initial moment, LPL = 0.65 V, and the period of one voltage cycle was kept as 8 s; only UPL was changed whereas the other parameters were kept constant. The size evolution of the particles was tracked under 80 °C, 100% RH, and a H2|N2 (anode|cathode) triangular waveform voltage cycle, to understand the effect of UPL on the performance and lifetime of Pt-Co alloy catalysts.
The change in UPL directly affects the coarsening and dissolution of the catalyst particles; so, it is necessary to investigate the effect of UPL on the evolution of particle diameter within the CCL. Figure 7a,b depicts the effect of UPL on the evolution of Di,j = 4 nm catalysts close to the GDL/CCL and GDL/membrane interfaces during the first voltage cycling, respectively. From Figure 7a, it can be found that when UPL = 0.85–1.00 V, the dissolution of the Di,j = 4 nm catalyst is less than the coarsening, leading to an increase in particle size after one voltage cycle. The size of the catalysts with Di,j = 4 nm remains almost constant after a voltage cycle for UPL = 1.05 V. However, the coarsening is clearly lower than the dissolution for the nanoparticles after UPL > 1.05 V, which may be due to the effect that more Pt2+ diffuses towards the CCL/membrane side during Pt dissolution due to a larger concentration gradient, resulting in insufficient remaining Pt2+ to restore the catalyst with Di,j = 4 nm to its original size. As seen in Figure 7b, the particle size on the CCL/membrane side decreases severely as the UPL. The change in catalyst size after the first voltage cycle for Di,j = 4 nm at UPL = 0.95 V is only 3 times that of UPL = 0.90 V, while the change in catalyst size after the first voltage cycle for Di,j =4 nm at UPL = 1.15 V is 319 times that of UPL = 0.90 V. This indicates that the effect of UPL on the catalyst diameter is perhaps nonlinear, suggesting that an increase in UPL leads to severe particle dissolution near the GDL/membrane interface. In summary, it can be found that UPL leads to an increasing rate of both dissolution and coarsening of the particles throughout the CCL.
The remaining ECSA situation can reflect the catalytic performance of the CCL. The effect of UPL on the remaining ECSA of the catalyst is depicted in Figure 8a. As analyzed in Figure 3, Pt hardly dissolves at lower voltages; therefore, it can be found that the ECSA loss increases continuously with UPL under a voltage cycle, which is also consistent with the experimental results of Đukic et al. [35]. The ECSA hardly changes with voltage cycles when UPL = 0.85 V, and the ECSA loss after 10,000 voltage cycles is only 2.63%. However, for UPL = 1.15 V, the ECSA loss after only 700 voltage cycles is more than 50%, and the ECSA after 10,000 voltage cycles is only 12.68%. From Figure 8b, it can be found that UPL leads to severe catalyst aging in the whole CCL, which is mainly due to the fact that UPL accelerates the dissolution and coarsening of the particles. The sensitivity to UPL increases dramatically along the thickness direction of CCL towards the CCL/membrane side. When UPL = 1.10 V, the loss of ECSA for x/L = 0.05 is 60.56%, while the ECSA loss near the CCL/membrane is almost complete. Therefore, long-term operation of the PEMFC at a too high voltage will lead to severe catalyst aging in the CCL and aggravate the degree of uneven aging of the ECSA, and the uneven aging of the catalyst along the CCL thickness direction will eventually lead to a catalytic reaction occurring only on the CCL/GDL side. This reduction in the available catalytic area and uneven distribution of ECSA could have an influence on the performance of PEMFCs and even seriously reduce thier operational life [54].
Using ECSA, Pt, and Co with the catalyst at UPL = 0.85 V as a reference, the results of ECSA, Pt, and Co at different UPLs and after 10,000 voltage cycles were normalized as follows to facilitate a visual comparison of the sensitivity of the residuals of ECSA, Pt, and Co in the catalyst to UPL, and these results are presented in Figure 9:
P A R = P A R U P L P A R U P L = 0.85 V × 100 %
where PAR indicates the residual content of ECSA, Pt mass, or Co mass.
From Figure 9, it can be found that when the UPL is increased from 0.85 V to 0.90 V, the losses in ECSA, Pt, and Co are only 3.53%, 0.95%, and 3.73%, respectively, indicating that the effects of lower UPL on the losses of ECSA, Pt, and Co are not significant. However, after UPL > 0.95 V, it can be clearly found that the three curves exhibit an abrupt decrease, with the remaining ECSA and Co mass of the catalyst at UPL = 1.00 V being 69% and 60.1% of that at UPL = 0.85 V, respectively, while the remaining ECSA and Co mass of the catalyst at UPL = 1.05 V are only 44% and 27.8% of that at UPL = 0.85 V, respectively. After UPL ≥ 1.10 V, the remaining Co mass curve tends to slow down due to almost all Co being dissolved; the remaining Co mass after 10,000 voltage cycles at UPL = 1.15 V is only 1.7% of UPL = 0.85 V, which is basically equivalent to a pure Pt catalyst. Furthermore, it can be noted that the mass loss of Co is most sensitive to UPL changes, and since the dissolved Co2+ is not reduced, these Co2+ can enter the ionomer as well as the membrane and badly influence the proton conductivity and severely degrade the performance of the PEMFC. In summary, when UPL < 0.95 V, the change in UPL does not have a significant impact on the catalyst performance and service life, while after UPL > 0.95 V, even a slight change in UPL may cause great harm to the catalyst performance and life in the CCL. Therefore, it is necessary to choose a reasonable UPL for PEMFC operation to slow down the performance degradation rate of the PEMFC.

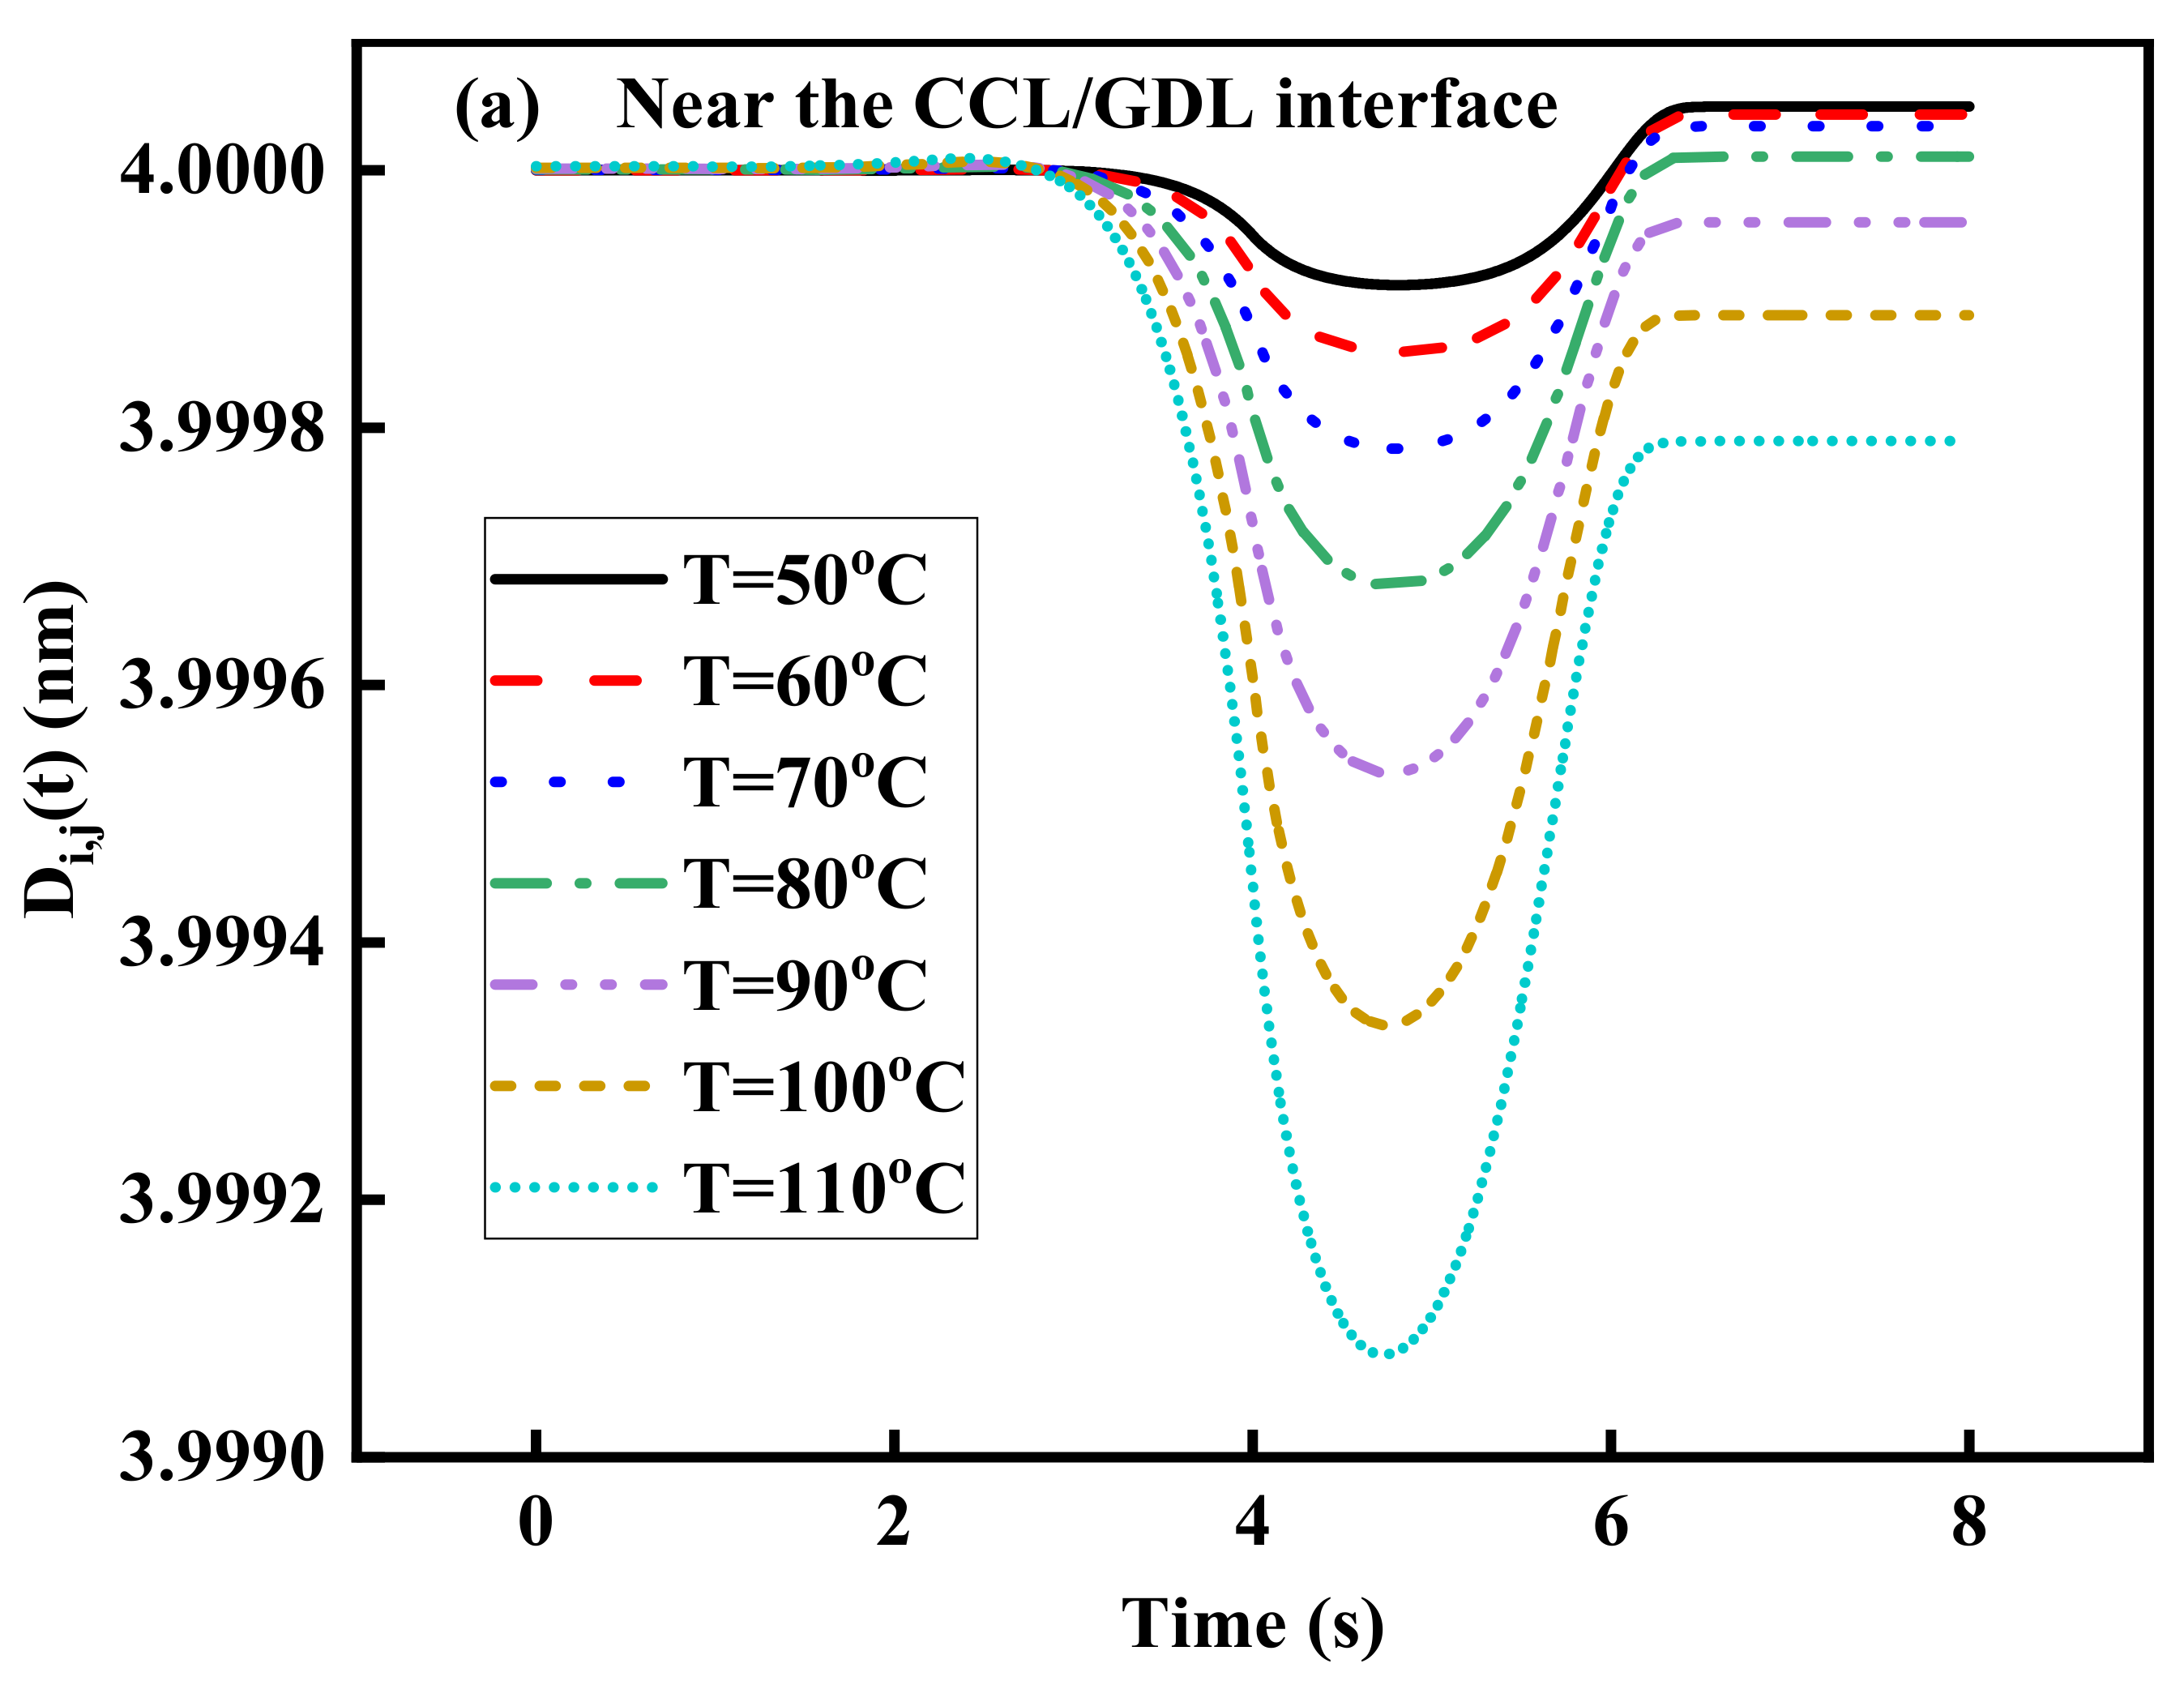
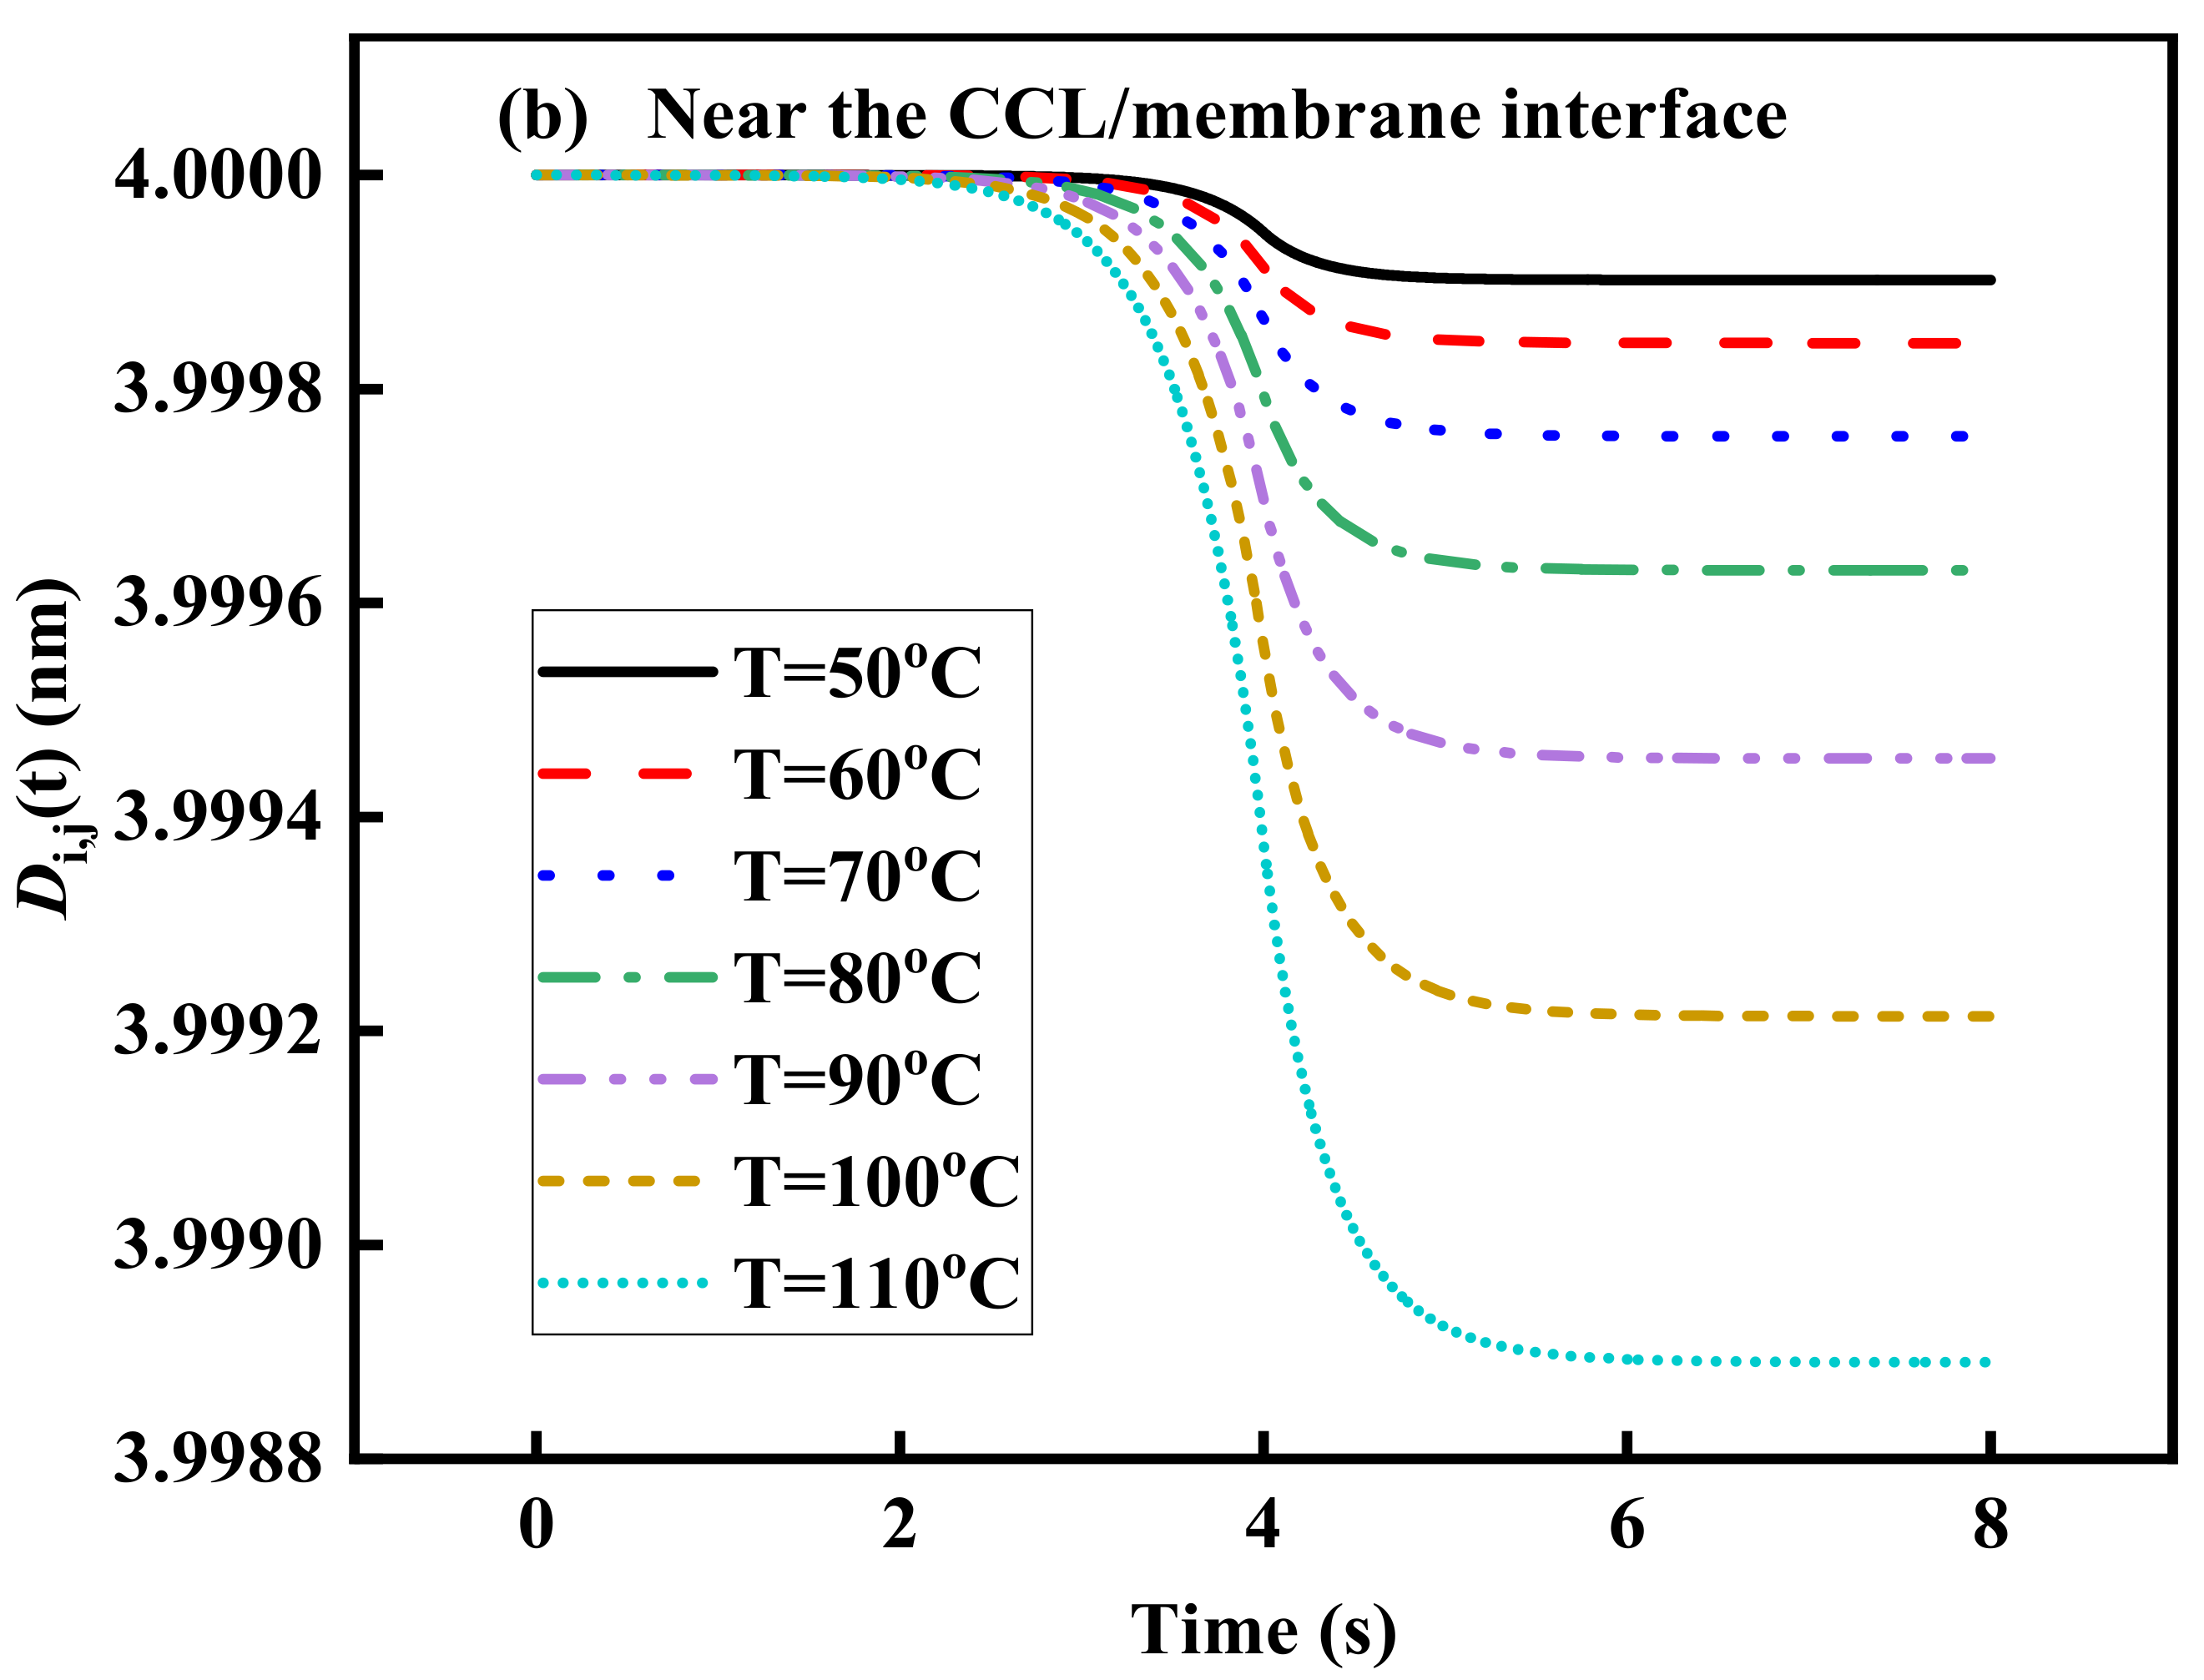
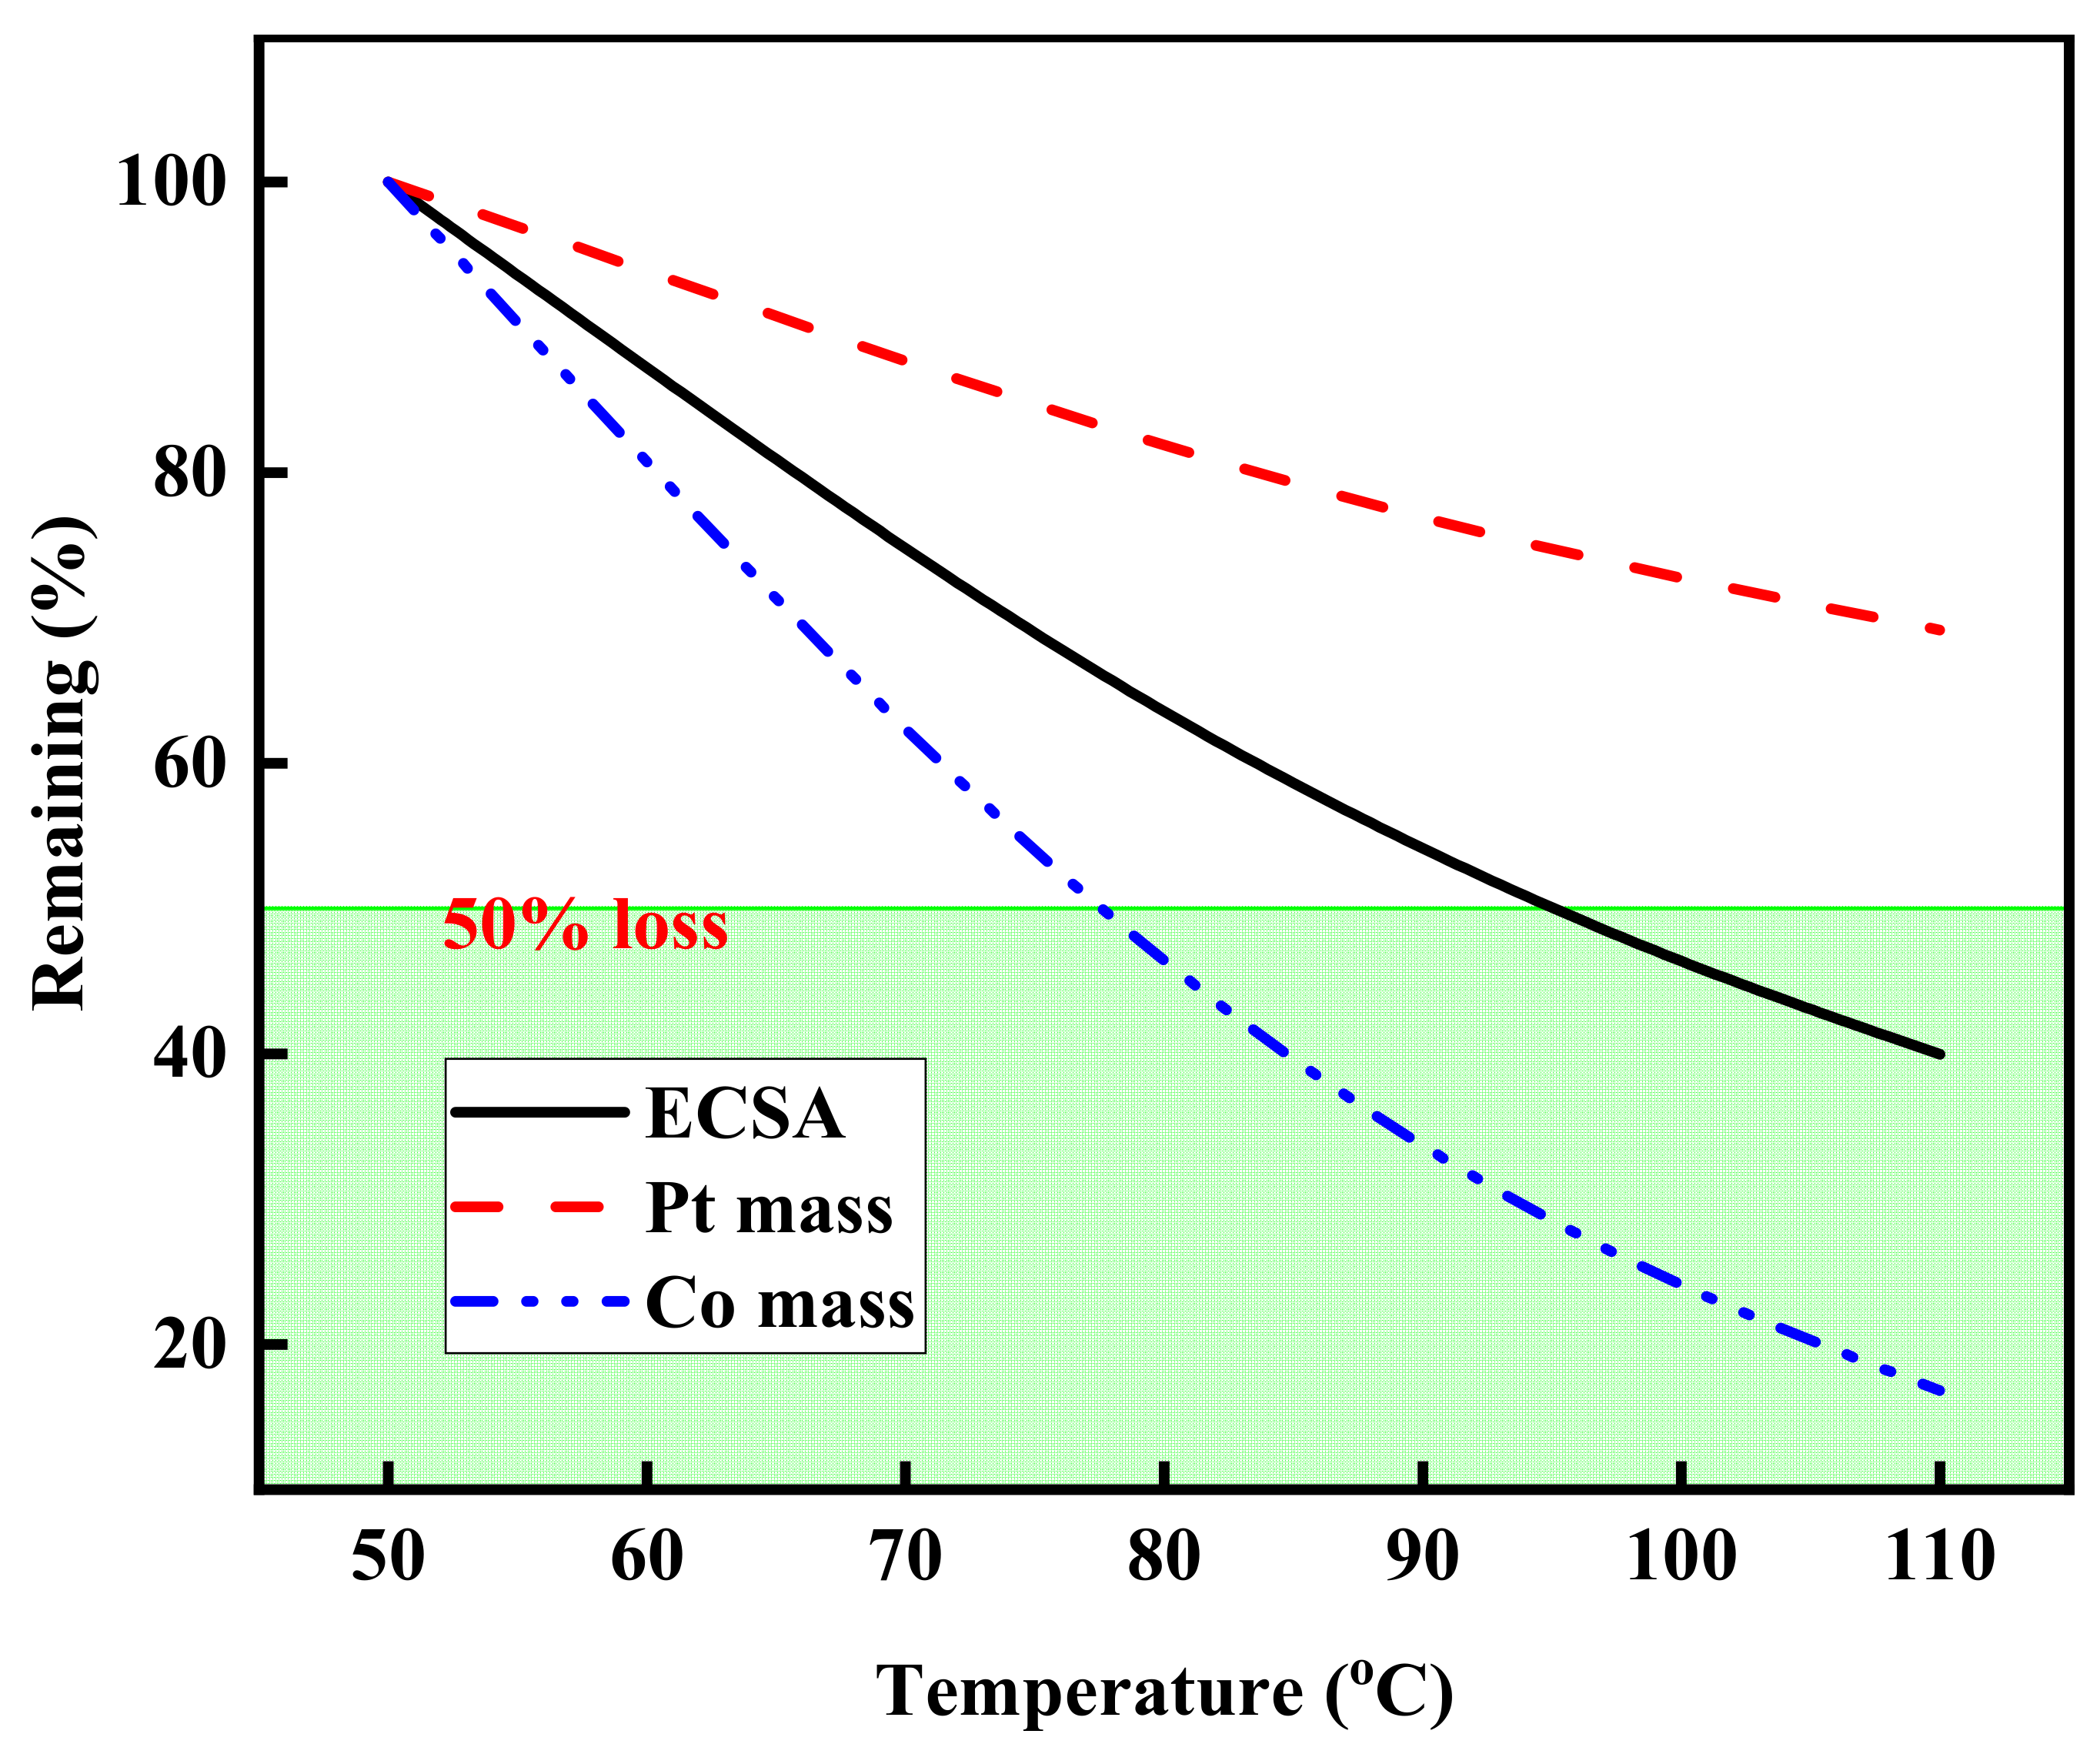
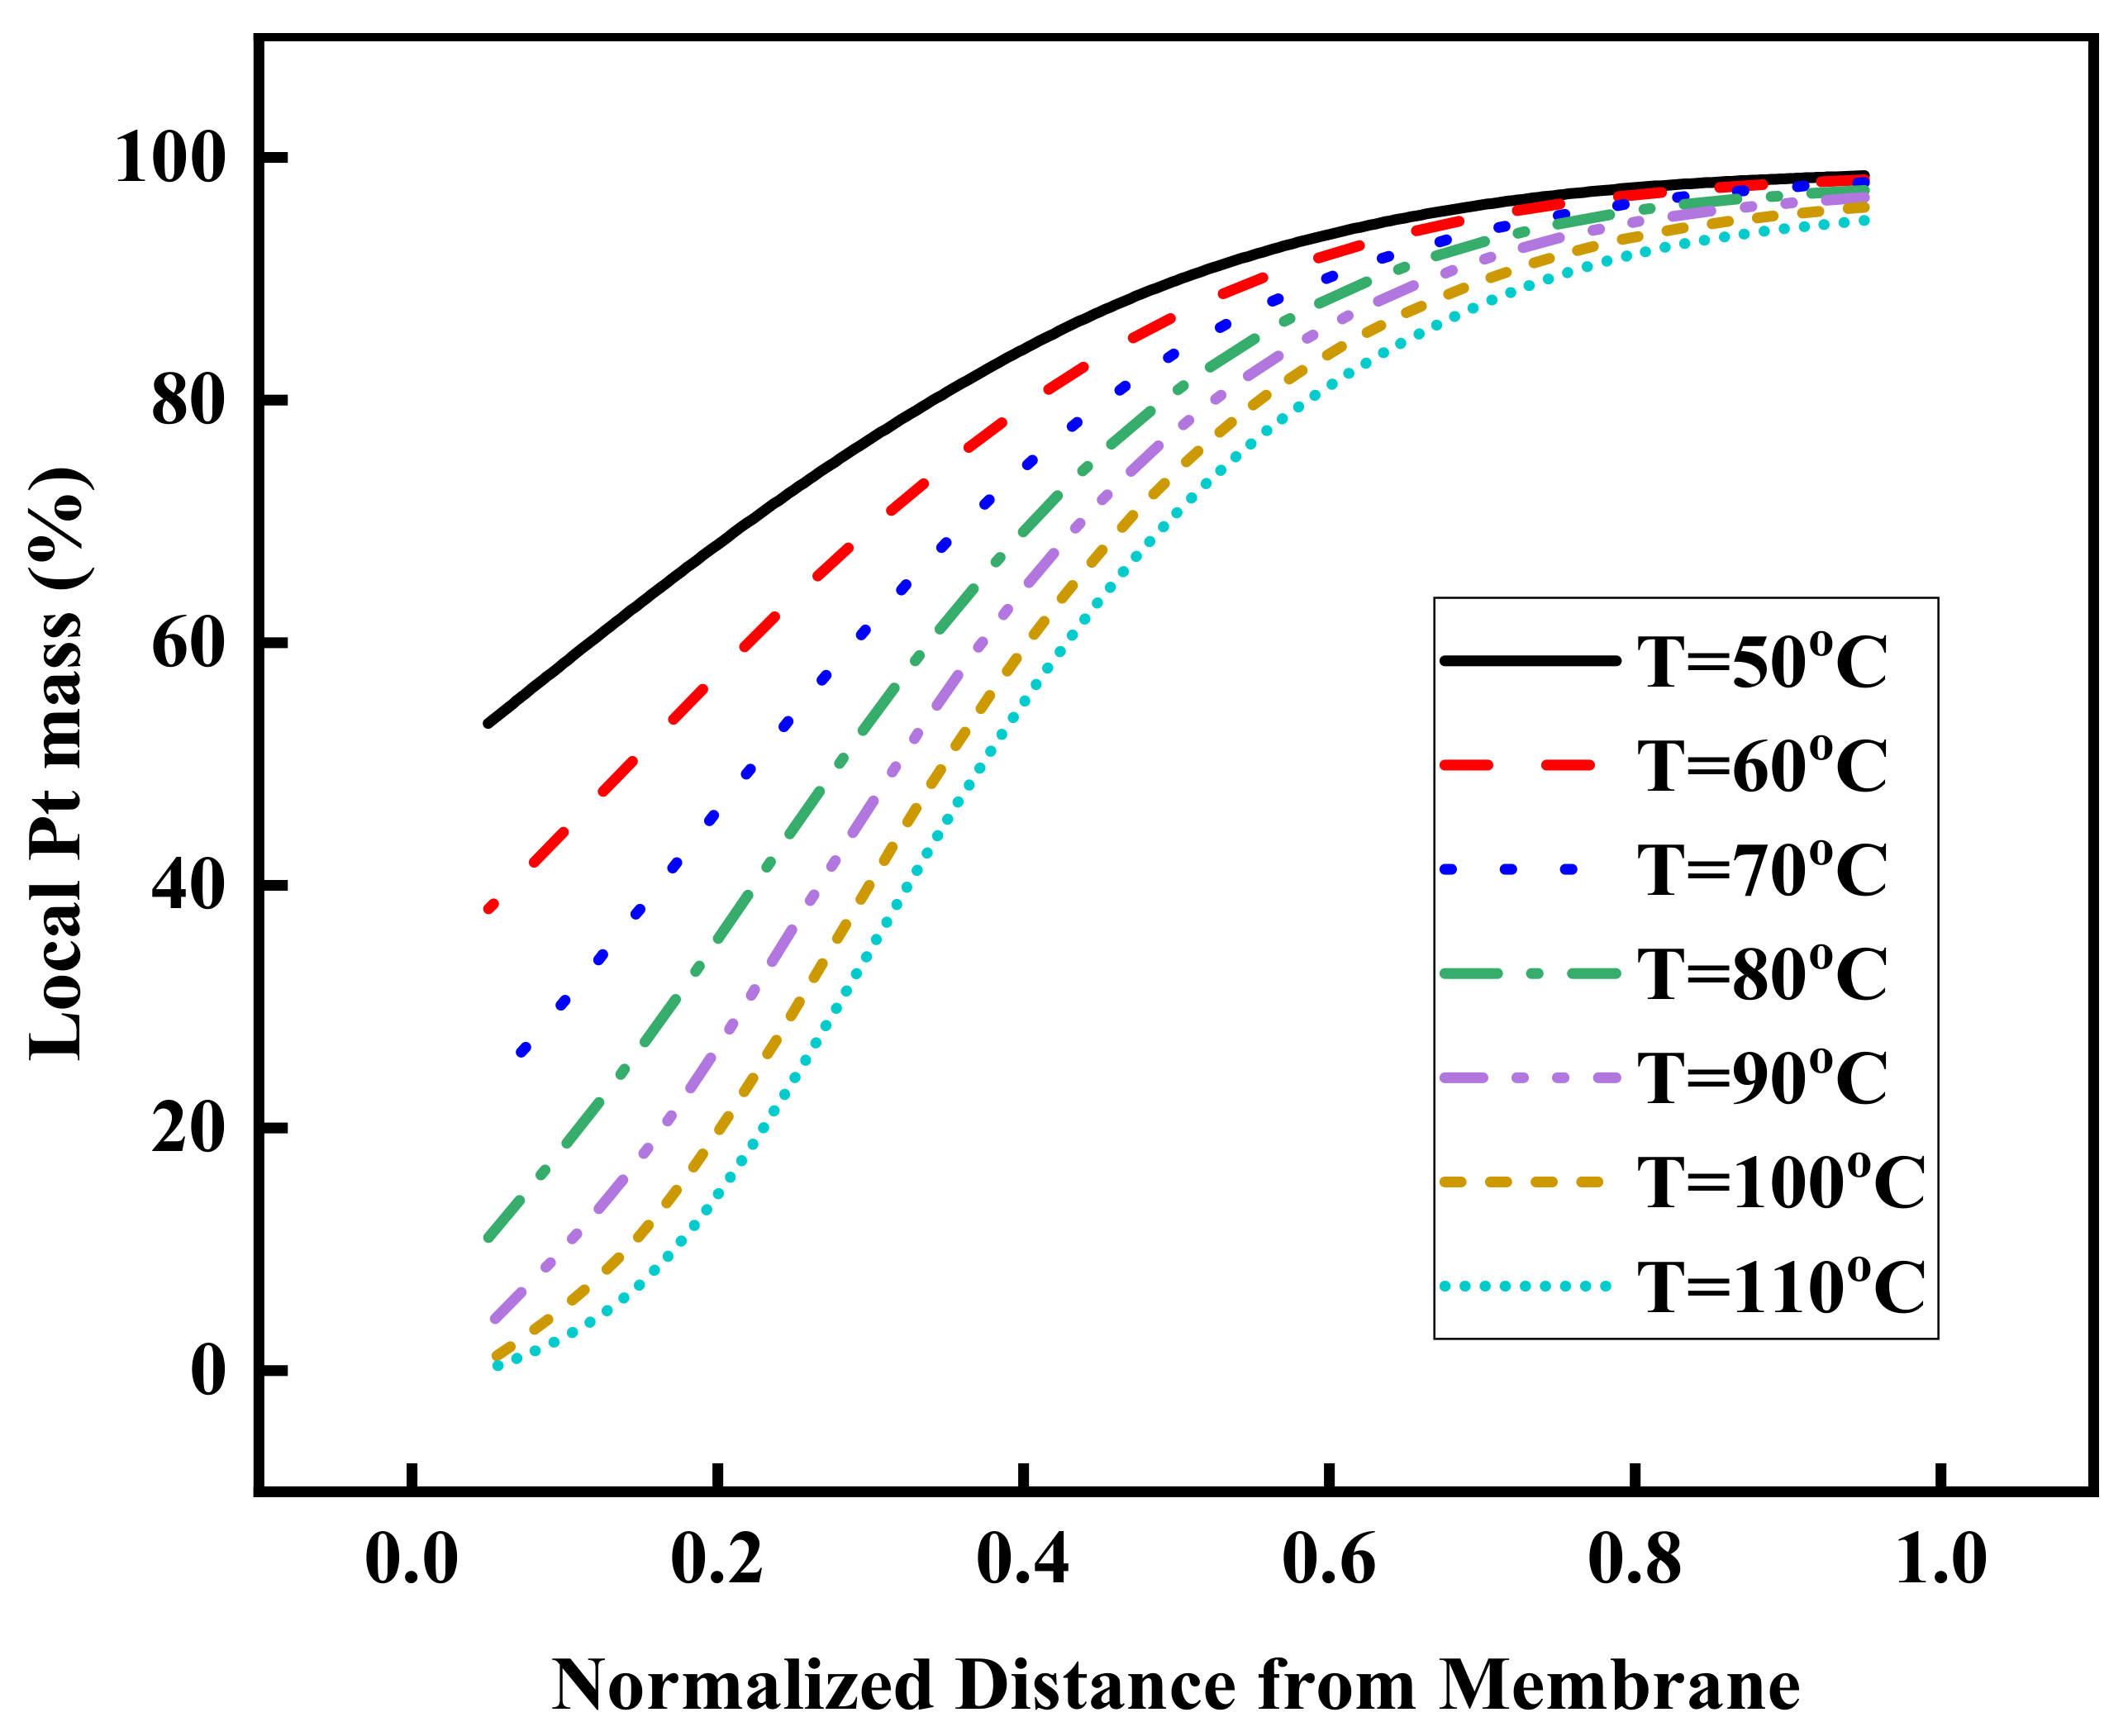
3.4. Effect of Operating Temperature

To further understand the effect of the operating temperature of PEMFC on the aging of Pt-Co alloy catalyst within CCL, the initial PSD of the catalyst was chosen to be normally distributed, with Dm = 4.0 nm and σ2 = 1.5 nm2, the Pt loading was 0.25 mg/cm2, and ni,j = 4.7 at the initial moment; only the temperature was variable whilst the other parameters remained unchanged. In addition, the corrosion of the carbon supports caused by high temperature was neglected. The size evolution of the particles was tracked under a triangular waveform voltage cycle of 0.65–1.05 V vs. RHE, 100 mV/s, 50–110 °C, H2|N2 (anode|cathode), and 100% RH, to understand the influence of temperature on the evolution and performance of Pt-Co alloy catalyst particles.
The operating temperature increases the rate of electrochemical reactions within the PEMFC, and as can be seen in Figure 10, the dissolution rate of the metals on the catalyst surface is significantly accelerated with temperature during the forward scanning voltage. Due to the concentration gradient, part of the Pt2+ generated in the Pt dissolution period will diffuse toward the CCL/membrane side, and temperature leads to an increase in the Pt2+ concentration, which promotes the diffusion of Pt2+ to the CCL/membrane side, resulting in more Pt mass loss. Moreover, a large amount of dissolved Co2+ cannot be reduced; so, as can be found in Figure 10a, with the increase in temperature, the increase in size of the particles with Di,j = 4 nm near the CCL/GDL interface during the reverse scanning voltage is gradually lower than the decrease in size during the forward scanning voltage. The results in Figure 10b illustrate that temperature causes a severe decay of the size of the particles near the CCL/membrane interface after a voltage cycle. Therefore, it can be deduced that the temperature causes more catalyst particles within the CCL to show a tendency to dissolve, which eventually leads to severe Pt loss, as analyzed next.
In order to further visualize the effect of the change in operating temperature on the Pt content in the catalyst at each location within the CCL, the results of the remaining Pt mass distribution within the CCL after 10,000 voltage cycles of the Pt-Co alloy catalyst at different temperatures are plotted in Figure 11. It is clear that the catalysts near the CCL/membrane interface are very sensitive to temperature. The Pt mass remaining at x/L = 0.05 and 0.95 are 53.34% and 98.48%, respectively, for T = 50 °C, and the Pt mass remaining at x/L = 0.05 and 0.95 are 0.74% and 95.86%, respectively, for T = 100 °C, which indicates that the catalyst is easily depleted near the CCL/membrane interface after the operating temperature reaches 100 °C, yet the influence of temperature change on the residuals of Pt mass on the carbon supports near the CCL/GDL interface is negligible. Therefore, high temperatures may accelerate the uneven distribution of catalysts in the direction of CCL thickness and severely degrade the catalytic performance and cut the lifetime of the CCL.
ECSA, Pt, and Co of the catalysts at T = 50 °C were used as the reference results, and the results of ECSA, Pt, and Co at different temperatures and after 10,000 voltage cycles were normalized as follows to facilitate a visual comparison of the sensitivity of the residuals of ECSA, Pt, and Co in the catalysts to the operating temperature, and these results are presented in Figure 12:
P A R = P A R T P A R T = 50 o C × 100 %
It is obvious from Figure 12 that the remaining ECSA, Pt, and Co mass of the catalysts show an almost linear variation with temperature when T < 80 °C, and these three parameters decrease by 1.26%, 0.61%, and 1.88%, respectively, per 1 °C increase in temperature. The effect of temperature on these three parameters diminished after T > 80 °C, at which time the remaining ECSA, Pt, and Co mass of the catalysts decreased by 0.70%, 0.38%, and 0.82%, respectively, per 1 °C increase in temperature. Similar to UPL, changes in operating temperature have the most serious effect on Co mass loss; so, the operating temperature must be strictly controlled when using these Pt-Co alloy nanoparticles as catalysts for PEMFC cathodes, to avoid severe shortening of the PEMFC service life due to high temperature; otherwise, this damage may be worth more than the cost.

4. Conclusions

In this study, a 1-D aging model of a Pt-Co alloy catalyst in the CCL is presented and validated. The ECSA loss, particle size change, and residuals of each metal on the carbon supports were investigated for a PEMFC under a voltage cycle, and the degradation of the catalyst was further investigated at different UPLs and PEMFC operating temperatures. The results show that the non-uniform distribution of Pt2+ along the thickness direction of the CCL leads to a different evolution of the catalyst at each location within the CCL, and the significant dissolution of the nanoparticles close to the CCL/membrane exacerbates the degradation of the catalysts here, thus leading to non-uniform aging of the catalyst along the thickness direction of the CCL; it also was found that the remaining content of ECSA as well as each metal in the catalyst gradually decreases during the voltage cycle. The rise in UPL increases the dissolution and coarsening reaction rate of the particles, which eventually intensifies the aging of the catalyst. When UPL < 0.95 V, it does not affect the catalyst significantly, while after UPL > 0.95 V, even a slight jitter in UPL may cause great harm to the performance and service life of the catalyst in the CCL. In addition, the rise in temperature exacerbates the Pt loss from the carbon support close to the CCL/membrane side, but has minimal effect on the Pt content close to the CCL/GDL side. The ECSA as well as the Pt and Co mass loss of the catalysts were found to show an almost linear variation with temperature, with the remaining amount of Co being the most sensitive to temperature. It is worth mentioning that, as predicted by the model, there is a large amount of Co mass loss in the catalyst, and the presence of these Co in the form of Co2+ may seriously affect the performance of PEMFCs, which is an essential topic for future study.

Author Contributions

Methodology, Y.L. (Yubai Li) and L.S.; software, L.G.; validation, Y.L. (Yang Li); resources, Y.L. (Yubai Li); data curation, Y.Y.; writing—original draft preparation, Y.Y.; writing—review and editing, J.L. and C.H.; supervision, M.B.; project administration, Y.S. All authors have read and agreed to the published version of the manuscript.

Funding

This work is supported by the National Natural Science Foundation of China (Grant No. 52106226, 51876027, 52176058) and the Fundamental Research Funds for the Central Universities, China (DUT20RC(3)095, DUT20JC21).

Institutional Review Board Statement

Not applicable.

Informed Consent Statement

Not applicable.

Data Availability Statement

Not applicable.

Conflicts of Interest

The authors declare no conflict of interest.

References

  1. Sandbeck, D.J.S.; Secher, N.M.; Speck, F.D.; Sorensen, J.E.; Kibsgaard, J.; Chorkendorff, I.; Cherevko, S. Particle Size Effect on Platinum Dissolution: Considerations for Accelerated Stability Testing of Fuel Cell Catalysts. ACS Catal. 2020, 10, 6281–6290. [Google Scholar] [CrossRef]
  2. Paul, M.T.Y.; Gates, B.D. Mesoporous Platinum Prepared by Electrodeposition for Ultralow Loading Proton Exchange Membrane Fuel Cells. Sci. Rep. 2019, 9, 4161. [Google Scholar] [CrossRef] [PubMed]
  3. Proietti, E.; Jaouen, F.; Lefevre, M.; Larouche, N.; Tian, J.; Herranz, J.; Dodelet, J.P. Iron-based cathode catalyst with enhanced power density in polymer electrolyte membrane fuel cells. Nat. Commun. 2011, 2, 416. [Google Scholar] [CrossRef]
  4. Lee, W.J.; Bera, S.; Kim, C.M.; Koh, E.K.; Hong, W.P.; Oh, S.J.; Cho, E.; Kwon, S.H. Synthesis of highly dispersed Pt nanoparticles into carbon supports by fluidized bed reactor atomic layer deposition to boost PEMFC performance. Npg. Asia Mater. 2020, 12, 40. [Google Scholar] [CrossRef]
  5. Sun, Y.Y.; Polani, S.; Luo, F.; Ott, S.; Strasser, P.; Dionigi, F. Advancements in cathode catalyst and cathode layer design for proton exchange membrane fuel cells. Nat. Commun. 2021, 12, 5984. [Google Scholar] [CrossRef]
  6. Cullen, D.A.; Neyerlin, K.C.; Ahluwalia, R.K.; Mukundan, R.; More, K.L.; Borup, R.L.; Weber, A.Z.; Myers, D.J.; Kusoglu, A. New roads and challenges for fuel cells in heavy-duty transportation. Nat. Energy 2021, 6, 462–474. [Google Scholar] [CrossRef]
  7. Sun, C.; Zhang, H. Review of the Development of First-Generation Redox Flow Batteries: Iron-Chromium System. ChemSusChem 2022, 15, 1–15. [Google Scholar] [CrossRef]
  8. Jiao, K.; Xuan, J.; Du, Q.; Bao, Z.M.; Xie, B.A.; Wang, B.W.; Zhao, Y.; Fan, L.H.; Wang, H.Z.; Hou, Z.J.; et al. Designing the next generation of proton-exchange membrane fuel cells. Nature 2021, 595, 361–369. [Google Scholar] [CrossRef]
  9. Sun, C.; Negro, E.; Nale, A.; Pagot, G.; Vezzù, K.; Zawodzinski, T.A.; Meda, L.; Gambaro, C.; Di Noto, V. An efficient barrier toward vanadium crossover in redox flow batteries: The bilayer [Nafion/(WO3)x] hybrid inorganic-organic membrane. Electrochim. Acta 2021, 378, 138133. [Google Scholar] [CrossRef]
  10. Eslamibidgoli, M.J.; Huang, J.; Kadyk, T.; Malek, A.; Eikerling, M. How theory and simulation can drive fuel cell electrocatalysis. Nano Energy 2016, 29, 334–361. [Google Scholar] [CrossRef]
  11. Huang, J.; Eikerling, M. Modeling the oxygen reduction reaction at platinum-based catalysts: A brief review of recent developments. Curr. Opin. Electrochem. 2019, 13, 157–165. [Google Scholar] [CrossRef]
  12. Wang, X.X.; Swihart, M.T.; Wu, G. Achievements, challenges and perspectives on cathode catalysts in proton exchange membrane fuel cells for transportation. Nat. Catal. 2019, 2, 578–589. [Google Scholar] [CrossRef]
  13. Dai, S.; Hou, Y.S.; Onoue, M.; Zhang, S.Y.; Gao, W.P.; Yan, X.X.; Graham, G.W.; Wu, R.Q.; Pan, X.Q. Revealing Surface Elemental Composition and Dynamic Processes Involved in Facet-Dependent Oxidation of Pt3Co Nanoparticles via in Situ Transmission Electron Microscopy. Nano Lett. 2017, 17, 4683–4688. [Google Scholar] [CrossRef] [PubMed]
  14. Ferreira, P.J.; la O’, G.J.; Shao-Horn, Y.; Morgan, D.; Makharia, R.; Kocha, S.; Gasteiger, H.A. Instability of Pt/C electrocatalysts in proton exchange membrane fuel cells—A mechanistic investigation. J. Electrochem. Soc. 2005, 152, A2256–A2271. [Google Scholar] [CrossRef]
  15. Carlton, C.E.; Chen, S.; Ferreira, P.J.; Allard, L.F.; Shao-Horn, Y. Sub-Nanometer-Resolution Elemental Mapping of “Pt3Co” Nanoparticle Catalyst Degradation in Proton-Exchange Membrane Fuel Cells. J. Phys. Chem. Lett. 2012, 3, 161–166. [Google Scholar] [CrossRef]
  16. Chen, S.; Gasteiger, H.A.; Hayakawa, K.; Tada, T.; Shao-Horn, Y. Platinum-Alloy Cathode Catalyst Degradation in Proton Exchange Membrane Fuel Cells: Nanometer-Scale Compositional and Morphological Changes. J. Electrochem. Soc. 2010, 157, A82–A97. [Google Scholar] [CrossRef]
  17. Xin, H.L.; Mundy, J.A.; Liu, Z.Y.; Cabezas, R.; Hovden, R.; Kourkoutis, L.F.; Zhang, J.L.; Subramanian, N.P.; Makharia, R.; Wagner, F.T.; et al. Atomic-Resolution Spectroscopic Imaging of Ensembles of Nanocatalyst Particles Across the Life of a Fuel Cell. Nano Lett. 2012, 12, 490–497. [Google Scholar] [CrossRef]
  18. Yu, Y.; Xin, H.L.; Hovden, R.; Wang, D.; Rus, E.D.; Mundy, J.A.; Muller, D.A.; Abruna, H.D. Three-dimensional tracking and visualization of hundreds of Pt-Co fuel cell nanocatalysts during electrochemical aging. Nano Lett. 2012, 12, 4417–4423. [Google Scholar] [CrossRef]
  19. Hasché, F.; Oezaslan, M.; Strasser, P. Activity, Stability, and Degradation Mechanisms of Dealloyed PtCu3 and PtCo3 Nanoparticle Fuel Cell Catalysts. ChemCatChem 2011, 3, 1805–1813. [Google Scholar] [CrossRef]
  20. Mayrhofer, K.J.J.; Ashton, S.J.; Meier, J.C.; Wiberg, G.K.H.; Hanzlik, M.; Arenz, M. Non-destructive transmission electron microscopy study of catalyst degradation under electrochemical treatment. J. Power Sources 2008, 185, 734–739. [Google Scholar] [CrossRef]
  21. Mayrhofer, K.J.J.; Meier, J.C.; Ashton, S.J.; Wiberg, G.K.H.; Kraus, F.; Hanzlik, M.; Arenz, M. Fuel cell catalyst degradation on the nanoscale. Electrochem. Commun. 2008, 10, 1144–1147. [Google Scholar] [CrossRef]
  22. Yasuda, K.; Taniguchi, A.; Akita, T.; Ioroi, T.; Siroma, Z. Platinum dissolution and deposition in the polymer electrolyte membrane of a PEM fuel cell as studied by potential cycling. Phys. Chem. Chem. Phys. 2006, 8, 746–752. [Google Scholar] [CrossRef]
  23. Zhang, H.; Haas, H.; Hu, J.; Kundu, S.; Davis, M.; Chuy, C. The Impact of Potential Cycling on PEMFC Durability. J. Electrochem. Soc. 2013, 160, F840–F847. [Google Scholar] [CrossRef]
  24. Darling, R.M.; Meyers, J.P. Kinetic model of platinum dissolution in PEMFCs. J. Electrochem. Soc. 2003, 150, A1523–A1527. [Google Scholar] [CrossRef]
  25. Darling, R.M.; Meyers, J.P. Mathematical model of platinum movement in PEM fuel cells. J. Electrochem. Soc. 2005, 152, A242–A247. [Google Scholar] [CrossRef]
  26. Franco, A.A.; Tembely, M. Transient multiscale modeling of aging mechanisms in a PEFC cathode. J. Electrochem. Soc. 2007, 154, B712–B723. [Google Scholar] [CrossRef]
  27. Franco, A.A.; Schott, P.; Jallut, C.; Maschke, B. A dynamic mechanistic model of an electrochemical interface. J. Electrochem. Soc. 2006, 153, A1053–A1061. [Google Scholar] [CrossRef]
  28. Bi, W.; Fuller, T.F. Modeling of PEM fuel cell Pt/C catalyst degradation. J. Power Sources 2008, 178, 188–196. [Google Scholar] [CrossRef]
  29. Holby, E.F.; Sheng, W.; Shao-Horn, Y.; Morgan, D. Pt nanoparticle stability in PEM fuel cells: Influence of particle size distribution and crossover hydrogen. Energy Environ. Sci. 2009, 2, 865–871. [Google Scholar] [CrossRef]
  30. Holby, E.F.; Morgan, D. Application of Pt Nanoparticle Dissolution and Oxidation Modeling to Understanding Degradation in PEM Fuel Cells. J. Electrochem. Soc. 2012, 159, B578–B591. [Google Scholar] [CrossRef]
  31. Li, Y.; Moriyama, K.; Gu, W.; Arisetty, S.; Wang, C.Y. A One-Dimensional Pt Degradation Model for Polymer Electrolyte Fuel Cells. J. Electrochem. Soc. 2015, 162, F834–F842. [Google Scholar] [CrossRef]
  32. Zheng, Z.F.; Yang, F.; Lin, C.; Zhu, F.J.; Shen, S.Y.; Wei, G.H.; Zhang, J.L. Design of gradient cathode catalyst layer (CCL) structure for mitigating Pt degradation in proton exchange membrane fuel cells (PEMFCs) using mathematical method. J. Power Sources 2020, 451, 227729. [Google Scholar] [CrossRef]
  33. Zheng, Z.; Luo, L.; Zhu, F.; Cheng, X.; Yang, F.; Shen, S.; Wei, G.; Zhang, J. Degradation of core-shell Pt3Co catalysts in proton exchange membrane fuel cells (PEMFCs) studied by mathematical modeling. Electrochim. Acta 2019, 323, 134751. [Google Scholar] [CrossRef]
  34. Wang, X.P.; Kumar, R.; Myers, D.J. Effect of voltage on platinum dissolution relevance to polymer electrolyte fuel cells. Electrochem. Solid State Lett. 2006, 9, A225–A227. [Google Scholar] [CrossRef]
  35. Dukic, T.; Moriau, L.J.; Pavko, L.; Kostelec, M.; Prokop, M.; Ruiz-Zepeda, F.; Sala, M.; Drazic, G.; Gatalo, M.; Hodnik, N. Understanding the Crucial Significance of the Temperature and Potential Window on the Stability of Carbon Supported Pt-Alloy Nanoparticles as Oxygen Reduction Reaction Electrocatalysts. ACS Catal. 2022, 12, 101–115. [Google Scholar] [CrossRef]
  36. Yoshida, T.; Kojima, K. Toyota MIRAI fuel cell vehicle and progress toward a future hydrogen society. Electrochem. Soc. Interface 2015, 24, 45–49. [Google Scholar] [CrossRef]
  37. Lochner, T.; Kluge, R.M.; Fichtner, J.; El-Sayed, H.A.; Garlyyev, B.; Bandarenka, A.S. Temperature Effects in Polymer Electrolyte Membrane Fuel Cells. ChemElectroChem 2020, 7, 3545–3568. [Google Scholar] [CrossRef]
  38. Ahluwalia, R.K.; Arisetty, S.; Peng, J.-K.; Subbaraman, R.; Wang, X.; Kariuki, N.; Myers, D.J.; Mukundan, R.; Borup, R.; Polevaya, O. Dynamics of Particle Growth and Electrochemical Surface Area Loss due to Platinum Dissolution. J. Electrochem. Soc. 2014, 161, F291–F304. [Google Scholar] [CrossRef]
  39. Dubau, L.; Maillard, F. Unveiling the crucial role of temperature on the stability of oxygen reduction reaction electrocatalysts. Electrochem. Commun. 2016, 63, 65–69. [Google Scholar] [CrossRef]
  40. Gatalo, M.; Jovanovic, P.; Petek, U.; Sala, M.; Selih, V.S.; Ruiz-Zepeda, F.; Bele, M.; Hodnik, N.; Gaberscek, M. Comparison of Pt-Cu/C with Benchmark Pt-Co/C: Metal Dissolution and Their Surface Interactions. ACS Appl. Energy Mater. 2019, 2, 3131–3141. [Google Scholar] [CrossRef] [Green Version]
  41. Moriau, L.J.; Hrnjic, A.; Pavlisic, A.; Kamsek, A.R.; Petek, U.; Ruiz-Zepeda, F.; Sala, M.; Pavko, L.; Selih, V.S.; Bele, M.; et al. Resolving the nanoparticles’ structure-property relationships at the atomic level: A study of Pt-based electrocatalysts. IScience 2021, 24, 102102. [Google Scholar] [CrossRef] [PubMed]
  42. Singh, K.; Tetteh, E.B.; Lee, H.Y.; Kang, T.H.; Yu, J.S. Tailor-Made Pt Catalysts with Improved Oxygen Reduction Reaction Stability/Durability. ACS Catal. 2019, 9, 8622–8645. [Google Scholar] [CrossRef]
  43. Wang, C.; Spendelow, J.S. Recent developments in Pt–Co catalysts for proton-exchange membrane fuel cells. Curr. Opin. Electrochem. 2021, 28, 100715. [Google Scholar] [CrossRef]
  44. Colón-Mercado, H.R.; Popov, B.N. Stability of platinum based alloy cathode catalysts in PEM fuel cells. J. Power Sources 2006, 155, 253–263. [Google Scholar] [CrossRef]
  45. Han, A.; Fu, C.; Yan, X.; Chen, J.; Cheng, X.; Ke, C.; Hou, J.; Shen, S.; Zhang, J. Effect of cobalt ion contamination on proton conduction of ultrathin Nafion film. Int. J. Hydrogen Energy 2020, 45, 25276–25285. [Google Scholar] [CrossRef]
  46. Li, H.; Gazzarri, J.; Tsay, K.; Wu, S.H.; Wang, H.J.; Zhang, J.J.; Wessel, S.; Abouatallah, R.; Joos, N.; Schrooten, J. PEM fuel cell cathode contamination in the presence of cobalt ion (Co2+). Electrochim. Acta 2010, 55, 5823–5830. [Google Scholar] [CrossRef]
  47. Braaten, J.P.; Xu, X.M.; Cai, Y.; Kongkanand, A.; Litster, S. Contaminant Cation Effect on Oxygen Transport through the Ionomers of Polymer Electrolyte Membrane Fuel Cells. J. Electrochem. Soc. 2019, 166, F1337–F1343. [Google Scholar] [CrossRef]
  48. Papadias, D.D.; Ahluwalia, R.K.; Kariuki, N.; Myers, D.; More, K.L.; Cullen, D.A.; Sneed, B.T.; Neyerlin, K.C.; Mukundan, R.; Borup, R.L. Durability of Pt-Co Alloy Polymer Electrolyte Fuel Cell Cathode Catalysts under Accelerated Stress Tests. J. Electrochem. Soc. 2018, 165, F3166–F3177. [Google Scholar] [CrossRef]
  49. Wang, Y.; Seo, B.; Wang, B.; Zamel, N.; Jiao, K.; Adroher, X.C. Fundamentals, materials, and machine learning of polymer electrolyte membrane fuel cell technology. Energy AI 2020, 1, 100014. [Google Scholar] [CrossRef]
  50. Tang, L.; Han, B.; Persson, K.; Friesen, C.; He, T.; Sieradzki, K.; Ceder, G. Electrochemical Stability of Nanometer-Scale Pt Particles in Acidic Environments. J. Am. Chem. Soc. 2010, 132, 596–600. [Google Scholar] [CrossRef]
  51. Uchimura, M.; Sugawara, S.; Suzuki, Y.; Zhang, J.B.; Kocha, S.S. Electrocatalyst Durability under Simulated Automotive Drive Cycles. ECS Trans. 2008, 16, 225–234. [Google Scholar] [CrossRef]
  52. Yang, Y.J.; Bai, M.L.; Lv, J.Z.; Gao, L.S.; Li, Y.; Lv, X.C.; Li, Y.B.; Song, Y.C. One-Dimensional Modeling for Aging of Pt-Co Core-Shell Catalysts in Proton Exchange Membrane Fuel Cells. J. Electrochem. Soc. 2022, 169, 054526. [Google Scholar] [CrossRef]
  53. Oezaslan, M.; Hasché, F.; Strasser, P. Pt-Based Core–Shell Catalyst Architectures for Oxygen Fuel Cell Electrodes. J. Phys. Chem. Lett. 2013, 4, 3273–3291. [Google Scholar] [CrossRef]
  54. Jomori, S.; Nonoyama, N.; Yoshida, T. Analysis and modeling of PEMFC degradation: Effect on oxygen transport. J. Power Sources 2012, 215, 18–27. [Google Scholar] [CrossRef]
Figure 1. Schematic diagram of the one-dimensional aging model of the Pt-Co alloy catalyst along the CCL thickness direction.
Sustainability 14 11462 g001
Figure 2. Comparison of the simulated and experimental results from Chen et al. [16] at 0.65–1.05 V vs. RHE, 100 mV/s, 80 °C, 100% RH, and H2|N2 (anode|cathode) after 10,000 voltage cycles: (a) the remaining Pt mass distribution and experimental and simulated Pt mass loss errors along the CCL thickness direction; (b) the ECSA distribution and experimental and simulated ECSA loss errors along the CCL thickness direction; (c) the PSD evolution results near the CCL/GDL interface.
Sustainability 14 11462 g002aSustainability 14 11462 g002b
Figure 3. Variation in voltage, Pt2+ concentration near the interface of the CCL/GDL and CCL/membrane, and PtO coverage on the surface of Di,j = 1.5 nm and 11.9 nm particles, with the time of the first voltage cycle.
Sustainability 14 11462 g003
Figure 4. Evolution of the amount of diameter change near the (a) CCL/GDL and (b) CCL/membrane interface under the first voltage cycle.
Sustainability 14 11462 g004
Figure 5. Evolution of Di,j = 4 nm, 5 nm, and 9 nm particles near the GDL/membrane and GDL/CCL interfaces during 10,000 voltage cycles.
Sustainability 14 11462 g005
Figure 6. (a) Distribution of ECSA of the Pt-Co catalyst under a voltage cycle; (b) effect of the voltage cycle on the remaining ECSA, Pt, and Co.
Sustainability 14 11462 g006
Figure 7. Evolution of the Di,j = 4 nm catalyst particles near the (a) GDL/CCL and (b) GDL/membrane interface at different UPLs under the first voltage cycle.
Sustainability 14 11462 g007aSustainability 14 11462 g007b
Figure 8. (a) Effect of different UPLs on the evolution of ECSA under a voltage cycle. (b) Effect of UPL on the ECSA distribution along the CCL thickness direction after 10,000 voltage cycles.
Sustainability 14 11462 g008
Figure 9. Effect of UPL on the remaining ECSA, Pt, and Co.
Sustainability 14 11462 g009
Figure 10. Effect of operating temperature on Di,j = 4 nm catalysts near the (a) CCL/GDL and (b) CCL/membrane interface during the first voltage cycle.
Sustainability 14 11462 g010aSustainability 14 11462 g010b
Figure 11. Distribution of the remaining Pt mass in the CCL after 10,000 voltage cycles at different operating temperatures.
Sustainability 14 11462 g011
Figure 12. Effect of operating temperature on the remaining ECSA, Pt, and Co in the catalysts after 10,000 voltage cycles.
Sustainability 14 11462 g012
Table 1. Parameters and physical properties.
SymbolValueUnitsDescription
v 1 * 1 × 104HzForward Pt oxide formation rate [30]
v 2 * 2 × 10−2HzBackward Pt oxide formation rate [30]
Γ 2.2 × 10⁻⁹mol/cm2Pt surface site density [30]
H ¯ 2 , f i t 1.2 × 10⁴J/molPartial molar oxide formation activation enthalpy (0 coverage) [30]
β 2 0.5(-)Butler–Volmer transfer coefficient for Pt oxide formation [30]
n2(-)Electrons transferred during Pt dissolution [30]
n 2 2(-)Electrons transferred during Pt oxide formation [30]
U f i t 1.03VPt oxide formation bulk equilibrium voltage [30]
λ 2.0 × 10⁴J/molPt oxide dependent kinetic barrier constant [30]
ω 5.0 × 10⁴J/molPt oxide-oxide interaction energy [30]
v 1 1 × 10⁴HzDissolution attempt frequency [30]
v 2 8 × 10⁵HzBackward dissolution rate factor [30]
β 1 0.5(-)Butler–Volmer transfer coefficient for Pt dissolution [30]
U e q 1.118VPt dissolution bulk equilibrium voltage [30]
ΩPt9.09cm3/molMolar volume of Pt [30]
ΩCo6.62cm3/molMolar volume of Co
γ 2.4 × 10⁻⁴J/cm2Pt [1 1 1] surface tension [30]
C P t 2 + r e f 4.0 × 10⁻³mol/LReference Pt2+ concentration
H ¯ 1 , f i t 4.1 × 10⁴J/molPt dissolution activation enthalpy under fully humidified condition
ε 0.2(-)Volume fraction of the ionomer increment in cathode electrode [14]
L5.0 × 10−4cmThickness of CCL [16]
ni, j4.7(-)Atomic ratio of Pt and Co in the catalyst (initial) [16]
DPt2+2 × 10⁻⁸cm2/sDiffusion coefficient of Pt2+ through ionomer
Publisher’s Note: MDPI stays neutral with regard to jurisdictional claims in published maps and institutional affiliations.

