Article

Three-Dimensional Simulation on the Effects of Different Parameters and Pt Loading on the Long-Term Performance of Proton Exchange Membrane Fuel Cells

1
Key Laboratory of Ocean Energy Utilization and Energy Conservation of Ministry of Education, Dalian University of Technology, Dalian 116023, China
2
Materials Science and Engineering Program & Texas Materials Institute, The University of Texas at Austin, Austin, TX 78712, USA
*
Authors to whom correspondence should be addressed.
Sustainability 2023, 15(4), 2902; https://doi.org/10.3390/su15042902
Submission received: 4 December 2022 / Revised: 27 January 2023 / Accepted: 2 February 2023 / Published: 6 February 2023
(This article belongs to the Special Issue Lithium Batteries and Fuel Cells for a Sustainable Future)

Abstract

:
The choice of platinum loading and the choice of the operating parameters of the cell are crucial in order to enhance a PEMFC’s endurance and, at the same time, to raise its performance. In this paper, a single-channel PEMFC counter-current model is developed to investigate the effects of a 0.3 mg/cm² Pt loading model and a 0.1 mg/cm² Pt loading model on the performance and durability of PEMFCs with different operating pressures, different cathode stoichiometry, and different channel and plate widths. It was found that increasing the PEMFC operating pressure and cathode stoichiometry would increase the cell performance and have some improvement for durability. Additionally, increasing the channel/plate width ratio would improve the cell performance while decreasing the cell durability.

1. Introduction

With today’s increasing depletion of fossil energy and environmental pollution problems, the demand for renewable energy is increasing [1]. The prolonged-term burning of large amounts of fossil energy produces large amounts of carbon dioxide (CO2) and other greenhouse gases, which can cause an energy crisis on the one hand, and accelerate the process of global warming on the other [2,3]. Therefore, researchers have been developing alternative energy sources to replace internal combustion engines to solve the energy problem [4]. Utilizing hydrogen, an ideal non-polluting fuel, will boost energy efficiency and decrease greenhouse gas emissions [5]. Polymer electrolyte membrane fuel cells (PEMFCs) have attracted considerable attention in the fields of automobiles, stationary power supplies, and portable power supplies due to their high efficiency, elevated power density, low operating temperature, and zero emissions [6,7,8]. In the past decade, PEMFCs have developed significantly in the automobile industry, with GM, Toyota, Hyundai, Volkswagen, and others producing their own fuel cell vehicles (FCV) [9]. PEMFC is considered the most likely power source to replace the internal combustion engine [10,11,12]. However, before this technology can be used commercially, there are still numerous challenges to be overcome, and PEMFC still has limitations in terms of performance, cost, longevity, and other areas [13,14]. In 2020, the U.S. Department of Energy (DOE) has set a PEMFC lifetime of 40,000 h for stationary power, 25,000 h for buses, and 5000 h for passenger cars, while the lifetime target for passenger cars is 8000 h [3,15]. Verhage et al. [16] designed a 70 kW PEMFC and reported measurements of PEMFC voltages for different types of membrane electrode assemblies, resulting in 3000 h of operation in 2013. An analysis by the Fuel Cell Technology Team (FCTT) noted that fuel cells reached a maximum life of 4100 h in 2016 [17]. At present, it remains a challenge for the PEMFC to reach 8000 h of service life.
A PEMFC as a stationary power source can reach 40,000 h of life, which is significantly higher than that of automotive fuel cells, because the fuel cell as a stationary power source is in steady-state conditions, while the life of automotive fuel cells is drastically reduced due to factors such as load changes, start-stop conditions, idling speed, and high-power operation [18,19]. In addition, water and thermal management also greatly affect the performance and durability of a PEMFC [20]. For example, water immersion in the anode will accelerate the occurrence of carbon corrosion, and water immersion in the cathode will lead to a decrease in a PEMFC’s current density and reduced performance [21,22]. Therefore, the issues of performance, lifetime, and cost of PEMFCs become critical in FCV.
The durability of the PEMFC has been studied extensively over the past few years. Mirzaei et al. [23] used a hydrothermal method to prepare highly dispersed Pt nanoparticles on multi-walled carbon nanotube catalysts for PEMFC durability experiments and performed accelerated durability tests with membrane electrode assemblies operating at high potentials in a fuel cell test station. In another study, Zhang et al. [24] examined the influence of the gas diffusion layer on the performance of PEMFCs, enhancing the thermal and electrical conductivities of the diffusion layer and determining the link between the gas flow rate and cell performance. Kong et al. [25] evaluated the effects of porosity and contact angle alignment and found that effective removal of extracted water in PEMFCs is crucial for cell performance. Ekiz et al. [26] also investigated the effect of setting different pressure values at the outlet, noting that injecting additional reactant at the cathode, as well as increasing the inlet velocity and outlet pressure, would increase cell performance.
A single PEMFC consists of a bipolar plate (BP), a membrane (MEM), two gas diffusion layers (GDL), two catalyst layers (CL), two microporous layers (MPL), and two flow channels [27,28]. The fuel cell works by pressurizing hydrogen gas into the anode flow channel, which reaches the anode CL via the anode GDL and the anode MPL. The hydrocarbon molecules are decomposed into protons and electrons by the anode catalyst, with the protons being transported through the membrane to the cathode side. The electrons are blocked by the membrane, and the external circuit reaches the cathode to generate a current [29]. At the same time, the cathode side passes oxygen or air into the cathode flow channel and reaches the cathode CL through the cathode GDL. At the active site of the cathode catalyst, protons and oxygen combine to produce water and heat. During the operation of a fuel cell, all components will age and decay to varying degrees, the performance of the battery will gradually decrease, and if any component fails, the operation of the battery will be terminated [30]. The core components of the PEMFC are the catalytic layer and the membrane electrode assembly. The catalytic layer is composed of catalyst, catalyst carrier, and Nafion polymer [31]. Nano-platinum placed on a highly specific area of carbon is commonly employed nowadays as a catalyst for PEMFCs [32]. However, carbon is not stable under the operating conditions of PEMFCs, and it undergoes electrochemical oxidation under conditions of accelerated potential and elevated temperature, which results in weakened Pt-carrier interactions and a loss of Pt-specific surface area, ultimately affecting the performance of PEMFCs [33].
The core component of the PEMFC is the proton exchange membrane, in which the cost of the platinum catalyst layer is as steep as 40% [34] of the total cost. In the current vehicle-mounted proton exchange membrane fuel cell, the total platinum loading is 0.25–0.5 mg/cm2, and the anode hydrogen oxidation reaction is relatively rapid. A 0.05 mg/cm² platinum catalyst can meet the demand, but the cathode redox reaction is slow. In order to meet the requirements, additional platinum catalysts are needed. A hot topic in the research of proton exchange membrane fuel cells is the attempt to reduce the load of platinum catalyst in the cathode catalytic layer and to study the low-platinum cathode catalytic layer [29].
Jia et al. [35] conducted a study of the performance impact of Pt loading reduction in PEMFCs. For the experimental results, the anode catalyst loading in a state-of-the-art membrane electrode assembly (MEA) operating under pure hydrogen conditions could be reduced to 0.05 mg/cm² without significant performance degradation. For the optimized MEA, reducing the cathode platinum loading to 0.2 mg/cm² caused a 10–20 mV loss in cell voltage. Furthermore, the working conditions of PEMFCs are critical to the device’s performance [36]. The Gibbs free energy of the reaction, the conductivity of the electrolyte membrane, and the gas diffusion rate are influenced by variables such as temperature, pressure, reactant stoichiometry ratio, and humidity, among others [37]. To get the operating conditions for maximum power, Kanani et al. [38] investigated a single serpentine PEMFC, taking into account the interaction and secondary impacts of various operating conditions, and estimated the maximum or minimum power generation over the whole range of parameters.
Studying these parameters is particularly crucial to understanding the performance of a PEMFC under a set of operational parameters. The potential difference caused by different operating parameters can be analyzed from the polarization curve [39]. The durability design goal of the PEMFC is to be able to maintain the FCV’s service life. Generally, FCVs use 10–20% performance degradation as the standard for fuel cell service life to expire [40]. It can be seen that studying the aging performance design of the PEMFC is of great interest. For low-platinum catalytic layers, the catalytic region degrades due to the aging of the catalyst and the simultaneous corrosion of the carbon substrate on the effective catalytic region due to the large intra-tidal micro-oxygen resistance. However, the reduction of the catalytic area will cause greater micro-oxygen resistance, thereby increasing the polarization loss of oxygen mass transfer and resulting in a rapid decline in the performance of the catalytic layer [41].
Therefore, it is necessary to model and investigate the performance of PEMFCs. PEMFC-related research mainly consists of model simulations and experimental tests, but experimental results and measurements of relevant quantities in electrochemical reaction processes require high-end experimental equipment and are therefore expensive. Currently, there is no efficient and feasible method to obtain the internal PEMFC accurately during operation. To systematically study the durability and performance of PEMFCs, modeling and simulation of PEMFCs are required. The 3D simulations of the PEMFC not only yield macroscopic results such as output voltage and current density under different operating conditions, but also the distribution of water and gas in the PEMFC. The primary focus of the modeling work presented in this paper is the investigation of modeling and simulation on a single-stream channel PEMFC. The objective of this paper is to study and investigate the effect of operating pressure, cathode oxygen stoichiometry, and cathode plate-to-channel width ratio on the performance and endurance of the PEMFC at different platinum loads.

2. Numerical Model

The PEMFC model used in this paper is based on CFD techniques, through the CFD software ANSYS FLUENT, which has a built-in PEMFC module, and runs the PEMFC module to perform numerical simulations under different conditions. The PEMFC simulation is generally performed in three steps. The first step is the modeling of each PEMFC component by the 3D modeling software SPACECLAIM from ANSYS. For example, listing GDL, CL, and MPL for cathode and anode, as well as flow channels and membrane components, and naming each component. The geometric dimensions of the components are given in Table 1. For computational convenience, the model adopts a symmetric distribution as shown in Figure 1. The second step is to mesh the model using the MESH meshing software in ANSYS to generate a high-quality mesh. The accuracy of the model strongly depends on mesh refinement. The third step is to define boundary conditions for the astrophysical and operational parameters of the PEMFC.

2.1. Model Assumptions [42,43]

  • The cell operating conditions are at steady state.
  • The inlet gas is an incompressible ideal gas.
  • Flow is incompressible and laminar in PEMFCs.
  • Isotropic media include porous layers such as GDL, MPL, and CL.
  • The thermophysical characteristics and operating temperature of the cell are both constant.

2.2. Control Equations

PEMFC simulations in ANSYS FLUENT require the division of the PEMFC into different computational domains. In the different computational domains, it is necessary to solve the conservation equations for mass, momentum, gas-phase matter, matter transport, and temperature. The PEMFC domains included are BP, GDL, MPL, CL, MEM, and flow channels. In this paper, since we are discussing the PEMFC steady-state model, we do not need to consider the transient phase in the equation. First is the mass conservation equation [44]:
( ρ g u g ) = S m ,
where S m is the mass source term. Conservation of momentum equation:
[ ρ g u g u g ε 2 ] = P g + τ + S u ,
where S u is the momentum source term and ε is the porosity.
Energy conservation equation [45]:
[ ρ g C p , g u g T ] = ( k eff T ) + S T ,
where C p is the heat capacity and k eff is the effective thermal conductivity.
Gas species (CHs, GDLs, MPLs, and CLs):
( ρ g u g C i , g ) = ( ρ g D i , g e f f C i , g ) + S i , g ,
where D i , g e f f and C i , g represent the effective gas diffusion coefficient and the molar concentration of the gas, respectively. The gas components in this model include H2, O2, and H2O.
Electron transport equation:
0 = ( σ e f f Φ s ) + S Φ s ,
where σ e f f is the effective conductivity and Φ s is the potential.
Proton transport equation:
0 = ( κ e f f Φ e ) + S Φ e ,
where κ e f f is the effective electrolyte conductivity and Φ e is the electrolyte phase.
Dissolved water transport equation:
0 = ( D W λ ) ( n d F i e ) + S W ,
where D W is the water diffusion coefficient, λ is the water content, n d is the electro-osmotic resistance coefficient, and i e is the electrolyte phase current density. This equation is used to solve the law of dissolved water transport between MEM and CL.
Capillary pressure:
0 = ( ρ l K l μ l p c ) + S p c ,
where ρ l is the liquid density, K l is the liquid permeability, μ l is the liquid dynamic viscosity, and p c is the capillary pressure. It is essential to note that this equation only applies to GDL, MPL, and CL. Due to variations in the interface structure of porous electrodes, the porosity varies from porous interface to porous interface, resulting in a discontinuity in the liquid phase saturation at the interface. Furthermore, the capillary pressure at the porous electrode drives the liquid water, and resolving this equation makes the capillary pressure continuous in the porous electrode [46,47].
P c = P g P l ,
P c = k e cos θ ( ε K ) 0.5 J ( s ) ,
J ( s ) = { 1.42 ( 1 s ) 2.12 ( 1 s ) 2 + 1.26 ( 1 s ) 3 ,   θ < 90 1.42 s 2.12 s 2 + 1.26 s 3 ,   θ > 90 ,
where θ is the contact angle, ε is the porosity, and K is the liquid permeability.
Liquid saturation:
( μ g K l μ l K g ρ l u g ) = ( K l μ l d p c d s ρ l s ) + S l ,
where K g is the gas permeability and s is the liquid saturation. The liquid saturation equation is solved only at the flow path.
Temperature equation:
( ρ g C p u g T ) = ( k e f f T ) + S T ,
where C p is the heat capacity and k e f f is the effective thermal conductivity.
The following equation describes the equilibrium water content as a function of water activity:
a = C H 2 O , g R u T p sat ,
λ e q = { 0.3 + 6 a [ 1 tanh ( a 0.5 ) ] + 3.9 a [ 1 + tanh ( a 0.89 0.23 ) ] , i f   s = 0 16.8 s + λ | a = 1 ( 1 s ) ,   if   s > 0 ,
species transport equation:
( ε c i ) t + ( ε u c i ) = ( D i e f f c i ) + S i ,
where S i is the substance source term and D i e f f represents the diffusion coefficient of i in the mixture [48].
Calculating the reactant oxidation and reduction rates occurring at the catalyst surface allows for electrochemical simulations. According to the Tafel streamlined Butler-Volmer equation for the transfer current density, the source term and transfer current are defined in the equation [49]:
ACL : j = a i 0 , a r e f e x p [ E a R u T ( 1 T T a r e f ) ] ( C H 2 C H 2 , r e f ) γ a e x p ( α a R u T F η ) ,
CCL : j = a i 0 , c r e f e x p [ E c R u T ( 1 T T c r e f ) ] ( C O 2 C O 2 , r e f ) γ c e x p ( α c R u T F η ) ,
where η denotes the overpotential in CL:
η = Φ s Φ e U o ,
The O2 transport controls the concentration polarization, and the cathodic O2 generates a local transport resistance on the surface of the Pt particle that controls the PEMFC’s limiting current density and mass transfer losses. Thus, the following equation provides the cathodic current density:
j ˜ = 4 F C O 2 ( 1 4 F C O 2 j + R i o n + R l ) ,
where R i o n is the ionomer film resistance and   R l is the resistance generated by the liquid water film surrounding the particle:
R l = a c a t r p 2 K O 2 D O 2 1 + S ε 1 ε 3 1 3 ( 1 ε ) ,
where K O 2 and D O 2 are the solubility and diffusion coefficient of O2 in liquid water, respectively, and r p is the particle radius. R i o n is the main parameter that is changed in the simulation and can be defined by the user to verify the simulation results.

2.3. Boundary Conditions

2.3.1. Inlet Flow Channel

The velocity of the inlet channel is obtained from the stoichiometric equation [50].
ξ a = C H 2 a u i n , a A a I r e f A 2 F ,
ξ c = C O 2 c u i n , c A c I r e f A 4 F ,
where A a and A c are the cross-sectional areas of the anode and cathode gas flow paths. u i n , a and u i n , c are the inlet velocities of the anode and cathode gas flow paths. The inlet velocities are affected by temperature, reactant mass fraction, and humidity conditions. C H 2 a and C O 2 c are the inlet H2 concentration and the inlet O2 concentration.

2.3.2. Outlet Flow Channel

The outlet pressure is the PEMFC working pressure.

2.3.3. Wall

In this model, the anode and cathode bipolar walls are used as symmetry boundaries. All walls in contact with the environment are adiabatic boundary conditions. The cathode lower boundary is set to a constant potential. At the upper anode boundary of the cell, the voltage is set to zero. Table 2 lists some of the most important parameters necessary for the PEMFC modeling [51].

2.4. Pt Degradation Model

Physical Pt degradation and one-dimensional mathematical modeling of the electrochemical reactions of Pt nanoparticle oxidation and dissolution form the basis of the present model. A specific number of discrete particle size groups are assigned to each control volume i . Considering the Pt nanoparticle diameter and Pt oxide coverage for each particle size group, j denotes the number of discrete particle size groups.
d ( d i , j ) d t = r n e t , P t Ω ,
d ( θ i , j ) d t = r net , oxide Γ 2 θ i , j d i , j d ( d i , j ) d t ,
where Ω is the molar volume of Pt, r n e t , o x i d e specific active surface area is expressed as the net oxidation rate of Pt particles, and r n e t , P t is expressed as the net dissolution rate of Pt, expressed by the following equation [52]:
r net ,   oxide   = v 1 * Γ e x p [ 1 R T ( H ¯ 2 , f i t + λ θ i , j ) ] × ( 1 θ i , j 2 ) e x p [ n 2 F ( 1 β 2 ) R T ( U f i t + ω θ i , j n 2 F V ) ] v 2 * v 1 * ( 10 2 p H ) e x p [ n 2 F β 2 R T ( U f i t + ω θ i , j n 2 F V ) ] ,
r n e t ,   P t = v 1 Γ e x p [ H ¯ 1 , f i t R T ] ( 1 m i n ( 1 , θ i , j ) ) × ( e x p [ n F ( 1 β 1 ) R T ( U e q 4 Ω γ total d i , j 2 F Δ Φ ) ] v 2 v 1 c P p 2 + c P t 2 + c t 2 + e x p [ n F β 1 R T ( U e q 4 Ω γ total d i , j n F Δ Φ ) ] ) ,
where the total surface tension γ total [J/cm2] can be expressed as:
γ total   = γ + Γ θ i , j R T × [ log ( v 2 * v 1 * ) + log ( 10 2 p H ) + n 2 F R T ( U f i t V ) + ω θ i , j 2 R T + log ( θ i , j 2 ) + 2 θ i , j θ i , j log ( 1 θ i , j 2 ) ] ,
where Δ Φ is the local difference in the electron potential. c P p 2 + is solved by the one-dimensional Pt ion diffusion equation for each time step of the transient Pt degradation model [53]. By monitoring the change in d i , j for each particle size group, it is possible to determine the electrochemically active surface area (ECA) for each computational node in the cathode catalyst layer (CCL) at each stage of the degradation process.

2.5. Current Cycle Model

The Pt degradation model provides the ECA for each time step required for the study, and the study model records one polarization curve at 3000 current cycles for a total current period of 15,000. Prior to this, initial steady-state PEMFC simulations were performed with the cell voltage increasing from 0.55–1 V in steps of 0.05 V to obtain a complete polarization curve to characterize the performance of the PEMFC. After every 3000 cycles of current, the value of ECA in CCL is recorded, and the steady-state PEMFC simulation is done with the same settings to generate the degraded PEMFC polarization curve.

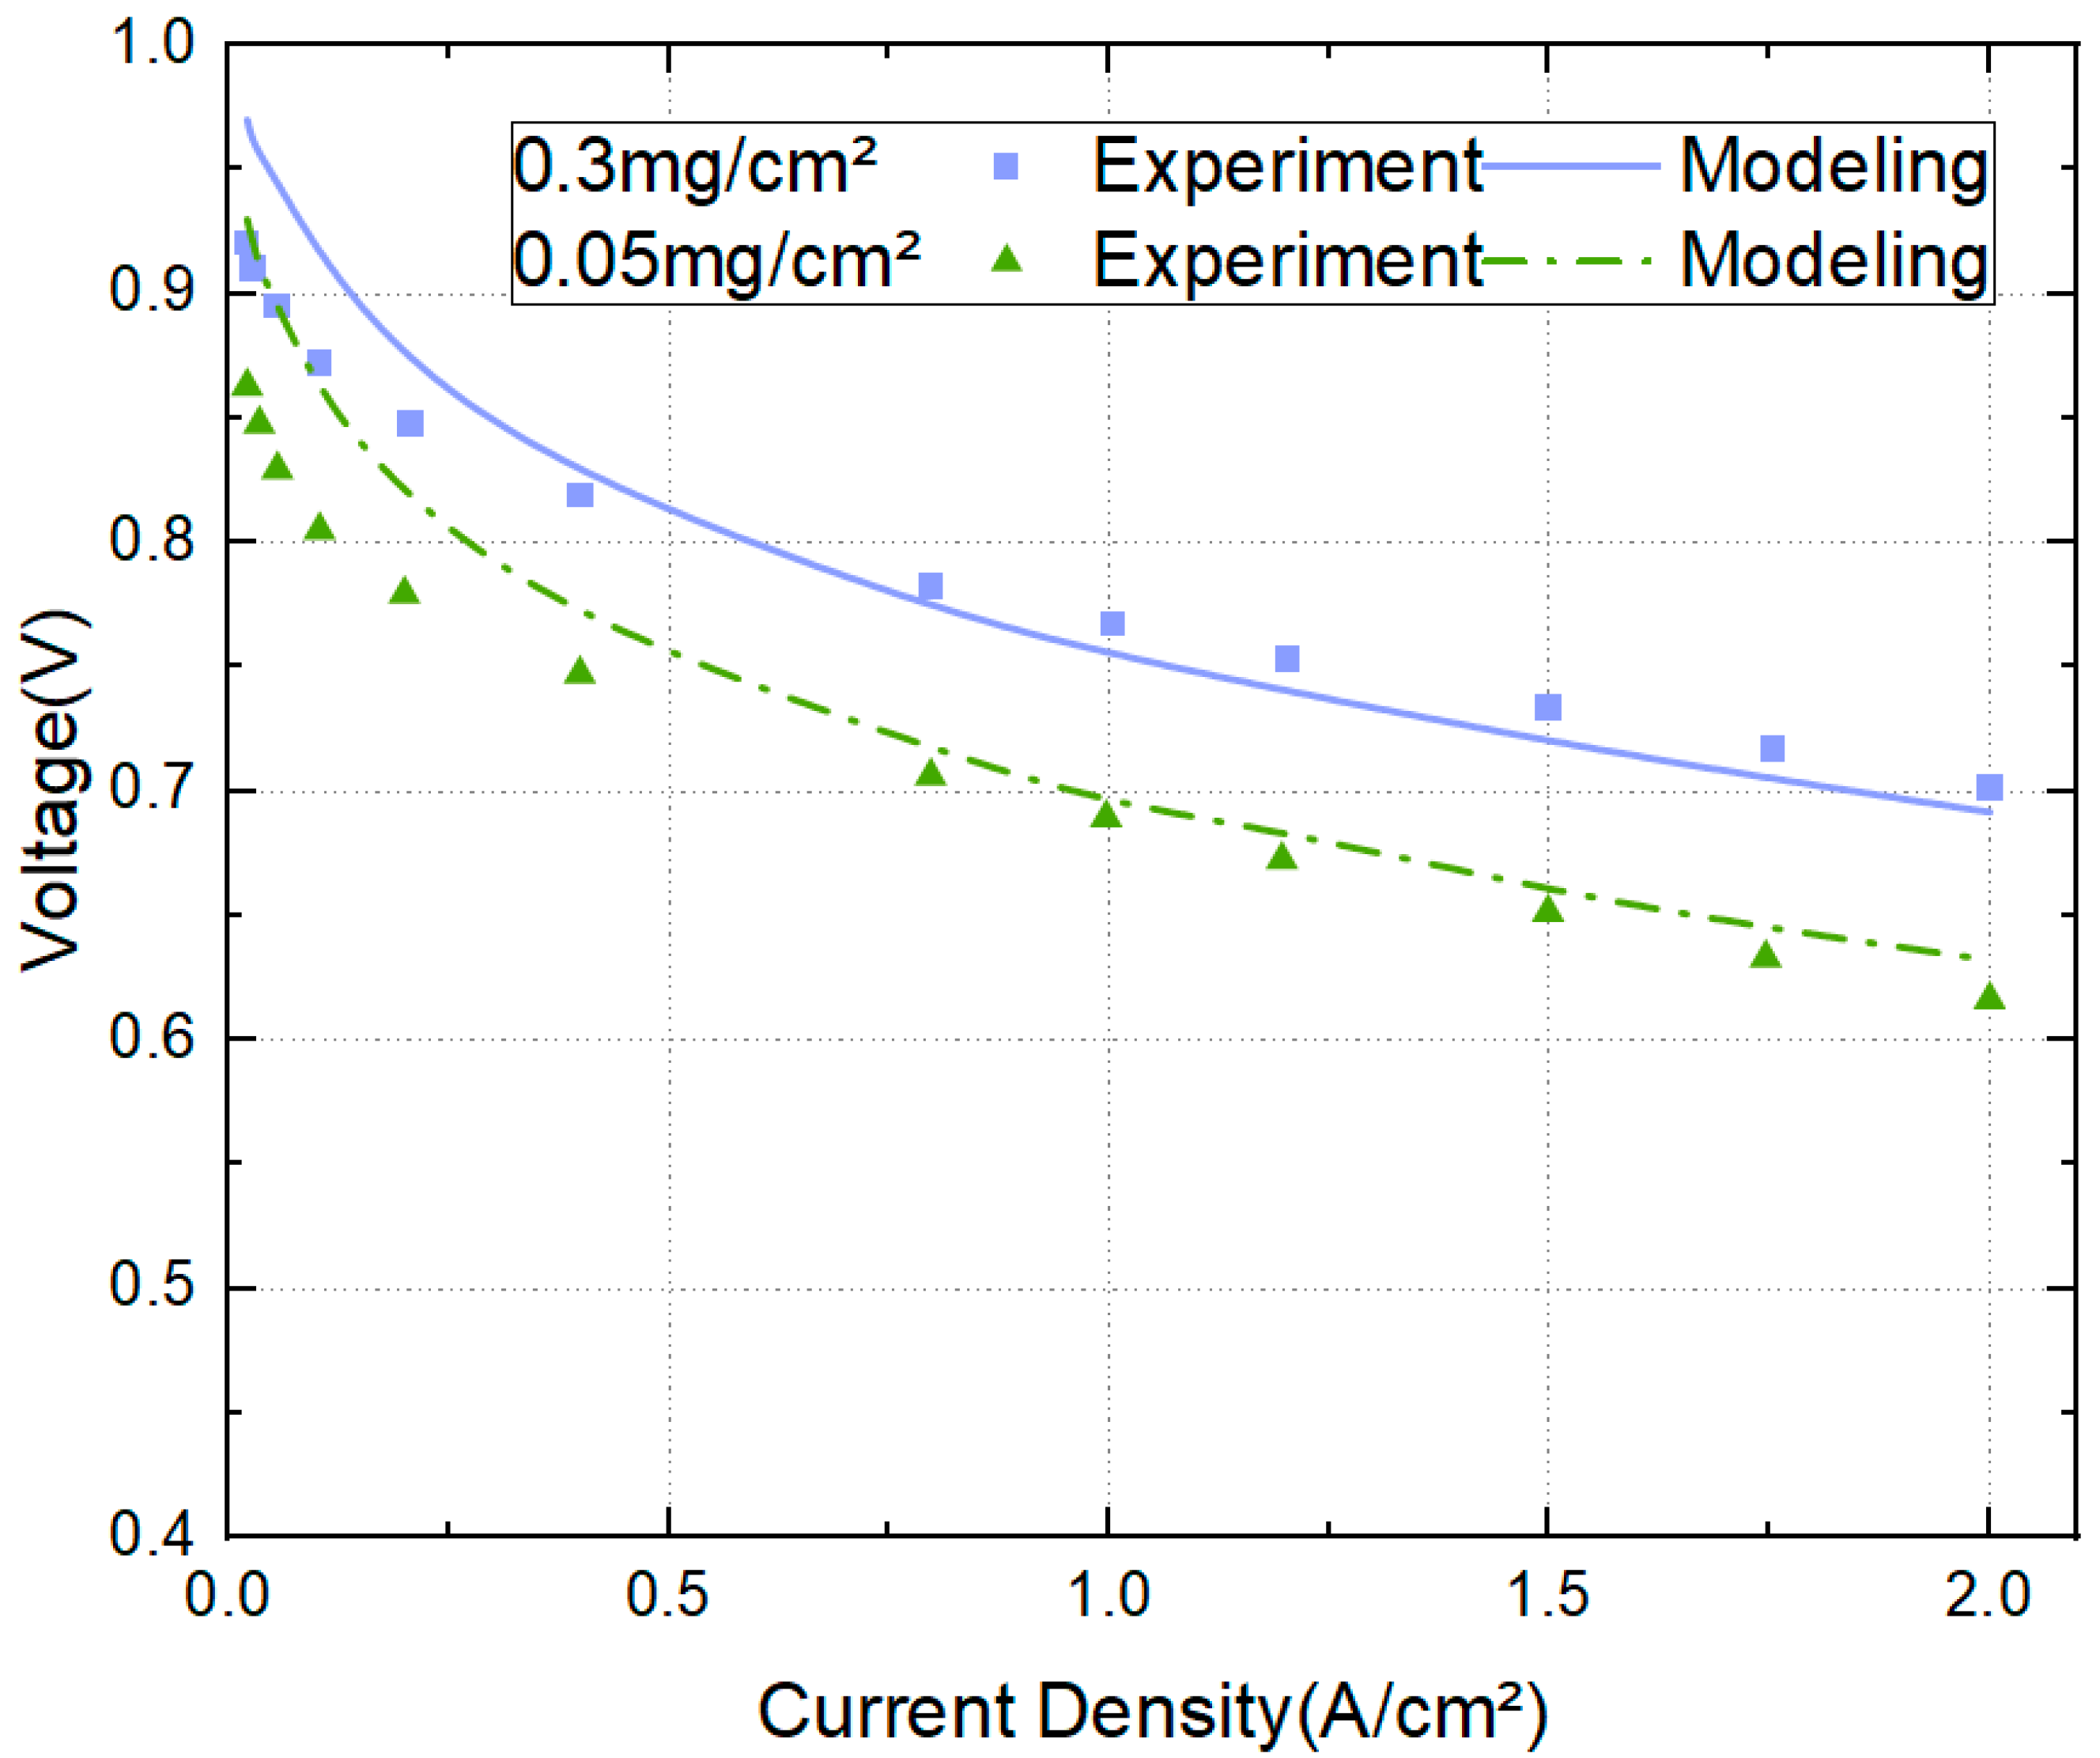
2.6. Model Validation

The modeling results were compared with the experimental data of Jon et al. [54] and used to validate the model and adjust the parameters. The experiments of Jon et al. [54] verified in detail the effect of local transport-related parameters at Pt nanoparticles on PEMFCs by fixing the electrode thickness and bulk properties. The polarization curves were compared for 0.3 mg/cm² Pt loading and 0.05 mg/cm² Pt loading PEMFCs at 80 °C, 150 kPa operating pressure, 100% RH, and anode/cathode stoichiometry ratios of 1.5/2.0. The modeling cases were built according to the experimental setup. In their experiments, the Pt nanoparticle distribution was varied by diluting different mass fractions of Pt on the Vulcan catalyst in order to maintain a constant catalyst layer thickness, ionomer content, and macrostructure, thus obtaining the effect of Pt dispersion on the PEMFC performance without involving the gas phase in the catalyst layer.
Figure 2 shows the results of comparing the experimental data from the 0.3 mg/cm2 Pt loading model and the 0.05 mg/cm2 Pt loading model with the modeled data. A Pt loading of 0.3 mg/cm2 has a larger ultimate current density than a Pt loading of 0.05 mg/cm2, implying that the PEMFC with a Pt loading of 0.3 mg/cm2 has better performance, as can be seen from the polarization curves. The model also reasonably predicts the polarization curves under different Pt loading conditions. The results showed that the parameters utilized in the model were within a tolerable range because the model operation conditions were consistent with the experimental circumstances, which were obtained at 80 °C, 150 kPa operating pressure, 100% RH, and 1.5/2.0 anode/cathode stoichiometry ratio. This research aims to clarify, through a modeling approach, the impact of various operating conditions on the performance of PEMFCs and to demonstrate, through varying Pt loading, the impact of various operating conditions on PEMFC endurance. This work will be helpful in determining the best operating conditions and Pt loading content for PEMFCs.

3. Results and Discussion

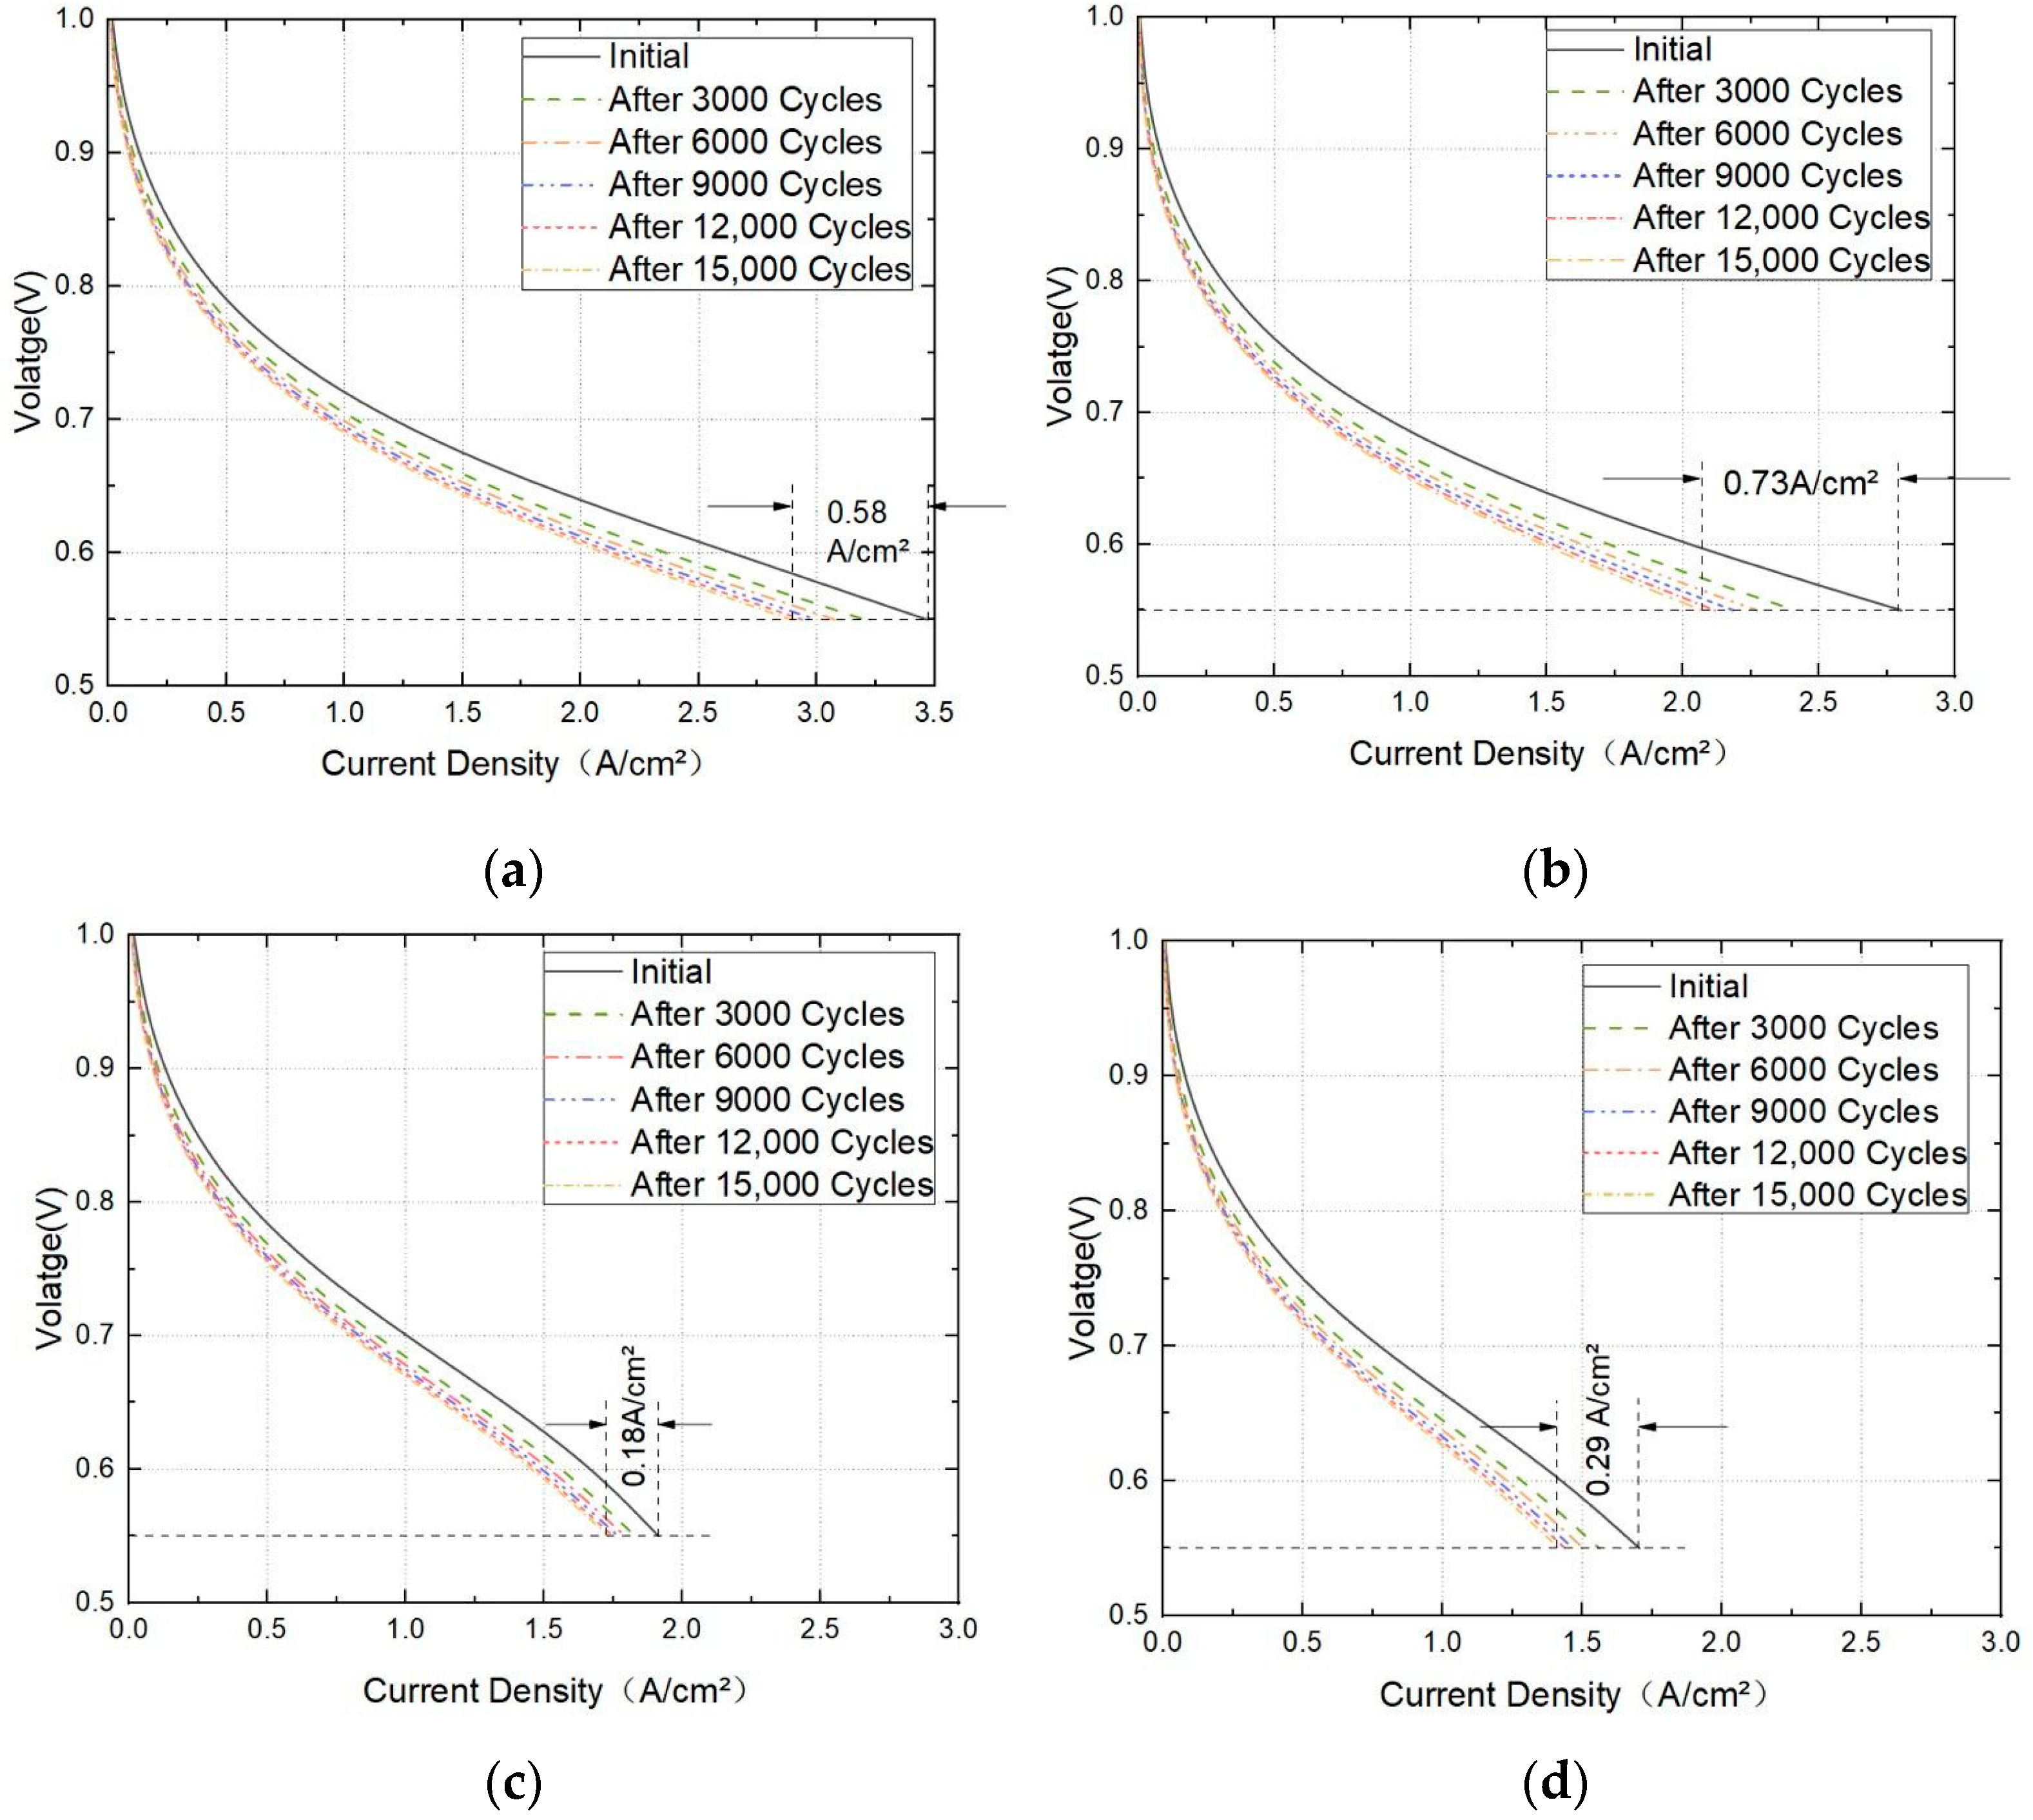
3.1. Pt Degradation Leads to Performance Loss of PEMFC

The PEMFC operating parameters for the PEMFC steady-state performance testing were set to 353.15 K and 202.65 kPa. The cathode Pt loadings were set to 0.3 mg/cm2 and 0.1 mg/cm2 for the PEMFC catalyst electrode, while the anode stoichiometry was 1.5 and the cathode stoichiometry was 2.0. The anode intake humidity was set at 50%, and the cathode inlet humidity was 10%. This was done to confirm the impact of Pt loading on PEMFC performance.
Since Pt is not uniformly degraded in CCL [55], it is difficult to experimentally determine the ECA distribution after degradation, and existing studies provide an effective way to estimate the inhomogeneous ECA distribution on CCL under conditions of inhomogeneous Pt degradation distribution [53]. Figure 3 compares the mass distribution of Pt remaining on the carbon carrier after current cycling. The results show that the mass loss of Pt under the 0.3 mg/cm² Pt loading condition is slightly smaller than that under the 0.1 mg/cm² Pt loading condition, and after 15,000 cycles, the mass loss of Pt under the 0.3 mg/cm² Pt loading condition is 61.8%, while the mass loss of Pt under the 0.1 mg/cm² Pt loading condition is 65%. The effect of different Pt loadings on Pt degradation and ECA loss can be obtained through simulation studies.
As shown in Figure 4, the initial polarization curves for two different platinum loads and the degraded polarization curves after different numbers of current cycles are shown. After 15,000 cycles, the voltage loss at high current density of 2.0 A/cm² for the 0.3 mg/cm² Pt load case is 35 mV, while the total voltage loss at medium current density of 1.0 A/cm² is 30 mV. Comparing with Figure 4a,b, the total voltage loss at 1.0 A/cm² for the 0.1 mg/cm² Pt load case is 38 mV, while the total voltage loss at 2.0 A/cm² current density is 57 mV. The total voltage loss is 38 mV at a current density of 1.0 A/cm² for the 0.1 mg/cm² Pt load, while the total voltage loss is 57 mV at a current density of 2.0 A/cm². This is due to the fact that at moderate current conditions, voltage losses are mainly due to oxygen reduction reaction (ORR) kinetic losses and microscale transport losses, while high ECA current densities lead to microscale oxygen transport resistance, which in turn allows additional interfacial concentration super potential. More importantly, due to the loss caused by ECA during Pt degradation, this leads to an increase in microscale oxygen transport resistance, which in turn leads to a larger overpotential at the PEFC interface concentration and accelerates the voltage loss of CCL. The voltage loss at a high current density of 35 mV at the 0.3 mg/cm² Pt load is reduced compared to the 0.1 mg/cm² Pt load. The voltage loss at high current density means that the performance of the PEMFC decreases at high power operation, which is very unfavorable for the PEMFC. However, higher Pt loading is not always preferable. In order to reduce the cost of the PEMFC due to the expensive Pt metal, it is necessary to quantitatively estimate the relationship between Pt loading content and voltage loss to select the appropriate operating conditions to mitigate the degradation of battery performance under dynamic conditions.
The above point is also better illustrated by comparing the distribution of current density in the middle layer of the membrane. Figure 5 shows the contours of the model’s current density distribution in the membrane’s middle layer under 0.3 mg/cm² Pt loading conditions at 0.65 V operating conditions. It is clear from Figure 5 that the contours of the current density distribution thin out with an increasing number of PEMFC cycles. Compared to Figure 6, the decreasing trend of the current density of the membrane interlayer with a Pt loading condition of 0.1 mg/cm² increases. This is consistent with the results of the obtained polarization curves.

3.2. Effect of Working Pressure on PEMFC Aging

In general, increasing the pressure will accelerate the flow of gaseous reactants into the PEMFC. Hence, the reaction rate will increase, which will improve the cell’s efficiency. After changing the operating pressure of the model mentioned in 3.1, current cycling was performed again to test the effect of 1 atm and 3 atm operating pressure on PEMFC performance. The tests still include both the 0.3 mg/cm² Pt load condition model and the 0.1 mg/cm² Pt load condition model, which are used to compare the changes in cell performance after varying the operating pressure under different Pt load conditions.
At 1 atm operating pressure, the reaction rate slows down considerably due to the decrease in reactant concentration at lower pressure, and the slope of the polarization curves in Figure 7a,b is substantially higher compared to Figure 4, which indicates that the current density of the PEMFC decreases substantially with lower voltage and the cell’s performance decreases substantially. In comparison with the degree of decay of the polarization curve after 15,000 cycles of the PEMFC, it can be found that the voltage loss under 1 atm operating pressure is 33 mV at a current density of 1.0 A/cm² for 0.3 mg/cm² Pt load condition and 46 mV at a current density of 1.0 A/cm² for 0.1 mg/cm² Pt load condition, both of which are higher than the voltage loss under 2 atm test condition. It was concluded that the reduced operating pressure would further contribute to the faster aging of the PEMFC. After adjusting the operating pressure to 3 atm, the corresponding reactant concentration increases, the activation and concentration overpotentials of the cell become smaller, and the reaction rate increases. However, in the low current interval, increasing the pressure is not an obvious way to improve the output performance of PEMFC, instead, the higher the pressure in the high current interval, the better the output performance of the PEMFC system. The result shows that the PEMFC can still achieve high cell voltage at higher current densities. Further comparing the polarization curves after 15,000 current cycles at 3 atm operating pressure, the voltage loss is 30 mV at a current density of 1.0 A/cm² for the 0.3 mg/cm² Pt load condition and 32 mV at 1.0 A/cm² for the 0.1 mg/cm² Pt load condition. Compared with the current cycle at 2 atm operating pressure, the voltage loss is improved but not significantly, which indicates that when the operating pressure of the PEMFC is increased, the cell performance will be improved on the one hand, and the cell performance loss will be slowed down on the other hand.
Figure 8 gives the current density distribution of the initial state (a) and the current density distribution (b) after 15,000 current cycles for the 0.3 mg/cm² Pt loading model at 3 atm operating pressure. Comparing (a) and (f) in Figure 5, the results show that the current density distribution is affected by the operating pressure, and a high operating pressure will make the current density distribution denser. Figure 8c,d show that the operating pressure is 1 atm, the current density distribution is obviously much thinner, and the response to the polarization curve is a curve drop. Additionally, comparing the decay of the current density distribution after 15,000 current cycles, the decay at 3 atm operating pressure is less than at 1 atm, and the results indicate that high operating pressure has some improvement for improving the endurance of the PEMFC. Figure 9 shows a 0.1 mg/cm2 Pt loading volume model at 3 atm operating pressure, including the initial state current density distribution (a), the current density distribution after 15,000 current cycles (b). Reduced operating pressure current density distribution makes decay more obvious, as shown in the 3 color scale in Figure 9c. In conclusion, the performance of the PEMFC is affected by the operating pressure and also by the Pt loading. Higher operating pressure and Pt loading will improve the performance of the PEMFC; besides, high operating pressure has some benefits for the endurance of the PEMFC.

3.3. Effect of Cathodic Oxygen Stoichiometry on PEMFC Performance

Cathode stoichiometry is one of the key factors affecting the performance of PEMFCs and also affects the local gas deficiency of a PEMFC. Proper cathode stoichiometry not only improves PEMFC performance and efficiency but also effectively reduces the impact on the PEMFC lifetime due to internal reactant gas deficiency. Current studies have tended to focus on the effect of cathode stoichiometry optimization on maximum power, and further research is needed for PEMFC degradation. Local gas deficiency leads to accelerated carbon corrosion and dissolution of catalyst particles inside the carbon carrier, which in turn leads to severe degradation of PEMFC durability. Oxygen molecules are larger than hydrogen molecules, which makes the oxygen ground diffusion rate smaller than hydrogen, so the cathode side is more prone to local gas deficiency compared to the anode side.
Figure 10a shows the schematic diagram of the polarization curve of a Pt loading of 0.3 mg/cm² PEMFC after 15,000 current cycles at cathode stoichiometry 3.0. After 15,000 current cycles, the current density loss is 0.49 A/cm² at 0.55 V cell voltage. Compared with Figure 10c, after changing the cathode stoichiometry to 1.5 at 0.55 V, the current density loss is reduced to 0.34 A/cm². Although the current density loss is reduced, the peak current density at cathode stoichiometry 1.5 is lower than that at cathode stoichiometry 3.0. In terms of loss rate, the performance degradation of the PEMFC with cathode stoichiometry 1.5 is higher than that of the PEMFC with cathode stoichiometry 3.0. For Pt loading of 0.1 mg/cm² PEMFC, changing the cathode stoichiometry appears to produce similar results. Figure 10b shows that the PEMFC current density loss is 0.63 A/cm² at 0.55 V cell voltage after 15,000 current cycles at a cathode stoichiometry of 3.0, and when the stoichiometry is reduced to 1.5, the current density loss is reduced to 0.5 A/cm² under the same conditions as shown in Figure 10d. Similarly, the current density decrease value is reduced, but the loss rate is higher. It is concluded that upgrading the cathode stoichiometry increases the PEMFC performance, more significantly at high current densities, and also leads to an increase in the PEMFC durability performance.
These current density distributions are given in Figure 11 and Figure 12. From the results of the current density distribution, the cathode stoichiometry decreases from 3.0 to 1.5, and the decrease in current density is mainly reflected in the decrease of the minimum value, while the peak current density does not change much, i.e., the current density distribution interval becomes larger. When different Pt loading PEMFCs were compared, it was discovered that the current density decreased more for the 0.1 mg/cm2 Pt loading amount model. The results show that the size of the cathode stoichiometry affects the minimum value of the current density distribution, and a lower cathode stoichiometry means a lower current density distribution.

3.4. Effect of Cathode Channel and Plate Width on the Performance of PEMFC

The flow field configuration also affects the performance of the PEMFC. The faster the gas diffusion rate, the faster the reaction gas will be supplied to the electrode and the faster the product removal will be. On the other hand, the higher the conductivity, the faster the electrochemical reaction in the PEMFC. The flow channel configuration greatly affects the gas diffusion rate and conductivity. A wider channel width is required for faster gas diffusion, and a wider plate width and narrower channel width are required for higher conductivity. In order to understand the effects of conductivity and gas diffusion on cell performance, different channel/plate width ratios are designed to simulate the polarization curves of PEMFC and reflect the performance of PEMFC.
As shown in Figure 13a, the current density decay of a PEMFC at 0.55 V is 0.58 A/cm² after 15,000 current cycles, compared with Figure 13b at a 0.1 mg/cm² platinum load condition, where the current density decay of a PEMFC at 0.55 V is 0.73 A/cm² after 15,000 current cycles. It can be clearly seen that the decay of the polarization curve after current cycling at 0.1 mg/cm² Pt loading is greater than that at 0.3 mg/cm² Pt loading. Next, the polarization curves were obtained by changing the width of the channel and the plate to 0.5 mm and 1.5 mm, and the polarization curves were obtained by conducting 15,000 current cycles again, as shown in Figure 13c,d for 0.3 mg/cm² Pt loading and 0.1 mg/cm² Pt loading conditions, respectively. Due to the reduced width of the flow channel, the airflow diffusion rate is significantly weakened, which also leads to a decrease in the PEMFC reaction rate. It is quite intuitive from the polarization curves that the current density obtained at the same voltage is quite lower than that at a flow path of 1.5 mm on a 0.5 mm pole plate. The current density decay is 0.18 A/cm² at 0.55 V for the 0.3 mg/cm² Pt loading model and 0.29 A/cm² at 0.55 V for the 0.1 mg/cm² Pt loading model. The PEMFC’s performance degrades severely. As well, the degree of polarization curve decay under 0.3 mg/cm² Pt loading is less than that under 0.1 mg/cm² Pt loading.
The channel/plate width has a great influence on the performance of the PEMFC. In terms of current density distribution, the current density distribution interval for the channel/plate width ratio of 0.5/1.5 is larger than that for the channel/plate width ratio of 1.5/0.5, but that does not mean that a large span of current density distribution represents high cell performance; instead, the current density distribution is more concentrated, and the span is smaller for the channel/plate width ratio of 1.5/0.5. Interestingly, after 15,000 current cycles from Figure 14, the minimum degree of decay of current density in the interlayer of the model film with channel/plate width ratio 0.5/1.5 is 0.05 A/cm², while the minimum degree of decay of current density in the interlayer of the model film with channel/plate width ratio 1.5/0.5 is 0.36 A/cm². Figure 15 shows the case of the 0.1 mg/cm² Pt loading model. After 15,000 current cycles, the minimum degree of decay of the current density in the interlayer of the model film with a channel/plate width ratio of 0.5/1.5 is 0.15 A/cm², while the minimum degree of decay of the current density in the interlayer of the model film with a channel/plate width ratio of 1.5/0.5 is 0.34 A/cm². The results show that an increase in the ratio of channel/plate width leads to an increase in current density, especially for the minimum value of current density, but this also results in a decrease in PEMFC endurance.

4. Conclusions

In this paper, a single-flow channel PEMFC is modeled in three dimensions. By varying the PEMFC operating pressure, cathode stoichiometry, cathode channel, and plate width, the experimental results are compared for testing the polarization curves under different operating conditions to reflect the cell’s performance.
To begin, the Pt degradation model was used to obtain the results of ECA distribution under the 0.3 mg/cm2 Pt loading condition and the 0.1 mg/cm2 Pt loading condition, and 15,000 current cycles were tested to determine the performance loss of the PEMFC under initial conditions. At high current densities, the loss caused by ECA during Pt degradation leads to an increase in micro-scale oxygen transport resistance, which in turn leads to a larger overpotential at the PEMFC interface concentration and accelerates the voltage loss of CCL.
Second, the operating pressure of the PEMFC was changed. Usually, a higher operating pressure means a higher concentration of gas reactants and a higher rate of gas reaction, and it was concluded that a lower operating pressure will further lead to a faster aging of the PEMFC. For a 0.1 mg/cm² Pt loading condition, increasing the operating pressure is more beneficial to improving the PEMFC’s durability, which means that for low Pt loading conditions, the PEMFC’s lifetime can be improved by increasing the operating pressure.
Thirdly, cathode stoichiometry is one of the key factors affecting the performance of PEMFCs. Cathode stoichiometry that is too low will lead to local gas deficiency, which in turn results in a lower PEMFC lifetime. It is found that increasing cathode stoichiometry is more helpful to improve the endurance of a 0.3 mg/cm² Pt-loaded PEMFC. Choosing the right cathode stoichiometry can help improve the performance of the PEMFC, and based on the results, a cathode stoichiometry of 2.0 is a suitable choice.
Finally, enhancing the flow field configuration can help a lot in slowing down the performance degradation of the PEMFC. The flow channel configuration largely affects the gas diffusion rate and conductivity. Increasing the flow channel-to-plate width ratio will enhance the performance of PEMFC significantly, but it also leads to the degradation of PEMFC endurance. On the other hand, for a 0.1 mg/cm² Pt-loaded PEMFC, decreasing the channel-to-plate width ratio is more beneficial for improving the fuel cell endurance. In summary, in order to reduce the Pt load while improving the performance of the PEMFC, it is possible to increase the operating pressure on a PEMFC with a low Pt load, as well as to reduce the ratio of channel-to-plate width, all of which are measures that contribute to the durability of the PEMFC.

Author Contributions

Investigation, Z.H., X.L. and H.H.; formal analysis, L.S.; methodology, Y.L. and L.S.; software, L.G. and Y.Y.; supervision, Y.L. and Y.S.; writing—original draft, Z.H.; writing—review and editing, L.S., Y.L. and Y.S. All authors have read and agreed to the published version of the manuscript.

Funding

This research is funded by the National Natural Science Foundation of China (Grant No. 52106226, 51876027, 52176058) and the Fundamental Research Funds for the Central Universities, China (DUT20RC(3)095, DUT20JC21).

Institutional Review Board Statement

Not applicable.

Informed Consent Statement

Not applicable.

Data Availability Statement

Not applicable.

Conflicts of Interest

The authors declare no conflict of interest.

References

  1. Thompson, S.T.; James, B.D.; Huya-Kouadio, J.M.; Houchins, C.; DeSantis, D.A.; Ahluwalia, R.; Wilson, A.R.; Kleen, G.; Papageorgopoulos, D. Direct hydrogen fuel cell electric vehicle cost analysis: System and high-volume manufacturing description, validation, and outlook. J. Power Sources 2018, 399, 304–313. [Google Scholar] [CrossRef]
  2. Han, R.; Li, J.; Guo, Z. Optimal quota in China’s energy capping policy in 2030 with renewable targets and sectoral heterogeneity. Energy 2022, 239, 121971. [Google Scholar] [CrossRef]
  3. Usman, M.; Balsalobre-Lorente, D.; Jahanger, A.; Ahmad, P. Pollution concern during globalization mode in financially resource-rich countries: Do financial development, natural resources, and renewable energy consumption matter? Renew. Energy 2022, 183, 90–102. [Google Scholar] [CrossRef]
  4. Tian, S.; Di, Y.; Dai, M.; Chen, W.; Zhang, Q. Comprehensive assessment of energy conservation and CO2 emission reduction in future aluminum supply chain. Appl. Energy 2022, 305, 117796. [Google Scholar] [CrossRef]
  5. Salvi, B.L.; Subramanian, K.A. Sustainable development of road transportation sector using hydrogen energy system. Renew. Sustain. Energy Rev. 2015, 51, 1132–1155. [Google Scholar] [CrossRef]
  6. Cano, Z.P.; Banham, D.; Ye, S.; Hintennach, A.; Lu, J.; Fowler, M.; Chen, Z. Batteries and fuel cells for emerging electric vehicle markets. Nat. Energy 2018, 3, 279–289. [Google Scholar] [CrossRef]
  7. Raza, S.S.; Janajreh, I.; Ghenai, C. Sustainability index approach as a selection criteria for energy storage system of an intermittent renewable energy source. Appl. Energy 2014, 136, 909–920. [Google Scholar] [CrossRef]
  8. Yuan, X.Z.; Li, H.; Zhang, S.S.; Martin, J.; Wang, H.J. A review of polymer electrolyte membrane fuel cell durability test protocols. J. Power Sources 2011, 196, 9107–9116. [Google Scholar] [CrossRef]
  9. Ma, S.; Lin, M.; Lin, T.; Lan, T.; Liao, X.; Maréchal, F.; Van Herle, J.; Yang, Y.; Dong, C.; Wang, L. Fuel cell-battery hybrid systems for mobility and off-grid applications: A review. Renew. Sustain. Energy Rev. 2021, 135, 110119. [Google Scholar] [CrossRef]
  10. Hames, Y.; Kaya, K.; Baltacioglu, E.; Turksoy, A. Analysis of the control strategies for fuel saving in the hydrogen fuel cell vehicles. Int. J. Hydrogen Energy 2018, 43, 10810–10821. [Google Scholar] [CrossRef]
  11. Kojima, K.; Fukazawa, K. Current Status and Future Outlook of Fuel Cell Vehicle Development in TOYOTA. ECS Trans. 2015, 69, 213–219. [Google Scholar] [CrossRef]
  12. Wang, Y.; Chen, K.S.; Mishler, J.; Cho, S.C.; Adroher, X.C. A review of polymer electrolyte membrane fuel cells: Technology, applications, and needs on fundamental research. Appl. Energy 2011, 88, 981–1007. [Google Scholar] [CrossRef]
  13. Zhao, J. Catalyst Layers in Polymer Electrolyte Membrane Fuel Cells: Formation, Characterization and Performance. UWSpace. 2019. Available online: http://hdl.handle.net/10012/14425 (accessed on 1 February 2023).
  14. Chen, H.; Pei, P.; Song, M. Lifetime prediction and the economic lifetime of Proton Exchange Membrane fuel cells. Appl. Energy 2015, 142, 154–163. [Google Scholar] [CrossRef]
  15. Kim, Y.S.; Hamrock, S.J.; Garland, N.L. Fuel Cell Technologies Program Multi-Year Research, Development and Demonstration Plan. 2015. Available online: https://www.semanticscholar.org/paper/Fuel-Cell-Technologies-Program-Multi-Year-Research%2C-Kim-Hamrock/cda07117b3f06f41b536068a867185742cad616e (accessed on 1 February 2023).
  16. Verhage, A.J.L.; Coolegem, J.F.; Mulder, M.J.J.; Yildirim, M.H.; de Bruijn, F.A. 30,000 h operation of a 70 kW stationary PEM fuel cell system using hydrogen from a chlorine factory. Int. J. Hydrogen Energy 2013, 38, 4714–4724. [Google Scholar] [CrossRef]
  17. Nguyen, H.L.; Han, J.; Nguyen, X.L.; Yu, S.; Goo, Y.; Le, D.D. Review of the durability of polymer electrolyte membrane fuel cell in long-term operation: Main influencing parameters and testing protocols. Energies 2021, 14, 4048. [Google Scholar] [CrossRef]
  18. Hou, J.B.; Yang, M.; Ke, C.C.; Wei, G.H.; Priest, C.; Qiao, Z.; Wu, G.; Zhang, J.L. Platinum-group-metal catalysts for proton exchange membrane fuel cells: From catalyst design to electrode structure optimization. EnergyChem 2020, 2, 100023. [Google Scholar] [CrossRef]
  19. Wang, Y.J.; Long, W.Y.; Wang, L.L.; Yuan, R.S.; Ignaszak, A.; Fang, B.Z.; Wilkinson, D.P. Unlocking the door to highly active ORR catalysts for PEMFC applications: Polyhedron-engineered Pt-based nanocrystals. Energy Environ. Sci. 2018, 11, 258–275. [Google Scholar] [CrossRef]
  20. Wang, G.J.; Yu, Y.; Liu, H.; Gong, C.L.; Wen, S.; Wang, X.H.; Tu, Z.K. Progress on design and development of polymer electrolyte membrane fuel cell systems for vehicle applications: A review. Fuel Process. Technol. 2018, 179, 203–228. [Google Scholar] [CrossRef]
  21. Zhang, Y.; Chen, B.; Guan, D.; Xu, M.; Ran, R.; Ni, M.; Zhou, W.; Hayre, R.O.; Shao, Z. Thermal-expansion offset for high-performance fuel cell cathodes. Nature 2021, 591, 246–251. [Google Scholar] [CrossRef]
  22. Olabi, A.G.; Wilberforce, T.; Abdelkareem, M.A. Fuel cell application in the automotive industry and future perspective. Energy 2021, 214, 118955. [Google Scholar] [CrossRef]
  23. Mirzaei, F.; Parnian, M.J.; Rowshanzamir, S. Durability investigation and performance study of hydrothermal synthesized platinum-multi walled carbon nanotube nanocomposite catalyst for proton exchange membrane fuel cell. Energy 2017, 138, 696–705. [Google Scholar] [CrossRef]
  24. Zhang, F.; Advani, S.G.; Prasad, A.K. Performance of a metallic gas diffusion layer for PEM fuel cells. J. Power Sources 2008, 176, 293–298. [Google Scholar] [CrossRef]
  25. Kong, I.M.; Jung, A.; Kim, Y.S.; Kim, M.S. Numerical investigation on double gas diffusion backing layer functionalized on water removal in a proton exchange membrane fuel cell. Energy 2017, 120, 478–487. [Google Scholar] [CrossRef]
  26. Ekiz, A.; Camci, T.; Türkmen, I.; Sankir, M.; Uslu, S.; Baker, D.K.; Aǧar, E. Modeling of bipolar plates for proton exchange membrane fuel cells. J. Fac. Eng. Archit. Gazi Univ. 2011, 26, 591–605. [Google Scholar]
  27. Ozden, A.; Shahgaldi, S.; Zhao, J.; Li, X.; Hamdullahpur, F. Assessment of graphene as an alternative microporous layer material for proton exchange membrane fuel cells. Fuel 2018, 215, 726–734. [Google Scholar] [CrossRef]
  28. Wang, J. System integration, durability and reliability of fuel cells: Challenges and solutions. Appl. Energy 2017, 189, 460–479. [Google Scholar] [CrossRef]
  29. Yue, M.L.; Jemei, S.; Gouriveau, R.; Zerhouni, N. Review on health conscious energy management strategies for fuel cell hybrid electric vehicles: Degradation models and strategies. Int. J. Hydrogen Energ. 2019, 44, 6844–6861. [Google Scholar] [CrossRef]
  30. Zhao, J.; Li, X.G. A review of polymer electrolyte membrane fuel cell durability for vehicular applications: Degradation modes and experimental techniques. Energy Convers. Manag. 2019, 199, 112022. [Google Scholar] [CrossRef]
  31. Shahgaldi, S.; Alaefour, I.; Li, X. Impact of manufacturing processes on proton exchange membrane fuel cell performance. Appl. Energy 2018, 225, 1022–1032. [Google Scholar] [CrossRef]
  32. Qiu, D.; Peng, L.; Lai, X.; Ni, M.; Lehnert, W. Mechanical failure and mitigation strategies for the membrane in a proton exchange membrane fuel cell. Renew. Sustain. Energy Rev. 2019, 113, 109289. [Google Scholar] [CrossRef]
  33. Chen, H.; Zhao, X.; Zhang, T.; Pei, P. The reactant starvation of the proton exchange membrane fuel cells for vehicular applications: A review. Energy Convers. Manag. 2019, 182, 282–298. [Google Scholar] [CrossRef]
  34. Kongkanand, A.; Mathias, M.F. The Priority and Challenge of High-Power Performance of Low-Platinum Proton-Exchange Membrane Fuel Cells. J. Phys. Chem. Lett. 2016, 7, 1127–1137. [Google Scholar] [CrossRef]
  35. Gasteiger, H.A.; Panels, J.E.; Yan, S.G. Dependence of PEM fuel cell performance on catalyst loading. J. Power Sources 2004, 127, 162–171. [Google Scholar] [CrossRef]
  36. Salva, J.A.; Iranzo, A.; Rosa, F.; Tapia, E.; Lopez, E.; Isorna, F. Optimization of a PEM fuel cell operating conditions: Obtaining the maximum performance polarization curve. Int. J. Hydrogen Energy 2016, 41, 19713–19723. [Google Scholar] [CrossRef]
  37. Wilberforce, T.; El-Hassan, Z.; Khatib, F.N.; Al Makky, A.; Baroutaji, A.; Carton, J.G.; Thompson, J.; Olabi, A.G. Modelling and simulation of Proton Exchange Membrane fuel cell with serpentine bipolar plate using MATLAB. Int. J. Hydrogen Energy 2017, 42, 25639–25662. [Google Scholar] [CrossRef]
  38. Kanani, H.; Shams, M.; Hasheminasab, M.; Bozorgnezhad, A. Model development and optimization of operating conditions to maximize PEMFC performance by response surface methodology. Energy Convers. Manag. 2015, 93, 9–22. [Google Scholar] [CrossRef]
  39. Abdin, Z.; Webb, C.J.; Gray, E.M. PEM fuel cell model and simulation in Matlab–Simulink based on physical parameters. Energy 2016, 116, 1131–1144. [Google Scholar] [CrossRef]
  40. Kongkanand, A.; Gu, W.; Mathias, M.F. Proton-Exchange Membrane Fuel Cells with Low-Pt Content. Fuel Cells Hydrog. Prod. 2017. [Google Scholar] [CrossRef]
  41. Zhao, J.J.; Tu, Z.K.; Chan, S.H. Carbon corrosion mechanism and mitigation strategies in a proton exchange membrane fuel cell (PEMFC): A review. J. Power Sources 2021, 488, 229434. [Google Scholar] [CrossRef]
  42. Zhang, Z.; Jia, L. Parametric study of the porous cathode in the PEM fuel cell. Int. J. Energy Res. 2009, 33, 52–61. [Google Scholar] [CrossRef]
  43. Wang, X.; Duan, Y.; Yan, W.; Peng, X. Effects of flow channel geometry on cell performance for PEM fuel cells with parallel and interdigitated flow fields. Electrochim. Acta 2008, 53, 5334–5343. [Google Scholar] [CrossRef]
  44. Macauley, N.; Papadias, D.D.; Fairweather, J.; Spernjak, D.; Langlois, D.; Ahluwalia, R.; More, K.L.; Mukundan, R.; Borup, R.L. Carbon Corrosion in PEM Fuel Cells and the Development of Accelerated Stress Tests. J. Electrochem. Soc. 2018, 165, F3148–F3160. [Google Scholar] [CrossRef]
  45. Le, A.D.; Zhou, B. A general model of proton exchange membrane fuel cell. J. Power Sources 2008, 182, 197–222. [Google Scholar] [CrossRef]
  46. Zhang, G.; Jiao, K. Multi-phase models for water and thermal management of proton exchange membrane fuel cell: A review. J. Power Sources 2018, 391, 120–133. [Google Scholar] [CrossRef]
  47. Meng, H. Numerical studies of liquid water behaviors in PEM fuel cell cathode considering transport across different porous layers. Int. J. Hydrogen Energy 2010, 35, 5569–5579. [Google Scholar] [CrossRef]
  48. Yuan, W.; Tang, Y.; Pan, M.; Li, Z.; Tang, B. Model prediction of effects of operating parameters on proton exchange membrane fuel cell performance. Renew. Energy 2010, 35, 656–666. [Google Scholar] [CrossRef]
  49. Mann, R.F.; Amphlett, J.C.; Peppley, B.A.; Thurgood, C.P. Application of Butler–Volmer equations in the modelling of activation polarization for PEM fuel cells. J. Power Sources 2006, 161, 775–781. [Google Scholar] [CrossRef]
  50. Wang, Y.; Yang, X.G.; Wang, C.Y. Ultrahigh fuel utilization in polymer electrolyte fuel cells—Part II: A modeling study. Int. J. Green Energy 2022, 19, 166–174. [Google Scholar] [CrossRef]
  51. Turhan, A.; Heller, K.; Brenizer, J.S.; Mench, M.M. Passive control of liquid water storage and distribution in a PEFC through flow-field design. J. Power Sources 2008, 180, 773–783. [Google Scholar] [CrossRef]
  52. Holby, E.F.; Morgan, D. Application of Pt Nanoparticle Dissolution and Oxidation Modeling to Understanding Degradation in PEM Fuel Cells. J. Electrochem. Soc. 2012, 159, B578–B591. [Google Scholar] [CrossRef]
  53. Li, Y.B.; Moriyama, K.; Gu, W.B.; Arisetty, S.; Wang, C.Y. A One-Dimensional Pt Degradation Model for Polymer Electrolyte Fuel Cells. J. Electrochem. Soc. 2015, 162, F834–F842. [Google Scholar] [CrossRef] [Green Version]
  54. Owejan, J.P.; Owejan, J.E.; Gu, W.B. Impact of Platinum Loading and Catalyst Layer Structure on PEMFC Performance. J. Electrochem. Soc. 2013, 160, F824–F833. [Google Scholar] [CrossRef]
  55. Ota, K.; Koizumi, Y. Platinum dissolution models and voltage cycling effects: Platinum dissolution in polymer electrolyte fuel cell (PEFC) and low-temperature fuel cells. Handb. Fuel Cells 2010. [Google Scholar] [CrossRef]
Figure 1. Computational domain and mesh. CL, catalyst layer; GDL, gas diffusion layer; MPL, microporous layer.
Sustainability 15 02902 g001
Figure 2. Comparison of model polarization curves with experimental results for an anode/cathode stoichiometry ratio of 1.5/2.0 [54] under fully wetted conditions.
Sustainability 15 02902 g002
Figure 3. ECA distribution after 15,000 current cycles.
Sustainability 15 02902 g003
Figure 4. Polarization curves at 0.3 mg/cm² Pt load (a), 0.1 mg/cm² Pt load (b) under current cycling test through 15,000 cycles between 0.55 V and 1 V.
Sustainability 15 02902 g004
Figure 5. Current density distribution of the membrane middle layer at 0.65 V (a) 0 cycles, (b) 3000 cycles, (c) 6000 cycles, (d) 9000 cycles, (e) 12,000 cycles, (f) 15,000 cycles under 0.3 mg/cm² Pt load.
Sustainability 15 02902 g005
Figure 6. Current density distribution of the membrane middle layer at 0.65 V (a) 0 cycles, (b) 3000 cycles, (c) 6000 cycles, (d) 9000 cycles, (e) 12,000 cycles, (f) 15,000 cycles under 0.1 mg/cm² Pt load.
Sustainability 15 02902 g006
Figure 7. Polarization curves obtained after 15,000 current cycles (a) at 1 atm, 0.3 mg/cm² Pt load, (b) at 1 atm, 0.1 mg/cm² Pt load, (c) at 3 atm, 0.3 mg/cm² Pt load, (d) at 3 atm, 0.1 mg/cm² Pt load.
Sustainability 15 02902 g007
Figure 8. 0.3 mg/cm² Pt loading model (a) 3 atm operating pressure, 0 cycles, (b) 3 atm operating pressure, 15,000 cycles, (c) 1 atm operating pressure, 0 cycles, (d) 1 atm operating pressure, 15,000 current cycles tested at 0.65 V membrane middle layer current density distribution.
Sustainability 15 02902 g008
Figure 9. 0.1 mg/cm² Pt loading model (a) 3 atm operating pressure, 0 cycles, (b) 3 atm operating pressure, 15,000 cycles, (c) 1 atm operating pressure, 0 cycles, (d) 1 atm operating pressure, 15,000 current cycles tested at 0.65 V membrane middle layer current density distribution.
Sustainability 15 02902 g009
Figure 10. The polarization curves obtained after 15,000 current cycles (a) at cathode stoi 3, 0.3 mg/cm² Pt loading, (b) at cathode stoi 3, 0.1 mg/cm² Pt loading, (c) at cathode stoi 1.5, 0.3 mg/cm² Pt loading, (d) at cathode stoi 1.5, 0.1 mg/cm² Pt loading.
Sustainability 15 02902 g010
Figure 11. 0.3 mg/cm² Pt loading model (a) cathode stoi 3.0, 0 cycles, (b) cathode stoi 3.0, 15,000 cycles, (c) cathode stoi 1.5, 0 cycles, (d) cathode stoi 1.5, 15,000 current cycles tested at 0.65 V membrane middle layer current density distribution.
Sustainability 15 02902 g011
Figure 12. 0.1 mg/cm² Pt loading model (a) cathode stoi 3.0, 0 cycles, (b) cathode stoi 3.0, 15,000 cycles, (c) cathode stoi1.5, 0 cycles, (d) cathode stoi 1.5, 15,000 current cycles tested at 0.65 V membrane middle layer current density distribution.
Sustainability 15 02902 g012
Figure 13. Polarization curves obtained after 15,000 current cycles (a) channel width/plate width 1.5/0.5, 0.3 mg/cm² Pt load, (b) channel width/plate width 1.5/0.5, 0.1 mg/cm² Pt load, (c) channel width/plate width 0.5/1.5, 0.3 mg/cm² Pt load, (d) channel width/plate width 0.5/1.5, 0.1 mg/cm² Pt load.
Sustainability 15 02902 g013
Figure 14. 0.3 mg/cm² Pt loading model (a) channel/plate width ratio 0.5/1.5, 0 cycle, (b) channel/plate width ratio 0.5/1.5, 15,000 cycles, (c) channel/plate width ratio 1.5/0.5, (d) channel/plate width ratio 1.5/0.5, 15,000 current cycles tested at current density distribution of the middle layer of the membrane at 0.65 V.
Sustainability 15 02902 g014
Figure 15. 0.1 mg/cm² Pt loading model (a) channel/plate width ratio 0.5/1.5, 0 cycle, (b) channel/plate width ratio 0.5/1.5, 15,000 cycles, (c) channel/plate width ratio 1.5/0.5, (d) channel/plate width ratio 1.5/0.5, 15,000 current cycles tested at current density distribution of the middle layer of the membrane at 0.65 V.
Sustainability 15 02902 g015
Table 1. Geometry and physical parameters.
ParameterValue
Channel length110 mm
Channel width1.0 mm
Channel height0.7 mm
Land width1.0 mm
GDL thickness160 μm
MPL thickness30 μm
ACL thickness6 μm
Membrane thickness18 μm
CCL thickness11 μm
PEMFC length100 mm
Table 2. Key physical parameters.
ParameterValue
Reference exchange current density at anode,   i 0 , a ref 1.2 × 10³ A/m²
Reference exchange current density at cathode,   i 0 , c ref 13.2 A/m²
Specific active surface area at anode/cathode, A 1.6 × 10⁵ 1/m/9.1 × 104 1/m
Activation energy,   E a / E c 8314 J/mol
Reference temperature,   T a ref / T c ref 353.15 K
Reference pressure,   P a ref / P c ref 2.02 × 10⁵ Pa
Anode/cathode transfer coefficients of the anode/cathode electrodes, α a / α c 1.0/1.0
Concentration dependence,   γ a / γ c 1.0/1.0
Permeability of GDL/MPL/CL,   K j 3 × 10⁻¹² m2/1 × 10−12 m2/2 × 10−13 m2
Thermal conductivity of BP/GDL/MPL/CL membrane,   k j 100.0 W/m K/10.0 W/m K/10.0 W/m K/10.0 W/m K/2.0 W/m K
Cathode ionomer resistance,   R ion 7.954 s/m
Equivalent weight, EW1100 kg/kmol
Porosity of GDL/MPL/CL,   ε G D L , ε M P L , ε C L 0.7/0.3/0.15
Contact angle of GDL/MPL/CL110°/130°/95°
Electrical conductivity of BP/GDL/MPL/CL,1.0 × 106 S/m/5.0 × 103 S/m/5.0 × 103 S/m/5.0 × 103 S/m
Anode (50% RH)/cathode (10% RH) inlet velocity for gas channel0.109 m/s/0.314 m/s
Disclaimer/Publisher’s Note: The statements, opinions and data contained in all publications are solely those of the individual author(s) and contributor(s) and not of MDPI and/or the editor(s). MDPI and/or the editor(s) disclaim responsibility for any injury to people or property resulting from any ideas, methods, instructions or products referred to in the content.

