Communication

An Evaluation of Hospital Cleaning Regimes—Microbiological Evaluation and LCA Analysis after Traditional and Sustainable/Green Procedures

1
Department of Chemical, Pharmaceutical and Agricultural Sciences, University of Ferrara, 44121 Ferrara, Italy
2
Punto 3 Srl, 44121 Ferrara, Italy
*
Author to whom correspondence should be addressed.
Sustainability 2022, 14(18), 11465; https://doi.org/10.3390/su141811465
Submission received: 11 August 2022 / Revised: 6 September 2022 / Accepted: 9 September 2022 / Published: 13 September 2022
(This article belongs to the Special Issue Environmental Risk Assessment and Sustainable Remediation Approaches)

Abstract

:
The development of sustainable processes has a significant role in balancing social productivity demands, environmental protection, and natural resources. The control of microbial contamination has so far been concentrated on the use of chemical-based sanitation procedures, which may have various limitations, as testified by the persistence of contamination itself, by the growing antimicrobial resistance (AMR) of hospital microbes, and by chemical-related pollution. This communication aims to present a comparative analysis between the use of traditional and green sanitation products and processes in hospital environments. The sampling campaign was conducted in a day hospital ward of a general hospital (Imola, Santa Maria della Scaletta Hospital). Each sample comes from a specific surface, furniture or sanitary, and was taken using RODAC contact plates and swabs with a neutralizing agent in order to standardize the result of the microbiological evaluation. Sampling occurred before and after traditional and green cleaning procedures. The green experimental protocol using 100% natural and biodegradable products in sanitization procedures of hospital areas at a medium-high health risk was found to be a technique of relevant interest. From CAM requirements, the green protocol must give equal or better results than the traditional protocol. It can be concluded that the green experimental system meets this criterion and has shown better antimicrobial activity performance than the traditional system; all findings are in an acceptable state of sanitation, with no evidence of pathogenic micro-organisms specified in the guideline.

1. Introduction

Public awareness of environmental problems has increased in recent years. Therefore, the development of sustainable processes has a significant role in balancing social productivity demands, environmental protection, and natural resources [1]. In sustainable development studies, Life Cycle Assessment (LCA) is known as a significant tool for the verification of appropriate sustainability along the evaluation of the environmental impacts of the design of a certain product or process [2,3]. The European Commission considers LCA the best framework currently available for assessing the potential environmental impacts of products [4].
Considering hospital-related settings, hygienization procedures represent a fundamental asset in order to control patient cross-contaminations, antimicrobial resistance (AMR), and are a weapon to reduce the costs of corrective measures after microbiological breakthroughs [5,6]. The need to search for biological molecules active against the main nosocomial pathogens is growing more and more. The resistance accumulated due to the misuse of antibiotics is orienting research on green products and their nanoformulations [7,8]. The control of microbial contamination has so far been concentrated on the use of chemical-based sanitation procedures, which may have various limitations, as testified by the persistence of the contamination itself, by the growing AMR of hospital microbes, and by the environmental pollution that certain chemicals cause [9,10,11]. Therefore, microbial monitoring of the inanimate environment can be used to detect the presence of specific nosocomial pathogens, and to evaluate the efficacy of routine cleaning and disinfection practices by providing benchmark data. These results can also be used to decide when corrective action may be required, facilitate the selection of suitable cleaning and disinfection agents, and evaluate the cost-effectiveness of various methods.
The objective of the study was to experiment in the field the effectiveness of sustainable and eco-labeled products (in compliance with hospital CAMs—Criteri Ambientali Minimi—Minimal Environmental Criteria) together with textiles (i.e., 100% disposable microfiber cloths) compared to the use of traditional treatments based on detergents and chemical disinfectants and regenerated microfiber.

2. Materials and Methods

2.1. Sampling Plan

The study was conducted in a day hospital ward of a general hospital (Imola, Santa Maria della Scaletta Hospital). The sampling plan was carried out based on clinical evidence and standard protocols, collecting each sample in triplicate. The sampling consists of the collection of environmental samples from different areas of use: patient rooms (where floor and hand-touchable surfaces have been sampled), patient bathrooms (where floor and hand-touchable surfaces, i.e., toilet, sink, shower, etc. have been sampled), waiting rooms, and the corridor of the same ward. Sampling occurred before and after cleaning procedures [12,13].

2.2. Microbiological Evaluation

Swabs and Plates

RODAC contact plates (Liofilchem, Roseto degli Abruzzi, TE, Italy) were used and swabs with a neutralizing agent (Dey Engley) (Liofilchem) were also employed to standardize the results. Surfaces were firstly visually assessed for general conditions, cleanliness, and moisture. Microbiological assessment in the form of aerobic colony counts (ACC) was based upon growth after incubation at 37 °C for 48 h, on tryptic soy agar (TSA) RODAC plates coated with plate count agar with neutralizer. MacConkey Agar (MCA) with neutralizer was used for enterobacterial counts, mannitol-salt agar (MSA) for staphylococcal counts, sabouraud dextrose agar for yeasts and moulds (SDA), and Clostridium difficile agar (ClDA) for Clostridium count. RODAC plates were inoculated directly by pressing on to flat surfaces with the aid of a contact plate weight applicator for 30 s (VWR collection, International, Milano, Italy) or, for irregularly shaped surfaces, the entire hand contact area was swabbed using a sterile pre-moistened cotton wool swab, which was then used to inoculate agar plates. Swabs were sampled using a sterile 10 cm × 10 cm template to sample an area of 100 cm2.
RODAC plates were then incubated within 2 h, and colonies were counted after 24–48 h. A very slight growth (6–39 colonies) ≅ 2.5 CFU/cm2 and a scant growth (<6 colonies) ≅ <2.5 CFU/cm2 were considered as acceptable for standard protocols. Swabs were also each plated in different isolation agarized media (TSA, SDA, MSA, MCA, and ClDA).
A total of 134 samples were collected for each sampling and for each protocol (TT and TG). Surface samples were collected from floors, tables, armchairs, beds, toilets, sink, shower, and bathroom floors, whereas in the common areas, samples were collected from tables, chairs, and floors. Air samples were collected at the center of each room at 150 cm from the floor. Samples were transported to the laboratory in refrigerated insulated bags (0–4°). The temperature was monitored via data logger. PCA plates were incubated at 36° ± 1° for 48 h and SDA plates at 25° for 72–120 h. Colonies were then counted, isolated, and identified [14,15,16,17,18].

2.3. Microbial Isolation and Identification

Swabs samples were vortexed to aid the release of microbes into the diluent, followed by transfer and spreading on 90 mm petri dishes, each containing 20 mL of the different agar (TSA, MCA, MSA, SDA, ClDA) for the growth of microbes. The petri dishes were incubated at 36 °C (25 °C for SDA plates), where bacterial colony growth was observed every day up for 5 days. Colonies with unique phenotype (morphology, shape and colour) were picked for further experiments and stored with 50% (v/v) glycerol at −80 °C. To identify bacterial isolated colonies, API systems (Biomerieux Italia, Grassina, FI, Italy) were used according to the manufacturer’s instructions.

2.4. Cleaning Procedure

The trial was carried out subsequently with the two selected protocols: use of the “traditional” system (TT) for four weeks, followed by the “GREEN” experimental system (TG), for a total period of 8 weeks. In this way, it was possible to compare the results of the different methods of sanitization in areas with the same intended use, type of use, and characteristics of contamination. Non-clean/non-treated surface sampling was carried out as our control (NT).
Protocols used are listed in Table 1 and Table 2. Briefly, the treatment differed for:
-
Use of pre-treated Puli-scrub cloths in TT, treated at higher temperatures (90 °C) than “GREEN” treatment (60 °C);
-
The use of eco-labelled products for the cleaning of floors and surfaces in TT, with higher tank dosages (1%) compared to the products of the experimental protocol “GREEN” (dosage 0.3%).
-
Use of eco-labelled textiles for the cleaning of floors and surfaces in the experimental protocol “GREEN”. Specifically, the Micro-Activa (Filmop), ultra-microfibre cloth used for the cleaning of floors passed the test conducted by an independent laboratory following the ISO 23231 for the release of microplastics in the water of washing and rinsing. Furthermore, the Ultra Cloth (Diversey) used for the cleaning of furniture, taps, and sanitaria has been certified as an Eco Nordic Swan product. These products are thoroughly tested to evaluate the human safety of their use, granting at the same time a low environmental impact (strict criteria concerning raw materials, productive cycle, and distribution chain).
-
The experimental protocol “GREEN” involved more durable textiles for the cleaning of sanitaria, taps, and furniture (Ultra Cloth, Diversey). Such textiles can be used for up to 500 washing cycles at 95 °C [19,20].
The Traditional protocol (TT) system was carried out as follows:
Table 1. scheme of the TT protocol. For each operation, the working procedure, product, dilution, equipment, trolley and machine is described. In the Table are listed the commercial cleaning products, cloths, and machines that have been employed.
OperationTraditional Protocol
Working ProcedureDilutionProductEquipmentTrolleyMachine
FLOORS—Hand washingMop wash with flat fringeD.U. 1.0%
pre-impregnation in the machine
Pine Ecolabel (Sutter)Puli-Scrub (Filmop)Morgan Top-Down Maxi 7020 (Filmop)
FLOORS—Manual disinfectionMop wash with flat fringeD.U. 1.0%
pre-impregnation in the machine
Ondaklor (Sutter)Puli-Scrub (Filmop)Morgan Top-Down Maxi 7020 (Filmop)
FLOORS—Mechanical washingScrubbing machine wash, normal modeD.U. 1.0%
tank dosing
Pine Ecolabel (Sutter) Bluematic 50 CB BT (Magris)
FLOORS—Mechanical disinfectionScrubbing machine wash, normal modeD.U. 3.0%
tank dosing
Ondaklor (Sutter) Bluematic 50 CB BT (Magris)
Dusting of furniture and surfacesCloth and trigger100% (P.U.)Diamond Ecolabel (Sutter)My Micro Cloth (Diversey)Morgan Top-Down Maxi 7020 (Filmop)
Furniture disinfectionCloth and triggerD.U. 3.0%
dosage in bottle with trigger
Ondaklor (Sutter)My Micro Cloth (Diversey)Morgan Top-Down Maxi 7020 (Filmop)
Toilet cleaningCloth and trigger100% (P.U.)Ruby Ecolabel (Sutter)My Micro Cloth (Diversey)Morgan Top-Down Maxi 7020 (Filmop)
Toilet disinfectionCloth and triggerD.U. 3.0%
dosage in bottle with trigger
Ondaklor (Sutter)My Micro Cloth (Diversey)Morgan Top-Down Maxi 7020 (Filmop)
Sanitary and taps descalingCloth and trigger100% (U.R.)Xtra-Calc Plus (Sutter)My Micro Cloth (Diversey)Morgan Top-Down Maxi 7020 (Filmop)
Textile reconditioning—DetergentMachine wash at 90 °C6 g/kgEnzy Extra (Sutter) PWM520 18 kg (Miele)
Textile reconditioning—AlkalizingMachine wash at 90 °C10 g/kgAlka Power (Sutter) PWM520 18 kg (Miele)
Textile reconditioning—DisinfectantMachine wash at 90 °C6 g/kgPer Active (Sutter) PWM520 18 kg (Miele)
Textile pre-impregnation—Floor cleanerMachine wash at 90 °C10 g/kgPine Ecolabel (Sutter)Puli-Scrub (Filmop) PWM520 18 kg (Miele)
Textile pre-impregnation—Surface disinfectantMachine wash at 90 °C10 g/kgOndaklor (Sutter)Puli-Scrub (Filmop) PWM520 18 kg (Miele)
The GREEN protocol (TG) system was carried out as follows:
Table 2. scheme of the TG protocol. For each operation the working procedure, product, dilution, equipment, trolley, and machine is described. In the Table are listed the commercial cleaning products, cloths, and machines that have been employed.
OperationGreen Protocol
Working ProcedureDilutionProductEquipmentTrolleyMachine
FLOORS—Hand washingMop wash with flat fringeD.U. 0.3%
pre-impregnation in the machine
Pine Easy Ecolabel (Sutter)Micro-Activa (Filmop)Alpha 2672 (Filmop)
FLOORS—Manual disinfectionMop wash with flat fringeD.U. 3.0%
pre-impregnation in the machine
Ondaklor (Sutter)Micro-Activa (Filmop)Alpha 2672 (Filmop)
FLOORS—Mechanical washingScrubbing machine wash, ECO modeD.U. 0.3%
tank dosing
Pine Easy Ecolabel (Sutter) Bluematic 50 CB BT (Magris)
FLOORS—Mechanic disinfectionScrubbing machine wash, ECO modeD.U. 3.0%
tank dosing
Ondaklor (Sutter) Bluematic 50 CB BT (Magris)
Dusting of furniture and surfacesCloth and triggerD.U. 6.0%
dosage in bottle with trigger
Diamond Easy Ecolabel (Sutter)Ultra Cloth (Diversey)Alpha 2672 (Filmop)
Furniture disinfectionCloth and triggerD.U. 3.0%
dosage in bottle with trigger
Ondaklor (Sutter)Ultra Cloth (Diversey)Alpha 2672 (Filmop)
Toilet cleaningCloth and triggerD.U. 6.0%
dosage in bottle with trigger
Ruby Easy Ecolabel (Sutter)Ultra Cloth (Diversey)Alpha 2672 (Filmop)
Toilet disinfectionCloth and triggerD.U. 3.0%
dosage in bottle with trigger
Ondaklor (Sutter)Ultra Cloth (Diversey)Alpha 2672 (Filmop)
Sanitary and taps descalingCloth and triggerD.U. 3.0%
dosage in bottle with trigger
Descaler Plus (Sutter)Ultra Cloth (Diversey)Alpha 2672 (Filmop)
Textile reconditioning—DetergentMachine wash at 60 °C6 g/kgEnzy Extra (Sutter) PWM520 18 kg (Miele)
Textile reconditioning—AlkalizingMachine wash at 60 °C10 g/kgAlka Power (Sutter) PWM520 18 kg (Miele)
Textile reconditioning—DisinfectantMachine wash at 60 °C6 g/kgPer Active (Sutter) PWM520 18 kg (Miele)
Textile pre-impregnation—Floor cleanerMachine wash at 60 °C3 g/kgPine Easy Ecolabel (Sutter)Micro-Activa (Filmop) PWM520 18 kg (Miele)
Textile pre-impregnation—Surface disinfectantMachine wash at 60 °C10 g/kgOndaklor (Sutter)Micro-Activa (Filmop) PWM520 18 kg (Miele)

2.5. Standard/GREEN Protocol Products

Diamond/diamond easy: contains raw materials of vegetable origin (ex. surfactants, solvents) derived from sugar beet and maize. Perfume with apple cider vinegar without allergens (Reg. 648/2004). Phosphate-free, nickel-free (less than 0.01 ppm). The product is not classified dangerous (without CLP symbols) according to the Reg. 1272/2008. It contains <5% of anionic surfactants as antibacterial [21,22] and benzisothiazolinone, laurylamine dipropylenediamine, and sodium pyrithione as preservative agents.
Pine/pine easy: pine perfume with eucalyptus essential oil, contains raw materials of vegetable origin (i.e., surfactants, solvents) derived from the processing of maize, potatoes, sugar beet, and coconut oil. Phosphate-free, nickel-free (less than 0.01 ppm). The diluted product according to the recommended dilution is not classified dangerous (without CLP symbols) according to Reg. 1272/2008. Contains soap, anionic surfactants, non-ionic surfactants < 5%, benzisothiazolinone, laurylamine dipropylenediamine, andsodium pyrithione [21].
Ruby/ruby easy: Descaling detergent, based on natural organic acid (citric acid). Ideal for the bathroom environment. Suitable for daily cleaning of taps, bathtubs, shower, tiles, etc. The daily use of Ruby Easy, thanks to anti-redepositing agents, helps prevent the formation of incrustations. Contains raw materials of vegetable origin (ex. surfactants, acids, solvents) derived from sugar beet, cellulose, and coconut oil. Without phosphates, nickel-free (less than 0.01 ppm). The product is not classified dangerous (without CLP symbols) according to Reg. 1272/2008.
Ondaklor: chloros-oxidizing disinfectant with a cleansing cleaning and disinfectant action of washable floors and surfaces. Contains sodium hypochlorite, C12-C14 alkyldimethylamines, N-oxide, polycarboxylates, and amphoteric surfactants < 5% [23].
Per active: is a bactericidal and fungicidal disinfectant based on active oxygen and peracetic acid. Indicated as an additive in automatic washing at low and medium temperatures. A total of 100 g of product contain acid peracetic 4.8 g, hydrogen peroxide 27.9 g, co-formulants, and water q.b. to 100 g [24].

2.6. LCA Analysis

LCA is a methodology standardized by ISO 14040:2006 [25] and ISO 14044:2006 [26]. Furthermore, the ISO 14067:2018 standard was also taken as a reference [27] to quantify the carbon footprint of the cleaning service, i.e., its greenhouse gases emissions.
ISO 14067:2018 standard establishes that reference shall be made to relevant Product Category Rules (PCR), if existing. In this case, PCR 2011:03 v 3.0.1 “Professional cleaning services for buildings” were considered for further specific indications for the UN CPC 853 product [28]. PCR establishes the main analysis requirements, in terms of functional unit, system boundaries, type and quality of data to be used, and applicable cut-off criteria.
The functional unit used is defined by the existing PCR, namely 1 square meter of representative average surface kept clean for 1 year. In defining the representative surface, the different types of environments considered in the sample area were taken into consideration.
The system boundaries adopted are of the “cradle-to-grave” type. The processes included in the analysis divided into the three phases, “upstream”, “core”, and “downstream”, are as follows:
  • the “upstream” phase included:
    the extraction of raw materials and their transformation;
    the transport of raw materials and semi-finished products to suppliers;
    the production of consumables, i.e., chemicals (detergents), textiles (fringes and cloths), accessories used, and their primary (plastic) and secondary (cardboard) packaging;
    the production of capital goods, or goods whose expected lifetime exceeds 3 years, i.e., machinery and equipment.
  • The “core” phase included:
    the transport of consumables from producers to the building where the cleaning service is provided;
    the implementation of the service through the use of chemical and textile products, equipment, and machinery;
    the production of fuels needed for transport;
    the production of electrical and thermal energy used in the building for the implementation of the service;
    water consumption for the dilution of chemical products and by washing machine.
  • The “downstream” phase included:
    the transport and treatment of solid waste and of waste water generated by the processes of the “core” phase.
The Impact Assessment methodology is implemented through the calculation of the Global Warming Potential (GWP) impact category, based on the model created by the Intergovernmental Panel on Climate Change (IPCC). This model evaluates the contribution to the increase in the greenhouse effect of some gases present in the atmosphere (namely CO2, CH4, N2O, SF6, HFCs, PFCs), correlating the quantity emitted to the category indicator “kg CO2 equivalent”, through the use of the specific characterization factor. This factor varies according to the substance efficacy in influencing the radiative forcing and its average residence time in the atmosphere, allowing to relate the GWP of each substance to the GWP of CO2, set equal to 1. The time threshold considered is one hundred years and the characterization factors refer to the 5th IPCC Report of 2014. The total impact score is obtained by adding together the contributions of each substance once translated into kg CO2-equivalent.

2.7. Statistical Analysis

Data were analyzed using Graphpad Prism (Graphpad software). Statistical analysis was performed using one-way ANOVA followed by Dunnett’s multiple comparisons test with GraphPad Prism version 9.0.0 for MacOS (GraphPad Software, San Diego, CA, USA).

3. Results and Discussion

The use of chemical-based disinfectants and detergents has increased in recent years, due to resistant pathogens, and even more during the COVID-19 outbreak, regardless of their toxicity to both humans and the environment and recontamination. A wide number of new sustainable approaches has been proposed lately, in order to reduce the use of these kind of disinfectants: Matsuura et al. in fact proposed the use of a photocatalytic reaction of titanium dioxide (TiO2) to disinfect hospital surfaces (TiO2 photocatalyst), reducing the use of chemicals; Rutala et al. showed that a continuous active disinfection, accomplished by the use of a novel eco-labeled disinfectant (EPA registered as Firebird F130), led to a 5-log10 reduction against different strains of pathogenic bacteria; Shu et al. proposed the use of nano-formulations of zinc oxide from green synthesis, achieving a higher antimicrobial activity when compared to the chemical-based synthesis [7,29,30].
Nevertheless, performance standards for green cleaning products must be approved and certified by certifying organizations such as Ecolabel or EPA Safer choice. The most common ingredients present in the tested green sanitizing products are hydrogen peroxide, citric acid, and non-ionic surfactants, which are all considered being safer antimicrobials than the chemicals used in traditional cleaning products.

3.1. Cleaning Effectiveness

The “GREEN” experimental protocol using 100% natural and biodegradable products in combination with the use of cloths and mops in disposable microfiber, in the sanitization procedures of hospital areas at a medium-high health risk, was found to be a technique of relevant interest. The experimental system has proved, within the limits of the sampling carried out, that the performance is in line with the traditional system. The limit of acceptability of the sanitization treatment is established by the guidelines used and is the numerical value of grown microorganisms (expressed in Colony Forming Units) per cm2, above which the sanitization treatment must be considered unacceptable.
All the sampled spaces were found acceptably sanitized: in fact, all spaces resulted in being acceptably cleaned, and the TG has always been comparable (if not better) to the TT with every technique used. Data are reported in the Supplementary Material file, from Supplementary Material Figures S1–S8.
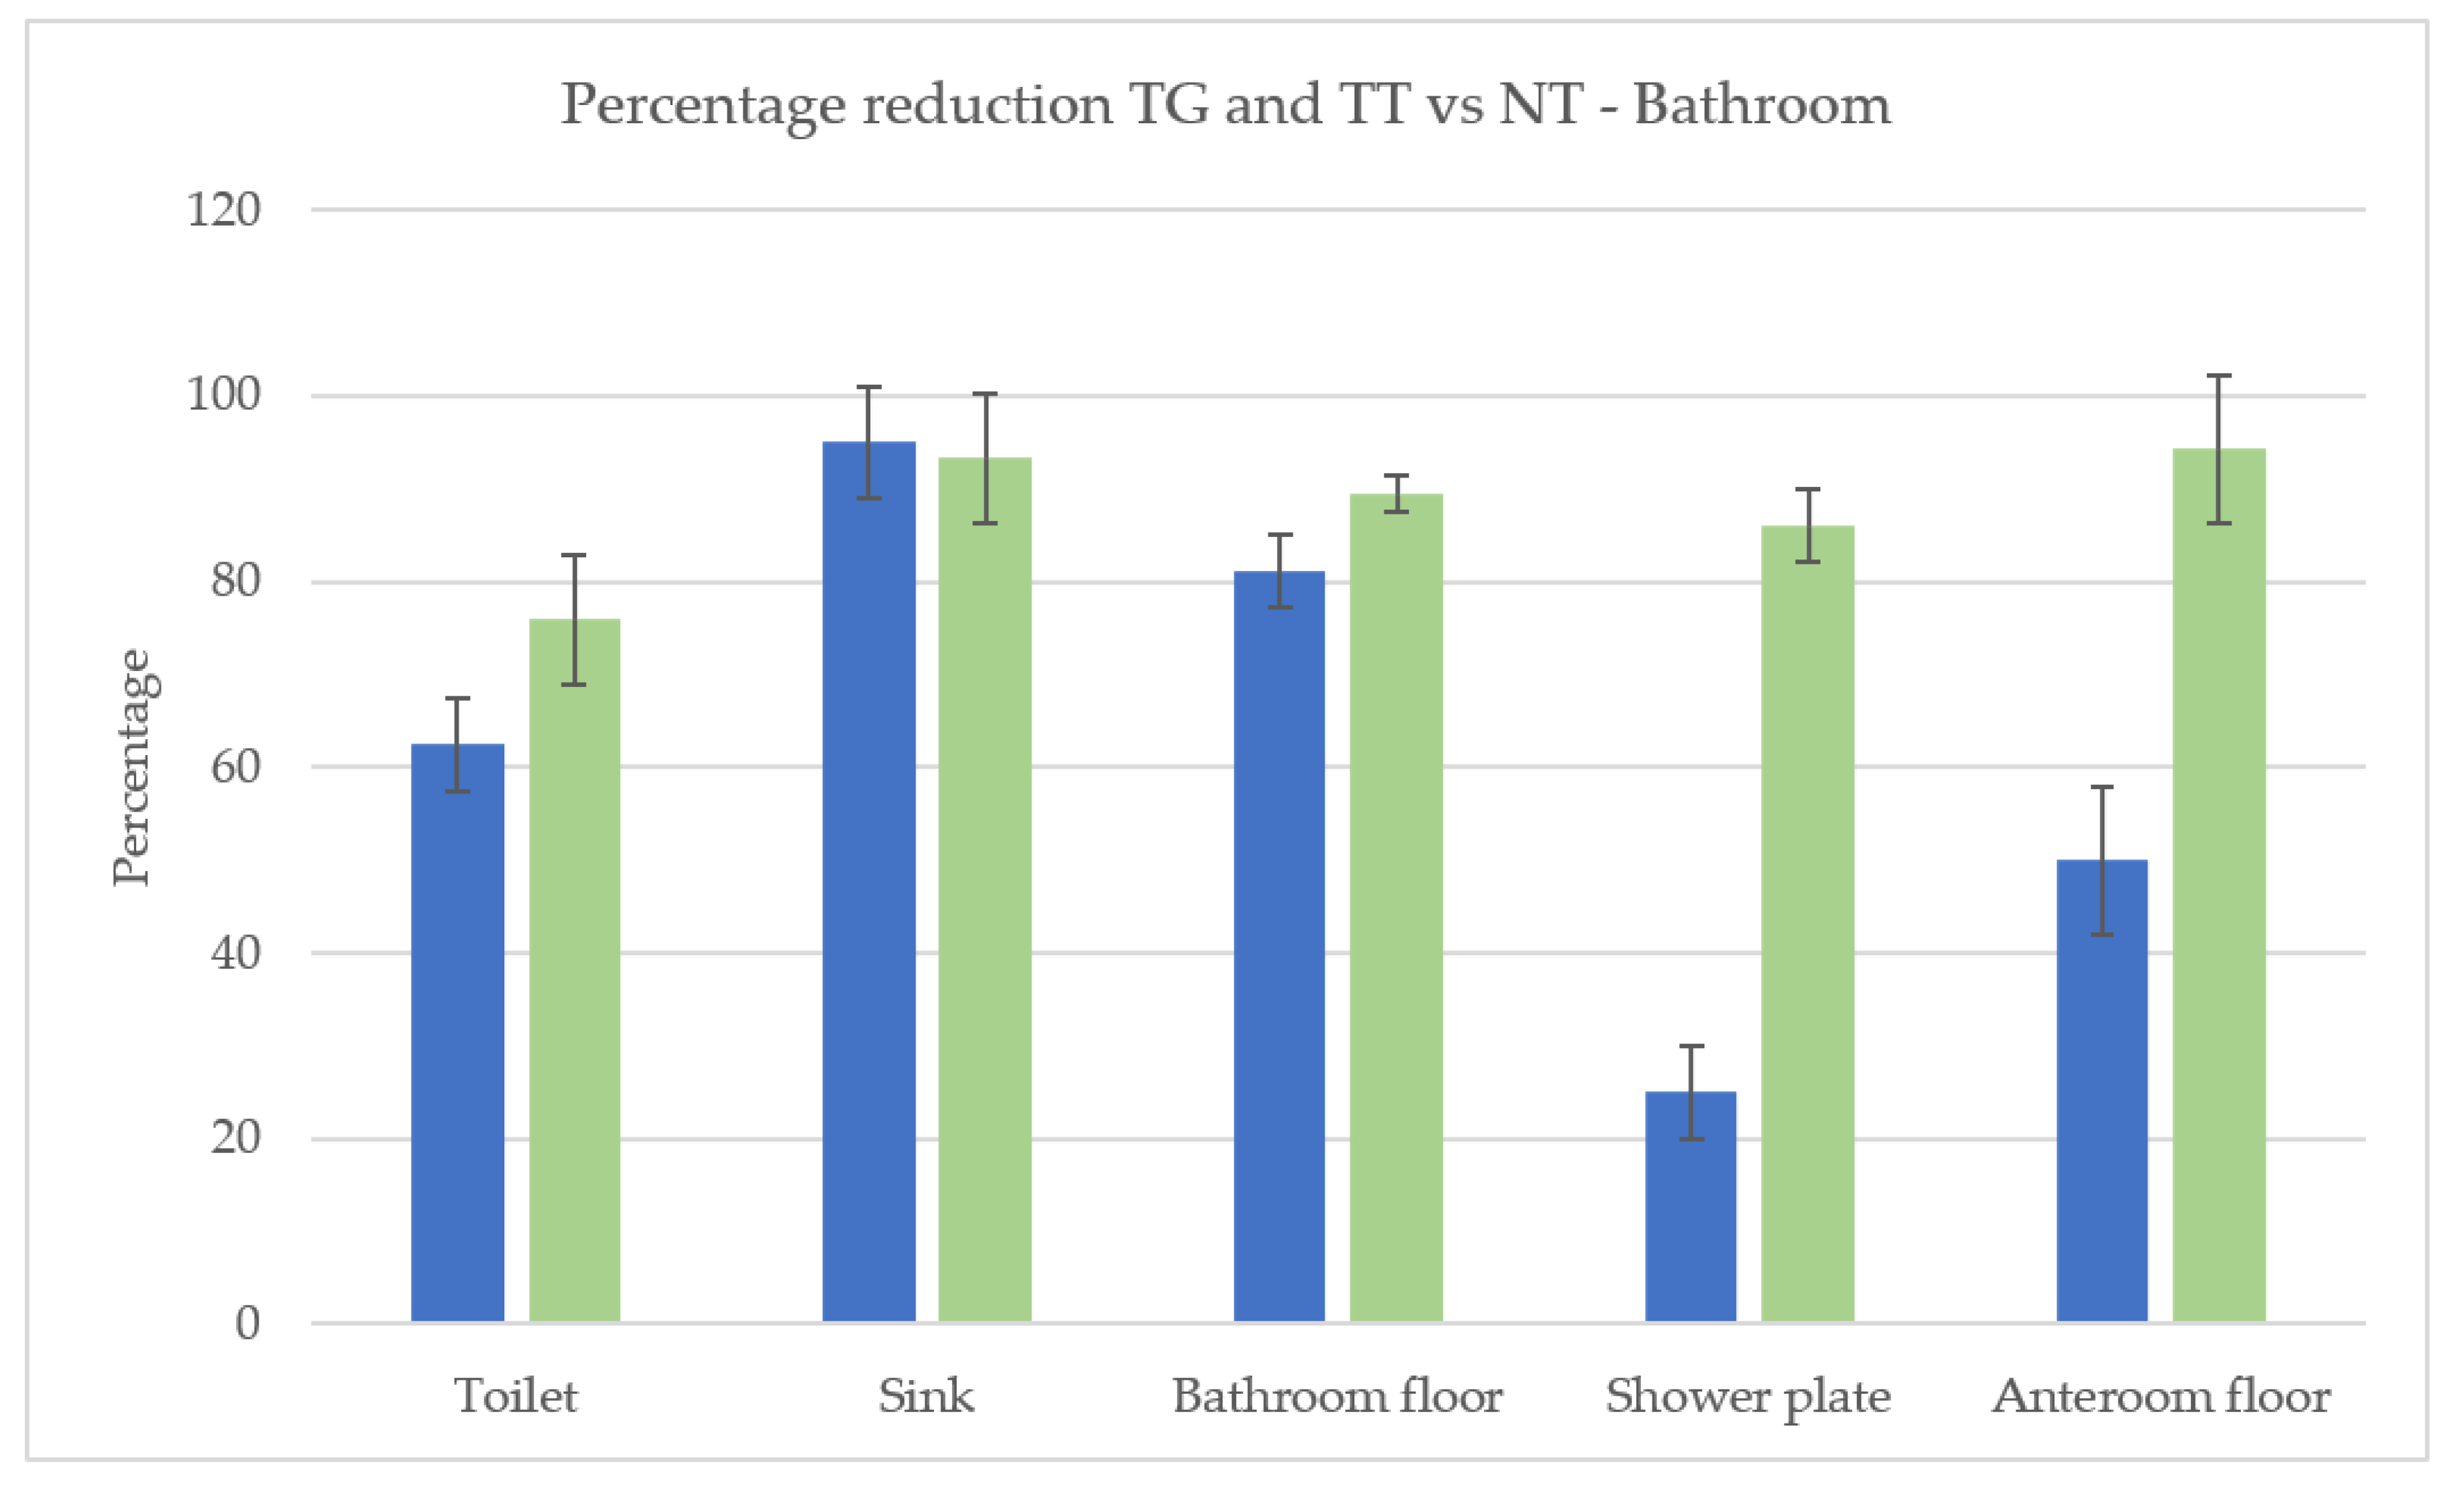
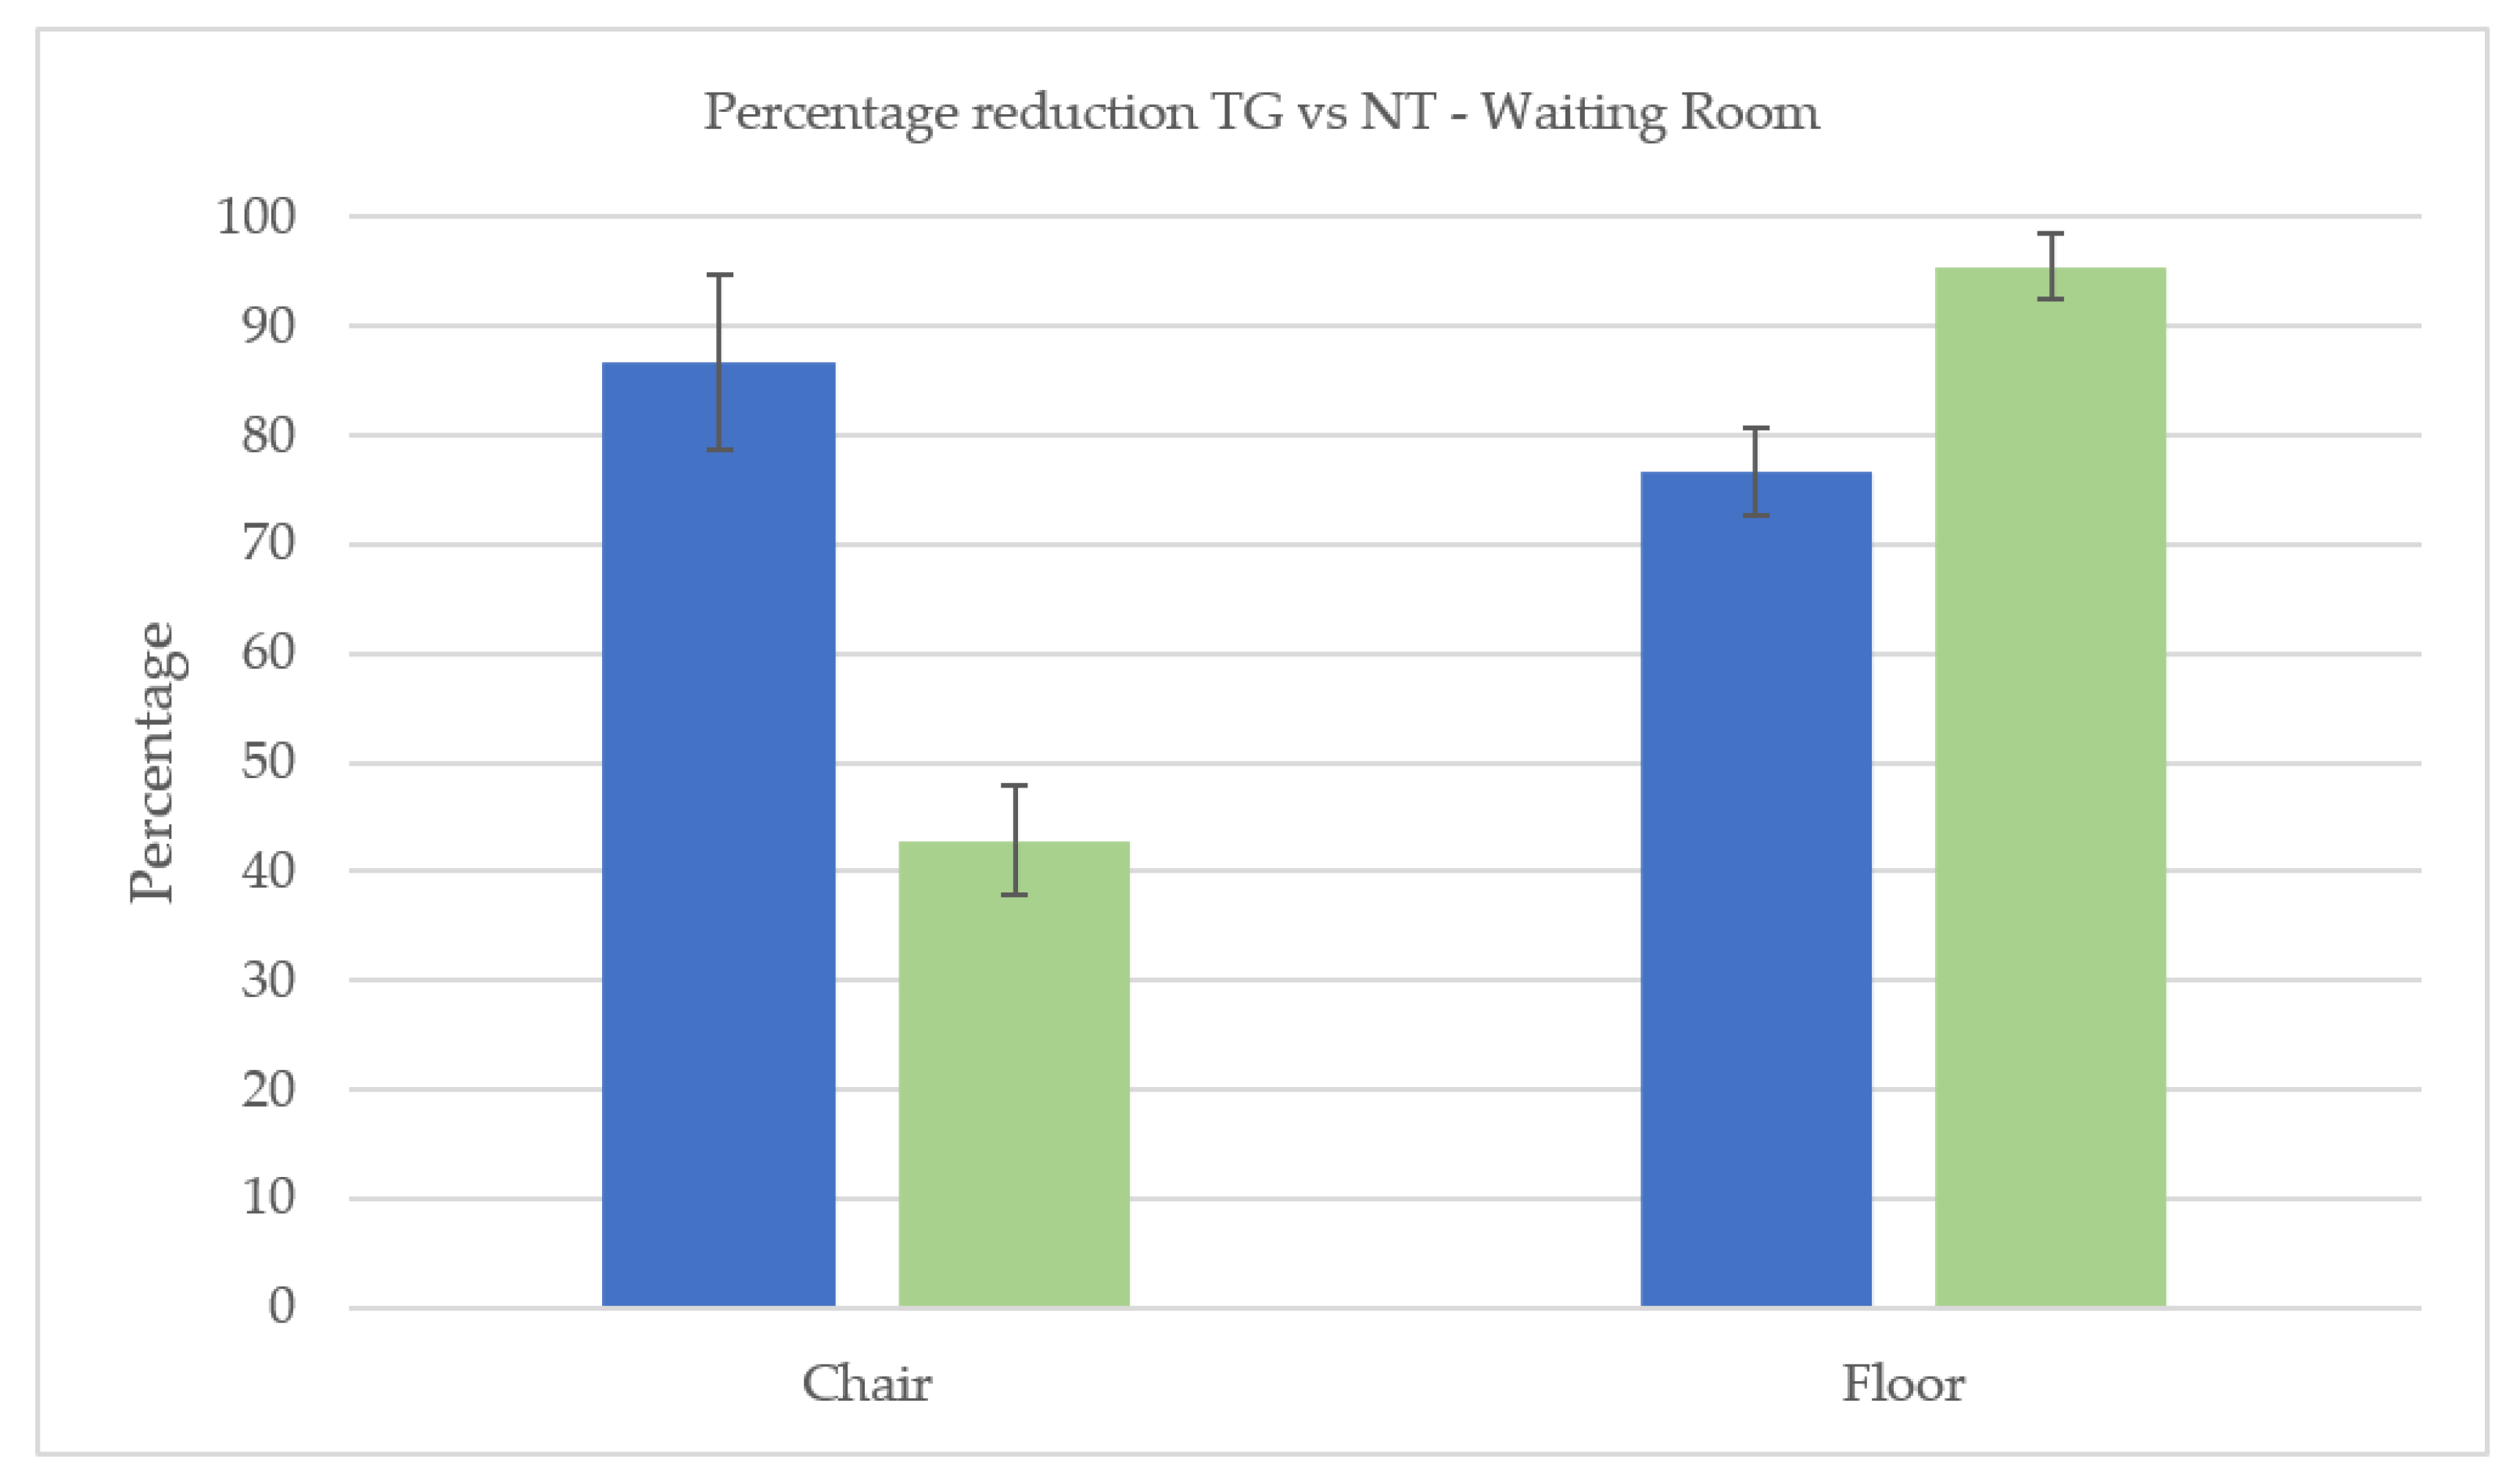
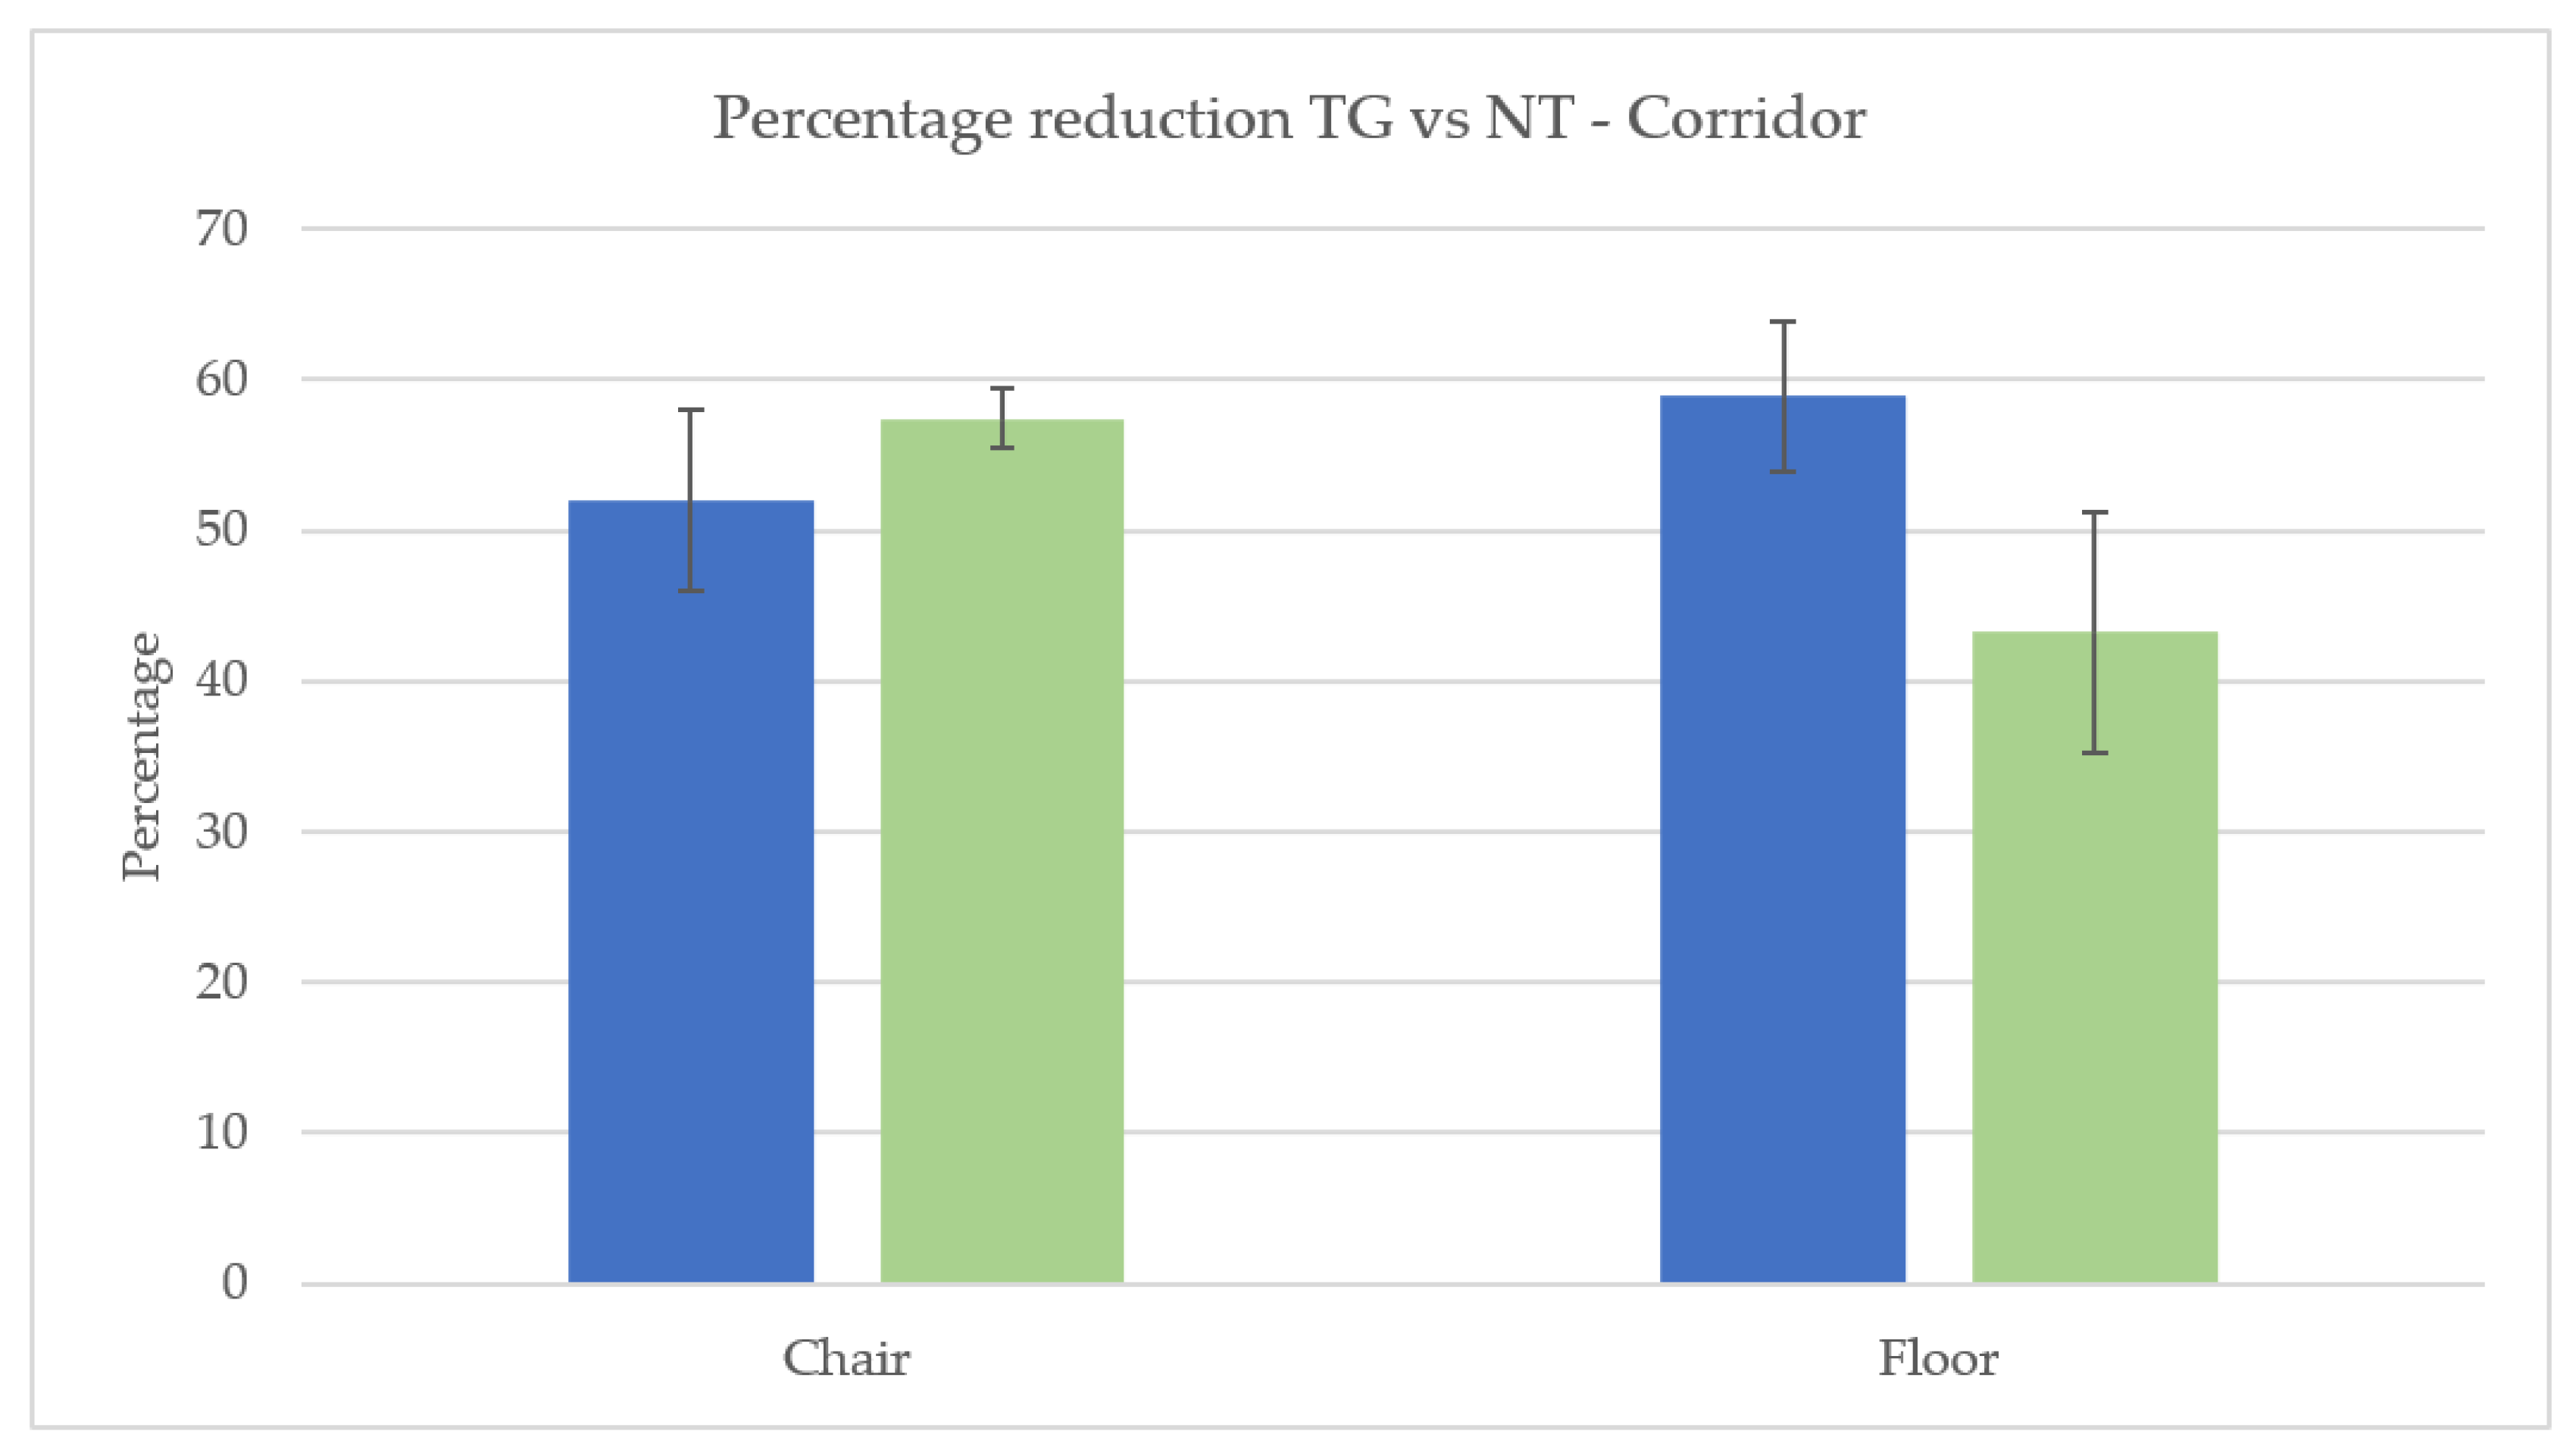
It must be noted that the variability in the number of microorganisms present in the various environments is subject to the variability of use and of patients who have frequented the environment. Therefore, the data to be evaluated is the microbial abatement (or percentage reduction) between pre-treatment (NT) and post-treatment (TT or TG).
The percentage reduction (TT and TG vs. NT) of sampled bacteria with swabs and total bacterial RODAC count plates on Tryptic Soy Agar (TSA) are subsequently reported in Figure 1, Figure 2, Figure 3 and Figure 4.

3.2. Microbial Isolation and Identification

The different spaces were sampled and titled in selective Mannitol Salt Agar soils for the isolation of Staph. aureus (MSA), MacConkey Agar for Enterococci Isolation (MCA), Sabouraud Dextrose Agar for Mold and Yeast Isolation (SDA), and Clostridium difficile Agar Base for Clostridium Isolation (CDBA). The results did not reveal the presence of pathogenic microorganisms Staph. aureus, C. albicans, E. coli, A. niger, and C. difficilis. From the biochemical API Tests (Biomerieux), the following microorganisms have been isolated and identified, mainly:
-
Staph. hominis (27)
-
Staph. cohnii ssp. Cohnii (6)
-
Staph. sciuri (2)
-
Staph. capitis (15)
-
Aerococcus urinae (11)
-
S. agalactiae (3)
-
Lactococcus lactis spp. Cremoris (2)
-
Aerococcus viridans (4)

3.3. LCA Analysis

The comparative LCA analysis showed that TG permits avoiding 0.168 kg of CO2e every year compared to the TT for each square meter of cleaned surface. This means that every year the application of “GREEN” protocol to the entire hospital would allow a quantity of avoided emissions equal to 4.53 tons of CO2e.
The most significant reduction in absolute terms is associated with the electricity consumption of the laundry cycles. The washing at 60 °C associated with the laundry product system guarantees a high level of microbiological hygiene while allowing a reduction of emissions by 51.8% compared to the “Traditional” 90 °C program. Another factor contributing to energy consumption reduction, albeit to a lesser extent, is the use of the latest generation fringes and cloths in TG, lighter than the equipment used in TT.
The greatest contribution to impact reduction from textiles is both the lower impact per piece in the production and end-of-life phases, and the longer duration of the dusting cloths. Overall, the textiles of the “GREEN” protocol allow for a saving of 44.4% compared to those of the “Traditional” protocol.
A third significant contribution comes from the use of more concentrated cleaning chemicals, and are therefore more effective than those used in TT when the same mass is compared. The lower consumption allows for a saving of greenhouse gas emissions equal to 26%.
Finally, a further contribution is made by lower consumption of laundry chemicals for washing and pre-impregnating textiles. The difference between the two protocols in this specific aspect is of 23.5% in favor of the TG.

4. Conclusions

The main benefit of using eco-friendly cleaning products is that they are better for the environment: they are designed to have environmentally friendly properties such as biodegradability, low toxicity, and lower concentrations of use, ensuring the effectiveness of cleaning. The LCA comparative analysis study found that the Green Protocol, implemented at the Hospital Santa Maria della Scaletta in Imola, allows for reducing the carbon footprint due to the reduced electricity consumption, longer duration of cloths, and higher concentrated chemicals, when compared to a Traditional Protocol.
From the data obtained and reported above it can be stated that “traditional” and “GREEN” protocols have had good performance in terms of sanitizing effectiveness and CO2e. From the CAM requirements, the “GREEN” protocol must give equal or better results than the traditional protocol. Following the analysis carried out, it can be concluded that the “GREEN” experimental system meets this criterion and has shown better performance than the “traditional” system regarding the antimicrobial activity and always within the threshold (all findings are in an acceptable state of sanitation). Is noteworthy that the antimicrobial decontamination was accompanied by avoiding 0.168 kg of CO2e every year for each square meter of cleaned surface. This means that every year, the application of “GREEN” protocol to the entire hospital would allow a quantity of avoided emissions equal to 4.53 tons of CO2e.

Supplementary Materials

The following supporting information can be downloaded at: https://www.mdpi.com/article/10.3390/su141811465/s1, Supplementary Materials—Hospital cleaning regimes evaluation.

Author Contributions

Conceptualization, P.M., R.F., M.B., C.B. and L.V.; methodology, P.M., R.F. and M.B.; investigation, R.F., M.M., G.T. and B.B.; resources, P.M. and C.B.; data curation, R.F. and M.M.; writing—original draft preparation, R.F., M.M. and L.V.; writing—review and editing, P.M.; supervision, P.M.; project administration, P.M.; funding acquisition, P.M. All authors have read and agreed to the published version of the manuscript.

Funding

This research was funded by Consorzio Stabile CMF Via Bolzano, 59 38121 Trento (TN) and The APC was funded by Consorzio Stabile CMF Via Bolzano, 59 38121 Trento (TN).

Institutional Review Board Statement

Not applicable.

Informed Consent Statement

Not applicable.

Data Availability Statement

Not applicable.

Acknowledgments

We would like to thank all the hygiene operators at the Santa Maria della Scaletta Hospital that helped with measurements of product, water, and energy consumption and, in particular: Iannacone Giuseppina, Ulani Manuela, Sagrini Roberta, Spalluto Simona, Grillo Margherita, Calogero Giusi, and Cagnazzi Loretta.

Conflicts of Interest

The authors declare no conflict of interest. The funders had no role in the design of the study; in the collection, analyses, or interpretation of data; in the writing of the manuscript; or in the decision to publish the results.

References

  1. Mensah, J. Sustainable development: Meaning, history, principles, pillars, and implications for human action: Literature review. Cogent Soc. Sci. 2019, 5, 1653531. [Google Scholar] [CrossRef]
  2. Mahmud, R.; Moni, S.M.; High, K.; Carbajales-Dale, M. Integration of techno-economic analysis and life cycle assessment for sustainable process design–A review. J. Clean. Prod. 2021, 317, 128247. [Google Scholar] [CrossRef]
  3. Helling, R.K. The Role of LCA in Sustainable Development. In Encyclopedia of Sustainable Technologies; Abraham, M.A., Ed.; Elsevier: Oxford, UK, 2017; pp. 237–242. [Google Scholar] [CrossRef]
  4. 302 Final Communication from the Commission to the Council and the European Parliament Integrated Product Policy Building on Environmental Life-Cycle Thinking. Available online: http://europa.eu.int/comm/environment/ipp/ippsum.pdf (accessed on 10 August 2022).
  5. Friedrich, A.W. Control of hospital acquired infections and antimicrobial resistance in Europe: The way to go. Wien. Med. Wochenschr. 2019, 169, 25–30. [Google Scholar] [CrossRef] [PubMed]
  6. Kraemer, S.A.; Ramachandran, A.; Perron, G.G. Antibiotic Pollution in the Environment: From Microbial Ecology to Public Policy. Microorganisms 2019, 7, 180. [Google Scholar] [CrossRef] [PubMed]
  7. Saif, M.S.; Zafar, A.; Waqas, M.; Hassan, S.G.; Haq, A.U.; Tariq, T.; Batool, S.; Irshad, M.; Hasan, M.; Shu, X. Phyto-reflexive Zinc Oxide Nano-Flowers Synthesis: An advanced Photocatalytic Degradation and Infectious therapy. J. Mater. Res. Technol. 2021, 13, 2375–2391. [Google Scholar] [CrossRef]
  8. Zafar, A.; Tariq, T.; Hasan, M.; Nazar, M.; Rasheed, M.N.; Mahmood, N.; Shu, X. Green-maturation of Cobalt-Oxide nano-sponges for reinforced bacterial apoptosis. Colloids Interface Sci. Commun. 2021, 45, 100531. [Google Scholar] [CrossRef]
  9. Henry, K.; Baronian, K.; Morris, M.; Galilee, C. Comparing the Current Chemical Cleaning Regime and Chemical-Free Cleaning at the University of Canterbury: A Report and Practical Microbiological Experiment for the Sustainability Office, University of Canterbury. 2011. Available online: https://www.canterbury.ac.nz/media/documents/sustain/Comparing_Chemical_and_Non_Chemical_Cleaning.pdf (accessed on 10 August 2022).
  10. Boyce, J.M. Modern technologies for improving cleaning and disinfection of environmental surfaces in hospitals. Antimicrob. Resist. Infect. Control 2016, 5, 10. [Google Scholar] [CrossRef] [PubMed]
  11. Exner, M.; Bhattacharya, S.; Gebel, J.; Goroncy-Bermes, P.; Hartemann, P.; Heeg, P.; Ilschner, C.; Kramer, A.; Ling, M.L.; Merkens, W.; et al. Chemical disinfection in healthcare settings: Critical aspects for the development of global strategies. GMS Hyg. Infect. Control. 2020, 15, 36. [Google Scholar]
  12. La Contaminazione Microbiologica Delle Superfici Negli Ambienti Lavorativi. 2017. Available online: www.inail.it (accessed on 10 August 2022).
  13. Linee Guida Sugli Standard di Sicurezza e di Igiene del Lavoro nel Reparto Operatorio Istituto Superiore per LA Prevenzione e la Sicurezza del Lavoro Dipartimento Igiene del Lavoro. Available online: http://www.ispesl.it (accessed on 10 August 2022).
  14. Dancer, S. How do we assess hospital cleaning? A proposal for microbiological standards for surface hygiene in hospitals. J. Hosp. Infect. 2004, 56, 10–15. [Google Scholar] [CrossRef] [PubMed]
  15. Galvin, S.; Dolan, A.; Cahill, O.; Daniels, S.; Humphreys, H. Microbial monitoring of the hospital environment: Why and how? J. Hosp. Infect. 2012, 82, 143–151. [Google Scholar] [CrossRef]
  16. Flouchi, R.; Elmniai, A.; El Far, M.; Touzani, I.; El Hachlafi, N.; Fikri-Benbrahim, K. Microbiological Monitoring of the Environment Using the “Association Rules” Approach and Disinfection Procedure Evaluation in a Hospital Center in Morocco. J. Environ. Public Health 2021, 2021, 7682042. [Google Scholar] [CrossRef] [PubMed]
  17. Griffith, C.; Obee, P.; Cooper, R.; Burton, N.; Lewis, M. The effectiveness of existing and modified cleaning regimens in a Welsh hospital. J. Hosp. Infect. 2007, 66, 352–359. [Google Scholar] [CrossRef]
  18. Griffith, C.; Cooper, R.; Gilmore, J.; Davies, C.; Lewis, M. An evaluation of hospital cleaning regimes and standards. J. Hosp. Infect. 2000, 45, 19–28. [Google Scholar] [CrossRef]
  19. Nilsen, S.K.; Dahl, I.; Jhrgensen, O.; Schneider, T. Micro-Fibre and Ultra-Micro-Fibre Cloths, their Physical Characteristics, Cleaning Effect, Abrasion on Surfaces, Friction, and Wear Resistance. 2002. Available online: www.elsevier.com/locate/buildenv (accessed on 2 August 2022).
  20. Smith, D.; Gillanders, S.; Holah, J.; Gush, C. Assessing the efficacy of different microfibre cloths at removing surface micro-organisms associated with healthcare-associated infections. J. Hosp. Infect. 2011, 78, 182–186. [Google Scholar] [CrossRef]
  21. Glover, R.E.; Smith, R.R.; Jones, M.V.; Jackson, S.K.; Rowlands, C.C. An EPR investigation of surfactant action on bacterial membranes. FEMS Microbiol. Lett. 1999, 177, 57–62. [Google Scholar] [CrossRef]
  22. Falk, N.A. Surfactants as Antimicrobials: A Brief Overview of Microbial Interfacial Chemistry and Surfactant Antimicrobial Activity. J. Surfactants Deterg. 2019, 22, 1119–1127. [Google Scholar] [CrossRef]
  23. Copello, G.; Teves, S.; Degrossi, J.; D’Aquino, M.; Desimone, M.; Díaz, L.E. Proving the antimicrobial spectrum of an amphoteric surfactant-sol-gel coating: A food-borne pathogen study. J. Ind. Microbiol. Biotechnol. 2008, 35, 1041–1046. [Google Scholar] [CrossRef] [PubMed]
  24. Cabassud, A.C.; Aptel, P. Bactericidal Properties of Peracetic Acid and Hydrogen Peroxide, Alone and in Combination, and Chlorine and Formaldehyde against Bacterial Water Strains. Available online: www.nrcresearchpress.com (accessed on 2 August 2022).
  25. ISO 14040:2006; Environmental Management—Life Cycle Assessment—Principles and Framework. ISO: Geneva, Switzerland, 2018. Available online: https://www.iso.org/standard/37456.html (accessed on 10 August 2022).
  26. ISO 14044:2006; Environmental Management—Life Cycle Assessment—Requirements and Guidelines. ISO: Geneva, Switzerland, 2018. Available online: https://www.iso.org/standard/38498.html (accessed on 10 August 2022).
  27. ISO 14067:2018; Greenhouse Gases—Carbon Footprint of Products—Requirements and Guidelines for Quantification. 27. ISO: Geneva, Switzerland, 2018. Available online: https://www.iso.org/standard/71206.html (accessed on 10 August 2022).
  28. Product Category Rules Construction Products and Construction Services 2012:01, Version 2.2; Environdec (Stockholm, Sweden). 2017. Available online: www.environdec.com (accessed on 10 August 2022).
  29. Rutala, W.A.; Gergen, M.F.; Sickbert-Bennett, E.E.; Anderson, D.J.; Weber, D.J.; CDC Prevention Epicenters Program. Antimicrobial activity of a continuously active disinfectant against healthcare pathogens. Infect. Control Hosp. Epidemiol. 2019, 40, 1284–1286. [Google Scholar] [CrossRef] [PubMed]
  30. Matsuura, R.; Lo, C.-W.; Wada, S.; Somei, J.; Ochiai, H.; Murakami, T.; Saito, N.; Ogawa, T.; Shinjo, A.; Benno, Y.; et al. SARS-CoV-2 Disinfection of Air and Surface Contamination by TiO2 Photocatalyst-Mediated Damage to Viral Morphology, RNA, and Protein. Viruses 2021, 13, 942. [Google Scholar] [CrossRef] [PubMed]
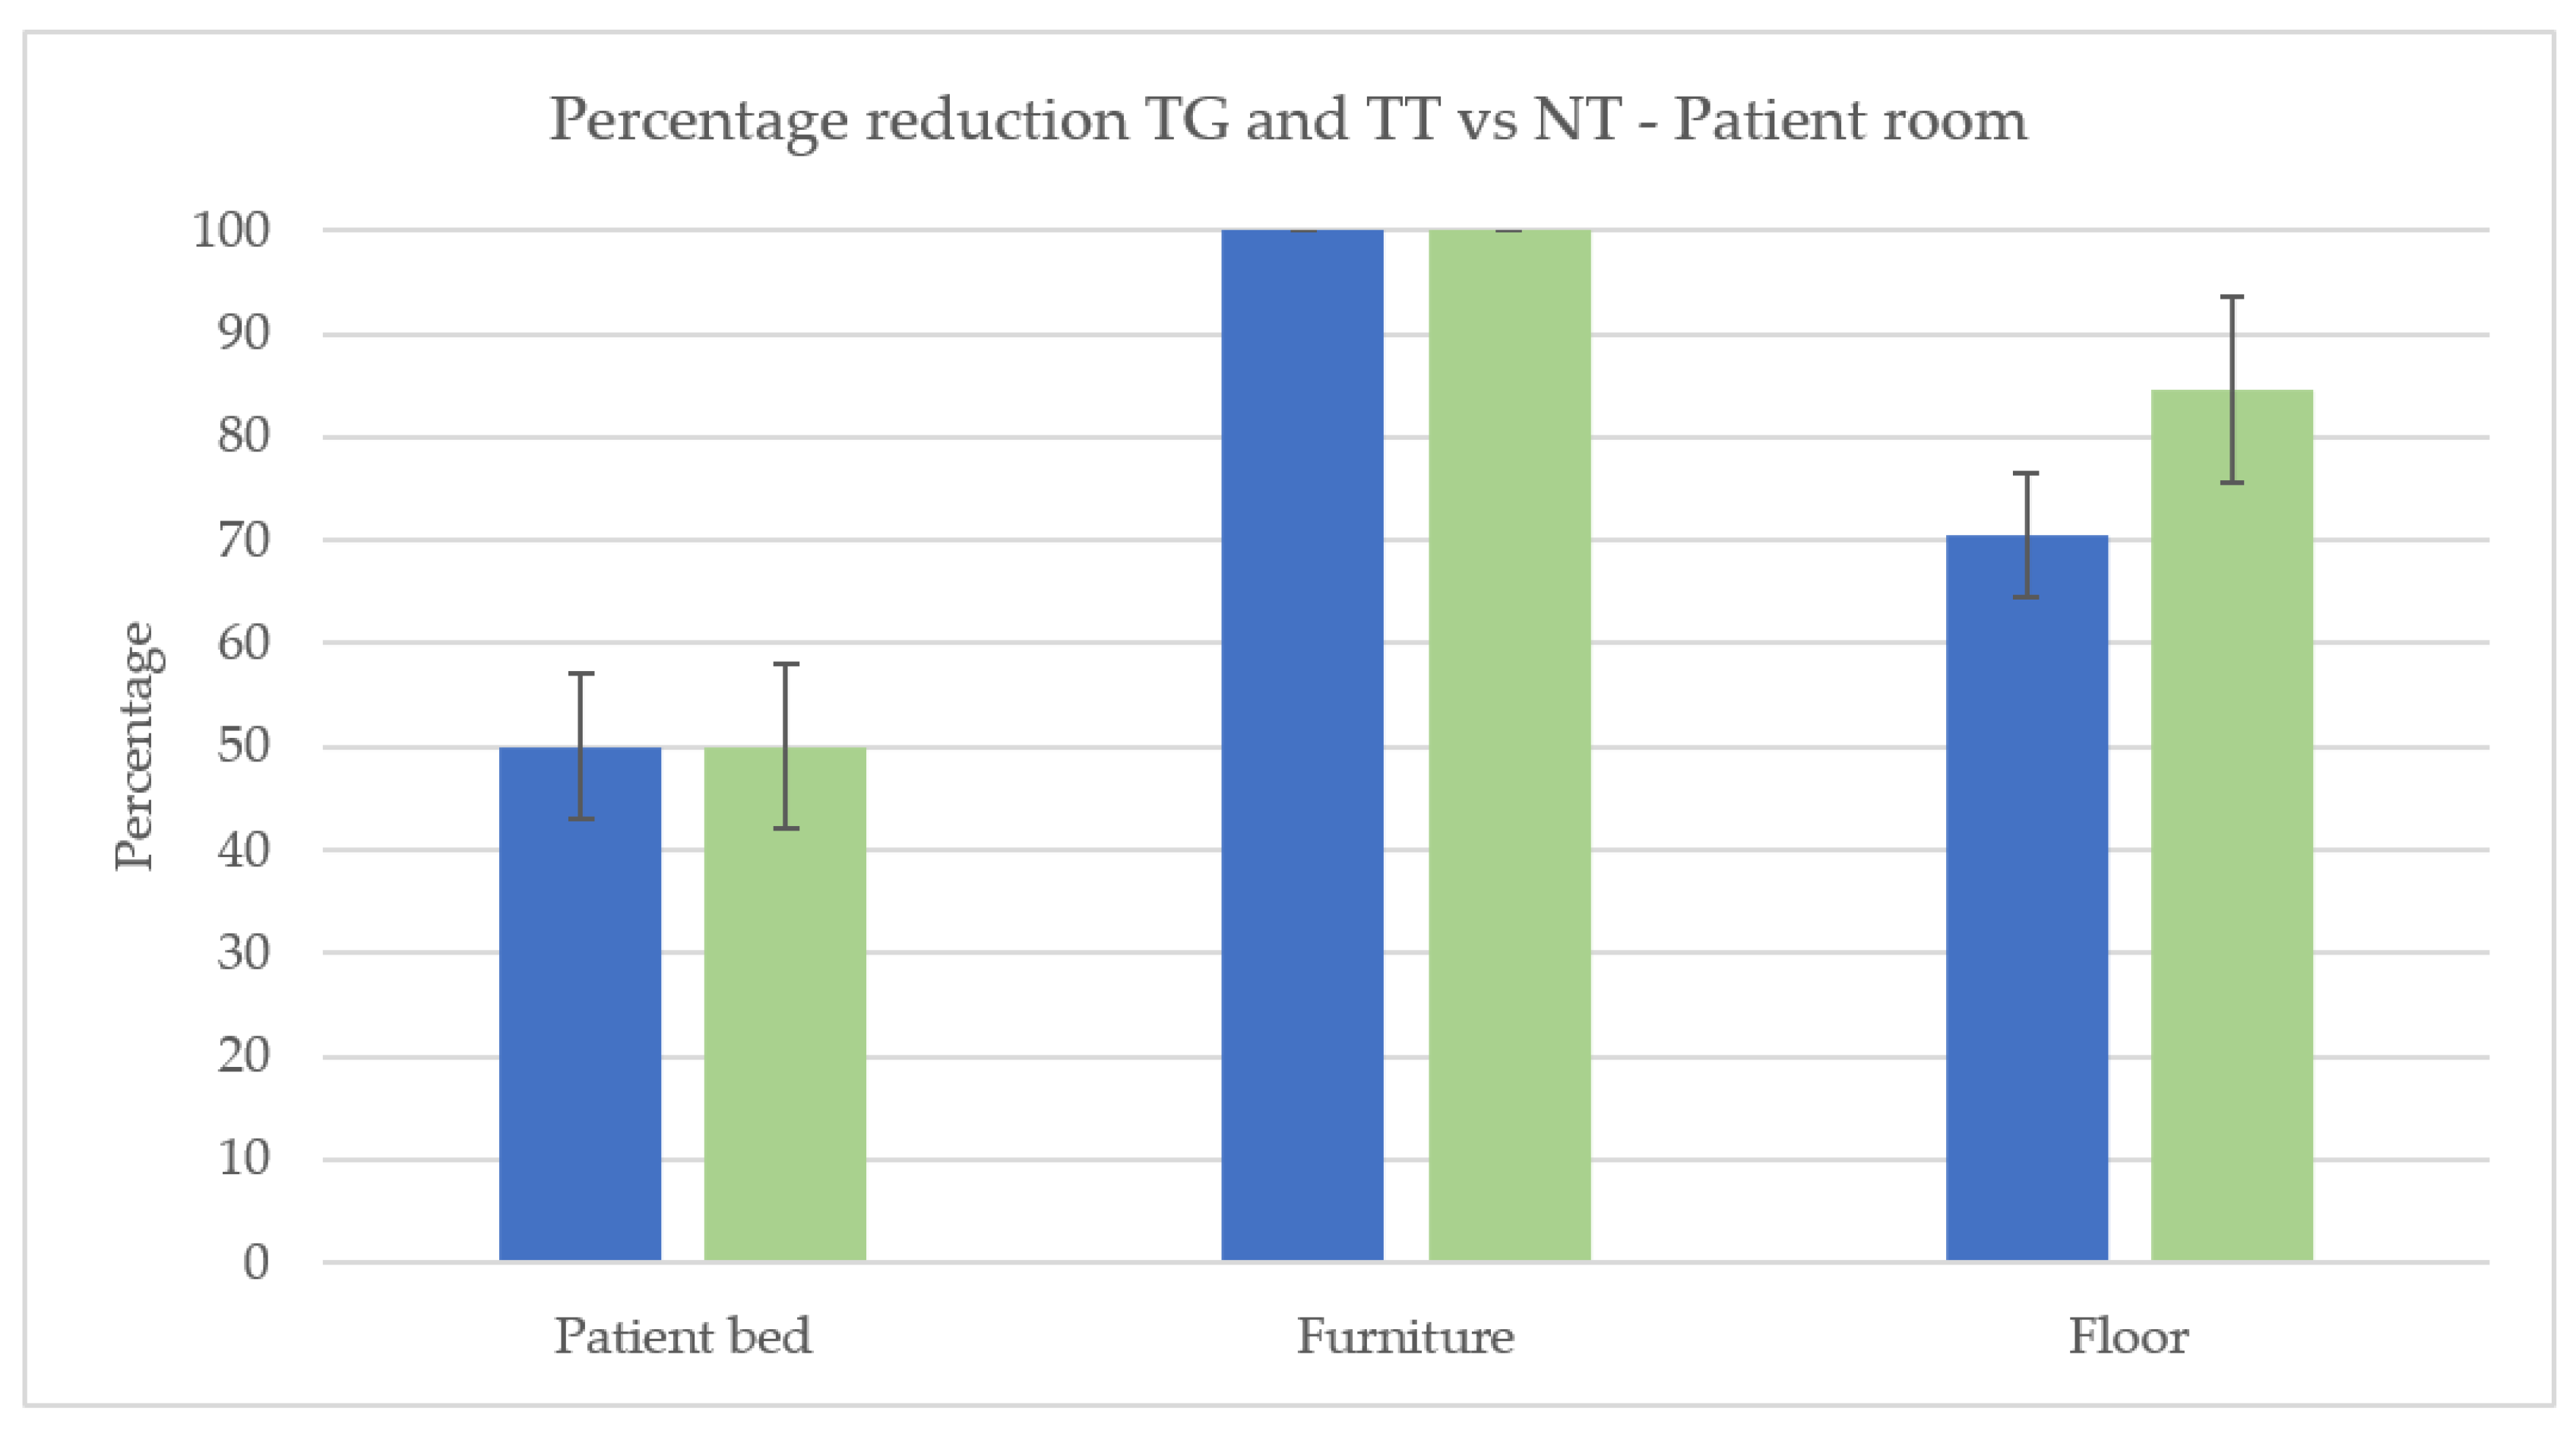
Figure 1. Percentage reduction of Untreated vs. Treated (TT in blue and TG in green)—Patient room area. Data are the mean of 2 independent experiments performed on triplicate (mean +/− standard deviation), and values are represented as a percentage.
Sustainability 14 11465 g001
Figure 2. Percentage reduction of Untreated vs. Treated (TT in blue and TG in green)—Bathroom area. Data are the mean of 2 independent experiments performed on triplicate (mean +/− standard deviation), and values are represented as a percentage.
Sustainability 14 11465 g002
Figure 3. Percentage reduction of Untreated vs. Treated (TT in blue and TG in green)—Waiting room area. Data are the mean of 2 independent experiments performed on triplicate (mean +/− standard deviation), and values are represented as a percentage.
Sustainability 14 11465 g003
Figure 4. Percentage reduction of Untreated vs. Treated (TT in blue and TG in green)—Corridor room. Data are the mean of 2 independent experiments performed on triplicate (mean +/− standard deviation), and values are represented as a percentage.
Sustainability 14 11465 g004
Publisher’s Note: MDPI stays neutral with regard to jurisdictional claims in published maps and institutional affiliations.