1. Introduction
With the rapid development of the social economy, the demand on mineral resources is increasing. The environmental problems caused by mining are extremely serious. Engineering and ecological measures should be taken to ensure slope stability and restore ecological effectiveness [
1,
2,
3]. The waste dump formed by loose residue is one of the regions in the mining area with fragile geotechnical and ecological characteristics. This type of accumulation satisfies the stress balance at the initial stage and gradually forms a high-steep slope after being dumped, which is prone to accumulate and swell at the foot of the slope, causing a failure trend along the slope, resulting in safety hazards [
4,
5]. These geotechnical issues pose a substantial risk to both people and property. Therefore, slope failure-caused natural disasters, such as landslides and debris flows, should be recognized as an unavoidable focus of ecological rehabilitation.
Rainfall is an important factor inducing landslides, which will cause seepage and decreased soil strength [
6,
7]. The study of unsaturated soil seepage began in 1936. Terzaghi [
8] first explored and studied the principle of effective stress. The total stress of saturated soil is calculated using
=
+
u, where
is the total stress of saturated soil,
u is the pore water pressure, and
is the effective stress.
Many phenomena are related to unsaturated soil seepage in natural conditions, such as sudden rainfall leading to landslides, collapse, etc. These disasters pose a grave threat to human and animal lives; therefore, it is essential to study the scientific issues involved. Bishop [
9] and Fredlund [
10] created the famous formula regarding unsaturated soil shear strength.
The effect of immersed rainfall on the slope stress and strain is extremely complicated. Unsaturated seepage causes an increase in the soil saturation levels in the unsaturated zone, which reduces the soil shear strength and causes slope instability [
11]. Xue et al. [
12] conducted a long-duration rainfall test. They observed the distribution of pore water pressure to investigate the slope deformation and analyzed the impact of permeability on the slopes. The results showed that the increase in the total infiltration in the slope soil led to the increase in pore water pressure if the rainfall time increased, which had a negative impact on slope stability.
A previous study by Hou et al. [
13] showed that rainfall-induced shallow landslides usually occur above the bottom of the wetting front or below the groundwater level during the infiltration process. The suction is a key factor during infiltration, which not only affects the soil permeability coefficient, but also changes the saturation of the soil. The suction set up a bridge between the stress field and the seepage field [
14,
15,
16]. Singh et al. [
17] pointed out that steeper slopes are better from an economic viewpoint; however, they are prone to damage. Karlis et al. [
18] integrated a physical-based hydrogeological model into the slope stability simulation to identify the landslide possibility due to hydrogeological conditions. Tu et al. [
19] used the strength reduction theory to analyze slope stability. They deduced the energy balance equations according to the energy conservation law and then verified the reliability of the balance equations via two-dimensional and three-dimensional models. Ozbay et al. [
20] applied the limit equilibrium theory and the finite element method to numerically analyze the formation of a landslide. Liu et al. [
21] obtained the safety factor and the critical sliding surface by comparing the limit equilibrium method (LEM) with two finite element methods, i.e., the enhanced limit strength method (ELSM) and strength reduction method (SRM).
The existing slope stability research, based on the fluid–solid coupling theory, has mainly been explored on the slopes in China’s central and eastern provinces which are exposed to significant natural rainfall. The dump slopes in the arid desertification area of northwest China consist of artificial deposits with large heights and angles. These types of deposits are made up of loose material, and the region has a low rainfall rate. For this reason, the impact of rainfall on the dump slope stability was often ignored. However, a once-in-a-century heavy rainfall occurred in Wuhai City, Inner Mongolia, China, in September 2018. Sudden heavy rainfall caused multiple collapses and landslides in the dump slopes of the study region. Due to the lack of land resources in this region, ultra-high stacking during the dumping increased the complexity of the slope safety evaluation. The safety threshold of rainfall is still unknown, and there are few studies on the slope stability of the dump under seepage. Because of this, the effect of steep dump slope on slope stability is deserving of research.
This paper combined the seepage theory and the geotechnical mechanics theory. A balanced equation was established regarding the interaction mechanism between seepage field and stress field. The mechanical response mechanism was investigated. ABAQUS finite element software was used to numerically investigated the factors of maximum storm intensity and rainfall duration. The effects of the maximum rainfall and the initial water content of the slope on slope stability were discussed. The variation laws of key-point deformation, pore water pressure, equivalent plastic strain, and safety factor were obtained by the numerical calculation. Finally, the failure mechanism of the slope was revealed. In order to reduce this damage, the simulation study of the maximum rainfall for the high-steep slope was carried out under different initial water contents and compared to the case of the standard slope. The stability of the high-steep dumps and standard slopes was discussed.
2. Seepage Theory of Unsaturated Soil
2.1. Permeability Function
In unsaturated soils, suction is an important parameter that affects the permeability coefficient and saturation. Van Genuchten proposed the classic VG model for suction in 1980 [
22].
where
ω,
ωs, and
ωr are the mass fraction of water, water under saturation, and residual water, respectively;
ψ is the suction;
α,
n, and
m are curve fitting parameters;
n = (1−
m)
−1.
where
k and
ks are the permeability coefficient of unsaturated soil and saturated soil, respectively;
ψ = (
ω−
ωr)(
ωs−
ωr)
−1.
2.2. Influence Mechanism of Stress Field on Seepage Field
In porous media (i.e., unsaturated soils), the soil porosity ratio, n, and its permeability coefficient, k, have a proportional relationship k = k (n). The soil void ratio is n0 for initial conditions. When the stress field and the load are applied, the soil is squeezed or stretched to obtain the volume strain, εv. Assuming that the volume strain is caused by the porosity variation, the porosity ratio is n = n0 + εv, after the stress field is applied. When the stress field acts on the soil, it can provide a certain volumetric strain on the soil, thereby changing the soil pore ratio. Finally, the soil permeability coefficient, k, can establish a functional relationship with the stress field, σij, i.e., k = k (σij). Therefore, the stress field affects the soil permeability coefficient via changing the soil pore ratio and then affecting the seepage field.
2.3. Influence Mechanism of Seepage Field on Stress Field
The distribution change in the seepage field can vary the soil moisture distribution. The seepage field affects the stress field via changing the water load, i.e., the external load of the stress field. The water head distribution in the soil is assumed to be
h (
x,
y), and the seepage water pressure,
p, on the load surface is expressed as
p =
γw (
h−H), where
H is the water head position,
γw is the water weight (i.e., 10 kN/m
3), and
x and
y are the coordinate system. The seepage volume force (
fx,
fy) in the seepage region is expressed as:
In the finite element calculation, the seepage volume force and seepage water pressure are converted into the external loads added on the nodes. The influence of the seepage field on the stress field can be briefly described as that of the external load added on the stress field, which is due to the change in the soil seepage pressure and soil seepage volume force.
2.4. Fluid–Solid Coupling Equation
According to the mass conservation law, the rate of increase and decrease in the flow in the seepage field is equal to the change in the flow rate into and out of the soil. According to Darcy’s law, the elements are assumed to be constant and isotropic (i.e.,
kx =
ky). The isotropic soil and water are incompressible. The seepage field differential Equation (4) is obtained.
where
h is the water head.
Based on the hydraulics principles, the seepage volume force is proportional to the hydraulic gradient. Using the finite element method, it is converted into the external loads added on the nodes.
where
Fs and
ΔFs are the equivalent node forces caused by seepage volume force and seepage volume force increment, respectively;
N is the shape function.
Finally, the displacement boundary and the seepage boundary conditions were defined, and the seepage field and the stress field are combined to obtain the fluid–solid coupling equations of the soil, when the stress field and the seepage field interact with each other. The finite element solution is carried out as follows.
where
K is the stiffness matrix,
k is the isotropic permeability coefficient (i.e., stress field matrix function),
Δδ is the displacement increment matrix, and
ΔF is the load increment matrix on the nodes.
3. Soil Shear Strength Test
This study was conducted in the Wuhai City coal mine dumps. The average multi-year temperature in Wuhai ranges between 9.0 °C and 9.2 °C, indicating a typical continental climate. Its typical climate is extremely cold in the winter (with a low of −36.6 °C) and extremely hot in the summer (with a high of 40.2 °C) [
23]. The average annual duration of sunlight is 3138.6 h. Wuhai City has an average annual precipitation of 159.8 mm, which varies in a range of 80 mm in the west to less than 250 mm in the east [
24]. However, the average annual evaporation is 3289 mm. The main soil types in this region are brown calcic soil, gray desert soil, and chestnut soil [
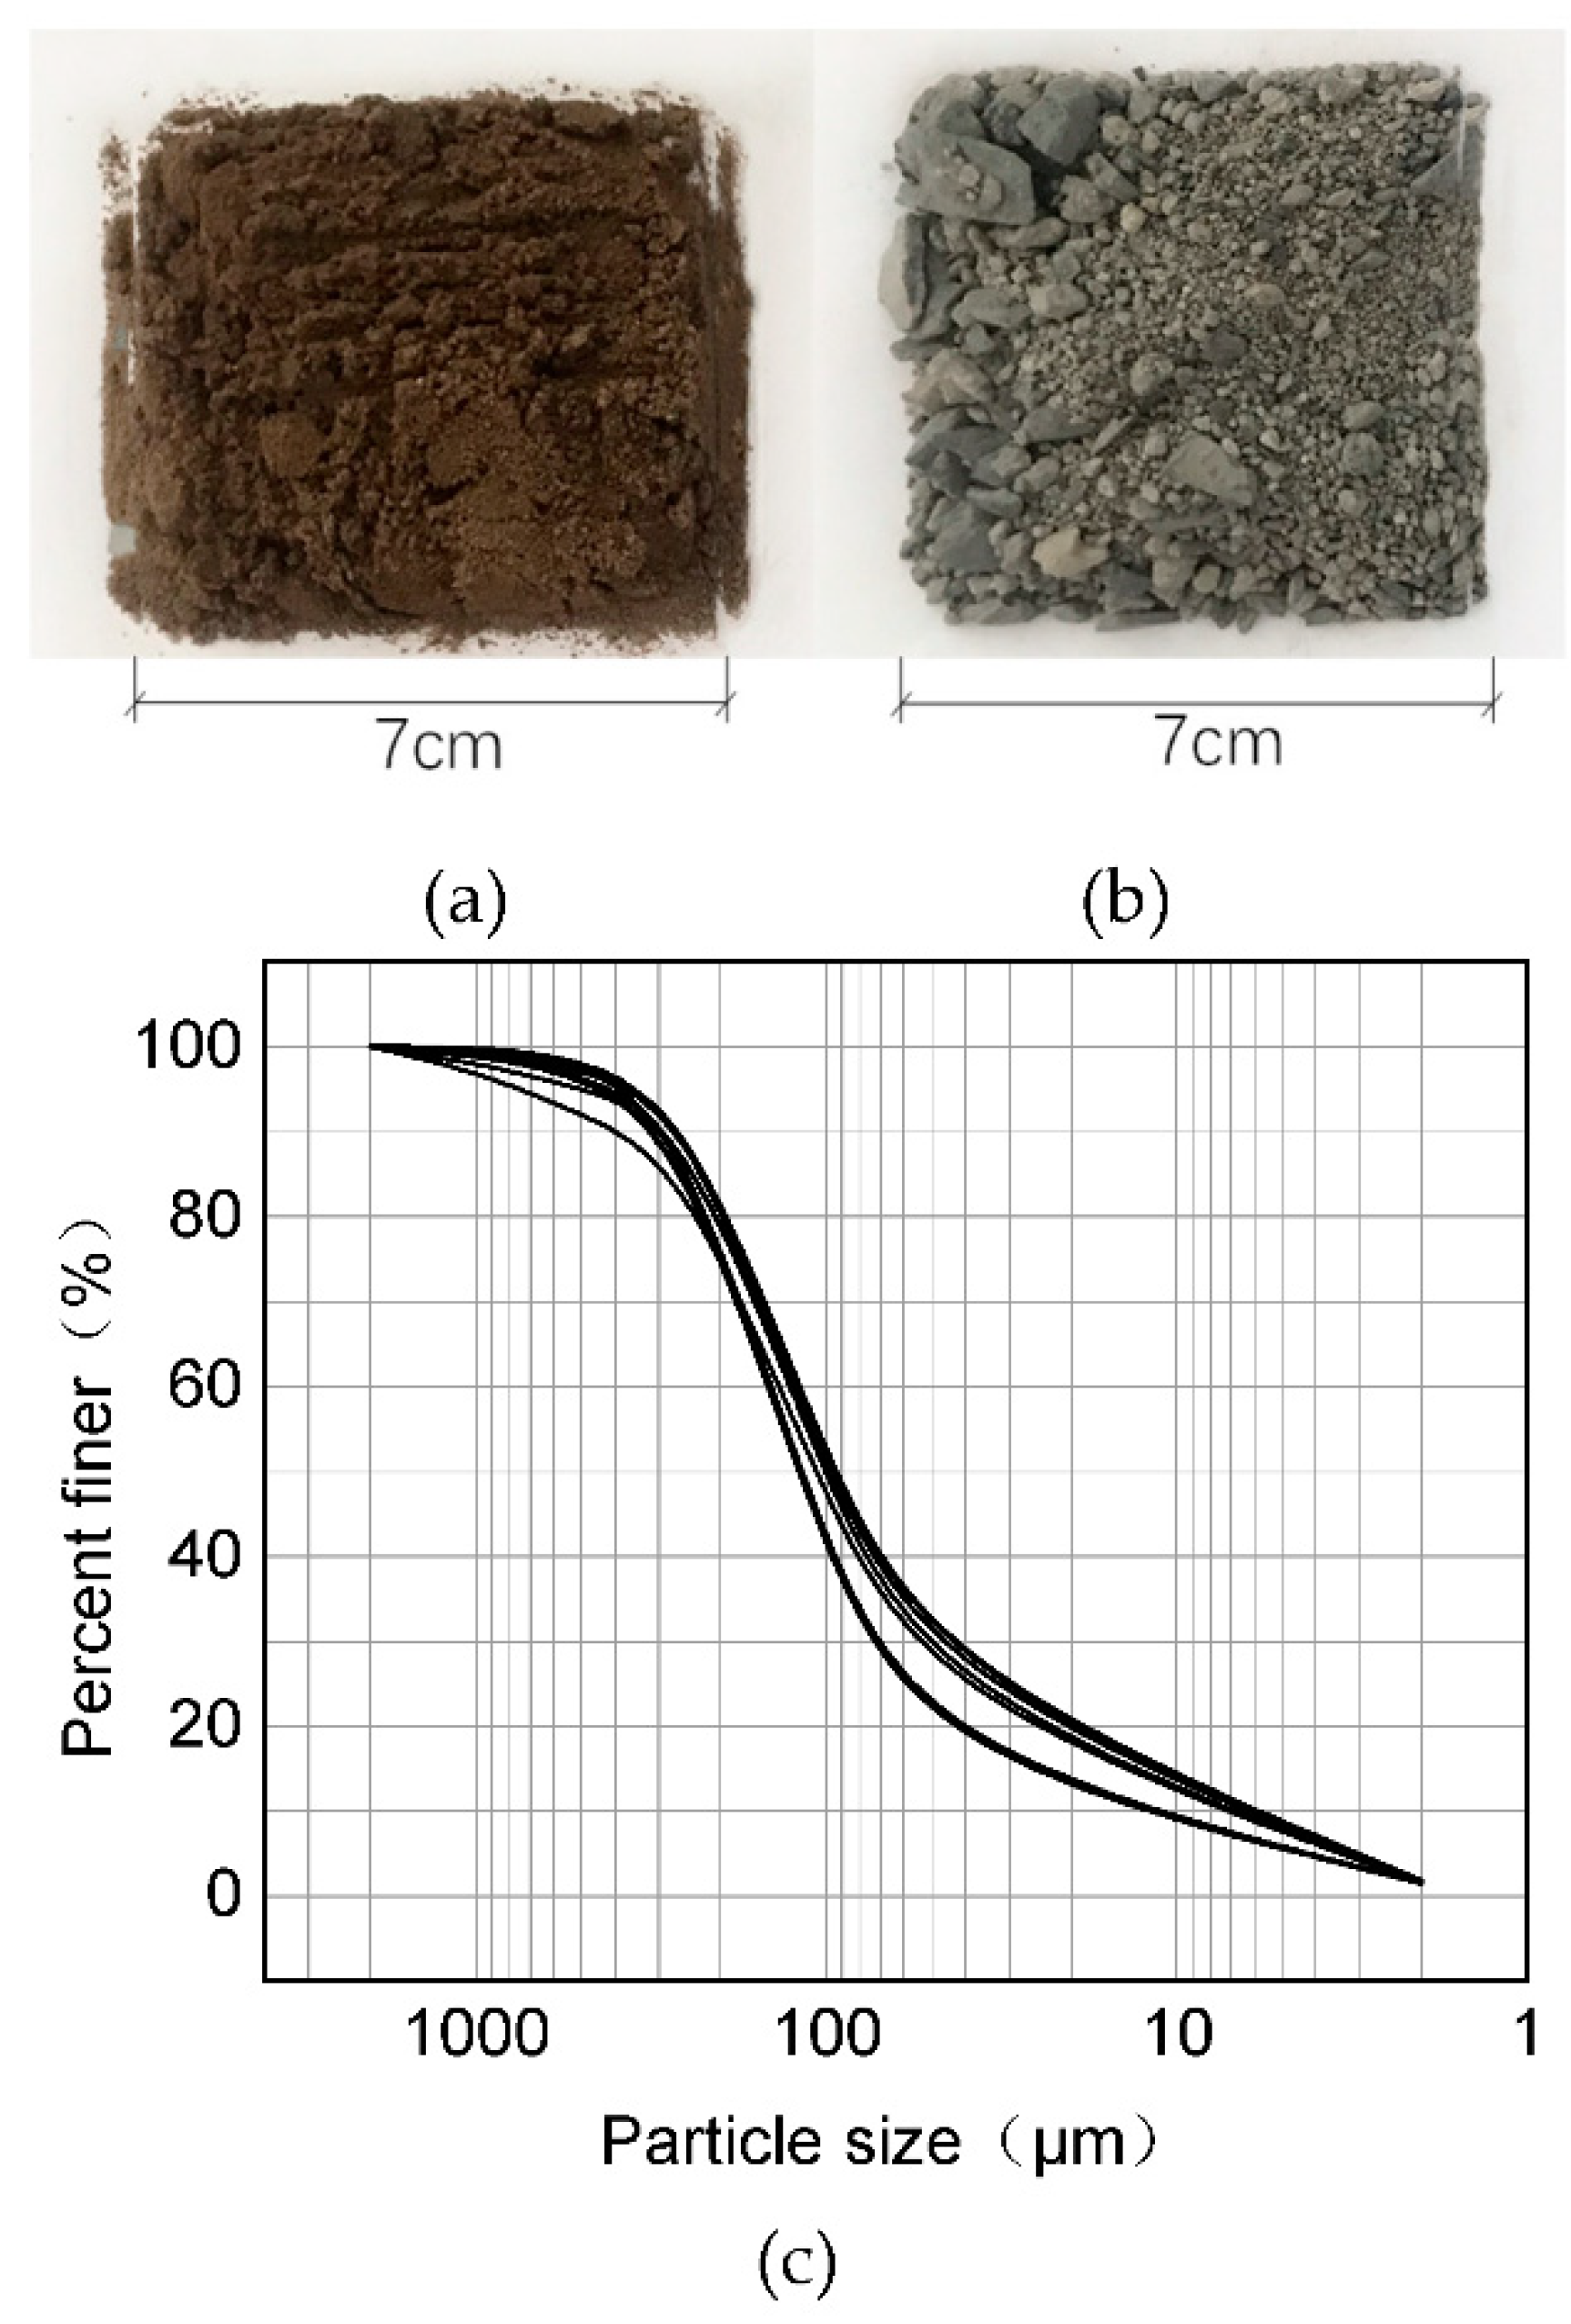
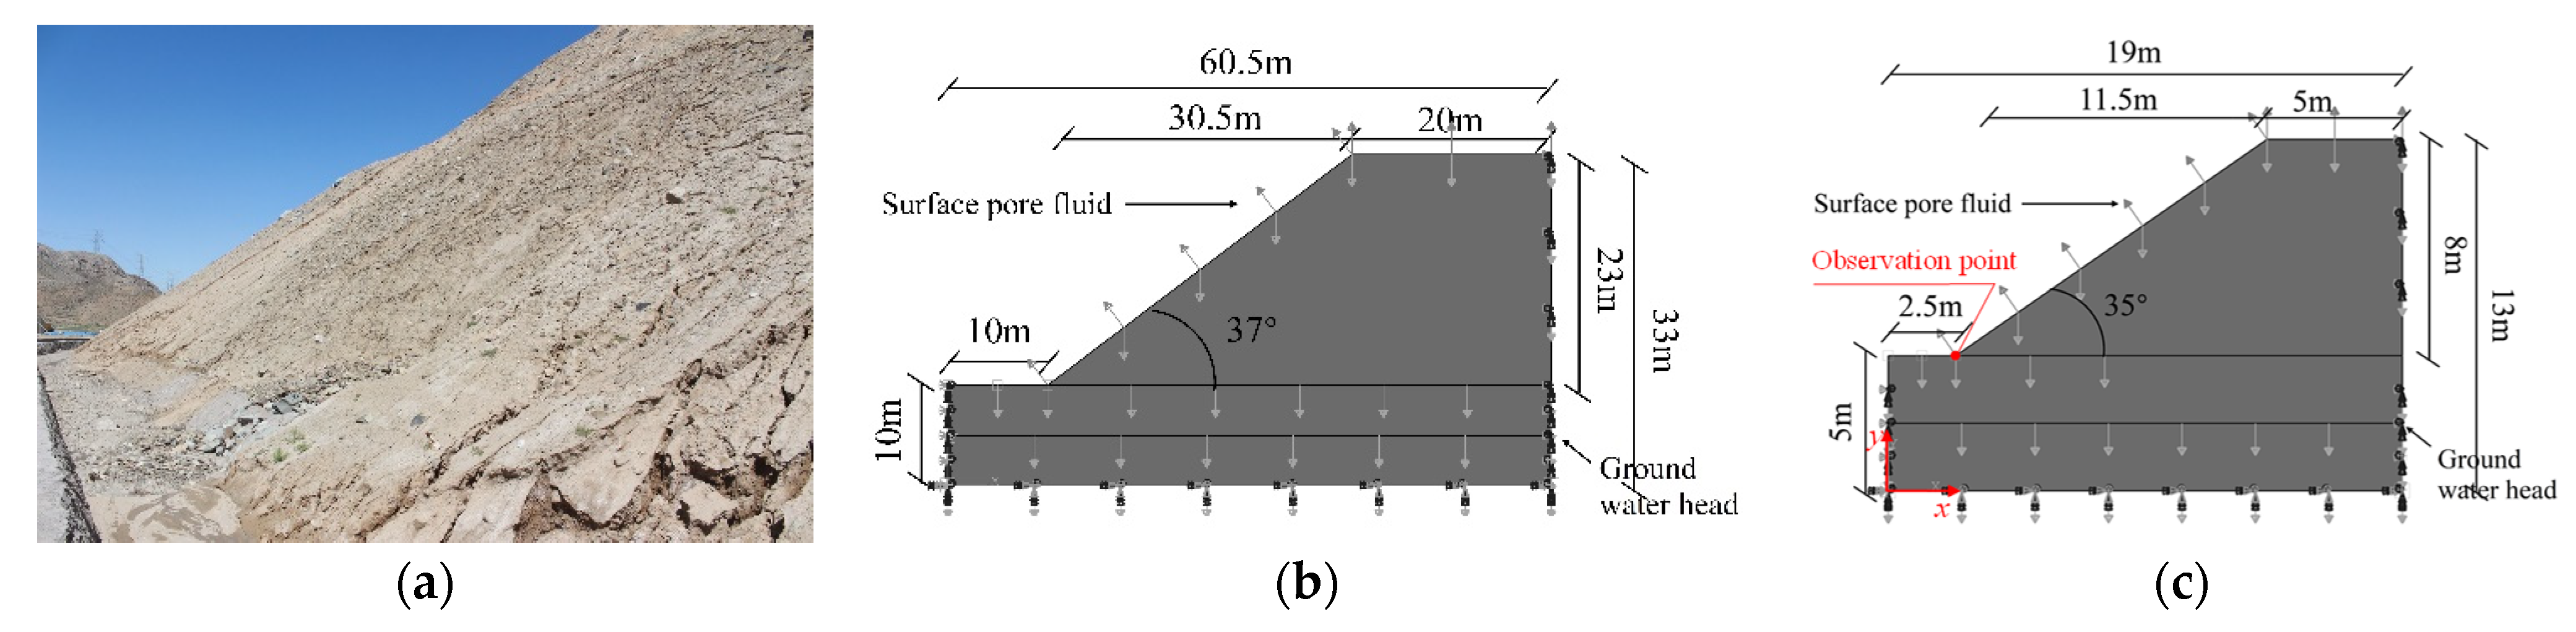
24]. Since Wuhai is located on the edge of the Loess Plateau, their parent material is loessial alluvial. Therefore, two types of soil samples were collected on slopes at the Xinxing Coal Mine (E 106°52′50″, N 39°42′03″), including loess and overburden, as shown in
Figure 1. The slope had three selected plots (i.e., 1 m × 1 m). Drilling was used to obtain three soil samples at random from each plot at a depth of around 20 cm. Therefore, a laser particle size analyzer (Mastersizer, 2000) was used to measure the particle size of nine covered loess samples that had gone through a 2 mm sieve. Soil samples were screened to 0.15 mm [
23]. The corresponding particle size distribution curve of loess, which is used in the simulation, is shown in
Figure 1c. The average particle size is 151.77 μm. The average uniformity coefficient is about
Cu = 50. The average curvature coefficient is about
Cc = 12.5. There is a 34% chance of the particles passing through the 0.075 mm sieve. This type of loess is a type of sandy clay. The internal friction angle (
φ) and cohesion (
c) are two prominent key indicators that reflect the soil shear strength as a Mohr–Coulomb model, which has been adopted for the soil [
25]. The soil shear strength is different under different initial water content conditions. Therefore, this section demarcates the liquid-plastic limit of different soils and then determines the soil water content range. Finally, the soil shear strength was measured under different water contents via a direct shear test.
3.1. Experimental Procedure
Because the particle size of the overburden samples is greater than 0.5 mm, as shown in
Figure 1b, the liquid limit and plastic limit cannot be measured. The natural water content of loess and overburden, as well as the liquid limit and plastic limit of loess, were measured via a photoelectric combined liquid-plastic limit device. In this paper, four water contents were arranged, including the saturation (
Sr) equaling 25%, 50%, 75%, and 100%, respectively. In addition, the list includes the liquid limit and plastic limit. A set of direct shear tests was carried out. All the tests followed CNS GB/T50123-2019 [
26].
3.2. Test Results
The water content is relative to the soil shear strength. The soil cohesion first increases and then decreases as a quadratic function while the soil water content increases; meanwhile, the soil friction angle increases linearly as the soil water content increases generally, and the soil shear strength also first increases and then decreases, as does the water content [
27].
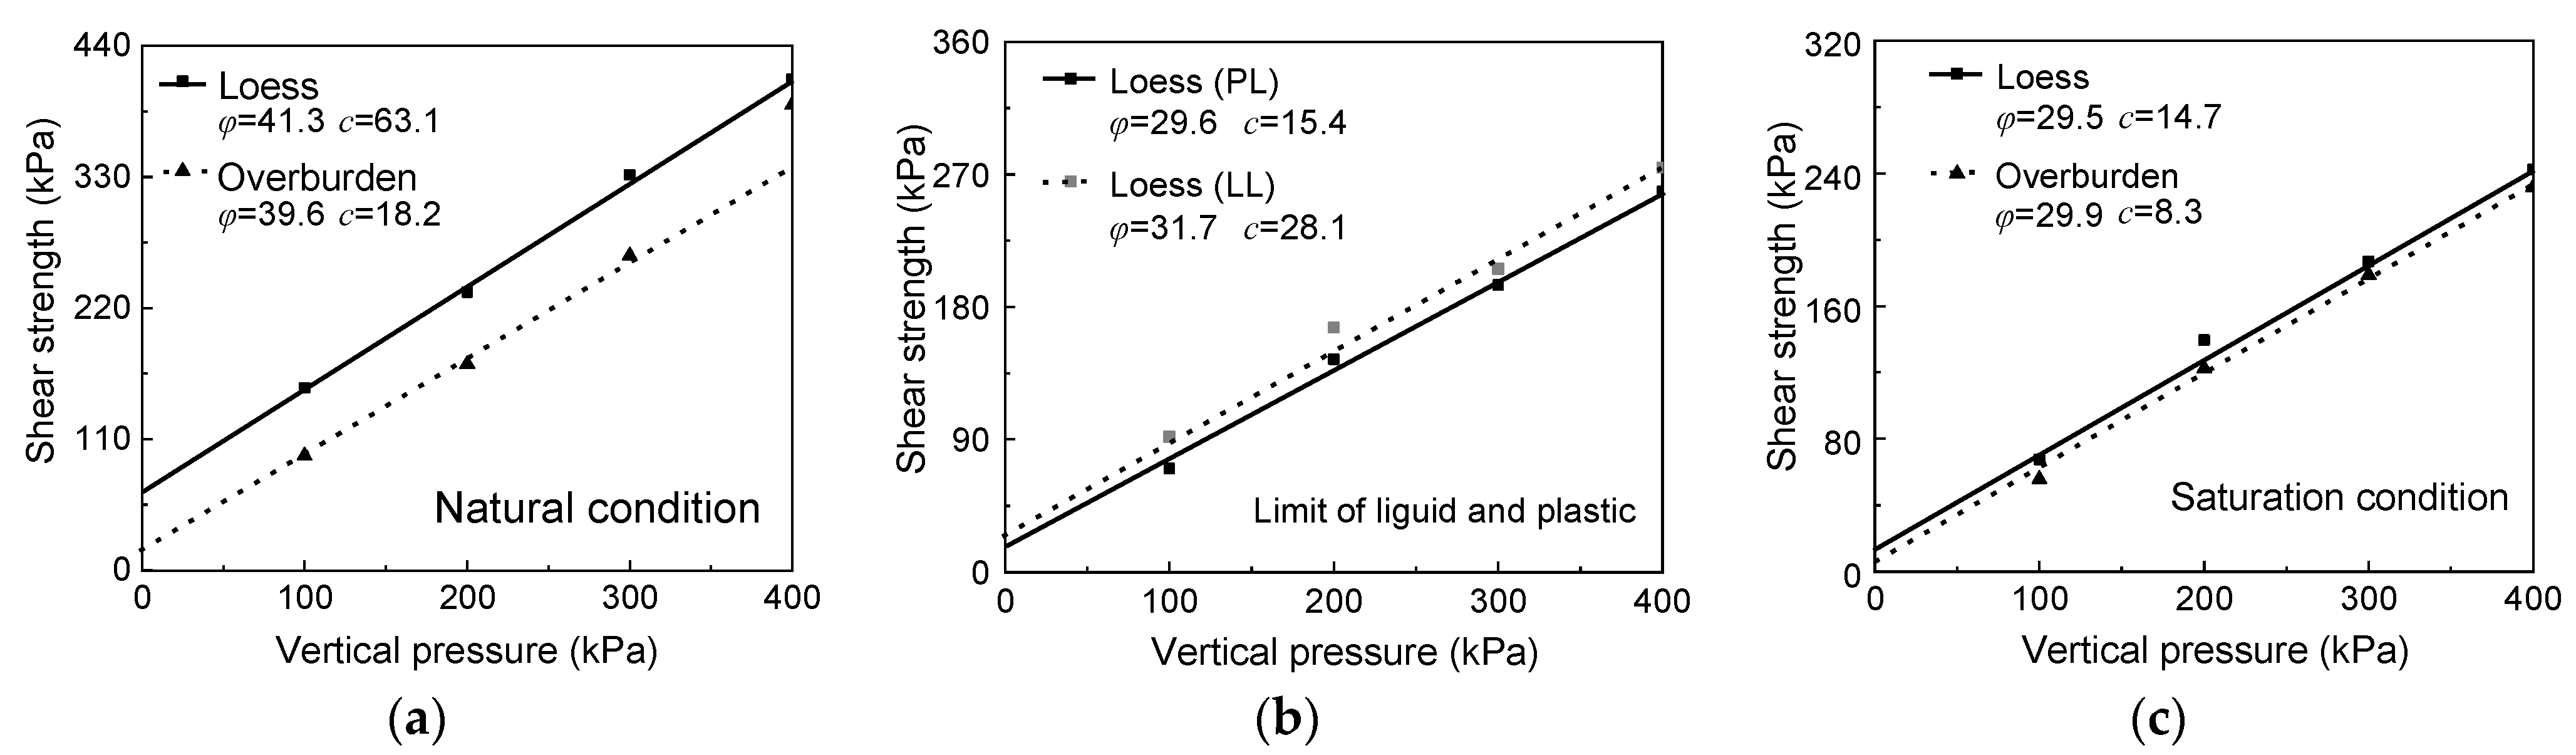
The measured
τ-σ curves of loess and overburden for different water contents are shown in
Figure 2. In particular, loess includes the liquid limit (LL, e.g.,
Sr = 90.91%) and plastic limit (PL, e.g.,
Sr = 60.10%). The relationship between the water content and internal friction angle, as well as cohesion, is shown in
Figure 3. With the increasing water content, the cohesion of the overburden generally decreased. The cohesion of the overburden decreased from 22.3 kPa to 8.3 kPa. It is worth noting that the cohesion of the loess has a more obvious downward trend, decreasing from 67.7 kPa to 14.7 kPa. The decline rate is up to 78.3%. Because the study area is located in the arid desertification area, the natural water content (
w) of the top loess is low (e.g.,
w = 1.72%), while the cohesion is 63.1 kPa. Therefore, the water content has a significant influence on the loess, which affects the shear strength.
The internal friction angles of the two materials showed a downward trend with the increase in water content. The internal friction angle of the loess and overburden decreased from 41.3° to 29.5° and from 42.2° to 29.9°, respectively. This means that the initial water content has a significant effect on the internal friction angle for these samples. The change in the internal friction angle is smooth, decreasing from 31.7° to 29.5°, since the water content of the loess is larger than the plastic limit.
5. Slope Stability Analysis and Discussion
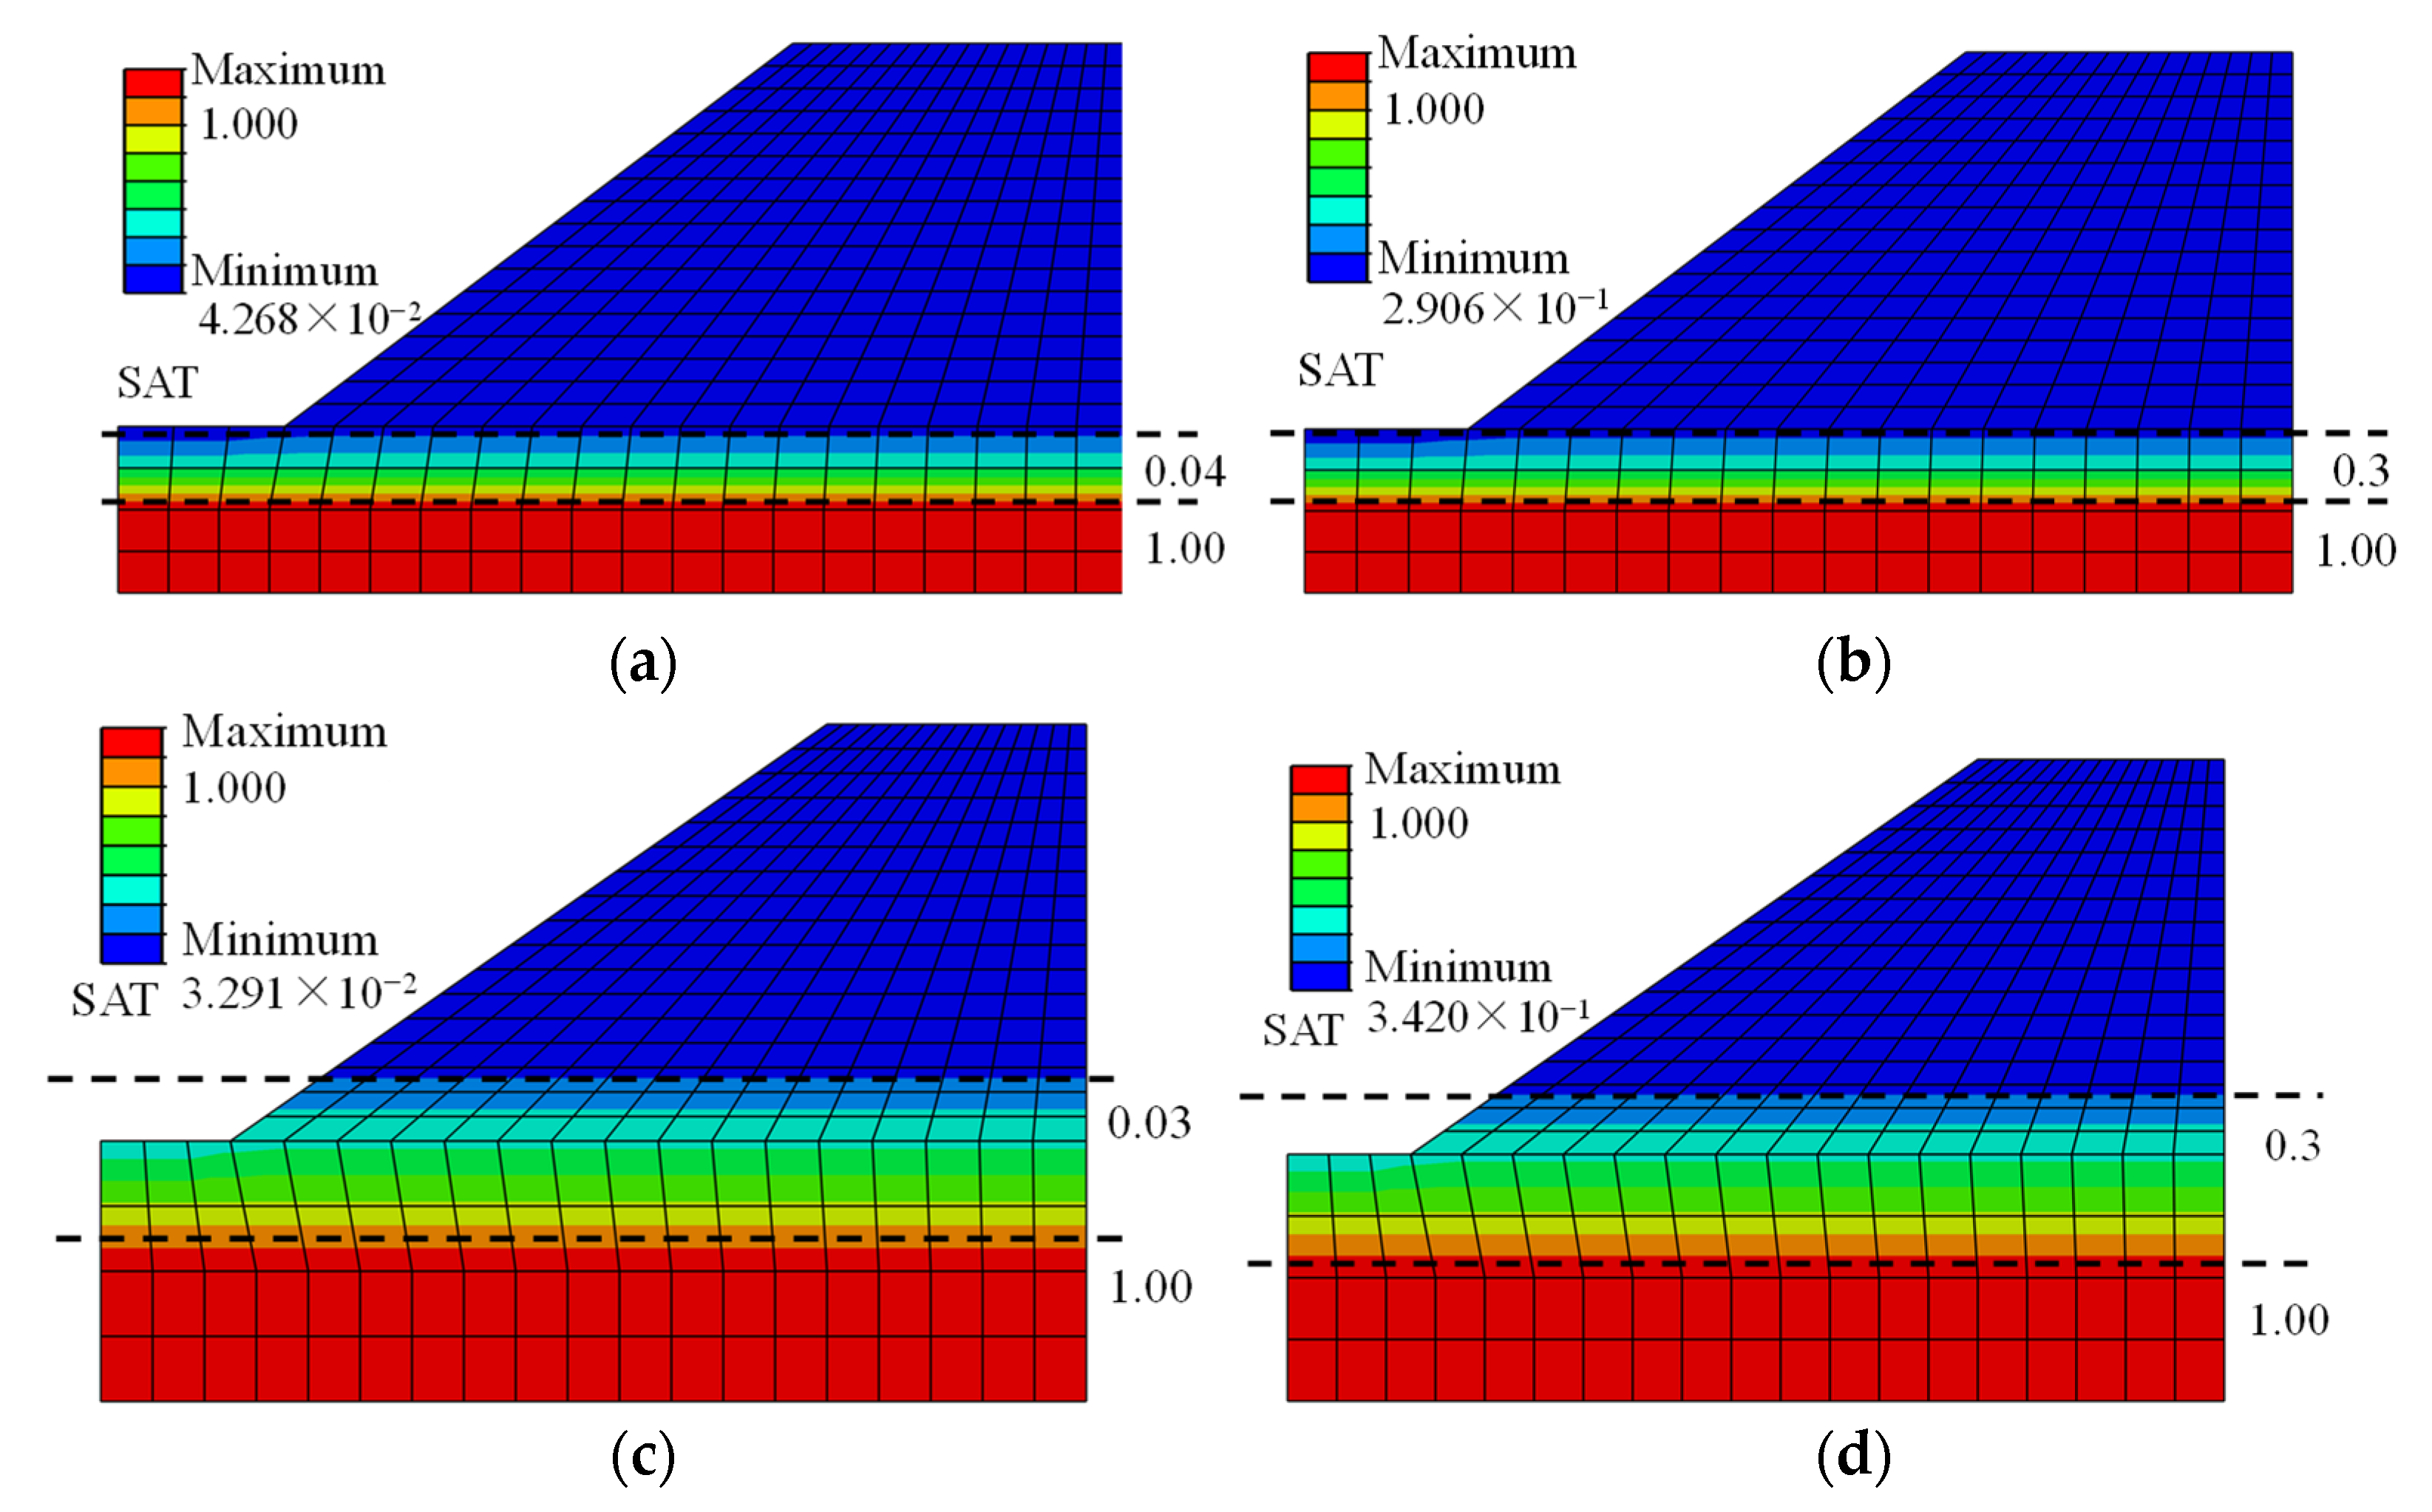
The gravity load and pore water pressure boundary were applied to the model. The soil saturation distributions of high-steep slope and standard slope, respectively, were obtained via static analysis, as shown in
Figure 6. The standard slope has a different saturation distribution compared with the high-steep slope. SAT denotes saturation. There is a significant difference between the upper and lower sides of the water level. The soil water content varied from saturated to unsaturated, and the boundary line for SAT = 1 is the initial water level. The accuracy of the numerical simulation is confirmed by the value given by Equation (2), i.e., the relationship between the permeability coefficient and volumetric water content.
5.1. Vertical Deformation
5.1.1. Equivalent Torrential Rain Case with 1 h Duration
Rainfall with an intensity of 68 mm/h for 1 h was applied to both the high-steep slope model and the standard slope model. A total of eight simulation cases were run, with four initial water contents (
w = 1.72%, 7.34%, 14.69%, and 22.03%). When rainfall occurs, the soil on the platform and the surface of the slope begin to absorb water. The saturation increases; meanwhile, the soil cohesion decreases, and the resistance of the soil particles decreases. When the soil resistance decreases, a certain amount of settlement will occur. The displacement is negative, indicating settlement (i.e., downward vertical deformation) or, conversely, swelling (i.e., upward vertical deformation). Since the rainwater infiltration has little effect on the horizontal deformation of the slope, only the changing regularity of the vertical slope deformation is discussed. The inflection point at the slope foot is selected as the observation point. The vertical deformation of the slope foot after a 1 h rainfall duration is shown in
Figure 7a,b.
In
Figure 7, the abscissa denotes the rainfall duration, and the ordinate denotes the vertical displacement of the observation point. The slope settlement of all cases show an increasing trend after 1 h of torrential rain. The settlement visibly changed as the initial water content of the standard slope increased from the natural water content of 1.72% to 22.03% after 1 h of equivalent heavy rainfall. The settlements (herein, absolute value) decreased from 1.62 mm to 1.31 mm and from 1.61 mm to 0.93 mm for the high-steep slope and standard slope, respectively, as the water content increased. In general, the relationship between the vertical displacement and the torrential rain for the high-steep slope is similar to that for the standard slope.
If the initial water content of the material is relatively low, the rainfall water infiltrates rapidly. Therefore, the settlement at the observation point is larger. When the initial water content is increased, the infiltration velocity is smaller. Therefore, the amount of settlement decreases. This shows that when the initial water content is low, the overall internal water distribution on the slope is smaller. In a short time, the torrential rain quickly infiltrates, and the saturation at the bottom of the slope increases rapidly, thereby reducing the soil’s ability to resist sliding. Meanwhile, the slope settlement is relatively large. However, if the initial water content gradually increased, the slope settlement decreased. this shows that the water infiltration rate will reduce after increasing the initial water content, resulting in the infiltration water remaining inside, not just at the bottom, of the slope. Meanwhile, the infiltration water distribution is more uniform on the slope, reducing the penetration force at the bottom, thereby reducing the strain and vertical deformation.
For the same initial water content, the vertical deformation of the high-steep slope and the standard slope is approximately the same, when the initial water content is only 1.72%. After 1 h of equivalent torrential rain, the vertical deformation of the high-steep slope is larger than that of the standard slope under the increasing initial water content, which is due to the excessive slope height and angle. This means that the high-steep slope has less stability.
5.1.2. Equivalent Heavy Rain Case with 24 h Duration
The rainfall intensity of 18 mm/h in 24 h was applied to both slope models. Eight simulation cases were carried out by controlling the initial water content of the slope as
w = 1.72%, 7.34%, 14.69%, and 22.03%, respectively. The vertical deformation of the observation point is shown in
Figure 8.
The eight curves in
Figure 8 can be divided into two types. When the initial water content is 1.72%, the slope vertical settlement increases steadily. When the initial water content is 7.34%, 14.69%, and 22.03%, the slope vertical deformation first increased and then decreased. This means the slope settlement appears at the beginning of rainfall and tends to increase. When the seepage water transformed into seepage force acting on the stress field, the stress field gradually increased. Especially for the high-steep slope under
w = 22.03%, the slope feet undergo a large strain and swelling. The vertical deformation begins to develop in the opposite direction.
The vertical deformation of the slope decreased, as shown in
Figure 8a, as the initial water content of the high-steep slope gradually increased. However, when the initial water content is 1.72% and 7.34%, the vertical settlements of the slope is 1.35 mm and 1.10 mm, respectively. When the rainfall intensity is 18 mm/h and the rainfall time is extended to 24 h, the rainwater can infiltrate the slope and does not converge at the bottom. When the initial water content is increased, the internal saturation of the slope is greater, and the water absorption capacity of the soil is weaker. When the initial water content is 14.69%, the vertical deformation first increases, that is, the settlement is 0.46 mm, then the vertical deformation decreases. The settlement is 0.13 mm, and the slope is still in settlement after 24 h of the heavy rain. When the initial water content is 22.03%, the vertical deformation is only 0.34 mm, and the swelling is 0.40 mm. After 24 h equivalent heavy rain, the slope deformation appeared to be swelling at the slope foot. When the initial water content of the slope is 1.72% under 24 h heavy rain, the slope settlement is obvious. When the initial water content of the slope is up to 22.03% under 24 h heavy rain, the slope becomes unstable.
As shown in
Figure 8b, when the initial water content increased, the vertical deformation trend of the standard slope was similar to the high-steep slope. When the water content increased from 1.72% to 7.34%, the vertical settlement decreased from 1.21 mm to 0.92 mm. When the initial water content was 14.69%, the vertical settlement of the slope increased to 0.52 mm and then decreased to 0.23 mm; when the initial water content was 22.03%, the vertical settlement of the slope increased to 0.66 mm and then decreased to 0.27 mm. The results show that the water gradually infiltrated downward, and the whole slope shrank and sank. After the continuous rainfall, the seepage water converges at the bottom of the slope, and the seepage force at the bottom of the slope acts on the stress field. The node stress at the bottom of the slope exceeds the yield strength and begins to transfer to the surrounding elements. Therefore, the slope foot begins to swell. However, the vertical deformation of the standard slope is different from the high-steep slope after 24 h of heavy rain, which has a swelling effect on the slope feet. Therefore, after 24 h of equivalent heavy rain, the standard slope tends to be more stable than the high-steep slopes.
When the initial water content increases, the vertical deformation of high-steep slopes is larger than that of the standard slopes under the same initial water content. When the node stress of the elements exceeds the yield strength, the swelling on the high-steep slope feet increases, but does not appear on the standard slope.
5.2. Pore Water Pressure
Pore water pressure is one of the important indexes used to evaluate the slope stability [
4]. Pore water pressure increases with time in soils with high water content. Increasing pore water pressure will cause the soil suction to decrease, which results in reducing the shear strength and slope failure [
32]. However, the initial water content has a significant impact on the slope pore water pressure. The greater the initial water content, the more significant the stratification changes of pore water pressure. Therefore, the minimum and maximum initial water content (i.e.,
w = 1.72% and 22.03%) were used for rainfall simulation. The water distribution on the slope was investigated via studying the pore water pressure stratification characteristics, as shown in
Figure 9 and
Figure 10.
The pore water pressure distribution is more concentrated after rainfall. When the initial water content is 1.72%, the permeability of the soil is high, and the water rapidly infiltrates and converges at the bottom of the slope, resulting in inhomogeneous pore water pressure distribution on the entire slope. When the initial water content is 22.03%, the soil tends to be saturated. Meanwhile, the soil permeability is weak, and the infiltration water converges inside the slope, which aggravates the stratification characteristic.
Comparing
Figure 9a,c to
Figure 9b,d, a long period of continuous rainfall (i.e., 24 h) will result in increasing total infiltration, and the pore water pressure distribution gradually shrinks from the initial linear distribution to the slope interior, thus forming envelope curves. The water will infiltrate and diffuse on the whole slope, increasing the entire pore water pressure. The water pressure, as well as the pore water pressure, will increase under continuous infiltration of the water.
Comparing
Figure 9 and
Figure 10, the pore water pressure distribution of high-steep slopes is approximately the same as for the standard slope. However, the pore water pressure of the high-steep slope is greater than that of the standard slope. Therefore, the slope stability reduced as the pore water pressure increased.
5.3. Equivalent Plastic Strain Distribution
The penetration range of equivalent plastic strain generated after 1 h and 24 h of rainfall is shown in
Figure 11 and
Figure 12. The initial water content is 1.72% and 22.03%, respectively.
When the initial water content of the slope increased, the penetration range of the equivalent plastic strain on the slope decreased under 1 h of torrential rain. The large initial water content can delay the diffusion of stress at the slope foot and maintain the slope stability, to a certain extent, in the case of extremely strong rainfall for a short duration. If the initial water content increased, the equivalent plastic strain penetration range on the slope shows an expansion trend after 24 h of heavy rain. Continuous infiltration of rainwater as an increasing load exacerbated the total stress under a long-duration heavy rainfall. Therefore, the stress on the slope foot exceeds the yield strength. A continuous sliding surface is formed, causing slope instability and failure.
The equivalent plastic strain penetration range in the case of a 1 h torrential rainstorm is larger than that of a 24 h heavy rain under a low initial water content (i.e., w = 1.72%). When the initial water content is low, long-duration heavy rain causes the water to fully penetrate and immerse in the slope. However, a 1 h torrential rain will rely on the rain intensity to quickly infiltrate the soil, and then the slope foot generates excessive seepage force, which gradually exceeds the yield strength, thereby forming a continuously sliding surface.
The equivalent plastic strain penetration range in the case of a 1 h torrential rainstorm is smaller than that of a 24 h of heavy rain under a high initial water content (i.e., w = 22.03%). The internal saturation of the slope is high in the case of the high initial water content because water will filtrate easily. After 24 h of heavy rain, when the rainwater infiltrates into the surface and inside of the slope, the water can fully infiltrate, and the total amount of infiltration water is greater than that from 1 h of torrential rain.
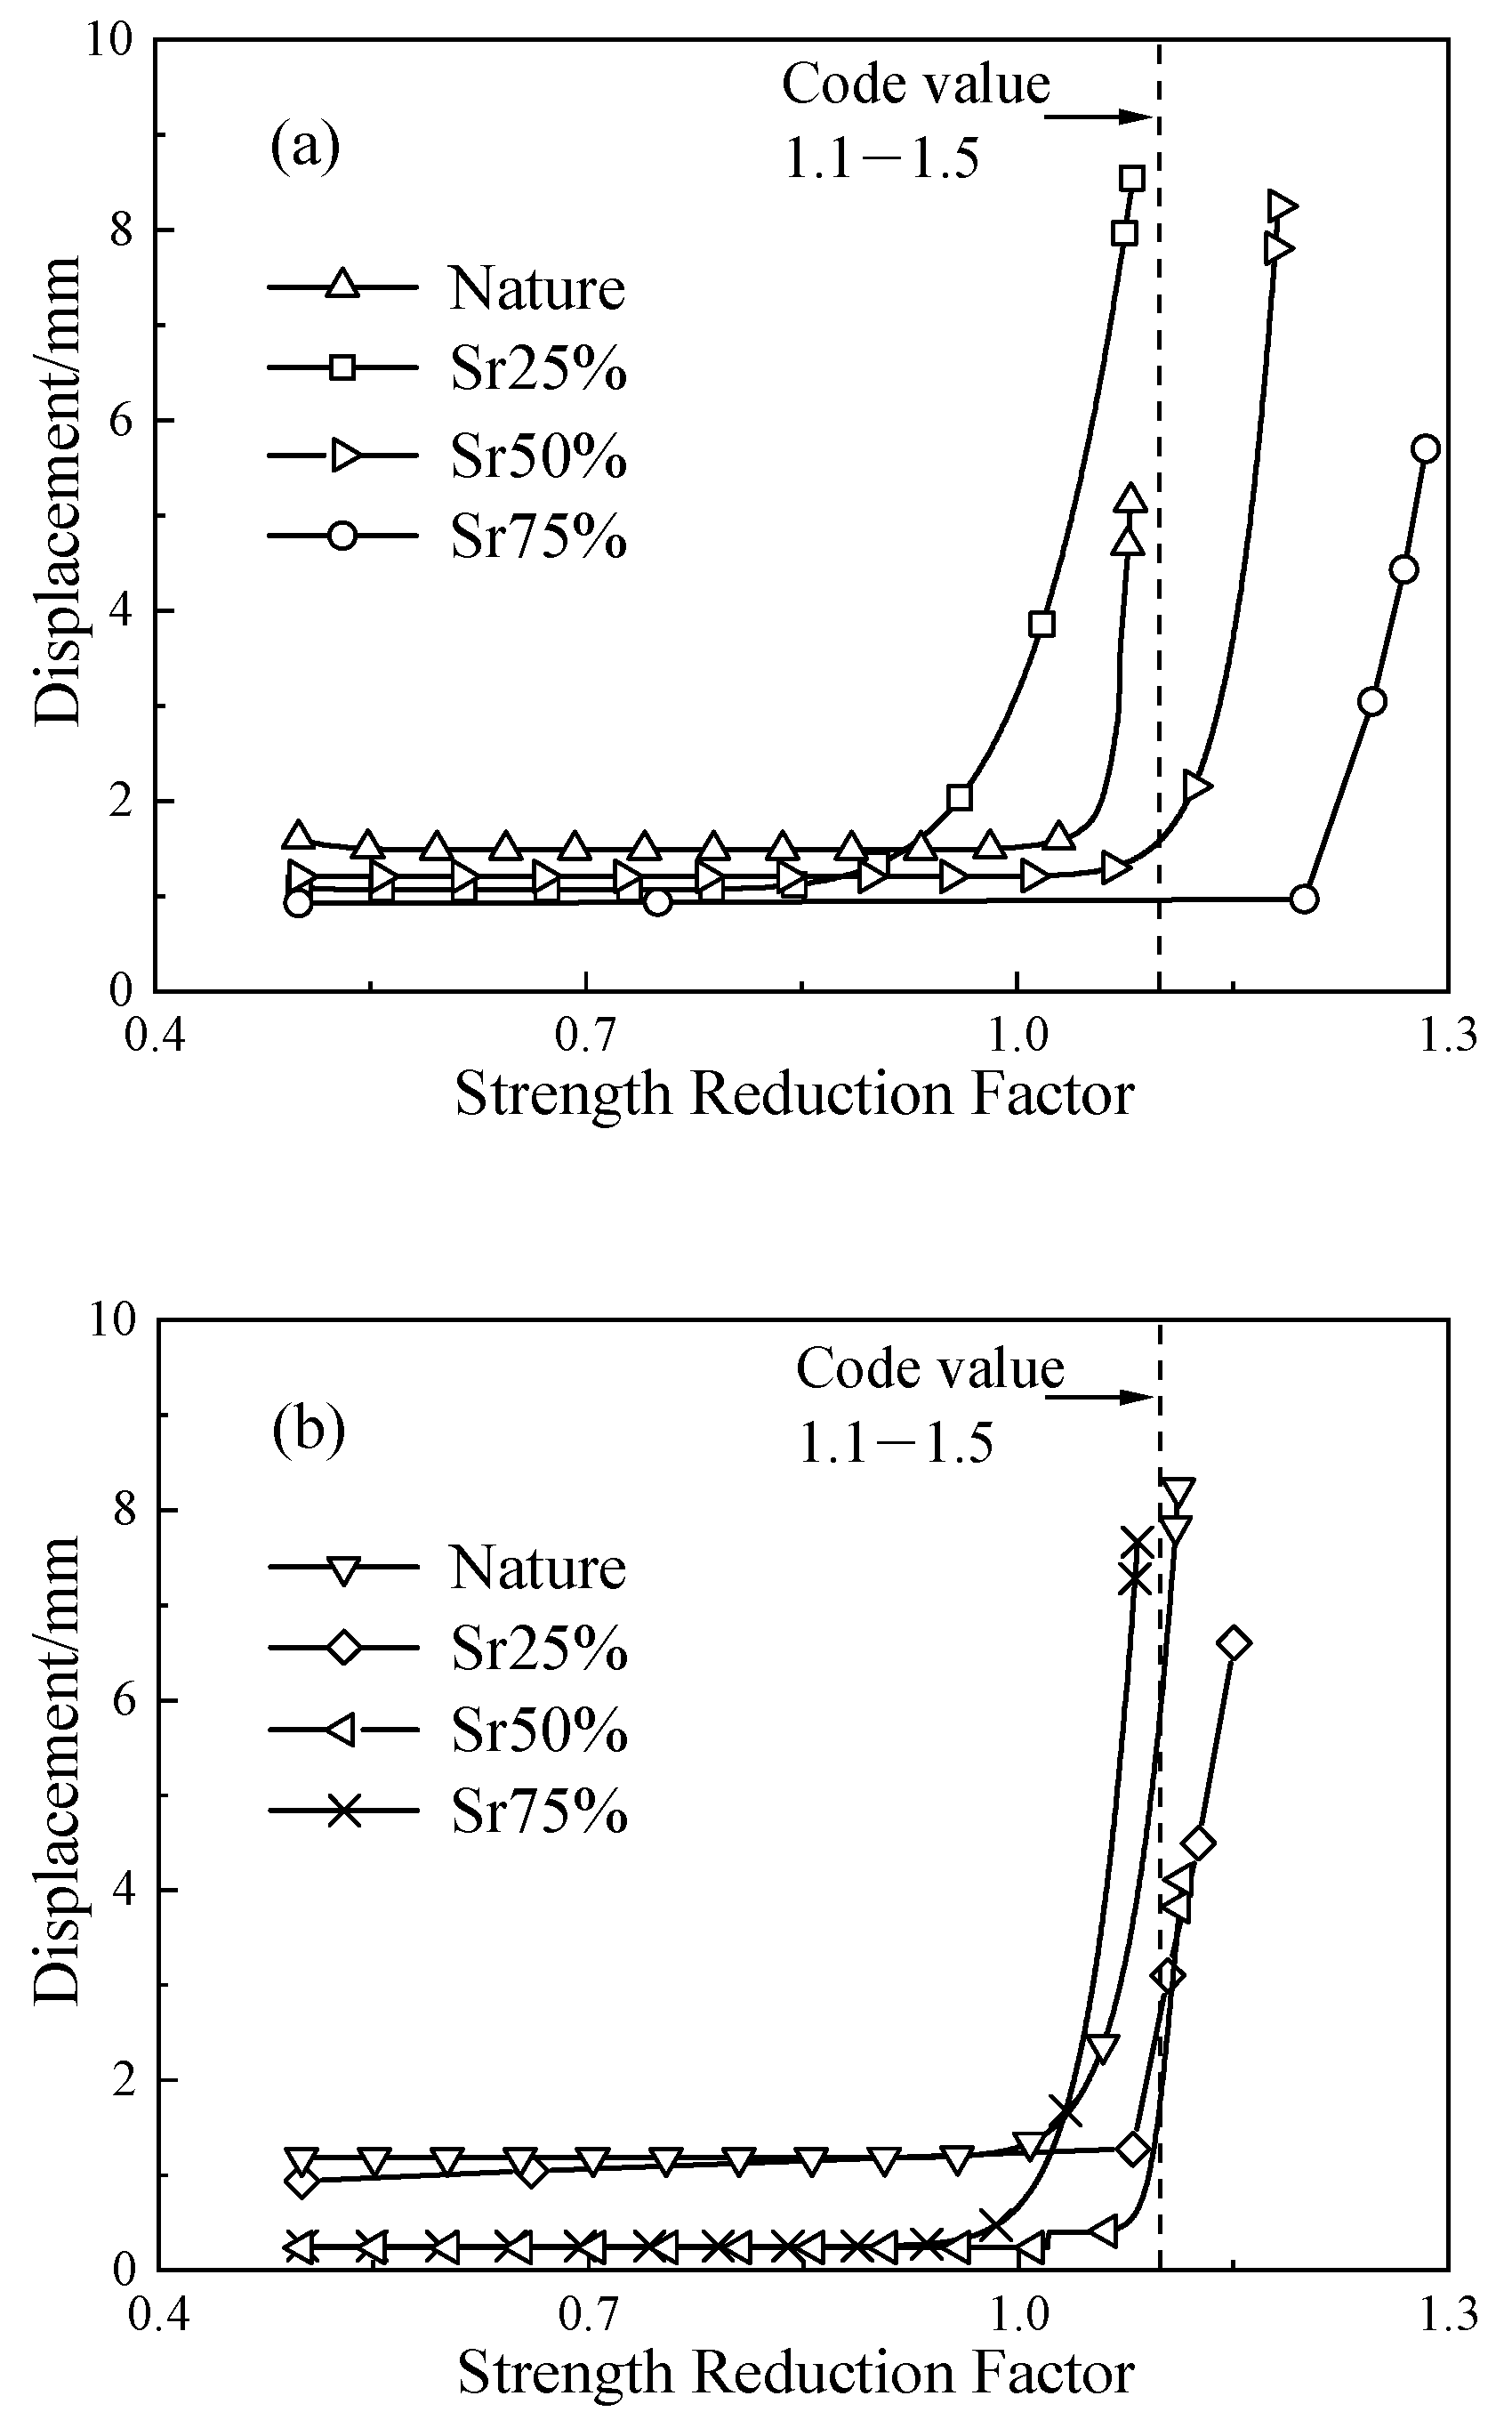
5.4. Safety Factor
The safety factor is another important index to evaluate slope stability. This paper calculated the safety factor of 16 rainfall schemes, and compared them to those of CNS GB50021-2001 [
33]. In this paper, the strength reduction method was adopted [
19]. The ABAQUS was used to calculate the slope safety factor (
Fs), and the non-convergence point was denoted as the corresponding safety factor.
5.4.1. Safety Factor of High-Steep Slope
The safety factor of the high-steep slope under different initial water contents and rainfall durations is shown in
Figure 13 and
Table 2.
According to the requirements in GB50021-2001, the safety factor of the dump slope is Fs = 1.1~1.5. The safety factors in the cases of the low initial water content under 1 h of torrential rain and 24 h of heavy rainfall are lower than the requirements of the code. Meanwhile, the slopes with an initial water content of 7.34%, 1 h torrential rainfall, and initial water content of 22.03%, 24 h heavy rainfall, would also exhibit the risk of instability and failure.
As shown in
Figure 13a, the safety factor gradually increases as the initial amount of water under 1 h of heavy rain increases. When the initial water content is up to 14.69%, the safety factor still satisfies the national code requirements. In
Figure 13b, the safety factor first increases and then decreases, and then it exceeds the code requirement as the initial water level slowly rises during 24 h of heavy rain. This means that the safety factor increases with the increasing initial water content under torrential rain of short duration. The safety factor first increased and then decreased with the increasing initial water content under heavy rainfall of long duration. When the initial water content increases, the cohesion is improved. The increasing cohesion can more effectively improve the safety factor. However, the cohesion and internal friction angle gradually decrease as the saturation is further increased, reducing the soil friction ability. Therefore, the safety factor decreases as the slope is immersed in rainwater.
5.4.2. Safety Factor of Standard Slope
The safety factor of a standard slope with different initial water contents under 1 h of torrential rain and 24 h of heavy rain is shown in
Figure 14 and
Table 2. When the initial water content is 1.72% and 7.34%, the safety factor of the slopes under 1 h of torrential rain is less than the code requirement. Meanwhile, when the initial water content is 22.03%, the slope is also unsafe after 24 h of heavy rain. As shown in
Figure 14a, the safety factor can meet the minimum code requirement when the initial water content is up to 14.69%. In
Figure 14b, when the initial water content increased from 1.72% to 14.69%, the safety factor first increased and then decreased under the 24 h of heavy rain. When the initial water content increased to 22.03%, the safety factor decreased to 1.08, exceeding the safety requirement.
The above results showed that when the initial water content is lower, the soil friction angle and cohesion are relatively larger, according to , where is the soil shear strength. The rainfall intensity of the 24 h equivalent heavy rain is much less than the 1 h equivalent torrential rain. The soil cohesion can balance with the water infiltration force; therefore, the safety factor is larger in the case of 1 h of torrential rain. However, when the soil saturation is higher, the soil friction angle and cohesion decrease; meanwhile, the effective stress of the soil decreases, which results in a decrease in the soil shear strength, . The continuous rainfall for a long duration allows the infiltration water to fully infiltrate and converge at the bottom of the slope. Then the soil shear strength cannot balance the additional penetration force caused by the infiltration, thereby reducing the safety factor.


