Article

Codon Usage Bias for Fatty Acid Genes FAE1 and FAD2 in Oilseed Brassica Species

1
ICAR-Indian Agricultural Research Institute, New Delhi 110012, India
2
ICAR-National Research Centre for Orchids, Pakyong 737106, India
3
ICAR-Directorate of Rapeseed-Mustard Research, Bharatpur 321303, India
*
Author to whom correspondence should be addressed.
These authors contributed equally to this work.
Sustainability 2022, 14(17), 11035; https://doi.org/10.3390/su141711035
Submission received: 26 July 2022 / Revised: 29 August 2022 / Accepted: 31 August 2022 / Published: 4 September 2022

Abstract

:
Codon usage bias (CUB) phenomenon varies with the species and even within the genes of the same species, where few codons are preferred more frequently than their other synonymous codons. It also categorizes the differences between species. Nucleotide compositional analysis reveals the molecular mechanisms of genes and the evolutionary relationship of a gene in dissimilar plant species. In the present study, three orthologous sequences of each FAE1 (FAE1.1, FAE1.2, and FAE1.3) and FAD2 (FAD2.1, FAD2.2, and FAD2.3) genes, from six Brassica species were accessed using the GenBank database. Further, CUB-related parameters such as nucleotide composition (AT and GC content), relative synonymous codon usage (RSCU), the effective number of codons (ENC), frequency of optimal codons (Fop), relative codon usage bias (RCBS), neutrality plot (GC12 vs. GC3), parity rule-2 [(A3/(A3 + T3) vs. (G3/(G3 + C3)], and correspondence analysis (COA) were analyzed to compare codon bias in U’s triangle Brassica species. The FAE1 genes were AT-biased and FAD2 genes were GC-biased across the studied Brassica species. RSCU values indicated that both the genes had moderate codon usage frequency for selected amino acids. The evolutionary study confirmed that codon usage preference is similar within the species grouped into the same cluster for FAE1; however, B. nigra performed differently for FAD2.2 orthologue. The high ENC value, low Fop, and RSCU value highlighted that FAE1 and FAD2 genes had a low level of gene expression and moderate preference for codon usage across the Brassicas. In addition, neutrality plot, parity rule, and correspondence analysis revealed that natural selection pressure had significantly contributed to CUB for FAE1 genes, whereas mutation and selection pressure occurred for FAD2 genes. This study would help to decode codon optimization, improve the level of expression of exogenous genes, and transgenic engineering to increase fatty acid profiling for the betterment of seed oil in Brassica species.

1. Introduction

Genetic code is the sequence of nucleotides in deoxyribonucleic acid (DNA) and ribonucleic acid (RNA) that determines the specific amino acid sequence of a protein. There are 61 sense and 3 stop codon triplets in the genetic code. Most amino acids are coded by more than one codon as only 20 amino acids are required for protein synthesis [1,2,3]. For instance, only Met and Trp have just one codon, whereas others have two (Gln, Phe, Glu, Tyr, Cys, Lys, His, Asp, and Asn,), three (Ile), four (Thr, Gly, Ala, Pro, and Val), and six (Leu, Arg, and Ser) codons [4,5]. Synonymous codons designate the same amino acid but are used differently in different species and even within the genes of the same species. Codon use bias (CUB) is defined as the disproportionate use of synonymous codons in the genome. However, the choice of synonymous codons for a specified amino acid is not always random in a particular gene or species [6]. In addition, some codons are used more recurrently than their synonymous counterparts in genes with such biasness. Codons that are repeatedly used are known as favorite codons. Two genetic model systems such as Escherichia coli and Saccharomyces cerevisiae were used for the majority of early CUB research [7,8,9]. In addition, CUB is often considered to comprise the cumulative effects of genetic drift, mutation pressure, and natural selection [10,11]. Further, CUB has been effectively used in the exogenic gene expressions [12], the expedition of root cause of species [13], prediction of gene functions [14], and estimation of intra-specific genetic divergence [15,16] in lower organisms such as E. coli [14], S. cerevisiae [14], DENV (dengue) virus [16], and HEV (hepatitis E) virus [15], and higher plants such as Arabidopsis thaliana [17], B. campestris [18], and Cucumis sativus [19]. Thus, there is a dire need to decode the inter-specific divergence at the genotypic level and boost the expression competence of exogenic genes in Brassica species by CUB, and it is worthwhile to try plants that have multicellular structures.
Oilseed Brassica is the world’s third-largest source of oilseed after palm and soybean, making it one of the most powerful oil crops on the planet [20,21,22,23,24]. The fatty acid (FA) balance and nutritional quality are determined by the oil and protein content of oilseeds [25]. In Brassica, palmitic (C16:0), stearic (C18:0), oleic (C18:1), linoleic (C18:2), linolenic (C18:3), eicosenoic (C20:1), and erucic acid (C22:1) represent fatty acid profile [26]. Among them, erucic acid is an undesirable fatty acid for edible oil [27,28], hence a critical indicator of the edible oil quality. Besides, the ratio of C18 unsaturated FAs is an another indicator of oil quality [25]. Oil quality is greatly affected by the composition and ratio of fatty acids, particularly polyunsaturated fatty acids (PUFAs), and its utility depends on the final purpose/usage. In Brassica species, there is a dire need for increasing linoleic acid and reducing erucic acid to improve its oil quality and sustain its high market share or create new market niche among other oilseed crops [29]. At high-temperature regimes, an increased oleic acid level can improve the oil stability and produce scarcer uninvited compounds [30,31]. Both FAE1 (fatty acid elongase1) and FAD2 (fatty acid desturase2) are essential enzymes for the fatty acid biosynthesis pathway [29,32]. FAE1, a critical gene in erucic acid biosynthesis, catalyzes the first condensation step in the elongation route of extremely long-chain fatty acid production and FAD2 regulates the percentage of polyunsaturated fatty acids in seed oil. Gene FAD2 catalyzes the first step in the conversion of oleic acid to linoleic acid in the production of polyunsaturated fatty acids [29,32,33].
The purpose of this study was to examine codon bias and base composition dynamics in FAE1 and FAD2 gene codon usage patterns in six Brassica species [three diploid species, B. rapa (AA), B. nigra (BB), B. oleracea (CC), and three amphidiploid species, B. juncea (AABB), B. carinata (BBCC), and B. napus (AACC)] using GC content, the effective number of codons (ENC), frequency of optimal codon (Fop), codon bias index, length of amino acids, hydropathicity of protein, aromaticity score, relative codon usage bias (RCBS), and relative codon adaptation. Further, it will encourage researchers to learn more about FAE1 and FAD2 gene use patterns, gene structure and function, and gene evolution in oilseed Brassica species. The codon manipulation will help in breeding the high-quality oilseed Brassica varieties, which will further ensure oilseed Brassica-based diversification in Indo-Gangetic plain zones.

2. Materials and Methods

2.1. Sequence Data Source

Entire coding sequences (with ATG as the initiation codon and TAA, TAG, or TGA as the termination codons) of FAE1 and FAD2 genes were identified using online tool GenBank [http://www.ncbi.nlm.nih.gov (accessed on 5 June 2022)]. For CUB analysis, U’s triangle Brassica species with complete three orthologs of FAE1 (FAE1.1, FAE1.2, FAE1.3) and FAD2 (FAD2.1, FAD2.2, FAD2.3) gene coding sequences were used and their gene ID, length, chromosomal position, etc., are presented in Table 1.

2.2. Analysis of Base Composition and Codon Preference

To calculate GC content (GC1, GC2 and GC3) on the first, second, and third nucleotide of the codon, the program called CUSP [34] was used and the average value of GC1 and GC2 in the coding sequence of both genes was calculated by GC12. Furthermore, relative synonymous codon usage (RSCU), effective number of codons (ENC), frequency of optimal codons (Fop values), codon bias index (CBI), number of synonymous codons (L_sym), length of amino acids (L_aa), GRAVY, and aromaticity score (Aromo) were calculated using CodonW 1.4 [35]. The content of GC, T, C, A, and G on the third nucleotide position of a synonymous codon is denoted by GC3s, T3, C3, A3, and G3, respectively.

2.3. Relative Synonymous Codon Usage (RSCU)

The theoretical observation value can be defined as the observed value at which synonymous codon usage frequency remains the same, i.e., absence of codon bias. On the other hand, the specific value between the actual observation value and theoretical observation value is termed RSCU. If RSCU = 1 there is no codon bias and RSCU > 1 indicates that the codon is more frequently used than the other synonymous codons [36].
RSCU i j = X i j 1 n i j = 1 n i X i j .  
where, ni denotes the number of synonymous codons for the ith amino acid, and Xij denotes the occurrence frequency of the jth codon for the ith amino acid [36].

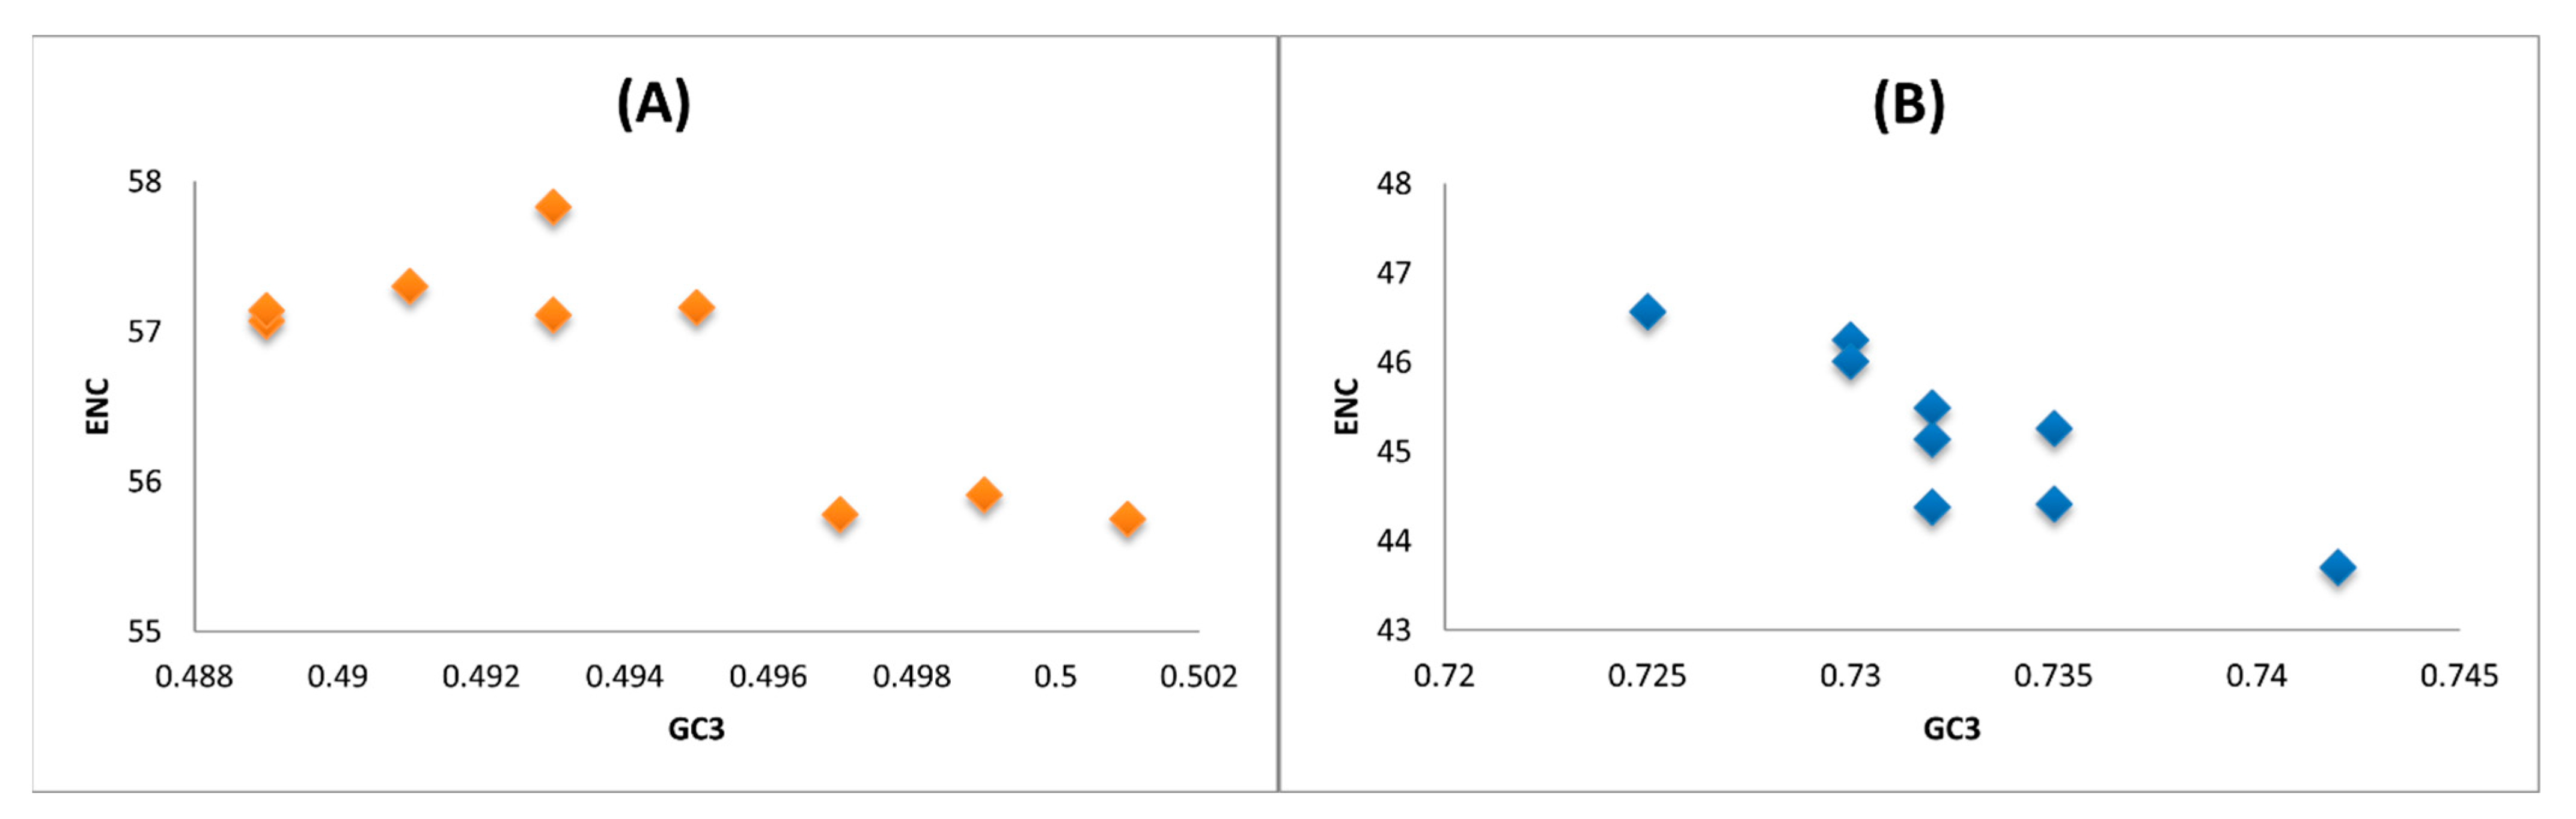
2.4. ENC-GC3 Plot Analysis
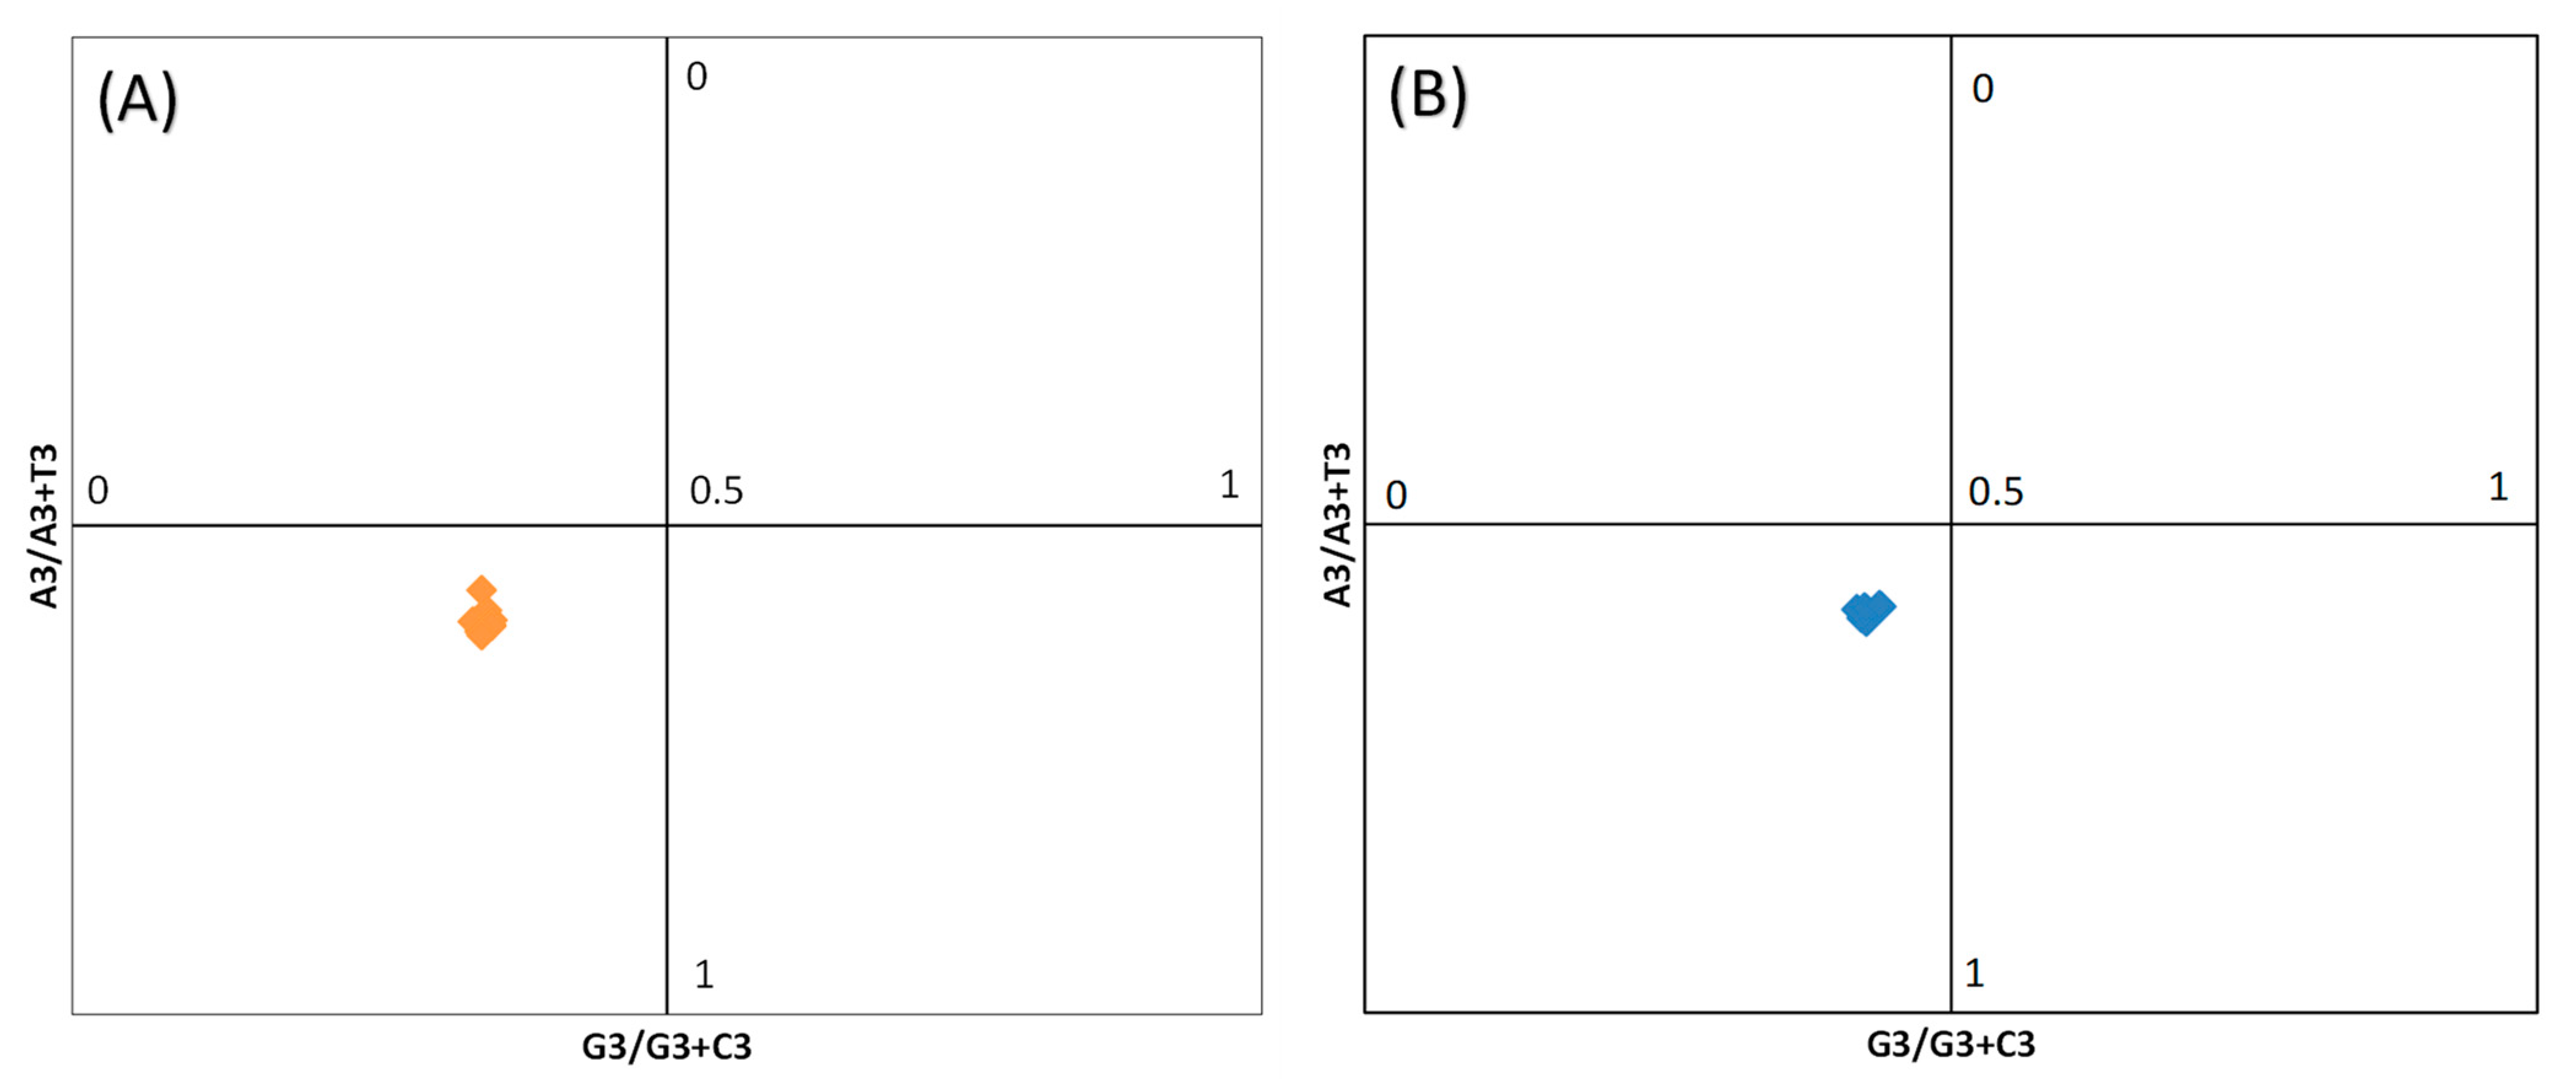
The ENC is a notable index for evaluating CUB in genes and genomes. ENC value ranges from 20 to 61. A gene with an ENC value of 20 has a strong bias, i.e., it uses just one codon to encode each amino acid individually, whereas a value of 61 indicates no bias, i.e., all synonymous codons are equally utilized to code a particular amino acid. The stronger the CUB, the lower the ENC number [37]. Furthermore, when the ENC score is equal to or less than 35, the gene is regarded to have significant use biasness [37]. GC3s, which indicate the contents of G and C at the third nucleotide position of codons excluding those encoding Met (AUG) and Trp (UGG), is a significant indicator of nucleotide composition bias. The ENC-GC3s plot was created to investigate the origins of CUB variation. The predicted ENC value of each gene was determined using Wright’s [37] formula:
ENC   = 2 + GC 3 + 29 GC 3 2 + ( 1 CG 3 ) 2
Genes are distributed along or near the anticipated curve when the G + C compositional restriction is a single driving factor. If CUB is primarily impacted by G + C compositional constraints while also being influenced by other variables not related to compositional constraints, the gene will be far below the predicted curve [38].

2.5. PR2-Bias Plot

PR2-bias plot is a two-dimensional graph having A3/(A3 + T3) as horizontal and G3/(G3 + C3) as vertical axis, representing the nucleotide compositions at the third position of the codons which estimates the effect of mutation pressure and natural selection by analyzing the AT bias and GC bias [39]. The PR2-bias plot is notably meaningful when the four codon amino acids of a gene are evaluated [39]. Ala (GCA, GCU, GCG, GCC), Gly (GGA, GGU, GGG, GGC), Pro (CCA, CCU, CCG, CCC) Thr (ACA, ACU, ACG, ACC), Val (GUA, GUU, GUG, GUC), Arg (CGA, CGU, CGG, CGC), Leu (CUA, CUU, CUG, CUC) and Ser (UCA, UCU, UCG, UCC) are four codon amino acids [39]. The degree and direction of the base deviation is represented by the distribution of points around the center (A = T, G = C). The mean values of A3/(A3 + T3) and G3/(G3 + C3) > 0.5 shows the existence of A and G bias, whereas the values < 0.5 indicate T and C bias. In addition, if A and T (G and C) show proportional distribution, then mutation pressure has complete influence on CUB. In contrast, the disproportional distribution indicates the synchronous impact of natural selection and other factors on CUB [39,40,41].

2.6. Neutrality Plot

The neutrality plot is a quantitative analytical method to study the effect of mutation pressure and natural selection on CUB and plotted against GC12 and GC3. GC12 and GC3 contents were estimated according to Sueoka [42]. A slope of 0 indicates the null effect of directional mutation pressure (full selective constraints), whereas a slope of 1 suggests total neutrality.

2.7. Frequency of Optimal Codon (Fop)

Optimal codon denotes to those codons which have the uppermost codon usage occurrence in some selected species. Additionally, Fop is a regularly used parameter to evaluate gene CUB [43]. Fop refers to the percentage of optimal codons from all synonymous codons in a species [43]. The Fop values range from 0.36, for genes having similar CUB, to 1, for genes having strong CUB [44].
F o p = 1 N i syn ( i ) n i
where, ni refers to the number of codons in ith the gene; N refers to the total number of codons in the gene; and syn (i) is the number of synonymous codons corresponding to an amino acid with codon i coding [45].

2.8. Evaluation and Analysis of Gene Expression

RCBS is the relative CUB of each codon in the gene with an influence on overall scoring, i.e., able to estimate CUB without a reference set [46], which is used to evaluate gene expression. The RCBS value of each FAE1 and FAD2 gene sequence is calculated according to formula provided by Fox and Erill [47].

2.9. Clustering Based on Codon Usage Bias

Conduct clustering based on CUB on six FAE1 and FAD2 genes [48] was calculated using R software (version 4.2.0, Vienna, Austria). In codon usage frequency analysis, the gene is considered a factor and relative codons as variables. The RSCU value of 59 synonymous codons [after removing three termination codons (UAA, UAG, UGA), AUG (Met) and UGG (Trp) codons] was used for the analysis of CUB.

2.10. Codon Adaptation Index (CAI)

Codon Adaptation Index (CAI) values are frequently used to assess the degree of bias toward codons which are favored in highly expressed genes. The greater the value, which ranges from 0 to 1, the stronger the codon uses bias, and the higher the expression level. Genes coding for ribosomal proteins in Brassica species under the study were utilized to compute CAI values [37], an estimate of gene expression level based on the concept that translational selection can help in optimizing the gene sequences according to their level of expression. Aromaticity values represent the proportion of aromatic amino acids (Phe, Tyr, Trp) in the translated gene product.

2.11. Correspondence Analysis (COA)

Correspondence analysis has been extensively used to understand the trend of codon usage variation among the related genes [19,49]. It is being used to overcome the biases at the amino acid level and analysis is operated on RSCU values of each codon. This multidimensional approach plots the studied genes as per their RSCU values in 59-dimentional space (after exclusion of tryptophan, methionine, and stop codons) and plots the principal correspondence portions of dissimilarity among orthologs [49,50]. It consists of the codon usages matrix and is plotted into two dimensions: X (total number of orthologs) and Y (codon usage values). Further, visual output can eradicate the superfluous noise and provide simple representation of the complex data [43].

2.12. Statistical Analysis

A heat map showing the Pearson correlation coefficient of the codon, GC3, and RSCU value of different Brassica species, using the hierarchical clustering method was generated through R software [51]. Different software such as Microsoft excel, MEGA5 (phylogenetic analysis), CUSP (GC1 and GC2), CAIcal (CAI) [52], and CodonW (http://codonw.sourceforge.net/) (accessed on 15 June 2022) (correspondence analysis, GRAVY, and Aromo, etc.) [35] were used for analyzing the different parameters related to CUB.

3. Results

3.1. SNPs and Amino Acid Alterations in the Conserved Regions of FAE1 and FAD2 Genes

In the present study, the FAE1 CDS sequence was found to be almost conserved; however, 94 SNPs were present at different nucleotide positions across the U’s triangle species for FAE1.1 (A-genome), FAE1.2 (B-genome), and FAE1.3 (C-genome) (Supplementary File S1). In addition, 25 SNPs were found due to transversion whereas 69 SNPs were due to transition. In transition, 27 and 42 SNPs were due to purine (A→G) and pyrimidine (C→T), respectively. However, out of 94 SNPs, only 23 missense-type codons encoded functionally different amino acids during protein synthesis and out of it, only 8 codons coded different groups (charge ↔ uncharged and/or positive ↔ negative) of amino acids (D/G40, H/Y140, E/K170, E/K174, N/K177, K/T181, N/D283, G/R286) that changed the protein configuration.
As FAD2 CDS sequence was concerned, almost 50% of the initial part was conserved and the remaining portion was non-conserved. In the conserved region, 62 SNPs were present at different nucleotide positions across the six Brassica species for FAD2.1 (A-genome), FAD2.2 (B-genome), and FAD2.3 (C-genome) (Supplementary File S2). Further, 37 and 25 SNPs were due to transition and transversion types of mutations, respectively. In transition, 12 and 25 SNPs were due to purine (A↔G) and pyrimidine (C↔T), respectively. However, out of 62 SNPs, only 12 missense codons encoded different amino acids at the protein level and only 2 codons (charge ↔ uncharged) encoded different amino acids (E/Q8 and H/Q79) that changed the protein configuration.

3.2. Analysis of Codon Bias of FAE1 and FAD2 Genes in Different Brassica Species

The codon usage biases (CUB) reveal the foundation of selective use of codons in the genome [53]. A heat map was constructed to understand the relationship between codon usage variation and base composition at the third base position, particularly, GC content (Figure 1). The result showed that most of the codons ended with A/T and G/C are positively correlated with GC3 in FAE1 and FAD2 genes, respectively. In FAE1, the most frequently used codons are AAC, GTT, CTT, and GAT; however, some codons ended with G/A (AAA and AAG)were also substantially used (Figure 1A). In FAD2, the most frequently used codons ended with C/G (TAC, TTC, CTC, AAG, GAC and ATC); however, one codon that ended with T (CCT) was also used frequently in the genome (Figure 1B). Thus, codon usage might be under the influence of GC3 preference in both genes.

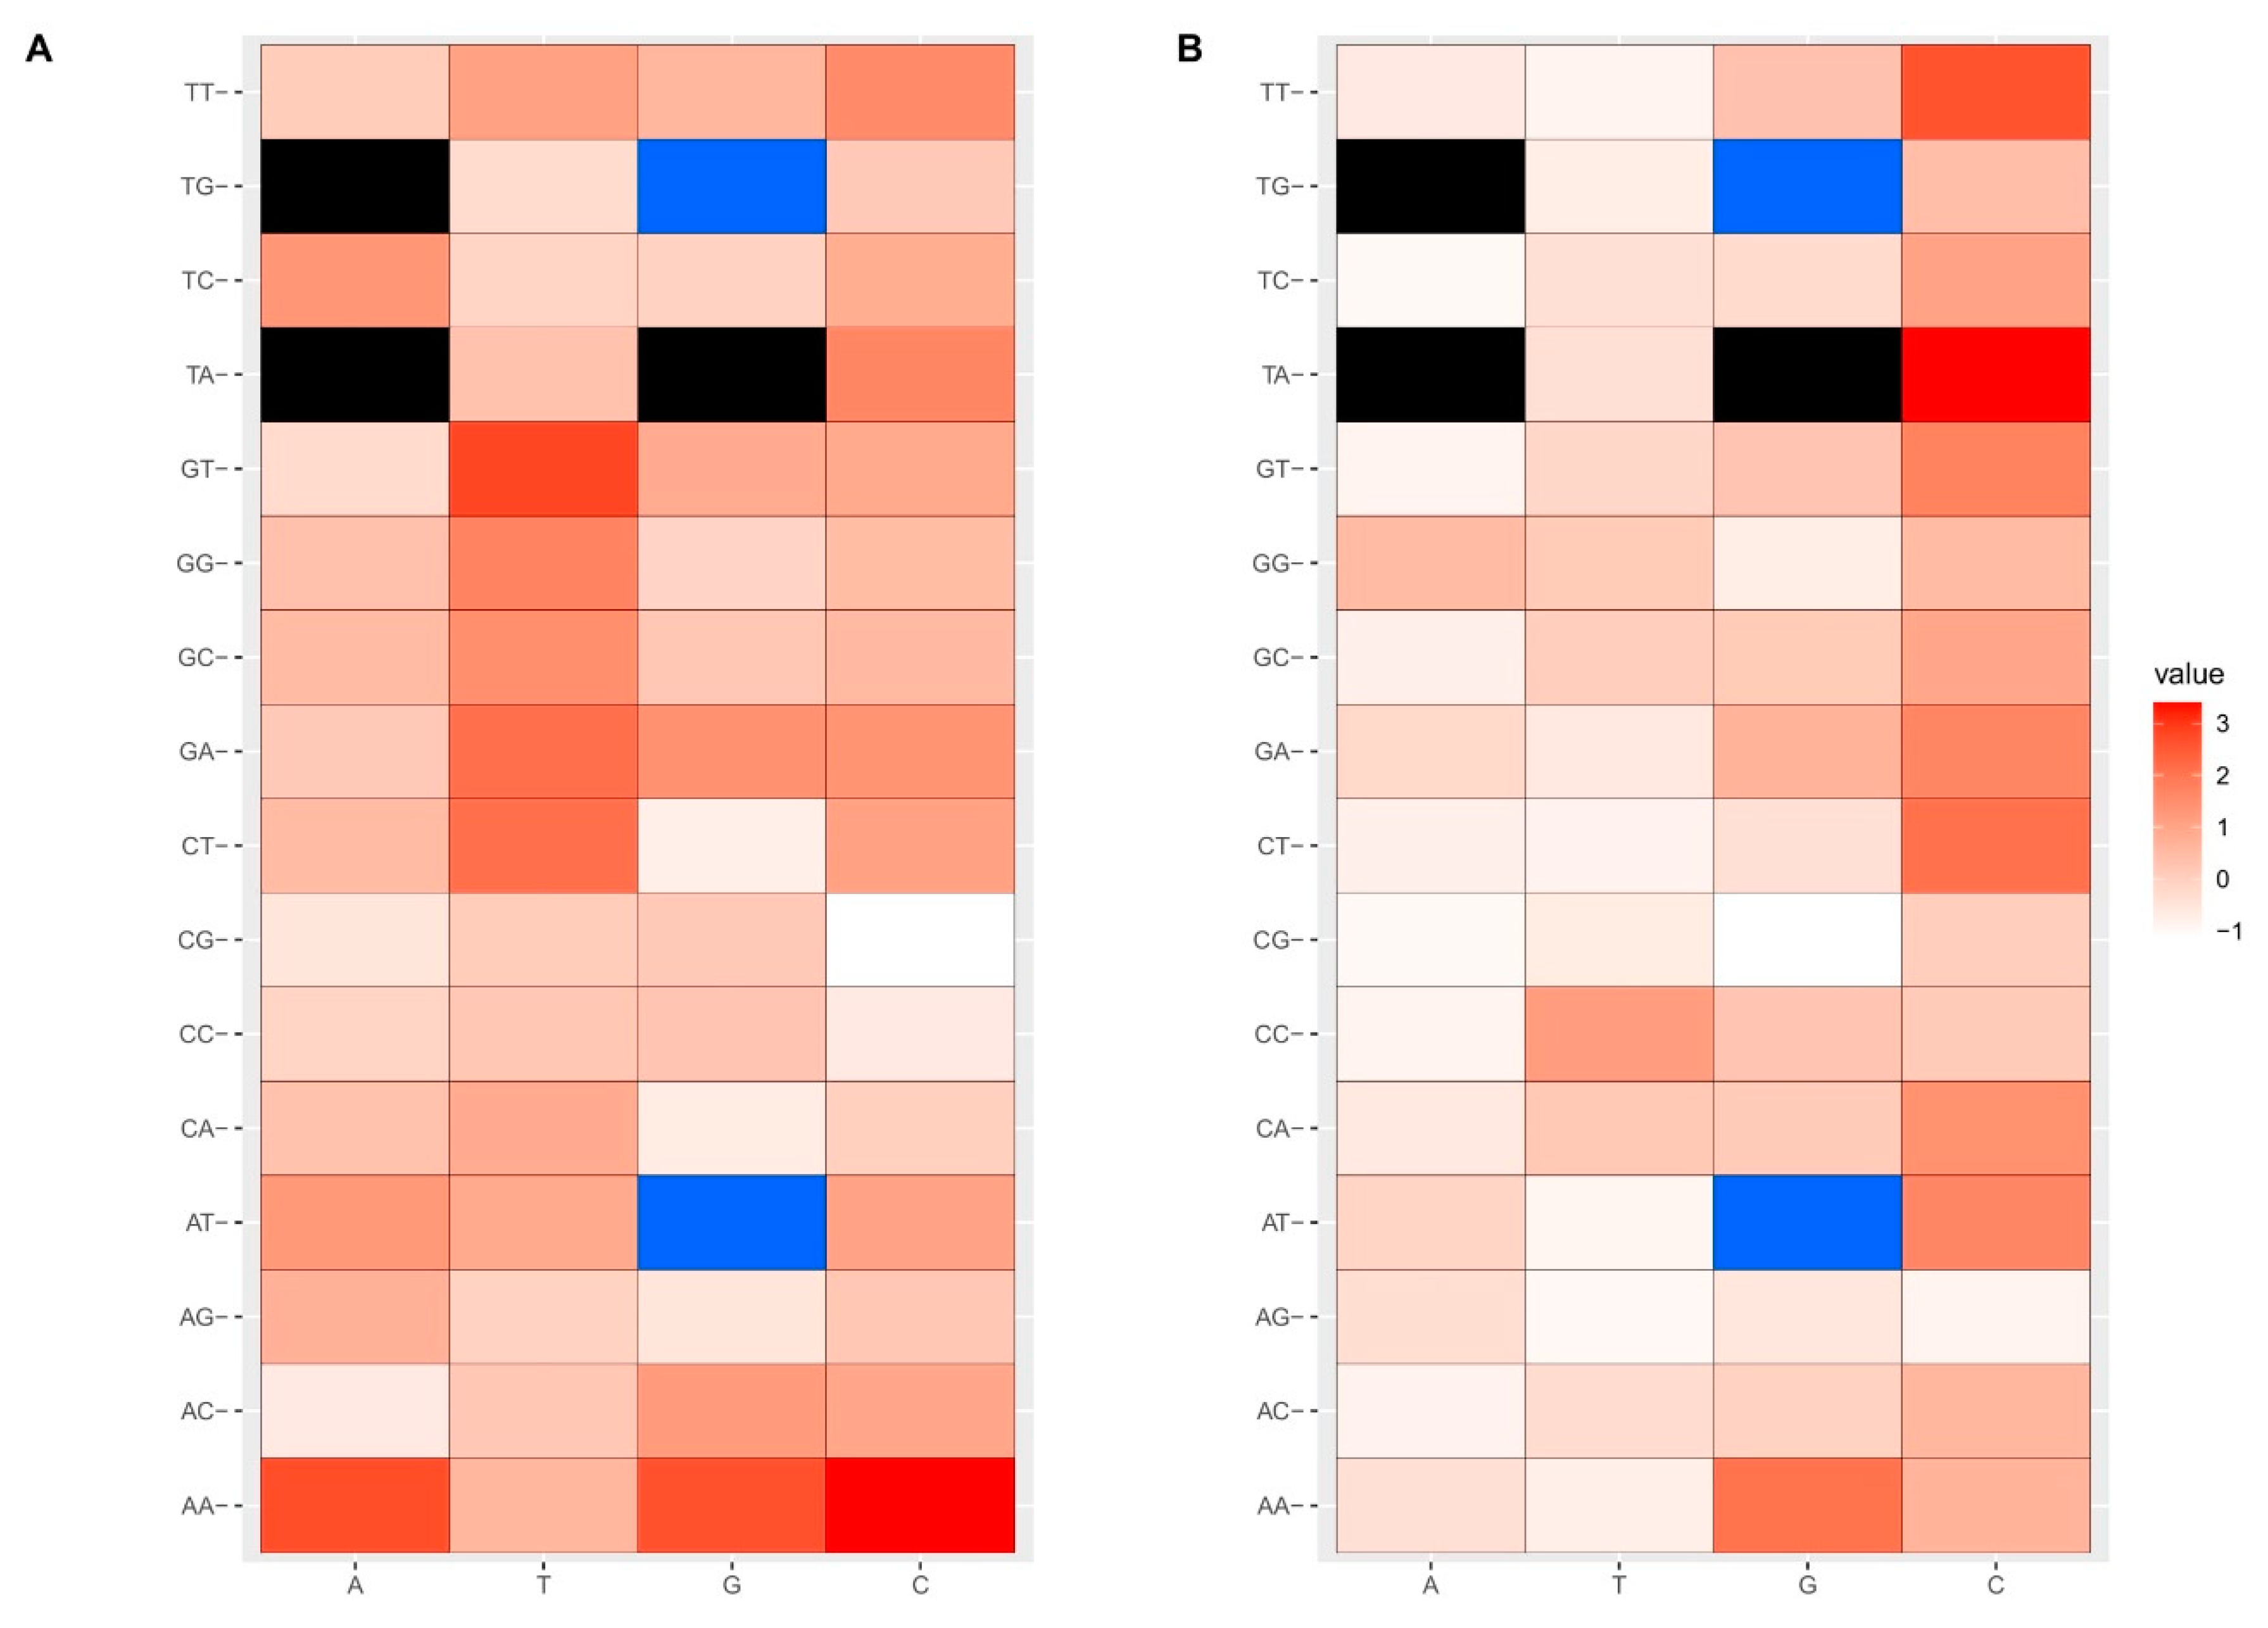
3.3. Preference of FAE1 and FAD2 Gene Codon Ended with G/C in Different Brassica Species

In the present study, the base composition of FAE1 and FAD2 gene coding sequence has been dissected in six Brassica species (Table 2). In FAE1, the average content of nucleotide A was highest (417.44) followed by T (407.22), C (350.66), and G (345.66). The average AT and GC content were 54.20 and 45.80%, respectively. Evidently, it revealed that the usage frequency of AT was relatively higher than GC among coding sequences of FAE1 gene in six Brassica species. An average GC content (GC12) on the first and second nucleotide position of the codon was 44.0% which was less than AT12 (56.0%). Among the third nucleotide position of the codon, T3 was highest (150.77) followed by C3 (143.11) whereas A3 (105.66) and G3 (107.44) were almost equal. This study highlights that codon closed with A/T was slightly preferred over G/C in the FAE1 gene coding sequence across the species. The frequency of optimal codon (Fop) analysis showed that 11 optimal codons were closed with A/T in the FAE1 gene of six Brassica species; however, only seven optimal codons ended with G/C (TTC, CCG, ACG, TAC, AAC, GAG, and TGC) whereas codon CGC was not even preferred (Figure 2A).
In the case of FAD2, the average content of nucleotide C was highest (363.44) followed by G (273.22), T (271.00), and A (247.00). The average AT and GC content were 44.9 and 55.1%, respectively. It highlighted that the usage frequency of GC was relatively higher than AT among FAD2 gene coding sequences in six Brassica species. Among the third nucleotide position of the codon, the content revealed that C3 (184.33) was the highest followed by G3 (97.67), T3 (61.44), and A3 (41.44) content. Interestingly, it was observed that AT content (54%) at the first and second position of the codon was higher than GC content (GC12) (Table 2). This study also highlighted that out of 19 Fop, 17 optimal codons closed with G/C were preferred over A/T in the FAD2 gene coding sequences across the six species; however, only two optimal codons (CCT and GGA) were closed with A/T whereas codon CGG was not used for coding the respective amino acid (Figure 2B).

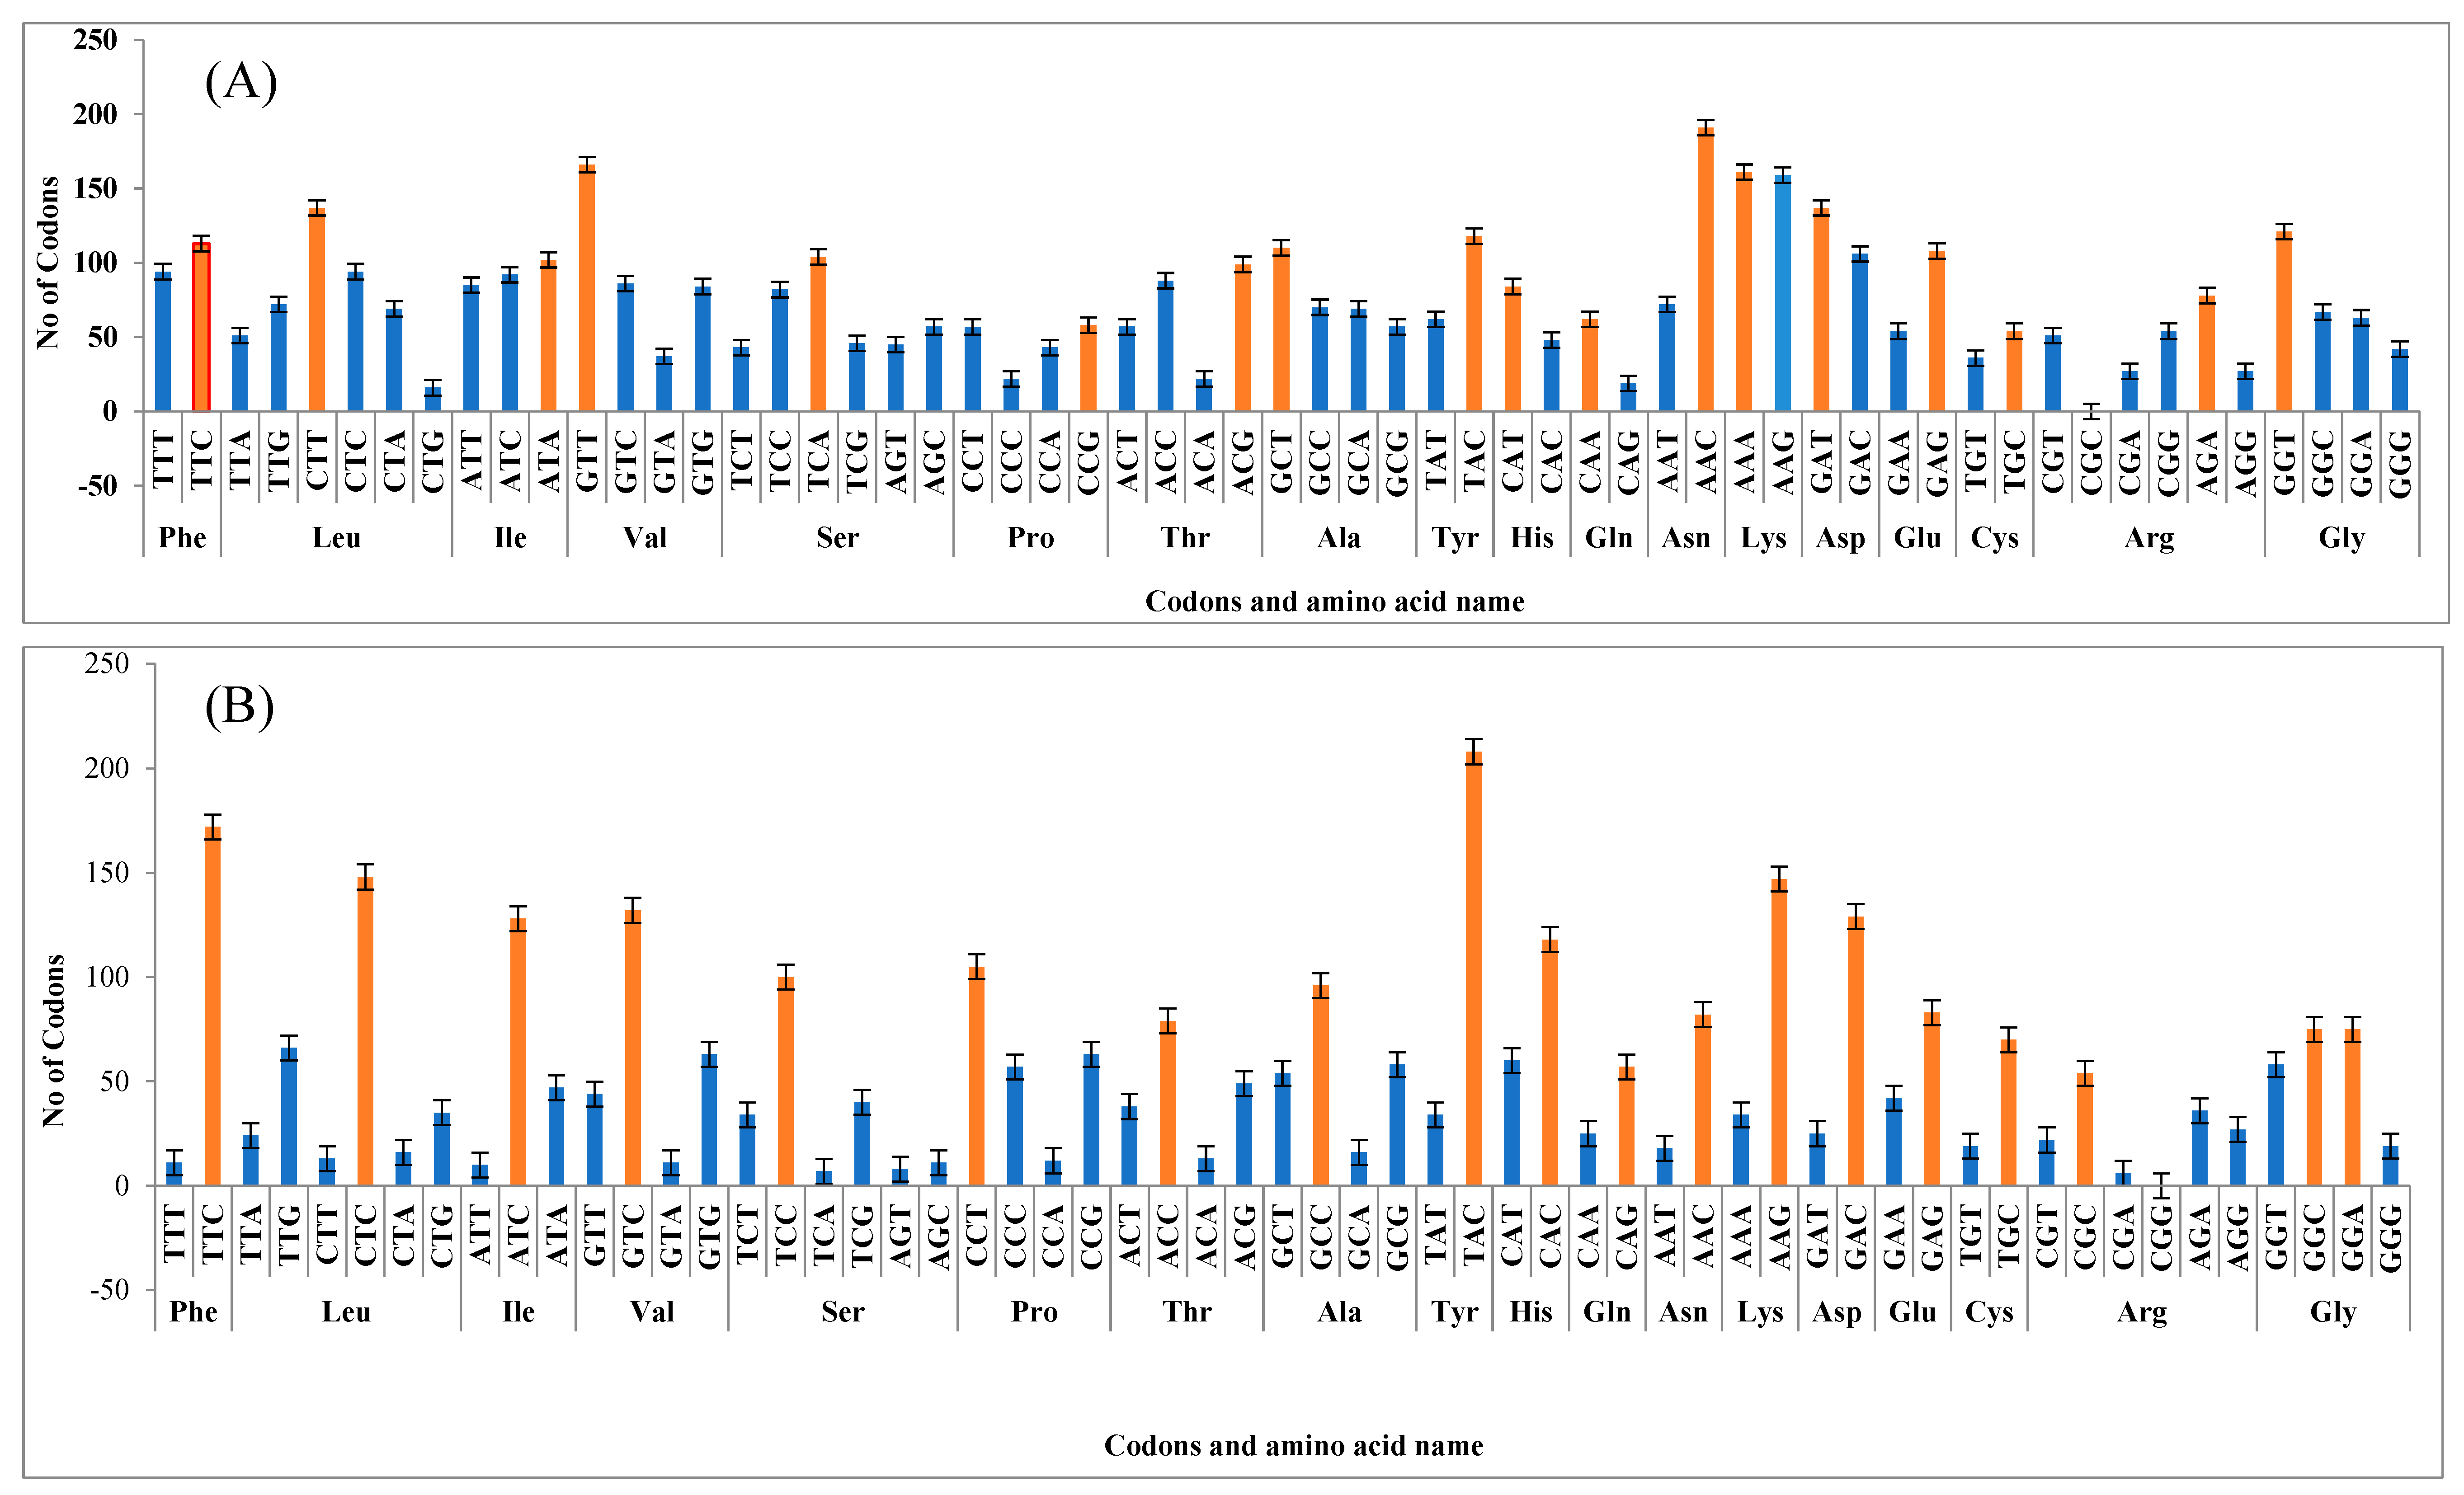
3.4. Relative Synonymous Codon Usage of FAE1 and FAD2 Genes

For FAE1, an RSCU value greater than one specifies high relative usage frequency, whereas a value superior to 1.60 advocates a robust preference. Moreover, 24 codons had an RSCU value greater than 1 and showed high usage frequency in different Brassica species. Among them, 13 high-frequency codons revealed a significant preference for codons ended with A/T (Table 3). However, codons closed with G/C (11) were almost preferred equally in six Brassica species. The RSCU cluster analysis showed that the RSCU value of codon CTT, GTT, TCA, GGT, and AGA was higher than 1.6 across the six Brassica species and showed relatively strong preference among FAE1 genes in different species (Figure 3). For FAD2, 29 codons had an RSCU value greater than 1 in different Brassica species. Among them, 23 high-frequency codons revealed a significant preference for codons that ended with G/C (Table 3). However, codons closed with C were highly preferred in six Brassica species. The RSCU cluster analysis showed that the RSCU value of codon TTC, CTC, ATC, GTC, TCC, ACC (except in Bna.FAD2.1), CCT, TAC, GCC, TAC, AAC, AAG, GAC, and CGC were higher than 1.6 across the six Brassica species and showed relatively strong preference among FAD2 genes in different species (Figure 3).

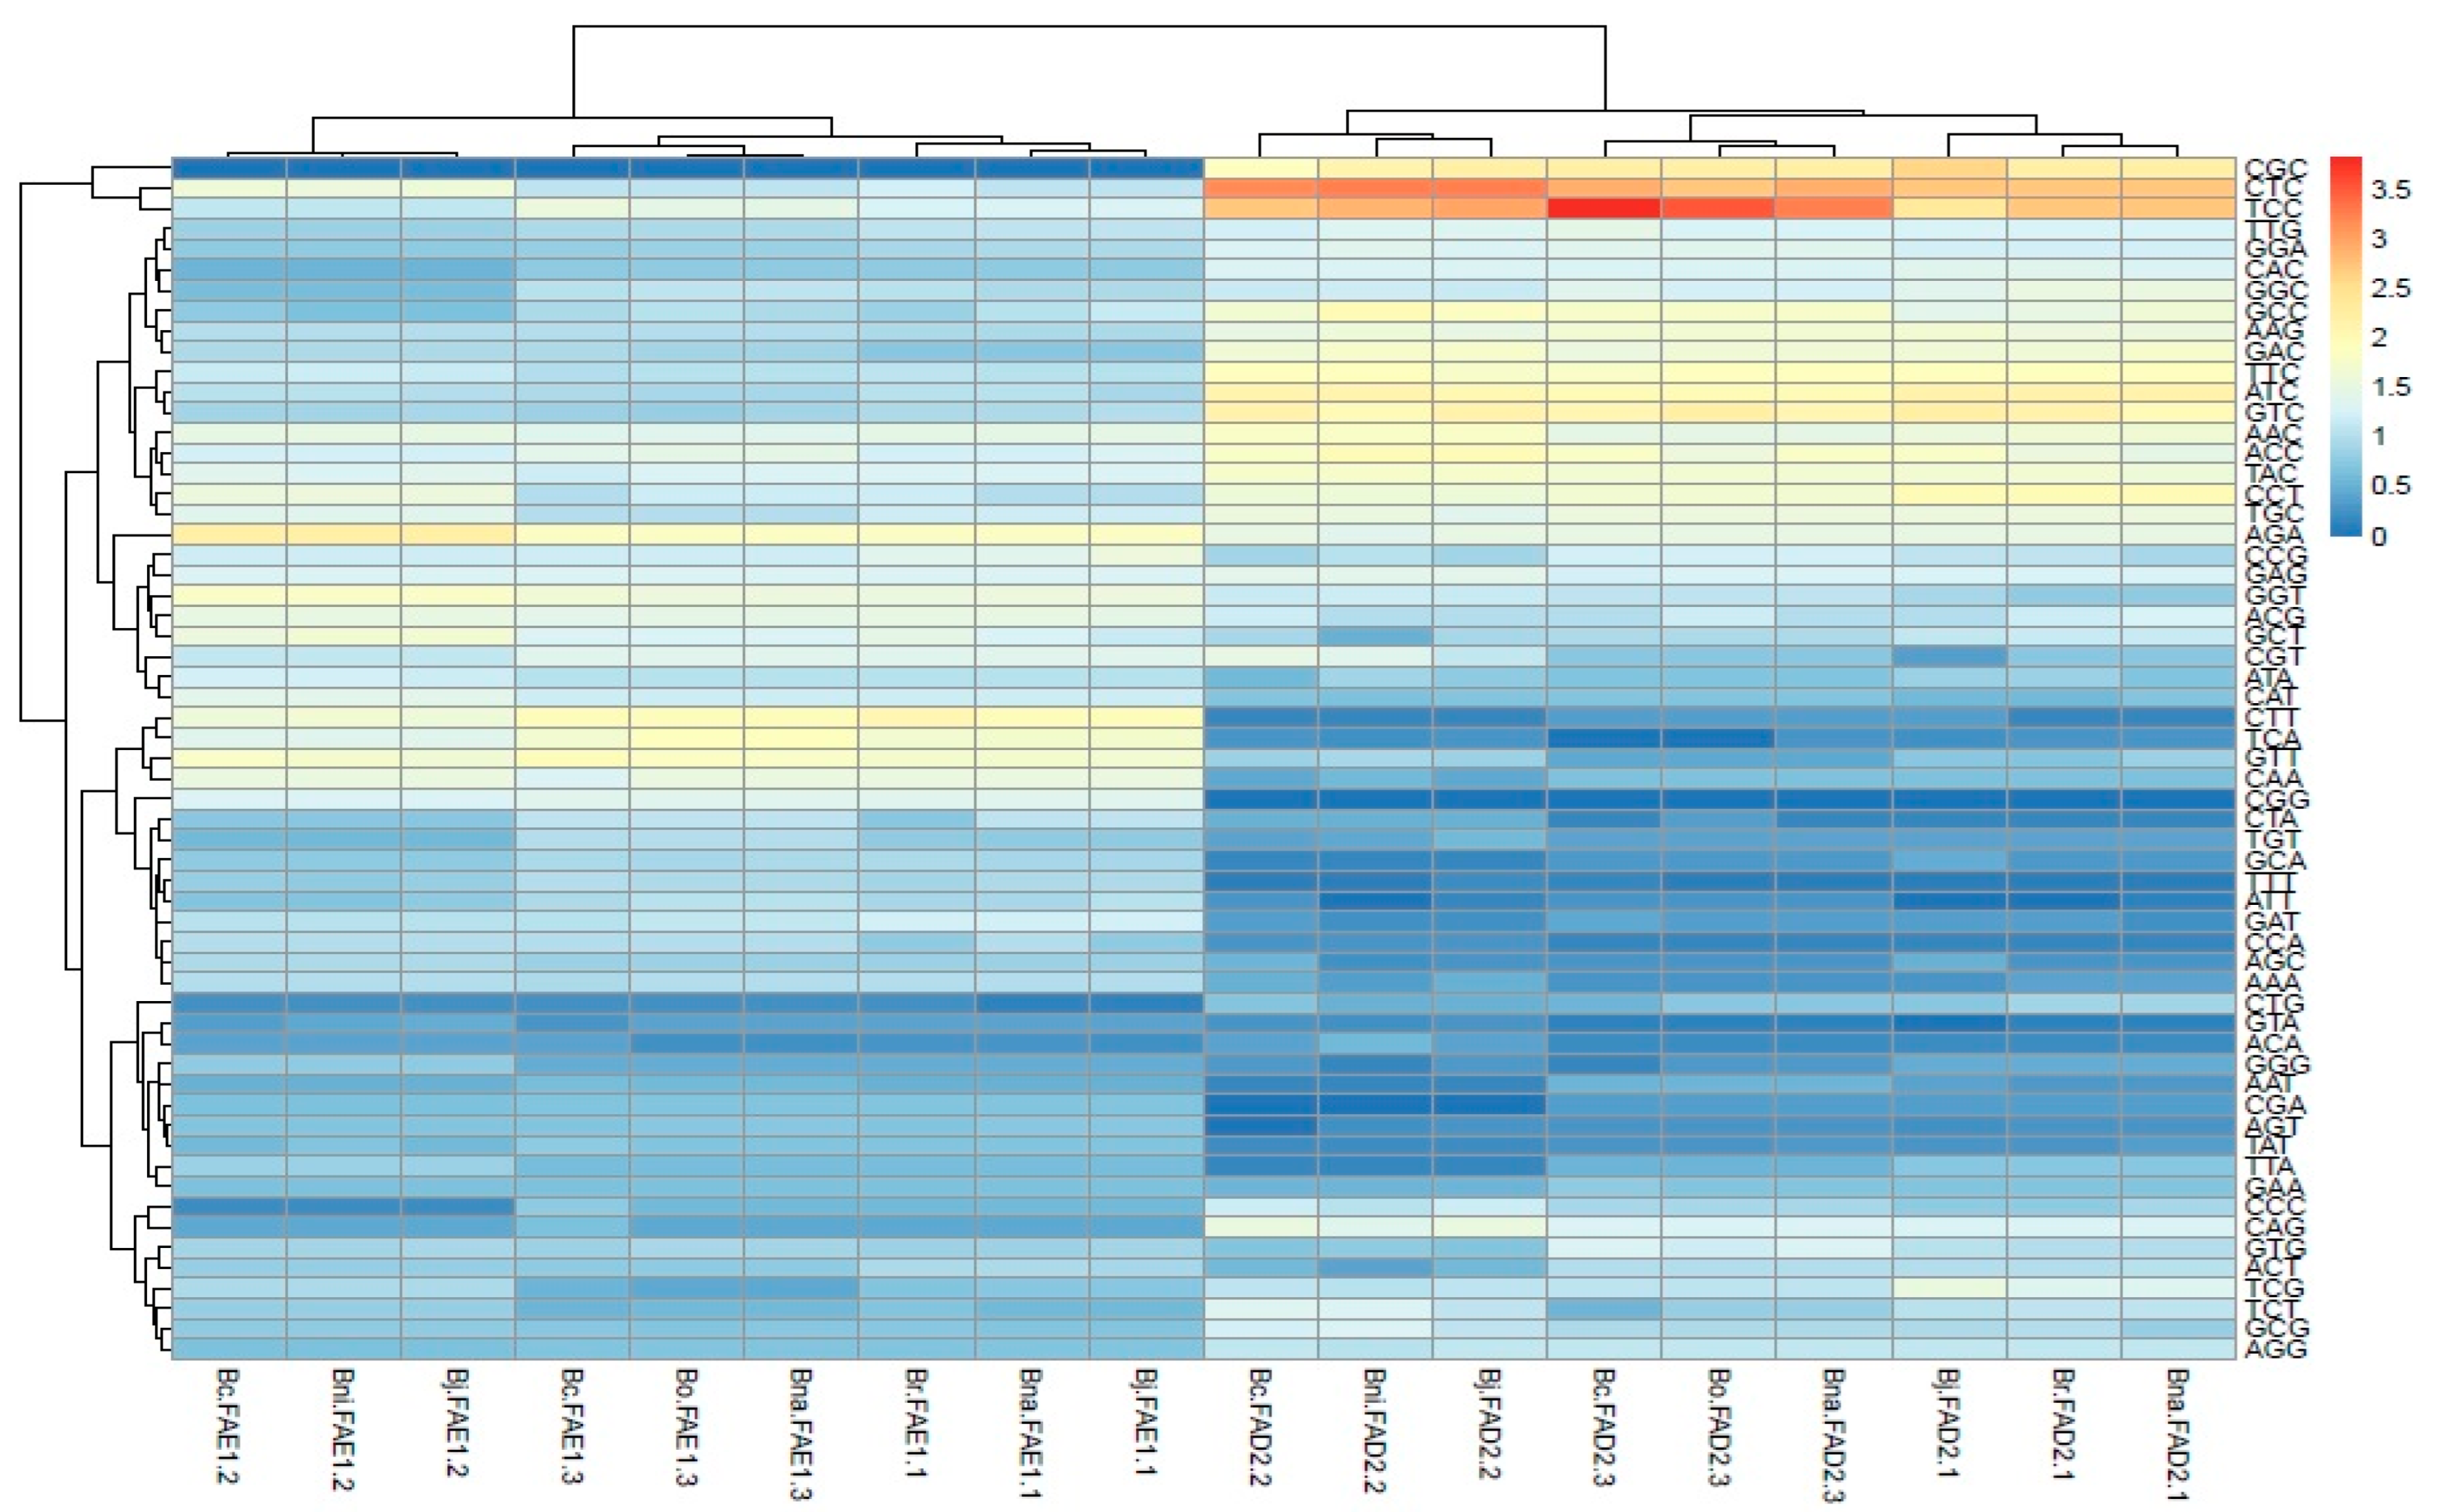
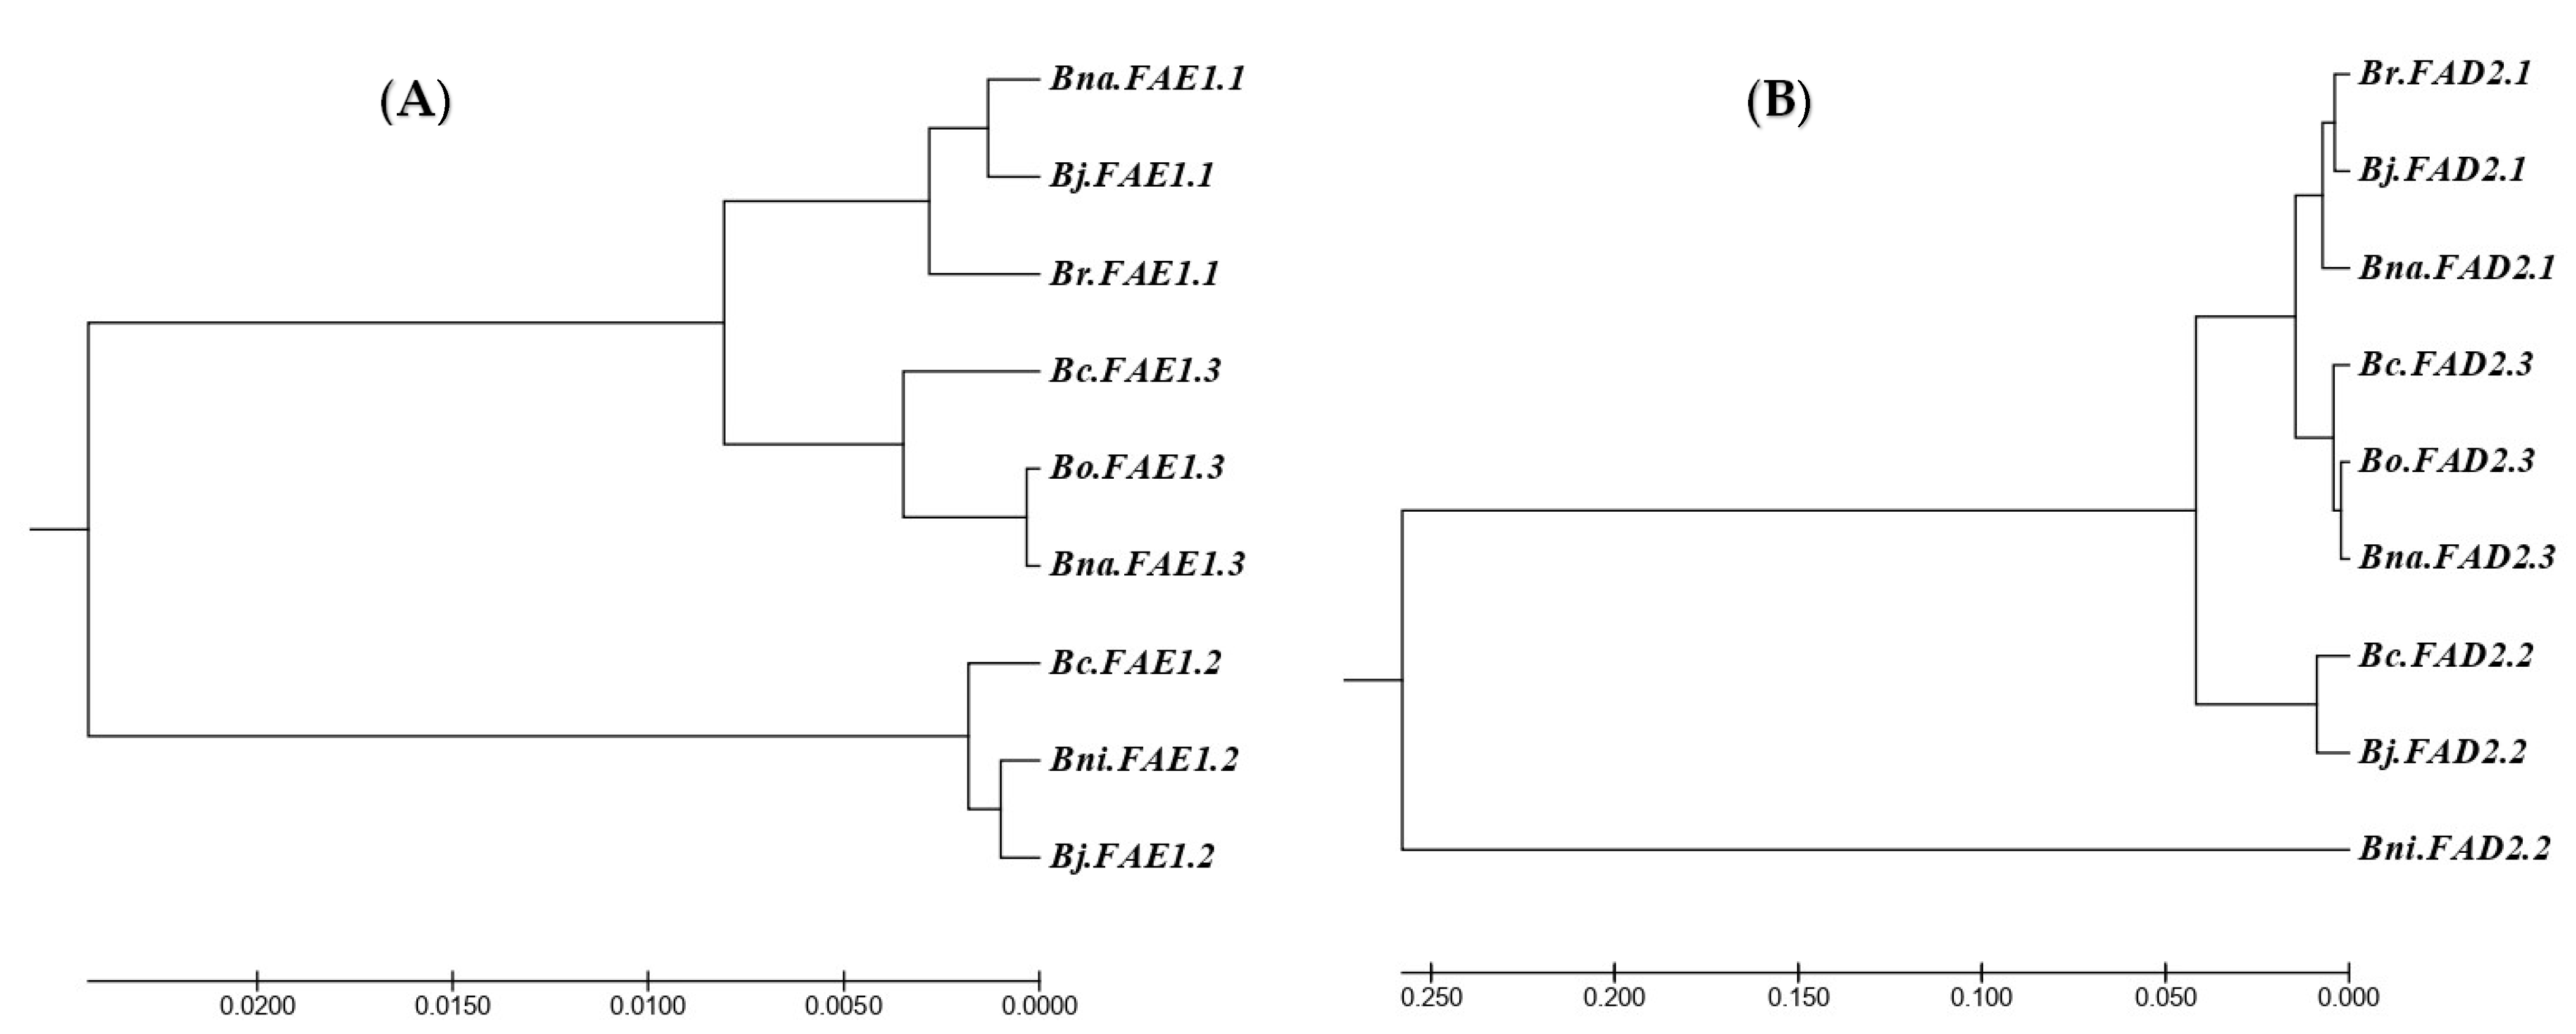
3.5. System Relationship of Codon Usage Patterns of FAE1 and FAD2 Genes

In the study, RSCU of FAE1 and FAD2 genes were used to establish adjacent evolutionary trees (neighbor-joining) in different Brassica species. The study highlighted that for each gene with a closer proximity between species had a significantly similar codon usage mode. For the FAE1 gene, Bna.FAE1.1 was nearer to Bj.FAE1.1 in comparison to Br.FAE1.1; Bo.FAE1.3 is adjacent to Bna.FAE1.3 whereas Bj.FAE1.2 was more similar to Bni.FAE1.2. Furthermore, FAE1.1 was closer to FAE1.3 than FAE 1.2 (Figure 4A). For the FAD2 gene, Br.FAD2.1 was closer to Bj.FAD2.1 than Bna.FAD2.1, whereas Bc.FAD2.3 was closer to Bo.FAD2.3 and Bna.FAD2.3. Further, Bc.FAD2.2 was more adjacent to Bj.FAD2.2 than other orthologs. In addition, FAD2.1 and FAD2.3 were placed in the same clade whereas Bc.FAD2.2 and Bj.FAD2.2 were placed in the second clade. In addition, Bni.FAD2.2 was grouped into the third clade that showed its divergence from other Brassica species for FAD2 orthologs sequences based on FAD2 nucleotide sequences. However, the evolutionary clade distance highlighted that Bni.FAD2.2 showed a resemblance with Bj.FAD2.2 and Bc.FAD2.2 than other orthologs (Figure 4B). In the earlier studies, it has been reported that genes with similar functions have similar codon usage modes [54,55]. Thus, all the studied Brassica genotypes showed a peculiar relationship with each other based on synonymous codon usage patterns for FAE1 and FAD2 genes.

3.6. Influence from Selection Pressure of FAE1 and FAD2 Genes in Different Brassica Species

In the study, for FAE1, ENC value ranged from 55.75 to 57.83 (average value 56.80), revealing that there was relatively less variation in the usage of FAE1 gene codons among different Brassica species. However, GC3s values were ranged from 0.489 to 0.501 (average value 0.494) (Table 4). The Fop and GC3 showed a positive correlation (Pearson r = 0.484, p < 0.05) between each other, but both GC3 (r = −0.784) and Fop values (r = −0.642) showed a significant negative correlation with ENC values (Table 4; Figure 5A). The RCBS value ranged from 0.124 to 0.135 (average value 0.130) (Table 4; Figure 6). CAI ranged from 0.120 to 0.125 (average value 0.122), RCA from 0.493 to 0.506 (average value 0.499), and CBI from 0.072 to 0.098 (average value 0.085). The RCBS was negatively correlated with RCA (r = −0.196) and CAI (r = −0.490), but positively correlated with CBI (r = +0.456). Aromaticity ranged from 0.093 to 0.097 (average value 0.095), the length of the amino acid is 506, and the length of the amino acid represents the number of translatable codons. The number of synonymous codons (L_sym) is 492 (Table 4).
As FAD2 gene is concerned, the ENC value ranged from 43.70 to 46.57 (average value 45.13), revealing that there was relatively less variation in the usage of FAD2 gene codons among different Brassica species. However, GC3s values ranged from 0.725 to 0.742 (average value 0.732). The correlation studies highlighted that ENC had negative association with GC3 (r = −0.869; p < 0.05) and Fop values (r = −0.398); however, a positive correlation was observed between Fop and GC3 (Pearson r = 0.147, p < 0.05) (Table 4, Figure 5B). The RCBS value ranged from 0.184 to 0.213 (average value 0.198) (Table 4; Figure 6). CAI was ranged from 0.128 to 0.135 (average value 0.131), RCA from 0.562 to 0.582 (average value 0.572), and CBI from 0.206 to 0.218 (average value 0.212). The RCBS was negatively correlated with RCA (r = −0.430) and CAI (r = −0.736), but positively correlated with CBI (r = +0.282). Aromaticity ranged from 0.151 to 0.156 (average value 0.155), the length of the amino acid was 384 (except 383 for Bni.FAD2.2), and the length of the synonymous codons varied from 364 (BniFAD2.2, Bj.FAD2.2, and Bc.FAD2.2) to 366 (Br.FAD2.1). The RCBS values indicated that FAE1 and FAD2 genes with lower expression had a lower codon preference.

3.7. Neutrality Plot

Neutrality plot analysis was done to understand the impact of selection pressure/mutation on codon usage in the genome [56]. The neutrality plot was plotted between GC content at the first and second position on the codon (GC12) and GC content at the third position (GC3). Gene FAE1 showed non-significant positive correlation (Pearson r = 0.242 and R2 = 0.059) and a near-zero regression slope (0.084) between GC12 and GC3 whereas a high significant positive correlation (Pearson r = 0.765; p < 0.05 and R2 = 0.586) and medium regression slope (0.616) for the FAD2 gene was observed. Previously it has been found that if selection pressure plays a crucial role then the correlation between GC12 and GC3 will be low and the slope of regression will be close to 0 and vice versa for the mutation [57]. In our study, we found a very low correlation and the slope of regression was close to 0 for FAE1 (Figure 7A), whereas the correlation was high and the slope of regression was close to 0.50 for FAD2 (Figure 7B).

3.8. PR-2 Bias Plot

It has been used to determine the significant impact of mutation or selection pressure on the genetic composition of the genome [57]. Selection pressure or mutational constraints result in the biased use of nucleotides at synonymous codon positions [58]. If the values accumulate at the center (0.5) of the PR2 plot, then this indicates that the absence of any bias or occurred mutation was dominant. In our study, FAD2 was positioned much closer to the center than FAE1, indicating natural selection plays a major role in codon usage for FAD2. (Figure 8B), whereas a higher distance for FAE1 genes (Figure 8A) indicates that mutation pressure could play the main role. Furthermore, it also highlighted that C/T was biasedly used at synonymous codon positions in both genes across the Brassica species.

3.9. Correspondence Analysis

Correspondence analysis (COA) was done to investigate the codon usage variation among FAE1 and FAD2 genes across the U’s species (Figure 9). For FAE1, the first principal axis consisted of 78.2% of the total variation whereas the second principal axis described only 11.9% of the variation (Figure 9A). The FAE1 orthologs mainly partitioned into two distinguished groups alongside the horizontal axis (Figure 9B). Three orthologs (Bj.FAE1.2, Bc.FAE1.2 and Bni.FAE1.2) were partitioned at the extreme right side of the axis-1 and have a high codon bias whereas other orthologs were positioned at the left side (upper and lower) of the axis-1 and have weak biasness. In addition, COA also highlighted that codons ended with AT and GC were almost equally distributed at both sides (left and right) of the axis-1 (Figure 9C), highlighting that selection played a vital role in codon usage bias for the FAE1 gene. Likewise, for the FAD2 gene, the first and second principal axis consisted of 56.5% and 22.5%, respectively, of the total variation (Figure 9D). In addition, three orthologs (Bni.FAD2.2, Bj.FAD2.2 and Bc.FAD2.2) were positioned at the extreme left of the axis-1 and other orthologs were located on the right side of axis-1 (Figure 9E). Further, COA also highlighted that codons ended with GC were distributed near the origin whereas codons ended with AT were scattered away from the origin (Figure 9F), highlighting that mutation with other factors played a vital role in codon usage bias for the FAD2 gene. Therefore, COA clearly differentiated the studied genes as per their codon usage variation and also demonstrated the effect of nucleotide composition at each codon.

4. Discussion

The CUB of different creatures is affected by various genomic attributes such as genetic code, gene length, recombination frequency, GC content, and level of gene expression [46,59]. Furthermore, researchers also highlighted that codon bias might be influenced by mutation or selection pressure, replication and preferred transcription, preferred translation, and protein hydrophobicity [55,60]. Both mutational pressure and selection constraints have a great impact on codon usage from prokaryotic cells to multicellular eukaryotic organisms [61,62]. Selection pressure affected codon usage in multicellular eukaryotic model organisms such as Caenorhabditis elagans and Drosophila melanogaster [63]. However, it was influenced by both selection pressure and mutation in viruses such as the Parvoviridae family [64]. In plants, each gene has a different codon frequency and even in the same amino acid there will be a different ratio or composition of used codons, and the composition of nucleotide in codon affects CUB [65]. The balance of mutation and reverse mutation frequency in the base composition of codon decides the frequency of nucleotides used in the genomic DNA [66]. Generally, mutation at the third nucleotide position of codon does not affect the translated amino acid in protein formation and the GC content plays a vital role to express the trend of mutation. Consequently, the third nucleotide of the codon has more buffering capacity to nullify the mutational pressure, and GC3 could also be used in the study of CUB.
In this study, most of the codons ended with A/T and G/C in FAE1, and FAD2, respectively, across the U’s triangle Brassica species. Overall, AT content was higher than GC content among FAE1 and vice-versa among FAD2 genes across the species. Previously, researchers revealed increased AT over GC content in the genome of plant species for different genes and most of the codons ended with A/T [55,67]. Fop estimation highlighted that most of the optimal codons ended with A/T in FAE1, yet preferred it with G/C in FAD2. Out of 59 synonymous codons, 24 and 29 codons in FAE1 and FAD2 genes, respectively, had RSCU values greater than 1, highlighting that these codons have high usage frequency in six Brassica species. For FAE1, evolutionary and clustering studies revealed that B. rapa, B. napus, and B. juncea were grouped in one cluster for FAE1.1; B. oleracea, B. napus, and B. carinata in the second cluster for FAE1.3; and B. nigra, B. carinata, and B. juncea in the third cluster for FAE1.2 and further similar codon usage within the same group for FAE1 orthologs. Moreover, Brassica species having A genome are closer to C genomic species than B genomic species for FAE1. For FAD2 gene also, A genomic species were clustered in one cluster, C genomic species were grouped in the second cluster, and B genomic species, except B. nigra, were clustered in the third cluster. However, B. nigra was positioned into a completely separate cluster but showed more affinity to B. campestris and B. juncea for FAD2.2. Similarly, for FAD2 gene, Brassica species having A genome are closer to C genomic species than B genomic species.
A higher value of ENC represents the lower level of gene expression in Brassica species. In this study, the ENC value was higher for FAE1 than FAD2 genes, highlighting that the FAE1 gene showed less CUB than FAD2. For both the genes, ENC value was more than 43 in all six Brassica species and indicated a lower level of gene expression across the species. Different crop species show different codon usage preferences and different genes within a plant species vary in terms of codon preferences [55]. In both genes, the study emphasized that there was a significant negative relationship between ENC and GC3s, and ENC and Fop; however, a positive correlation was observed between Fop and GC3s. These results were opposite to the previous studies [55,68] where ENC was positively associated with GC3 and highlighted that codon usage inclination depends upon the third nucleotide position as G/C in the genome. Fop values indicated that both genes had a minimal level of codon usage bias across the different Brassica species.
The gene RCBS values can be used to measure the effective index of gene expression, whose value is mainly under the influence of gene base composition preference [37]. In the present investigation, both the genes that had a lower value of RCBS indicated lower gene expression corresponding to lower codon preference. These findings are in accordance with the previous research where the lower values of RCBS were reported in the AP2 gene [55]). Codon adaptation index (CAI) is a measurement of the relative adaptiveness of the codon usage of a gene towards the codon usage of highly expressed genes, i.e., predicting the expression level of a gene [36]. In this study, CAI values for both the genes were found low (<0.135). Codon bias index (CBI) measures the extent to which a gene uses a subset of optimal codons [69]. In our findings, CAI was negatively correlated with CBI for FAE1 (r = −0.006) and positively for FAD2 (r = +0.047) gene. The lower value of CAI and CBI for both the genes depicted that there was a low level of CUB across the species, which plays a crucial role in deciding the level of gene expression. The values of CAI and CBI were also found low in Ancylostoma ceylanicum and highlighted that the more optimal the codon usage in the coding sequence, the higher the gene expression value [70]. The aromaticity score denotes the frequency of aromatic acids in the hypothetical translated gene product. Aromaticity score is indices of amino acid usage [71]. The variation might be arisen due to the differences in the amino acid composition of the concerned gene. Gene expression is also influenced by aromaticity, length of amino acids, and gravy of a protein. The correlation between CAI and aromaticity score was negative for FAE1 (r = −0.094) and positive for FAD2 (r = 0.587) gene, whereas CAI showed no correlation with the length of amino acids for FAE1 and a positive association with the FAD2 (r = +0.738) gene. Furthermore, ENC showed a significant negative correlation for FAE1 (r = −0.760, p < 0.05) and a positive correlation (r = 0.710, p < 0.05) for FAD2 with the aromaticity score. This highlighted the aromaticity of the FAD2 gene proteins that could affect the CUB and vice-versa with the FAE1 gene across the six Brassica species. This study was supported while studying CUB for the SRY gene in mammals [72] and in A. ceylanicum [70]. The neutrality plot conclusively highlighted that selection pressure played a crucial role in the preference use of codons for the FAE1 gene; however, the role of mutation was high in the FAD2 gene. Previously, a very low correlation and regression slope between GC12 and GC3 was reported in the A. ceylanicum gene, therefore, mutation affected CUB in the genome [70]; however, a high correlation was observed in mitochondrial genes [73]. In the present study, the PR2-bias plot revealed that the proportion of A was not equal to T, and G was not equal to C, at the third nucleotide position of codons for both the genes. The proportion of T3 and C3 was higher than A3 and G3 for the genes, and AT and GC were not proportionally distributed around the center, indicating that mutation along with other factors such as selection pressure played a crucial role for CUB in both the genes. In the present study, correspondence analysis revealed that relative inertia of axis-1 was comparatively higher for FAE1 than FAD2 genes. Based on the positions of the orthologs on the axis-1, three orthologs (Bj.FAE1.2, Bc.FAE1.2, and Bni.FAE1.2) of FAE1 showed less codon usage bias than others; however, three orthologs (Bj.FAE1.2, Bc.FAE1.2, and Bni.FAE1.2) of FAD2 expressed high codon biasness. The correspondence analysis of the synonymous codon usage in FAE1 and FAD2 highlighted that codons that ended with AT and GC were randomly distributed in all the directions for FAE1, whereas codons that ended with GC were positioned around the center, and codons that ended with AT were scattered onto the plot. In this way, it could be concluded that selection pressure played a major role for FAE1 and mutation with other factors played a significant role for FAD2. Selection pressure also played a major role for CUB in A. ceylanicum genes [70] and in the Mycobacterium tuberculosis coding genome [57] and the Jatropha curcas genes [74].

5. Conclusions

Codon usage bias is greatly influenced by mutational pressure and natural selection pressure that affects the distribution of nucleotide patterns across the genomic DNA in all plant and animal species. The information related to CUB is always needed to understand and decode molecular mechanisms of gene evolution, functional adaptiveness, and survival strategies since its inception. In our study, FAE1 and FAD2 genes were AT and GC biased, respectively, and were moderately bias across the six Brassica species. Further, selection pressure played a vital role in CUB for FAE1, yet mutation occurred with other factors for the FAD2 gene. Previously, there were reports in plant species that also supported the role of mutation and selection pressure on codon usage patterns and evolutionary relatedness of each gene with each other based on CUB. In addition, the seed oil quality of Brassica species could be enhanced significantly if the occurrence of natural mutations preexists for low erucic and high oleic acid at the genomic level. Codon manipulation in oilseed Brassica breeding would lead to the development of demand-driven high-quality varieties which will push the sustainable diversification in oilseed crops.

Supplementary Materials

The following supporting information can be downloaded at: https://www.mdpi.com/article/10.3390/su141711035/s1, File S1: Nucleotide and amino acid sequences of FAE1 gene in different Brassica species; File S2: Nucleotide and amino acid sequences of FAD2 gene in different Brassica species.

Author Contributions

Conceptualization, R.C., N.S. and S.C.; methodology, R.C., Y.T. and P.Y.; software, B.K.A. and V.K.M.; validation, R.C., N.S., Y.T., S.V. and D.K.Y.; formal analysis, R.C., S.C. and B.K.A.; investigation, M.K.P. and P.P.; resources, R.C., Y.T., N.S. and S.V.; data curation, R.C., S.C. and N.S.; writing—original draft preparation, R.C. and S.C.; writing—review and editing, N.S., D.K.Y., S.V., Y.T. and S.S.R.; visualization, R.C. and S.C; supervision, N.S. and Y.T.; All authors have read and agreed to the published version of the manuscript.

Funding

This research received no external funding.

Institutional Review Board Statement

Not applicable.

Informed Consent Statement

Not applicable.

Data Availability Statement

All the data are included within the manuscript and the Supplementary Tables.

Acknowledgments

The first author is grateful to ICAR-CRPMB fellowship, NCBI for accessing the genomic data and ICAR-IARI, New Delhi, for providing scientific inputs during the research.

Conflicts of Interest

The authors declare no conflict of interest.

References

  1. Lateef, O.M.; Akintubosun, M.O.; Olaoba, O.T.; Samson, S.O.; Adamczyk, M. Making Sense of “Nonsense” and More: Challenges and Opportunities in the Genetic Code Expansion, in the World of TRNA Modifications. Int. J. Mol. Sci. 2022, 23, 938. [Google Scholar] [CrossRef]
  2. Bailey, S.F.; Alonso Morales, L.A.; Kassen, R. Effects of Synonymous Mutations beyond Codon Bias: The Evidence for Adaptive Synonymous Substitutions from Microbial Evolution Experiments. Genome Biol. Evol. 2021, 13, evab141. [Google Scholar] [CrossRef] [PubMed]
  3. Smolskaya, S.; Andreev, Y.A. Site-Specific Incorporation of Unnatural Amino Acids into Escherichia coli Recombinant Protein: Methodology Development and Recent Achievement. Biomolecules 2019, 9, 255. [Google Scholar] [CrossRef] [PubMed]
  4. Bailey, J. Nucleosides, Nucleotides, Polynucleotides (RNA and DNA) and the Genetic Code. In Inventive Geniuses Who Changed the World; Springer: Cham, Switzerland, 2022; ISBN 9783030813802. [Google Scholar]
  5. Iriarte, A.; Lamolle, G.; Musto, H. Codon Usage Bias: An Endless Tale. J. Mol. Evol. 2021, 89, 589–593. [Google Scholar] [CrossRef] [PubMed]
  6. Jou, W.; Haegeman, G.Y.; Sebaert, M.; Fiers, W. Nucleotide Sequence of the Gene Coding for the Bacteriophage MS2 Coat Protein. Nature 1972, 237, 82–88. [Google Scholar] [CrossRef] [PubMed]
  7. Begum, N.S.; Chakraborty, S. Influencing Elements of Codon Usage Bias in Birnaviridae and Its Evolutionary Analysis. Virus Res. 2022, 310, 198672. [Google Scholar] [CrossRef]
  8. Plotkin, J.B.; Robins, H.; Levine, A.J. Tissue-Specific Codon Usage and the Expression of Human Genes. Proc. Natl. Acad. Sci. USA 2004, 101, 12588–12591. [Google Scholar] [CrossRef]
  9. Grantham, R.; Gautier, C.; Gouy, M.; Jacobzone, M.; Mercier, R. Codon Catalog Usage Is a Genome Strategy Modulated for Gene Expressivity. Nucleic Acids Res. 1981, 9, 213. [Google Scholar] [CrossRef]
  10. Hershberg, R.; Petrov, D.A. Selection on Codon Bias. Annu. Rev. Genet. 2008, 42, 287–299. [Google Scholar] [CrossRef]
  11. Zhang, Z.; Li, J.; Cui, P.; Ding, F.; Li, A.; Townsend, J.P.; Yu, J. Codon Deviation Coefficient: A Novel Measure for Estimating Codon Usage Bias and Its Statistical Significance. BMC Bioinform. 2012, 13, 43. [Google Scholar] [CrossRef] [Green Version]
  12. Kane, J.F. Effects of Rare Codon Clusters on High-Level Expression of Heterologous Proteins in Escherichia coli. Curr. Opin. Biotechnol. 1995, 6, 494–500. [Google Scholar] [CrossRef]
  13. Ahn, I.; Jeong, B.J.; Bae, S.E.; Jung, J.; Son, H.S. Genomic Analysis of Influenza A Viruses, Including Avian Flu (H5N1) Strains. Eur. J. Epidemiol. 2006, 21, 511–519. [Google Scholar] [CrossRef] [PubMed]
  14. Lin, K.; Kuang, Y.; Joseph, J.S.; Kolatkar, P.R. Conserved Codon Composition of Ribosomal Protein Coding Genes in Escherichia coli, Mycobacterium tuberculosis and Saccharomyces cerevisiae: Lessons from Supervised Machine Learning in Functional Genomics. Nucleic Acids Res. 2002, 30, 2599–2607. [Google Scholar] [CrossRef]
  15. Zhou, J.h.; Li, X.r.; Lan, X.; Han, S.Y.; Wang, Y.n; Hu, Y.; Pan, Q. The Genetic Divergences of Codon Usage Shed New Lights on Transmission of Hepatitis E Virus from Swine to Human. Infect. Genet. Evol. 2019, 68, 23–29. [Google Scholar] [CrossRef] [PubMed]
  16. Zhou, M.; Guo, J.; Cha, J.; Chae, M.; Chen, S.; Barral, J.M.; Sachs, M.S.; Liu, Y. Non-Optimal Codon Usage Affects Expression, Structure and Function of Clock Protein FRQ. Nature 2013, 494, 111–115. [Google Scholar] [CrossRef] [PubMed]
  17. Chiapello, H.; Lisacek, F.; Caboche, M.; Hénaut, A. Codon Usage and Gene Function Are Related in Sequences of Arabidopsis thaliana. Gene 1998, 209, GC1–GC38. [Google Scholar] [CrossRef]
  18. Srivastava, S.; Chanyal, S.; Dubey, A.; Tewari, A.K.; Taj, G. Patterns of Codon Usage Bias in WRKY Genes of Brassica rapa and Arabidopsis thaliana. J. Agric. Sci. 2019, 11, 76. [Google Scholar] [CrossRef]
  19. Nie, X.; Deng, P.; Feng, K.; Liu, P.; Du, X.; You, F.M.; Weining, S. Comparative Analysis of Codon Usage Patterns in Chloroplast Genomes of the Asteraceae Family. Plant Mol. Biol. Rep. 2014, 32, 828–840. [Google Scholar] [CrossRef]
  20. Chand, S.; Patidar, O.P.; Chaudhary, R.; Saroj, R.; Chandra, K.; Meena, V.K.; Limbalkar, O.M.; Patel, M.K.; Pardeshi, P.P.; Vasisth, P. Rapeseed-Mustard Breeding in India: Scenario, Achievements and Research Needs. In Brassica Breeding and Biotechnology; Islam, A.K.M.A., Ed.; IntechOpen: London, UK, 2021; p. 22. ISBN 978-1-83968-697-9. [Google Scholar]
  21. Saroj, R.; Soumya, S.L.; Singh, S.; Sankar, S.M.; Chaudhary, R.; Yashpal, R.; Saini, N.; Vasudev, S.; Yadava, D.K. Unraveling the Relationship Between Seed Yield and Yield-Related Traits in a Diversity Panel of Brassica juncea Using Multi-Traits Mixed Model. Front. Plant Sci. 2021, 12, 651936. [Google Scholar] [CrossRef]
  22. Meena, V.K.; Taak, Y.; Chaudhary, R.; Chand, S.; Patel, M.K.; Muthusamy, V.; Yadav, S.; Saini, N.; Vasudev, S.; Yadava, D.K. Deciphering the Genetic Inheritance of Tocopherols in Indian mustard (Brassica juncea L. Czern and Coss). Plants 2022, 11, 1779. [Google Scholar] [CrossRef]
  23. Rathore, S.S.; Babu, S.; Shekhawat, K.; Singh, V.K.; Upadhyay, P.K.; Singh, R.K.; Raj, R.; Singh, H.; Zaki, F.M. Oilseed Brassica Species Diversification and Crop Geometry Influence the Productivity, Economics, and Environmental Footprints under Semi-Arid Regions. Sustainability 2022, 14, 2230. [Google Scholar] [CrossRef]
  24. Kumar, S.; Seepaul, R.; Small, I.M.; George, S.; Kelly O’brien, G.; Marois, J.J.; Wright, D.L.; Huchzermeyer, B.; Florida, N. Interactive Effects of Nitrogen and Sulfur Nutrition on Growth, Development, and Physiology of Brassica carinata A. Braun and Brassica napus L. Sustainability 2021, 13, 7335. [Google Scholar] [CrossRef]
  25. Nesi, N.; Delourme, R.; Brégeon, M.; Falentin, C.; Renard, M. Genetic and Molecular Approaches to Improve Nutritional Value of Brassica napus L. Seed. Comptes Rendus-Biol. 2008, 331, 763–771. [Google Scholar] [CrossRef]
  26. Knutzon, D.S.; Thompson, G.A.; Radke, S.E.; Johnson, W.B.; Knauf, V.C.; Kridl, J.C. Modification of Brassica Seed Oil by Antisense Expression of a Stearoyl- Acyl Carrier Protein Desaturase Gene. Proc. Natl. Acad. Sci. USA 1992, 89, 2624–2628. [Google Scholar] [CrossRef] [PubMed]
  27. Taylor, D.C.; Barton, D.L.; Michael Giblin, E.; Mackenzie, S.L.; Van Den Berg, C.G.J.; McVetty, P.B.E. Microsomal Lyso-Phosphatidic Acid Acyltransferase from a Brassica oleracea Cultivar Incorporates Erucic Acid into the Sn-2 Position of Seed Triacylglycerols. Plant Physiol. 1995, 109, 409–420. [Google Scholar] [CrossRef]
  28. Badawy, I.H.; Atta, B.; Ahmed, W.M. Biochemical and Toxicological Studies on the Effect of High and Low Erucic Acid Rapeseed Oil on Rats. Food/Nahrung 1994, 38, 402–411. [Google Scholar] [CrossRef]
  29. Shi, J.; Lang, C.; Wang, F.; Wu, X.; Liu, R.; Zheng, T.; Zhang, D.; Chen, J.; Wu, G. Depressed Expression of FAE1 and FAD2 Genes Modifies Fatty Acid Profiles and Storage Compounds Accumulation in Brassica napus Seeds. Plant Sci. 2017, 263, 177–182. [Google Scholar] [CrossRef]
  30. Töpfer, R.; Martini, N.; Schell, J. Modification of Plant Lipid Synthesis. Science 1995, 268, 681–686. [Google Scholar] [CrossRef]
  31. Hardin-Fanning, F. The Effects of a Mediterranean-Style Dietary Pattern on Cardiovascular Disease Risk. Nurs. Clin. N. Am. 2008, 43, 105–115. [Google Scholar] [CrossRef]
  32. Beisson, F.; Koo, A.J.K.; Ruuska, S.; Schwender, J.; Pollard, M.; Thelen, J.J.; Paddock, T.; Salas, J.J.; Savage, L.; Milcamps, A.; et al. Arabidopsis Genes Involved in Acyl Lipid Metabolism. A 2003 Census of the Candidates, a Study of the Distribution of Expressed Sequence Tags in Organs, and a Web-Based Database 1. Plant Physiol. 2003, 132, 681–697. [Google Scholar] [CrossRef] [Green Version]
  33. Qi, W.; Lu, H.; Zhang, Y.; Cheng, J.; Huang, B.; Lu, X.; Sheteiwy, M.S.A.; Kuang, S.; Shao, H. Oil Crop Genetic Modification for Producing Added Value Lipids. Crit. Rev. Biotechnol. 2020, 40, 777–786. [Google Scholar] [CrossRef] [PubMed]
  34. Rice, P.; Longden, L.; Bleasby, A. EMBOSS: The European Molecular Biology Open Software Suite. Trends Genet. 2000, 16, 276–277. [Google Scholar] [CrossRef]
  35. Peden, J.F. Analysis of Codon Usage. Ph.D. Thesis, University of Nottingham, Nottingham, UK, 1999. [Google Scholar]
  36. Sharp, P.M.; Li, W.H. An Evolutionary Perspective on Synonymous Codon Usage in Unicellular Organisms. J. Mol. Evol. 1986, 24, 28–38. [Google Scholar] [CrossRef] [PubMed]
  37. Wright, F. The ‘Effective Number of Codons’ Used in a Gene. Gene 1990, 87, 23–29. [Google Scholar] [CrossRef]
  38. Majeed, A.; Kaur, H.; Bhardwaj, P. Selection Constraints Determine Preference for A/U-Ending Codons in Taxus contorta. Genome 2020, 63, 215–224. [Google Scholar] [CrossRef]
  39. Sueoka, N. Intrastrand Parity Rules of DNA Base Composition and Usage Biases of Synonymous Codons. J. Mol. Evol. 1996, 42, 323. [Google Scholar] [CrossRef]
  40. Sueoka, N. Translation-Coupled Violation of Parity Rule 2 in Human Genes Is Not the Cause of Heterogeneity of the DNA G+C Content of Third Codon Position. Gene 1999, 238, 53–58. [Google Scholar] [CrossRef]
  41. Sueoka, N.; Kawanishi, Y. DNA G + C Content of the Third Codon Position and Codon Usage Biases of Human Genes. Gene 2000, 261, 53–62. [Google Scholar] [CrossRef]
  42. Sueoka, N. Directional Mutation Pressure and Neutral Molecular Evolution. Proc. Natl. Acad. Sci. USA 1988, 85, 2653–2657. [Google Scholar] [CrossRef]
  43. Ikemura, T. Codon Usage and TRNA Content in Unicellular and Multicellular Organisms. Mol. Biol. Evol. 1985, 2, 13–34. [Google Scholar] [CrossRef]
  44. Stenico, M.; Lloyd, A.T.; Sharp, P.M. Codon Usage in Caenorhabditis elegans: Delineation of Translational Selection and Mutational Biases. Nucleic Acids Res. 1994, 22, 2437–2446. [Google Scholar] [CrossRef] [PubMed]
  45. Lavner, Y.; Kotlar, D. Codon Bias as a Factor in Regulating Expression via Translation Rate in the Human Genome. Gene 2005, 345, 127–138. [Google Scholar] [CrossRef] [PubMed]
  46. Karlin, S.; Mrázek, J. What Drives Codon Choices in Human Genes? J. Mol. Biol. 1996, 262, 459–472. [Google Scholar] [CrossRef] [PubMed]
  47. Fox, J.M.; Erill, I. Relative Codon Adaptation: A Generic Codon Bias Index for Prediction of Gene Expression. DNA Res. 2010, 17, 185–196. [Google Scholar] [CrossRef]
  48. Das, S.; Paul, S.; Dutta, C. Synonymous Codon Usage in Adenoviruses: Influence of Mutation, Selection and Protein Hydropathy. Virus Res. 2006, 117, 227–236. [Google Scholar] [CrossRef]
  49. Zhang, R.; Zhang, L.; Wang, W.; Zhang, Z.; Du, H.; Qu, Z.; Li, X.Q.; Xiang, H. Differences in Codon Usage Bias between Photosynthesis-Related Genes and Genetic System-Related Genes of Chloroplast Genomes in Cultivated and Wild Solanum Species. Int. J. Mol. Sci. 2018, 19, 3142. [Google Scholar] [CrossRef]
  50. Andargie, M.; Congyi, Z. Genome-Wide Analysis of Codon Usage in Sesame (Sesamum indicum L.). Heliyon 2022, 8, e08687. [Google Scholar] [CrossRef]
  51. R Core Team. R: A Language and Environment for Statistical Computing; R Core Team: Vienna, Austria, 2019. [Google Scholar]
  52. Puigbò, P.; Bravo, I.G.; Garcia-Vallve, S. CAIcal: A Combined Set of Tools to Assess Codon Usage Adaptation. Biol. Direct 2008, 3, 38. [Google Scholar] [CrossRef] [PubMed]
  53. Hassan, S.; Mahalingam, V.; Kumar, V. Synonymous Codon Usage Analysis of Thirty Two Mycobacteriophage Genomes. Adv. Bioinformatics 2009, 2009, 316936. [Google Scholar] [CrossRef]
  54. Tatarinova, T.V.; Alexandrov, N.N.; Bouck, J.B.; Feldmann, K.A. GC3 biology in Corn, Rice, Sorghum and Other Grasses. BMC Genom. 2010, 11, 308. [Google Scholar] [CrossRef] [Green Version]
  55. WU, Y.q; LI, Z.y; Zhao, D.q; Tao, J. Comparative Analysis of Flower-Meristem-Identity Gene APETALA2 (AP2) Codon in Different Plant Species. J. Integr. Agric. 2018, 17, 867–877. [Google Scholar] [CrossRef]
  56. Kumar, S.; Stecher, G.; Li, M.; Knyaz, C.; Tamura, K. MEGA X: Molecular Evolutionary Genetics Analysis across Computing Platforms. Mol. Biol. Evol. 2018, 35, 1547–1549. [Google Scholar] [CrossRef]
  57. Gun, L.; Yumiao, R.; Haixian, P.; Liang, Z. Comprehensive Analysis and Comparison on the Codon Usage Pattern of Whole Mycobacterium tuberculosis Coding Genome from Different Area. BioMed Res. Int. 2018, 2018, 3574976. [Google Scholar] [CrossRef] [PubMed]
  58. Błazej, P.; Mackiewicz, D.; Wnetrzak, M.; Mackiewicz, P. The Impact of Selection at the Amino Acid Level on the Usage of Synonymous Codons. G3 Genes Genomes Genet. 2017, 7, 967–981. [Google Scholar] [CrossRef]
  59. Palidwor, G.A.; Perkins, T.J.; Xia, X. A General Model of Codon Bias Due to GC Mutational Bias. PLoS ONE 2010, 5, e13431. [Google Scholar] [CrossRef]
  60. Butt, A.M.; Nasrullah, I.; Tong, Y. Genome-Wide Analysis of Codon Usage and Influencing Factors in Chikungunya Viruses. PLoS ONE 2014, 9, e90905. [Google Scholar] [CrossRef]
  61. Gouy, M.; Gautier, C. Codon Usage in Bacteria: Correlation with Gene Expressivity. Nucleic Acids Res. 1982, 10, 7055–7074. [Google Scholar] [CrossRef]
  62. Bragg, J.G.; Quigg, A.; Raven, J.A.; Wagner, A. Protein Elemental Sparing and Codon Usage Bias are Correlated among Bacteria. Mol. Ecol. 2012, 21, 2480–2487. [Google Scholar] [CrossRef]
  63. Vicario, S.; Moriyama, E.N.; Powell, J.R. Codon Usage in Twelve Species of Drosophila. BMC Evol. Biol. 2007, 7, 226. [Google Scholar] [CrossRef]
  64. Shi, S.L.; Jiang, Y.R.; Liu, Y.Q.; Xia, R.X.; Qin, L. Selective Pressure Dominates the Synonymous Codon Usage in Parvoviridae. Virus Genes 2013, 46, 10–19. [Google Scholar] [CrossRef]
  65. Wong, G.K.S.; Wang, J.; Tao, L.; Tan, J.; Zhang, J.; Passey, D.A.; Yu, J. Compositional Gradients in Gramineae Genes. Genome Res. 2002, 12, 851–856. [Google Scholar] [CrossRef] [PubMed]
  66. Xu, C.; Cai, X.; Chen, Q.; Zhou, H.; Cai, Y.; Ben, A. Factors Affecting Synonymous Codon Usage Bias in Chloroplast Genome of Oncidium Gower Ramsey. Evol. Bioinforma. 2011, 7, 271–278. [Google Scholar] [CrossRef] [PubMed]
  67. Wu, Y.; Zhao, D.; Tao, J. Analysis of Codon Usage Patterns in Herbaceous Peony (Paeonia lactiflora Pall.) Based on Transcriptome Data. Genes 2015, 6, 1125–1139. [Google Scholar] [CrossRef]
  68. Yang, Z.; Nielsen, R. Mutation-Selection Models of Codon Substitution and Their Use to Estimate Selective Strengths on Codon Usage. Mol. Biol. Evol. 2008, 25, 568–579. [Google Scholar] [CrossRef] [PubMed]
  69. Bennetzen, J.L.; Hall, B.D. Codon Selection in Yeast. J. Biol. Chem. 1982, 257, 3026–3031. [Google Scholar] [CrossRef]
  70. Singh, R. Analysis of Synonymous Codon Usage Bias in Ancylostoma ceylanicum. Gene Rep. 2021, 24, 101290. [Google Scholar] [CrossRef]
  71. Nayak, K.C. Comparative Study on Factors Influencing the Codon and Amino Acid Usage in Lactobacillus sakei 23K and 13 Other Lactobacilli. Mol. Biol. Rep. 2012, 39, 535–545. [Google Scholar] [CrossRef]
  72. Choudhury, M.N.; Uddin, A.; Chakraborty, S. Nucleotide Composition and Codon Usage Bias of SRY Gene. Andrologia 2018, 50, e12787. [Google Scholar] [CrossRef]
  73. Deb, B.; Uddin, A.; Mazumder, G.A.; Chakraborty, S. Analysis of Codon Usage Pattern of Mitochondrial Protein-Coding Genes in Different Hookworms. Mol. Biochem. Parasitol. 2018, 219, 24–32. [Google Scholar] [CrossRef]
  74. Wang, Z.; Wang, G.; Cai, Q.; Jiang, Y.; Wang, C.; Xia, H.; Wu, Z.; Li, J.; Ou, Z.; Xu, Z.; et al. Genomewide Comparative Analysis of Codon Usage Bias in Three Sequenced Jatropha curcas. J. Genet. 2021, 100, 20. [Google Scholar] [CrossRef]
Figure 1. Heat map of values of codons with third nucleotide position of the codon for FAE1 (A) and FAD2 (B) genes. The black and blue blocks represent stop codons (TGA, TAG, TAA) and non-degenerate codons (ATG, TGG), respectively, that were completely absent in FAE1 and FAD2 genes across the six Brassica species. The dark red color indicates a highly positive correlation and white color represents a highly negative correlation.
Sustainability 14 11035 g001
Figure 2. Complete frequency of optimal and non-optimal codons used in FAE1 (A) and FAD2 (B) genes among six Brassica species. Orange and blue colors represent optimal and non-optimal used codons with corresponding amino acid.
Sustainability 14 11035 g002
Figure 3. Clustering of relative synonymous codon usage (RSCU) values of each codon among FAE1 and FAD2 genes across the six Brassica species. Each block in the map represents the RSCU value of a codon (shown in rows) corresponding to each gene across the six different Brassica species (shown in the column). The color intensity on the block indicates different RSCU values; intensity towards dark red RSCU > 1.60 and light red to dark blue RSCU < 1.60.
Sustainability 14 11035 g003
Figure 4. Evolutionary analyses for FAE1 (A) and FAD2 (B) were performed in MEGA5.
Sustainability 14 11035 g004
Figure 5. Relationship between ENC and GC3s values for FAE1 (A) and FAD2 (B) genes among different Brassica species. Orange and blue dots represent the ENC and GC3s values of the coding sequences for FAE1 and FAD2 genes.
Sustainability 14 11035 g005
Figure 6. Distribution of relative synonymous codon usage (RCBS) for FAE1 (A) and FAD2 (B) genes across six Brassica species.
Sustainability 14 11035 g006
Figure 7. Neutrality plot for FAE1 (A) and FAD2 (B).
Sustainability 14 11035 g007
Figure 8. PR2 (parity rule 2) bias plot for FAE1 (A) and FAD2 (B).
Sustainability 14 11035 g008
Figure 9. Correspondence analysis for FAE1 (upper row) and FAD2 (lower row) orthologs. In (A,D), correspondence analysis revealing different principal axes based on RSCU value. The dotted line denotes the cumulative total of the inertia explained by nine axes. In (B,E), distribution of orthologs based on RSCU values. In (C,F), correspondence analysis highlighting the distribution of synonymous codons ended with different nucleotides, where A, U, G, C were colored differently.
Sustainability 14 11035 g009
Table 1. The gene ID, accession number, length, chromosomal location, and coded amino acids of two fatty acid genes (erucic acid-FAE1 and oleic acid-FAD2) gene coding sequences (CDS) in six different Brassica species.
S.N.Brassica SpeciesErucic Acid (FAE1)Oleic Acid (FAD2)
Gene IDAccession No.Length (bp)ChromosomeAmino AcidGene IDAccession No.Length (bp)ChromosomeAmino Acid
1B. rapaBr.FAE1.1KF999626.11521A08384Br.FAD2.1JN859550.11155A05506
2B. nigraBni.FAE1.2MH745118.11521B07384Bni.FAD2.2HM138369.11152B05506
3B. oleraceaBo.FAE1.3AF490460.11521C03384Bo.FAD2.3JN859552.11155C05506
4B. carinataBc.FAE1.2KF664167.11521B03384Bc.FAD2.2AF124360.21155B06506
5B. carinataBc.FAE1.3KF664166.11521C03384Bc.FAD2.3JAAMPC010000013.11155C05506
6B. napusBna.FAE1.1GU325717.11521A08384Bna.FAD2.1JN992606.11155A05506
7B. napusBna.FAE1.3GU325719.11521C03384Bna.FAD2.3JN992607.11155C05506
8B. junceaBj.FAE1.1AJ558197.11521A08384Bj.FAD2.1MN585117.11155A05506
9B. junceaBj.FAE1.2AJ558198.11521B07384Bj.FAD2.2MN585120.1 1155B05506
Table 2. Nucleotide composition analysis in the coding sequences of erucic acid (FAE1) and oleic acid (FAD2) genes in six Brassica species.
S. N #.ATGCA3T3G3C3AT (%)GC (%)GC1 (%)GC2 (%)AT3 (%)GC3 (%)GC12 (%) 2^AT12 (%) 2^
Erucic acid (FAE1)
1.4154103463501031541071430.5420.4580.4870.3930.5070.4930.4400.560
2.4154073513481061491111410.5400.4600.4870.3940.5030.4970.4410.559
3.4224063403531071521041440.5440.4560.4850.3930.5110.4890.4390.561
4.4144073513491051481111430.5400.4600.4850.3940.4990.5010.4400.560
5.4154073453541041531061440.5400.4600.4890.3960.5070.4930.4430.557
6.4194083443501071511061430.5440.4560.4870.3910.5090.4910.4390.561
7.4224073403521071521041440.5450.4550.4850.3910.5110.4890.4380.562
8.4194063443521061501071440.5420.4580.4850.3930.5050.4950.4390.561
9.4164073503481061481111420.5410.4590.4830.3940.5010.4990.4390.561
Mean417.44407.22345.66350.66105.66150.77107.44143.110.5420.4580.4860.3930.5060.4940.4400.560
SD1^2.94811.13314.02762.05481.33332.04272.71250.99380.00180.00180.00160.00140.00400.00400.00130.001
Oleic acid (FAD2)
1.2503592722744361981830.4110.5480.5060.4080.2700.7300.4570.543
2.2483702632714356981870.4030.5560.5180.4090.2580.7420.4640.536
3.2473612722754162991830.4090.5510.5090.4100.2680.7320.4600.540
4.2453702682724062971860.4040.5560.5190.4130.2650.7350.4660.534
5.2463622742734063971850.4090.5500.5060.4100.2680.7320.4580.542
6.2493572762734264971820.4130.5450.5060.4050.2750.7250.4560.544
7.2463612732754162991830.4090.5510.5090.4100.2680.7320.4600.540
8.2473592732764262991820.4090.5500.5060.4130.2700.7300.4600.540
9.2453722682704161951880.4040.5560.5190.4130.2650.7350.4660.534
Mean247271273.22363.4441.4461.4497.67184.330.4490.5510.5110.4100.2670.7330.4610.539
SD1^1.6333.7421.8725.3151.0662.1141.2472.1080.00370.00370.00560.00250.00440.00450.00350.004
#: refer Table 1 for identifying serial numbers for Brassica species; SD 1^: Standard deviation; GC12 (%) 2^: average of GC content percent at first and second nucleotide positions in codon; AT12 (%) 2^: average of AT content percent at first and second nucleotide positions in codon.
Table 3. Complete relative synonymous codon usage (RSCU) for erucic acid (FAE1) and oleic acid (FAD2) genes among six Brassica species.
Erucic Acid (FAE1)Oleic Acid (FAD2) Erucic Acid (FAE1)Oleic Acid (FAD2)
Amino AcidCodonNo. (1)RSCU (2)No (1)RSCU (2)Amino AcidCodonNo. (1)RSCU (2)No. (1)RSCU (2)
PheTTT940.910110.121AlaGCT1101.435 *540.964
TTC1131.090 *1721.879 * GCC700.917961.714 *
LeuTTA510.698240.482 GCA690.904160.287
TTG720.984661.311 * GCG570.744581.035 *
CTT1371.871 *130.260TyrTAT620.689340.281
CTC941.286 *1482.935 * TAC1181.311 *2081.719 *
CTA690.942160.315HisCAT841.276 *600.674
CTG160.219350.698 CAC480.7241181.326 *
IleATT850.909100.162GlnCAA621.531 *250.610
ATC920.9901282.076 * CAG190.469571.390 *
ATA1021.100 *470.762AsnAAT720.547180.361
ValGTT1661.781 *440.699 AAC1911.453 *821.639 *
GTC860.9221322.113 *LysAAA1611.006 *340.376
GTA370.396110.174 AAG1590.9941471.624 *
GTG840.901631.013 *AspGAT1371.127 *250.324
SerTCT430.682341.018 * GAC1060.8731291.676 *
TCC821.307 *1003.004 *GluGAA540.667420.672
TCA1041.659 *70.210 GAG1081.333 *831.328 *
TCG460.729401.199 *CysTGT360.800190.427
AGT450.71780.240 TGC541.200 *701.573 *
AGC570.906110.330ArgCGT511.294 *220.907
ProCCT571.267 *1051.774 * CGC00.000542.235 *
CCC220.489570.960 CGA270.68460.250
CCA430.956120.201 CGG541.368 *00.000
CCG581.289 *631.065 * AGA781.971 *361.490 *
ThrACT570.858380.850 AGG270.684271.118 *
ACC881.321 *791.764 *GlyGGT1211.655 *581.027 *
ACA220.331130.290 GGC670.908751.318 *
ACG991.489 *491.096 * GGA630.858751.323 *
GGG420.578190.333
(1) No, total number of preferred codons in a gene. (2) Mean values of RSCU based on the synonymous codon usage frequencies of a gene. * Codons having RSCU values (>1.0) are more preferred in the genome.
Table 4. Codon uses bias indices for fatty acid (FAE1 and FAD2) genes across the six Brassica species.
BrassicaRCBSRCACAICBIFopENCGC3L_symL_aaThe Highest RSCUGRAVYAromo
Erucic acid (FAE1)
Br.FAE1.10.1240.5060.1210.0830.45157.110.493492506CTC (L)−0.1190.093
Bni.FAE1.20.1340.4990.1200.0950.45755.780.497492506AGA (R)−0.1030.095
Bo.FAE1.30.1260.5050.1250.0860.45357.070.489492506CTC (L)−0.1330.095
Bc.FAE1.20.1350.5010.1230.0980.45955.750.501492506AGA (R)−0.1050.097
Bc.FAE1.30.1190.5000.1240.0900.45557.830.493492506CTC (L)−0.1230.093
Bna.FAE1.10.1270.4950.1230.0790.44957.300.491492506CTC (L)−0.1070.095
Bna.FAE1.30.1250.5040.1250.0880.45557.140.489492506CTC (L)−0.1280.095
Bj.FAE1.10.1280.4930.1210.0720.44557.160.495492506CTC (L)−0.1170.095
Bj.FAE1.20.1320.5010.1210.0970.45955.910.499492506AGA (R)−0.1050.097
Oleic acid (FAD2)
Br.FAD2.10.1940.5810.1310.2080.52746.250.730366384CTC (L); TCC(S)−0.1290.156
Bni.FAD2.20.2130.5660.1280.2120.52743.700.742364383CTC (L)−0.1390.151
Bo.FAD2.30.1880.5720.1330.2120.52945.140.732365384TCC(S)−0.1210.156
Bc.FAD2.20.1890.5820.1330.2120.52745.260.735364384CTC (L)−0.1270.154
Bc.FAD2.30.1920.5770.1350.2120.52944.380.732365384TCC(S)−0.1210.156
Bna.FAD2.10.1840.5790.1340.2060.52646.570.725365384CTC (L); TCC−0.1220.156
Bna.FAD2.30.1840.5760.1310.2070.52645.490.732365384TCC(S)−0.1110.156
Bj.FAD2.10.2010.5710.1310.2130.52946.010.730365384CTC (L)−0.1140.156
Bj.FAD2.20.1890.5620.1330.2180.53044.410.735364384CTC (L)−0.1280.154
RCBS—Relative codon bias usage; RCA—Relative codon adaptation; CAI—Codon adaptation index; CBI—Codon bias index; Fop—Frequency of optimal codon; ENC—The effective number of codons; L-sym—Number of synonymous codons; L_aa—Length of amino acids; GRAVY—Grand average of hydropathicity; Aromo—Aromaticity score.
Publisher’s Note: MDPI stays neutral with regard to jurisdictional claims in published maps and institutional affiliations.

