Article

Can Complete-Novice E-Bike Riders Be Trained to Detect Unmaterialized Traffic Hazards in the Urban Environment? An Exploratory Study

Faculty of Industrial Engineering and Technology Management, Holon Institute of Technology (HIT), Holon 5810201, Israel
Sustainability 2022, 14(17), 10869; https://doi.org/10.3390/su141710869
Submission received: 26 June 2022 / Revised: 23 August 2022 / Accepted: 26 August 2022 / Published: 31 August 2022
(This article belongs to the Special Issue Urban Design, Urban Planning and Traffic Safety)

Abstract

:
Although hazard perception is an important skill found to be crucial for negotiating traffic among various types of road users, few studies have systematically investigated e-bike riders’ ability to perceive potential unmaterialized hazardous situations or aimed to enhance these abilities through training. The present study explored the formation of two hazard perception training interventions based upon exposing young complete-novice e-bike riders to a vast array of materialized traffic hazards, with the aim of evaluating their effectiveness in enriching the ability to anticipate unmaterialized hazards. Young complete-novice e-bike riders were allocated into one of two intervention modes (‘Act and Anticipate Training’ or ‘Predictive and Commentary Training’) or a control group (ten in each group). AAT members underwent a theoretical tutorial, then observed clips depicting real-time hazardous situations footage taken from an e-bike rider’s perspective and were asked to perform a hazard detection task. PCT members underwent a theoretical tutorial, then a ‘what might happen next?’ task, followed by observation of video footage with expert commentary. A week later, participants were requested to complete a hazard perception test, during which they viewed ten videos and pressed a response button whenever they identified a hazardous situation. Overall, participants in both interventions were more aware of potential unmaterialized hazards compared to the control in both their response sensitivity and verbal descriptions. Trainees were responsive to the developed training interventions. Thus, actively detecting materialized hazards may produce effective training that enriches these road users’ hazard perception skills and allows them to safely negotiate traffic. Advantages of each of the training methodologies along with implications for intervention strategies, licensing, and policy development are discussed.

1. Introduction

Electric powered bicycles (e-bikes) are an emerging form of micro-mobility (i.e., self-driven lightweight vehicles operating at relatively low speeds) that aims to provide a feasible and environmentally sustainable mobility solution to first- and last-mile travel problems [1,2,3,4,5]. In recent years, they are becoming a common and popular mode of transportation worldwide, mostly in urban surroundings [6,7]. Due to their many inherent advantages [8,9], such as convenience of use and affordability [10,11], they are becoming an efficient means of personal commuting and are greatly changing the urban mobility landscape [12,13]. As a result of the growth in their prevalence [14,15,16,17], e-bike riders are becoming increasingly involved in road crashes [18,19,20]. For instance, in Israel there has been a 15-fold increase in the number of hospitalized patients associated with e-bike incidents between 2013 and 2020, reaching a total of 695 in 2020 [21]. It has been suggested that e-bike riders are more likely to be involved in severe crashes than mechanical bicycle riders [22], as their users are able to travel faster while exerting the same physical effort [9,23]. For instance, early research [15] showed that the utilization of e-bikes was associated with an increased risk of being treated at an emergency department due to a crash. Accordingly, it has been suggested that, while in comparison to mechanical bicycle riders e-bike riders have a lower casualty rate, these casualties are more severely injured and tend to utilize more hospital resources [11].
In various countries worldwide, e-bikes are emerging as a transport mode for youngsters [24,25,26]. For instance, in a recent study [27] it has been suggested that the majority (approximately 86%) of adult e-bike users in Israel are 19–34-year-old youngsters. In a similar manner, e-bikes have become a chief form of transportation in Vietnam, especially among youngsters [25], as they do not require a designated license [26]. Notably, a recent study conducted in the Netherlands [12] indicated that e-bikes have become increasingly popular among the younger age groups, who are adopting them as a commute mode, hence shifting the traditional image of the e-bike in the country as a mode of transport used mostly by the elderly.
As many of these road users are youngsters, who may be inexperienced in negotiating road safety, they are inclined to put themselves as well as other vulnerable road users (e.g., inexperienced drivers, pedestrians, and micro-mobility riders) in jeopardy [9]. Indeed, research findings have demonstrated that, compared to experienced adults, young novice road users are less skilled at negotiating complex traffic situations [28,29,30,31], their visual search strategies tend to be inadequate, and they are more inclined to demonstrate subpar performance in evaluating hazardous road traffic situations [32,33]. Hence, it is crucial to explore their skill set further, and in particular their ability to identify, holistically appraise, and predict traffic events [34,35,36].
The ability to detect, assess, and predict traffic situations from a holistic perspective, that is, to be aware of hazardous road situations or to ‘read’ roads in anticipation of forthcoming events, is often termed ‘hazard perception’ [35,36,37]. This ability has been identified as an underlying element in safety and crash prevention [38]. It has been thoroughly researched for a variety of road users, including automobile drivers [28,29], mechanical bicycle users [39], and pedestrians [40,41]. Evidence suggests that hazard perception, one of the few traffic negotiating skills that correlates with traffic collision involvement [38,42,43,44], is an essential capability for road users, with drivers with better hazard perception abilities more likely to have a reduced crash risk [43].
In order to examine hazard perception skills, researchers tend to present participants with traffic scene movies or still pictures taken from a road user’s perspective, then request that they press a response button each time they identify a hazard [35,45,46]. These hazard instigators (i.e., the sources of danger) are distinguished in the literature [40,47,48,49,50] as being of two types: (a) materialized hazards, traffic occurrences where a failure to engage in an immediate evasive action may cause harm to a road user or damage to property [33,41]; and (b) potential unmaterialized hazards, a source of danger that, while it does not require engaging in an immediate action, should be detected and monitored so that the precursor does not develop into a materialized hazard [51,52].
Using a variety of video-based materials, research has shown that potential unmaterialized road hazard instigators are more discriminative than materialized hazards [28,48,51]. Namely, the divergence between road users’ experience can be reflected by their ability to identify and respond to different types of traffic hazards [40,48]. For instance, young novice drivers are considered to have deficient hazard perception skills compared to experienced drivers [35,43,53]. That is, while younger inexperienced drivers tend to mostly identify materialized hazards, experienced drivers tend to identify both materialized and unmaterialized hazards [48]. These differences are apparent when examining participants’ verbal descriptions of detected hazards as well. For example, examining participants’ verbal descriptions of detected hazards, a pattern emerged in which 7–9-year-olds referred much less to potential unmaterialized hazardous situations in their verbal descriptions compared to 9–10-year-olds, 10–13-year-olds, and experienced adult pedestrians [40]. Notably, although only few studies have thoroughly and methodically examined hazard perception abilities among e-bike riders, [49] explored these skills and indicated that e-bike riders’ hazard perception performance tends to be enhanced with additional experience. Specifically, the authors showed that experienced e-bike riders are more inclined to identify potential unmaterialized hazards and to provide more verbal descriptions regarding potential unmaterialized hazardous situations.

2. Training Intervention: A Tool for Enhancing Hazard Perception

Because the hazard perception skill has been found to be an essential component of road users’ abilities [35], and as research has shown that hazard perception skills tend to improve with experience [28,35,49,54], traffic safety researchers have engaged in various attempts to construct training intervention programs in the hope of enhancing young novice road users’ hazard perception skills [41,47,55,56]. A variety of hazard perception training interventions have been developed over the years to account for automobile drivers, pedestrians, and mechanical bicycle users’ skills [29,36,41,55,57,58,59,60]. Indeed, evidence has shown that hazard perception is susceptible to training [29,36,41,58,59], as training in hazard perception has been found to benefit novice road users [57]. However, there has been a shortage of studies systematically investigating this skill with regard to e-bikes, mapping e-bike riders’ abilities to perceive potential unmaterialized hazardous situations [49], or aiming to create designated training interventions. Specifically, there has been only one study that aimed to develop a hazard anticipation training program for e-bike riders and to evaluate its effectiveness [61]. Nonetheless, it focused on experienced (as opposed to novice or complete-novice) older adults (as opposed to youngsters) and did not focus on potential unmaterialized hazards. Hence, the present study is aimed at constructing and evaluating hazard perception training interventions for young complete-novice e-bike riders’ ability, focusing on their ability to detect potential unmaterialized hazard instigators prior to their materialization.
Particularly, this study attempts to enhance these road users’ attentiveness towards potential unmaterialized hazards by applying a conceptual approach taken from the hazard perception training realm and based on theoretical and methodological grounds that have been found effective in enhancing young novice drivers’ [28,29] and child-pedestrians’ hazard perception abilities [41].
Particularly, an attempt was made to utilize a similar set of theoretical and methodological tools which have been found highly efficient in training young novice drivers’ and child-pedestrians’ hazard perception skills [40,41] in order to lay the groundwork for producing an efficient mechanism to enhance complete-novice e-bike riders’ hazard perception skills. Specifically, [29] constructed a hazard perception training methodology for automobile drivers called the Act and Anticipate Hazard Perception Training (AAHPT), in which young novice drivers practiced one of three hazard perception training modes (i.e., ‘Active’, ‘Instructional’, or ‘Hybrid’), and compared them to a control group. The AAHPT was developed based on the underlying notion that exposing trainees to a vast array of materialized road hazards would be an effective tool towards enhancing their ability to anticipate potential unmaterialized hazards during testing. The ‘Active’ training mode had participants observe real-world traffic scenes and actively search and respond to hazardous situations by pressing a response button each time they identified a hazard. The ‘Instructional’ training mode had participants undergo a tutorial that included both written material and video-based examples from real-world settings regarding the hazard perception skill. The ‘Hybrid’ training mode had participants receive a combination of both in which participants were presented with a concise theoretical component followed by a condensed active component. In comparison to the untrained control group members, the ‘Active’ and ‘Hybrid’ trainees (i.e., those who were exposed to the two active-practical intervention modes) were more attentive to potential unmaterialized traffic occurrences. Furthermore, ref. [41] used this paradigm to train young child-pedestrians’ (completely inexperienced as road users, as they were not allowed to cross roadways unaccompanied) hazard perception skills in simulated settings by exposing them to simulated typical urban scenarios from a pedestrian’s point of view and having them engage in an active hazard detection task (i.e., pressing a response button each time they identified a hazard). Control group members were found to be less able to identify potential hazard instigators relative to trainees; they were mostly challenged by traffic scenes where the field of view was restricted.
Another paradigm in developing hazard perception programs is represented by [57], in which four modes of video-based training interventions were created: (a) a ‘what might happen next?’ intervention based on [62]; (b) an expert commentary training intervention; (c) a hybrid commentary training intervention (i.e., with both an expert and self-generated commentaries); and (d) a ‘full training package’ intervention consisting of both a ‘what might happen next?’ intervention and hybrid commentary training. Although all of the training modes presented significant results compared with the untrained groups’ results, the ‘full training package’ resulted in the greatest improvement. Importantly, adding self-generated commentaries to the expert commentary exercise in the hybrid commentary condition failed to significantly benefit participant performance. Furthermore, all of the training effects decayed considerably after one week except for the effect of the ‘full training package’, which remained significant. Notably, although no benefit was found when adding self-generated commentaries to expert commentaries, it has been suggested that combining ‘what might happen next?’ exercises with expert commentary training may provide an additional benefit [57].

3. The Present Study

Because e-bikes have only entered common use in recent years, there are substantial gaps in research regarding the skills and performance of e-bike riders [8]. Correspondingly, the present study examined the possibility of enhancing young complete-novice e-bike riders’ ability to identify unmaterialized road hazards in the traffic environment through training. Studies have shown that there are differences between e-bikes and mechanical bicycles [13,63], as the duration and distance of trips performed by e-bike riders are longer compared to the trips performed on mechanical bicycles [13]. In [11], the authors found differences between these two types of bicycles with regard to riding-related injuries; e-bike riders were found to have a higher risk of head injury compared to those riding mechanical bicycles. Furthermore, [64] has shown that e-bike use and injury patterns tend to differ from those of mechanical bicycle users. According to [18], e-bikes tend to be ridden faster on average and their riders are more inclined to accelerate faster than mechanical bicycle riders; in addition, these vehicles interact differently with other road users (i.e., motorized vehicles are more hazardous for e-bike riders, while vulnerable road users are more hazardous for mechanical bicycle riders) and is subject to specific types of hazards. As such, it has been argued that the design of countermeasures for accident prevention should differ between these two types of vehicles. Similarly, [11] advocated that e-bikes have specific characteristics that should be studied and further addressed in an attempt to produce training interventions that can enrich appropriate skills for safely riding this type of vehicle. It should be noted that in Israel [65], as in other countries worldwide, road users who hold a driving license do not need a riding license, insurance, or e-bike license, and can ride e-bikes on the same bicycle trails as mechanical bicycle users. Thus, there is a pressing need to address these road users’ ability to identify hazardous situations in the traffic environment. Aiming to simulate this typical situation, in which any driver’s license holder can ride an e-bike without any (or much) prior experience (for instance, by grabbing one of the e-bikes that are widely scattered and accessible for use at any moment in many urban areas), participants in the present study were specifically chosen as complete novices, i.e., those who have zero experience in riding e-bikes. Furthermore, as prior studies have noted that road users who have experience using multiple transportation modes may demonstrate improved hazard perception abilities as a result of their broad experiences [37,66], it was important to examine whether these complete-novice e-bike riders might benefit from designated hazard perception training intervention in light of their experience as drivers.
In summation, as earlier studies have shown that hazard perception skills tend to improve with experience [36], and have shown that experienced road users [28,33,40] and specifically e-bike riders [49] tend to detect more potential unmaterialized hazards, the objective of this study was to lay foundations for exploring whether developing hazard perception skills might enrich complete-novice e-bike riders’ ability to perceive potentially hazardous situations and predict future hazardous events prior to their materialization. Thus, the formation and evaluation of two designated hazard perception interventions for youngster complete-novice e-bike riders are described here, namely, ‘Act and Anticipate Training’ (AAT) and ‘Predictive and Commentary Training’ (PCT), with the aim of exploring whether they can be beneficial for increasing road safety. It was expected that trainees would be more sensitive than the control group to potential unmaterialized hazards. To investigate whether either of the techniques is preferable to the control or to the other group, the two training modes (AAT and PCT) were set up for comparison and participants’ responses were examined.

4. Materials and Methods

4.1. Participants

Thirty participants were recruited from within our academic institute and volunteered to take part in the study. Participants had normal vision with uncorrected [67,68] static acuity testing of 6/12 (20/40) or better [33,51,69]. Aiming to create homogeneity between the groups, several demographic characteristics were equalized; the process of allocating participants into groups was controlled by accounting for age, sex, automobile driving license experience, socioeconomic status, and sensation-seeking score. The participants’ mean age was 26.1 years (sd = 2.86), 26.1 years (sd = 2.73), and 26.33 years (sd = 1.00) for the AAT, PCT, and control groups, respectively. Accounting for sex (found to be a crucial factor in road users’ crash rate [70,71], the same male to female ratio (4:6, respectively) was kept constant in the three participant groups. Furthermore, as automobile driving license status has been found to play an important role in their performance in a hazard detection task [49], the participants’ driving experience was equalized; their mean automobile driving experience was 8.60 years (sd = 2.63), 8.78 years (sd = 1.29), and 9.54 years (sd = 2.56) for the AAT, PCT, and control groups, respectively. In accordance with prior research noting that the risk of road users’ injury is inversely related to their socioeconomic status [72], the participants were all of a similar socioeconomic level (i.e., middle class, 10,500–17,500 NIS per household). Furthermore, it has been argued [59] that participants’ sensation-seeking (i.e., their tendency to proactively pursue novel experiences and external stimuli aiming to appease their need for sensation [73]) should be considered when examining their hazard perception skills, as higher sensation-seeking scores (on a scale between ‘1’—low sensation seeking tendency, and ‘40’—high tendency) have been found to be associated with unsafe traffic behavior. Hence, participants’ sensation-seeking score was calculated and kept similar between the groups (mean sensation-seeking scale score 15.2, 16.1, and 15.7 for AAT, PCT, and control, respectively). Notably, participants all had the same level of experience with mechanical bicycles, that is, all knew how to ride mechanical bicycles but seldom used them. Lastly, exposure to traffic as e-bike riders was kept constant, as none of the participants had prior e-bike experience (similar to [41]). Study protocols were approved by the academic institute’s ethics board, and informed consent was obtained from all participants involved in the study.

4.2. Materials and Setup

4.2.1. Formation of the Training Interventions

In the present study, two hazard perception training interventions named ‘Act and Anticipate Training’ (AAT) and ‘Predictive and Commentary Training’ (PCT) were constructed according to the principles described below.
(a)
Exposure to a large number of diverse traffic situations:
When faced with unfamiliar conditions, experienced individuals tend to use their past experience in similar circumstances to better decipher the new situation, fill in gaps, and infer missing information, as well as to better predict forthcoming events [74]. Hence, an attempt was made to increase trainees’ exposure to genuine and unstaged real-life traffic situations [75] by presenting them with a large number of diverse road traffic situations, with the aim of enabling them to gain riding experience in various traffic settings in a short period of time and in a safe setting [29,41].
(b)
Scenarios situated in local settings:
Background and contextual cues play a key role in many cognitive processes, including learning [76,77]. In keeping with this argument, it has been suggested that environmental settings should be taken into account when constructing an effective hazard perception training intervention in order to ensure linkage between the unique characteristics of the geographic region and the typical road hazards it produces [28,29,41,51]. Accordingly, the present training interventions were developed in order to measure the Israeli landscape, infrastructure, and e-bike rider characteristics by presenting e-bike riders with an array of hazard perception movie clips depicting common traffic hazards that local e-bike riders tend to encounter.
(c)
Types of hazardous events:
Previous findings have indicated that the most prominent deficiency of young novice road users is identifying typical potential unmaterialized hazards [33,40,48,51]. Furthermore, it has been suggested that in order to better anticipate potential unmaterialized hazardous situations, trainees should first engage with situations where hazard instigators materialize [28,29,41]. In keeping with this assertion, the participants in this study observed more situations in which the hazard source materialized during the training sessions then during the test session, where most of the hazards were unmaterialized hazards. The videos presented to the participants were matched [29] such that similar hazardous events located in similar traffic environments appeared in both the training and the test session, while more potential unmaterialized hazards appeared in the test (Figure 1). For instance, where a training movie would depict a materialized hazardous situation such as riding in close proximity to parked vehicles when a door opens, a matching test movie would depict a potential unmaterialized hazardous situation such as riding in close proximity to parked vehicles in the same traffic environment without a door opening.
(d)
Theoretical–verbal component
A common practice found to be useful in hazard perception training is to present trainees with theoretical declarative knowledge-based material [41,78]. Indeed, it has been demonstrated that adding a theoretical–verbal section to a training intervention can increase the longevity and generalization of learning [79,80]. Accordingly, a theoretical–verbal component was used in this research in both training interventions, aiming to enhance participants’ awareness of road hazards by introducing trainees to the various types of hazards that exist and the locations where they are most likely to appear.
(e)
Active–practical component
In addition to the theoretical–verbal component, each of the training interventions contained an active–practical component in which participants were required to actively search for and respond to hazardous situations by engaging in action. Indeed, it has been previously suggested [29,81] that hybrid training interventions composed of both theoretical and active components can be more effective than can exclusive use of either component individually. As learning is based upon the link between action and perception [77,82], training processes should advance from action to concept [83], and can be more effective when an individual is required to physically respond to a given situation as opposed to only observing it as a spectator [82]. Hence, the active component in the AAT intervention was aimed at emulating an action–perception loop by requesting participants to produce responses to hazardous situations over a limited time period. It was conjectured that riding experience could be gained, at least to an extent, by producing repeated responses to hazardous situations, and that proactively identifying and responding to hazards might benefit the process of detecting hazards. AAT trainees were first presented with the theoretical–verbal component, aiming to improve awareness of hazards by exposing them to theoretical knowledge regarding which types of hazards exist and where they are most likely to appear. Then, trainees observed the movie footage depicting typical urban hazard perception test scenarios and performed a hazard detection task in which they actively searched and responded to hazardous situations by pressing a response button each time a hazard instigator was detected. At the end of each clip, they were instructed to provide a description of the hazard situation that triggered their response. Then, feedback was provided in the form of an expert pointing out the hazard instigators depicted in the movie.
The PCT intervention was in line with the ‘full training package’ intervention in [57], which was found to improve hazard perception skill among drivers. Specifically, this intervention was based upon the authors’ recommendation to use the ‘full training package’, minus self-generated commentaries, as no benefit was found when adding self-generated commentaries to expert commentaries. Thus, in addition to the theoretical–verbal component, this intervention included a ‘what might happen next?’ exercise and expert commentary training. Trainees were first shown half of the movie clip footage of a hazardous traffic situation that was cut short, occluding as soon as the hazard began to develop, and were required to predict ‘what might happen next?’ [57,62]. Then, they were shown what actually happened when the video resumed. After each movie clip, feedback was provided in the form of an expert pointing out the hazard instigators depicted in the movie. In the third and last part, trainees were required to watch the other half of the movie clip footage of the hazardous traffic situation, which was provided along with expert commentary describing the hazard instigators depicted in each of the movies.

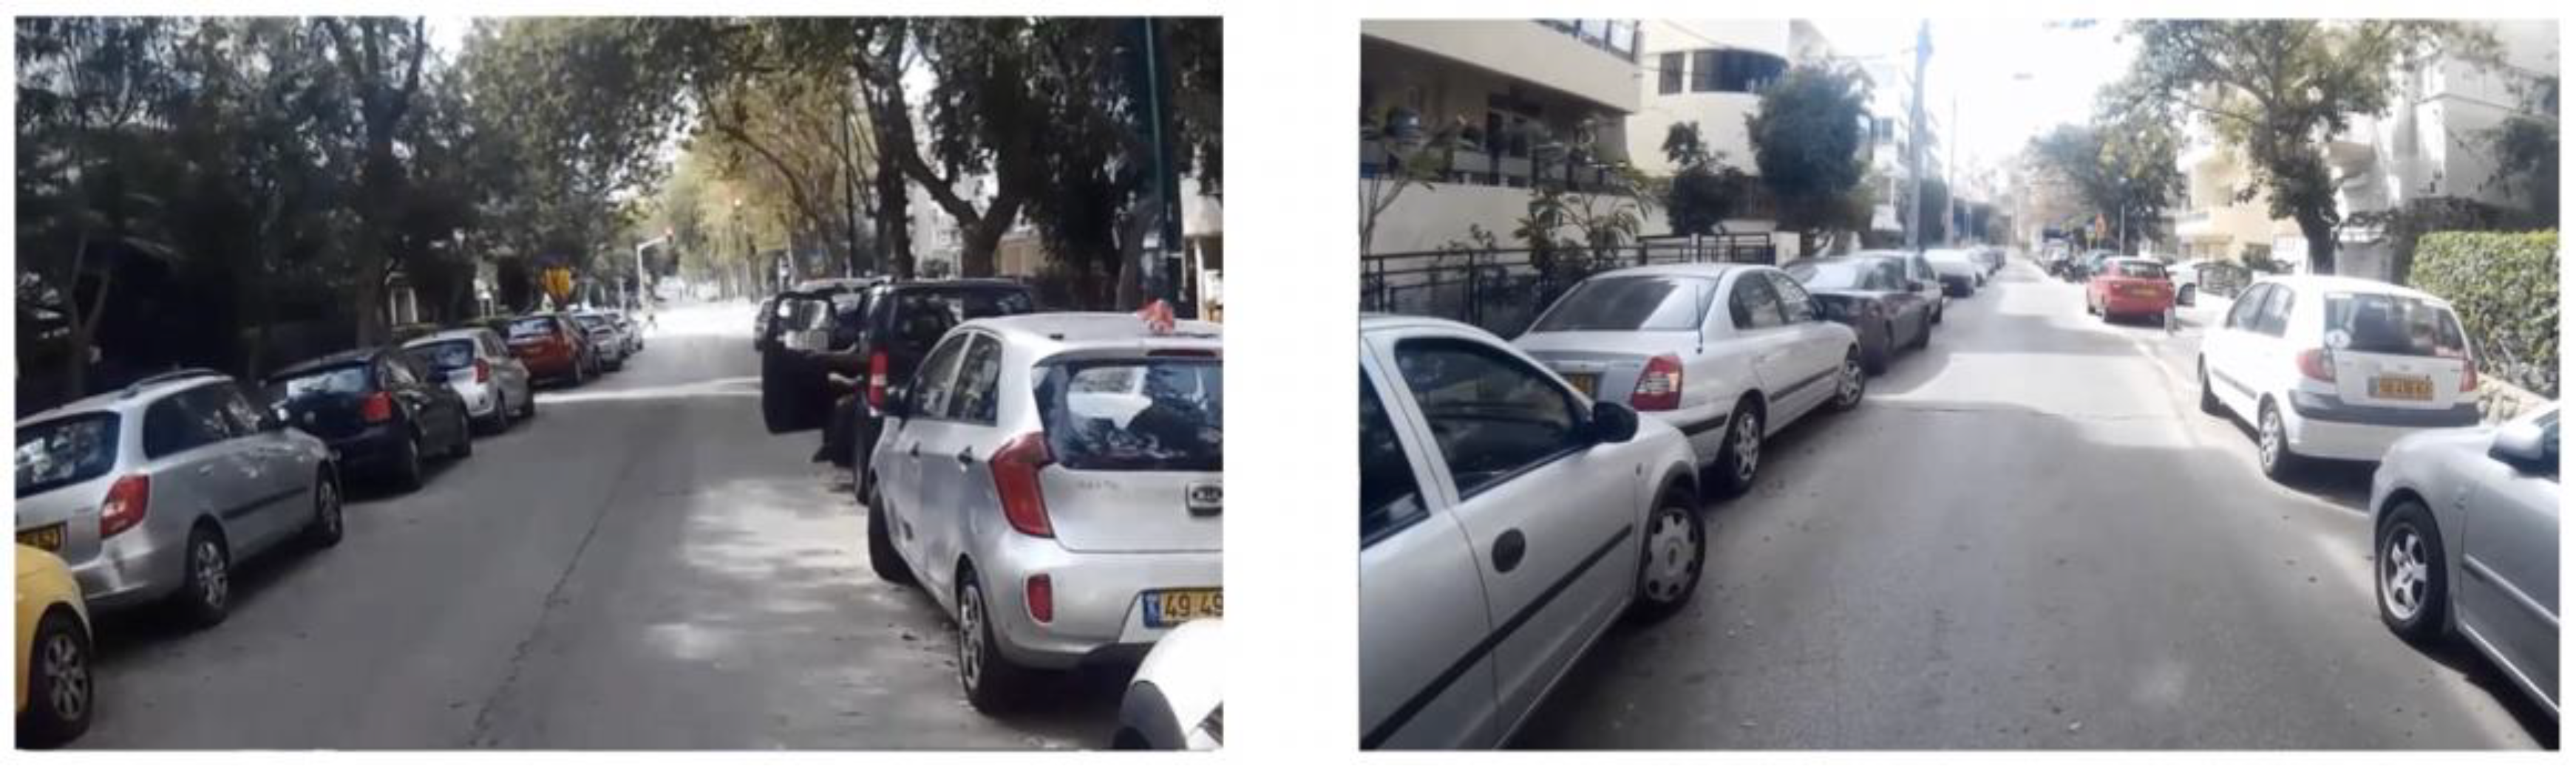
4.2.2. Hazard Perception Traffic Scene Clips

A set of daylight real-world traffic scene movie clips were recorded using a GoPro digital recording device mounted on an e-bike, presenting an e-bike rider’s view while riding an e-bike through the streets. Notably, it has been suggested that each traffic location tends to display its own unique characteristics that dictate a specific array of typical hazards; thus, the utility of a hazard perception traffic scene clip recording depends upon the setting (i.e., region, city, country) in which it is utilized [41]. As it has been shown that urban areas accounted for approximately 75% of e-bike fatalities in Israel between 2015 and 2018 [84], participants were required to observe an array of typical Israeli traffic movie clips filmed in urban Tel Aviv streets [29,75]. Movies were edited into a set of thirty movie clips of 10–40 s long that were utilized in the training session. An additional set of ten movie clips were utilized in the test session (as was the case in [49]). Consistent with prior studies [41,49,51,85,86], each movie clip depicted a different number of hazardous situations.
Aiming to construct intervention programs that are specific for e-bike riding, the movie footage depicted real-world traffic scenes taken from an e-bike rider’s perspective and illustrating a variety hazard types and traffic environments that users would typically encounter, thereby presenting the e-bike rider’s experience of riding fast and accelerating fast [18,87] on designated cycling routes, traffic roads, and pavement. This is in line with previous research indicating that these riders use a mixture of urban facilities and switch between different road layouts [27] in a manner that increases their risk of being involved in conflicts with other road users as compared to mechanical bicycle users, mainly at intersections and near crosswalks [88]. Hazard situations consisted of dynamic (moving automobiles, pedestrians, motorcycles, and buses) as well as static (junctions, curves, vegetation, and other types of restricted field of view) instigators. In line with prior findings [18] suggesting motorized vehicles to be more hazardous for e-bike riders, the hazard situations consisted of 33% automobiles, 29% pedestrians, 19% motorcycles, and 19% buses. The movies presented to trainees were matched [29], with similar situations in the same traffic settings appearing in both the training and the test session; however, the testing movie clips depicted more potential unmaterialized hazards (Figure 1). All movie clips presented to the participants were preserved in their original version and were not amended or retouched.
Each participant was seated at an approximate distance of 60 cm from a 19″ LCD screen with a resolution of 1920 × 1080 pixels, on which the hazard perception movie clips were presented using a designated Visual Basic program. This program was developed in-house to present participants with the experimental materials (instructions, questionnaires, theoretical–verbal component), to play the movie clips, and to record the participants’ responses. The participants’ button presses were captured using a push button.

4.2.3. Questionnaires

The participants completed two computerized questionnaires. The first consisted of demographic and background questions. The second was a computerized Hebrew version [89] of the Sensation-Seeking Scale [90] comprising forty forced-choice items on a scale, designed to evaluate individual differences in sensation-seeking with regard to the four aspects of sensation-seeking: experience-seeking, disinhibition, thrill/adventure-seeking, and boredom susceptibility.

4.3. Procedure

Aiming to create matching and homogenous groups and to ensure to a large extent that the groups differed only by the particular treatment they each received, participants were allocated into one of three conditions (AAT, PCT, or control group) while accounting for age, sex, automobile driving license experience, socioeconomic status, and sensation-seeking score. Trainees underwent a training section, followed by a test section conducted one week later (resembling similar short-term assessments in the hazard perception training literature [29,41,57,91,92,93]), whereas the control group members underwent only the test.

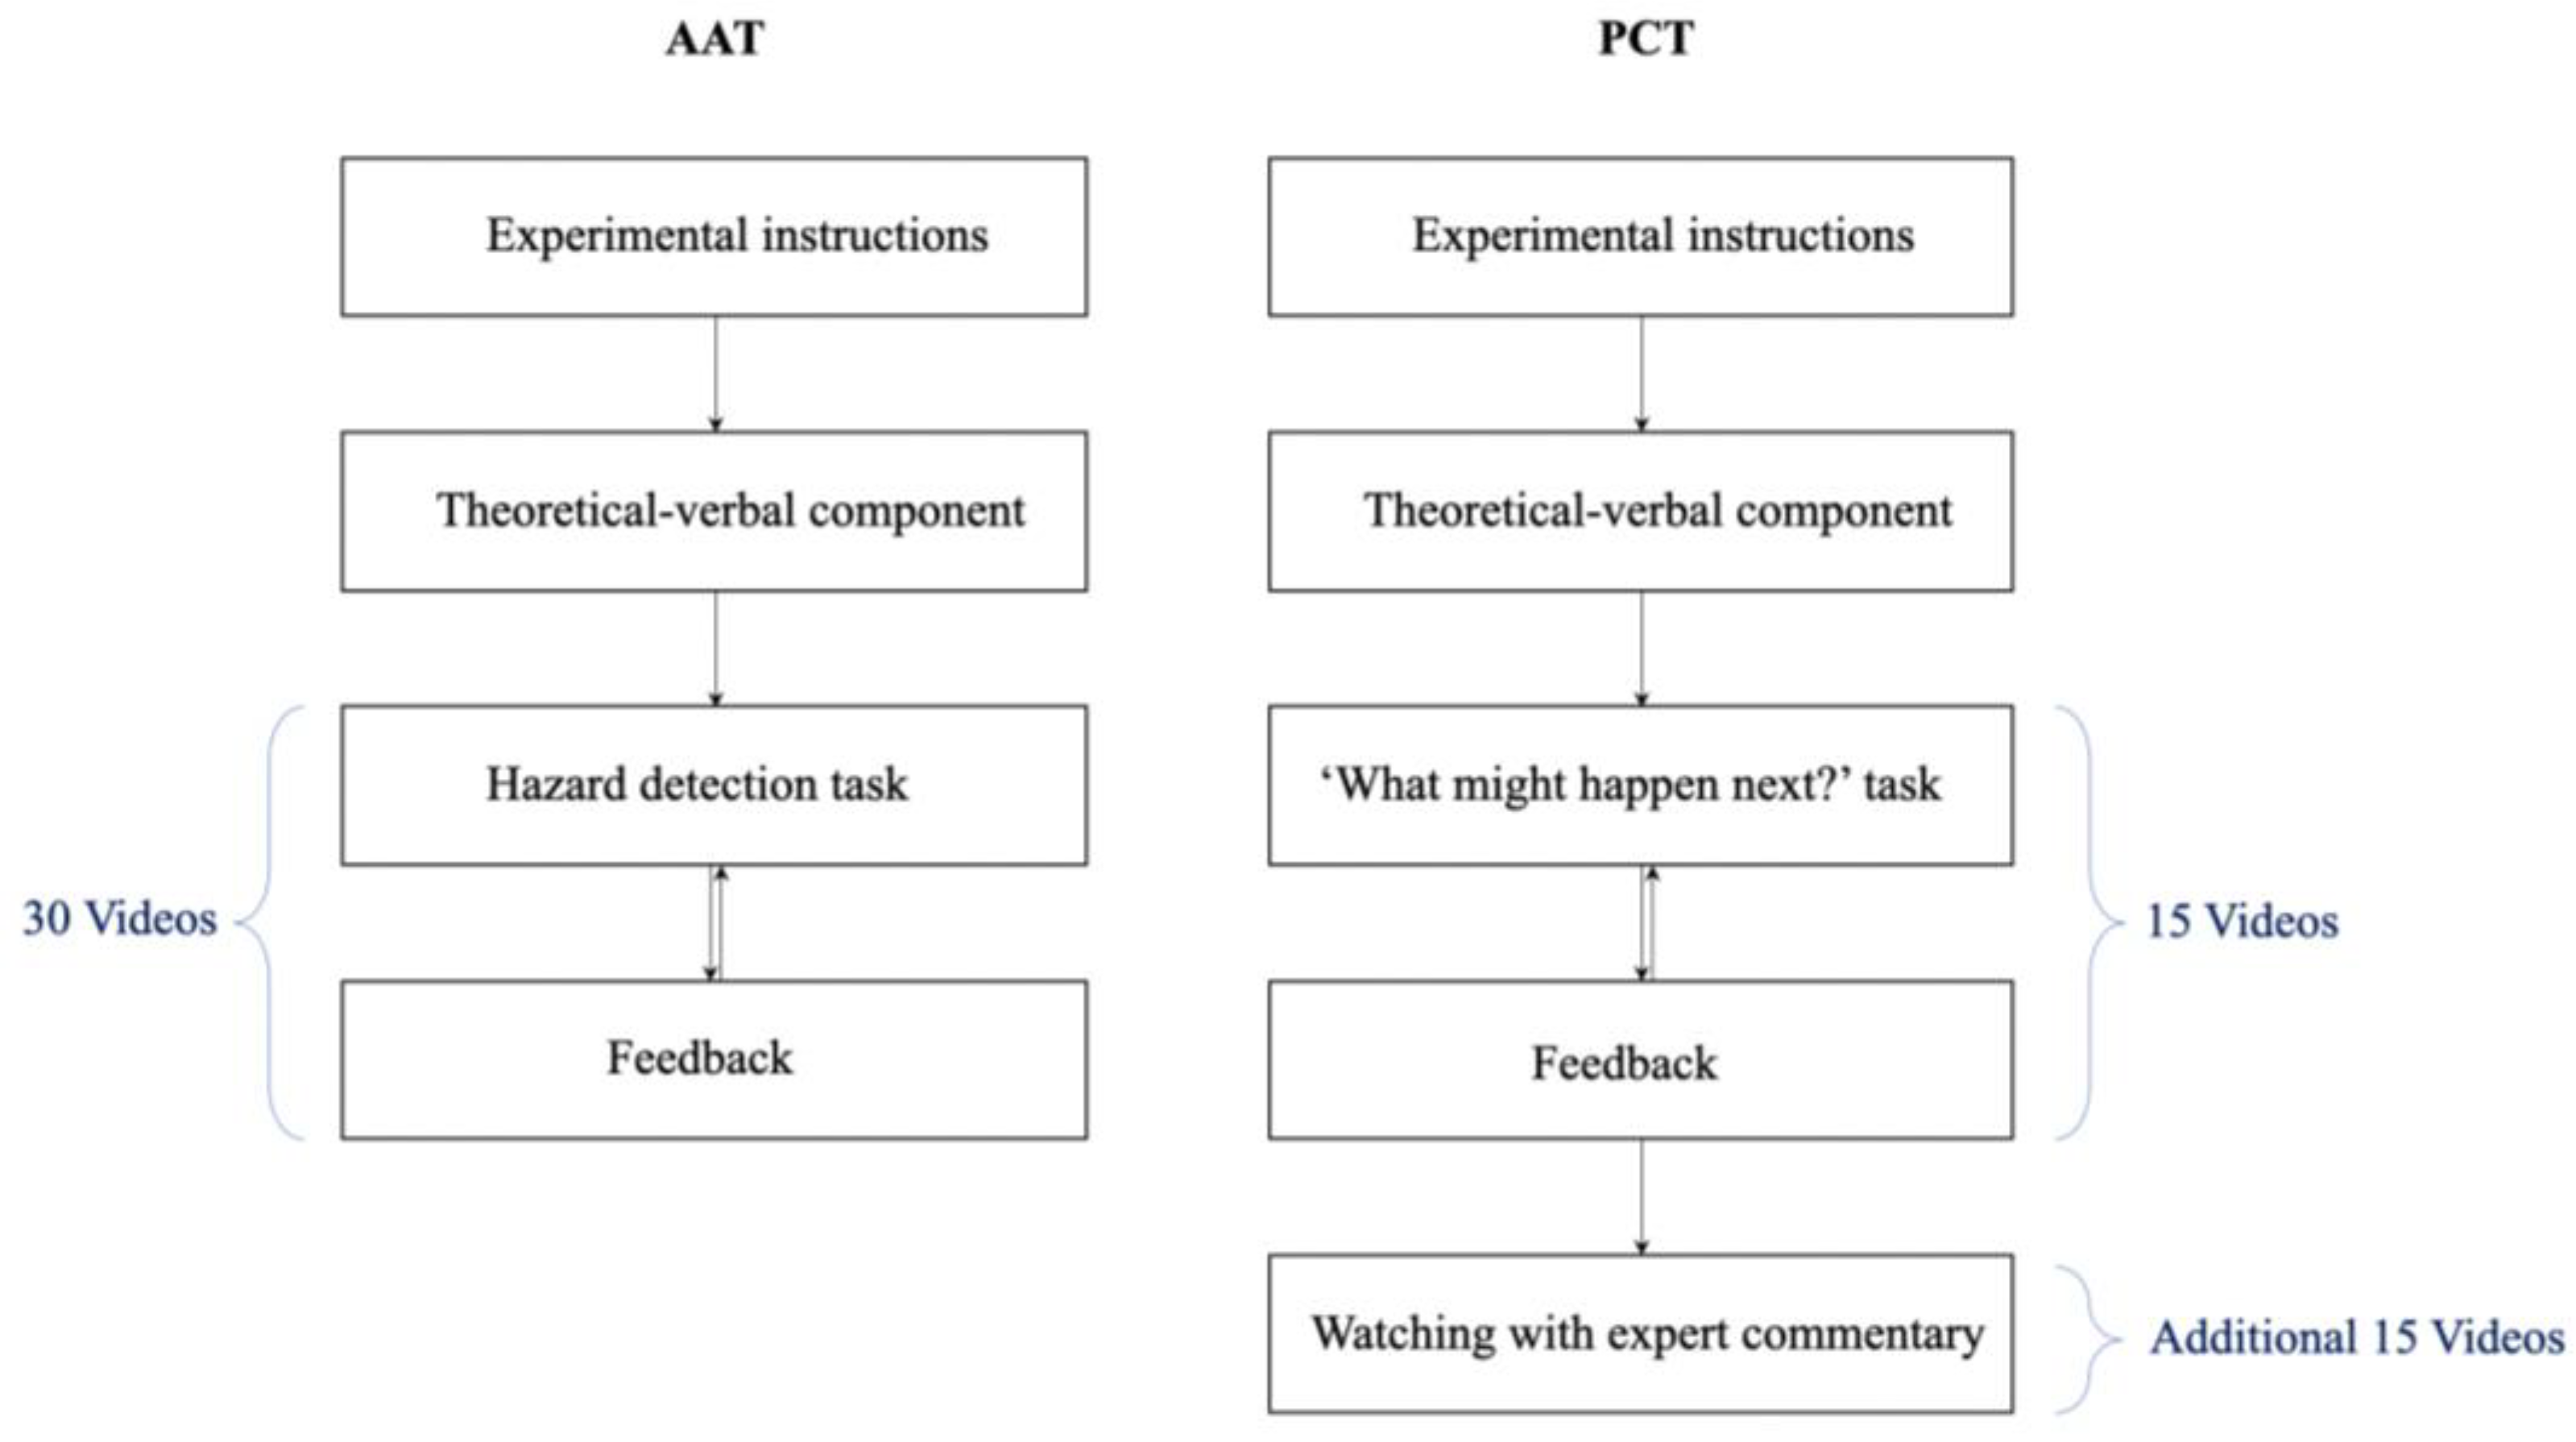
4.3.1. Training Session

Trainees were individually invited into the academic institute’s human factors laboratory for an hour-and-a-half long training intervention session. First, they each provided the experimenter with a signed informed consent form approving their participation in the study. Each trainee was introduced to the laboratory (where temperature and illumination conditions were kept constant throughout the experiment), then underwent the Snellen static acuity test. Trainees were then positioned in front of the laboratory’s computer screen. Next, the experimenter set up and activated the designated software.
Two modes of intervention were designed: AAT and PCT (Figure 2). The video database that these two training interventions were based upon was the same (i.e., participants were exposed to the same footage), however, there were conceptual differences between the two types of interventions in the way that they disclosed the training material to the trainees. Next, participants proceeded according to the specific intervention mode as described in the following sections.

Act and Anticipate Training (AAT)

Participants were read the experimental instructions and provided with an exhaustive explanation of the experimental task. AAT trainees were then presented with the theoretical–verbal component administered in the form of a twenty-minute power point presentation [85], with the aim of improving their awareness of hazards by exposing them to theoretical knowledge regarding hazard perception and its importance to driving safety. Trainees were exposed to a variety of traffic environments that e-bike users would typically encounter (designated cycling routes, traffic roads, and pavement), demonstrating the types of hazards (materialized, unmaterialized) and hazard instigators (moving automobiles, pedestrians, motorcycles, buses) that exist and the locations where they are most likely to appear.
Next, the trainees were instructed to observe the hazard perception clip database (i.e., thirty movie clips depicting typical urban hazard perception test scenarios taken from the perspective of an e-bike rider) and to perform a hazard detection task (i.e., to actively search and identify hazards and to press a designated response button each time they detect a hazard instigator). In line with prior studies such as [28,29,33,49,51], a hazard instigator was characterized according to the following definition adopted from [94], p. 3: an “object, situation, occurrence or combination of these that introduce[s] the possibility of the individual road user experiencing harm”. Participants were requested to respond as quickly as possible when they identified a hazard, and were further instructed to press the button only once for each of the instigators. Participants observed the scenarios in a random order. Aiming to resolve ambiguities regarding the reason for the initiation of each of the participants’ responses [29,95,96], at the end of each clip, participants were presented with blank fields in equal number to their responses to the clip and were instructed to fill them in with a description of the hazard instigator that triggered their response. Notably, although the entries were open-ended, most participants in almost all movies did not indicate any recall issues, and tended to recall the hazard instigators they identified. After each movie clip, feedback was provided in the form of an expert pointing out the hazard instigators depicted in the movie. Two practice videos were used to allow the participants to familiarize themselves with the experimental task.

Predictive and Commentary Training (PCT)

The PCT intervention resembled the ‘full training package’ intervention in [57], which was found to improve hazard perception skill among drivers. It should be noted that, based on the authors’ recommendations, self-generated commentaries were not used in this study, as no benefit was found when adding self-generated commentaries to expert commentaries.
Participants were read the experimental instructions and provided with an exhaustive explanation of the experimental task. PCT trainees were then presented with the theoretical–verbal component administered in the form of a twenty-minute power point presentation [85], aiming to improve awareness of hazards by exposing them to theoretical knowledge regarding hazard perception and its importance to driving safety. Trainees were exposed to a variety of traffic environments that e-bike users would typically encounter (designated cycling routes, traffic roads, and pavement), demonstrating the types of hazards (materialized, unmaterialized) and hazard instigators (moving automobiles, pedestrians, motorcycles, buses) that exist and the locations where they are most likely to appear.
Next, trainees were shown half of the movie clip footage (i.e., 15 videos) consisting of hazardous traffic situations that were cut short, occluding as soon as the hazard began to develop, and were requested to predict ‘what might happen next?’ [57,62] by filling in blank spaces. Next, the video resumed and trainees were shown what actually happened. After each movie clip, feedback was provided in the form of an expert pointing out the hazard instigators depicted in the movie.
In the third and last part, PCT trainees were required to watch the other half of the movie clip footage of a hazardous traffic situation (i.e., 15 videos), provided along with running verbal commentary from an expert describing the traffic environment and the hazard instigators depicted in the movie, aiming to direct trainees’ attention to precursors that should be detected and monitored.

4.3.2. Test Session

The test session took place one week after training [29,41,57,91,92,93]. During this session, each of the participants was instructed to observe ten typical urban hazard perception test scenarios taken from an e-bike rider’s point of view and to engage in a hazard detection task (i.e., to press a response button each time a hazard was identified). As previously mentioned, the hazard instigator definition was adopted from [94]. Notably, these testing scenarios were used to examine e-bike riders’ perception of hazards utilizing a hazard detection task, and found differences between e-bike riders with varied levels of e-bike riding experience [49]. Aiming to resolve ambiguities regarding the reason for the initiation of each of the participants’ responses [29,52,95,96], at the end of each clip the participants were presented with blank fields in equal number to their responses to the clip and were instructed to fill them in with a description of the hazard instigator that triggered their response. Although the entries were open-ended, most participants did not indicate any recall issues for almost all of the movies, and tended to recall the hazard instigators they identified. Participants were requested to respond as quickly as possible when a hazard was detected, and further instructed to press the button only once for each hazard instigator. Two practice videos were used to ensure that all of the participants were familiarized with the experimental task. After ensuring that they each understood the task and were ready to continue, the test began; participants observed the scenarios in a random order without knowing the exact number of scenarios they were about to see.
Lastly, it should be noted that the AAT was based upon the notion that repetitive exposure to traffic scene movies can be an effective tool for training hazard perception. As the hazard perception test itself necessitated exposure to traffic scenes, the mere fact of exposure to the test (i.e., use of pre-test) could have altered the results by increasing the participants’ sensitivity to the format and potentially modifying their performance. Hence, this reactive nature of the AAT intervention required the use of a post-test-only control design employing an array of matching participants, thereby creating equivalence between the trainee and control groups.

4.4. Data Preparation and Analyses

A summary file was generated for each of the participants depicting their button presses alongside the related time stamp and their matching verbal descriptions of each hazardous event. In accordance with the previous literature [29,48,49], a hazardous event was defined as the interval between the first and the last press made by participants, given that at least two of the participants responded at approximately the same time and referred to the same hazard instigator. An event onset was set as the earliest press made by any of the participants (assuming that the hazard instigator was indeed present in the scene), and its endpoint was set to the latest button press made by any of the participants (from the point when the hazard was first present until it was no longer visible). A button press was classified as a response to a hazard instigator only if both the verbal description of the hazard and the temporal location of the button press matched the attributes of that instigator. Participants’ self-reported incorrect responses (i.e., a response button that was mistakenly pressed) were excluded.
In total, thirty-nine hazardous situations were identified. It should be noted that thirty-three hazardous situations were predefined by the researchers. Further, six additional hazards were defined post hoc, where a new hazardous situation was added post hoc to the database only if at least 30% of the all participants identified it as hazardous [29]. Following prior research [51,53,85], these hazard situations were classified into two main hazard types: seventeen materialized hazards (i.e., a traffic occurrence where a failure to engage in an immediate evasive action may cause harm) and twenty-two potential unmaterialized hazards (i.e., sources of danger that do not require road users to engage in an immediate action but which should be detected and monitored). These hazard types were taken into account in the analysis process as detailed in the following paragraphs.
As the study was aimed at examining the training interventions’ effectiveness in enhancing trainees’ ability to identify hazardous situations, two types of analyses were applied: (a) response sensitivity, aiming to explore whether a specific participant group tended to report hazardous situations more often than the others; and (b) verbal description analysis regarding participants’ descriptions of the reasons they provided for identifying an instigator as hazardous, aiming to decipher which of the traffic hazards were detected by the different participant groups.

4.4.1. Response Sensitivity

Participants’ response sensitivity refers to the probability of a participant identifying a hazard and pressing the response button during the hazard instigator’s allotted time window. For this analysis, the dependent variable is binary distributed, indicating whether a participant pressed (‘1′) the response button within the allotted time window of the hazard or did not (‘0′). The analysis included two independent variables; the first independent variable was the participant group (AAT, PCT, control) and the second was the type of hazard (either a materialized or potential unmaterialized road hazard).
In order to examine whether any of the e-bike rider groups identified more hazards than the others, a binary logistic regression with a logit-link function within the framework of GLMM (generalized linear mixed models) was utilized. To account for individual differences, participants were included as a random effect. Sequential Bonferroni correction [97] was used for all post hoc analyses. Main effects and second order interaction of the fixed effects were included in the model.

4.4.2. Analysis of Verbal Descriptions

Participants’ verbal descriptions regarding the reasons they provided for identifying a particular instigator as hazardous were examined. Participants’ verbal descriptions were coded into two hazard types: materialized (e.g., “the car I tailgated suddenly braked”; “as I was riding, a pedestrian emerged and burst into my lane”) or potential unmaterialized (e.g., “my field of view was restricted due to the trashcan on the left”; “the e-bike I am riding is moving at a high speed”). Participants’ verbal descriptions were matched to specific hazardous events based on their depiction of the instigator they identified and the relevant time stamp. In line with prior studies [40,41,51], certain verbal descriptions were counted several times, as they mentioned more than one hazard instigator at a specific time-point due to the complexity of the real-world situations (e.g., “my field of view was blocked while a vehicle approached from the left”, which is both a materialized and a potential unmaterialized hazard). As the number of verbal descriptions was Poisson distributed, a Poisson regression with a log link function within the framework of GLMM was utilized. The between-group fixed effect included was participant group (AAT, PCT, or control). Hazard type (either a materialized or unmaterialized road hazard) was referred to as the within-group fixed effect. The dependent variable for analysis was defined as the number of verbal descriptions of hazard instigators articulated by the participants. Post hoc pairwise multiple comparisons were calculated using Sequential Bonferroni correction [97]. The main effects and second order interaction of the fixed effects were included in the model. To account for individual differences, participants were included as a random effect.

5. Results

5.1. Response Sensitivity

5.1.1. Participant Group

Applying the GLMM revealed a significant main effect of the participant group (F(2,1122) = 10.34, p < 0.001). Sequential Bonferroni post hoc pairwise comparisons revealed that control group members were significantly less likely to respond to a hazard instigator (estimated mean = 0.41, standard error = 0.06) compared to the PCT and AAT members (0.62, 0.05, Padj < 0.05; 0.76, 0.04 Padj < 0.001, respectively). Moreover, PCT members were significantly (Padj < 0.05) less likely to respond to a hazard instigator than the AAT members (Table 1).

5.1.2. Hazard Type

A significant main effect of the hazard type was revealed (F(1,1122) = 204.99, p < 0.001). Sequential Bonferroni post hoc pairwise comparisons revealed that participants were significantly less likely to respond to a potential hazard instigator (estimated mean = 0.33, standard error = 0.03) than a materialized hazard instigator (0.83, 0.02).

5.1.3. Participant Group and Hazard Type

Although the model did not find a significant interaction between participant group and hazard type (F(1,1122) = 1.30, N.S.). Sequential Bonferroni post hoc pairwise comparisons revealed that control group members were significantly less likely to respond to potential unmaterialized situations (estimated mean = 0.18, standard error = 0.04) than both training group members (0.39, 0.06, Padj < 0.01; 0.47, 0.06, Padj < 0.001 for PCT and AAT members, respectively).
Fewer differences were found between the participants’ responses to materialized hazard instigators, where control group members were significantly less likely to respond to materialized situations (estimated mean = 0.69, standard error = 0.06) than AAT group members (0.92, 0.03, Padj < 0.001); however, no significant difference was found between the responses of control group members and PCT members (0.81, 0.04, N.S.) to materialized situations (Figure 3).

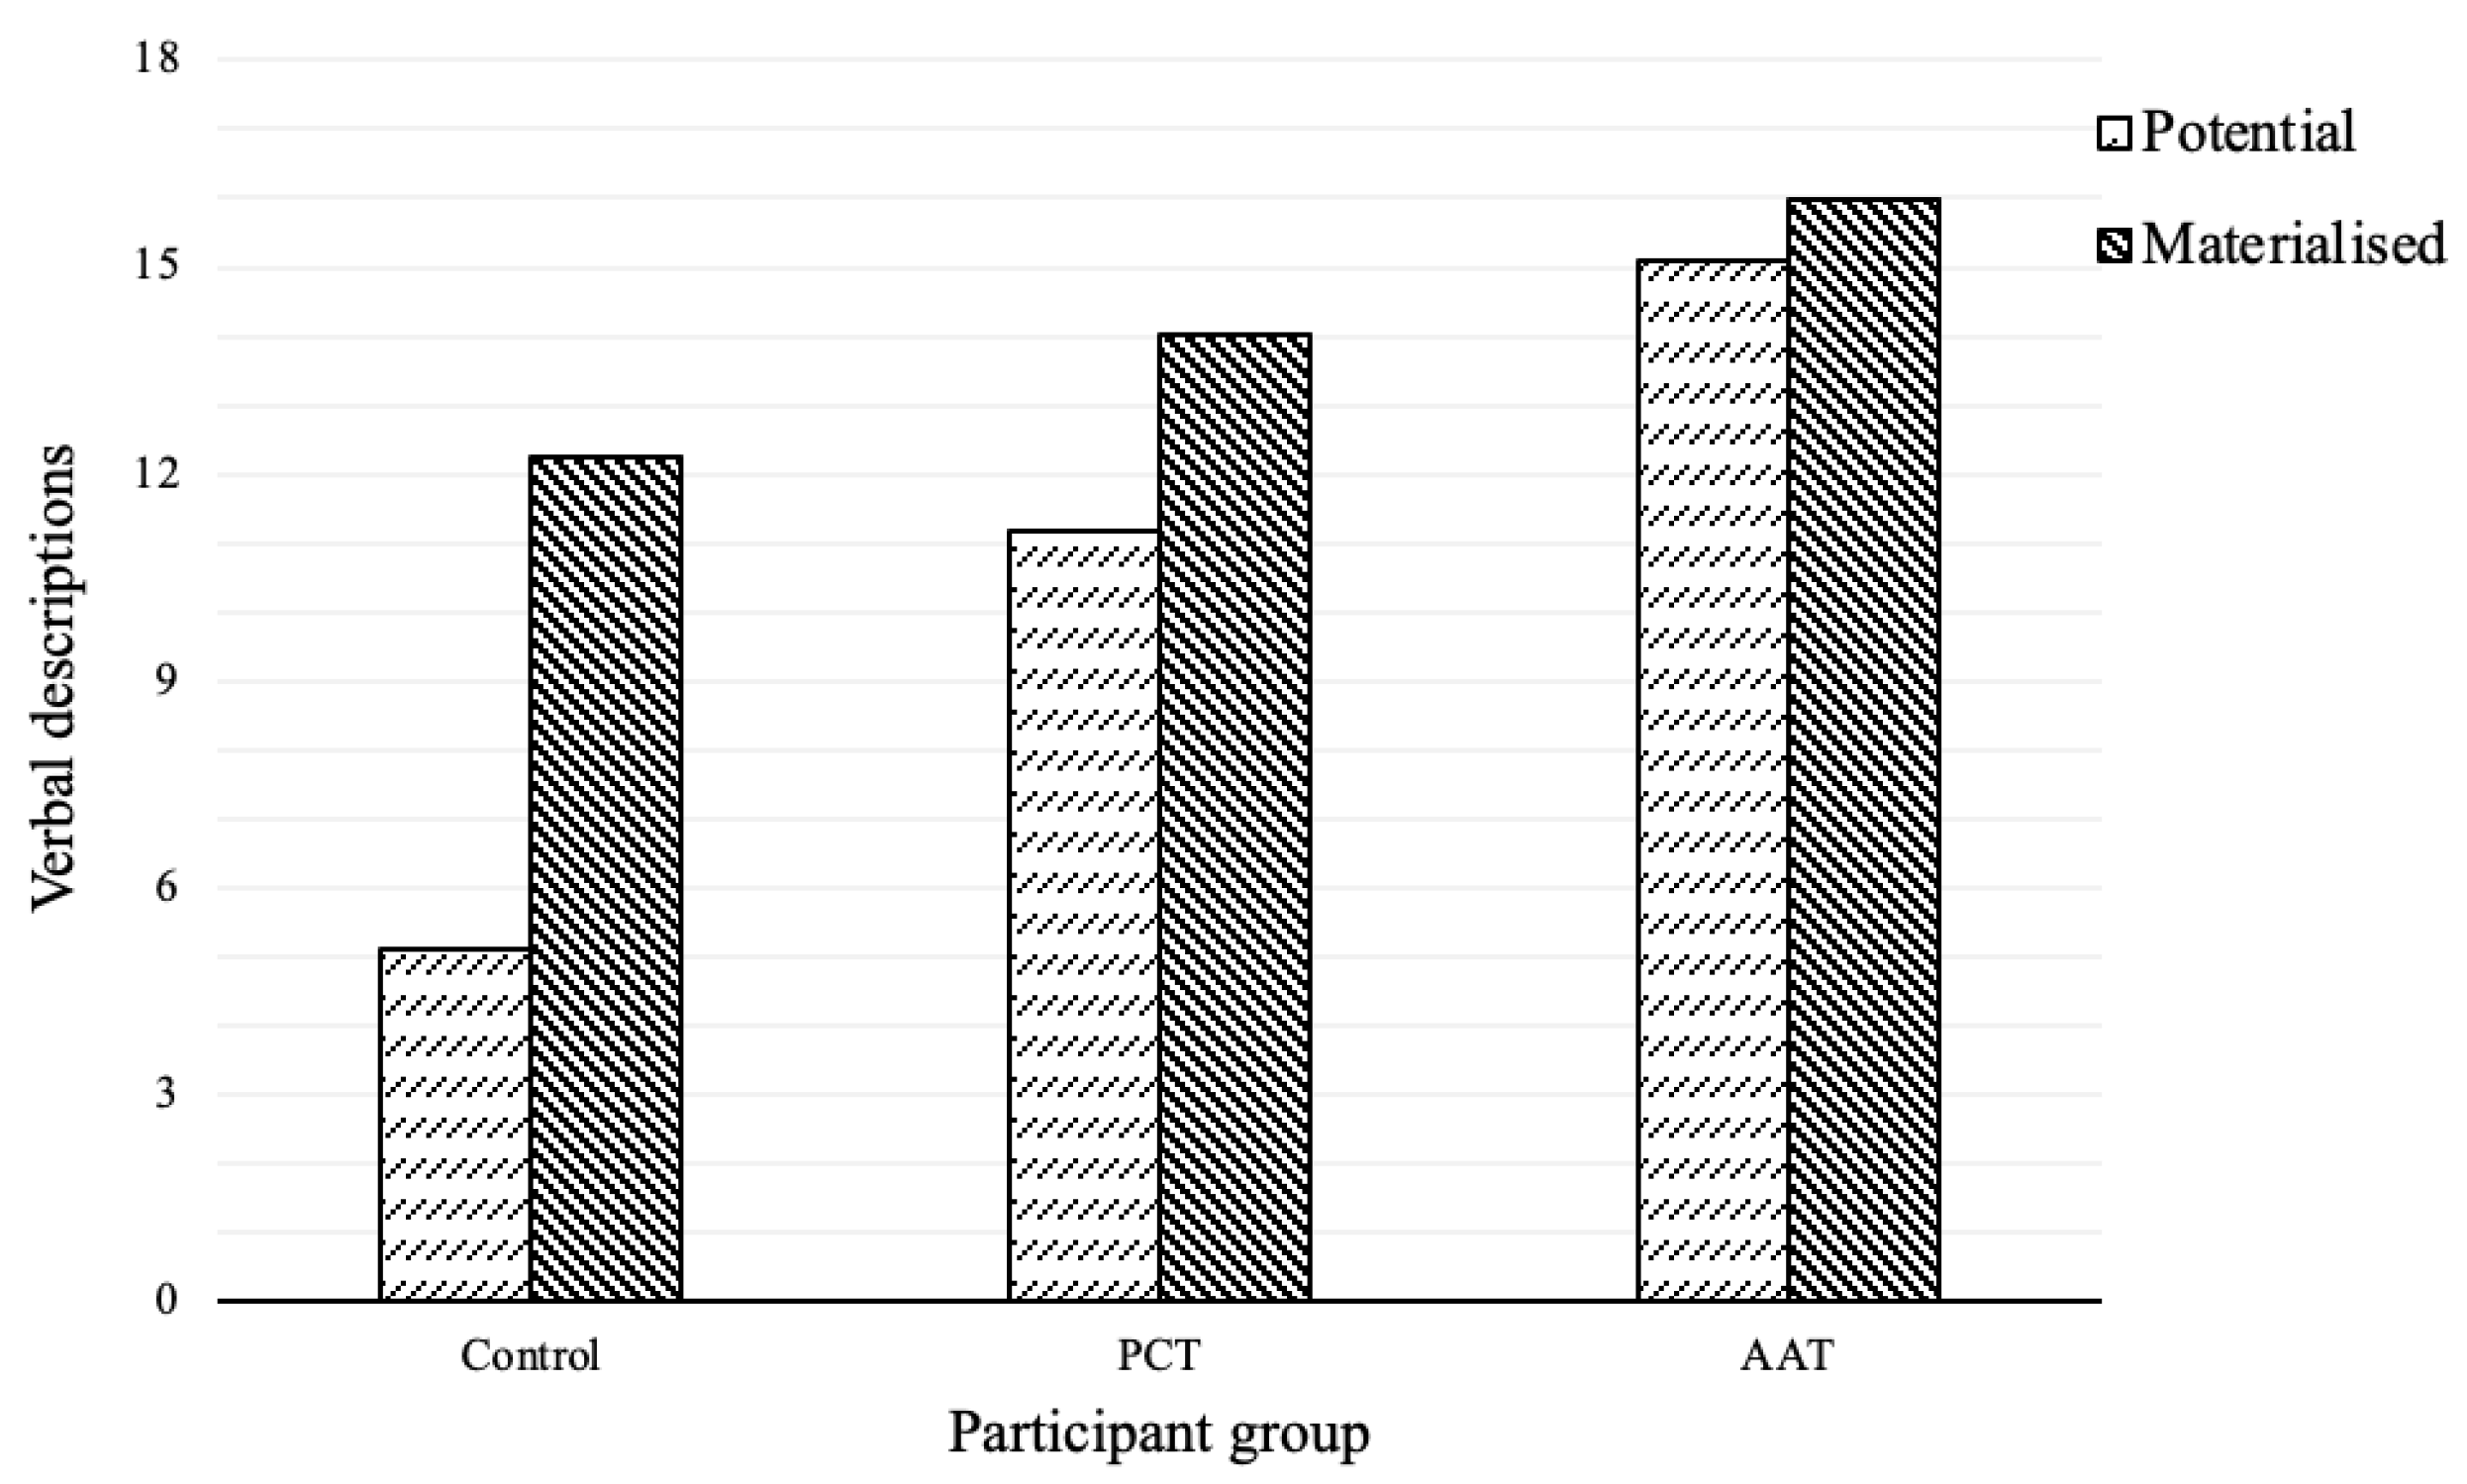
5.2. Analysis of Verbal Descriptions

5.2.1. Participant Group

Applying the GLMM revealed a significant main effect of the participant group (F(2,52) = 6.34, p < 0.01). Sequential Bonferroni post hoc pairwise comparisons indicated that control group members provided significantly fewer verbal descriptions of hazard instigators (estimated mean = 8.68, standard error = 1.34) than were provided by AAT members (15.55, 1.40, Padj < 0.01); however, no significant difference was found between control and PCT group members (12.61, 1.35, N.S.) (Table 2).

5.2.2. Hazard Type

A significant main effect of hazard type was revealed (F(1,52) = 16.45, p < 0.001). Sequential Bonferroni post hoc pairwise comparisons revealed that participants provided significantly fewer verbal descriptions of potential hazard instigators (estimated mean = 10.47, standard error = 0.87) than were provided for materialized hazard instigators (14.09, 0.94).

5.2.3. Participant Group and Hazard Type

The model revealed a significant interaction between participant group and hazard type (F(2,52) = 4.61, p < 0.01). Sequential Bonferroni post hoc pairwise comparisons revealed that control group members provided significantly fewer verbal descriptions of potential unmaterialized situations (estimated mean = 5.12, standard error = 1.36) than both training groups members (11.18, 1.50, Padj < 0.01; 15.11, 1.63, Padj < 0.001, for PCT and AAT members, respectively). However, no differences were found between participants’ responses to materialized hazard instigators (estimated mean = 12.24, standard error = 1.63; 14.04, 1.60; 15.98, 1.66 for control, PCT, and AAT, respectively) (Figure 4).

6. Discussion

In the past decade, e-bikes have become an increasingly popular means of transport for sustainable, affordable, and efficient personal commuting [6,8,9,98,99,100]. Previous research has found that e-bike riders are more likely to become involved in traffic crashes [18,19]. Although hazard perception capabilities are imperative in the process of safely negotiating traffic [28,29,33,34,38,39,41], and even though prior studies have demonstrated that hazard perception training interventions may be an effective tool towards enhancing skills among road users [38,40,41,101], research regarding training in the context of hazard perception skills among young e-bike riders in general, and among young complete-novice e-bike riders in particular, is lacking. The current study was aimed at developing and evaluating two modes of hazard perception training intervention that aspire to enhance young complete-novice e-bike riders’ awareness towards potential, unmaterialized hazards in the traffic environment. As experienced road users in general [33,48] and experienced e-bike riders in particular [49] have been found to identify more potential unmaterialized hazard instigators compared to novices [28,48,53] and complete novices [41], trainees were expected to be more attentive towards potential unmaterialized hazards compared to control and to mention more unmaterialized hazard instigators in their verbal descriptions. As conjectured [29,41], trainees in both intervention programs showed enhanced attentiveness towards potential unmaterialized hazards, and tended to perform better compared to control group members in both their response sensitivity and verbal descriptions.
Specifically, the response sensitivity analysis revealed a significant main effect of the participant group, with control group members less likely to respond to a hazard instigator than both trainee groups; furthermore, PCT group members were less likely to respond to a hazard instigator than the AAT members. Post hoc pairwise comparisons revealed that control group members were significantly less inclined to identify unmaterialized road hazards than members of both training groups. In addition, fewer differences were found between the participants’ responses to materialized hazard instigators, with control group members significantly less likely to respond to materialized situations than AAT group members. Regarding the verbal descriptions, analysis indicated that control group members provided fewer verbal descriptions of the hazard instigators than were provided by AAT members; however, no significant difference was found between control and PCT group members. Moreover, an interaction was revealed between the participant group and hazard type, with control group members providing fewer verbal descriptions of potential unmaterialized situations than members of either training group. However, no differences were found between participants’ responses to materialized hazard instigators.
These results are consistent with the research hypotheses, indicating that training hazard perception may significantly improve complete-novice e-bike riders’ chances of identifying potential unmaterialized hazards. These findings are in line with prior literature regarding road users exemplifying that hazard perception is dependent on prior experience and is susceptible to training [28,33,36,40,101,102]. Notably, considering the main effect of the participant group in the response sensitivity results, in which both PCT members and control were less likely to respond to a hazard instigator than AAT members, it can be suggested that the AAT intervention was more beneficial than the PCT training. Notably, however, this difference disappeared when the type of hazard was taken into account, as no differences were found between AAT and PCT trainees regarding unmaterialized hazards. Because the main focus of this study was participants’ sensitivity towards potential unmaterialized hazards, these results support the idea that both interventions were similarly effective.
It should be noted that the AAT intervention was based on the notion that exposing young complete-novice e-bike riders to a vast array of materialized hazardous situations during the training intervention would enable them to anticipate more potential unmaterialized hazards during testing. Indeed, repeated exposure to specific hazards has been shown to improve hazard perception skills among drivers [29,101]. These results may provide initial evidence for the notion that the more trainees respond to events and experience riding, as was the case in the AAT mode, the more they accumulate information and experience while learning how to better estimate the likelihood that particular hazards will appear in specific environments [29]. It is suggested that in this case such experience enabled these trainees to integrate elements in the environment and predict future events, as was the case for inexperienced drivers [28] and child-pedestrians [41] in previous research. It can be further suggested that the differences found between the two training interventions with regard to the main effects stemmed from the fact that AAT trainees were required to be more proactive. Namely, these participants had to choose when to push the button, and were thus required to detect and identify hazards and to decide to act, while the PCT trainees were asked to predict ‘what might happen next?’, and were more reactive in the sense that they were required to predict, not identify, a situation as hazardous, and only had to predict future events at a specifically chosen point in time.
Additionally, these findings suggest that including an active–practical component in training intervention programs can be an effective technique for enhancing complete-novice e-bike riders’ ability to perceive potentially hazardous situations. Thus, it is beneficial to promote the idea of actively responding to displayed hazard perception traffic scenes as an off-road tool for training young complete-novice e-bike riders to identify road hazards and to predict hazardous situations prior to their materialization. Utilization of this hazard perception training paradigm developed to produce a coherent intervention (as in the cases of [29,41]) can be useful for creating a future constructive intervention component aimed at reducing involvement in road crashes.
Lastly, this study presents early evidence that a hazard perception training package of the type used here may produce a training effect in young complete-novice e-bike riders that can persist even after a week. This can be regarded as an important first step in establishing that such training interventions have an enduring effect, although further work is needed to determine their longevity. Exploring and demonstrating complete-novice e-bike riders’ knowledge deficiencies in evaluating potential hazard instigators may contribute to the effort of producing public education programs as a major road safety technique.

7. Conclusions

The hazard perception skill has been extensively researched in various road safety domains [28,29,35,39,101] and found to be vital for road users, one of the few traffic negotiating skills to correlate with traffic crash involvement [38,42,43,44]. Furthermore, several countries worldwide utilize a video-clip-based hazard perception test as an integral part of the licensing process for automobile drivers [36,43]. However, only limited research exists on enhancing the hazard perception skill through training among e-bike riders in general and among young complete-novice e-bike riders in particular. This study reports the development and evaluation of two hazard perception interventions. Findings suggest that young complete-novice e-bike riders may benefit from training. In this regard, the findings may serve as a support tool for gaining better comprehension of the hazard perception skill in the hope of laying the initial foundations for designing a hazard perception training intervention for young complete-novice e-bike riders.
As the use of sustainable commuting may be beneficial for the environment, promoting e-bike use can contribute to a more environmentally friendly transport system. For e-bikes to achieve their full potential and become a sustainable and safe mode of transportation, policies should aim to improve these riders’ safety. Indeed, the current exploratory study’s findings suggest that a designated training intervention can be an effective tool towards this goal and play a role in the effort to enhance traffic safety. This study can be regarded as a starting point towards producing proper guidelines for future hazard perception training intervention programs for young complete-novice e-bike riders.
Lastly, as part of the design and implementation of public policies, consideration should be given to the development and distribution of programs that promote e-bike riding as a sustainable means of transportation while focusing on improving potential users’ perceptions of unmaterialized potential traffic hazards. By aiming to increase ease of use while promoting safety, these programs should be delivered to the general public in the most suitable and accessible way. For instance, future training interventions could be carried out either individually (e.g., as a self-administered application) or in a group setting following collaboration with various community institutions while providing designated incentives for the use of this ecological transportation mode and for taking part in the hazard perception training program aiming to enhance safety.
Finally, several limitations should be addressed. First, participants completed the hazard detection task in a controlled laboratory setting. Taking a more ecological approach by comparing their performances to those displayed while similar tasks are being carried out in real-world settings may provide further support for these findings. Moreover, a longer-term evaluation of the training intervention programs is needed in order to ascertain their contribution to riders’ safety and whether it can be sustained over a longer time period. Second, it should be noted that the reactive nature of the AAT intervention prevented the use of a pre-test/post-test control design, as is used in the case of training novice automobile drivers [29] and pedestrians [41]. The AAT was based upon the notion that repetitive exposure to traffic scene movies may be an effective tool for training hazard perception. As the hazard perception test itself necessitates exposure to traffic scenes, mere exposure to the test (i.e., use of pre-test) could alter the results by increasing the participants’ sensitivity and potentially modifying their performance. Thus, it was necessary to employ a post-test-only control design and to use an array of matching participants by creating equivalence between trainees and control and aiming to create groups that differed only in the specific treatment they each received. In addition, it might be argued that the AAT trainees could have performed better because they were familiarized with the hazard detection task. Nevertheless, an early examination conducted prior to the experiment determined that two practice videos were sufficient for participants to comprehend, acclimatize, and seamlessly carry out the experimental task.
Third, sample size might be considered a limitation of the present study. Notwithstanding this, in setting a predetermined commonly used α = 5%, the probability of finding a false positive was determined a priori. Hence, the sample size affected only the power of the procedures and the probability of true positives; that is, although the sample size did affect the probability of missing correct responses, it did not affect the probability of false alarms. Furthermore, the fact that significant effects were revealed strengthens the findings. Additional effects might have been missed as a result of low power following the small sample size.
Fourth, the sample of young complete-novice e-bike riders might not have been representative of the entire user population. Indeed, the process of allocating participants into groups by accounting for age, sex, automobile driving license status, socioeconomic status, and sensation-seeking score was only partially and not fully controlled. Hence, replicating the results with a larger and more diverse sample would further support these research findings. In addition, in the present study the trainees were chosen as complete novices in riding e-bikes, aiming to simulate a typical situation both in Israel [65] and in other countries worldwide, where any driver’s license holder can allow users to ride an e-bike without any prior experience. Future studies may benefit from exploring the effects of training on young inexperienced e-bike riders (e.g., novice riders with e-bike riding experience [49]) beyond zero-experience complete novices.
Lastly, as e-bikes are becoming increasingly popular among youngsters [9,24,25,26,27,99], the present research focused on riders in this age group. Yet, it is worth noting that in several regions, such as in Australia and the USA [5,8], the prevalence of use is rather higher among older and middle-aged individuals. Thus, it is suggested that further research should direct attention toward investigating and improving the hazard perception abilities of these e-bike riders.

Funding

This research received no external funding.

Institutional Review Board Statement

Not applicable.

Informed Consent Statement

Study protocols were approved by the academic institute’s ethics board, and informed consent was obtained from all participants involved in the study.

Data Availability Statement

Not applicable.

Conflicts of Interest

The author declares no conflict of interest. All participants gave their informed consent for inclusion before they participated in the study. The study was conducted in accordance with the Declaration of Helsinki, and the protocol was approved by the Ethics Committee of Holon Institute of Technology (HIT).

References

  1. de Kruijf, J.; Ettema, D.; Dijst, M. A longitudinal evaluation of satisfaction with e-cycling in daily commuting in the Netherlands. Travel Behav. Soc. 2019, 16, 192–200. [Google Scholar] [CrossRef]
  2. Davies, N.; Blazejewski, L.; Sherriff, G. The rise of micromobilities at tourism destinations. J. Tour. Futures 2020, 6, 209–212. [Google Scholar] [CrossRef]
  3. Yang, H.; Ma, Q.; Wang, Z.; Cai, Q.; Xie, K.; Yang, D. Safety of micro-mobility: Analysis of E-scooter crashes by mining news reports. Accid. Anal. Prev. 2020, 143, 105608. [Google Scholar] [CrossRef] [PubMed]
  4. Allem, J.P.; Majmundar, A. Are electric scooters promoted on social media with safety in mind? A case study on Bird’s Instagram. Prev. Med. Rep. 2019, 13, 62–63. [Google Scholar] [CrossRef]
  5. Plazier, P.A.; Weitkamp, G.; van den Berg, A.E. “Cycling was never so easy!” An analysis of e-bike commuters’ motives, travel behaviour and experiences using GPS-tracking and interviews. J. Transp. Geogr. 2017, 65, 25–34. [Google Scholar] [CrossRef]
  6. Chang, F.; Haque, M.M.; Yasmin, S.; Huang, H. Crash injury severity analysis of E-Bike Riders: A random parameters generalized ordered probit model with heterogeneity in means. Saf. Sci. 2022, 146, 105545. [Google Scholar] [CrossRef]
  7. Tang, T.; Guo, Y.; Zhou, X.; Labi, S.; Zhu, S. Understanding electric bike riders’ intention to violate traffic rules and accident proneness in China. Travel Behav. Soc. 2021, 23, 25–38. [Google Scholar] [CrossRef]
  8. Fishman, E.; Cherry, C. E-bikes in the Mainstream: Reviewing a Decade of Research. Transp. Rev. 2016, 36, 72–91. [Google Scholar] [CrossRef]
  9. Hadar, Y. Electric Bicycle Accidents—Data, Risk Factors, Behaviors and Means of Dealing with the Phenomenon; Israeli National Road Safety Authority: Jerusalem, Israel, 2018.
  10. Popovich, N.; Gordon, E.; Shao, Z.; Xing, Y.; Wang, Y.; Handy, S. Experiences of electric bicycle users in the Sacramento, California area. Travel Behav. Soc. 2014, 1, 37–44. [Google Scholar] [CrossRef]
  11. Siman-Tov, M.; Radomislensky, I.; Peleg, K.; Bahouth, H.; Becker, A.; Jeroukhimov, I.; Karawani, I.; Kessel, B.; Klein, Y.; Lin, G.; et al. A look at electric bike casualties: Do they differ from the mechanical bicycle? J. Transp. Health 2018, 11, 176–182. [Google Scholar] [CrossRef]
  12. de Haas, M.; Kroesen, M.; Chorus, C.; Hoogendoorn-Lanser, S.; Hoogendoorn, S. E-bike user groups and substitution effects: Evidence from longitudinal travel data in the Netherlands. Transportation 2021, 49, 815–840. [Google Scholar] [CrossRef]
  13. Gitelman, V.; Korchatov, A.; Elias, W. Speeds of young e-cyclists on urban streets and related risk factors: An observational study in Israel. Safety 2020, 6, 29. [Google Scholar] [CrossRef]
  14. Schleinitz, K.; Petzoldt, T.; Franke-Bartholdt, L.; Krems, J.; Gehlert, T. The German Naturalistic Cycling Study–Comparing cycling speed of riders of different e-bikes and conventional bicycles. Saf. Sci. 2017, 92, 290–297. [Google Scholar] [CrossRef]
  15. Schepers, J.P.; Fishman, E.; Den Hertog, P.; Wolt, K.K.; Schwab, A.L. The safety of electrically assisted bicycles compared to classic bicycles. Accid. Anal. Prev. 2014, 73, 174–180. [Google Scholar] [CrossRef] [PubMed]
  16. Ma, C.; Yang, D.; Zhou, J.; Feng, Z.; Yuan, Q. Risk riding behaviors of urban e-bikes: A literature review. Int. J. Environ. Res. Public Health 2019, 16, 2308. [Google Scholar] [CrossRef]
  17. Rose, G. E-bikes and urban transportation: Emerging issues and unresolved questions. Transportation 2012, 39, 81–96. [Google Scholar] [CrossRef]
  18. Dozza, M.; Piccinini, G.F.B.; Werneke, J. Using naturalistic data to assess e-cyclist behavior. Transp. Res. Part F Traffic Psychol. Behav. 2016, 41, 217–226. [Google Scholar] [CrossRef]
  19. Hertach, P.; Uhr, A.; Niemann, S.; Cavegn, M. Characteristics of single-vehicle crashes with e-bikes in Switzerland. Accid. Anal. Prev. 2018, 117, 232–238. [Google Scholar] [CrossRef]
  20. Savitsky, B.; Radomislensky, I.; Goldman, S.; Kaim, A.; Acker, A.; Aviran, N.; Bahouth, H.; Bar, A.; Becker, A.; Braslavsky, A.; et al. Electric bikes and motorized scooters-popularity and burden of injury. Ten years of national trauma registry experience. J. Transp. Health 2021, 22, 101235. [Google Scholar] [CrossRef]
  21. Bodas, M.; Radomislensky, I.; Givon, A. Electric-Bicycle and Electric-Scooter Injuries in Road Accidents: 2020 Annual Report; Israel National Center for Trauma and Emergency Medicine; Gertner Institute for Epidemiology and Health Policy Research: Beer-Sheva, Israel, 2021.
  22. Gehlert, T.; Kröling, S.; Schreiber, M.; Schleinitz, K. Accident analysis and comparison of bicycles and pedelecs. In Framing the Third Cycling Century: Bridging the Gap between Research and Practice; Grafl, K., Bunte, H., Dziekan, K., Haubold, H., Eds.; German Environment Agency: Dessau-Roßlau, Germany, 2018; pp. 77–85. [Google Scholar]
  23. Twisk, D.; Vlakveld, W.; Dijkstra, A.; Reurings, M.; Wijnen, W. From Bicycle Crashes to Measures; SWOV Institute for Road Safety Research: Leidschendam, The Netherlands, 2013. [Google Scholar]
  24. Hakkert, S.; Gitleman, V.; Carmel, R.; Korczatov, A.; Said, M.; Chen, S.; Gnaim, M.; Bechor, S. Characterizing the Needs and Solutions for Integrating Alternative Means of Transport into the Urban Space: A Concluding Report; Road Safety Research Center, Technion: Haifa, Israel, 2018. [Google Scholar]
  25. Nguyen, X.T.; Nguyen, Q.H. Service issues: Overview of electric vehicles use in Vietnam. In Proceedings of the Armand Peugeot Chair International Conference: 3rd Electromobility Challenging Issues, Armand Peugeot Chair, Singapore, 1–4 December 2015. [Google Scholar]
  26. Truong, L.T.; Nguyen, H.T.; De Gruyter, C. Mobile phone use among motorcyclists and electric bike riders: A case study of Hanoi, Vietnam. Accid. Anal. Prev. 2016, 91, 208–221. [Google Scholar] [CrossRef]
  27. Gitelman, V.; Korchatov, A.; Carmel, R. Safety-related behaviours of e-cyclists on urban streets: An observational study in Israel. Transp. Res. Procedia 2022, 60, 609–616. [Google Scholar] [CrossRef]
  28. Borowsky, A.; Shinar, D.; Oron-Gilad, T. Age, skill, and hazard perception in driving. Accid. Anal. Prev. 2010, 42, 1240–1249. [Google Scholar] [CrossRef] [PubMed]
  29. Meir, A.; Borowsky, A.; Oron-Gilad, T. Formation and evaluation of act and anticipate hazard perception training (AAHPT) intervention for young novice drivers. Traffic Inj. Prev. 2014, 15, 172–180. [Google Scholar] [CrossRef]
  30. Hill, R.; Lewis, V.; Dunbar, G. Young children’s concepts of danger. Br. J. Dev. Psychol. 2000, 18, 103–119. [Google Scholar] [CrossRef]
  31. Tabibi, Z.; Pfeffer, K. Choosing a safe place to cross the road: The relationship between attention and identification of safe and dangerous road-crossing sites. Child Care Health Dev. 2003, 29, 237–244. [Google Scholar] [CrossRef]
  32. Benda, H.V.; Hoyos, C.G. Estimating hazards in traffic situations. Accid. Anal. Prev. 1983, 15, 1–9. [Google Scholar] [CrossRef]
  33. Meir, A.; Oron-Gilad, T.; Parmet, Y. Are child-pedestrians able to identify hazardous traffic situations? Measuring their abilities in a virtual reality environment. Saf. Sci. 2015, 80, 33–40. [Google Scholar] [CrossRef]
  34. Foot, H.C.; Thomson, J.A.; Tolmie, A.K.; Whelan, K.M.; Morrison, S.; Sarvary, P. Children’s understanding of drivers’ intentions. Br. J. Dev. Psychol. 2006, 24, 681–700. [Google Scholar] [CrossRef]
  35. Horswill, M.S.; McKenna, F.P. Drivers’ hazard perception ability: Situation awareness on the road. In A Cognitive Approach to Situation Awareness; Banbury, S., Tremblay, S., Eds.; Ashgate: Aldershot, UK, 2004; pp. 155–175. [Google Scholar]
  36. Horswill, M.S.; Hill, A.; Silapurem, L.; Watson, M.O. A thousand years of crash experience in three hours: An online hazard perception training course for drivers. Accid. Anal. Prev. 2021, 152, 105969. [Google Scholar] [CrossRef]
  37. Crundall, D.; Crundall, E.; Clarke, D.; Shahar, A. Why do car drivers fail to give way to motorcycles at t-junctions? Accid. Anal. Prev. 2012, 44, 88–96. [Google Scholar] [CrossRef]
  38. Horswill, M.S. Hazard perception in driving. Curr. Dir. Psychol. Sci. 2016, 25, 425–430. [Google Scholar] [CrossRef]
  39. Vansteenkiste, P.; Zeuwts, L.; Cardon, G.; Lenoir, M. A hazard-perception test for cycling children: An exploratory study. Transp. Res. Part F Traffic Psychol. Behav. 2016, 41, 182–194. [Google Scholar] [CrossRef]
  40. Meir, A.; Parmet, Y.; Oron-Gilad, T. Towards understanding child-pedestrians’ hazard perception abilities in a mixed reality dynamic environment. Transp. Res. Part F Traffic Psychol. Behav. 2013, 20, 90–107. [Google Scholar] [CrossRef]
  41. Meir, A.; Oron-Gilad, T.; Parmet, Y. Can child-pedestrians’ hazard perception skills be enhanced? Accid. Anal. Prev. 2015, 83, 101–110. [Google Scholar] [CrossRef] [PubMed]
  42. Boufous, S.; Ivers, R.; Senserrick, T.; Stevenson, M. Attempts at the practical on-road driving test and the hazard perception test and the risk of traffic crashes in young drivers. Traffic Inj. Prev. 2011, 12, 475–482. [Google Scholar] [CrossRef]
  43. Horswill, M.S.; Hill, A.; Wetton, M. Can a video-based hazard perception test used for driver licensing predict crash involvement? Accid. Anal. Prev. 2015, 82, 213–219. [Google Scholar] [CrossRef]
  44. Wells, P.; Tong, S.; Sexton, B.; Grayson, G.; Jones, E. Cohort II: A Study of Learner and New Drivers; Volume 1—Main Report (No. 81). Road Safety Research Report; Department for Transport: London, UK, 2008.
  45. Malone, S.; Brünken, R. The role of ecological validity in hazard perception assessment. Transp. Res. Part F Traffic Psychol. Behav. 2016, 40, 91–103. [Google Scholar] [CrossRef]
  46. Crundall, D. Hazard prediction discriminates between novice and experienced drivers. Accid. Anal. Prev. 2016, 86, 47–58. [Google Scholar] [CrossRef]
  47. Crundall, D.; Andrews, B.; Van Loon, E.; Chapman, P. Commentary training improves responsiveness to hazards in a driving simulator. Accid. Anal. Prev. 2010, 42, 2117–2124. [Google Scholar] [CrossRef]
  48. Borowsky, A.; Oron-Gilad, T. Exploring the effects of driving experience on hazard awareness and risk perception via real-time hazard identification, hazard classification, and rating tasks. Accid. Anal. Prev. 2013, 59, 548–565. [Google Scholar] [CrossRef]
  49. Meir, A.; Dagan, B. Can young novice e-bike riders identify hazardous traffic situations? An exploratory study. Travel Behav. Soc. 2020, 21, 90–100. [Google Scholar] [CrossRef]
  50. Pradhan, A.K.; Fisher, D.L.; Pollatsek, A. Risk perception training for novice drivers: Evaluating duration of effects of training on a driving simulator. Transp. Res. Rec. 2006, 1969, 58–64. [Google Scholar] [CrossRef]
  51. Meir, A.; Oron-Gilad, T. Understanding complex traffic road scenes: The case of child-pedestrians’ hazard perception. J. Saf. Res. 2020, 72, 111–126. [Google Scholar] [CrossRef]
  52. Meir, A.; Hartmann, D.; Borowsky, A. Examining lifeguards’ abilities to anticipate surf hazard instigators—An exploratory study. Saf. Sci. 2021, 143, 105421. [Google Scholar] [CrossRef]
  53. Parmet, Y.; Meir, A.; Borowsky, A. What can a hazard function teach us about drivers’ perception of hazards? Traffic Inj. Prev. 2019, 20, 140–145. [Google Scholar] [CrossRef]
  54. Wallis, T.S.; Horswill, M.S. Using fuzzy signal detection theory to determine why experienced and trained drivers respond faster than novices in a hazard perception test. Accid. Anal. Prev. 2007, 39, 1177–1185. [Google Scholar] [CrossRef] [PubMed]
  55. Pollatsek, A.; Narayanaan, V.; Pradhan, A.; Fisher, D.L. Using eye movements to evaluate a PC-based risk awareness and perception training program on a driving simulator. Hum. Factors 2006, 48, 447–464. [Google Scholar] [CrossRef]
  56. Sexton, B. Development of hazard perception testing. In Proceedings of the DETR Novice Drivers Conference, Bristol, UK, June 2000. [Google Scholar]
  57. Wetton, M.A.; Hill, A.; Horswill, M.S. Are what happens next exercises and self-generated commentaries useful additions to hazard perception training for novice drivers? Accid. Anal. Prev. 2013, 54, 57–66. [Google Scholar] [CrossRef]
  58. Zeuwts, L.H.; Vansteenkiste, P.; Deconinck, F.J.; Cardon, G.; Lenoir, M. Hazard perception training in young bicyclists improves early detection of risk: A cluster-randomized controlled trial. Accid. Anal. Prev. 2017, 108, 112–121. [Google Scholar] [CrossRef]
  59. Ābele, L.; Haustein, S.; Møller, M.; Martinussen, L.M. Consistency between subjectively and objectively measured hazard perception skills among young male drivers. Accid. Anal. Prev. 2018, 118, 214–220. [Google Scholar] [CrossRef] [Green Version]
  60. Roberts, S.C.; Zhang, F.; Fisher, D.; Vaca, F.E. The effect of hazard awareness training on teen drivers of varying socioeconomic status. Traffic Inj. Prev. 2021, 22, 455–459. [Google Scholar] [CrossRef] [PubMed]
  61. Kovácsová, N.; Vlakveld, W.P.; de Winter, J.C.; Hagenzieker, M.P. PC-based hazard anticipation training for experienced cyclists: Design and evaluation. Saf. Sci. 2020, 123, 104561. [Google Scholar] [CrossRef]
  62. Mckenna, F.P.; Crick, J.L. Developments in Hazard Perception; Transport Research Laboratory: Crowthorne, UK, 1997. [Google Scholar]
  63. Lefarth, T.L.; Poos, H.P.A.M.; Juhra, C.; Wendt, K.W.; Pieske, O. Pedelec users get more severely injured compared to conventional cyclists. Der Unf. 2021, 124, 1000–1006. [Google Scholar]
  64. DiMaggio, C.J.; Bukur, M.; Wall, S.P.; Frangos, S.G.; Wen, A.Y. Injuries associated with electric-powered bikes and scooters: Analysis of US consumer product data. Inj. Prev. 2020, 26, 524–528. [Google Scholar] [CrossRef]
  65. Israel National Road Safety Authority. Registration and Licensing Offenses: Operation of Unregistered or Unlicensed Motorized Vehicles. Israel National Road Safety Authority. 2022. Available online: https://www.gov.il/BlobFolder/generalpage/ebike_license/he/news_20190704_legal_1.jpg (accessed on 4 June 2022).
  66. Beanland, V.; Hansen, L.J. Do cyclists make better drivers? Associations between cycling experience and change detection in road scenes. Accid. Anal. Prev. 2017, 106, 420–427. [Google Scholar] [CrossRef] [PubMed]
  67. Snellen, H. Letterproeven Tot Bepaling der Gezigtsscherpte; PW van der Weijer: Utrecht, The Netherlands, 1862. [Google Scholar]
  68. Bennett, A.G. Ophthalmic test types. Br. J. Physiol. Opt. 1965, 22, 238–271. [Google Scholar]
  69. Haliza, A.M.; Syah, M.M.M.; Norliza, M.F. Visual problems of new Malaysian drivers. Malays. Fam. Physician 2010, 5, 95. [Google Scholar]
  70. Larsen, K.; Gilliland, J.; Hess, P.; Tucker, P.; Irwin, J.; He, M. The influence of the physical environment and sociodemographic characteristics on children’s mode of travel to and from school. Am. J. Public Health 2009, 99, 520–526. [Google Scholar] [CrossRef]
  71. McMillan, T.; Day, K.; Boarnet, M.; Alfonzo, M.; Anderson, C. Johnny walks to school—does Jane? Sex differences in children’s active travel to school. Child. Youth Environ. 2006, 16, 75–89. [Google Scholar]
  72. Christie, N.; Ward, H.; Kimberlee, R.; Towner, E.; Sleney, J. Understanding high traffic injury risks for children in low socioeconomic areas: A qualitative study of parents’ views. Inj. Prev. 2007, 13, 394–397. [Google Scholar] [CrossRef]
  73. Zuckerman, M. Behavioral Expressions and Biosocial Bases of Sensation Seeking; Cambridge University Press: Cambridge, UK, 1994. [Google Scholar]
  74. Endsley, M.R. Measurement of situation awareness in dynamic systems. Hum. Factors 1995, 37, 65–84. [Google Scholar] [CrossRef]
  75. Wetton, M.A.; Hill, A.; Horswill, M.S. The development and validation of a hazard perception test for use in driver licensing. Accid. Anal. Prev. 2011, 43, 1759–1770. [Google Scholar] [CrossRef] [PubMed]
  76. Yeh, W.; Barsalou, L.W. The situated nature of concepts. Am. J. Psychol. 2006, 119, 349–384. [Google Scholar] [CrossRef]
  77. Barsalou, L.W. Grounded cognition. Annu. Rev. Psychol. 2008, 59, 617–645. [Google Scholar] [CrossRef] [Green Version]
  78. Mills, K.L.; Rolls, G.W.P.; Hall, R.D.; McDonald, M. The Effects of Hazard Perception Training on the Development of Novice Driver Skills; Road Safety Research Report No. 4; Department of the Environment, Transport the Regions: London, UK, 1998.
  79. Thomson, J.A.; Tolmie, A.K.; Foot, H.C.; Whelan, K.M.; Sarvary, P.; Morrison, S. Influence of virtual reality training on the roadside crossing judgments of child pedestrians. J. Exp. Psychol. Appl. 2005, 11, 175. [Google Scholar] [CrossRef] [PubMed]
  80. Novak, S. Virtual environment pedestrian training programs for children: A review of the literature. SURG J. 2009, 2, 28–33. [Google Scholar] [CrossRef]
  81. Hattie, J.; Timperley, H. The power of feedback. Rev. Educ. Res. 2007, 77, 81–112. [Google Scholar] [CrossRef]
  82. Noice, H.; Noice, T. Learning dialogue with and without movement. Mem. Cogn. 2001, 29, 820–827. [Google Scholar] [CrossRef]
  83. Dragutinovic, N.; Twisk, D. The Effectiveness of Road Safety Education: A Literature Review; SWOV Institute for Road Safety Research: Leidschendam, The Netherlands, 2006. [Google Scholar]
  84. Shachak, M. Bicycles, Electric Bicycles and Electric Scooters: Data on Accidents, Injuries, Regulations and Inspection; Center of Research and Information: The Knesset, Israel, 2018. [Google Scholar]
  85. Borowsky, A.; Oron-Gilad, T.; Meir, A.; Parmet, Y. Drivers’ perception of vulnerable road users: A hazard perception approach. Accid. Anal. Prev. 2012, 44, 160–166. [Google Scholar] [CrossRef]
  86. Borowsky, A.; Palacci, N.; Itzhaki, M.; Shinar, D. The assessment of hazard awareness skills among light rail drivers. Transp. Res. Part F Traffic Psychol. Behav. 2019, 67, 15–28. [Google Scholar] [CrossRef]
  87. Langford, B.C.; Chen, J.; Cherry, C.R. Risky riding: Naturalistic methods comparing safety behavior from conventional bicycle riders and electric bike riders. Accid. Anal. Prev. 2015, 82, 220–226. [Google Scholar] [CrossRef] [PubMed]
  88. Petzoldt, T.; Schleinitz, K.; Heilmann, S.; Gehlert, T. Traffic conflicts and their contextual factors when riding conventional vs. electric bicycles. Transp. Res. Part F Traffic Psychol. Behav. 2017, 46, 477–490. [Google Scholar] [CrossRef]
  89. Birenbaum, M. On the construct validity of the Sensation Seeking Scale in a non-English-speaking culture. Personal. Individ. Differ. 1986, 7, 431–434. [Google Scholar] [CrossRef]
  90. Zuckerman, M.; Kolin, E.A.; Price, L.; Zoob, I. Development of a sensation-seeking scale. J. Consult. Psychol. 1964, 28, 477. [Google Scholar] [CrossRef] [PubMed]
  91. Ahmadi, N.; Katrahmani, A.; Romoser, M.R. Short and long-term transfer of training in a tablet-based teen driver hazard perception training program. In Proceedings of the Human Factors and Ergonomics Society Annual Meeting, Philadelphia, PA, USA, 1–5 October 2018; SAGE Publications: Los Angeles, CA, USA, September 2018; Volume 62, pp. 1965–1969. [Google Scholar]
  92. McDonald, C.C.; Goodwin, A.H.; Pradhan, A.K.; Romoser, M.R.; Williams, A.F. A review of hazard anticipation training programs for young drivers. J. Adolesc. Health 2015, 57, S15–S23. [Google Scholar] [CrossRef]
  93. Fisher, D.L.; Laurie, N.E.; Glaser, R.; Connerney, K.; Pollatsek, A.; Duffy, S.A.; Brock, J. Use of a fixed-base driving simulator to evaluate the effects of experience and PC-based risk awareness training on drivers’ decisions. Hum. Factors 2002, 44, 287–302. [Google Scholar] [CrossRef]
  94. Haworth, N.; Symmons, M.; Kowaldo, N. Road Safety Issues for People from Non-English Speaking Backgrounds (No. 176); Monash University Accident Research Centre: Clayton, VI, Australia, 2000. [Google Scholar]
  95. Sagberg, F.; Bjørnskau, T. Hazard perception and driving experience among novice drivers. Accid. Anal. Prev. 2006, 38, 407–414. [Google Scholar] [CrossRef]
  96. McGowan, A.M.; Banbury, S. Evaluating interruption-based techniques using embedded measures of driver anticipation. In A Cognitive Approach to Situation Awareness; Routledge: London, UK, 2004; pp. 176–192. [Google Scholar]
  97. Holm, S. A simple sequentially rejective multiple test procedure. Scand. J. Stat. 1979, 6, 65–70. [Google Scholar]
  98. Cherry, C.R.; MacArthur, J. Are E-bikes Unsafe? A review of European and North American Studies. In Proceedings of the 6th Annual International Cycling Safety Conference, Davis, CA, USA, 21–22 September 2017. [Google Scholar]
  99. Elias, W.; Gitelman, V. Youngsters’ Opinions and Attitudes toward the Use of Electric Bicycles in Israel. Sustainability 2018, 10, 4352. [Google Scholar] [CrossRef]
  100. Li, R.; Krishna Sinniah, G.; Li, X. The Factors Influencing Resident’s Intentions on E-Bike Sharing Usage in China. Sustainability 2022, 14, 5013. [Google Scholar] [CrossRef]
  101. Cao, S.; Samuel, S.; Murzello, Y.; Ding, W.; Zhang, X.; Niu, J. Hazard Perception in Driving: A Systematic Literature Review. Transp. Res. Rec. 2022. [Google Scholar] [CrossRef]
  102. Meyer, S.; Sagberg, F.; Torquato, R. Traffic hazard perception among children. Transp. Res. Part F Traffic Psychol. Behav. 2014, 26, 190–198. [Google Scholar] [CrossRef]
Figure 1. An example of matching training and test movies, displaying parked vehicles in a similar, urban traffic environment. The training movie (left) displays a materialized hazardous situation in which a parked vehicle’s door opens, while the test movie (right) displays a potential hazardous situation of riding in close proximity to parked vehicles, where a car door can swing open at any time.
Sustainability 14 10869 g001
Figure 2. The training interventions used in the present experiment. AAT trainees were (1) read the experimental instructions, (2) presented with the theoretical–verbal component, (3) performed a hazard detection task (i.e., identified hazards situations and described them) for each of the 30 videos, and (4) received feedback after each video. PCT trainees were (1) read the experimental instructions, (2) presented with the theoretical–verbal component, (3) performed a ‘what might happen next?’ task (i.e., predicted what may happen next, then were shown what actually happened when the video resumed) for each of the first 15 videos, (4) received feedback after each of the 15 videos, and (5) watched the additional 15 videos along with expert commentary describing the hazard instigators depicted in the movie.
Sustainability 14 10869 g002
Figure 3. Response sensitivity—interaction between participant group and hazard type. The bar columns represent the estimated marginal means of responses.
Sustainability 14 10869 g003
Figure 4. Verbal descriptions—interaction between participant group and hazard type. The bar columns represent the estimated marginal means of responses.
Sustainability 14 10869 g004
Table 1. A summary of the participants’ response sensitivity results.
SourceFEstimated Means (SE)Pairwise Comparisons
Participant group10.34 ***AAT = 0.76 (0.04)
PCT = 0.62 (0.05)
C = 0.41 (0.06)
C < PCT (Padj < 0.05)
C < AAT (Padj < 0.001)
PCT < AAT (Padj < 0.05)
Hazard type204.99 ***Materialized = 0.83 (0.02)
Ummaterialized = 0.33 (0.03)
Unmaterialized < Materialized (Padj < 0.001)
Participant group * Hazard type1.30Materialized:
AAT = 0.92 (0.03)
PCT = 0.81 (0.04)
C = 0.69 (0.06)
Materialized:
C < AAT (Padj < 0.001)
Unmaterialized:
AAT = 0.47 (0.06)
PCT = 0.39 (0.06)
C = 0.18 (0.04)
Unmaterialized:
C < AAT (Padj < 0.001)
C < PCT (Padj < 0.01)
PCT = AAT (N.S.)
Note that AAT, PCT, and C represent ‘Act and Anticipate Training’ intervention, ‘Predictive and Commentary Training’ intervention, and ‘Control’ group members, respectively. Additionally, *** denotes a significance level of 1%, and * denotes a significance level of 10%.
Table 2. Summary of the participants’ verbal description results.
SourceFEstimated Means (SE)Pairwise Comparisons
Participant group6.34 **AAT = 15.55 (1.40)
PCT = 12.61 (1.35)
C = 8.68 (1.34)
C < AAT (Padj < 0.01)
C = PCT (N.S.)
Hazard type16.45 ***Materialized = 14.09 (0.94)
Ummaterialized = 10.47 (0.87)
Unmaterialized < Materialized (Padj < 0.001)
Participant group * Hazard type4.61 *Materialized:
AAT = 15.98 (1.66)
PCT = 14.04 (1.60)
C = 12.24 (1.63)
Materialized:
N.S.
Unmaterialized:
AAT = 15.11 (1.63)
PCT = 11.18 (1.50)
C = 5.12 (1.36)
Unmaterialized:
C < AAT (Padj < 0.001)
C < PCT (Padj < 0.01)
PCT = AAT (N.S.)
Note that the AAT, PCT, and C represent ‘Act and Anticipate Training’ intervention, ‘Predictive and Commentary Training’ intervention, and ‘Control’ group members, respectively. Additionally, *** denotes a significance level of 1%, ** denotes a significance level of 5%, and * denotes a significance level of 10%.
Publisher’s Note: MDPI stays neutral with regard to jurisdictional claims in published maps and institutional affiliations.

