Article

Numerical Simulation to Determine the Largest Confining Stress in Longitudinal Tests of Cable Bolts

1
Laboratory of Deep Coal Resource Key Mining, Ministry of Education, School of Mines, China University of Mining and Technology, Xuzhou 221116, China
2
Coal Mine of Jingyuan Coal Power Co., Ltd., Baiyin 730699, China
*
Author to whom correspondence should be addressed.
Sustainability 2022, 14(17), 10871; https://doi.org/10.3390/su141710871
Submission received: 30 July 2022 / Revised: 23 August 2022 / Accepted: 25 August 2022 / Published: 31 August 2022

Abstract

:
Bolt support is an economic method of roadway support. However, due to the influence of mining disturbance, the stress of roadway-surrounding rock changes, thus resulting in varying degrees of confining pressure in the radial direction of bolt. In this manuscript, a numerical solution was proposed to determine the largest confining stress in longitudinal tests of cable tendons. FLAC3D was selected to simulate the longitudinal process of cable tendons. The structural pile element was selected to simulate the cable tendon. The loading behavior of the cable was controlled by the cohesive and the frictional behavior of the cable/grout surface. To confirm the credibility of this numerical solution, the loading behavior of a normal cable and an improved cable was simulated. Experimental longitudinal tests were selected to validate the numerical results, showing that there was a satisfactory agreement between numerical and experimental results. The loading behavior of normal cables and improved cables was numerically simulated. Under the same test conditions, when the improved cable was used, the confining medium can generate much higher confining stress compared with normal cable tendons. Consequently, higher confining stress can result in a larger loading capacity of cable tendons.

1. Introduction

Fully bonded cable tendons were originally introduced into mining engineering around 1963. Initially, the fully bonded cable is simply made by twisting seven steel wires into a strand and bonded in the borehole, as shown in Figure 1. In-situ tests reported that using the cable reinforcement method can effectively increase the stability of underground chambers in the mine site [1]. Then, it saw a rapid development of cable usage in mining activities. This seven-wire cable is termed as the normal cable tendon.
In the 1990s, a new cable design was developed. By unwinding the normal cable at regular intervals to form a suite of nodes and antinodes along the cable, the birdcaged cable was fabricated. From then on, many different cable tendons were developed, such as bulbed cable tendons, nutcaged cable tendons, swaged cable tendons, and epoxy-coated cable tendons [3]. These cable tendons have much better performance compared with the standard seven-wire cable tendons and are therefore named as improved cable tendons.
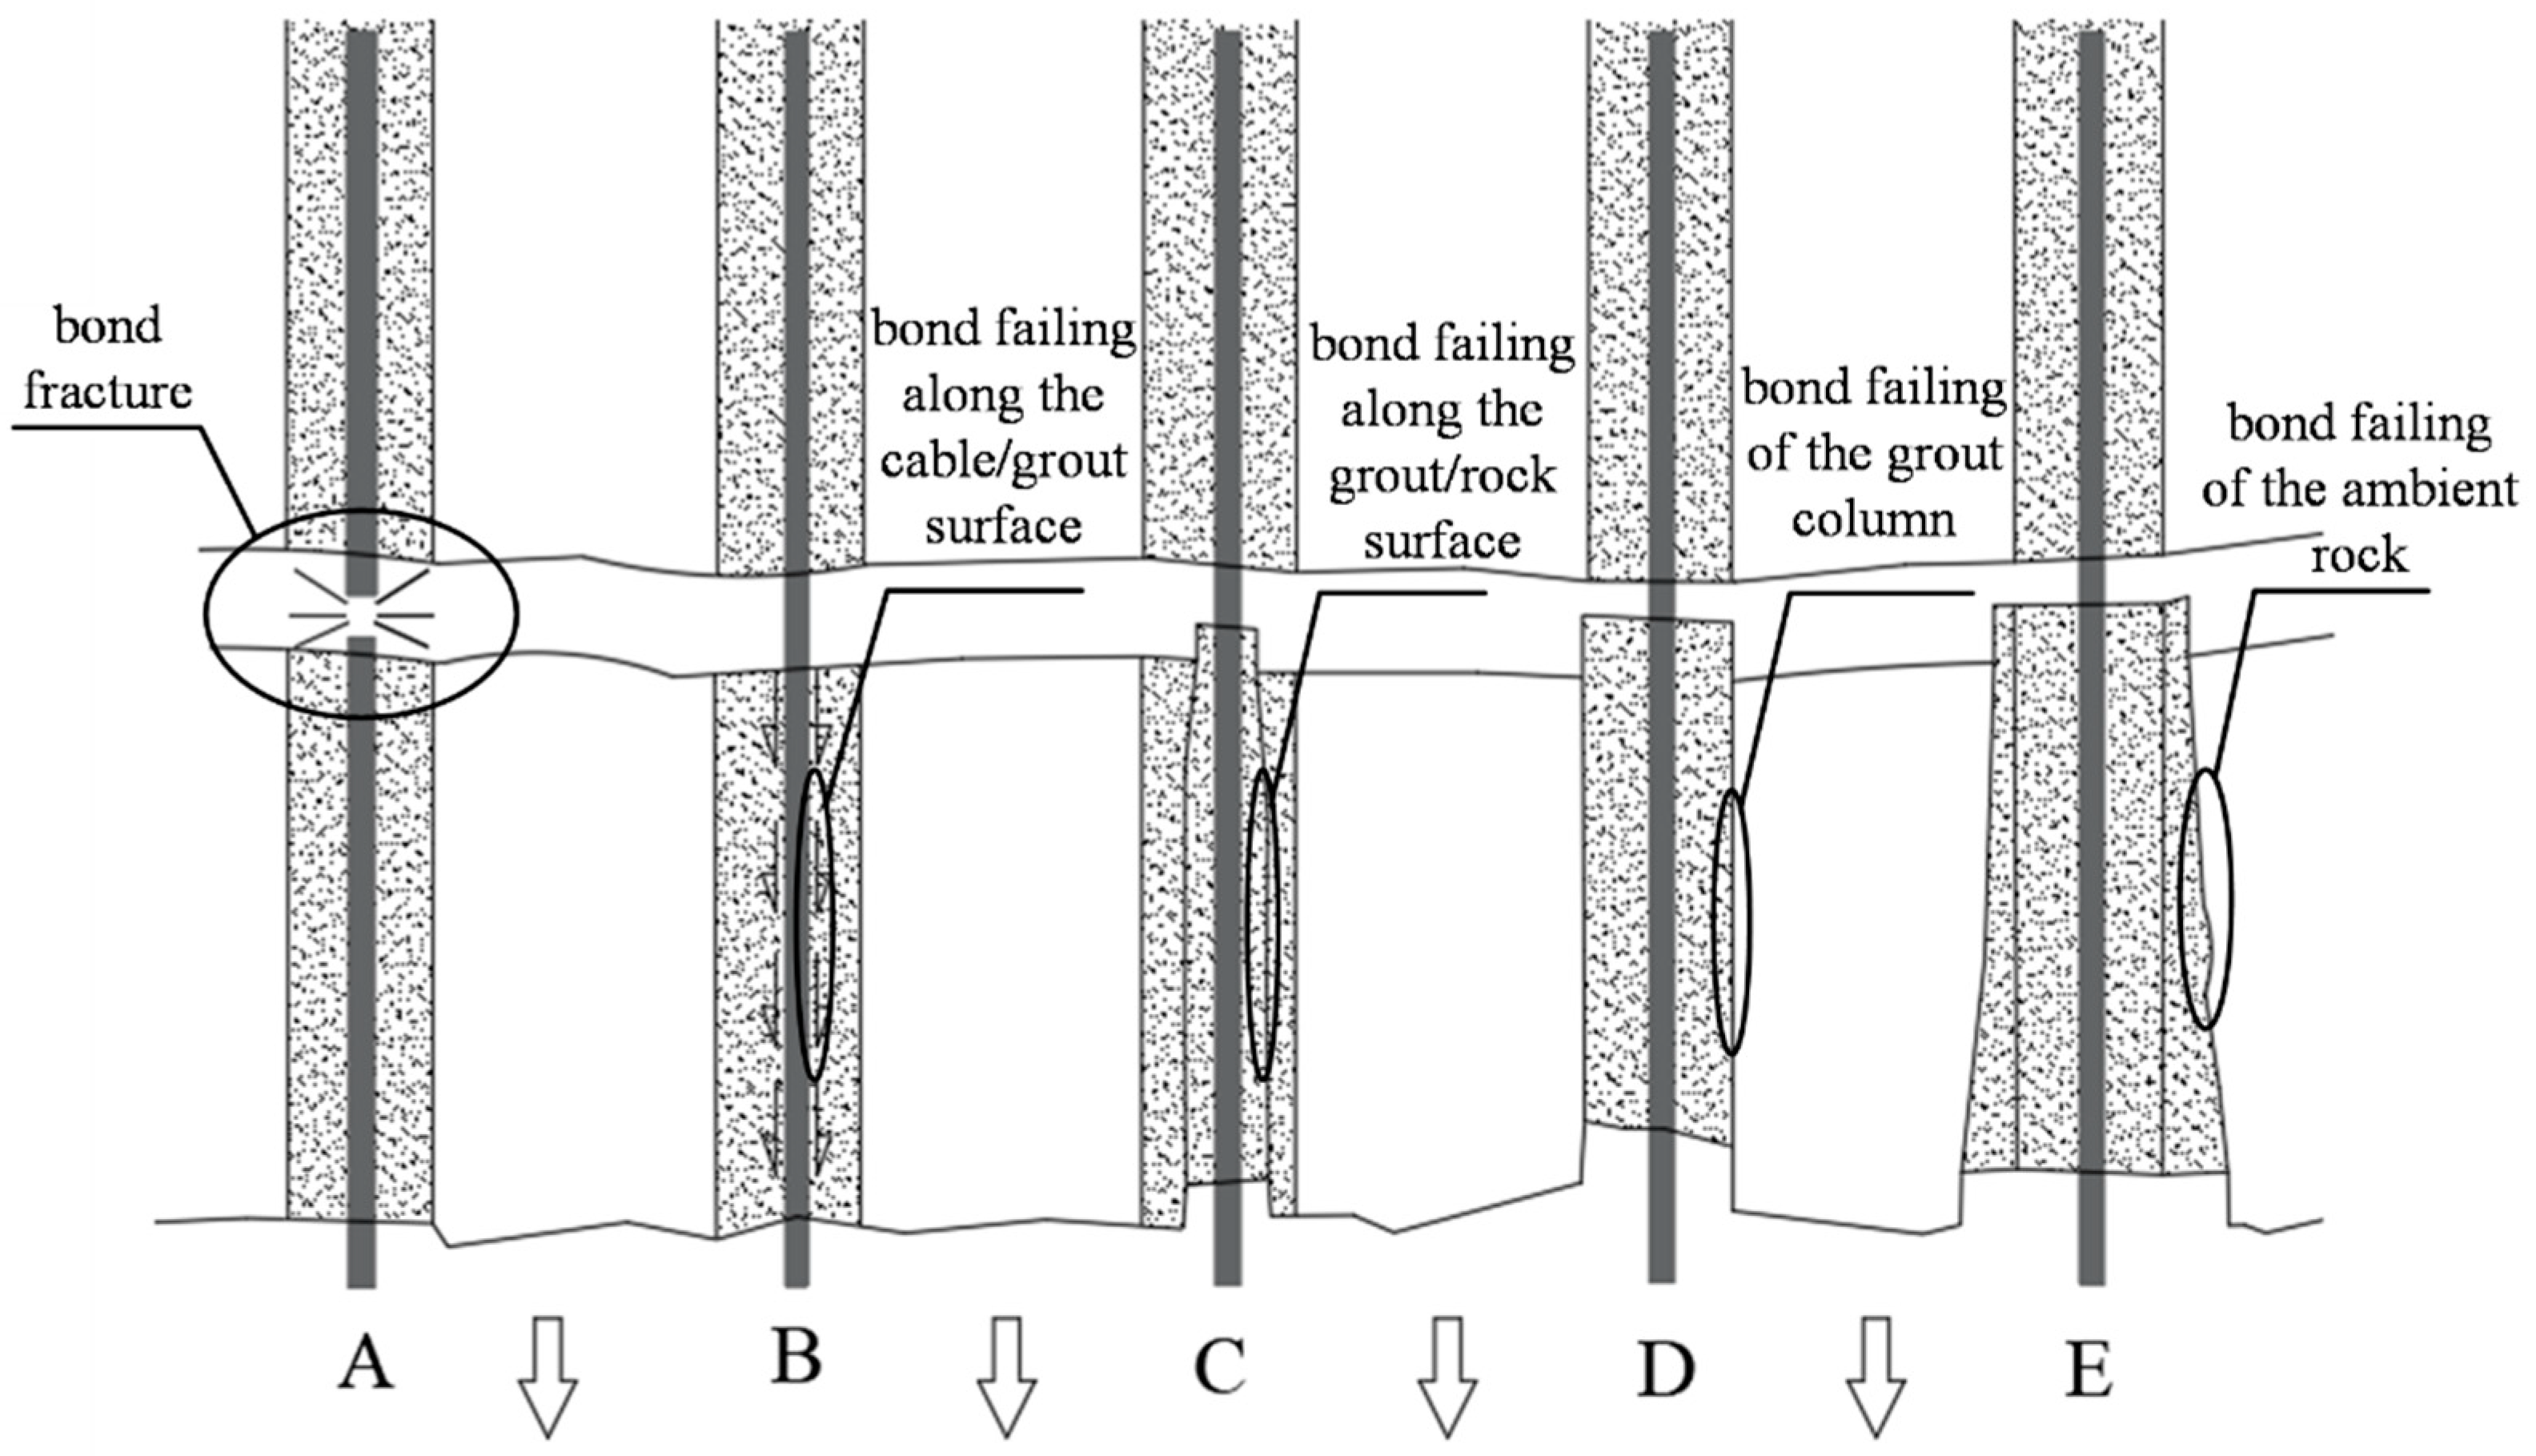
Although cable tendons have been applied in mining for more than fifty years, failure of the cable system still occurs [4]. It is summarised that there are basically five different failure modes, namely, bond fracture, bond failing along the cable/grout (c/g) surface, bond failing along the grout/rock (g/r) surface, failing of the grout column, and failing of the ambient rock. Moreover, Hutchinson and Diederichs [2] mentioned that cable rupture can also occur in field applications when the dead weight of the reinforced rock mass is larger than the tensile capacity of the steel, as shown in Figure 2. Nevertheless, many indoor and field tests have demonstrated that bond failing of the c/g surface is the main failing type [5].
To understand the bond failing behavior of cable tendons, it is more common to pull a bonded cable tendon from a pipe in the indoor environment [6]. For example, Fuller and Cox [7] selected longitudinal tests on a normal cable tendon. A mild steel pipe was selected to confine the bonded cable tendon. The test results showed that the embedment length significantly affected the largest loading capacity of cable tendons. Thenevin et al. [8] conducted pull-out tests on steel rebars, smooth steel bars, fiberglass-reinforced polymer-threaded bolts, flexible cable bolts, IR5/IN special cable bolts, and Mini-cage cable bolts. This paper provides an extensive database of laboratory pull-out test results and confirms the influence of the confining pressure and the embedment length on the pull-out response (rock bolts and cable bolts). Sakhno et al. [9] conducted longitudinal tests on roof bolts to analyse the parameters of a new method to fasten roof bolts with the help of non-adhesive mixtures extending while hardening along with the development of high expansion pressures. The testing results were applied to obtain regressive dependences of bolt fastening efforts in terms of different ratios between roof bolt diameter, borehole diameter, and encapsulation depth. By means of numerical simulation, Krykovskyi et al. [10] analyze changes in shape and dimensions of a rock mass area, fortified with the help of a polymer, depending upon the density of injection rock bolts, as well as the value of initial permeability of enclosing rocks to substantiate optimum process solutions to support roofs within the unstable rocks and protect mine workings against water inflow and gas emission. Goris [11] used the same longitudinal test method to evaluate the influence of water/cement (w/c) percentage on the performance of cable tendons. It was revealed that decreasing the w/c percentage can effectively benefit the loading capacity of cable tendons. Hyett and Bawden [12] installed a bulbed cable in a steel pipe and conducted longitudinal tests. The test results showed that the bulbed geometry can apparently increase the loading capacity. Furthermore, it was recommended that the diameter of the bulbed geometry should be restricted to 25 mm. Satola [13] conducted longitudinal tests on the standard seven-wire cable tendons and found that adding debonding materials, such as silicone and oil, can decrease the bonding quality of the c/g surface and therefore reduce the loading performance of cable tendons. Thus, in field application, to increase the bonding capacity of cable tendons, the surface of cable tendons should be kept clean. Mosse-Robinson and Sharrock [14] conducted longitudinal tests on bulbed cable tendons installed in steel pipes to analyse the effect of drilled hole size on the loading performance of cable tendons. Test results showed that the drilled hole size had marginal effect on the loading capacity of cable tendons. Tadolini et al. [15] installed bonded PC-strand cables in steel pipes and conducted longitudinal tests. It was found that the indentation geometry along the wires can influence the mechanical interlocking of the c/g surface and therefore adding indentations along the wire can significantly increase the loading capacity of cable tendons. These indoor longitudinal tests helped scientists and engineers to better understand the loading behavior of cable tendons. In addition, they are beneficial for the cable manufacturers to optimize the design of cable tendons.
However, a serious issue in those testing was that the largest confining stress during the longitudinal process was unknown. Specifically, when a cable is pulled from a metal pipe, the c/g surface dilates [16]. Since the metal pipe creates a constant normal stiffness (CNS) boundary condition, the pipe then applies a passive confinement on the c/g surface, which can be determined with Equation (1):
P = k Δ r
where, P = confinement generated by the pipe; k = radial stiffness of the pipe; Δr = dilation of the c/g surface.
Hyett et al. [17] demonstrated that the confinement applied by the metal pipe has a marked effect on the loading performance of cable tendons. Therefore, it is necessary to explicitly know the largest confining stress in longitudinal tests of cable tendons.
To solve this problem, Aoki et al. [18] proposed using strain gauges to measure the confining stress in longitudinal tests. Specifically, strain gauges were attached on the surface of the steel pipe and then the cement-based grout was selected to bond the cable tendon with the steel pipe. After the longitudinal test, the confining stress generated by the steel pipe can be calculated with Equation (2):
p = t r σ r
where, p = the confining stress generated by the steel pipe; t = the thickness of the pipe; r = the radius of the internal face of the pipe; σr = stress along the radial direction, which can be calculated from the strain gauge.
However, an issue of this method is that the strain gauge attached on the cable surface can be easily destroyed during the longitudinal process. Furthermore, installing strain gauges on the cable requires much time and labour work [19].
The purpose of this paper is to determine the largest confining stress in longitudinal tests of cable tendons through the method of numerical simulation. First, the structural pile element in the numerical code FLAC3D was introduced. Then, an indoor longitudinal test with a normal cable tendon was selected to validate this approach. After that, an indoor longitudinal test with an improved cable was also selected to validate this numerical solution.

2. Materials and Methods

2.1. Materials

In this study, two different cable tendons were used. One was the plain cable tendon and the other was the improved cable tendon. The reason to use those two different cable tendons was that this study followed the previous research work conducted by Aoki, Maeno, Shibata, and Obara [18]. In their study, the plain cable tendon and the improved cable tendon were used. The tested cable tendon had a diameter of 15.2 mm.

2.2. Methods

2.2.1. Theoretical Background

In this study, the numerical software of FLAC3D was used. The FLAC3D is a three-dimensional numerical program that has been widely used in rock engineering [20,21]. In FLAC3D, a structural element named pile can be selected to simulate the loading process of rock tendons, such as rock bolts, cable tendons, and tiebacks [22]. As a result, in this manuscript, the pile element was adopted to simulate the cable tendon.
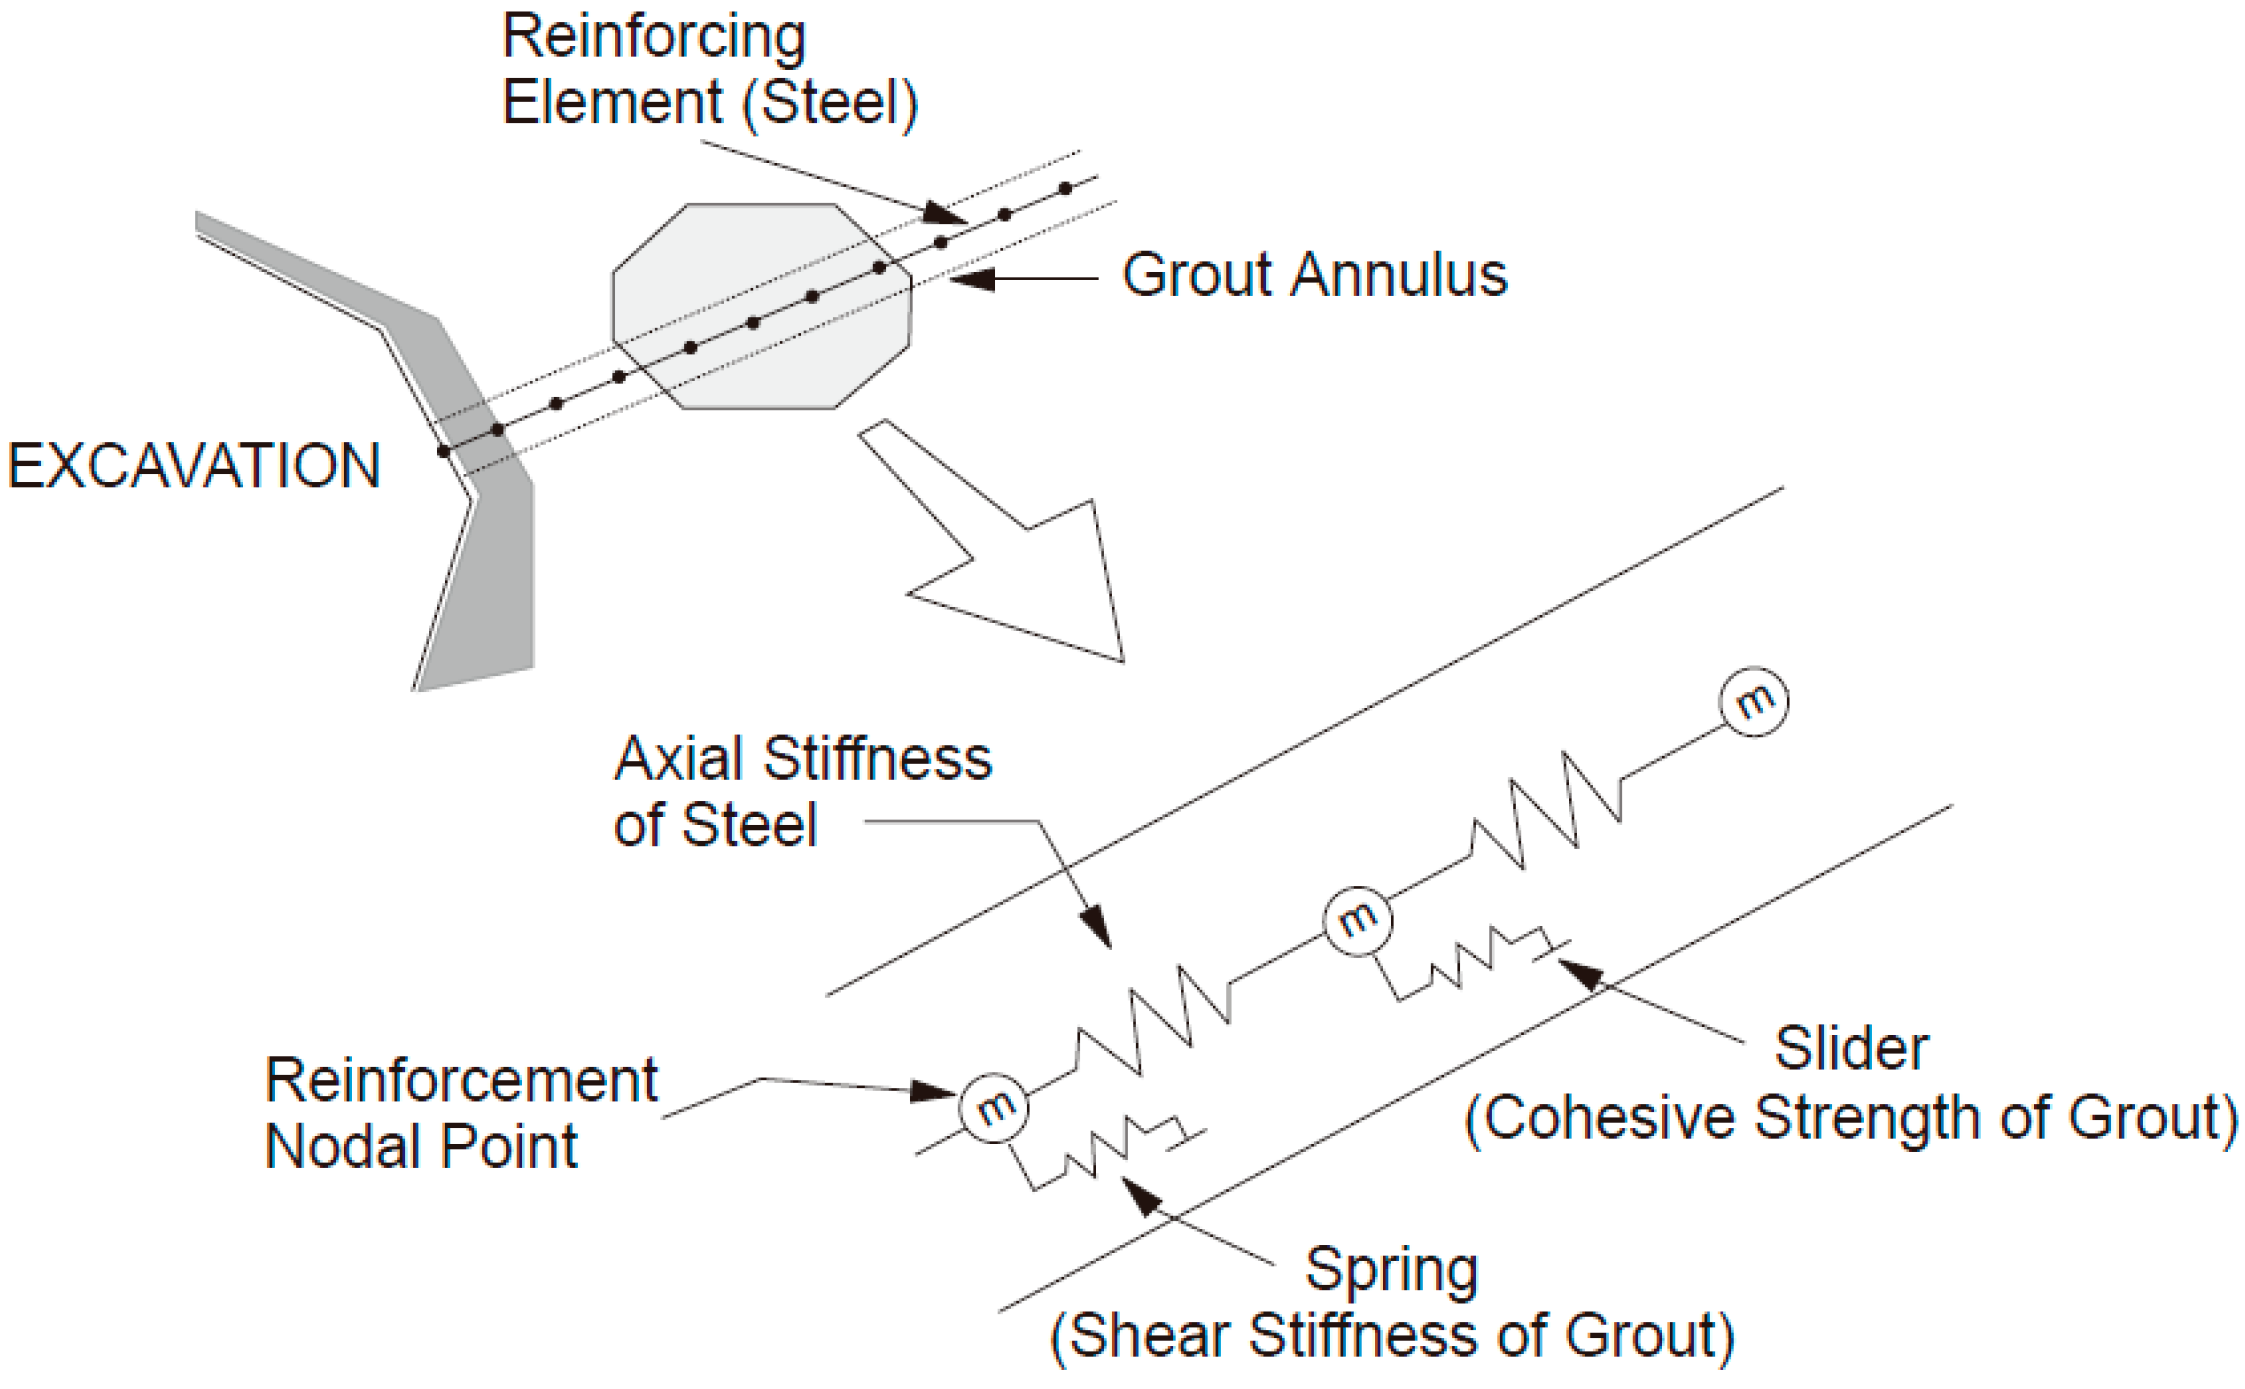
As mentioned above, in cable reinforcement, bond failing of the c/g surface is the major failing type [23]. To simulate the c/g surface, a spring-slider system is used in FLAC3D, as shown in Figure 3. Specifically, in the spring-slider system, the slider is selected to represent the cohesive behavior of the c/g surface and the spring is selected to simulate the shear stiffness of the grout material [24,25].
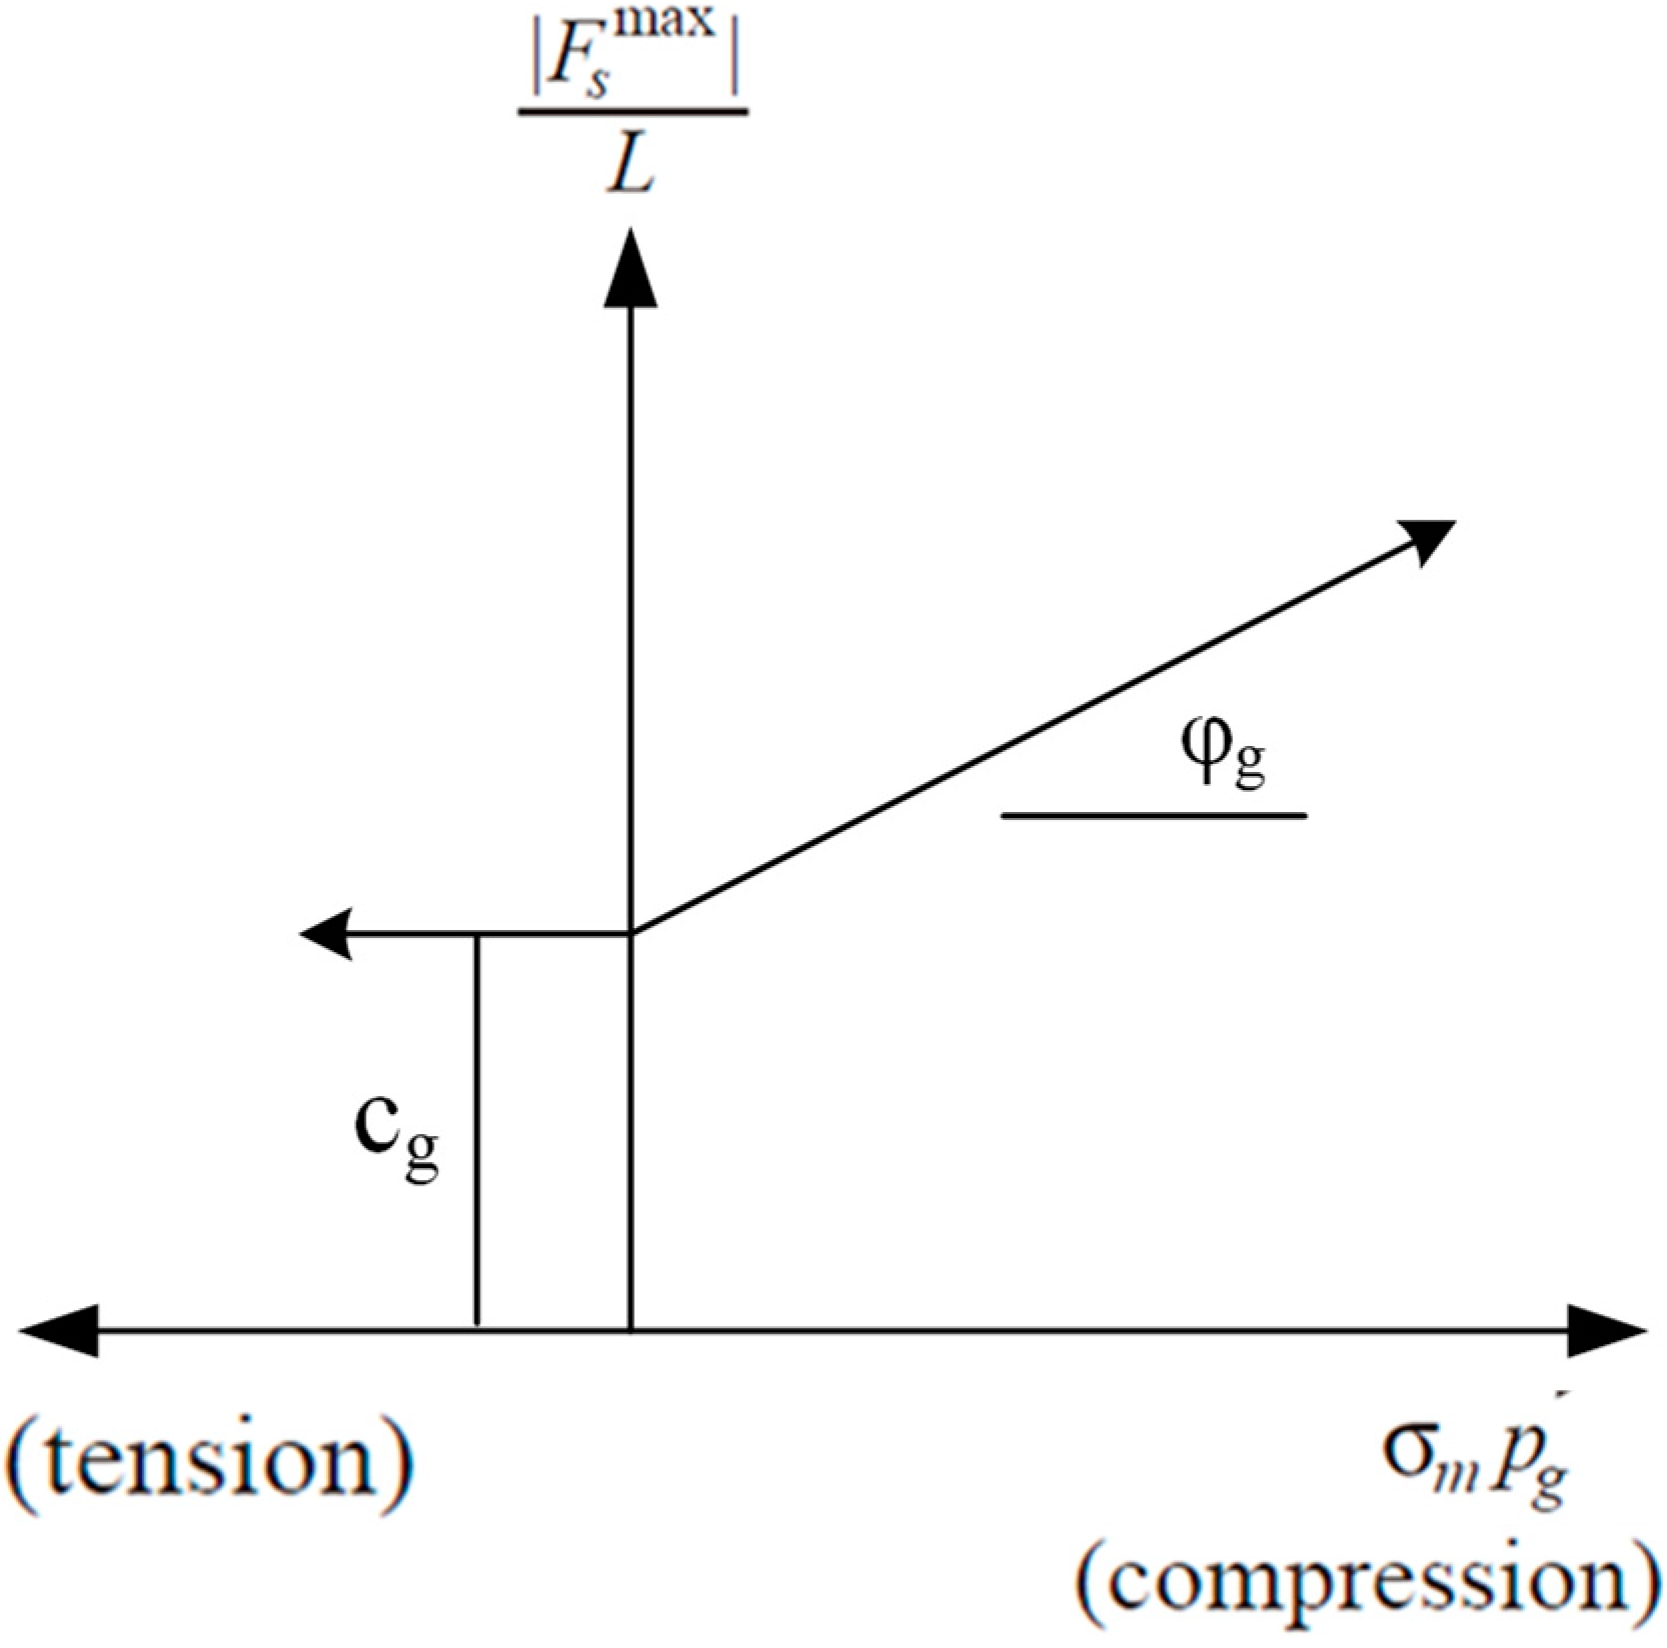
The largest coupling strength of the c/g surface is determined by the interfacial cohesion and friction, as depicted in Figure 4.
Equation (3) can be selected to calculate the largest shear strength of the c/g surface [22]:
F max L = S + σ p tan φ
where, Fmax = the largest shearing strength of the c/g surface; L = the bonded length of the cable tendon; S = cohesive force of the c/g surface with one-metre length; σ = confining stress generated by the surrounding confining medium; p = perimeter of the cable; φ = friction angle of the c/g surface.
The cohesive force of the c/g surface can be calculated once the cohesive strength of the grout is acquired. In fact, tri-axial tests and direct shear tests can be selected to measure the cohesion of the grout. However, Moosavi and Bawden [26] indicated that the direct shear test is more appropriate to get the cohesion of the grout for cable reinforcement scenarios. This is because in rock reinforcement, failing always occurred along the c/g surface, which can be regarded as a pre-defined surface. In direct shear testing, shear failure also occurred along a pre-determined plane, which is more consistent with the c/g surface shear failure behavior. As a result, in this study, the grout cohesive strength measured with the direct shear test was used.
Assuming that the grout cohesion is c, the cohesive force of the c/g surface can be calculated with Equation (4):
S = c Q p
where, c = cohesive strength of the grout measured from the direct shear test; Q = bond quality between the cable and grout.
Substituting Equation (4) into (3), the following equation can be acquired:
σ = 1 tan φ ( F max p L c Q )
Equation (5) indicates that the confining stress applied by the surrounding medium can be acquired once the cohesion and friction angle of the grout were acquired. Then, two indoor cable longitudinal tests were simulated to ensure the effectiveness of this numerical solution.

2.2.2. Numerical Pulling Test on a Normal Cable Tendon

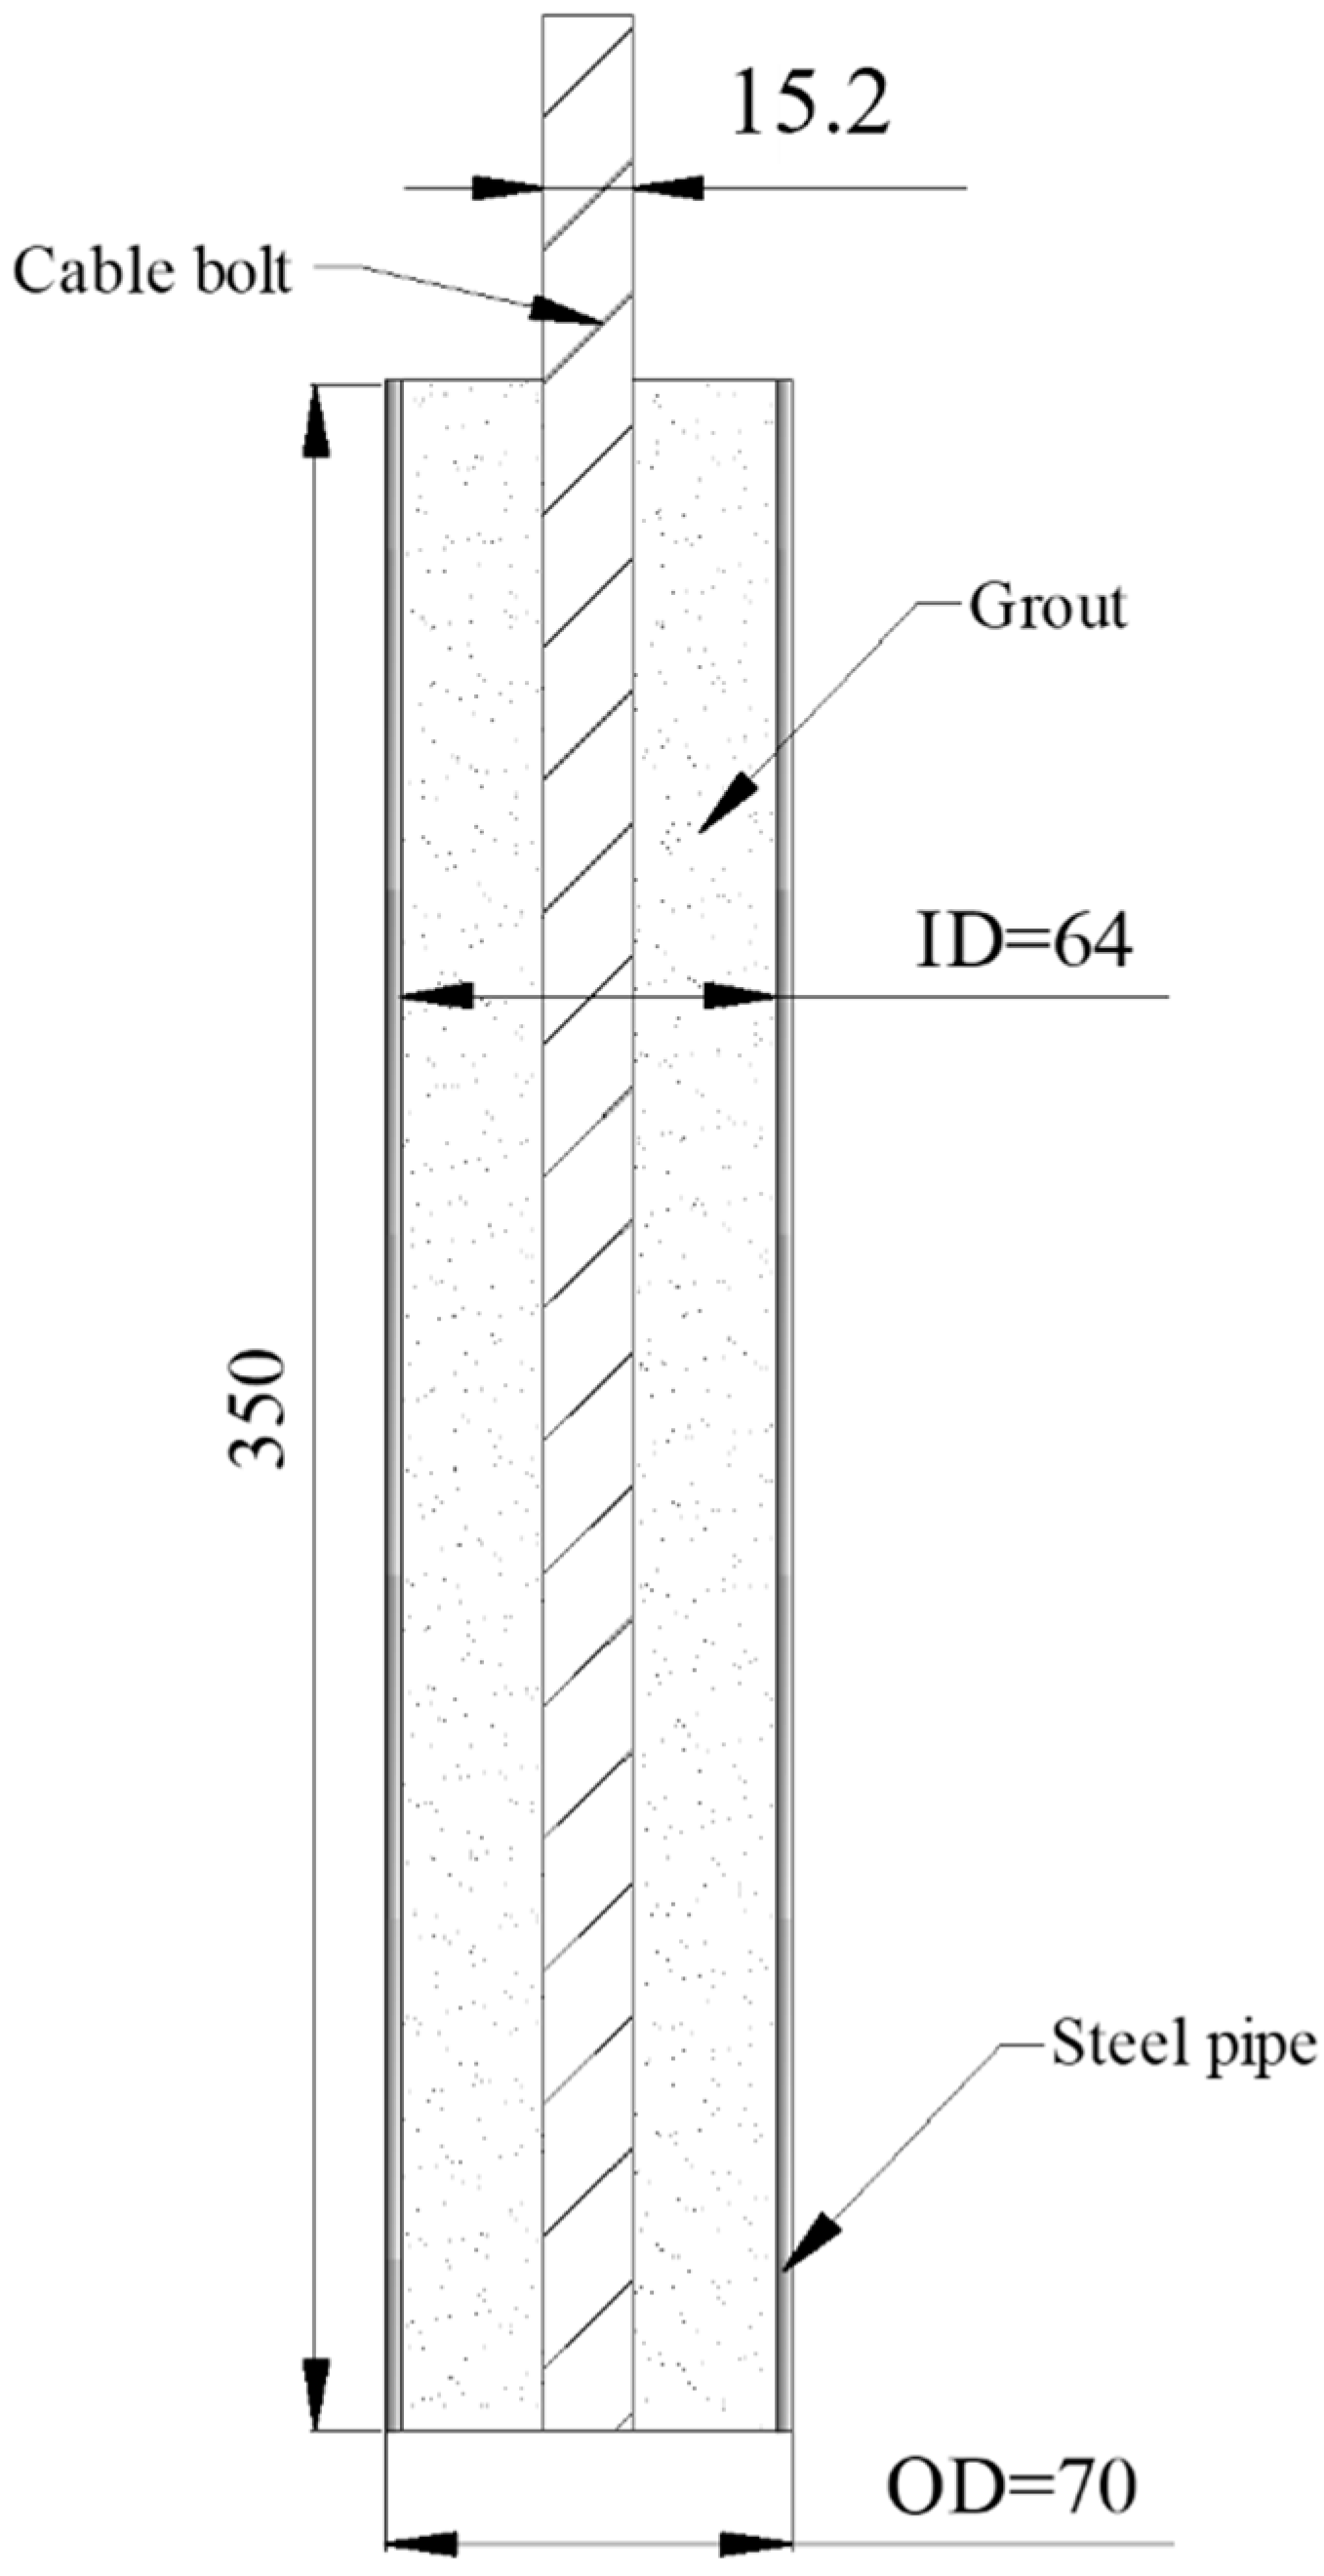
Aoki, Maeno, Shibata, and Obara [18] conducted longitudinal tests on normal cable tendons. The cable tendon has a bonded length of 350 mm and was embedded in a steel pipe. The internal diameter (ID) of the steel pipe is 64 mm and the outside diameter (OD) of the steel pipe is 70 mm. The modulus and Poisson’s ratio of the steel pipe are 190 GPa and 0.3. A cement-based mortar with an unconfined strength of 52 MPa was selected to bond the cable tendon and the pipe. The modulus and Poisson’s ratio of the grout are 10.8 GPa and 0.26. A cutting diagram of the test is depicted in Figure 5.
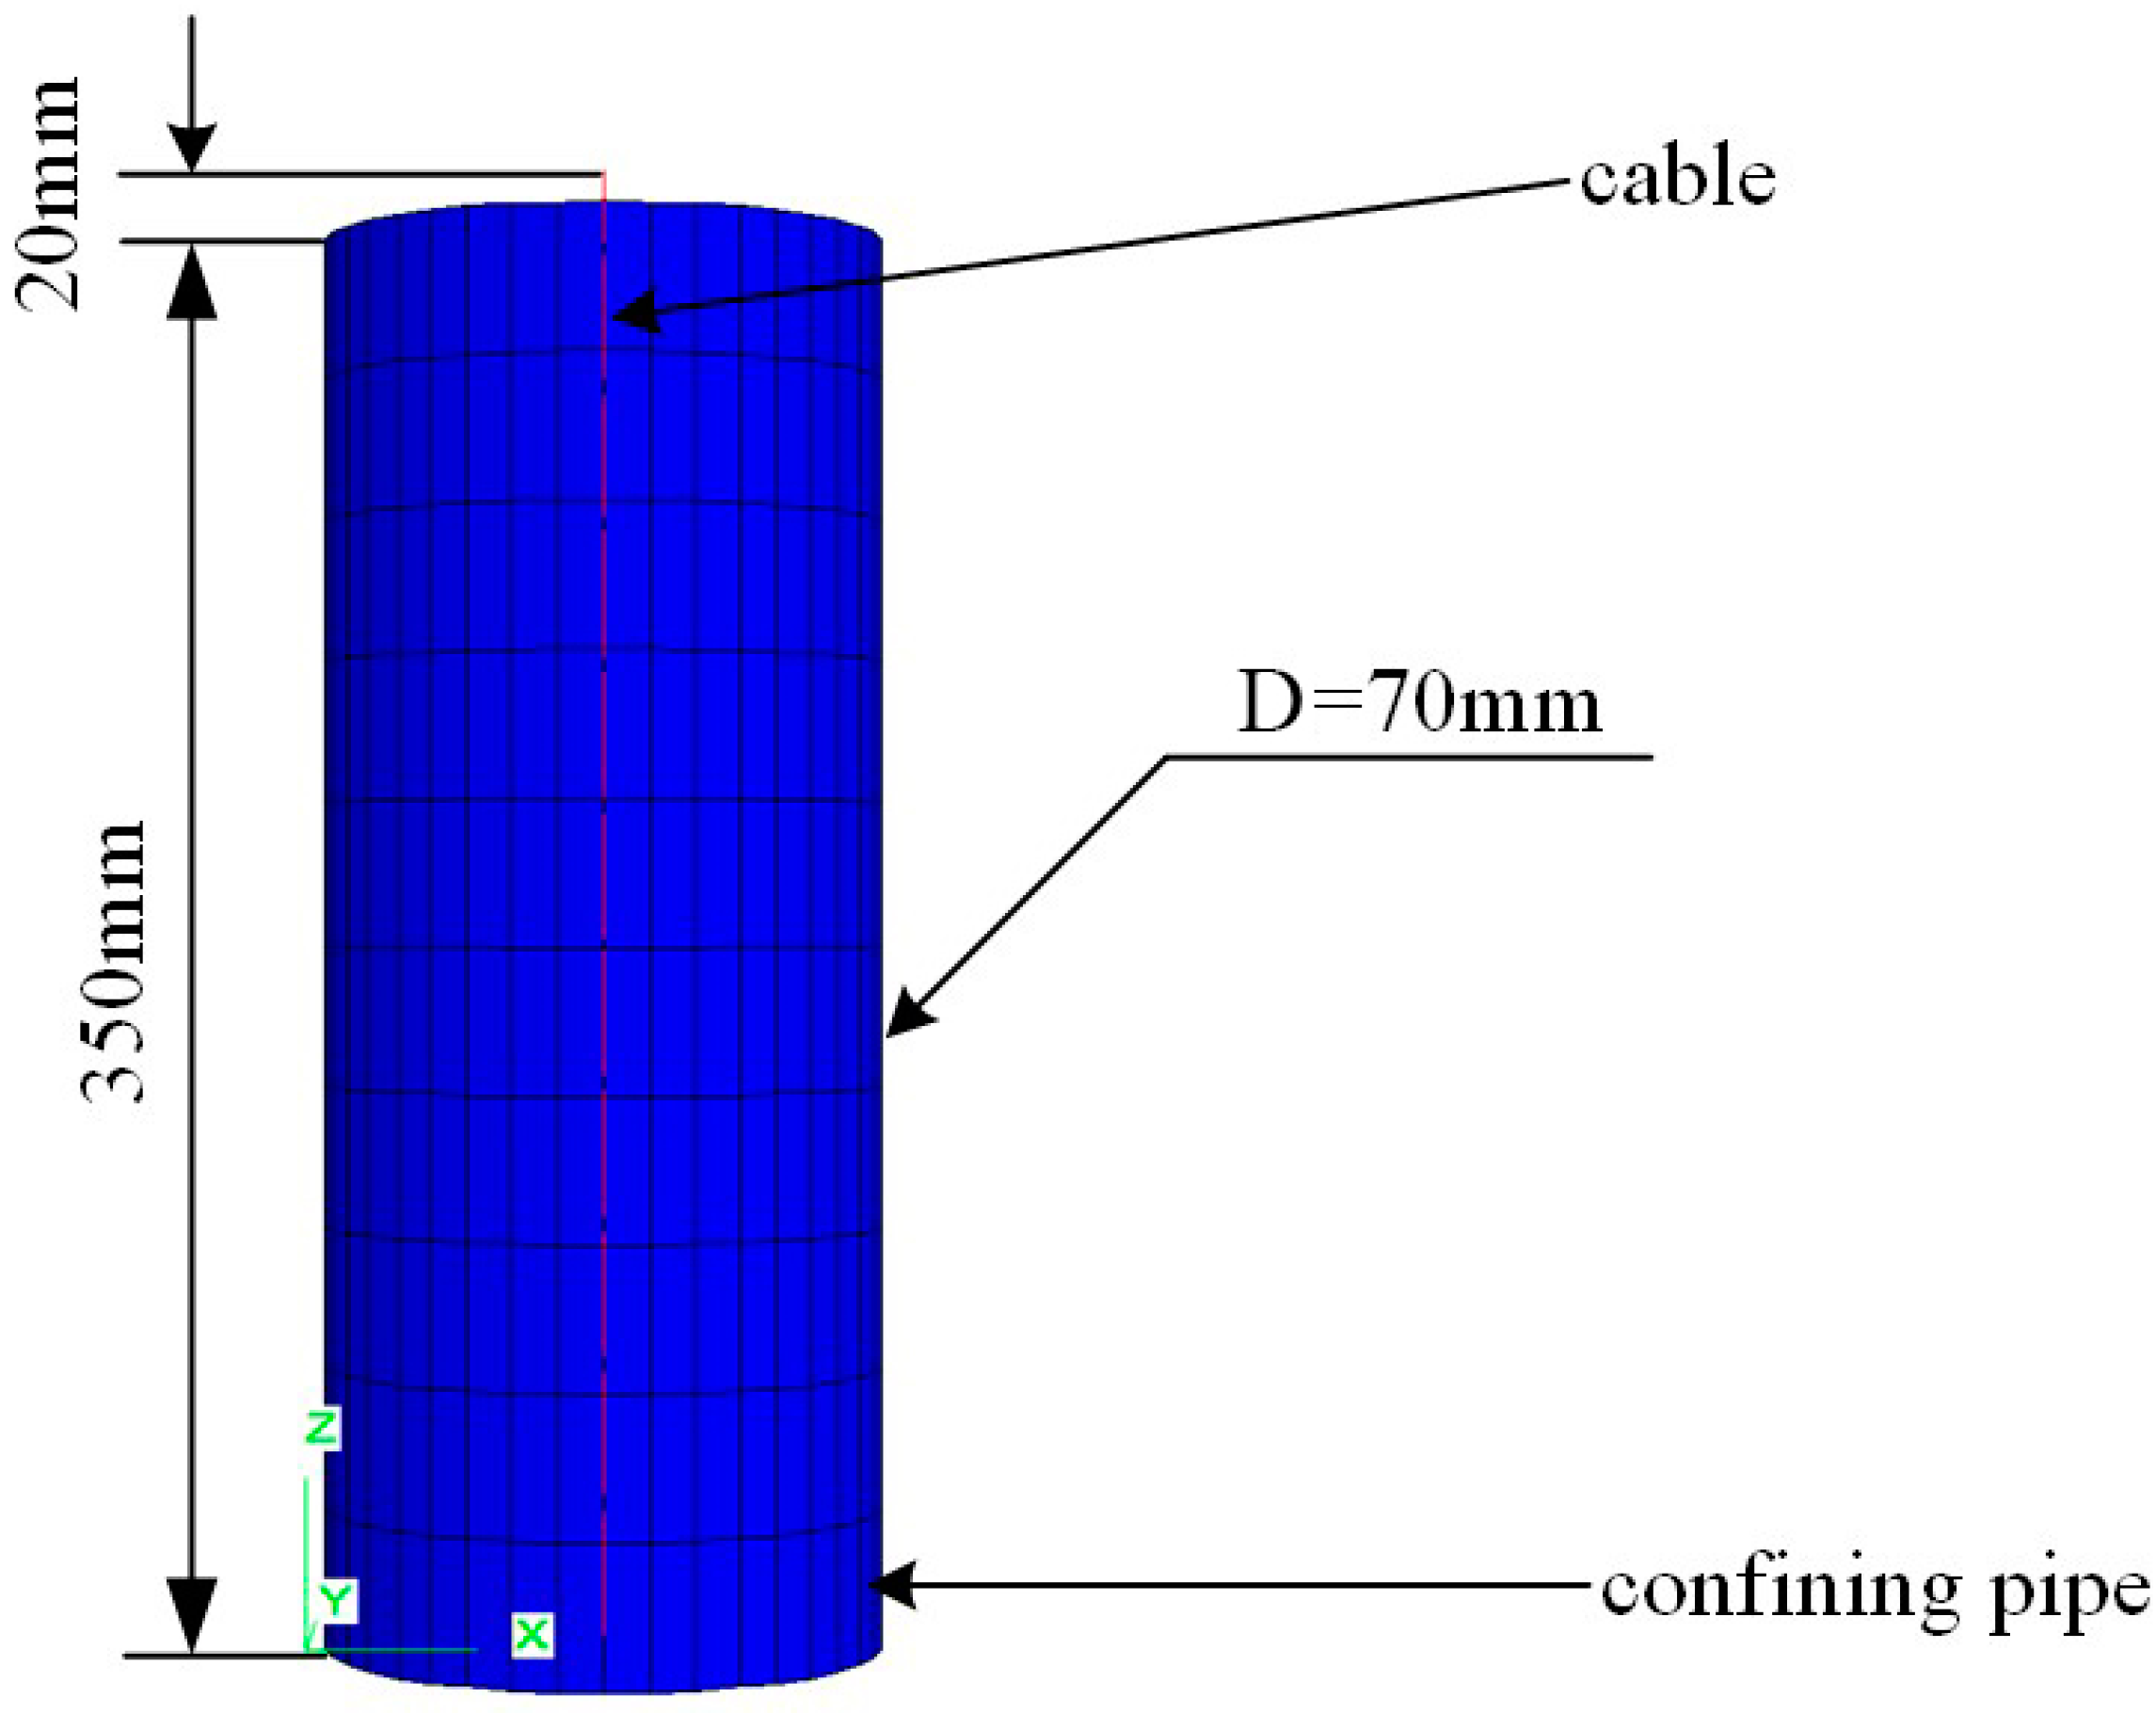
This longitudinal process was simulated in FLAC3D. Specifically, a cylindrical mesh was created to simulate the confining pipe. The OD of the cylindrical mesh was 70 mm, being consistent with the steel pipe dimension. A pile element which was selected to simulate the cable was installed in the center of the mesh. The total length of the pile was 370 mm in which the embedment length was 350 mm and the free length was 20 mm, as shown in Figure 6.
An elastic model was selected to simulate the steel pipe because the steel pipe remained intact during the whole longitudinal process. An elastic-perfectly plastic model was selected to simulate the cable and the yielding force was set to a large value of 520 kN. This is because the cable remained elastic in the whole longitudinal test process and failing only occurred along the c/g surface.
As for the grout column, the most important thing is to get the cohesion and friction angle of the grout material. Previous research indicated that when the UCS of the cement grout is around 54 MPa, the cohesion and friction angle are 12.4 MPa and 42.3°. In this study, the grout had a UCS of 52 MPa, which is consistent with the performance of the grout tested in previous research. Therefore, a cohesive strength and friction angle of 12.4 MPa and 42.3 were used in this simulation.
Hutchinson and Diederichs [2] mentioned that the adhesion of the carbon steel and cement grout with the w/c percentage varying between 0.35 and 0.5 can be ranged from 1 MPa to 3 MPa. Considering that a traditional normal cable was tested, and the grout had a low strength, a bonding quality of 0.17 was selected to indicate the bonding performance between the cable tendon and the grout column. Therefore, the cohesive strength of the c/g surface can be calculated as: 0.17 × 12.4 = 2.1 MPa. The results showed that the calculated cohesive strength of the c/g surface is in the range of 1–3 MPa, which is consistent with the conclusion given by Hutchinson and Diederichs [2]. The input factors for the cable, the steel pile, and the grout column are tabulated in Table 1.
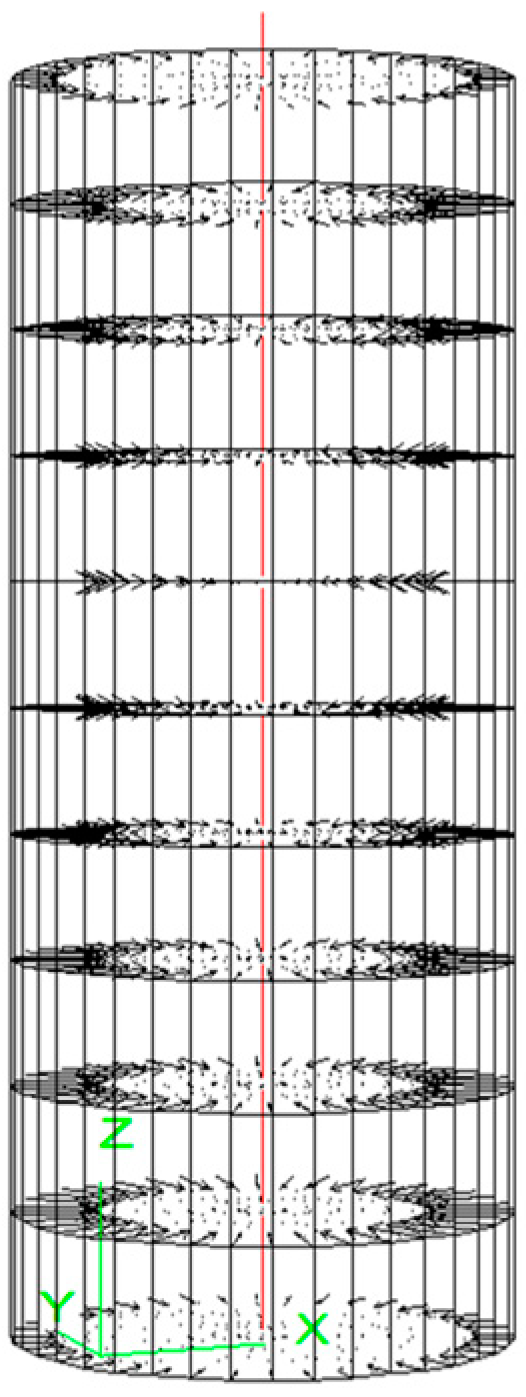
During the simulation, the top boundary of the mesh was fixed to the model so that the sample top boundary was restricted by the bearing plate during the indoor test. A Fish function was written to record the longitudinal load. As for the longitudinal displacement, the axial movement of the loading end of the structural pile was monitored. During the numerical longitudinal process, a confining stress was applied on the outside surface of the mesh to model the confining stress generated by the steel pipe in the indoor environment, as shown in Figure 7.
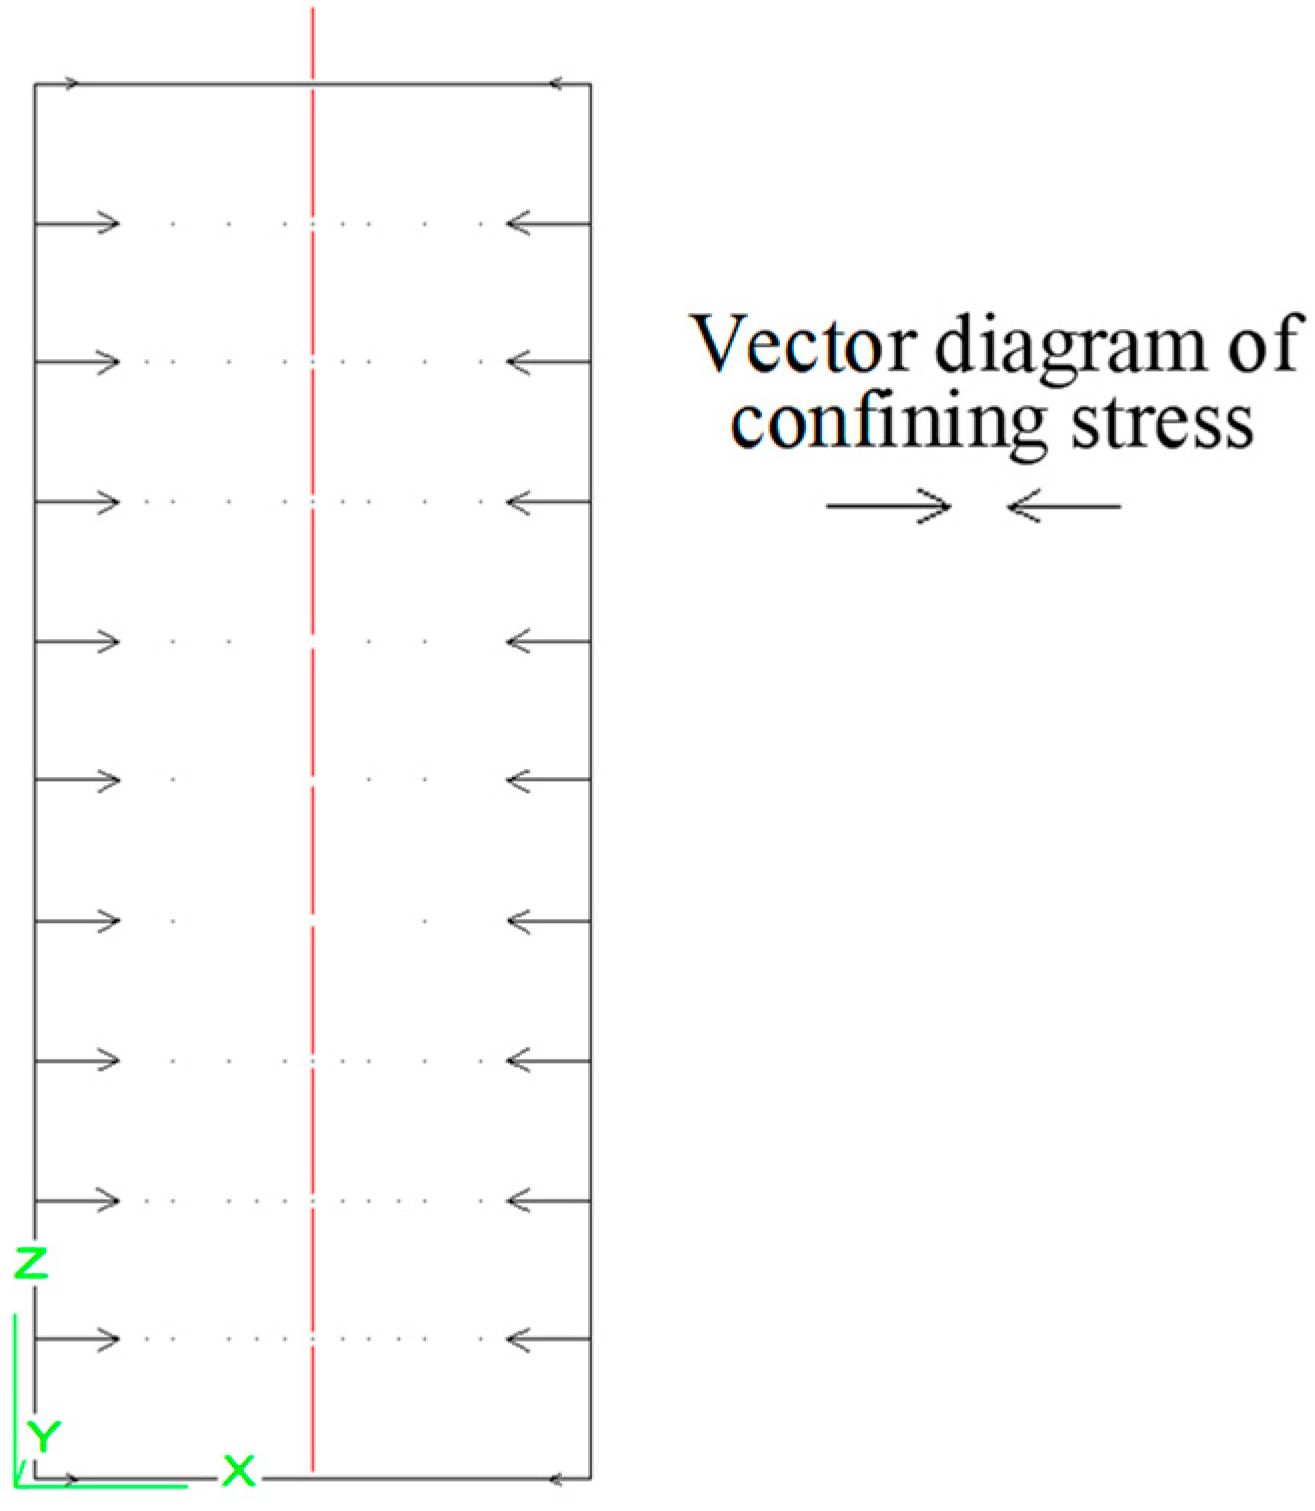
To clearly show the confining stress applied on the outside surface of the mesh, a vertical plane was selected to cut the mesh. The boundary of the mesh and the applied confining stress were shown on the plane, as shown in Figure 8.

2.2.3. Numerical Pulling Test on an Improved Cable Tendon

Then, another numerical pulling test was conducted on an improved cable tendon. The pulling process followed the procedures mentioned by Aoki, Maeno, Shibata, and Obara [18].
The structural pile element was selected to simulate the improved cable tendon. Specifically, a higher bond quality of 0.35 was used because the improved cable had better bonding behavior with the grout column because of the special improved surface geometry. Consequently, the cohesion of the surface between the improved cable tendon and the grout column was 0.35 × 12.4 = 4.3 MPa. The input factors for the improved cable, the steel pipe, and the grout column are summarised in Table 2.

3. Results and Discussion

3.1. Pulling Test Results of the Normal Cable Tendon

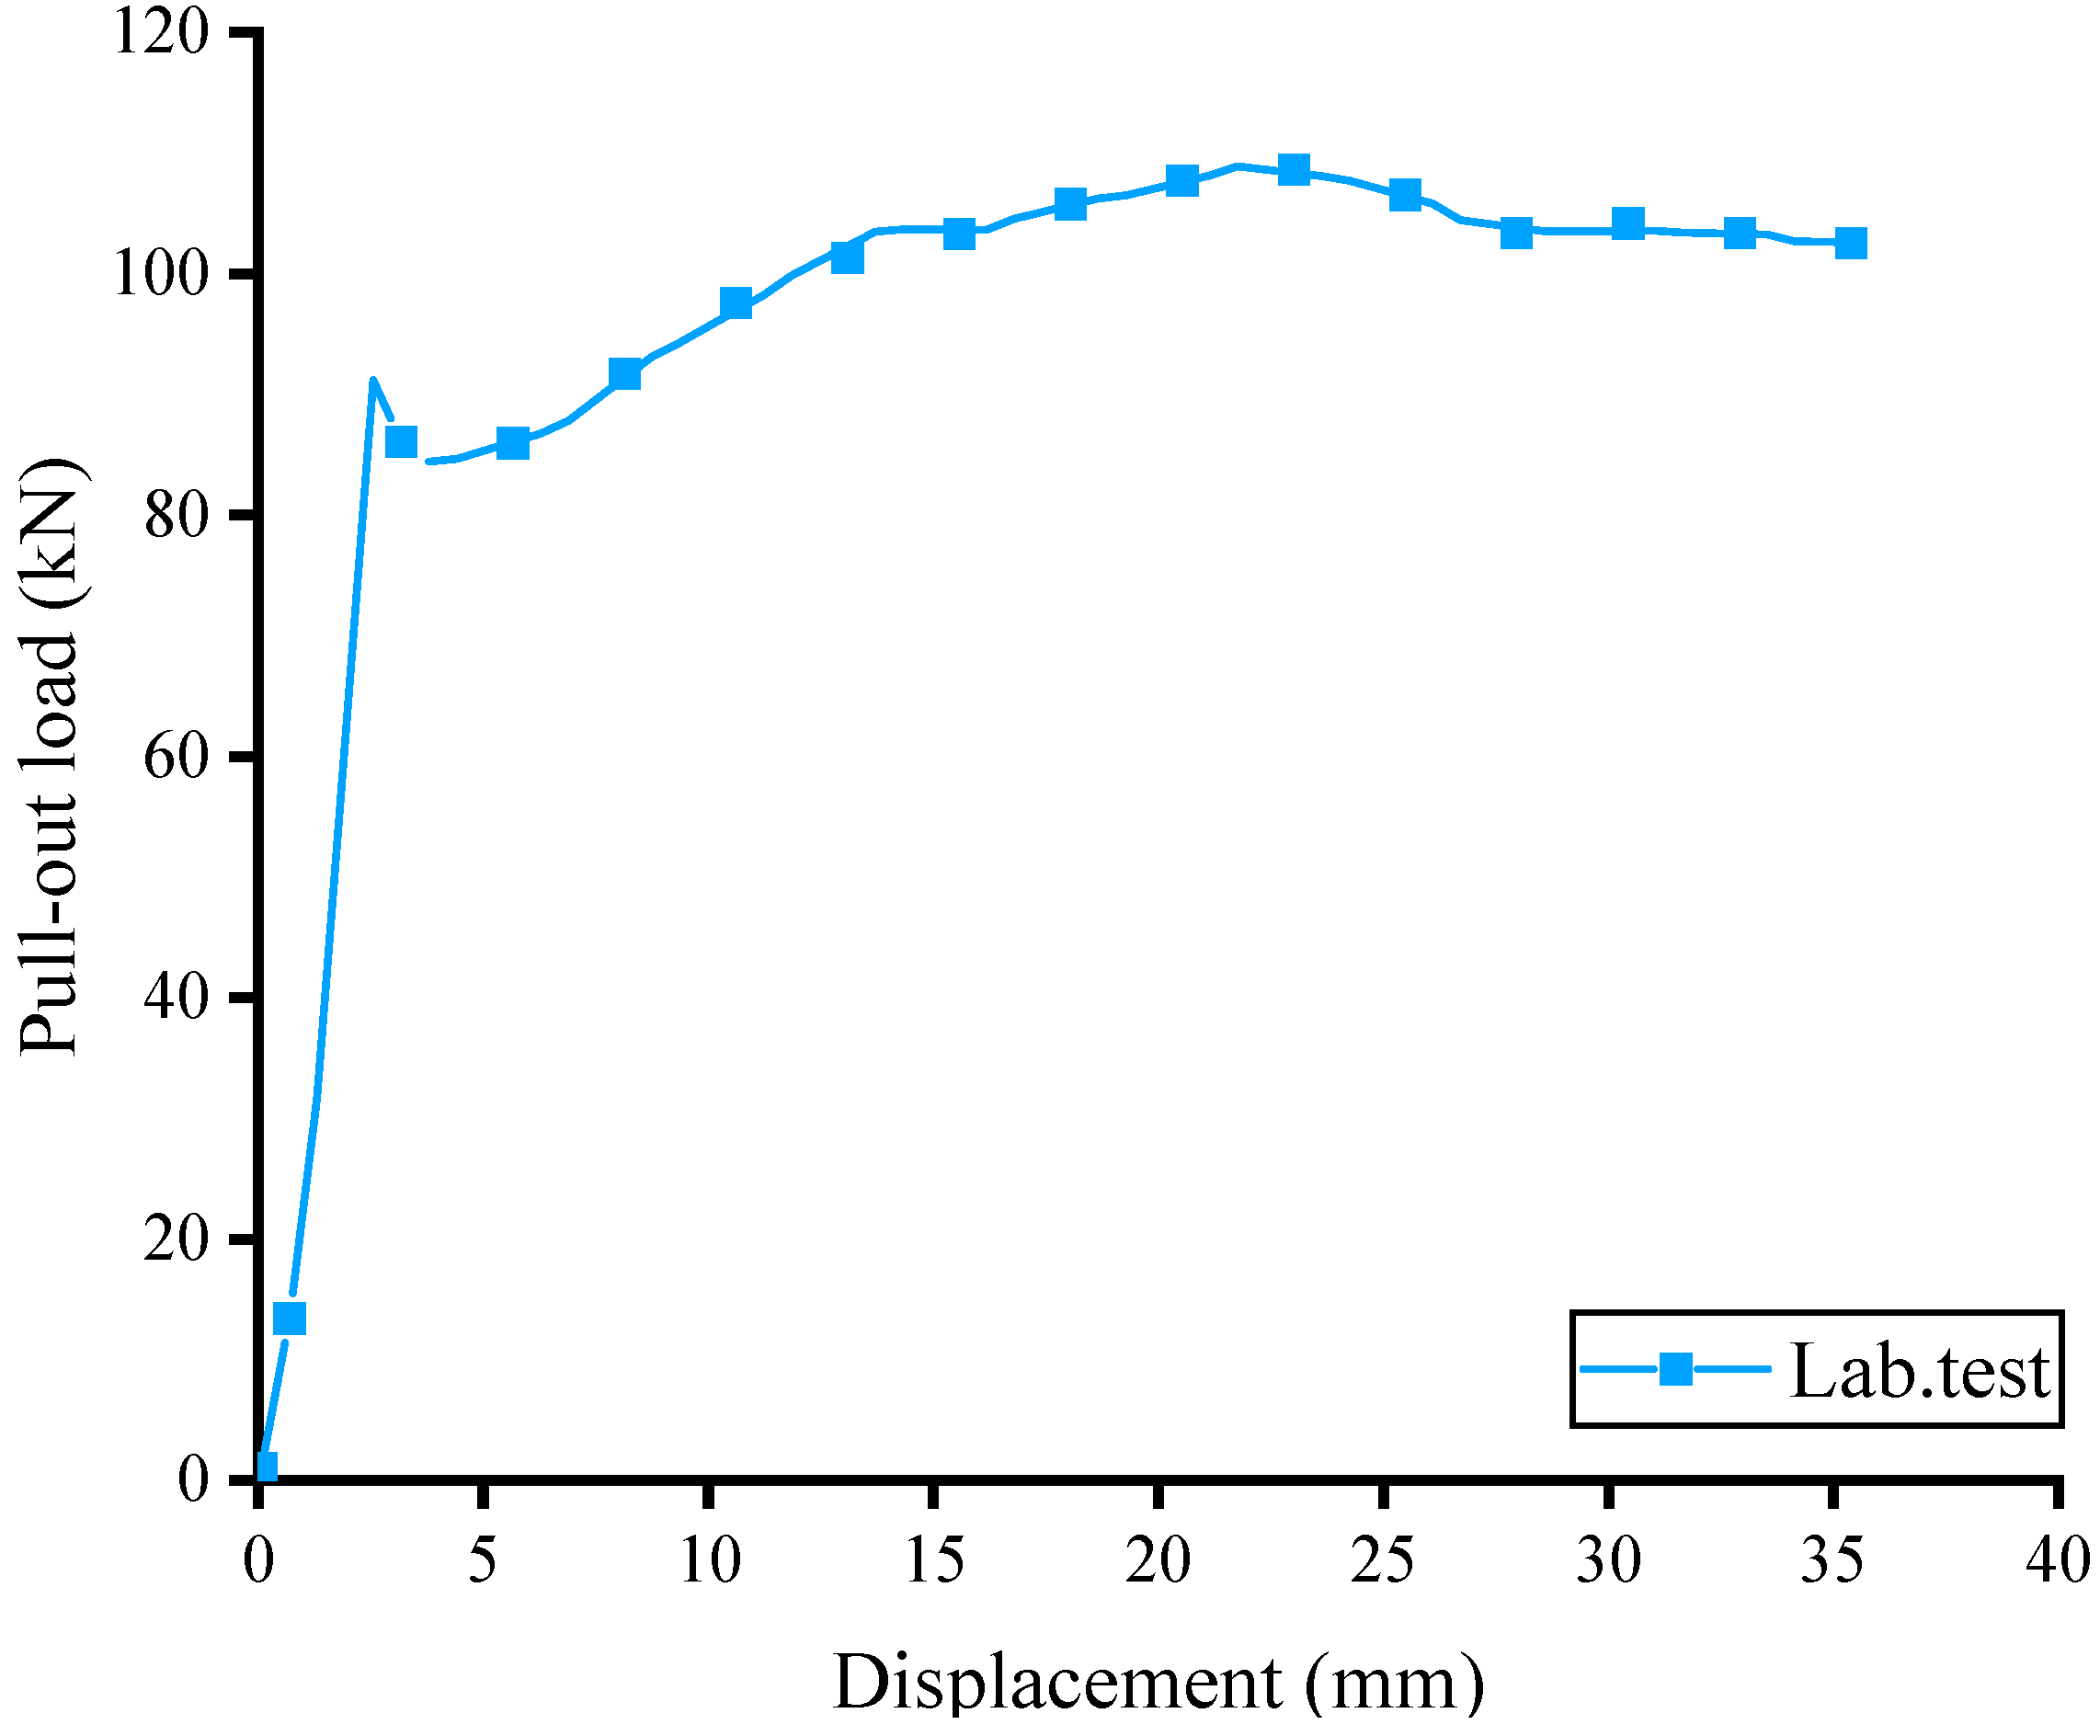
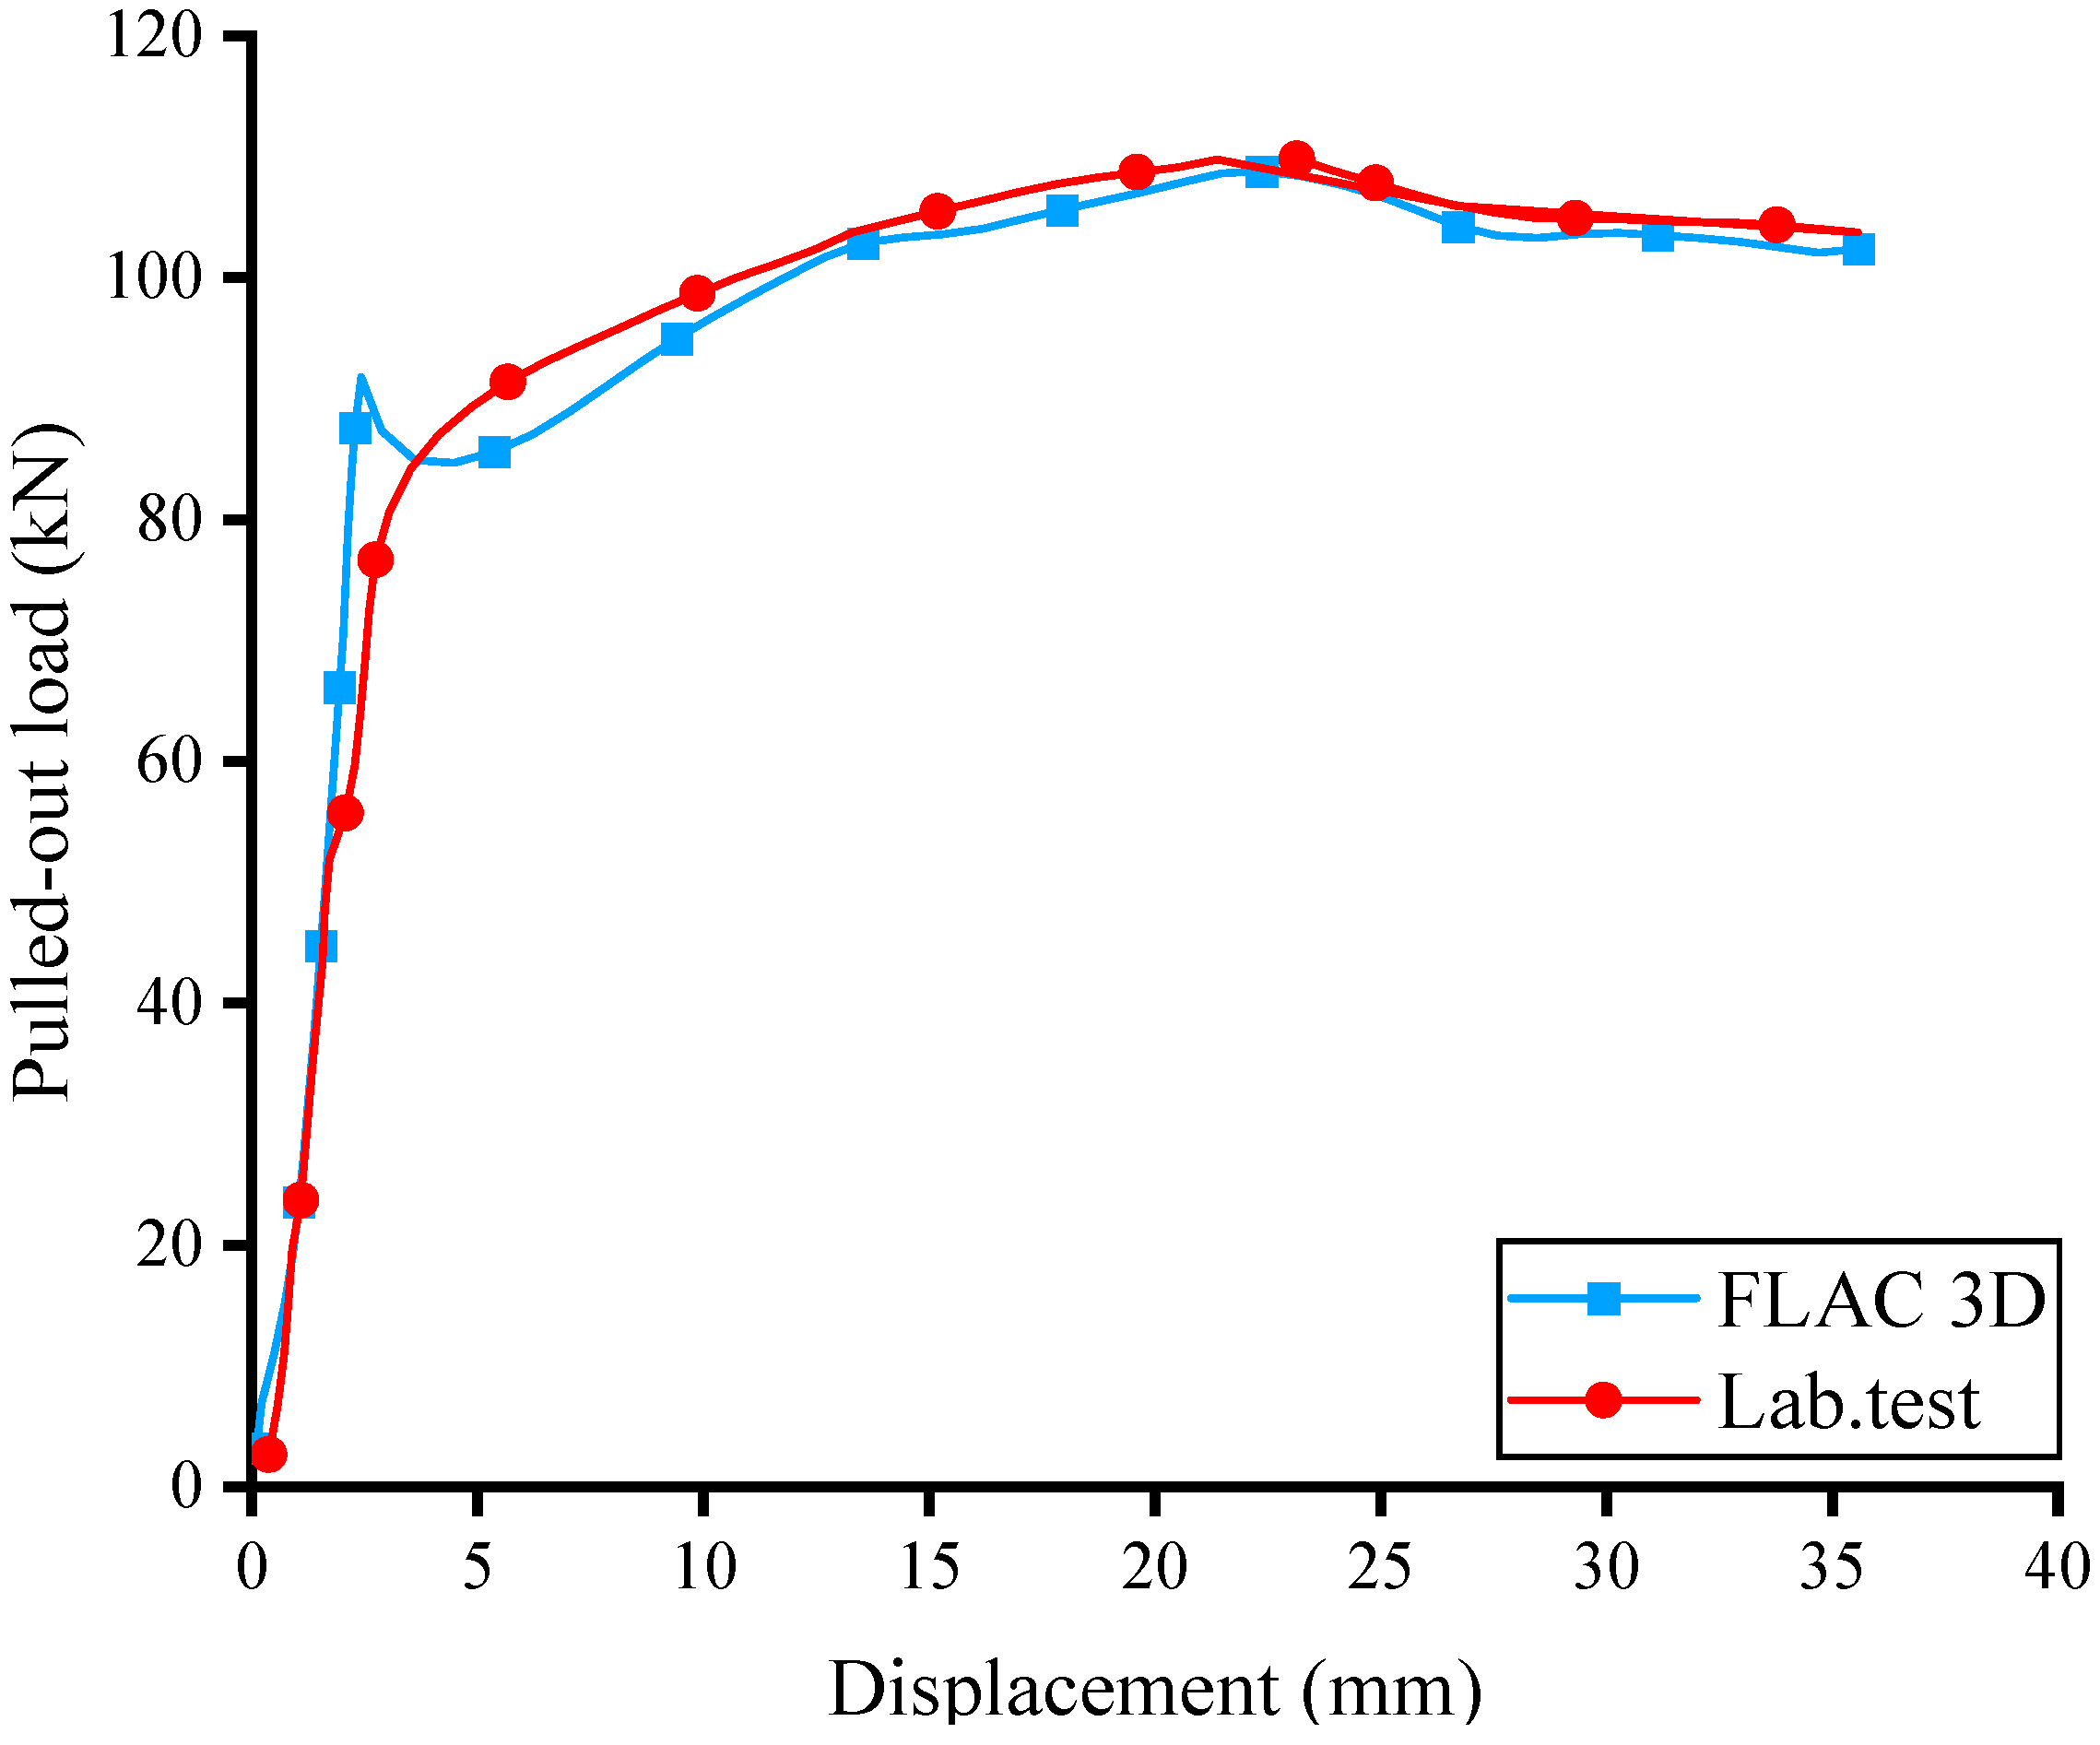
The loading performance of the normal cable is plotted in Figure 9. The cable tendon reached the first peak load of 92 kN when the longitudinal displacement increased to 2.5 mm. Then, the load loading capacity increased again. When the longitudinal displacement arrived at 22 mm, the cable tendon reached the peak load of 109 kN.
In the numerical pulling test, the confining stress was adjusted until the largest longitudinal load in modelling was in line with the peak load measured in the experimental longitudinal test. After the peak load, the behavior of the fully bonded cable tendon was controlled with the strain-softening model.
It was found that when a confining stress of 4.8 MPa was used, a good correlation between the numerical and the indoor longitudinal results generated, as shown in Figure 10. Specifically, in FLAC3D, the loading capacity of the normal cable tendon increased almost linearly with the displacement to 81 kN. Then, the loading capacity of the normal cable still rose but with a much lower slope. At a displacement of around 22 mm, the loading capacity of the normal cable tendon reached the peak of 109 kN. Then, the loading capacity of the cable decreased gradually with the displacement.
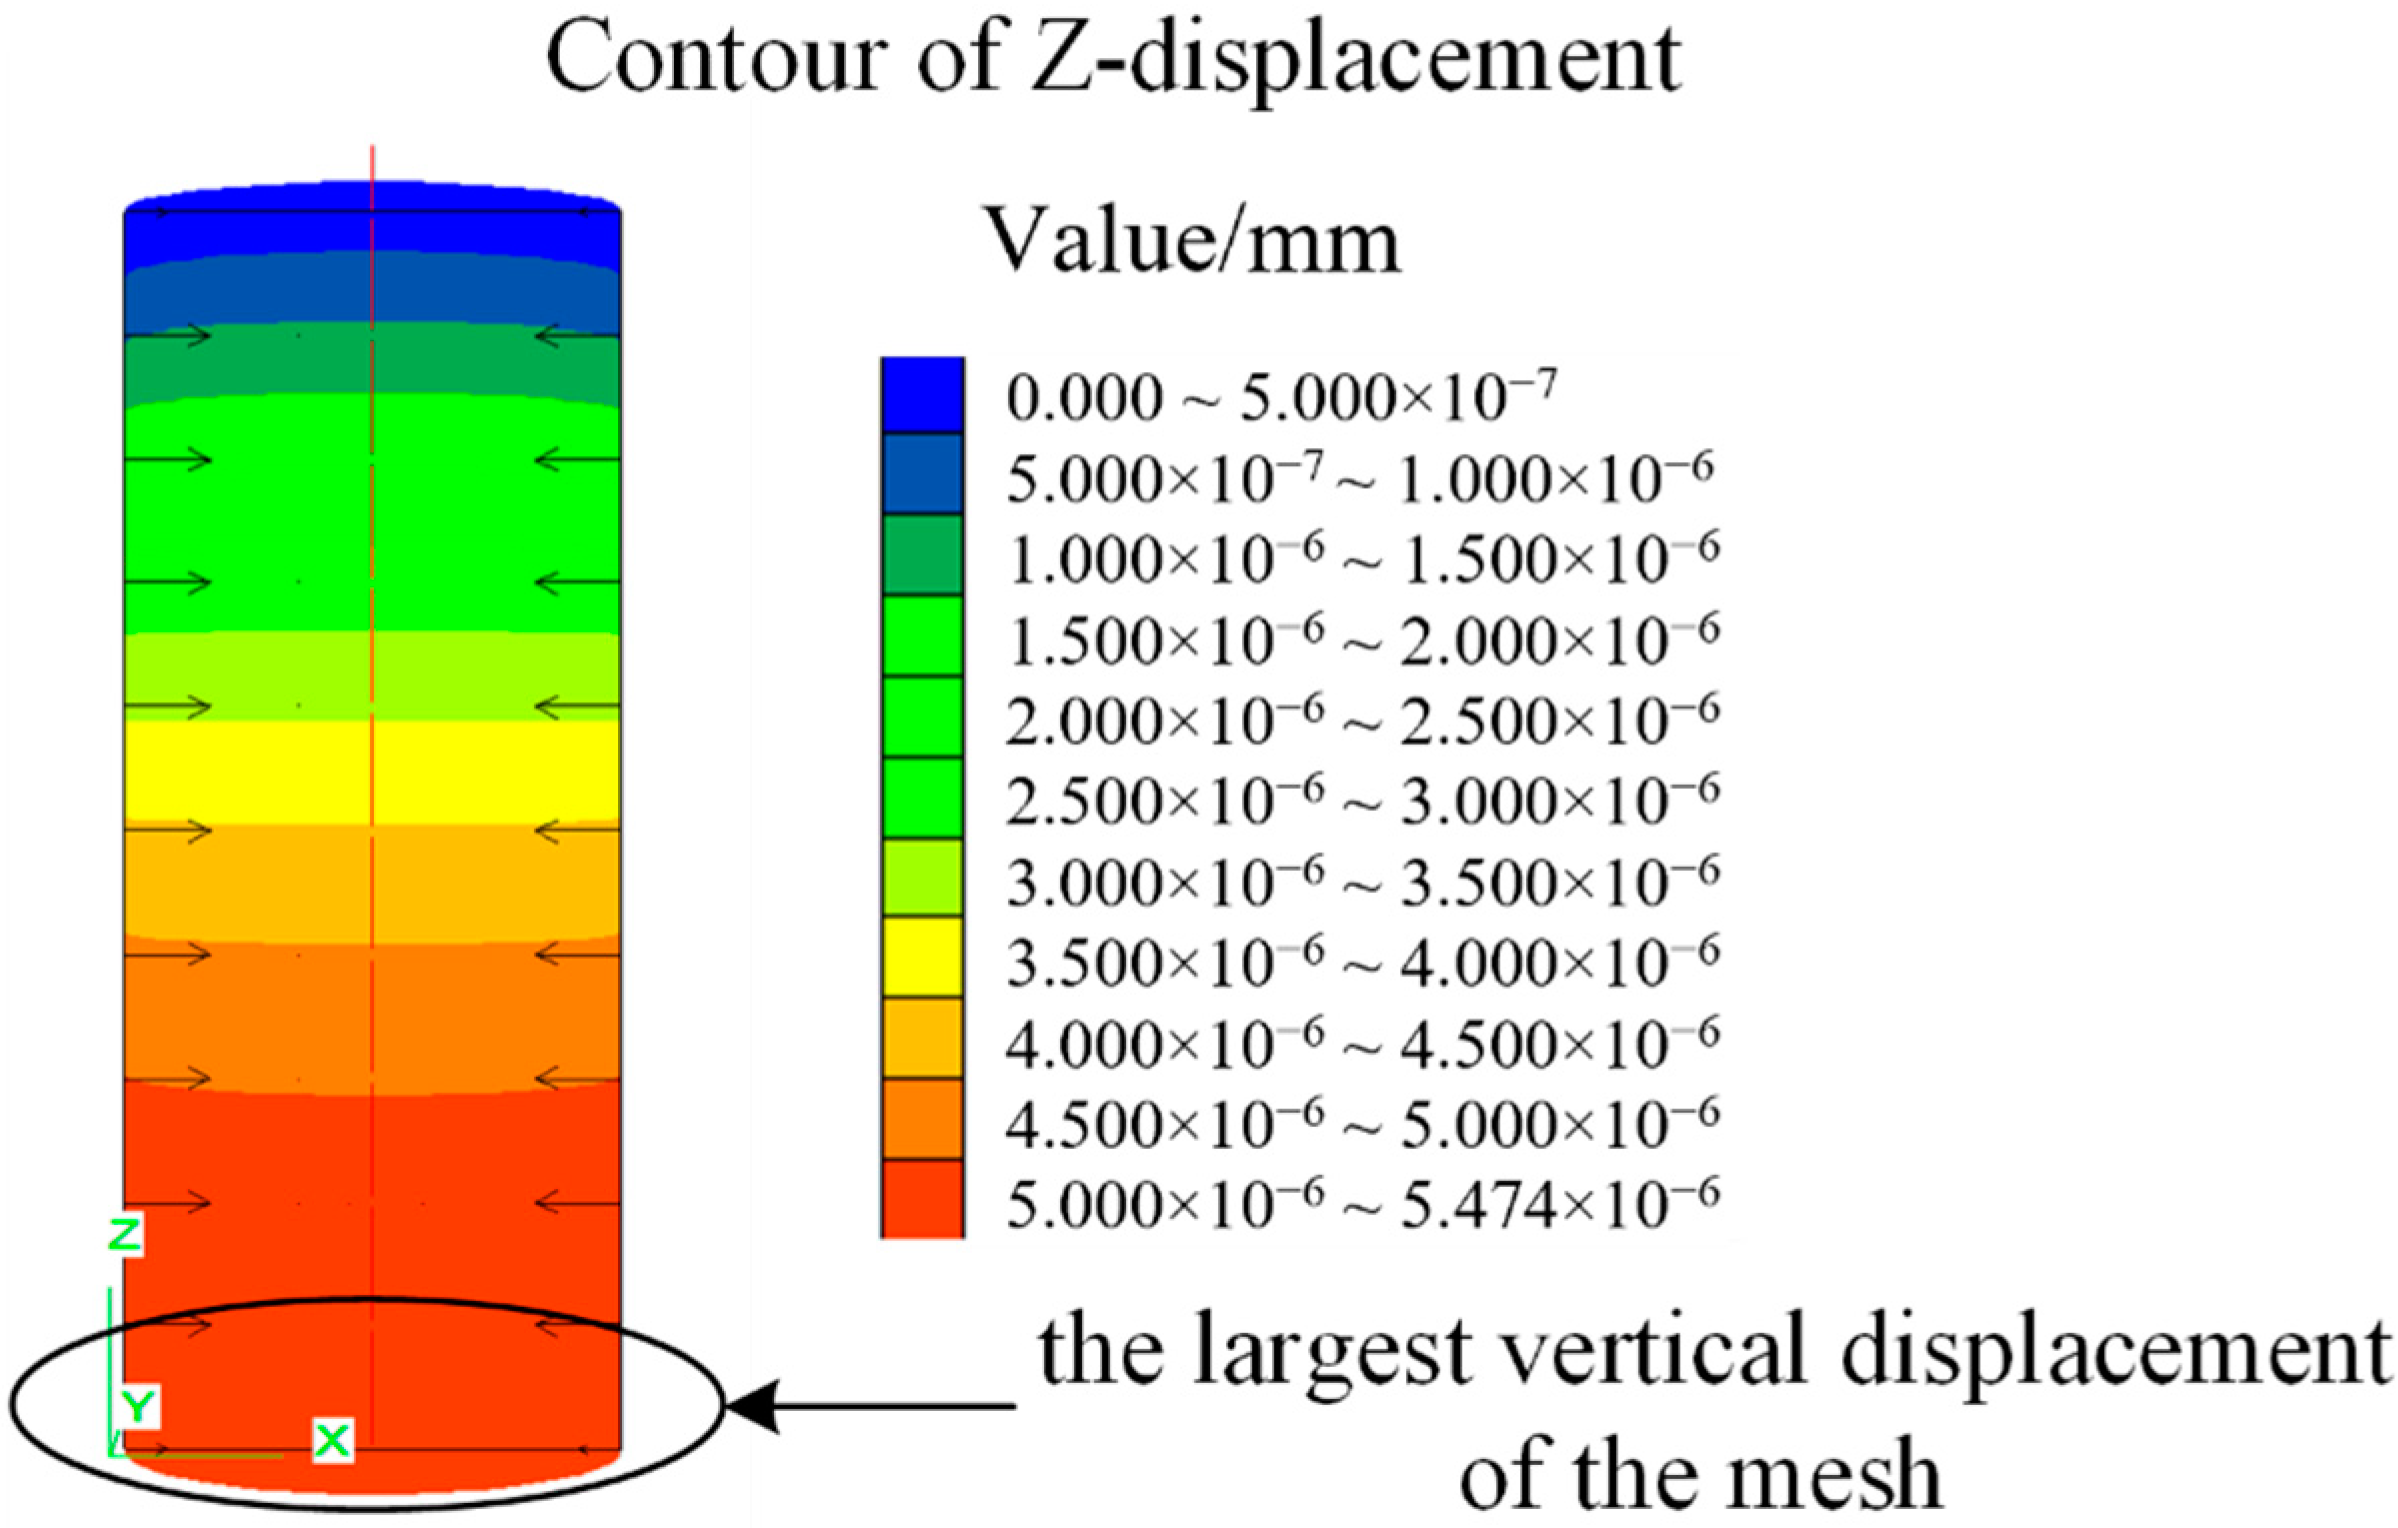
The vertical displacement contour in the cylindrical mesh is plotted in Figure 11. It indicates that at the top section of the mesh, the vertical deformation was zero. This is because the top surface of the mesh was fixed, simulating the bearing plate effect. Furthermore, the largest vertical displacement of the mesh occurred at the bottom of the mesh.
In the indoor test, Aoki, Maeno, Shibata, and Obara [18] used strain gauges to measure the confining stress generated by the steel pipe. It was found that during the indoor longitudinal process, the largest confining stress generated by the steel pipe was 4.4 MPa.
It indicates that there is a close match between the largest confining stress used in FLAC3D and the largest confining stress recorded in the indoor environment. This indicates that the numerical solution developed in this manuscript can be selected to analyse the largest confining stress for normal cable tendons in indoor longitudinal tests.

3.2. Pulling Test Results of the Improved Cable Tendon

For the numerical pulling test of the improved cable tendon, the confining stress was calibrated when the largest longitudinal load in the numerical solution was in line with the peak load acquired in the indoor longitudinal test. It indicated that when the confining stress used in the numerical simulation was 10.9 MPa, a good correlation between the numerical and indoor longitudinal results was generated, as shown in Figure 12.
It is admitted that there was still some mismatch between the simulation results and the experimental results. This was more apparent when the displacement increased from 1 mm to 2.5 mm. The reason was that in this simulation, the spring-slider was used to simulate the connection between the cable bolt and the rock mass. However, for improved cable bolts, the inflated bulb along the cable cannot be properly simulated with the nodal points. Therefore, further research should be continued to especially investigate how to accurately simulate the inflated bulb.
It indicated that there was generally a linear relation between the loading capacity of the improved cable and the displacement. In numerical simulation, at a displacement of around 5.3 mm, the loading capacity of the improved cable reached the peak load of approximately 227 kN, being consistent with the largest longitudinal load recorded in the indoor test.
As for the confining stress, the largest confining stress recorded in the indoor test was 10 MPa. As mentioned above, in numerical simulation, the largest confining stress was 10.9 MPa, being consistent with the indoor recorded result. This indicates that this numerical solution is also applicable to determine the largest confining stress for improved cable tendons.
It was also found that under the same test condition, when the improved cable was used, the confining medium can generate much higher confining stress compared with normal cable tendons. Since the loading performance of cable tendons mainly relies on the friction-dilation behavior of the c/g surface, higher confining stress can result in larger loading capacity of cable tendons.

3.3. Discussion

Indoor longitudinal tests were always selected to evaluate the loading behavior of fully bonded cable tendons. During the longitudinal test, a CNS boundary condition was usually used. Consequently, a confining stress can be generated by the confining medium because of the dilation of the c/g surface. However, the largest confining stress applied by the confining medium was usually unknown. In the indoor environment, strain gauges can be attached on the confining medium surface to record the strain variation and then the largest confining stress can be acquired. However, it requires much material and labour cost. In this manuscript, a numerical solution was selected to determine the largest confining stress in longitudinal tests of cable tendons.
It is significant to acquire the mechanical factors of the grout: the cohesion and the friction angle. Then, a proper bond quality can be selected to calculate the cohesion between the cable and the grout column. After that, the input parameters including the cable, the confining medium, and the grout can be substituted into FLAC3D for further calculation. Through calibration, the largest confining stress can be acquired when a good correlation between the numerical and indoor longitudinal results is generated.
It should be noted that to use this numerical approach, the mechanical properties of the grout should be obtained in advance. More specifically, the shear properties of the grout should be acquired. To acquire the shear properties of the grout, either the triaxial test or the direct shear test can be used. Through conducting those two tests, the grout cohesive strength and the friction angle can be obtained. Then, those two values can be substituted into this numerical approach to further determine the maximum confining stress in longitudinal tests of cable tendons.
The contribution of this study is that it reveals the stress state in the cable tendon anchorage body. Moreover, it helps the researchers and engineers to better understand the interaction between the cable tendon and the surrounding rock mass.

4. Conclusions

A numerical solution was proposed to determine the largest confining stress in longitudinal tests of fully bonded cable tendons. The numerical program of FLAC3D was used. The structural pile element was selected to simulate the cable tendon. In numerical simulation, the loading behavior of the cable tendon was controlled by the cohesive and frictional behavior of the c/g surface. Two types of cable tendons, a normal cable tendon and an improved cable tendon, were simulated. For the normal cable, a low bond quality of 0.17 was used. However, for the improved cable, a higher bond quality of 0.35 was used because the bonding performance of the improved c/g surface was better. Experimental longitudinal results were selected to validate the credibility of this numerical solution. It indicates that a good correlation between numerical and indoor longitudinal results occurred. In the numerical simulation, for the normal cable, the largest confining stress was 4.8 MPa, whereas for the improved cable, the largest confining stress was 10.9 MPa. This indicates that under the same test condition, the improved cable can lead the confining medium to generate much higher confining stress. Consequently, the improved cable tendons have better loading performance.

Author Contributions

Conceptualization, Q.C.; writing: X.Y., Q.L., S.S., J.Q., X.S. and B.Z. All authors have read and agreed to the published version of the manuscript.

Funding

National Natural Science Foundation of China (52174130) and Priority Academic Program Development of Jiangsu Higher Education Institutions.

Data Availability Statement

All data were included in this article.

Conflicts of Interest

The authors declare no conflict of interest.

References

  1. Zhang, C.; Zhao, Y.; Han, P.; Bai, Q. Coal pillar failure analysis and instability evaluation methods: A short review and prospect. Eng. Fail. Anal. 2022, 138, 106344. [Google Scholar] [CrossRef]
  2. Hutchinson, D.J.; Diederichs, M.S. Cablebolting in Underground Mines; BiTech Publishers Ltd.: Richmond, BC, Canada, 1996. [Google Scholar]
  3. Li, D.; Masoumi, H.; Ming, C. A constitutive model for modified cable bolts exhibiting cone shaped failure mode. Int. J. Rock Mech. Min. Sci. 2021, 145, 104855. [Google Scholar] [CrossRef]
  4. Wang, M.; Bai, J.; Li, W.; Wang, X.; Cao, S. Failure mechanism and control of deep gob-side entry. Arab. J. Geosci. 2015, 8, 9117–9131. [Google Scholar] [CrossRef]
  5. Zhao, Y.; Zhang, N.; Zheng, X. Experimental study of axial stress distribution and transfer along the bolt rods in an underground coal mine. Arab. J. Geosci. 2016, 9, 30. [Google Scholar] [CrossRef]
  6. Chen, J.; Liu, P.; Liu, L.; Zeng, B.; Zhao, H.; Zhang, C.; Zhang, J.; Li, D. Anchorage performance of a modified cable anchor subjected to different joint opening conditions. Constr. Build. Mater. 2022, 336, 127558. [Google Scholar] [CrossRef]
  7. Fuller, P.G.; Cox, R.H.T. Mechanics of load transfer from steel tendons to cement based grout. In Proceedings of the Fifth Australasian Conference on the Mechanics of Structures and Materials, Melbourne, Australia, 25–26 August 1975; pp. 189–203. [Google Scholar]
  8. Thenevin, I.; Martín, L.B.; Hadj-Hassen, F.; Schleifer, J.; Lubosik, Z.; Wrana, A. Laboratory pull-out tests on fully grouted rock bolts and cable bolts: Results and lessons learned. J. Rock Mech. Geotech. Eng. 2017, 9, 843–855. [Google Scholar] [CrossRef]
  9. Sakhno, I.; Sakhno, S.; Isaienkov, O.; Kurdiumow, D. Laboratory studies of a high-strength roof bolting by means of self-extending mixtures. Min. Miner. Depos. 2019, 13, 17–26. [Google Scholar] [CrossRef]
  10. Krykovskyi, O.; Krykovska, V.; Skipochka, S. Interaction of rock-bolt supports while weak rock reinforcing by means of injection rock bolts. Min. Miner. Depos. 2021, 15, 8–14. [Google Scholar] [CrossRef]
  11. Goris, J.M. Laboratory Evaluation of Cable Bolt Supports (in Two Parts) 1. Evaluation of Supports Using Conventional Cables; Bureau of MINES: Washington, DC, USA, 1990; pp. 1–23. [Google Scholar]
  12. Hyett, A.J.; Bawden, W.F. The 25mm Garford Bulb Anchor for Cable Bolt Reinforcement Part 1: Laboratory Results; Queen’s University: Kingston, ON, Canada, 1994; pp. 1–16. [Google Scholar]
  13. Satola, I.S. Testing of the yielding cable bolt achieved by debonding. In Proceedings of the Congress of the International Society for Rock Mechanics, Paris, France, 25–28 August 1999; pp. 1467–1470. [Google Scholar]
  14. Mosse-Robinson, S.; Sharrock, G. Laboratory experiments to quantify the pull-out strength of single strand cable bolts for large boreholes. In Proceedings of the Second Australasian Ground Control in Mining Conference 2010, Sydney, Australia, 23–24 November 2010; pp. 201–209. [Google Scholar]
  15. Tadolini, S.C.; Tinsley, J.; McDonnell, J.P. The next generation of cable bolts for improved ground support. In Proceedings of the 31st Internatioanl Conference on Ground Control in Mining, Morgantwon, WV, USA, July 31–August 2012; pp. 1–7. [Google Scholar]
  16. Moosavi, M. Load Distribution along Fully Grouted Cable Bolts Based on Constitutive Models Obtained from Modified Hoek Cells; Unpublished; Queen’s University: Kingston, ON, Canada, 1997. [Google Scholar]
  17. Hyett, A.J.; Bawden, W.F.; Reichert, R.D. The effect of rock mass confinement on the bond strength of fully grouted cable bolts. Int. J. Rock Mech. Min. Sci. 1992, 29, 503–524. [Google Scholar] [CrossRef]
  18. Aoki, T.; Maeno, Y.; Shibata, K.; Obara, Y. Laboratory pull-out tests of cablebolts. In Proceedings of the ISRM International Symposium-EuRock 2002, Madeira, Portugal, 25–27 November 2002; pp. 599–606. [Google Scholar]
  19. Chekired, M.; Benmokrane, B.; Mitri, H.S. Laboratory evaluation of a new cable bolt tension measuring device. Int. J. Rock Mech. Min. Sci. 1997, 34, 203.e1–203.e13. [Google Scholar] [CrossRef]
  20. Liu, H.Y.; Small, J.C.; Carter, J.P. Full 3D modelling for effects of tunnelling on existing support systems in the Sydney region. Tunn. Undergr. Space Technol. 2008, 23, 399–420. [Google Scholar] [CrossRef]
  21. Gale, W.J.; Mark, C.; Oyler, D.C.; Chen, J. Computer simulation of ground behaviour and rock bolt interaction at Emerald Mine. In Proceedings of the International Conference on Ground Control in Mining, Morgantown, WV, USA, 3–5 August 2004; pp. 27–34. [Google Scholar]
  22. Itasca. FLAC3D Fast Lagrangian Analysis of Continua in 3 Dimensions; Consulting Group Incorporation: Minneapolis, MN, USA, 2016. [Google Scholar]
  23. Chen, J.; Zhao, Y.; Zhao, H.; Zhang, J.; Zhang, C.; Li, D. Analytic study on the force transfer of full encapsulating rockbolts subjected to tensile force. Int. J. Appl. Mech. Eng. 2021, 13, 2150097. [Google Scholar] [CrossRef]
  24. Chen, J.; Zeng, B.; Liu, L.; Tao, K.; Zhao, H.; Zhang, C.; Zhang, J.; Li, D. Investigating the anchorage performance of full-grouted anchor bolts with a modified numerical simulation method. Eng. Fail. Anal. 2022, 141, 106640. [Google Scholar] [CrossRef]
  25. Chen, J.; Saydam, S.; Hagan, P.C. Numerical simulation of the pull-out behaviour of fully grouted cable bolts. Constr. Build. Mater. 2018, 191, 1148–1158. [Google Scholar] [CrossRef]
  26. Moosavi, M.; Bawden, W.F. Shear strength of Portland cement grout. Cem. Concr. Compos. 2003, 25, 729–735. [Google Scholar] [CrossRef]
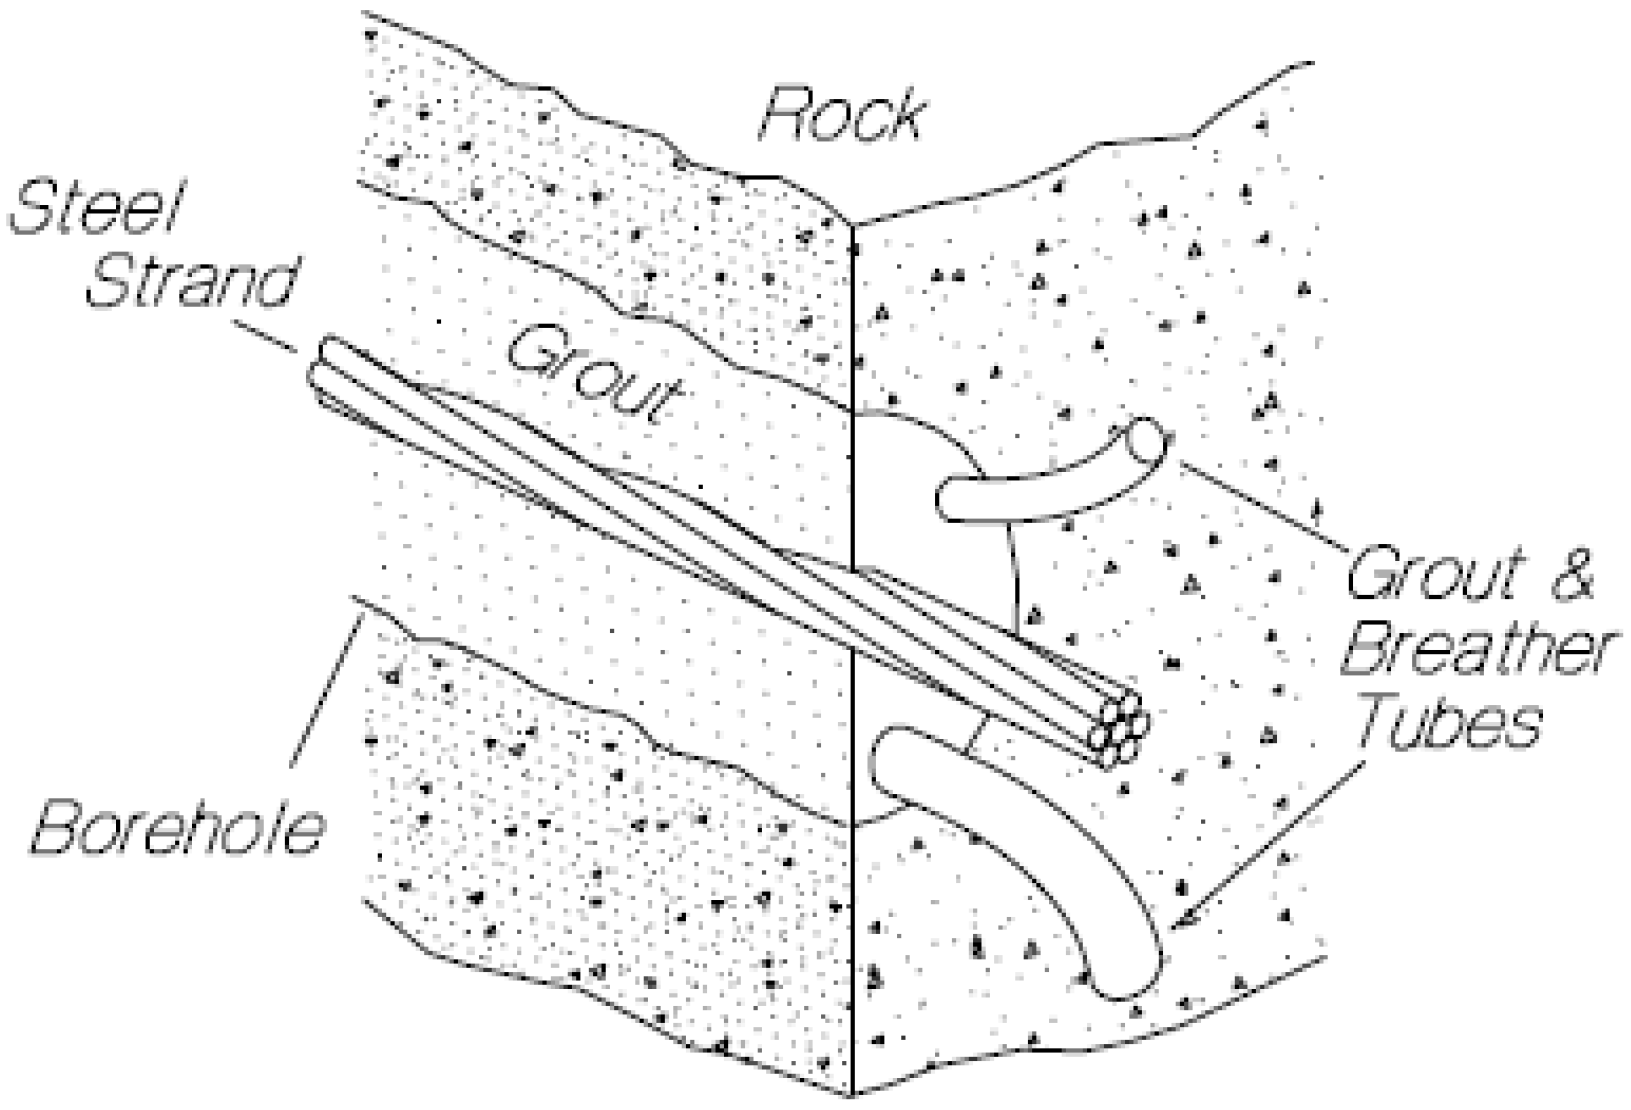
Figure 1. The cable reinforcement system [2].
Sustainability 14 10871 g001
Figure 2. Failing types of fully bonded cable tendons [2].
Sustainability 14 10871 g002
Figure 3. The spring-slider system in FLAC3D [22].
Sustainability 14 10871 g003
Figure 4. Coupling strength criteria of the c/g surface [22].
Sustainability 14 10871 g004
Figure 5. The cross-sectional diagram of the test.
Sustainability 14 10871 g005
Figure 6. Geometry of a bonded cable reinforcement system in FLAC3D.
Sustainability 14 10871 g006
Figure 7. Apply confining stress on the outside surface of the mesh in FLAC3D.
Sustainability 14 10871 g007
Figure 8. Relative position between the boundary of the mesh and the confining stress on the cutting plane in FLAC3D.
Sustainability 14 10871 g008
Figure 9. Loading performance of the normal cable tendon [18].
Sustainability 14 10871 g009
Figure 10. Comparing between the numerical and indoor longitudinal results of the normal cable tendon.
Sustainability 14 10871 g010
Figure 11. Vertical displacement contour in the mesh.
Sustainability 14 10871 g011
Figure 12. Comparison between the numerical and indoor longitudinal results of the improved cable.
Sustainability 14 10871 g012
Table 1. Input factors for the normal cable tendon.
TypeIndexSymbolValue
CableYoung’s modulus (MPa)E190
Diameter (mm)-15.2
Embedment length (mm)-350
Steel pipeYoung’s modulus (MPa)E210
Poisson’s ratioμ0.3
GroutBond quality-0.17
Cohesive strength (MPa)C12.4
Friction angle (°)φ42
Table 2. Input factors for the improved cable tendon.
TypeIndexSymbolValue
CableYoung’s modulus (MPa)E190
Diameter (mm)-15.2
Embedment length (mm)-350
Steel pipeYoung’s modulus (MPa)E210
Poisson’s ratioμ0.3
GroutBond quality-0.35
Cohesive strength (MPa)C12.4
Friction angle (°)φ42
Publisher’s Note: MDPI stays neutral with regard to jurisdictional claims in published maps and institutional affiliations.