1. Introduction
Following the financial crisis in 2008 and the COVID-19 pandemic, the world has been faced with completely new changes in social and economic life. All of this strongly affects the way, scope and forms of functioning of modern socioeconomic systems. Together with advancing climate and technological changes, geopolitical instability, migration crises, demographic problems or exogenous economic shocks, it places the issue of resilience at the center of the scientific debate conducted at the international and national levels; moreover, in these discussions, it is emphasized that the resilience of regional and local economies is becoming a new development goal, gradually replacing the concept of sustainable development promoted since the end of the 1980s [
1]. The concept of resilience, which means the ability to deal with shocks and adapt to changing circumstances in the face of stress, is interdisciplinary. Resilience was originally a term of natural and physical sciences, used in ecology to describe how an ecological system could recover from a disturbance [
2] and in engineering to describe the return of a system to a steady state after a shock. The concept was only introduced to social science in the early 2000s [
3]. In a period of increased environmental, social and economic crises, resilience has become a significant purchase as a descriptor of how societies can respond positively to pressures. Therefore, the concept of resilience has been extended to other disciplines, such as public policy, urban planning, crisis management, financial management and others [
4,
5,
6,
7,
8,
9,
10,
11,
12,
13,
14,
15,
16]. Despite that, much less attention has been devoted to how local government units (LGUs) anticipate, absorb and react to shocks affecting their finances over time, i.e., financial resilience. The existing scientific literature has not conceptualized but operationalized the concept of financial resilience of LGUs through the prism of three different but interrelated interpretations of resilience: engineering, ecological and organizational resilience [
17,
18]. In the first engineering sense, the system is resilient when it returns to equilibrium. The second understanding of resilience focuses on the role of disturbances that force the system to change beyond the elastic threshold and return to equilibrium but in a slightly modified form. The third organizational understanding of resilience is derived from the psychology and theory of organization; it focuses on the behavioral aspect of organizations that, in the face of turbulence, are able to maintain their capacity by adapting existing structures and functions to shocks; these interpretations can be useful in testing financial resilience at the local government level, providing useful criteria for identifying and classifying various response strategies. Engineering and ecological resilience refer to strategies based on the so-called ’bouncing back’ strategies, which manifest themselves in budget cuts, increased taxes and fees, deferring investments or selling assets [
11]. Organizational resilience, in turn, reflects the so-called ’bouncing forward’ strategies based on changes in organizational structure, function, goals and values through transformation and innovation (redefining the methods of providing public services, using public-private partnerships etc.).
The preservation of the financial resilience of the LGUs in Poland and Croatia is of great concern. Although both countries differ in terms of size and number of LGUs, they were selected for the article because of certain similarities. Both countries are post-communist countries. Furthermore, they are characterized by a similar proportion of the urban population in the national population (at a level of approximately 60% in 2018) [
19]. There are unitary three-tier subnational government systems in both countries. In Croatia, the representatives of LGUs are cities and municipalities, whereas the counties belong to regional government units. The Croatian local government consists of 576 regional and local government units; these are 127 cities, 428 municipalities, 20 counties, and a capital city of Zagreb that has a dual status (city and county). As in Croatia, the Polish public administration is based on a three-level structure: regional, intermediate and municipal. The regional level comprises 16 voivodeships (regions, provinces). The intermediate level is made up of 314 powiats (counties). Municipalities (gminas) are divided into three categories: urban municipalities, rural municipalities and mixed municipalities. In 1998–1999, a group of 66 of the largest cities was given the status of urban municipalities with county rights. At present, Poland has 302 urban municipalities. Furthermore, Poland and Croatia are characterized by similar fiscal decentralization, with a share of local government revenues in GDP of 13.49% in 2020 (Croatia) and 15.12% (Poland), and a share of expenditures of 14.49% (Croatia) and 14.92%, respectively [
19]. The structure of local income and expenditure in both countries is also very similar.
Unlike Western European cities, the contemporary character of Polish and Croatian cities is largely the result of socialist urbanization and industrialization processes. Increasing pressure on European cities as a result of globalization and European integration has led to a polarization of urban development. The cities of Poland and Croatia have faced additional challenges related to increased competition within the EU. The adjustment process has turned out to be extremely difficult, especially for cities that have not benefited from foreign direct investment. In 2021, the level of urbanization measured by the urban population in Poland and Croatia was quite similar, i.e., approximately 61% and 58%, respectively. The Polish settlement network is polycentric, characterized by a regular size distribution of cities, a hierarchical structure of several levels and a small advantage of the capital city over other centers compared to other European countries. The features of the Croatian settlement network indicate its monocentric character. The determinant of this is, among others, the share of the population living in the capitals of both countries. Warsaw concentrates approximately 5% of the total population and Zagreb much more, almost 16%. A characteristic feature of the settlement network is a certain shortage of large urban centers. The advantage of Warsaw over the second largest city, Krakow, is 2.3, and in the case of Zagreb and Split, this ratio is 4.5. The cities of Poland and Croatia, as post-communist countries, show a similar model of economic development. Large centers are developing their own potential and remain attractive to external investors, but medium-sized and small towns are increasingly experiencing the negative effects of depopulation, especially the outflow of young residents. In addition, cities in both countries need to improve their global value chains since this is an important determinant of international trade. For example, the global value chain participation index in 2018 was 53.6% for Poland and 37.0% for Croatia. In turbulent times, the sustainable development of the cities in both countries is dependent on a change in the development model from extensive, based on the attraction of external investors and the creation of new jobs, to intensive, based on endogenous resources and the maintenance of financial sustainability. Especially during the COVID-19 pandemic, the foundations of government financial planning at all government levels emphasized the problems of financial resilience; this is noticeable at the local level, where the financial, and especially fiscal capacity, is more limited. As the COVID-19 pandemic has affected the central government budget in both countries, it is very interesting at what level the financial resilience of local government units, especially in cities in both countries, has been affected; this raises a more general question as to how local governments respond to crises and external shocks and what this reaction depends on.
Research on financial resilience at the local government level is relatively limited [
1,
16,
20,
21]. Additionally, to date, only a few studies in the literature have investigated the path of fiscal resilience and its determinants at the local level [
1,
11,
16,
21]. Based on their findings, they all concluded that, in general, more developed local government units are more resilient. In particular, it seems interesting to compare the fiscal resilience of LGUs and the factors shaping them in various economic, social and institutional systems in the period after the Great Recession with the current global post-pandemic shock.
Therefore, the objective of this article is to investigate the financial resilience profiles of large cities in Poland and Croatia from 2010 to 2020 and to identify the factors differentiating the identified resilience patterns. As little is known in this area, the following research questions are posed:
- (1)
How should one define and measure the financial resilience of LGUs?
- (2)
How does the external economic environment affect the financial performance of LGUs, and what are the main fiscal adjustment strategies adopted to cope with disturbances?
- (3)
Does the scope of fiscal resilience of LGUs differ over time, and how can cities be classified depending on their resilience trajectories over time?
- (4)
What determines the fiscal resilience profiles of LGUs?
The study period allowed for the consequences of the Great Recession, as well as the time of macroeconomic prosperity and the beginning of the recent post-pandemic crisis, to be taken into account. The article used a two-stage research procedure. In the first stage, groups with similar resilience trajectories over time were classified using group-based trajectory modeling (GBTM). In the second stage, to identify variables that explain financial resilience patterns, a panel data regression was used.
The contribution of this article is threefold. First, to fill the gap in the research on financial resilience at the local government level, second, to determine and describe the different financial resilience patterns from the technical, ecological and organizational perspectives, and third, to use the long-term and dynamic behavioral finance perspective to study the fiscal responses of local authorities for external shocks.
The article is structured as follows. After a brief introduction,
Section 2 provides a review of the existing literature concentrated on the concept of resilience, as well as a link between resilience and financial resilience, with a particular focus on local government. Furthermore, the impact of the external environment on the financial performance of the cities in Poland and Croatia is described in
Section 3. The methodological framework and data sample are presented in
Section 4. The empirical results are studied in
Section 5. The discussion and limitations are discussed in
Section 6, while
Section 7 includes concluding remarks.
2. Literature Review
In the literature, there have been various studies on local government financial resilience [
1,
10,
11,
12,
14,
20,
21,
22,
23,
24,
25,
26,
27,
28], but the concept of fiscal resilience is lacking.
The incorporation of resilience into policy occurred relatively late in comparison to sustainability, although the concept of resilience in ecology was defined as early as the 1970s. The concept was introduced in other fields, including public policy related to LGUs, particularly urban planning. Unlike sustainability, there is no universally accepted definition of resilience. Furthermore, the concept of resilience is multidimensional, so financial resilience is also multidimensional; however, in all these perspectives, there is a common approach that holds that resilience is the capability of a system to maintain its functions and structure in the face of internal and external shocks and to adapt to those changes.
In addition, the financial resilience framework is based on four components [
28]; these are economic resources, financial products and services, financial knowledge and behavior and social capital. The economic resource component refers to income, savings, debt management and the ability to pay the costs of living and raise funds in an emergency. Financial exclusion research is a component of financial products and services, while current financial capability research is a component of financial knowledge and behavior. The last component, social capital, refers to access to community and government support services. All of these components encompass both internal and external resources. The main goal of financial resilience is the ability to maintain a stable financial condition in the face of external shocks [
13,
15,
16,
29]. Some researchers also investigate taxes, financial reserves and diversified tax revenues as determinants of financial resilience. In a study by [
12], the effect of perceived external shock, vulnerability and anticipatory capacity on government bouncing back and bouncing forward strategies that respond to shocks has been examined. Ref. [
29] measures the financial resilience of local governments in Italy using sensitivity indices, focusing on the ability to resist shocks and maintain the status quo. In their study, ref. [
16] explained the relationship between financial resilience and its financial, human and political resources using the framework of resource-based view theory in the case of US state governments; their results show that the effect of government resources on financial resilience differs depending on the type of resource. When it comes to fiscal resilience, ref. [
1] define fiscal resilience at the regional level as the ability of the regional budget system to recover from various shocks that either throw it off the path of balanced development or have the potential to do so. In the case of the Russian regions, they found that, in 2020, fiscal resilience was primarily supported by federal grants. On the other hand, the concept of financial resilience of English local government has been analyzed by [
21]. Based on their results, they proposed recommendations to policymakers to consider how they can strengthen institutions and financial resilience in order to be ready for a crisis.
It should be remembered that, under disturbance conditions, local authorities determine different response strategies [
30], which have an impact on both local fiscal health and the degree to which demand for the most important public services is met. In the existing literature, local adaptation strategies are classified and tested, usually using case study methods based on qualitative data collected through interviews or surveys [
30,
31,
32,
33,
34]; it is difficult to draw clear and universal conclusions on such a basis; these methods seem insufficient to identify local financial resilience patterns and their sources. To achieve this objective, it is necessary to adopt a long-term and dynamic perspective on behavioral finance, in which the individual behavior and specific reactions of certain local governments are the results of external conditions and internal decisions determined by financial robustness, anticipatory capacity, awareness, flexibility and recovery ability [
35]; it is interesting in particular to compare the profiles of local financial resilience and their determinants in various economic, social and institutional systems in the period of the great economic and financial crisis of 2008–2010 with the current global post-pandemic shock.
Following all the studies and the scarcity of quantitative research, this article attempts to fill the scientific gap and empirically focus on the Croatian and Polish cities as local government units. Furthermore, our main hypothesis is that the level of financial resilience of local government units, i.e., the cities of Poland and Croatia, differs in both countries; however, the classification of cities into similar groups based on commonality in their fiscal behavior over time may help to better identify the sources of those differences.
3. Impact of the External Environment on the Financial Performance of the Cities in Poland and Croatia
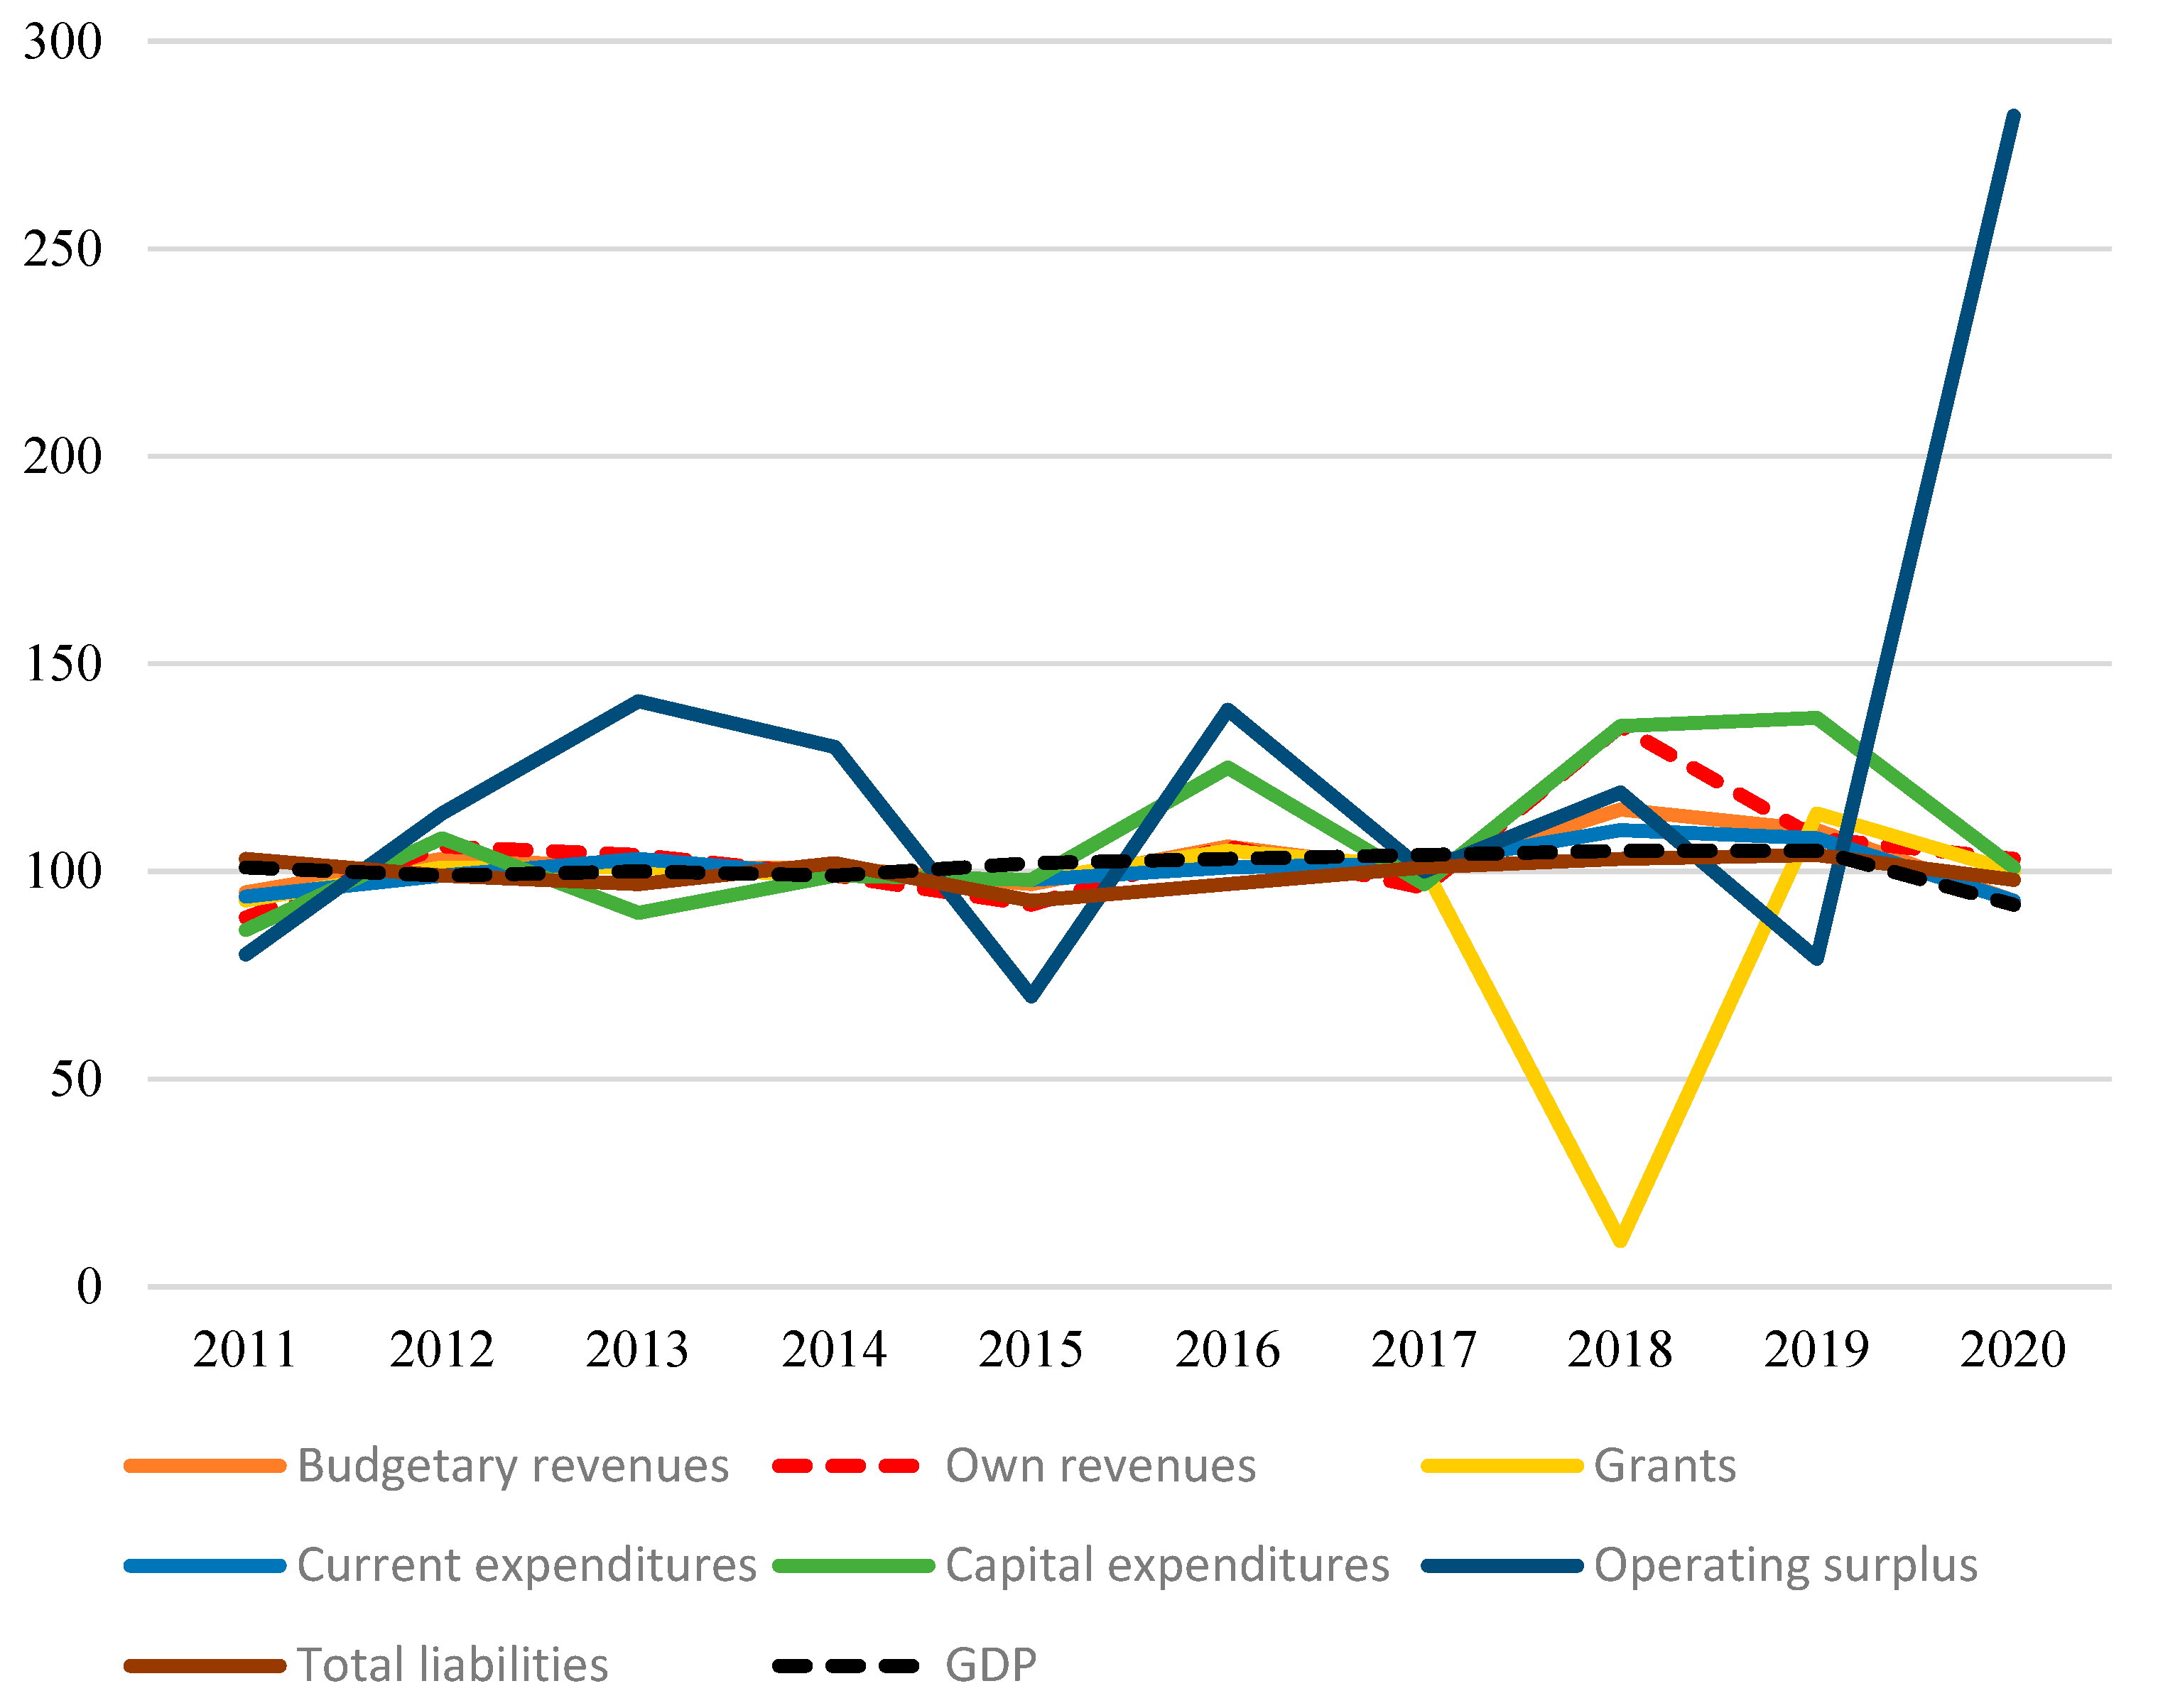
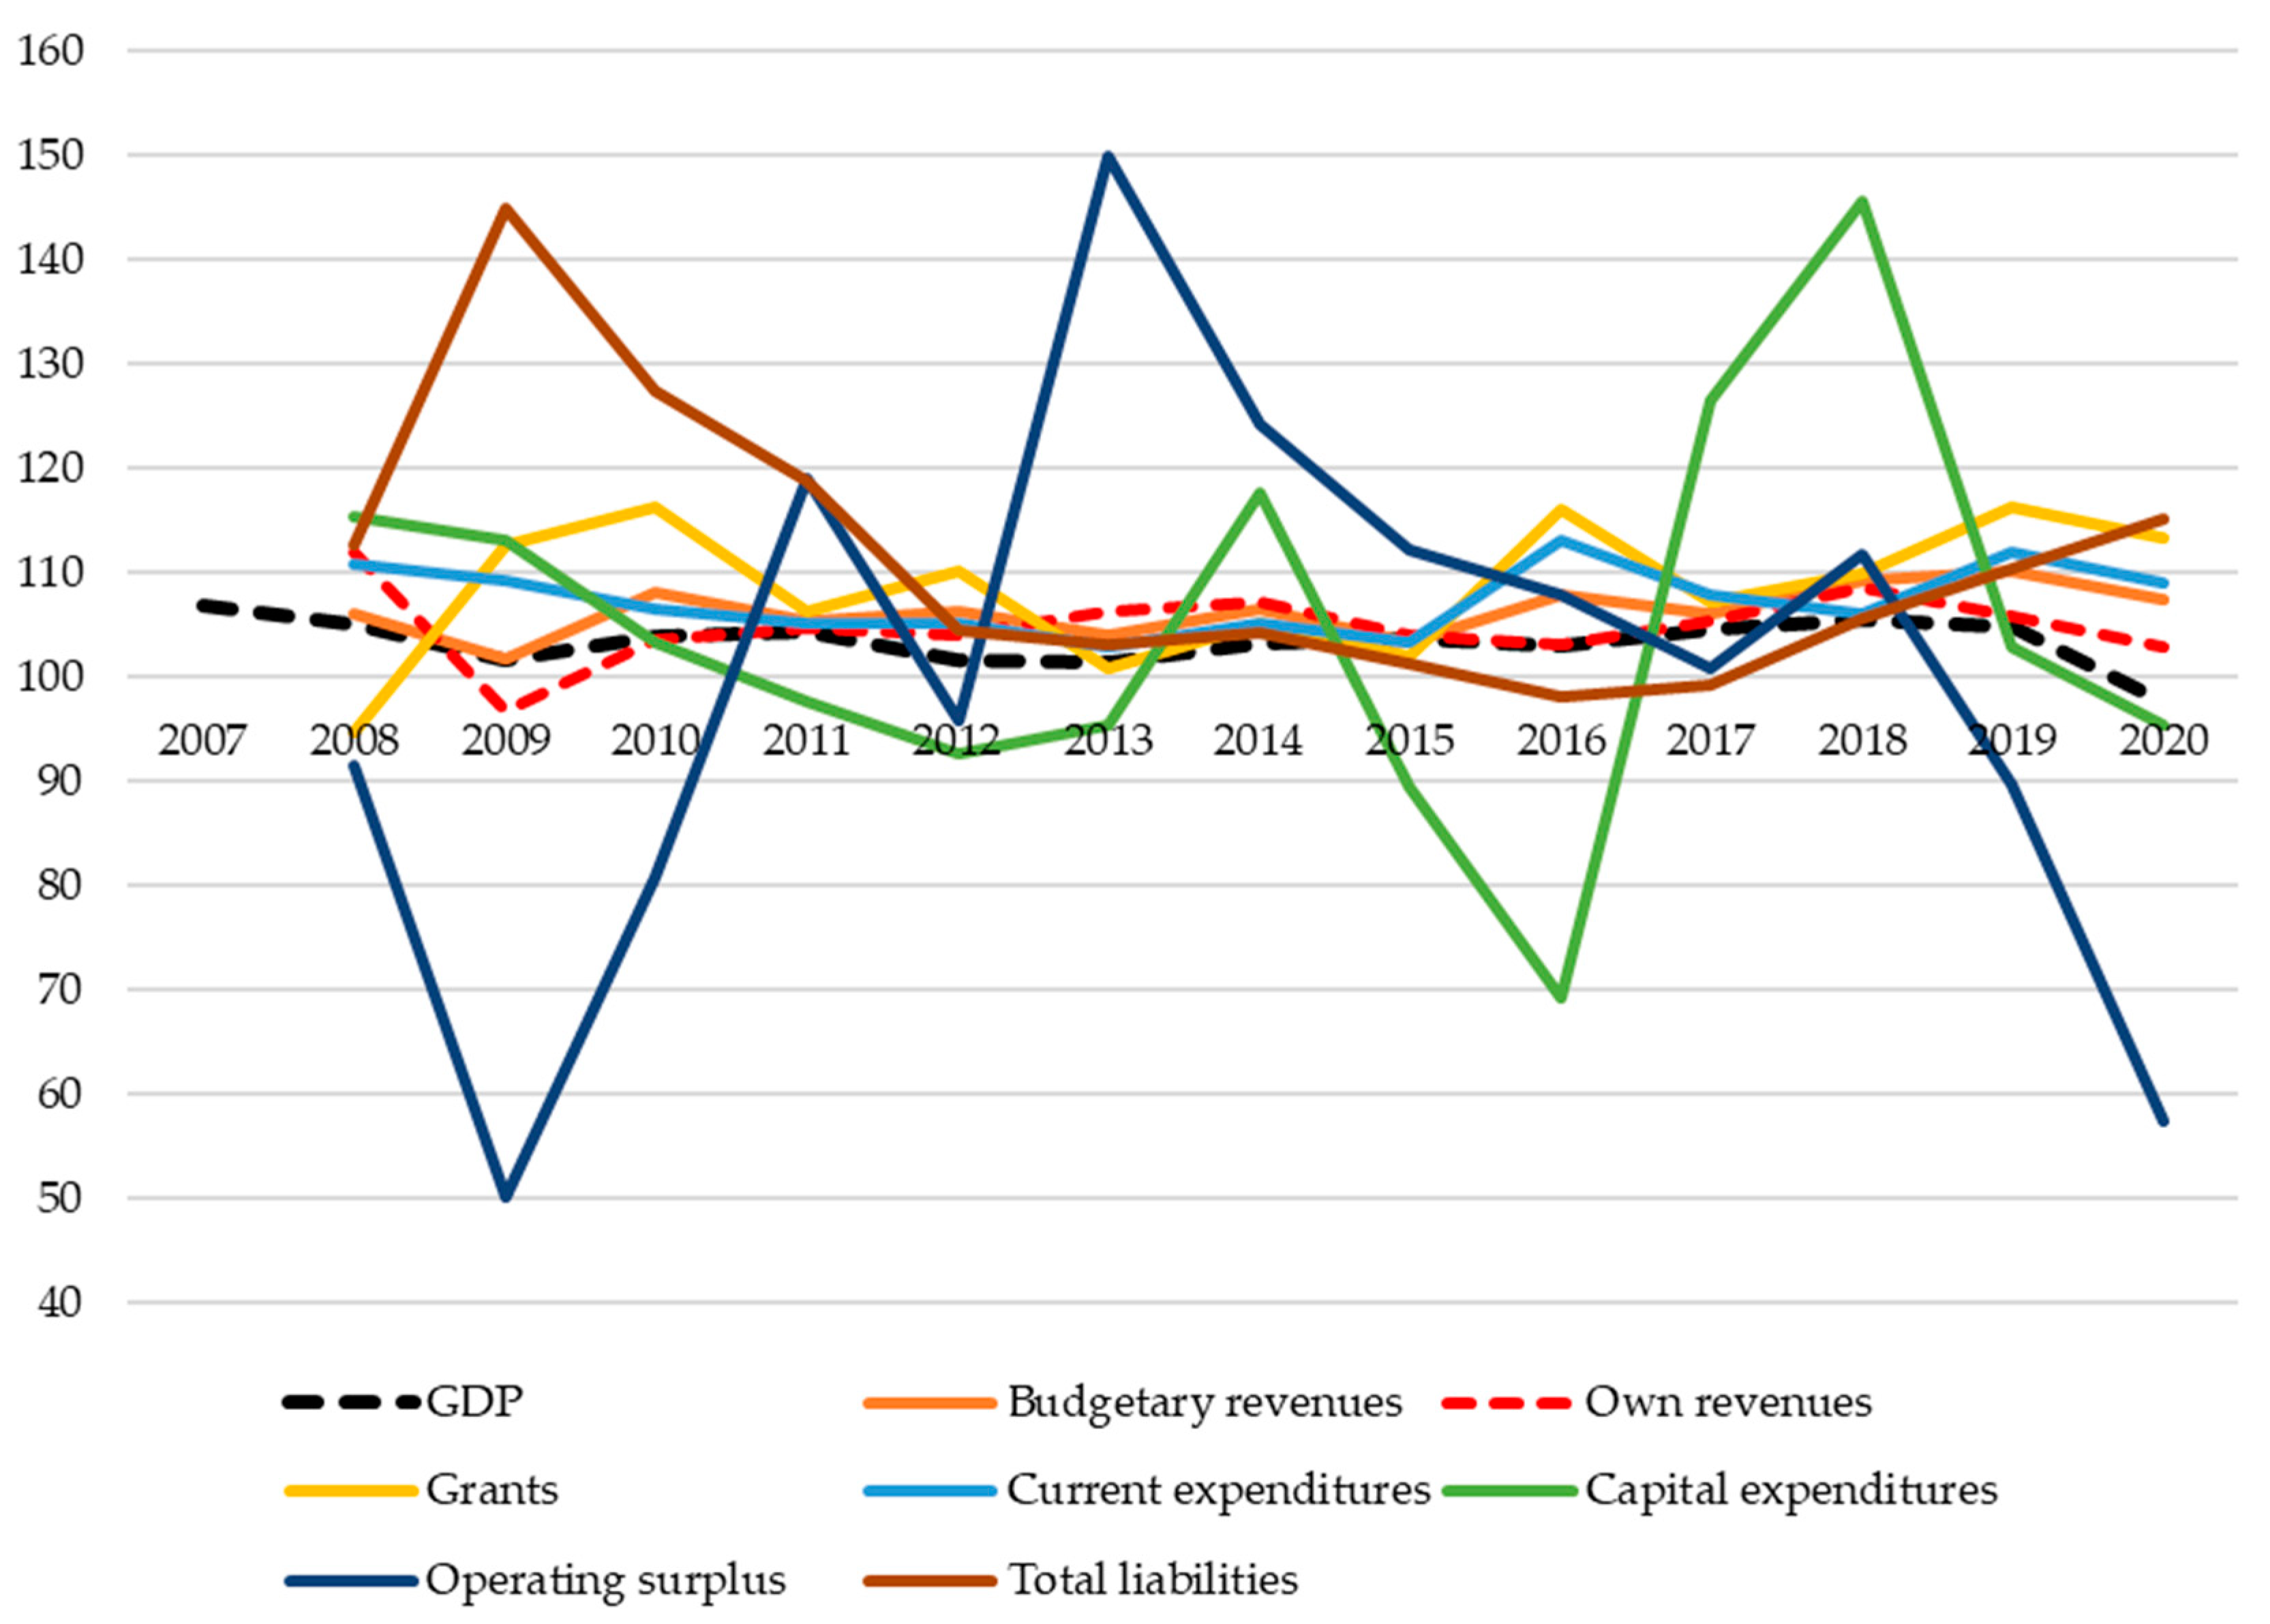
Figure 1 shows the dynamics of the most important budget categories of Polish cities from 2011 to 2020, against the backdrop of GDP growth. To deepen the analysis, the period immediately before the outbreak of the 2008–2009 Great Depression was also taken into account. Economic turbulence was reflected in fluctuations in GDP growth. Economic recession (characterized by negative GDP dynamics) was only faced in 2020, while in 2008–2009, 2012–2013, and 2016 periods of the economic slowdown can be observed. In the case of Croatia, the trend is very similar in the observed budget categories. In the case of GDP, Croatian cities recorded negative dynamics until 2015. Later, the growth was recorded until 2020. For other budget categories, the situation is the same: increase after 2015 (
Figure 2).
The scale of the impact of the business cycle on the financial situation is determined by the elasticity of local incomes and expenditures relative to the changes in the GDP. There are two types of reactions of economic variables to fluctuations in economic growth rates: procyclical (changes in the same direction as GDP) and countercyclical (changes in the opposite direction as GDP) [
36] (p. 163)
Thus, the impact of the business cycle on the financial performance of local government units depends, among other things, on the conditions of (1) the automatic reaction of local government revenues and expenditures to cyclical fluctuations; (2) deliberate anti-crisis fiscal responses of local authorities; and (3) anti-crisis interventions at the central level.
LGUs’ own revenue is considered procyclical [
37]. Under conditions of economic depression, their own revenue declines; this results from a decrease in total demand, production and employment, as well as in the value of fixed assets and the prices of goods and services (this can be important in the case of LGUs that depend on local sales taxes). Lower tax income is influenced by its weaker collection due to tax avoidance [
38].
In the case of local government expenditures, current expenditures and capital expenditures react differently to disturbances. During an economic recession, current expenditure tends to increase, which means that it is countercyclical. Local governments must meet the current needs of residents, and these needs increase at a time of economic slowdown (social assistance and social well-being). In addition, costs for servicing local government debt increase.
The capital expenditure of local government units behaves differently. In times of economic recession, investment cuts are one of the first decisions taken by local authorities facing financial difficulties; this is contrary to Keynes’ recommendations to increase public investment in response to a recession, but it is one of the most obvious decisions; it allows local government units to finance other current needs.
The impact of turbulence on local financial performance is a consequence of the discretionary response strategies of the self-governing authorities. Research by [
39] shows that during the crisis, some local governments tried to actively use fiscal instruments (such as lowering local taxes or providing subsidies for enterprises in difficulty) [
38]. That enables local authorities to mitigate the negative impact of cyclical fluctuations on their budgets.
The scope of the influence of the crisis on local fiscal health also depends on anti-crisis interventions carried out at the central level. Research conducted by [
40] on the example of American states shows that federal earmarked grants for the implementation of the Medicaid program turned out to be procyclical. Refs. [
41,
42] reached similar conclusions and analyzed the shaping of intergovernmental fiscal transfers in Germany.
Sometimes lags in adapting the local financial systems to changes in the external economic environment must also be taken into account; they cause the actual effects of turbulence to be noticeable only after a certain period of time (usually around 1–2 years after the shock has occurred). Among other things, the design is influenced by transfers from the upper level of the government budget (shares in state taxes or general subsidies), which are often calculated on the basis of historical data.
4. Materials and Methods
The specific aim of this article is to identify the financial resilience profiles (patterns) of the largest Polish and Croatian cities from 2010–2020; it is acknowledged that the local internal environment affects cities in forming different responses to external shocks. As such, a method used in behavioral sciences was adapted to public finance to examine different patterns of local strategies of resilience over time. A behavioral approach is taken to local financial management, focusing on the fiscal performance of the cities before and after the disturbances. Group-based trajectory modeling, a method commonly used in behavioral sciences, is introduced to public finance.
The sample is composed of 302 Polish and 127 Croatian cities. The time range of the research covers the years 2010–2020. The choice of cities is justified by their relative homogeneity, particularly in terms of population, tasks carried out and infrastructure resources. Compared to other LGUs, cities have the highest financial autonomy in the management of their expenditures and revenues, allowing them to use fiscal policy to absorb external shocks (at least in part). Furthermore, cities provide a wide range of public services (education, social services, public health care, municipal services: water supply, sewage and waste management, infrastructure: road and transport, municipal housing, environmental protection and job creation), which directly affects their operating balance.
In this article, group-based trajectory modeling (GBTM) was used; this is a specialized application of finite mixture modeling designed to address the problem of the classification of a heterogeneous set of entities into similar groups based on commonality in their behavioral changes over time. Although GBTM is less used in the field of economics, it is a very common technique used in behavioral sciences. The main purpose of the application of the GBTM model is to identify groups of individuals who follow similar trajectories over age or time of a single outcome or behavior [
43,
44]. Rather than prescribing the existence of trajectories of a specific form ex-ante on the basis of an individual trait or traits, the method allows the trajectories to emerge from the data themselves.
The approach proposed has a number of advantages. First, GBTM determines the form and number of groups that best fit the data and provides a metric to evaluate the precision of group assignments. Standard regression analysis is limited to informing theory about how diverse types of entities moderate divergent outcomes. The alternative of constructing different categories through arbitrary division of the data, such as median or quartile splits may be uninformative if the division masks the true types of research objectives that exist within each subsample. Therefore, GBTM is a solution to the limitations of using assignment rules based on inherently subjective categorization criteria. Second, trajectory modeling is a well-established method, with software packages readily available to practitioners [
45,
46,
47,
48]. Third, GBTM is a flexible method that can be applied to both cross-sectional data (single period measurements) and longitudinal data (multiple-period measurements). The most common metric for indexing time is age or year [
49]. Fourth, trajectory analysis is often applied to normally distributed data, but it is also applicable to discrete distributions such as binomial, Poisson, multinomial etc., making this method a useful tool for the exploratory analysis of data sets.
Classification of the financial resilience profiles (patterns) of the largest Polish and Croatian cities is based on their public debt to total revenues (Lr) trajectories A focus is placed on this indicator of financial resilience for two reasons.
First, it must be remembered that nearly all systems of fiscal condition measurement recognize the importance of public debt. Financial resilience is primarily understood through the lens of the long-term solvency of local public authorities. That means the ability of the city’s financial system to service and pay off all debt obligations and recover from shocks that could throw it off the path of sustainable development. The minimum condition for maintaining this capacity is that the growth rate of debt is lower than or equal to the growth rate of total budget revenue. Second, resilience emphasizes the ability to respond to and cope with disturbances. Because of this, the share of public debt in local revenue is a proper measure of resilience, given the role of public debt as a countercyclical tool against external shocks. In times of distress, debt helps maintain the local capability of service provision after an external shock, but during recovery, should be reduced in order to maintain financial resilience.
After the diagnosis of the different membership classes of the cities in Poland and Croatia, factors that contribute to different debt-to-revenue ratio trajectories within each class were then investigated. Included are a set of variables indicating changes in the socioeconomic and financial condition of cities, including population, employment, revenue capacity, fiscal autonomy, financial dependence, investments and operating balance. To identify the main drivers of the patterns of financial resilience over time, a panel data regression has been used. The presumption for using panel models is the possibility of performing a cross-sectional analysis. For this reason, the heterogeneity of entities is a fundamental assumption of this research approach.
Table 1 reports summary statistics of the variables included in the analysis.
5. Empirical Results
In order to characterize the trajectories of the debt-to-revenue ratio (Lr) from 2010–2020 in Polish and Croatian cities, the command traj in Stata 15.1 is used. We compared the Schwarz-Bayesian information criterion for models with two to five distinct groups was compared and it was noted that additional groups improved model fit; it was decided to define four groups as a manageable number of groups, which still show heterogeneity in the trajectories, as shown in
Figure 3 and
Figure 4. Linear trends in the debt-to-revenue ratio do not reflect hypothetical pathways of engineering, ecological or organizational resilience.
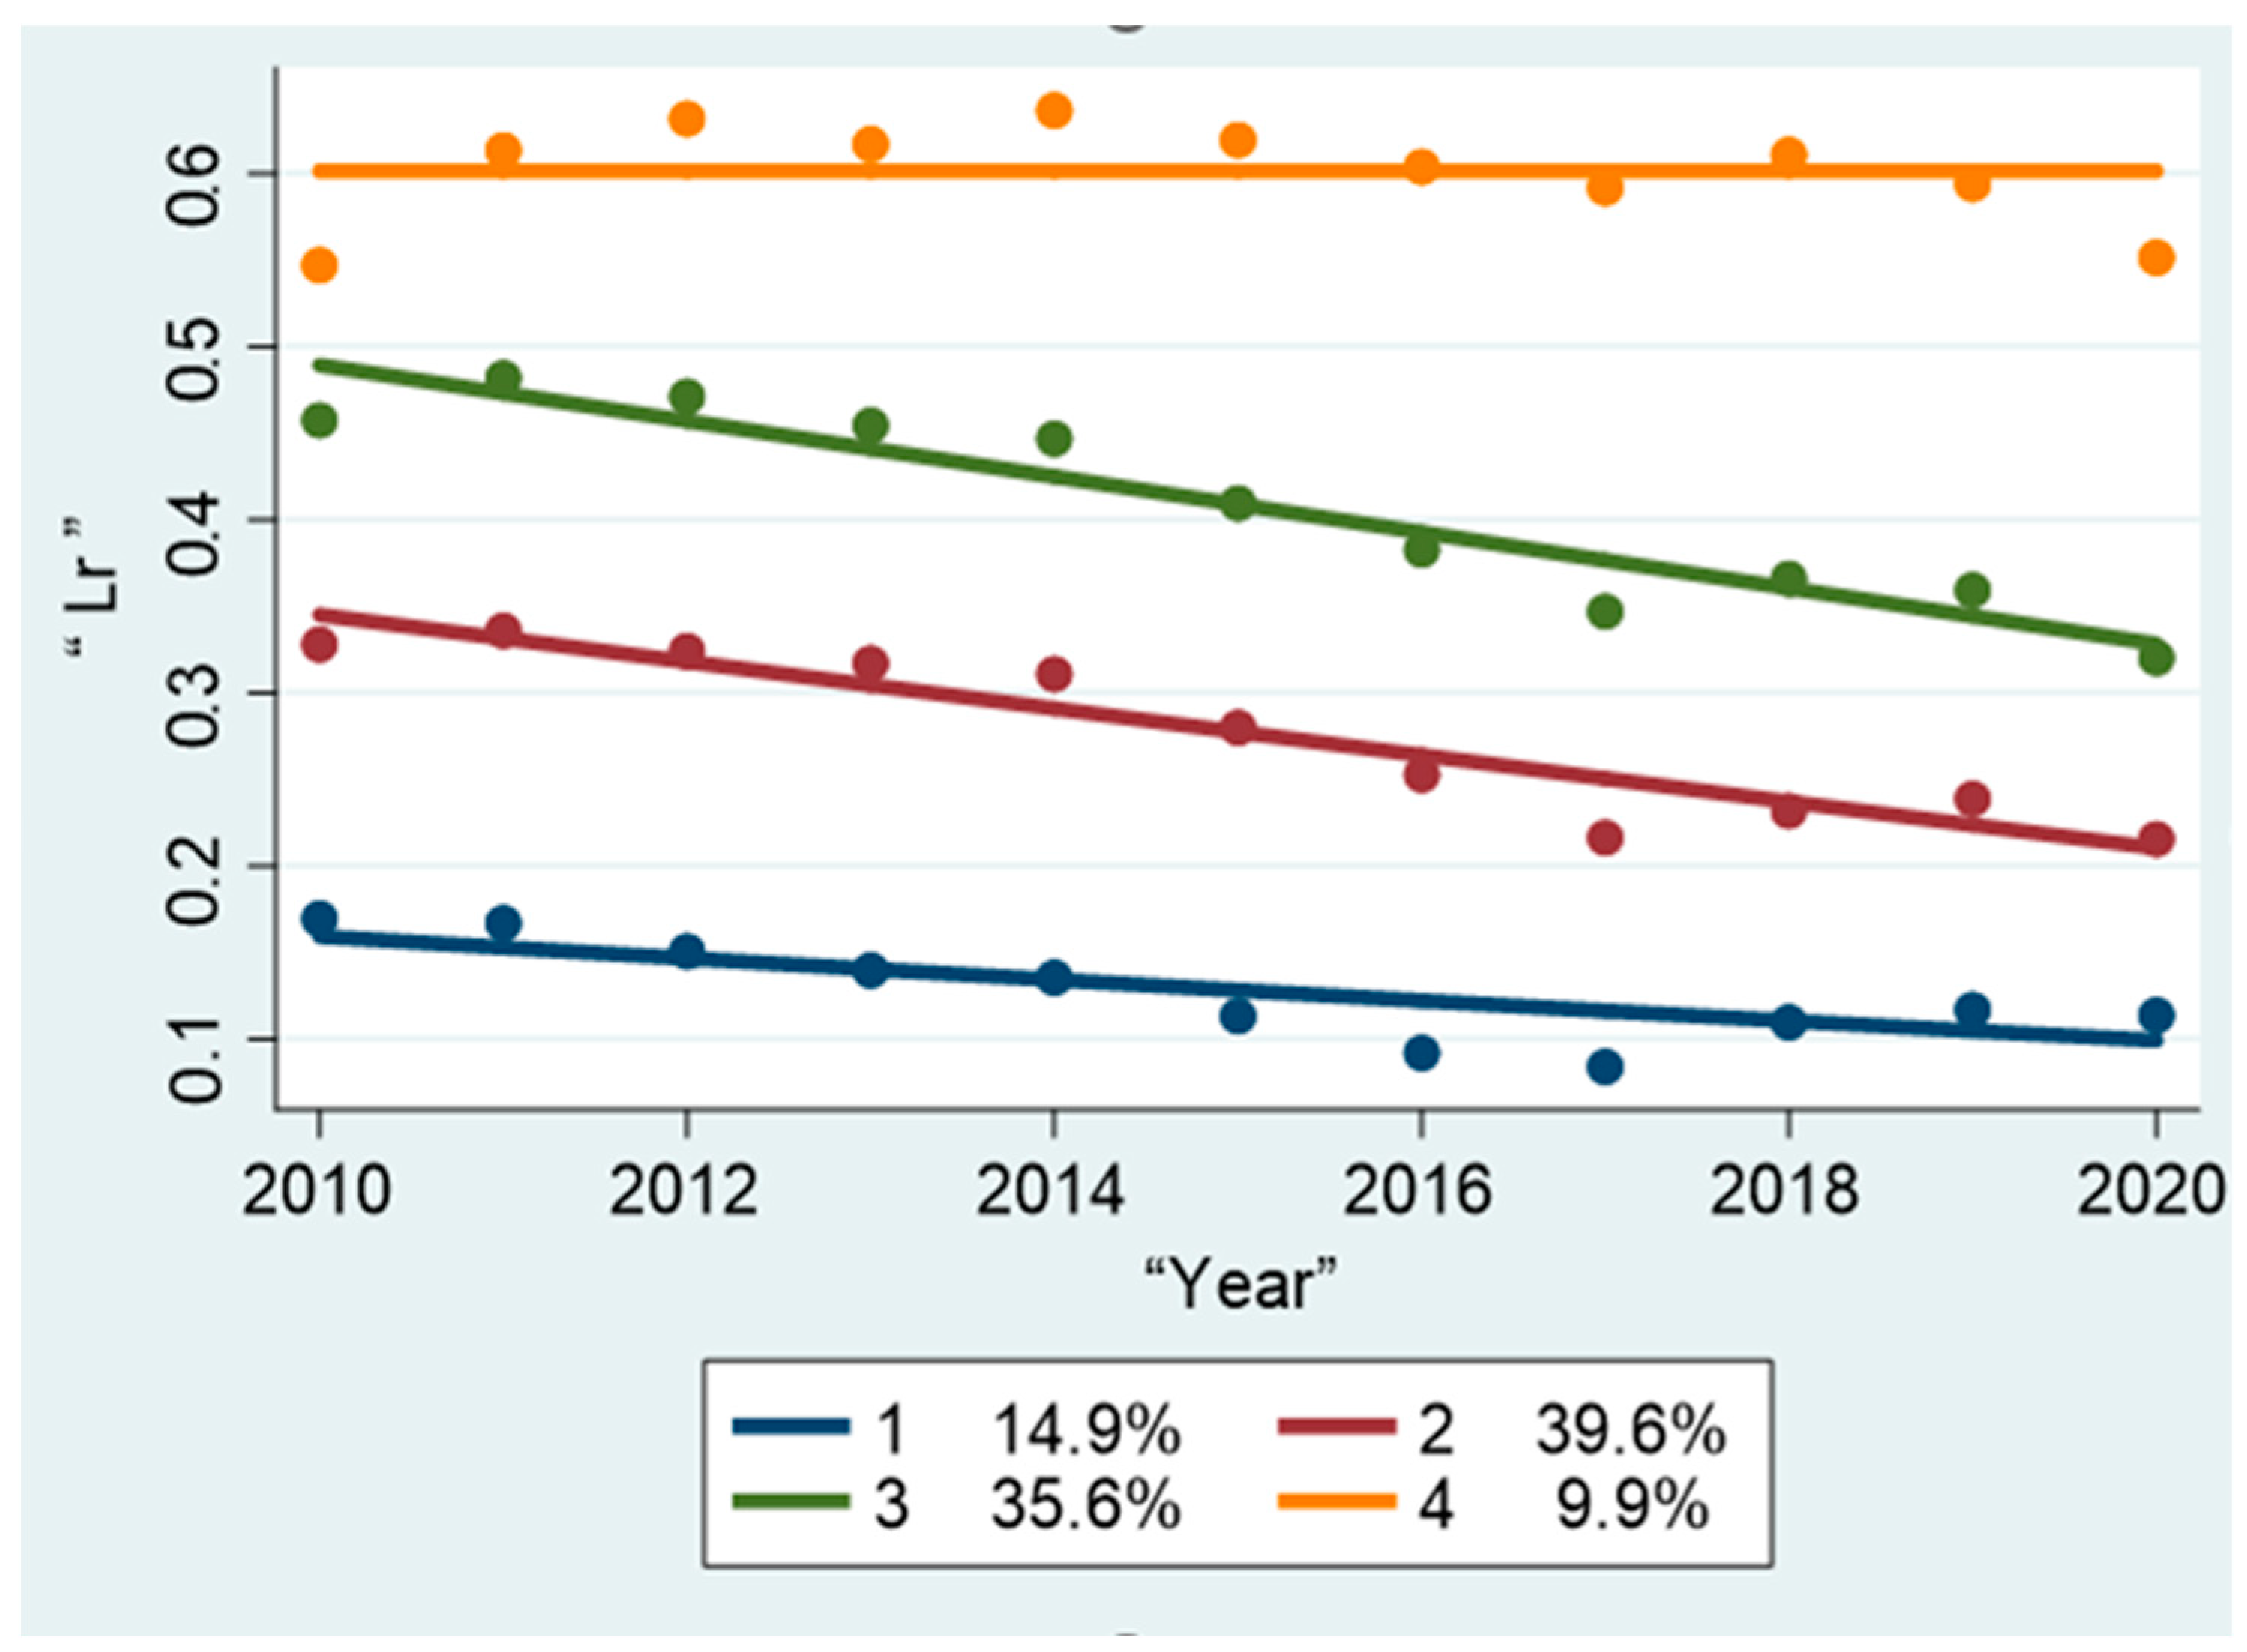
The first model referring to Polish cities had an adequate proportion and sample number in each group: ‘Group 1′ 14.9%, ‘Group 2′ 39.6%, ‘Group 3′ 35.6% and ‘Group 4′ 9.9% (
Figure 3 and
Table 2). The average posterior probability (AvePP) value was 0.94 or more for each group, which is well above the recommended minimum AvePP value of 0.70.
Figure 3 shows the trajectories of the debt-to-revenue ratio (Lr) in Polish cities for these four groups during the 11-year period. The four groups can be interpreted as follows. The first group consists of 14.9% of Polish cities (n = 44). The debt in total income was the lowest at the beginning and maintained its low level throughout the study period. The cities in this category showed a remarkable trend of a decrease in the debt ratio over time. The average Lr in this group dropped from about 16.94% in 2010 to about 11.29% in 2019. The second group of 39.6% of cities (n = 118) was initially characterized by a higher share of debt in revenues than the first group; however, the decrease in the Lr ratio was quite significant, on average, from 32.52% in 2010 to 21.32% in 2020. The third group comprising 35.6% of cities (n = 110) shows a higher share of debt in budget revenues than the first and second groups, but the Lr also seems to decline over time (on average, from 45.64% in 2010 to 32% in 2020). The fourth group (9.9%, n = 30) is made up of municipalities with the highest share of debt in local revenue. Furthermore, in this group, unlike in the previous groups, the Lr indicator increased by an average of 54.56% to more than 66%.
The above-mentioned characteristics basically show that the better the initial financial situation of cities when disturbances occur, the more likely they are to adjust and consolidate the budget as a crisis response strategy. On the other hand, the worse the initial debt situation, the lower budgetary prudence and the greater tendency to increase debt as a response to shock.
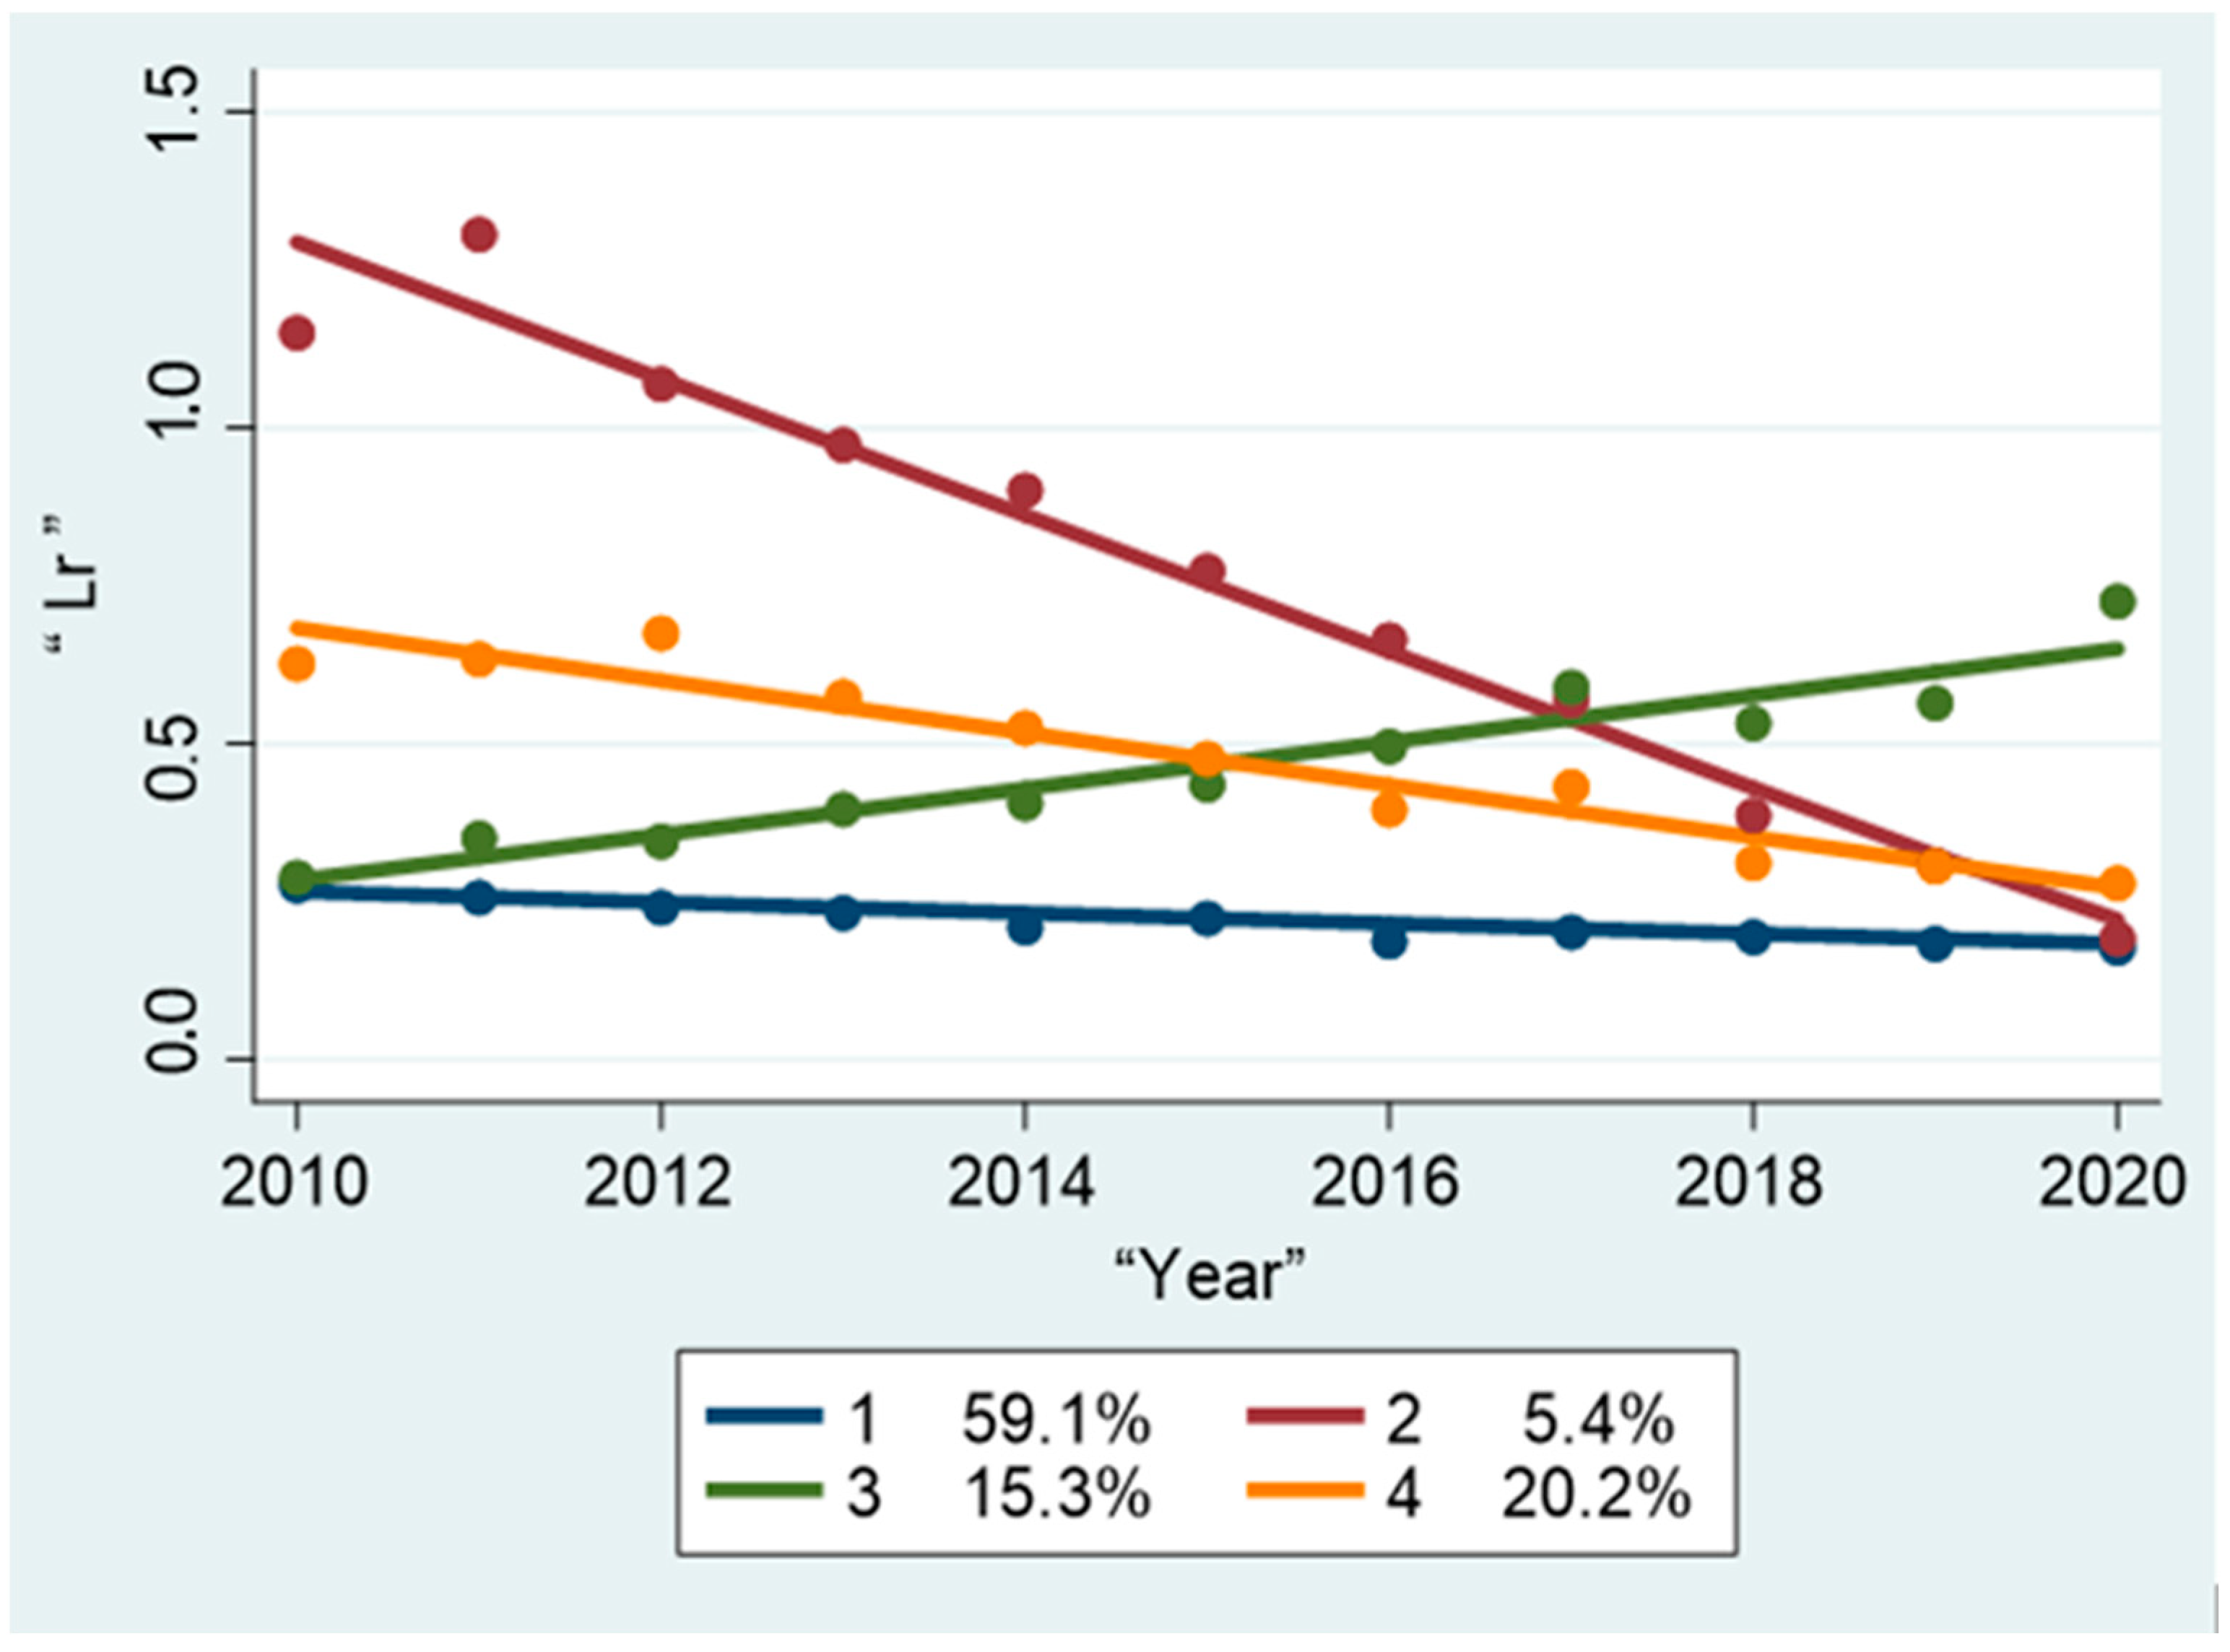
The second model, which refers to Croatian cities, had the following structure: ‘Group 1′ 59.1%, ‘Group 2′ 5.4%, ‘Group 3′ 15.3% and ‘Group 4′ 20.2% (
Figure 4 and
Table 3). The average posterior probability (AvePP) value was 0.94 to 0.98 for each group. In Croatian cities, the situation was slightly different from that in Polish cities. Groups 1 and 3 have similar starting points with the lowest share of debt in total budget revenues. In the case of Group 1, the Lr indicator remains relatively stable with a slight decline. The situation was different in Group 3, where there was a significant approximate 46% increase in the ratio of the debt-to-total revenue. The other two groups, i.e., Group 4 and Group 2, recorded a decrease in debt during 2010–2020; it was the largest in Group 2, where the average Lr ratio fell from about 115% in 2010 to only 20% in 2020; this demonstrates the high efficiency of the public debt reduction strategies implemented in these cities. A reduction in the share of debt in budget revenues could also be observed in the cities in Group 4, from an average of 62% to only 28% in 2020.
The research has revealed different patterns of the financial resilience of cities in Po-land and Croatia; moreover, the scope of fiscal resilience of LGUs differs over time, which made it possible to distinguish groups of cities characterized by similar Lr trajectories over time. The differences in fiscal resilience were significantly smaller in Poland, where all entities generally showed a decrease in the debt-to-revenue ratio over time. On the other hand, in Croatia, the scope of fiscal resilience in the four groups of cities was more diversified, and in some cities, even an increase in the Lr index was noticeable.
In order to examine the main drivers of financial resilience paths in both countries, the factors contributing to the different levels of debt-to-revenue ratios were then investigated.
Table 4 reports the results of the panel data analysis for Poland, and
Table 5 for Croatia. As a baseline model for comparison, a panel regression was first derived that includes all cities from 2010 to 2020, controlling for the fixed effects of the city and year. Separate regression models for groups identified by the GBTM were then run to recognize various determinants for changing the debt-to-revenue ratios between groups.
The inclusion of group-specific and time-dependent effects in panel models requires the use of specific estimation methods. Estimation using the Ordinary Least Squares Method (OLSM) is acceptable if an individual effect does not occur, and then the panel is treated as a set of time-cross-sectional data (the result of the Breusch-Pagan test decides on its occurrence or its lack thereof). In the case of their existence, an appropriate selection between the fixed-effects model (FEM) and the random-effects model (REM) must be made. For that, the Hausman test is used, which examines the occurrence of a correlation between explanatory variables and group effects.
In order to perform an analysis of panel data estimates, the hypothesis of the existence of individual effects was first verified using the Breusch-Pagan test, which indicated the legitimacy of their introduction. Subsequently, using the Hausman test, the fixed-effects model (FEM) was chosen; this was in line with theoretical findings, taking into account that the sample covered almost all (and not only randomly selected) urban municipalities in Poland and Croatia and the research period was relatively short; however, in this model, it may be difficult to select an appropriate estimator due to possible endogeneity. The solution adapted to this type of data is dynamic models based on panel data. The problem of the endogeneity of variables is solved by the appropriate selection of the lags of these variables in the matrix of instruments. More precisely, the models were estimated using the System-Generalized Method of Moments (GMM) estimator, suggested by [
49]. In the literature, this estimator is recommended for models with a small number of time units and a large number of research objects, as in the panel analyzed. To verify the robustness and quality of the model, the Arellano-Bond test (m) was used to address the problem of autocorrelation [
50] and the Sargan test to test over-identifying restrictions to verify that the instruments applied to control the endogeneity are correct. Both tests confirmed the consistency of the model.
For all Polish cities, the most important predictors of debt-to-income ratios are the share of operating surplus in total revenues, total revenues per capita, the ratio of own revenue to total revenues and capital expenditures per capita, but they have opposite effects. The first two determinants have a negative effect on Lr, whereas the latter two have a positive correlation with this indicator. A higher percentage of operating surpluses in total revenues would lead to a lower debt-to-revenue ratio. The same relationship applies to total revenues per capita; it is quite understandable because the increased ability to generate surpluses in the current budget and, above all, the revenue capacity reduce demand for debt capital. In comparison, the growth of capital expenditures per capita would lead to an increase in the debt-to-revenue ratio; it is surprising that the debt-to-revenue ratio may also be determined by the increase in the percentage of own revenues. On the basis of all of the above, it can be concluded that an increase in per capita revenues only leads to a reduction in debt if its source is revenue other than its own (i.e., transfers from the state budget).
Once separate models for the groups identified by growth mixture modeling (GBTM) were run, essentially, the same determinants for the change in the debt-to-revenue ratio between groups were identified, although the strength of their impact was different.
Compared to all cities, cities in Group 1 are particularly vulnerable to capital expenditure changes, while operational surpluses and total revenues have a much smaller impact on the debt-to-revenue ratio. Group 1 consists of cities with the best financial situation at the beginning; these entities have remained resilient to disruptions mainly due to adjustment strategies, which consist of investment cuts.
In Group 2 (with a higher initial average public debt), unlike other cities, a statistically significant variable was the size of the city (population). A lower population would lead to a lower debt-to-revenue ratio. Smaller cities are able to better satisfy the demands of citizens, thus limiting borrowing needs. In addition, the costs of public services are U-shaped, so in large cities, they will rise; this is influenced, among other things, by the problems that accompany large-scale operations, such as bureaucracy, management difficulties and the increase in transaction costs. In Group 2, shock adaptation strategies included a more balanced use of both expenditure instruments (investment cuts) and resource instruments (increase in per capita income and collection of operating surpluses).
In Group 3, the decrease in the debt-to-income ratio was mainly due to the accumulation of operating surpluses, while the capacity of the own revenues was reduced; this group of cities seems to remain resilient, mainly through means other than their own revenues, like subsidies from the central government.
In this context, it seems interesting to identify the determinants of financial resilience in Group 4-the only one where the debt-to-revenue ratio increased; it should be noted that there is a significant impact of the number of people in employment on the growth of the debt; it must be pointed out that, in Polish official public statistics, employment data only concern entities with ten or more employees. Consequently, in small towns where micro-enterprises play an important role, the number of people employed will be underestimated, whereas in larger cities, it will be exaggerated. Considering the fact that the largest cities in Poland are also the cities with the highest public debt, this can explain the positive correlation between employment and the debt-to-revenue ratio. In Group 4, the main driver of public debt was the decline in total revenues and operating surpluses. Group 4 also had the worst initial financial situation in terms of debt.
In the case of Croatia, in the model for all cities, the same predictors as for all Polish cities were identified, with the impact of total revenue per capita and capital expenditure being stronger than in Poland.
In Croatia, in Groups 1, 2 and 4, the debt-to-revenue ratio declined during the analysis period, indicating that fiscal resilience remained.
In the most numerous Group 1 with the best initial financial condition, the main factors determining the Lr were the same predictors as in all Croatian cities, but their influence was less. Furthermore, cities in Group 1 are particularly more vulnerable to the number of people in employment.
In cities from the least number of Group 2, the reduction in the number of employees was the only predictor of a decline in the debt-to-revenue ratio; these cities experienced the largest decrease in debt from 2010 to 2020, despite the fact that it was the highest in 2010; it is surprising that the financial variables that determine the financial resilience in all cities do not affect the Lr in Group 2; this may suggest that the greatest resilience of these cities was not caused so much by factors related to the fiscal policy implemented, but rather by macroeconomic conditions independent of local authorities. Perhaps this was due to the fact that the deterioration of the labor market and the expected decline in local revenues prompted local authorities to repay their debts sooner, fearing the deterioration of their already poor financial situation in the future.
However, in Group 4, the most important predictors of a decrease in the debt-to-revenue ratio were an increase in total revenue per capita and a decrease in capital expenditure. The influence of these variables was almost twice as great as in all Croatian cities. The response strategies adopted by these cities during turbulent periods were effective, as they reduced the Lr by half on average.
Group 3 was the only category of cities that experienced an increase in debt. The increase in the Lr ratio in these cities was primarily due to investment expenditure, as other variables did not play an important role there.
When comparing Polish and Croatian cities, Croatian cities were characterized by a much higher average debt-to-revenue ratio. In the face of emerging turbulence, their poor initial financial health has led to increased pressure to take specific adjustment measures. Polish cities had a lower Lr at the beginning of the study. The fiscal adjustments they made were generally effective, since they caused almost all cities to experience a decrease in the debt-to-income ratio; however, compared to the Croatian cities, in Poland, the extent of the Lr decline was generally lower and more uniform among the groups of cities.
In both the Polish and Croatian cities, common predictors of fiscal resilience were distinguished, i.e., the share of operating surplus in total revenues, total revenues per capita and capital expenditures per capita. In the case of Croatian cities, the percentage of their own revenue was insignificant, and the operating surplus also played a smaller role; this research has shown that the source of differences in LGUs’ financial resilience is not as much the nature and intensity of the disturbances experienced as the internal financial capacity.
6. Discussion
The financial and especially fiscal resilience of local government units in Poland and Croatia has been a serious concern after the financial crisis in 2008 and the COVID-19 pandemic. Based on the results of comparative studies that observed local government units in the US, Italy and the UK, it can be concluded that local governments react differently to shocks; this was the case of English local governments in the aftermath of COVID-19. In addition, lower financial resilience is noted in the municipalities of Italy (island and continental) compared to the central-north municipalities. Therefore, it can be concluded that the vulnerability of the Italian public finance system of local governments depends mainly on the concept of financial resilience. Therefore, our objective was to analyze the financial resilience of local government units, that is, cities in Poland and Croatia, as well as to identify the factors that influence financial resilience. The results of the empirical analysis support the hypothesis that the financial resilience of local government units, i.e., cities in Poland and Croatia, as well as determinants of resilience behave differently in both countries; moreover, an interesting fact is that the behavior of local government units within one country is different according to the empirical results of the group membership (4). In this way, the empirical results strongly justify the need for response budget planning that should be established beyond the local level. Nevertheless, the comparison between Polish and Croatian large cities reveals that Polish cities are much better prepared and have stronger financial health to react to different shocks than Croatian cities.
7. Conclusions
This article is the first pioneering attempt to analyze the concept of the financial resilience of local government units, i.e., cities in Poland and Croatia. In order to estimate the degree and to identify the factors that have an influence on financial resilience, a two-stage research procedure has been applied–group-based trajectory modeling and panel data regression. For the period analyzed, which was characterized by two turbulent times, that is, the financial crisis and the COVID-19 pandemic, the analysis showed interesting results. In each country, the groups (4) of local government units behave differently when faced with shocks, i.e., the financial crisis and the COVID-19 pandemic. Nevertheless, we can conclude that local government units in both countries need to have better budget planning and financial health in turbulent times, which should be established beyond the local level. The findings provide new evidence to the existing literature addressing the financial resilience of local government units. The findings will be beneficial not only for academic experts, but also for policymakers. Therefore, the recommendation for policymakers is to ponder how they can strengthen institutions and financial resilience to be ready for internal or external shocks. Therefore, special emphasis should be placed on the financial health of local government units towards financial and fiscal resilience. As a consequence, this will surely improve the financial sustainability of central and local governments, as well as the relationship with various central government departments.
As the article offers new and interesting insights regarding the financial resilience of local government units, there are also some limitations. First, the research period is restricted to 2010–2020, so one direction for future research is to extend the research period as well as the future budget projections; this will provide additional empirical evidence for a longer time period with included budget projections. The second limitation is very closely connected with the first one; it refers to the research methods adopted. Therefore, the use of novel econometric approaches, i.e., quantile panel regression for a longer research period would be very useful. Accordingly, a direction for future research would be to examine the behavior of other local government units in each EU country separately and then make a comparison with this research.


