Article

Can Coordinated Development of Manufacturing and Information Communication Service Industries Boost Economic Resilience? An Empirical Study Based on China’s Provinces

1
School of Management, Tianjin University of Technology, Tianjin 300384, China
2
College of Management and Economics, Tianjin University, Tianjin 300072, China
*
Author to whom correspondence should be addressed.
Sustainability 2022, 14(17), 10758; https://doi.org/10.3390/su141710758
Submission received: 22 July 2022 / Revised: 19 August 2022 / Accepted: 22 August 2022 / Published: 29 August 2022
(This article belongs to the Special Issue Contemporary Issues in Applied Economics and Sustainability)

Abstract

:
Information and communication technology has supported industrial digitalization and brought profound changes to many industries. Under the influence of new technologies and applications, the production mode, enterprise form, business mode and employment mode of manufacturing have accelerated reform, which has effectively promoted the production efficiency and green development of manufacturing. In the face of the complicated and severe economic situation and the wave of industrial digitalization in the world today, it is necessary to study the influence of the coordinated development of manufacturing and information communication service industries (M&ICS industries) on economic resilience. Based on the data of China’s 30 provinces during 2010–2020, this paper estimates the economic resilience and the degree of coordinated development of M&ICS industries. Next, based on the setting of two spatial weight matrices, it uses a spatial econometric model to systematically analyze the influence of the coordinated development of M&ICS industries on economic resilience across China’s provinces. The research results show that the economic resilience across China’s provinces had significant positive spatial correlation. Moreover, the coordination between M&ICS industries had a significant positive effect on economic resilience; however, such an effect was concentrated mostly locally, and the spillover effect on surrounding regions was negative and nonsignificant. This study is of vital strategic significance and practical value to promoting both the resilience of the regional economy and the digital transformation of manufacturing.

1. Introduction

Over recent years, trade wars have broken out frequently in the intricate international situation. After getting into the “new normal”, China’s economy has presented the characteristics of structural slowdown. The outbreak of COVID-19 has even had a negative impact on the economy. Whether the economy can regain stability and sustained growth rapidly after suffering from the interference of external factors is a huge test on the economic resilience in all regions of China [1,2,3]. Regional economic resilience is not just the capability to deal with a shock once, but also the long-term adaptability to omnipresent uncertain risks [4,5,6]. Therefore, how to improve regional economic resilience has become an important issue. With the development of science and technology and the deepening of economic services, industrial synergy has appeared in many industrial fields [7]. Industrial synergy has brought new impetus to industrial development and economic growth, and has increasingly become an important factor to improve industrial competitiveness and regional economic resilience [8].
According to the statistics of China’s Ministry of Industry and Information Technology, the value added by manufacturing was CNY 31.4 trillion in 2021, accounting for 27.4% of the GDP, ranking first among the eighteen sectors and far higher than the second in China. In addition, the manufacturing sector can provide advanced equipment for almost all sectors in the national economy. Hence, as one of the most important real economies of China, manufacturing has played a key role in stabilizing the national economic resilience and aroused the special attention of the Chinese government. However, China’s manufacturing industry is currently facing some burning issues. For example, most manufacturing enterprises remain situated at the bottom of the value chain, less competent in independent innovation, lacking in core competitiveness, and enslaved to foreign countries in numerous key domains. Meanwhile, with the increase in human resource cost and environmental cost, the profitability of China’s manufacturing industry is far worse than before, needing the exploration of new development paths. The digital economy is rising worldwide as a novel economic form. All governments have promoted relevant policies in succession to accelerate the development of the digital economy, seek new economic growth points, and advance the sustained, sound development of the national economy [9]. According to the “White Book on China’s Digital Economy (2021)”, the scale of the digital economy has reached a proportion of 1/3 of China’s GDP. The information communication service industry (ICS industry) is a specialized sector providing service activities for all realms of the national economy using information communication technologies. With the wide application of 5th Generation Mobile Communication Technology (5G), Internet of Things (IoT), artificial intelligence (AI), blockchain, cloud computing and other new-generation information communication technologies, the ICS industry is playing an increasingly important role in the social economy, acting as a key driver and supporter for the digital transformation of manufacturing [10,11,12]. Wide, deep integration and application of information communication technologies in manufacturing will be boosted, and new models such as personalized customization, intelligent production, and targeted service will be created to realize the digitalization of essential productive factors, processes, and products of manufacturing enterprises, thereby accelerating the development of industrial digitalization [13,14,15]; meanwhile, the digitalization development of manufacturing enriches the variety of information communication services, presents higher requirements on the quality of information communication services, and deepens and widens the R&D innovation, integration, and penetration of the ICS industry, thereby accelerating the development of digital industrialization [16]. Evidently, the ICS industry system and the manufacturing industry system interplay via the mutual promotion arising from their respective coupling elements, hence a coupling effect is achieved between the two systems [17]. Under this background, this paper explores the impact of the synergy between M&ICS industries on regional economic resilience from the analytic perspective of coordinated development between M&ICS industries.
Economic resilience is a significant use of the resilience notion in the economic field [18]. The application of the concept to the regional economy has raised a series of significant questions about the performance and dynamics of local economies in times of risks [19]. Since Simmie and Martin [6] first put forward the conceptual framework of regional economic resilience from an evolutionary theoretical perspective in 2010, increasingly more scholars have begun to pay attention to this concept. Studies can be categorized mainly into theories on regional economic resilience, measurement and evaluation of regional economic resilience, development and evolution of regional economic resilience, and the influencing factors of regional economic resilience, etc. Existing studies on the influencing factors of regional economic resilience are mainly concerned with the economic structure, enterprises, and ecosphere, relating industrial structure [4,20], government intervention [21,22], financial system and social capital [23,24], talent resources and entrepreneurship [16,25], innovation capability [16,26], climate change [27] and other specific factors; few studies have explored the impacts of these factors on economic resilience from the perspective of industrial synergy. The study in this paper enriches the relevant literature on the influencing factors of regional economic resilience from the perspective of industrial synergy. Additionally, existing studies are mainly concentrated on the synergy or integration between manufacturing and productive service industries or other sectors [28,29,30]; little of the literature has specifically investigated the coordinated development of M&ICS industries. Overall, the main contributions of this article include the following aspects: Firstly, the relevant research gap is bridged by exploring the impact of the coordination between M&ICS industries on regional economic resilience. Secondly, the influencing factors of regional economic resilience and the spatial effect is further developed in this study.
The remaining parts of the paper are organized as follows: Section 2 performs a theoretical analysis and raises some hypotheses; Section 3 presents the research design, including the research model setting, selection of variables, and data sources; Section 4 presents the results and analysis, beginning with a brief analysis on the level of economic resilience across China’s provinces and the level of synergy between M&ICS industries, followed by a selective analysis of the empirical consequence of the synergy between M&ICS industries on economic resilience; Section 5 summarizes this study and raises suggestions against the conclusions.

2. Theoretical Analysis and Research Hypotheses

2.1. Synergy between M&ICS Industries versus Regional Economic Resilience

Martin et al. [18,19] summarized a relatively complete definition of economic resilience based on a systematic summary of relevant literature, that is, economic resilience is the identification and explanation of how regions and localities have responded to shocks, which mainly includes the following four dimensions: vulnerability, resistance, adaptability, and restorability. This definition has been adopted by many scholars, such as Nystrom [31], and Doran and Fingleton [32]. Based on previous empirical studies, we know that there are many factors affecting regional economic resilience. However, a series of literature on strengthening regional economic resilience were only based on the concept of economic resilience. In contrast to previous studies, this paper focuses on industrial synergy. Based upon the literature review and the foregoing discussion on regional economic resilience, the mechanism of how the synergy between M&ICS industries influences regional economic resilience is analyzed in three aspects: industrial structure, innovation capability, and employment/entrepreneurship.
The synergy between M&ICS industries can have a positive effect on economic resilience by promoting the upgrade of industrial structures. The ICS industry features informatization, digitalization, and high technology. Its synergy with such industrial entities as manufacturing promotes the digitalization and intellectualization of manufacturing processes and advances the improvement in production models [33,34,35]. Meanwhile, the digitalization upgrade of manufacturing boosts the industrialization of the ICS industry and extremely enriches the industrial structure [36]. The upgrade of industrial structures can transfer essential productive factors from low-productivity departments to higher-productivity ones, forming new growth impetus mechanisms and growth points, thereby boosting the overall efficiency of resource allocation [37] within, as well as the sustainability and stability of, the economy.
The synergy between M&ICS industries can have a positive effect on economic resilience by promoting innovation capability. First, the synergy between M&ICS industries has given continual rise to new models and business types, creating a pressure that urges enterprises to expedite technological innovation. Second, the synergy between M&ICS industries is beneficial to the free flow of innovation knowledge within industry, advancing the rapid popularization of innovative applications and lowering the risk of technological innovation, thereby effectively boosting innovation efficiency [38,39]. Meanwhile, with the concentration of innovation resources, communication among all innovative subjects and between the innovative subject and consumers within a region is beneficial for innovative subjects implementing collaborative innovation and making up for the weaknesses of innovation, thereby improving regional innovation capabilities. Economic geographers have attached a growing importance to innovation in the dynamic evolution of the regional economy, arguing that new productive activities are more likely to occur in regions with a stronger innovation capability and thus boost economic recovery after the regional economy has suffered from an external shock, so that these regions can get rid of the adverse impact due to the external shock [40].
The synergy between M&ICS industries can have a positive effect on economic resilience by promoting employment and entrepreneurship. Due to the high R&D input, high innovativeness and other features of the ICS industry, a large number of top talents can be attracted into the manufacturing industry, which is conducive to stimulating regional entrepreneurial activity [41]. Meanwhile, the synergy between M&ICS industries has given rise to many new models and business types, created many entrepreneurial opportunities, and widened the channels of employment. To some extent, the higher the social entrepreneurial activity, the more flexible the employment of social members, and the stronger the ability of the regional economy to resist external shocks [42].
Based on the above analysis, the following hypothesis is raised.
Hypothesis 1 (H1).
The synergy between M&ICS industries can promote regional economic resilience.

2.2. Spatial Spillover Effect of the Synergy between M&ICS Industries

The development in information communication technologies has caused a profound transformation to the spatial distribution characteristics and evolution impetus mechanisms for commercial activities, widening and deepening inter-regional economic activities [43]. This can significantly boost the overall efficiency of the industrial chain, effectively enhance the relevancy between manufacturing and upstream–downstream industries [34], and, especially in the industrial integration process, realize cross-regional flow of essential productive factors by means of the introduction, assimilation, and diffusion of new technologies [44]. Not limited to the interior of a region, therefore, the impacts brought about by the coordinated development of M&ICS industries may reach the surrounding areas via cross-regional knowledge and technology spillovers. Furthermore, the concentration of M&ICS industries can lead to a spillover effect of external economies of scale and knowledge and to a recombination effect of essential factors [45]. Still, the concentration of M&ICS industries can effectively lower the costs of logistic transportation, industrial transaction and information gathering, and strengthen inter-regional economic cooperation and exchange, and the stability of the regional economy [46]. Based on the above analysis, the following hypothesis is raised, given that the synergy between M&ICS industries may also have a spatial spillover effect.
Hypothesis 2 (H2).
The synergy between M&ICS industries can enhance the economic resilience in adjacent regions via spatial spillover.

3. Research Design

3.1. Method of Estimating the Level of Synergy between M&ICS Industries

For the measurement of synergy between two systems, this paper uses the coupling coordination degree to measure the level of synergy between the two industries by building the following model: Formula (1) is about the coupling degree (CD) between industries; Formula (2) is about the canonical correlation analysis (CCA); Formula (3) is about the harmonic index of the comprehensive development level (CDL); and Formula (4) is about the coupling coordination degree (CCD) between M&ICS industries.
C D = 2 j = 1 P w j × P i j × j = 1 q w j × Q i j j = 1 P w j × P i j + j = 1 q w j × Q i j , M j = X i j m i n X j m a x X j m i n X j
ρ = max a , b Corr u , v , u = a T P i j , v = b T Q i j
C D L = γ j = 1 p M × P i j + δ j = 1 q M j × Q i j
C C D = C D × C D L
where Mj denotes the weight of each index; Xij denotes the value of sample i under the index j of the manufacturing or ICS industry; max Xj and min Xj represent the maximum and minimum, respectively, among the indexes of M&ICS industries; Pij and Qij represent the values through standardized treatment in M&ICS industries; p and q correspond to the numbers of indexes of M&ICS industries, respectively; ρ denotes the correlation between u and v and represents the maximum; a T and b T are basis vectors; γ and δ are undetermined coefficients (γ + δ = 1), reflecting the degrees of the contribution of the manufacturing industry and of the ICS industry, respectively, to the integrated system’s coupling synergy. To avoid the influence of subjective human factors, the study adopts canonical correlation analysis to estimate the undetermined coefficients γ and δ according to the determined objective data [47], and γ is 0.425 and δ is 0.575.

3.2. Construction of Spatial Durbin Model (SDM)

The SDM constructed here is formulated as below:
R e s i t = α + ρ W R e s i t + β 1 I n d i t + β 2 X i t + θ W X i t + μ i + ν t + ε i t
where i indicates the region; t denotes the year; W is a spatial weight matrix; α is a constant term; Res denotes the level of regional economic resilience; Ind denotes the level of synergy between M&ICS industries; X is a series control variable; β1 and β2 are elastic coefficients; ρ is an autoregressive coefficient; μi and νt represent the individual and temporal fixed effects, respectively; εit is a random disturbance term.
Additionally, while performing the spatial correlation test and spatial quantitative analysis, this paper makes simultaneous use of the geographical distance matrix W1 and the economic distance matrix W2 constructed in Formulas (6) and (7) as spatial weight matrices to ensure the reliability of the research conclusion, where d is the distance between two provincial capitals, PGDP is the provincial GDP per capita, and i and j are two distinct regions.
W 1 = 1 d i j 2 , i j 0 , i = j
W 2 = 1 P G D P j P G D P i , i j 0 , i = j

3.3. Description of Data and Variables

3.3.1. Explained Variable

The level of economic resilience across China’s provinces (Res) is evaluated as the explained variable. The existing literature mainly adopts the core variable method while measuring economic resilience. Despite the advantages of this method, such as easiness of implementation, it overlooks the marginal contribution from other variables of the economic system, and the comprehensive evaluation system is more coincident with the multiple characteristics and attributes of economic resilience. Referring to Martin [3], Cellini [22], and Liu [48], etc., this study builds a comprehensive evaluation system for economic resilience, as shown in Table 1, in four dimensions: vulnerability, resistance, adaptability, and restorability, according to the data available at the level of China’s provinces. Further, it employs the entropy method for weighting estimation to derive the level of economic resilience across China’s provinces.

3.3.2. Core Explanatory Variable

Based on the foregoing Formulas (1)–(3), the level of synergy between M&ICS industries (Ind) is evaluated as a core explanatory variable by estimating the coupling coordination degree between M&ICS industries. While taking overall examples from Tang [30] and Wu et al. [49], this paper selects the evaluation indexes of industrial synergy from the perspectives of development scale and development potential (Table 2).

3.3.3. Control Variables

Based upon the preceding literature review and theoretical analysis, this study selects the following control variables.
The proportion of government fiscal expenditure over GDP is selected as a measurement index of government intervention (Gov). Government can offer effective assistance for economies suffering from external fluctuations to get through hardship by means of financial aid or tax exemptions/reductions; however, excessive intervention may affect the proper allocation of market resources and lower the efficiency of resource utilization.
The proportion of total export–import volume over GDP is selected as a measurement index of market openness (Mar). Against the background of economic globalization, the degree of market openness affects the development of regional economies. Meanwhile, the higher the degree of market openness, the stronger the relevancy between the regional economy and international market, and the more susceptible the regional economy to the external economy.
R&D expenditure is selected as a measurement index of the innovation environment (Inn). In areas with a more favorable innovation environment, enterprises have higher initiatives in innovation and are more ready to undergo technological upgrades to enhance corporate strength.
The ratio of the balance of deposits to the balance of loans of financial institutions is used to measure the financial level (Fin). A favorable environment for financial development can not only lend strong financial support for real economies, but also effectively alleviate the impact of external shocks on the economy and regulate economic activities in an orderly manner.
The number of college students per 10 thousand people is selected as a measurement index of personnel resources (Per), a key competitive edge for a region.

3.4. Data Sources

According to the connotation of the ICS industry and the Chinese government’s current statistical caliber, the data of the ICS industry in this study originate from the information transmission, software, and information technology service industries, including three major categories of industries: telecommunications, radio and TV and satellite transmission services, internet and related services, and the software and information technology service industry. Data estimation is based on the panel data from the 30 provincial regions (excluding Tibet, which is beyond the research scope due to incomplete statistics) of mainland China during 2010–2020. Furthermore, the fixed-asset deflator of each province with 2010 as the base period is adopted to deflate the fixed-asset investment volume in each, to promote comparability between the data. All raw data in the index system originate from China Statistical Yearbook, China Industry Statistical Yearbook, China Statistical Yearbook of the Tertiary Industry, China Statistical Yearbook on Science and Technology, and all municipal and provincial statistical yearbooks and statistical communiques of the corresponding years. The descriptive statistics of the used variables are displayed in the following table (Table 3).

4. Results and Analysis

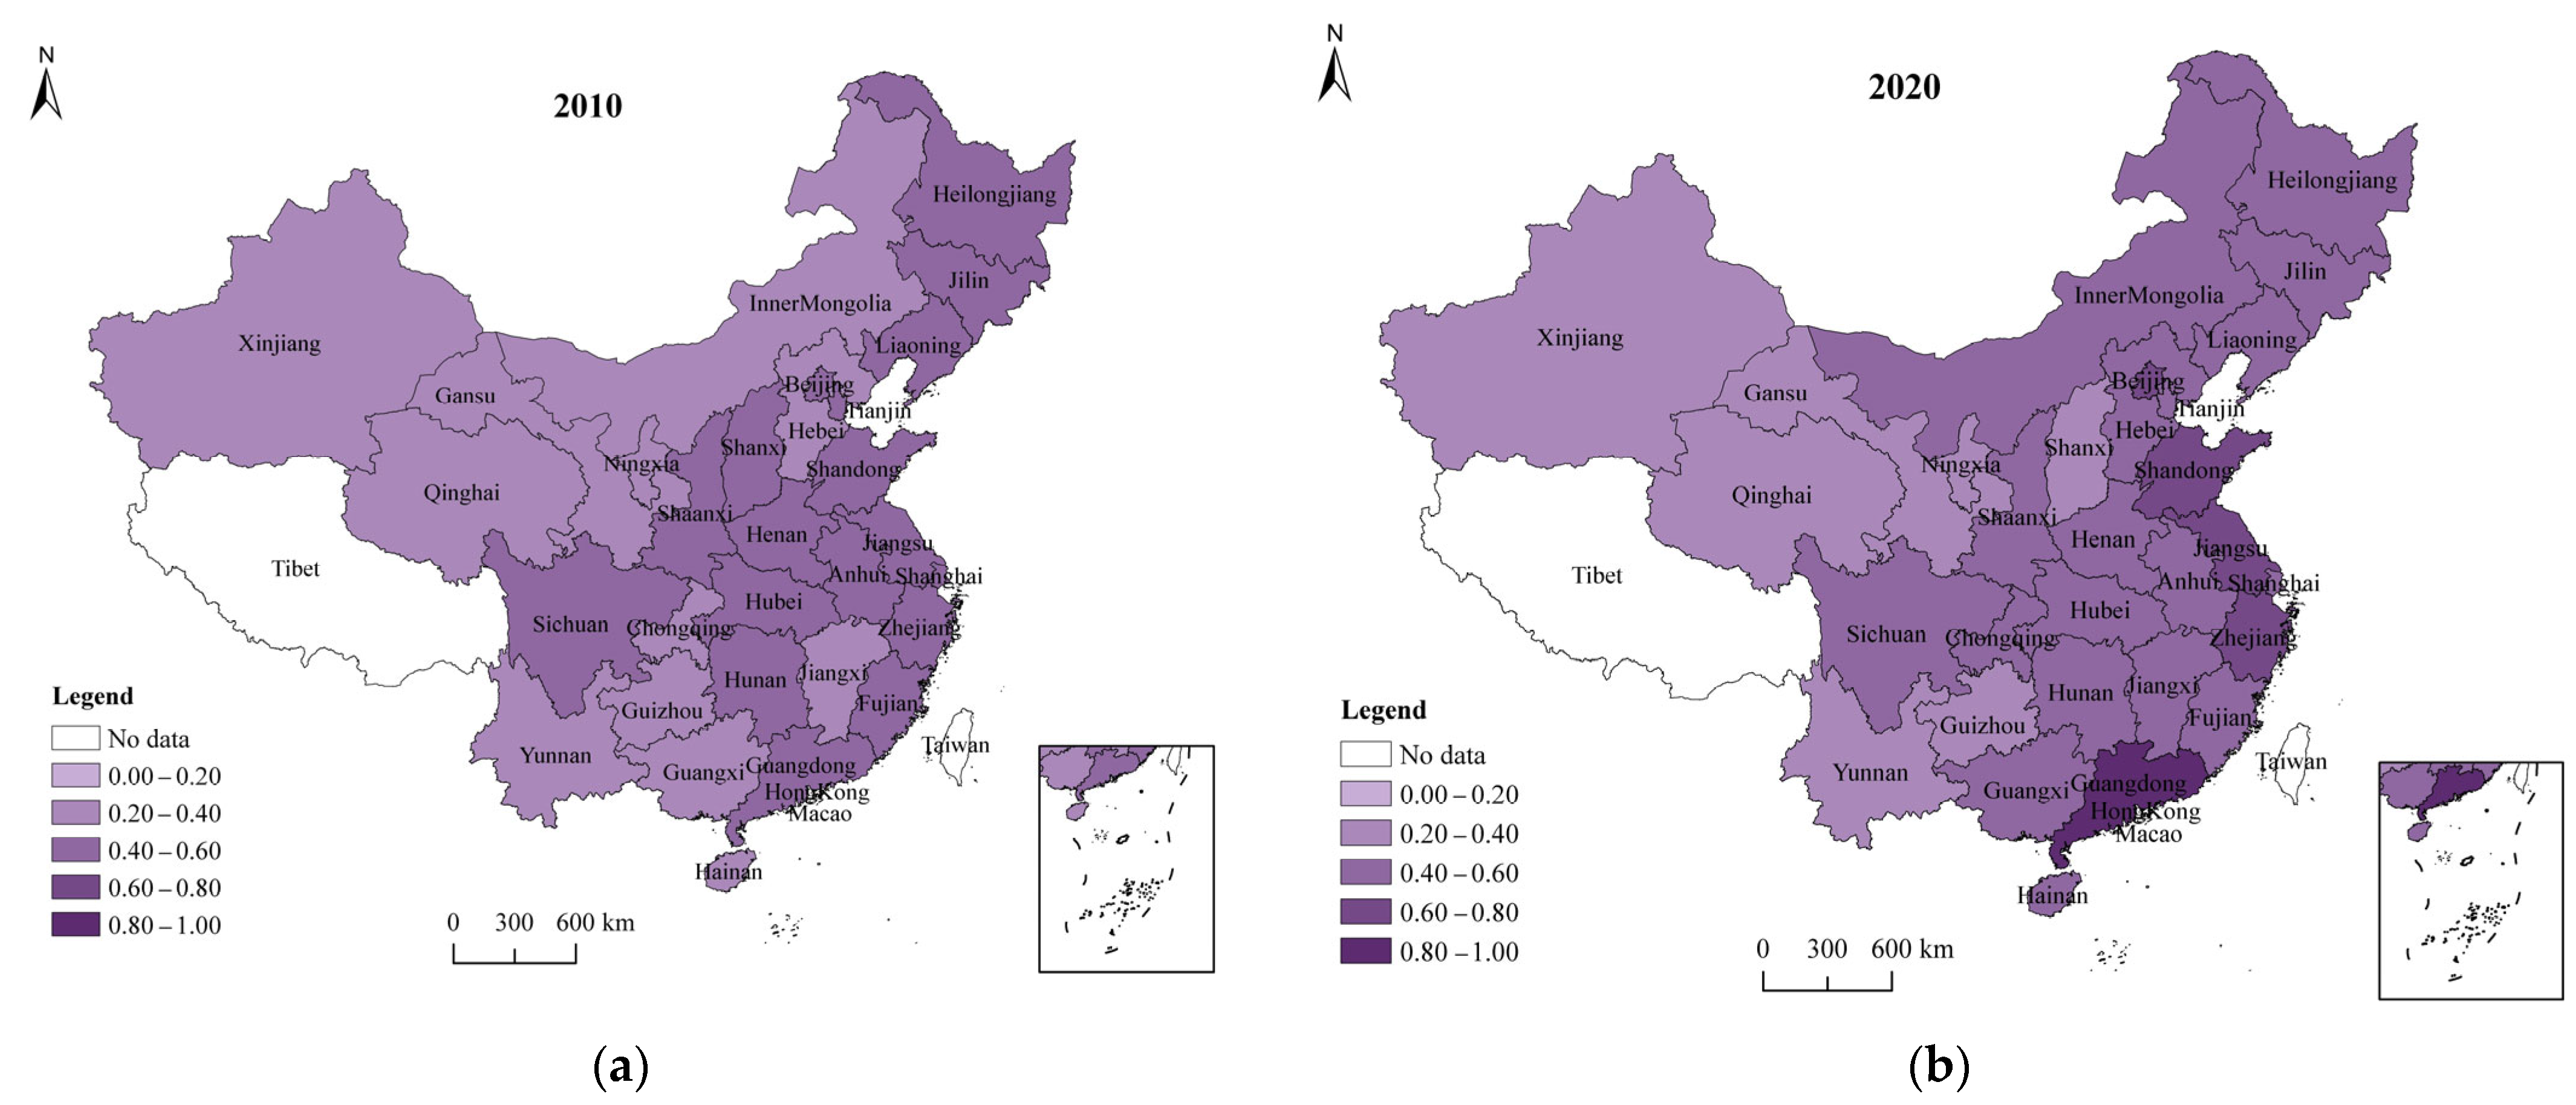
4.1. Level of Economic Resilience across China’s Provinces

The level of economic resilience across China’s provinces during 2010–2020 is estimated by the entropy method, and the spatial distribution maps corresponding to 2010 and 2020 are plotted in Figure 1. Analyzed from the temporal perspective, the level of economic resilience in all provinces of China appears on the slow rise within the research period, with the mean in all provinces rising by a range of 0.103, from 0.266 in 2010 to 0.369 in 2020, showing an overall low level of economic resilience but an overall upturn of economic development resilience across China’s provinces. Analyzed from the spatial perspective, the spatial difference in economic resilience between China’s provinces in 2010 is insignificant, with the level of economic resilience ranging between the universally low values of 0.179 and 0.405. The interprovincial difference in economic resilience in 2020 is relatively significant, with the level of economic resilience higher in most eastern coastal provinces than in inland provinces; the top-ranked provinces and cities include Guangdong, Jiangsu, Beijing, Tianjin, Shanghai, Zhejiang, Shandong, and Fujian, all of which are categorized as eastern provincial regions, showing that China’s economic resilience has been significantly polarized between the eastern and the western areas. Therefore, there remains much room for China to make improvements in the resilience of economic development and in regional coordination.

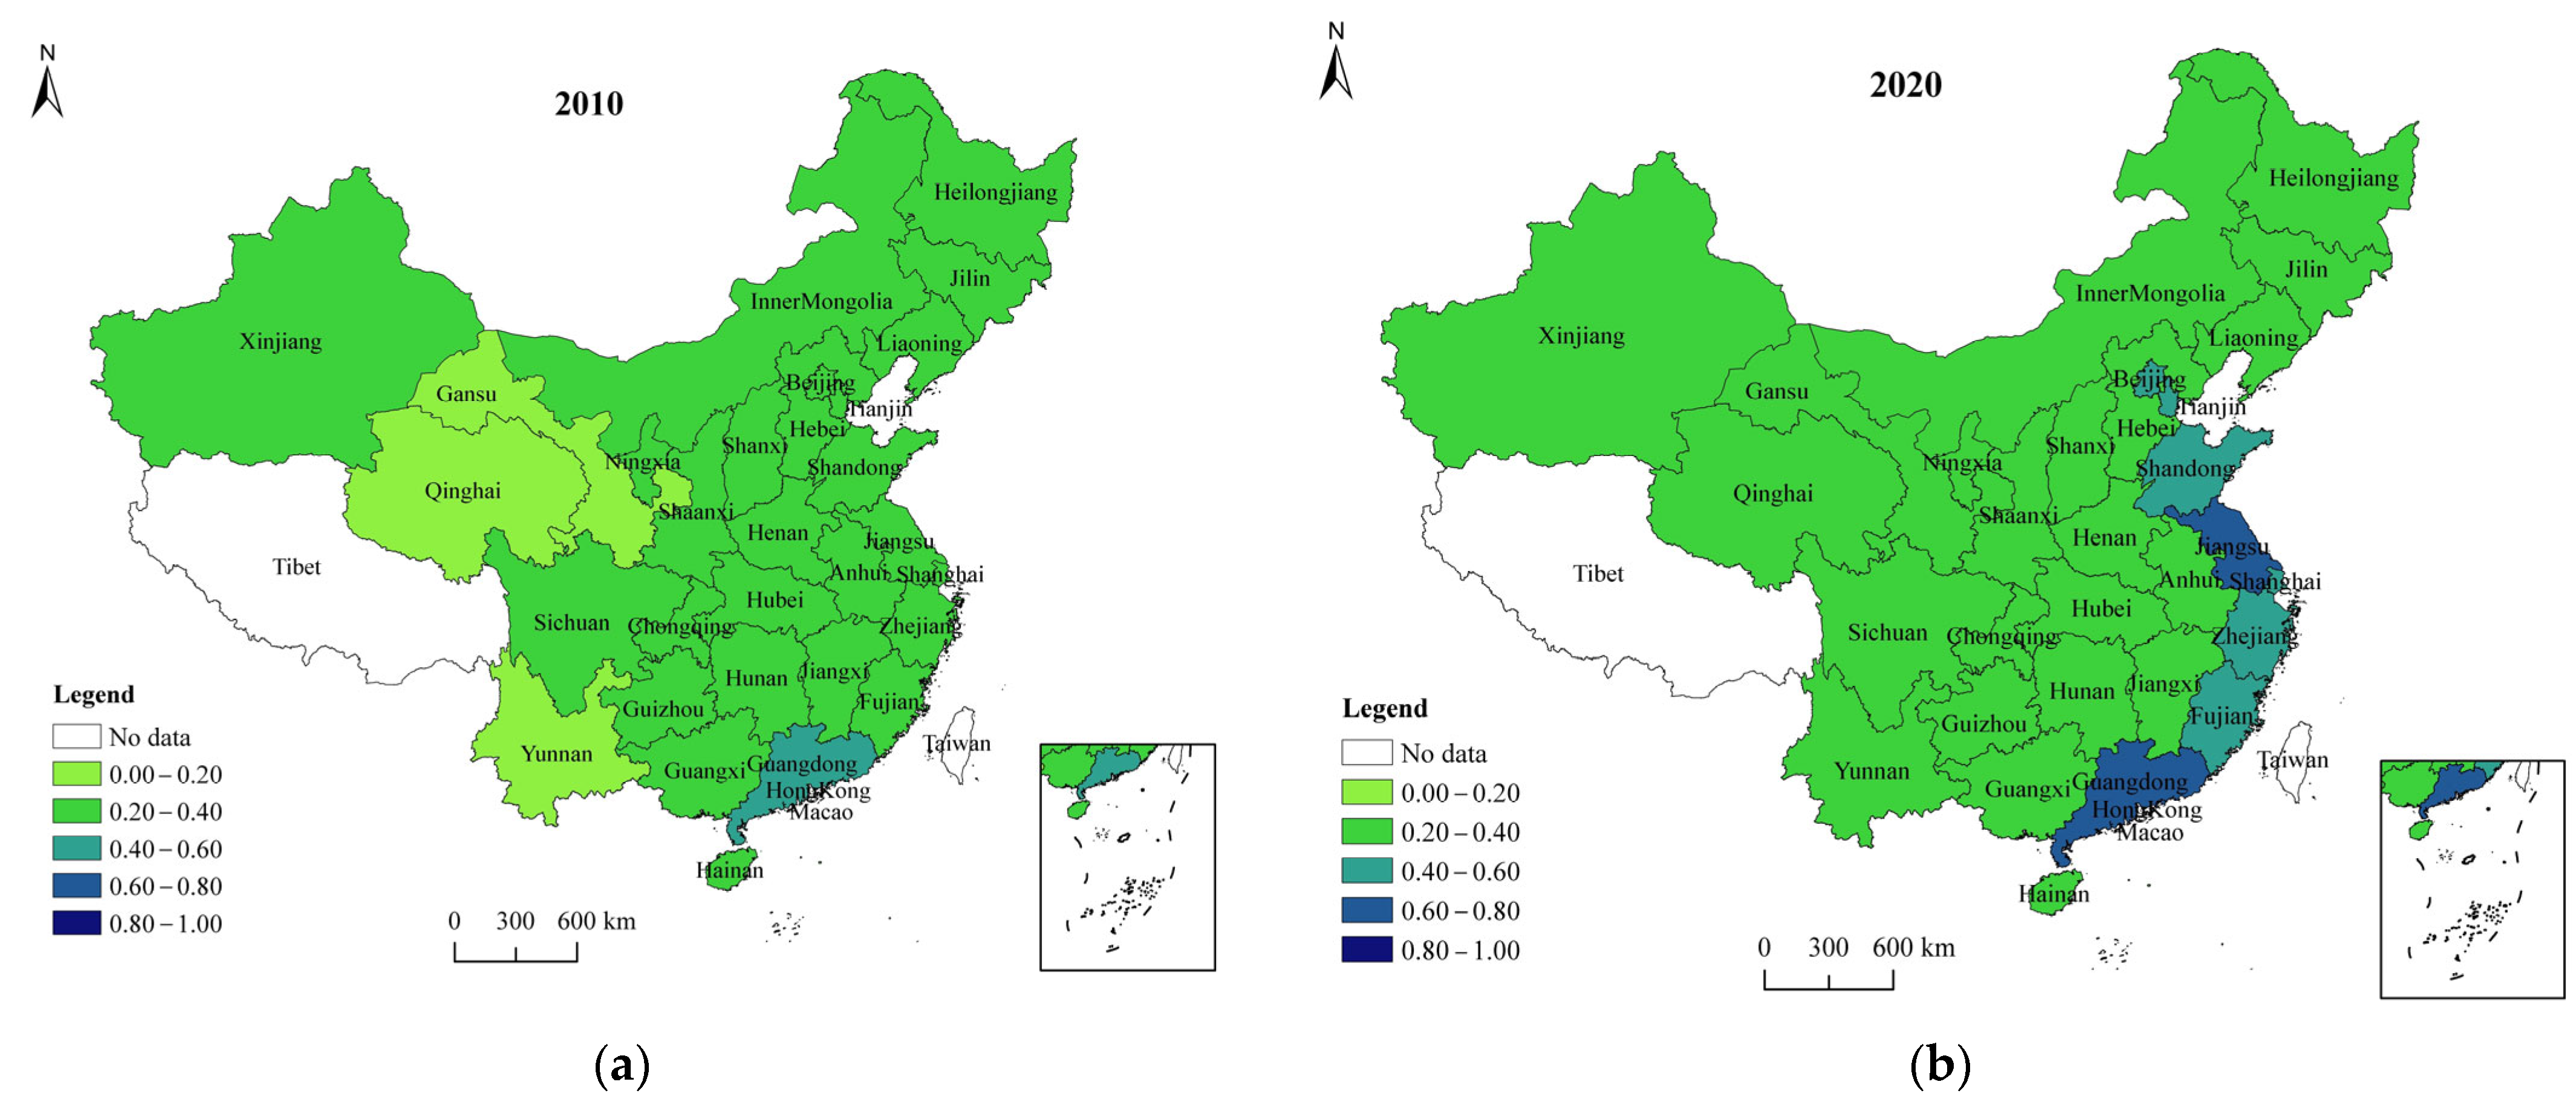
4.2. Level of Synergy between M&ICS Industries

According to the level of synergy between M&ICS industries derived from the estimation, the spatial distribution maps of the level of synergy between M&ICS industries across China’s provinces are plotted in Figure 2. Overall, the level of synergy between these two industries is low across China, with considerable room for being improved. Judged from the mean of all provinces of each year, the level of synergy between M&ICS industries shows a wavelike uptrend from 0.425 in 2010 to 0.492 in 2020. The growth of the average level of synergy between M&ICS industries is small. In spatial distribution, there exists a significant spatial difference in the level of synergy between M&ICS industries, with the level of synergy higher in eastern provinces than in central and western provinces; moreover, this difference has the tendency to widen over time, with the growth rate of the level of industrial synergy in eastern provinces overtaking that in other areas. Therefore, there is a pressing need for China to improve the industrial spatial distribution, narrow the inter-regional difference, and raise the overall level of coordinated development between industries.

4.3. Empirical Test of Spatial Econometrics

4.3.1. Spatial Spillover Effect and Model Determination

Moran’s I method is adopted in this study to test the spatial correlation in economic resilience across China’s provinces. The study reveals that, within the research period, the Moran index with the spatial weight on geographical distance as a feature varies between 0.24 and 0.29, and that the Moran index with the spatial weight on economic distance as another feature ranges between 0.27 and 0.32; both have passed the test at a 1% significance level. A preliminary revelation is that there exists a positive spatial correlation in economic resilience across China’s provinces, hence the spatial econometric model can be adopted for further analysis.
To determine the appropriate spatial econometric model, the following tests are usually conducted on the base of giving priority to SDM and the results are shown in Table 4. First, the Hausman test has a result at the 1% significance level, suggesting that the fixed effect model should be selected. Second, the LR test results show that the temporal and spatial fixed effects both pass the 1% confidence level, hence the temporal and spatial fixed effects coexist. Moreover, in the LR test, the original hypothesis that SDM can degrade into the SEM or SAR model is significantly rejected, so that SDM is affirmed. On the above, the most appropriate model for this study is the SDM with spatial and temporal fixed effects.

4.3.2. Empirical Results of SDM

Based upon the preceding theoretical analysis, the results estimated by Formula (3) are shown in Table 5. The SDM regression results under both spatial weight matrices turn out to have high values of R2 and Log-L, indicating an excellent model fitting. In terms of the core explanatory variable, the impacts of the synergy between M&ICS industries on economic resilience are both significantly positive under both weight matrices, suggesting that the synergy between M&ICS industries is conducive to higher economic resilience. The spatial autocorrelation coefficient of the explained variable is positive at the 1% significance level, further verifying the spatial positive correlation in economic resilience across China’s provinces; this result is consistent with the work of Song et al. [50] to a large extent, who found that the economic resilience of China’s counties was significantly spatially correlated.
The total spatial effect is decomposed into direct effect and indirect (spillover) effect by applying the partial differential method to further analyze the impacts of the synergy between M&ICS industries on economic resilience. The results are shown in Table 6.
From Table 6, under the two weight matrices of geographical distance and economic distance, the coefficient of the direct effect of the synergy between M&ICS industries on economic resilience is positive at the 1% significance level, whereas the coefficient of the spillover effect is negative and nonsignificant, showing that the synergy between M&ICS industries in the relevant area can boost local economic resilience, but that the economic resilience in the surrounding areas is suppressed, probably because of a competitive relationship in essential resource factors with these surrounding areas throughout the process of industrial synergy. For the control variable, the coefficients of both direct and indirect effects of government intervention and market openness are negative, showing that government intervention and market openness could suppress economic resilience, which confirms the views of many scholars [50,51,52]. Government intervention affects the normal operation of the market and causes regional dependence on fiscal expenditure in the long run. A high degree of market openness might be a disadvantage to local economic resilience due to the unstable international environment. The coefficients of both direct and spillover effects of innovation environment are positive at the 1% significance level, suggesting that innovation is not only conducive to local economic resilience, but that it also promotes economic resilience in the surrounding areas via technological spillover. The coefficient of financial level is positive on both effects, and it passes the 1% significance test, showing that development in the financial industry is not only conducive to local economic resilience enhancement, but that it also plays a significant role in radiating and driving the surrounding areas. Financial development can improve cross-regional financial liquidity, accelerate industrial transformation and upgrades in local and adjacent areas, and drive regional division of work and switch, thereby creating a beneficial economic cycle [53,54]. The coefficient of the direct effect of personnel resource is positive, while that of spillover effect is negative. This finding is consistent the argument of Eppelsheimer et al. [55], who argue that human capital externalities attenuate with increasing distance.

4.3.3. Robustness Test

The robustness test is conducted by replacing the spatial weight matrix W. Referring to the practices of many scholars, a geographically adjoining spatial weight matrix W3 is set based on the binary algorithm. As part of common practice in academia, the island province Hainan is set as an adjoining province to Guangdong Province. As shown in Formula (8), W3 takes on the value of 1 when provinces i and j are adjacent; else, the value of 0.
W 3 = 1 ,   i   and   j   are   adjacent 0 ,   i   and   j   are   nonadjacent
The results are shown in Table 7. After setting the geographically adjoining matrix as the spatial weight matrix, all coefficients of variables are estimated in basically the same way as above. Therefore, the research results in this paper are robust.

5. Discussion and Conclusions

With spreading uncertainty and instability worldwide, how to promote regional economic resilience efficiently has become one focus in many countries. Regional economic resilience is a significant theoretical method for scholars to investigate economic recovery and sustainable development [56,57]. As mentioned in the literature review, many scholars have studied different aspects of the factors influencing regional economic resilience, and some studies have demonstrated that industrial structure plays an important role in regional economic resilience [50,51,52,53]. Nowadays, the development of digital technology has brought profound changes to the industrial structure of the manufacturing industry [7], and the theoretical research on the phenomenon of industrial integration is one of the frontier topics in the theoretical research of the industrial economy [7,8]. Therefore, this study takes industrial coordination as the starting point and China’s provincial manufacturing as evidence on the basis of previous studies and confirms that the synergy between M&ICS industries has a positive impact on regional economic resilience. In addition, the model used in the study has paid attention to spatial factors, which is also an advantage compared to previous studies. This study provides a new perspective for the related research in the field of the industrial economy and economic resilience.
It should be noted that this paper has some limitations that need to be addressed in future research. Firstly, this study focuses on the provincial economic resilience of a single developing country (China). Scholars can expand the scope by including other countries to help policymakers in other countries promote economic resilience. Secondly, future studies can expand and optimize the index system and influencing factors of economic resilience. For example, with the aggravation of environment pollution and the greenhouse effect throughout the world in recent years, the ecological environment plays a growing important role in regional economic resilience. The impact of the ecological environment on regional economic resilience should not be ignored. Thirdly, with the development of the digital economy, the statistical caliber of the digital industry may be more comprehensive, hence the measurement of the ICS industry can be further improved in future research.
The main objective of this study is to demonstrate the impact of the synergy between M&ICS industries on economic resilience based on the spatial econometric model. The following conclusions follow from the research results in this paper: (1) The economic resilience across China’s provinces is universally low but on the steady uptrend; in addition, the development in provincial economic resilience is severely polarized between the eastern and western areas. (2) The level of synergy between M&ICS industries across China’s provinces shows an overall wavelike uptrend; however, the interprovincial imbalance is gradually intensified, showing an overall pattern of polarization with the level of synergy decreasing from east to west. (3) The spatial econometric model test suggests that the economic resilience across China’s provinces has a significant positive spatial spillover effect, and that the synergy between M&ICS industries has a significant promotive effect on economic resilience. Within a spatial range, the direct effect of the synergy between M&ICS industries on provincial economic resilience is significantly positive, while the spillover effect on surrounding areas is negative and nonsignificant. (4) According to the regression results of the control variable, innovation environment, financial level, and personnel resource are all conducive to higher economic resilience, while government intervention and market openness are suppressive to regional economic resilience. Furthermore, innovation environment and financial level have significant spatial spillover effects.
Based upon the above conclusions, some suggestions are raised: (1) In promoting the synergy between M&ICS industries, preferential policies should be formulated with benefit compensations and other devices to boost the development efficiency and quality of and break the barriers to the ICS industry in the key areas of central and western China. (2) The spatial spillover effect of industrial synergy should be strengthened, and the regional innovation environment and financial development level should be promoted in particular. (3) The radiating and driving role in eastern areas with higher levels of industrial synergy should be unleashed to bridge interprovincial gaps and lay a solid foundation for effectively boosting regional economic resilience via industrial synergy. (4) China should continue to be preferentially directed towards higher economic resilience, promote the industrial transformation and upgrade of manufacturing, expedite the progress of digitalization, and stimulate more enterprises to undergo technological innovation.

Author Contributions

Conceptualization, J.L.; Methodology, H.X.; Software, P.G.; Data curation, H.X.; Formal analysis, J.L.; Writing—Original draft preparation, Y.X.; Writing—Review and editing, Y.X. and Y.Y.; Project administration, Y.X.; Funding acquisition, J.L. and Y.X. All authors have read and agreed to the published version of the manuscript.

Funding

This research was funded by “Tianjin Science and Technology Planning Project of China, grant number 21ZLZKZF00290”.

Acknowledgments

The authors would like to acknowledge the professionals who collaborated during this study. I would also like to thank the editor and the anonymous referees at the journal for insightful comments.

Conflicts of Interest

The authors declare no conflict of interest.

References

  1. Yu, H.; Liu, Y.; Liu, C.; Fan, F. Spatiotemporal variation and inequality in China’s economic resilience across cities and urban agglomerations. Sustainability 2018, 10, 4754. [Google Scholar] [CrossRef]
  2. Christopherson, S.; Michie, J.; Tyler, P. Regional resilience: Theoretical and empirical perspectives. Camb. J. Reg. Econ. Soc. 2010, 3, 3–10. [Google Scholar] [CrossRef]
  3. Martin, R. Regional economic resilience, hysteresis and recessionary shocks. J. Econ. Geogr. 2012, 12, 1–32. [Google Scholar] [CrossRef]
  4. Martin, R.; Sunley, P.; Gardiner, B.; Tyler, P. How regions react to recessions: Resilience and the role of economic structure. Reg. Stud. 2016, 50, 561–585. [Google Scholar] [CrossRef]
  5. Martin, R.; Sunley, P. Path dependence and regional economic evolution. J. Econ. Geogr. 2006, 6, 395–437. [Google Scholar] [CrossRef]
  6. Simmie, J.; Martin, R. The economic resilience of regions: Towards an evolutionary approach. Camb. J. Reg. Econ. Soc. 2010, 3, 27–43. [Google Scholar] [CrossRef]
  7. Liu, Y.; Zhao, X.; Mao, F. The synergy degree measurement and transformation path of China’s traditional manufacturing industry enabled by digital economy. Math. Biosci. Eng. 2022, 19, 5738–5753. [Google Scholar] [CrossRef]
  8. Khorasani, M.; Loy, J.; Ghasemi, A.H.; Sharabian, E.; Leary, M.; Mirafzal, H.; Cochrane, P.; Rolfe, B.; Gibson, I. A review of Industry 4.0 and additive manufacturing synergy. Rapid Prototyp. J. 2022, 28, 1462–1475. [Google Scholar] [CrossRef]
  9. Chen, X.; Teng, L.; Chen, W. How does FinTech affect the development of the digital economy? Evidence from China. N. Am. J. Econ. Financ. 2022, 61, 101697. [Google Scholar] [CrossRef]
  10. Li, T.; Wang, X. Digital economy empowers China’s dual cycle” strategy–Internal logic and practice path. Economist 2021, 5, 102–109. (In Chinese) [Google Scholar]
  11. Wu, B.; Yang, W. Empirical test of the impact of the digital economy on China’s employment structure. Financ. Res. Lett. 2022, 49, 103047. [Google Scholar] [CrossRef]
  12. Marie, V.; Mitra, A.; Sharma, C. Infrastructure, information & communication technology and firms’ productive performance of the Indian manufacturing. J. Policy Modeling 2016, 38, 353–371. [Google Scholar] [CrossRef]
  13. Kusiak, A. Smart manufacturing must embrace big data. Nature 2014, 544, 23–25. [Google Scholar] [CrossRef] [PubMed]
  14. Lin, P.; Li, M.; Kong, X.; Chen, J.; Huang, G.Q.; Wang, M. Synchronisation for smart factory—Towards IoT-enabled mechanisms. Int. J. Comput. Integr. Manuf. 2018, 31, 624–635. [Google Scholar] [CrossRef]
  15. Jere, S.; Saku, P.; Minna, L.; Katri, S.; Harri, N. Reconfigurable pilot lines enabling industry digitalization: An approach for transforming industry and academia needs to requirements specifications. Procedia CIRP 2022, 107, 1226–1231. [Google Scholar] [CrossRef]
  16. Sohal, A.; Moss, S.; Ng, L. Comparing IT success in manufacturing and service industries. Int. J. Oper. Prod. Manag. 2001, 21, 30–45. [Google Scholar] [CrossRef]
  17. Kelle, M. Crossing industry borders: German manufacturers as services exporters. World Econ. 2013, 36, 1494–1515. [Google Scholar] [CrossRef]
  18. Martin, R.; Sunley, P. On the notion of regional economic resilience: Conceptualization and explanation. J. Econ. Geogr. 2015, 15, 1–42. [Google Scholar] [CrossRef]
  19. Martin, R.; Sunley, P.; Tyler, P. Local growth evolutions: Recession, resilience and recovery. Camb. J. Reg. Econ. Soc. 2015, 8, 141–148. [Google Scholar] [CrossRef]
  20. Breathnach, P.; van Egeraat, C.; Curran, D. Regional economic resilience in Ireland: The roles of industrial structure and foreign inward investment. Reg. Stud. Reg. Sci. 2015, 2, 497–517. [Google Scholar] [CrossRef]
  21. Whitley, R. The institutional structuring of innovation strategies: Business systems, firm types and patterns of technical change in different market economies. Organ. Stud. 2016, 21, 855–886. [Google Scholar] [CrossRef]
  22. Cellini, R.; Torrisi, G. Regional resilience in Italy: A very long-run analysis. Reg. Stud. 2014, 48, 1779–1796. [Google Scholar] [CrossRef]
  23. Cho, M.; Hassink, R. Limits to locking-out through restructuring: The textile industry in Daegu, South Korea. Reg. Stud. 2009, 43, 1183–1198. [Google Scholar] [CrossRef]
  24. Mikheeva, N.N. Resilience of Russian regions to economic shocks. Stud. Russ. Econ. Dev. 2021, 32, 68–77. [Google Scholar] [CrossRef]
  25. Di Pietro, F.; Lecca, P.; Salotti, S. Regional economic resilience in the European Union: A numerical general equilibrium analysis. Spat. Econ. Anal. 2020, 16, 287–312. [Google Scholar] [CrossRef]
  26. Allam, Z.; Jones, D. Climate change and economic resilience through urban and cultural heritage: The case of emerging small island developing states economies. Economies 2019, 7, 62. [Google Scholar] [CrossRef]
  27. Gao, Y.; Song, Y. Research on the interactive relationship between information communication technology and manufacturing industry. Clust. Comput. 2017, 22, 5719–5729. [Google Scholar] [CrossRef]
  28. Malhotra, A.; Osiyevskyy, O. The changing value of firm resources during industry convergence: Market vs. technical assets. Acad. Manag. Annu. Meet. Proc. 2015, 2015, 18599. [Google Scholar] [CrossRef]
  29. Liu, Y.W.; Li, J.; Xu, Y. Quantitative evaluation of high-tech industry policies based on the PMC-Index model: A case study of China’s Beijing-Tianjin-Hebei region. Sustainability 2022, 14, 9338. [Google Scholar] [CrossRef]
  30. Tang, X.; Zhang, X.; Li, Y. Dynamic coordination development in China’s manufacturingand manufacturing-related service industries. Econ. Res. J. 2018, 53, 79–93. (In Chinese) [Google Scholar]
  31. Nyström, K. Regional resilience to displacements. Reg. Stud. 2017, 52, 4–22. [Google Scholar] [CrossRef]
  32. Doran, J.; Fingleton, B. Employment resilience in Europe and the 2008 economic crisis: Insights from micro-level data. Reg. Stud. 2015, 50, 644–656. [Google Scholar] [CrossRef]
  33. Jung, S.; Nam, C.; Yang, D.-H.; Kim, S. Does corporate sustainability performance increase corporate financial performance? Focusing on the information and communication technology industry in Korea. Sustain. Dev. 2018, 26, 243–254. [Google Scholar] [CrossRef]
  34. Pan, W.; Xie, T.; Wang, Z.; Ma, L. Digital economy: An innovation driver for total factor productivity. J. Bus. Res. 2022, 139, 303–311. [Google Scholar] [CrossRef]
  35. Manca, C.; Grijalvo, M.; Palacios, M.; Kaulio, M. Collaborative workplaces for innovation in service companies: Barriers and enablers for supporting new ways of working. Serv. Bus. 2018, 12, 525–550. [Google Scholar] [CrossRef]
  36. Cataldo, S.D.; Lee, S.; Macii, E.; Vogel-Heuser, B. Leading information and communication technologies for smart manufacturing: Facing the new challenges and opportunities of the 4th industrial revolution. Proc. IEEE 2021, 109, 320–325. [Google Scholar] [CrossRef]
  37. Nwani, C.; Bekun, F.V.; Agboola, P.O.; Omoke, P.C.; Effiong, E.L. Industrial output, services and carbon emissions: The role of information and communication technologies and economic freedom in Africa. Environ. Dev. Sustain. 2022. [Google Scholar] [CrossRef]
  38. Singh, R.K.; Luthra, S.; Mangla, S.K.; Uniyal, S. Applications of information and communication technology for sustainable growth of SMEs in India food industry. Resour. Conserv. Recycl. 2019, 147, 10–18. [Google Scholar] [CrossRef]
  39. Li, R.; Rao, J.; Wan, L. The digital economy, enterprise digital transformation, and enterprise innovation. Manag. Decis. Econ. 2022, 10, 1–12. [Google Scholar] [CrossRef]
  40. Boschma, R. Towards an evolutionary perspective on regional resilience. Reg. Stud. 2014, 49, 733–751. [Google Scholar] [CrossRef]
  41. Canarella, G.; Miller, S.M. The determinants of growth in the U.S. information and communication technology (ICT) industry: A firm-level analysis. Econ. Model. 2018, 70, 259–271. [Google Scholar] [CrossRef]
  42. Giannakis, E.; Mamuneas, T.P. Labour productivity and regional labour markets resilience in Europe. Ann. Reg. Sci. 2022, 68, 691–712. [Google Scholar] [CrossRef] [PubMed]
  43. Zhang, T.; Sun, B.; Li, W.; Zhou, H. Information communication technology and manufacturing decentralisation in China. Pap. Reg. Sci. 2022, 101, 619–637. [Google Scholar] [CrossRef]
  44. Kutin, A.; Dolgov, V.; Sedykh, M. Information links between product life cycles and production system management in designing of digital manufacturing. Procedia CIRP 2016, 41, 423–426. [Google Scholar] [CrossRef]
  45. Yang, N.; Liu, Q.; Chen, Y. Does industrial agglomeration promote regional innovation convergence in China? Evidence from high-tech industries. IEEE Trans. Eng. Manag. 2021, 1–14. [Google Scholar] [CrossRef]
  46. Wu, J.; Jing, J. Producer services agglomeration, industrial convergence and technological innovation. Shanghai J. Econ. 2021, 7, 69–80. (In Chinese) [Google Scholar]
  47. Michaeli, T.; Wang, W.; Livescu, K. Nonparametric Canonical Correlation Analysis. In Proceedings of the 33rd International Conference on Machine Learning, PMLR, New York, NY, USA, 20–22 June 2016; Volume 48, pp. 1967–1976. [Google Scholar] [CrossRef]
  48. Liu, X.; Zhang, X.; Li, H. Measurement of China’s macro economic resilience: A systemic risk perspective. Soc. Sci. China 2021, 1, 12–32. (In Chinese) [Google Scholar]
  49. Wu, J.; Li, Q. Spatial effect of digital transformation driving the integration of manufacturing and service industries. J. Stat. 2022, 3, 42–56. (In Chinese) [Google Scholar]
  50. Song, G.; Zhong, S.; Song, L. Spatial pattern evolution characteristics and influencing factors in county economic resilience in China. Sustainability 2022, 14, 8703. [Google Scholar] [CrossRef]
  51. Guo, J.; Xu, Z. Research on the influence of industrial related variety on regional economic resilience-Analysis of threshold effect based on regional innovation level. Sci. Technol. Prog. Policy 2019, 36, 39–47. (In Chinese) [Google Scholar]
  52. Wang, X.; Li, M. Determinants of regional economic resilience to economic crisis: Evidence from Chinese economies. Sustainability 2022, 14, 809. [Google Scholar] [CrossRef]
  53. Du, Z.; Zhang, H.; Ye, Y.; Jin, L.; Xu, Q. Urban shrinkage and growth: Measurement and determinants of economic resilience in the Pearl River Delta. J. Geogr. Sci. 2019, 29, 1331–1345. [Google Scholar] [CrossRef]
  54. Eraydin, A. Attributes and characteristics of regional resilience: Defining and measuring the resilience of Turkish regions. Reg. Stud. 2016, 50, 600–614. [Google Scholar] [CrossRef]
  55. Eppelsheimer, J.; Jahn, E.J.; Rust, C. The spatial decay of human capital externalities—A functional regression approach with precise geo-referenced data. Reg. Sci. Urban Econ. 2022, 95, 103785. [Google Scholar] [CrossRef]
  56. Pendall, R.; Theodos, B.; Franks, K. Vulnerable people, precarious housing, and regional resilience: An exploratory analysis. Hous. Policy Debate 2012, 22, 271–296. [Google Scholar] [CrossRef]
  57. Giannakis, E.; Bruggenman, A. Economic crisis and regional resilience: Evidence from Greece. Pap. Reg. Sci. 2017, 96, 451–476. [Google Scholar] [CrossRef]
Figure 1. Spatial distributions of the level of economic resilience across China’s provinces corresponding to (a) 2010 and (b) 2020.
Sustainability 14 10758 g001
Figure 2. Spatial distributions of the level of synergy between M&ICS industries across China’s provinces corresponding to (a) 2010 and (b) 2020.
Sustainability 14 10758 g002
Table 1. Comprehensive evaluation system for economic resilience across China’s provinces.
Target LevelPrimary IndexSecondary IndexSourceAttribute of IndexWeight
Economic resilienceVulnerabilityUnemployment rate (%)CSY0.021
Growth rate of population (%)CSY+0.037
Proportion of direct foreign investments over GDP (%)CSY0.022
Engel coefficient (%)CSY0.046
ResistanceGrowth rate of GDP (%)CSY+0.057
Average wage of workers (CNY)CSY+0.097
Disposable income per capita (CNY)CSY+0.126
Proportion of the unemployed insured population over the unemployed population (%)CSY+0.018
Proportion of employees of state-owned units over the employed population (%)CSY0.028
AdaptabilityProportion of fiscal expenditure on education over GDP (%)CSY, CSYST+0.056
Proportion of fiscal expenditure on science and technology over GDP (%)CSY, CSYST+0.124
Number of patents licensed per 10 thousand peopleCSYST+0.168
Proportion of college students over total population (%)CSY, CSYST+0.039
RestorabilityUrbanization rate (%)CSY+0.071
Degree of fiscal decentralization (%)CSY+0.031
Proportion of the balance of loans of financial institutions over GDP (%)CSY+0.024
Density of population (number of people per km2)CSY+0.035
Notes: CSY: China Statistical Yearbook, CSYST: China Statistical Yearbook on Science and Technology.
Table 2. Evaluation indexes for the level of synergy between M&ICS industries.
IndustryPrimary IndexSecondary IndexSourceWeight
ManufacturingDevelopment scaleSize of the employed population (10 thousand)CISY0.114
Business revenue (100 million CNY)CISY0.123
Fixed-asset investment volume (100 million CNY)CISY0.111
Development potentialGrowth rate of main business (%)CISY0.081
Growth rate of licensed patents for inventionCISY, CSYST0.047
Growth rate of the employed population (%)CISY0.065
Information communication serviceDevelopment scaleSize of the employed population (10 thousand)CSYTI0.109
Business revenue (100 million CNY)CSYTI0.121
Fixed-asset investment volume (100 million CNY)CSYTI0.091
Development potentialGrowth rate of the employed population (%)CSYST0.056
Growth rate of port number with internet broadband access (%)CSYST0.043
Growth rate of mobile internet subscribers (%)CSYST0.039
Notes: CISY: China Industry Statistical Yearbook, CSYTI: China Statistical Year book of the Tertiary Industry, CSYST: China Statistical Yearbook on Science and Technology.
Table 3. The descriptive statistics of the used variables.
VariableMeanStd. DevMinMax
Res0.2990.3410.1700.764
Ind0.4540.2720.3140.813
Gov0.2390.2310.1080.539
Mar0.2570.3370.0250.674
Inn0.0480.0790.0040.151
Fin1.3100.6900.7452.105
Per193122100339
Table 4. Judgment tests for model selection.
Correlation TestGeographical Distance MatrixEconomic Distance Matrix
Hausman test182.26 ***181.92 ***
LR test (spatial fixed effect)61.09 ***51.34 ***
LR test (temporal fixed effect)59.39 ***58.84 ***
LR test (SEM nested in SDM)43.37 ***47.57 ***
LR test (SAR nested in SDM)384.54 ***369.19 ***
Notes: The triple asterisks (***) signify that the test passes the 1% significance levels, respectively.
Table 5. Spatial econometric results of the synergy between M&ICS industries in boosting economic resilience.
VariableSDM with Spatial and Temporal Fixed Effects
Geographical DistanceEconomic Distance
Ind0.576 ***
(15.05)
0.552 ***
(14.21)
Gov−0.092 *
(−1.95)
−0.104 **
(−2.26)
Mar−0.002 ***
(−10.14)
−0.002 ***
(−10.17)
Inn0.714 ***
(6.30)
0.736 ***
(6.86)
Fin0.033 ***
(3.69)
0.039 ***
(4.46)
Per0.022
(0.28)
0.033
(0.01)
W×Res0.196 ***
(2.49)
0.211 ***
(3.21)
W×Ind0.118
(0.91)
0.217
(0.64)
W×Gov−0.197 *
(−1.89)
−0.523 *
(−1.85)
W×Mar−0.002 *
(−1.74)
−0.003
(−1.58)
W×Inn1.234 ***
(4.78)
3.006 ***
(4.79)
W×Fin0.113 ***
(5.26)
0.299 ***
(5.80)
W×Per−0.122
(−0.74)
−0.144
(−0.20)
R20.5790.522
Log-L953.819953.728
Notes: The triple, double, and single asterisks (***, **, and *) signify that the test passes the 1%, 5%, and 10% significance levels, respectively; the items in parentheses are t-statistical values.
Table 6. Decomposition results of the effect of the synergy between M&ICS industries on economic resilience.
VariableDirect EffectIndirect EffectTotal Effect
GeographicalEconomicGeographicalEconomicGeographicalEconomic
Ind0.583 ***
(14.68)
0.563 ***
(14.38)
−0.076
(−0.72)
−0.161
(−0.87)
0.507 ***
(4.86)
0.402 **
(2.13)
Gov−0.085 *
(−1.77)
−0.091 *
(−1.93)
−0.132
(−1.62)
−0.249
(−1.56)
−0.217 ***
(−2.86)
−0.339
(−2.24)
Mar−0.002 ***
(−10.18)
−0.002 ***
(−10.36)
−0.000
(−10.18)
−0.000
(−10.36)
−0.002 ***
(−5.34)
−0.002 ***
(−2.92)
Inn0.645 ***
(5.54)
0.643 ***
(5.74)
0.774 ***
(3.75)
1.334 ***
(3.73)
1.419 ***
(8.16)
1.977 ***
(6.14)
Fin0.027 ***
(3.08)
0.028 ***
(3.45)
0.078 ***
(4.70)
0.151 ***
(4.48)
0.105 ***
(6.33)
0.179 ***
(5.42)
Per0.012
(0.39)
0.023
(0.05)
−0.021
(−0.81)
−0.031
(−0.24)
−0.009
(−0.69)
−0.008
(−0.25)
Notes: The triple, double, and single asterisks (***, **, and *) signify that the test passes the 1%, 5%, and 10% significance levels, respectively; the items in parentheses are t-statistical values.
Table 7. The robustness test results.
VariableSDMVariableSDM
Ind0.669 ***
(15.44)
W×Mar−0.004 *
(−1.97)
Gov−0.076
(−0.07)
W×Inn1.421 ***
(4.78)
Mar−0.274 **
(−2.16)
W×Fin0.153 ***
(5.26)
Inn0.582 ***
(4.62)
W×Per−0.122 *
(−2.82)
Fin0.049 ***
(4.88)
Hausman test140.46 ***
Per0.021 *
(2.08)
LR test (spatial fixed effect)43.09 ***
W×Res0.673 ***
(3.21)
LR test (temporal fixed effect)49.79 ***
W×Ind0.203
(0.91)
LR test (SEM nested in SDM)49.67 ***
W×Gov−0.157 *
(−2.02)
LR test (SAR nested in SDM)256.74 ***
Notes: The triple, double, and single asterisks (***, **, and *) signify that the test passes the 1%, 5%, and 10% significance levels, respectively; the items in parentheses are t-statistical values.
Publisher’s Note: MDPI stays neutral with regard to jurisdictional claims in published maps and institutional affiliations.

