Abstract
Shield excavation and tail grouting are the main causes of ground deformation in tunnel construction, especially in the case of new tunnels undercrossing existing tunnels, which have stricter requirements for settlement control. This paper investigates the equivalent layer method, which is used to simulate ground deformation induced by shield construction and tail grouting via numerical analysis. The research is based on a case study of Beijing’s newly built Metro Line 12 undercrossing the existing Metro Line 10, which is constructed in soft soil. Three-dimensional finite simulation via Plaxis 3D is performed, incorporating the equivalent layer method. Parametric analysis is carried out to explore the influence of the thickness (δ) and elastic modulus (E) of the equivalent layer on surface settlement. It is shown that the surface settlement increases almost linearly with the increase in , and it is insensitive to changes in E. The is the dominating factor affecting the surface settlement. Based on the Beijing Metro Lines project, the predicted surface settlement is analyzed and compared with monitoring data. Based on a case study of Beijing Metro, the applicability of the equivalent layer method is verified, and the empirical values for δ and E are summarized. δ = 1.8 Gp and E = 2 MPa are suitable values for analysis, which could be references for other shield tunnel constructions in soft soil. With the obtained empirical values of the equivalent layer method, the deformation caused by grouting and undercrossing tunnels could be accurately predicted, which is benefit for reducing budget and environmental protection.
1. Introduction
Due to the rapid development and accelerating urbanization of China, underground traffic construction has been widely adopted to alleviate traffic pressure. Inevitably, an increasing number of subway and road tunnels are being planned and constructed, and the number of newly built tunnels overlapping with existing tunnels or structures is also increasing. Shield tunneling is considered as a commonly used technology for tunnel construction. The difficulty of applying shield tunneling in urban areas with prosperous business districts nearby is in controlling the ground deformation caused by over-excavation [1,2,3,4,5,6]. Over-excavation and the strata loss of shield construction may be caused by the gap between soil and the lining, since the diameter of the shield shell is larger than the diameter of the lining. In order to control ground deformation, the tail grouting method is commonly used in practice.
In the shield tail grouting method, liquid grouting materials are injected into the annular shield tail gap between the segment and the ground through a grouting hole behind the shield tail. During the construction of the shield, as the shield advances, the grouting pipe keeps a certain pressure and continuous grouting to the shield tail, filling the construction gap of the shield tail, thereby reducing the deformation of the ground [7].
Tunnel construction will inevitably induce varying degrees of ground movement and result in ground surface settlement. Many studies on the prediction of ground deformation in tunnel construction have been carried out by using empirical methods [4,8,9,10,11,12], analytical methods [13,14], and numerical methods [15,16,17,18]. Empirical and analytical methods are more suitable for simple excavation applications, which do not take complex construction situations and existing structures into account. Numerical methods are considered as a more accurate way to predict tunneling-induced deformation, which could simulate different construction details.
Predicting shield excavation and grouting by numerical simulation is an effective and efficient method that is currently used. In the process of numerical simulation, the simulation of formation loss can be mainly divided into three categories: the stress release method [15], the displacement convergence method [17,19,20,21], and the equivalent layer method [22,23,24,25,26,27,28]. The ground loss caused by tunnel excavation and grouting is difficult to measure in practice to obtain an accurate value, and the existing simulation methods have certain limitations. The stress release method parameters have limited correlation with the ground loss rate [29]. As for the displacement convergence method, the relationship between the different ground losses and the displacement shrinkage ratio produced under different construction situations is not clear [17,30]. The equivalent layer method is simple to use in numerical analysis with wide applicability [22,23,24,25,26,27,28]. The parameters of the equivalent layer method are relatively simple, which have no correlation with construction parameters such as grouting amount and grouting pressure. The parameters of the equivalent layer are taken from empirical values [22,26]. The present studies mainly take the values of parameters of the equivalent layer method according to different soil properties with a large range. The degree of the influence of a parameter on the surface settlement and the accurate empirical values of parameters for different soil layers still need to be explored based on actual engineering applications. Especially for cases of undercrossed shield tunnels at a small proximity, accurate empirical values of equivalent layer methods are of great importance in numerical simulations.
This paper investigates the equivalent layer method, which is used to simulate the ground deformation induced by shield construction and tail grouting via numerical analysis. The research is based on a case study of Beijing’s newly built Metro Line 12 undercrossing the existing Metro Line 10, which is constructed in soft soil. A three-dimensional finite simulation via Plaxis 3D is performed, incorporating the equivalent layer method. Parametric analysis is carried out to explore the influence of the thickness () and elastic modulus (E) of the equivalent layer on surface settlement. Based on a case study of the Beijing Metro Lines project, the predicted surface settlement is analyzed and compared with monitoring data. The applicability of the equivalent layer method is verified, and the empirical values for and E are summarized, which could be references for other shield tunnel constructions in soft soil. Based on the case study of undercrossed shield tunnels at a small proximity, the obtained empirical values from the equivalent layer method could accurately predict the deformation caused by grouting and undercrossing tunnels, especially in soft soils. The accurate prediction through methods in this paper shows the influence of tail grouting on ground deformation; it could control the volume of grouting materials in construction, which is beneficial to reducing budgets and environmental protection.
2. Project Overview
This research is based on the shield tunnel project of Beijing’s newly built Metro Line 12 undercrossing the existing Metro Line 10. The overlapping section of Metro Line 12 starts from Sanyuanqiao Station in the east and passes through the existing Line 10 Liangmaqiao Sanyuanqiao Station section.
2.1. Geological Conditions
The plain view of Line 12 and Line 10 is shown in Figure 1. The newly built shield tunnel of Line 12 passes under the twin tunnels of the existing Line 10 with the skew angle of 60 degrees. As shown in Figure 2, the internal and external diameters of the tunnel linings are 5.4 m and 6.0 m. The width of each segment is 1.2 m. The horizontal distance between the central axis of the newly built Line 12 is 35.0 m with a buried depth of 15.8 m. The newly built Line 12 undercrosses the existing Line 10 with a small vertical clear distance. The distance between the right line of Line 10 and the shield section of Line 12 is 4.50 m, and the buried depth is 14.52 m. The distance between the left line of Line 10 and the shield section of Line 12 is 2.19 m, and the buried depth is 16.31 m.
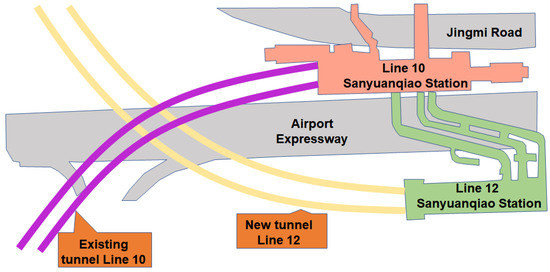
Figure 1.
Plain view of Line 12 undercrossing Line 10.
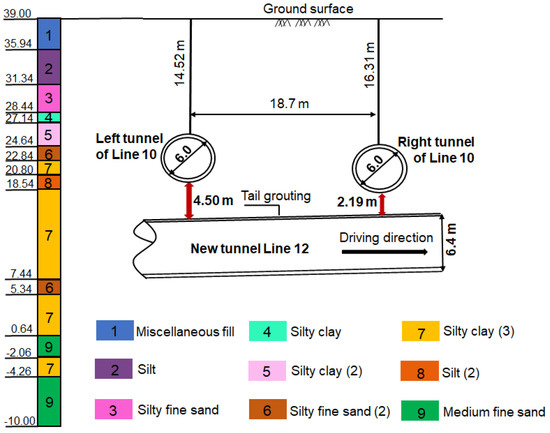
Figure 2.
Typical soil profile at the undercrossing section.
The typical geological profile of Line 12 and the existing Line 10 is shown in Figure 2. The profile shows that the existing tunnels and new tunnels are mainly located in silt clay, which is considered to have properties of low shear strength and high compressibility. The ground water is about 12.09 m below the ground surface. The geotechnical parameters of soils obtained by the site investigation are listed in Table 1.

Table 1.
Geotechnical properties of soil layers.
2.2. Driving Paremeters of EPBS
Two EPBS machines (CTE6650) manufactured by China Railway Engineering Equipment Group Co., Ltd. (Singapore), were employed in the construction of the new tunnels. The shield machine has basic functions such as an excavation system, ballast removal system, ballast soil improvement system, segment installation system, grouting system, power system, control system, measurement and guidance system, and video monitoring system. It can meet the requirements of excavation in gravel strata, medium and fine sand strata, and clay strata, and has the ability to control the direction with high precision, meeting the requirements of environmental protection.
According to the relative distance between the shield machine and Metro Line 10, the tail grouting of left and right lines is divided into a test section and an undercrossing section, and different construction measures are taken, as shown in Figure 3 and Figure 4. During the excavation of new tunnels, 94–163 rings of the left line and 94–188 rings of the right line were considered as test sections. The driving parameters of the shield machine of the test section were used as references. Based on the construction of the test section, the driving parameters of the undercrossing section were optimized constantly to reduce the deformation of existing tunnels and control the process of tail grouting. Four rings of segment were injected with polyurethane material to isolate the undercrossing section to prevent tail grouting materials’ channeling. The detailed driving parameters of the shield machine are listed in Table 2.
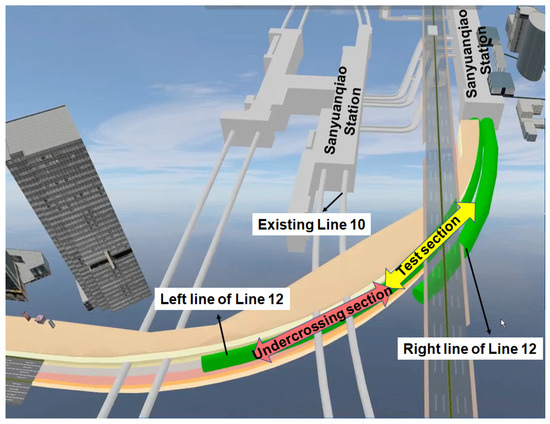
Figure 3.
Layout of the test section and undercrossing section of tail grouting.
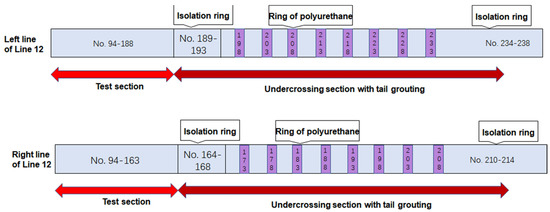
Figure 4.
Detailed arrangements of test section and undercrossing section of tail grouting.
Table 2.
Main parameters of EPBS machines (CTE6650).
Tail grouting is considered as an effective way to control ground deformation, which fills the tail gap between the segment and the ground. The effect of tail grouting is mainly influenced by the composition of grouting materials, grouting volume, and grouting pressure. Tail grouting adopts double-liquid grout, which is composed of cement and sodium silicate. The mix proportion of grouts is shown in Table 3. The grouting range of each ring is within 270° of the top of the tunnel, the grouting depth is 2 m, and the strength of the reinforced soil is not less than 1 MPa. The tail grouting volume of each ring is proposed to be 4.5 m3, which is 140% of the theoretical void volume. The grouting pressure is 0.2~0.35 Mpa.
Table 3.
Mix proportion of grouts (per m3).
2.3. Arrangement of Measurement
The clear distance between the new tunnel and the existing Line 10 is small, of which the construction risk is high. To grasp the influence of tunnel excavation on the surrounding environment, the settlement of the tunnel structures and horizontal convergence were carefully measured in the research region. Thirty monitoring sections were arranged along Metro Line 10; the layout of the monitoring points is shown in Figure 5, and the detailed arrangement of the measuring points is shown in Figure 6.
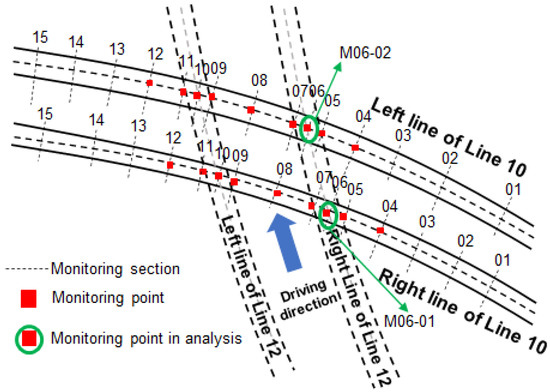
Figure 5.
Layout of monitoring points.
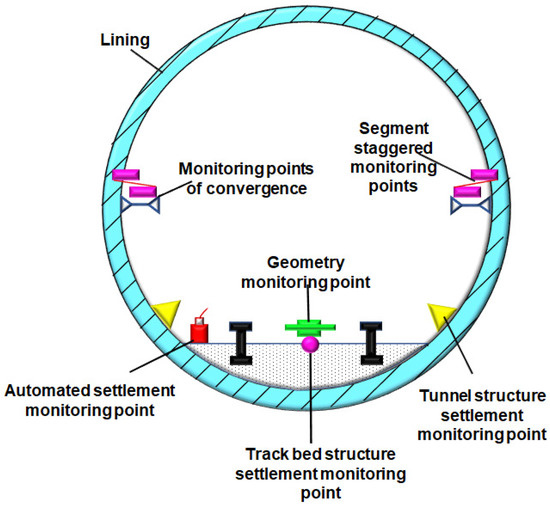
Figure 6.
Arrangement of monitoring points.
The data collection frequency of the automated monitoring system was generally once per 20 min when the new tunnel undercrossed the existing tunnel. The data collection frequency was once per 4-6 h after the new tunnel undercrossed the existing tunnel. Manual monitoring was performed once a day during the underpass construction, once every 2–3 days after the undercrossing construction was completed, and once every 2–3 days after exiting the affected area. Table 4 shows the accuracy and restrictions of the devices used in each monitoring item.
Table 4.
Accuracy and restrictions of devices of monitoring items.
3. Equivalent Layer Method
3.1. Model of Equivalent Layer
In actual construction, it is difficult to quantify factors such as the filling of shield tail gaps in tail grouting and the distribution of grout after grouting. The equivalent layer method uses a homogeneous, equal thickness, elastic soil layer to simulate reinforced soil around the tunnel linings [22,26]. Ground deformation is simulated by replacing the actual soil layer and grouting around the lining with the equivalent layer.
The equivalent layer is an abstraction of the disturbance of the soil around the tunnel and the effect of backfilling and grouting. For certain strata and construction methods, the thickness and mechanical parameters of the equivalent layer should be certain values. The materials of the equivalent layer are made of soil, cement paste, and a mixture of soil and cement paste. The composition ratio is related to the properties of soil, grouting materials, grouting pressure, and grouting volume. The equivalent layer can be regarded as an elastic material. Mechanical properties and thickness are very important parameters for the equivalent layer method, which has a great impact on the simulation results of tail grouting.
The mechanical properties of the equivalent layer include the elastic modulus (E) and Poisson’s ratio (). The materials in the equivalent layer are soil, cement grouts, and a mixture of soil and cement grouts. Its elastic modulus (E) should be between soil and cement. Generally, it can be obtained by referring to the compressive modulus () of cement soil, which is related to the properties of soil, grouting materials, and its composition ratio. Since the range of Poisson’s ratio () is not large, its value has limited influence on the simulation of ground deformation. Therefore, the Poisson’s ratio () of the equivalent layer can be taken as 0.2 with reference to the Poisson’s ratio () of cement–soil [26,31].
The thickness of the equivalent layer is closely related to the tail gap and the actual grouting volume and the severity and range of disturbed surrounding soil during the construction. It can be calculated by [22]:
where is the thickness of the equivalent layer, is the coefficient, and is the computed shield tail gap, which is half the difference between the shield diameter and the outer diameter of tunnel lining. For different soils, the value range of is also different: for loose sand, is 1.3~1.8; for dense sand, is 0.9~1.3; for soft clay, is 1.6~2.0 [22,26].
In the process of simulating the effect of tail grouting on the ground deformation by using the equivalent layer method, the ground deformation is affected by the thickness and the elastic modulus of the equivalent layer. It is necessary to analyze the sensitivity of the ground deformation to the parameters of the equivalent layer method. The concept of the equivalent layer method used in the numerical analysis is shown in Figure 7.
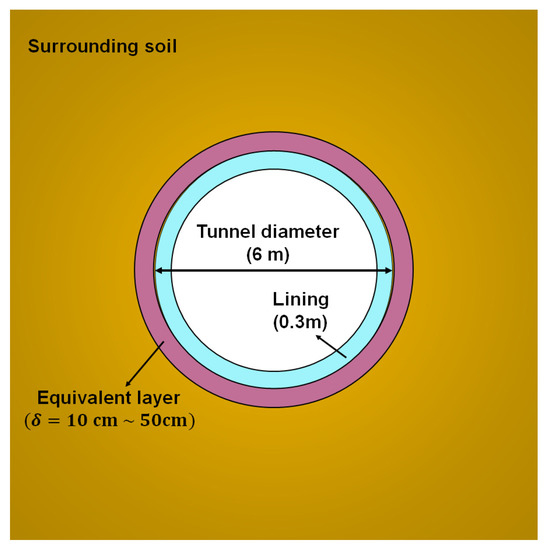
Figure 7.
Concept of equivalent layer method.
3.2. Numerical Model of Equivalent Layer Method
Plaxis 3D was used to establish the numerical model in this paper. As shown in Figure 8, the three-dimensional finite element model was used out to analyze the sensitivity of the parameters of the equivalent layer method on ground deformation. The dimension of the model was 50 m × 120 m × 50 m, considering the construction scheme and boundary effect. Since the tunnel was symmetrical, half of the tunnel was taken for the study. The tunnel’s buried depth is 20 m, and the diameter of the tunnel is 6 m with the lining of 0.3 m. The boundary conditions were presented as follows: (1) no horizontal displacement along the four vertical mesh boundaries and (2) no vertical or horizontal displacement along the bottom boundary of the mesh. The lining was simulated by soil elements. It was considered to be reinforced concrete; the elastic modulus (E) was 26 GPa after considering the stiffness reduction, and the Poisson’s ratio was 0.1 [30,31,32]. The simulation was conducted under drained conditions. An elastic perfectly plastic model with the Mohr–Coulomb failure criterion was assumed for the soil, and the geotechnical properties of soils and the lining are shown in Table 5.
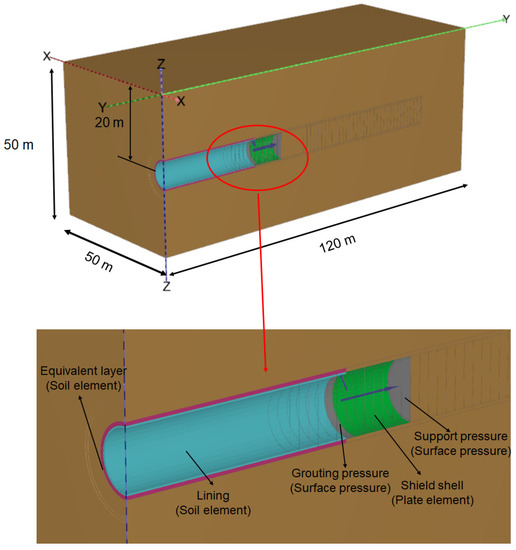
Figure 8.
Numerical model of equivalent layer method.
Table 5.
Properties of lining.
Figure 9 shows the influence of the thickness of the equivalent layer () on ground deformation with the same E of the equivalent layer. The had a great impact on the ground deformation. As the increased from 10 cm to 50 cm, the surface settlement increased from 35 mm to 63 mm. The surface settlement increased almost linearly with the increase in the . This is because the E of the equivalent layer was smaller than that of the soil, and the larger the was, the larger the deformation that was induced. The was related to the volume of grouting and the disturbance of surrounding soil during excavation. This indicates that for better control of the surface settlement, the should be reduced. The grouting volume should be reasonably controlled during tunnel construction, and the over-excavation and disturbance of the surrounding soil should be avoided as much as possible.
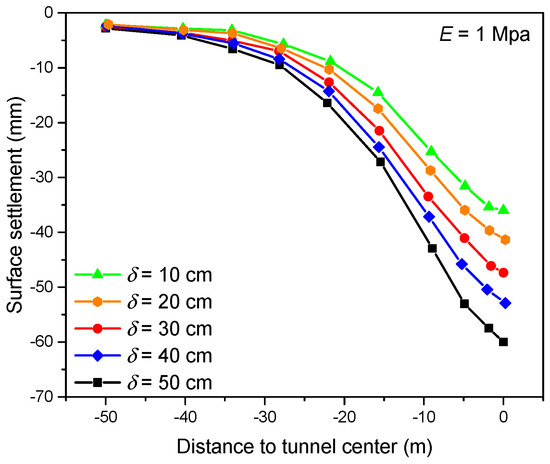
Figure 9.
Surface settlement with different thicknesses of equivalent layer (δ).
Figure 10 shows the influence of the E of the equivalent layer on ground deformation with the same . When the E of the equivalent layer was very large (10 MPa) or small (0.1 MPa), the surface settlement was rather small, while when the E of the equivalent layer was in the middle value (1 MPa), the surface settlement was large. The surface deformation was insensitive to changes in E. The reason for this is that when the E of the equivalent layer was large, the deformation of the equivalent layer itself was small. The equivalent layer could support the overburdened soil; in this way the surface settlement was reduced. When the E of the equivalent layer was too small, the support of the equivalent layer on the overburdened soil was almost non-existent, the lateral compression of the soil made the tunnel lining uplift, and the surface settlement decreased. The E of equivalent the layer was related to the properties of the grouting materials. This indicates that for the better control of the surface settlement, the optimization of the ratio of the grouting materials should be explored.
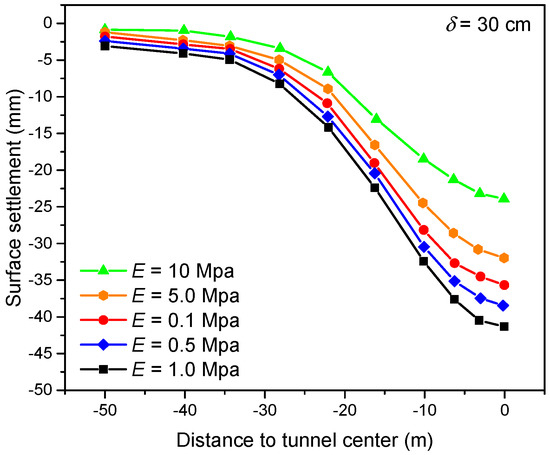
Figure 10.
Surface settlement with different elastic moduli of equivalent layer (E).
From the above parametric analysis, it could be seen that the and E of the equivalent layer both had different influences on the surface settlement. In the numerical simulation of shield tunnels, it is very important to select the parameters of the equivalent layer method correctly. At present, most of the values of the equivalent layer parameters come from empirical values, which will inevitably affect the calculation accuracy of the surface settlement. In construction, the composition of the grouts used in tail grouting only differ a little [33,34,35]. Combined with the above sensitivity analysis, the E of the equivalent layer can be referenced to the empirical value of the strength of the conventional grouts [34,35]. The thickness of the equivalent layer could use the measured monitoring data by back analysis to find the suitable value. With the empirical value of E and the calculated thickness of the equivalent layer, the ground deformation could be predicted more accurately.
4. Numerical Simulation
4.1. Numerical Model
Based on the project overview in Section 2, the research area of the newly built tunnel Line 12 and the existing tunnel Line 10 was about 100 m × 120 m. In order to simplify the model, it was approximately considered that Line 12 and Line 10 intersected in a straight line with an angle of 60 degrees. The numerical model is shown in Figure 11. The dimensions of the numerical model were 100 m × 120 m × 50 m, the boundary conditions were the same as the numerical model in Section 3.2, and the buried depth and diameter of the tunnel were according to the project overview in Section 2. The finite-element model consisted of approximately 188,000 nodes and 106,000 elements.
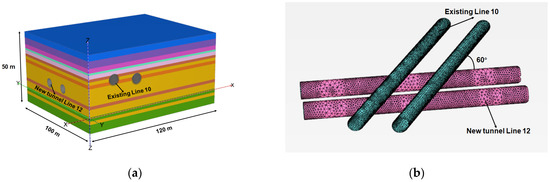
Figure 11.
Three-dimensional numerical model (a) and relative position of two tunnels (b).
The Hardening Soil Small-Strain (HSS) constitutive model was adopted for the ground soils’ modeling, which considers the nonlinear relationship between shear stiffness and soil strain within the range of small strains. The power exponent (m) related to the stress level is generally 0.5 for silt and sandy soil [36]; for cohesive soil, the value of m ranges from 0.5 to 1. The Poisson’s ratio is assumed to be a constant, which is 0.2 in analyses. The reference stress is generally taken as 100 kPa. The dilatation angle can be taken as for sandy soils, and generally 0 for cohesive soils [37]. The stiffness parameters include the tangent stiffness for primary oedometer loading (), secant stiffness in the standard drained triaxial test (), and unloading/reloading stiffness from drained triaxial test (). According to the existing research [38], the three parameters used in this study could be calculated (see in Appendix A). The reference shear modulus at very small strains () was different for cohesive soil and sandy soil (see in Appendix A). The detailed parameters of different soils in the numerical simulation are listed in Table 6.
Table 6.
Geotechnical properties of soil layers in numerical analysis.
The numerical models of the tunnel and the tail grouting simulated using the equivalent layer method are shown in Figure 11. The lining was simulated by soil elements with the same parameters listed in Table 5. The shield shell was simulated by a plate element, and the tail grouting was simulated by soil elements by using the equivalent layer method, the detailed geotechnical properties of which are shown in Table 7.
Table 7.
Geotechnical properties of shield shell and equivalent layer.
4.2. Numerical Results
Figure 12 shows the transverse settlement profile of the newly built tunnel Line 12 with the advancement of the shield tunnel face. With the advancement of the shield, the surface settlement continued to increase and finally tended to be stabilized. When the tunnel face exceeded the observation section, the rate of settlement growth decreased. The transverse settlement profile was distributed with two peaks. Since the left line was excavated ahead of the right line, the surface settlement above the left line was always larger than the surface above the right line during the construction process. After the completion of the twin lines’ construction, the surface settlement curve basically presented symmetrical distribution. With the advancement of the tunnel face, the settlement trough gradually expanded. This indicates that tunnel face excavation is the main cause of surface settlement.
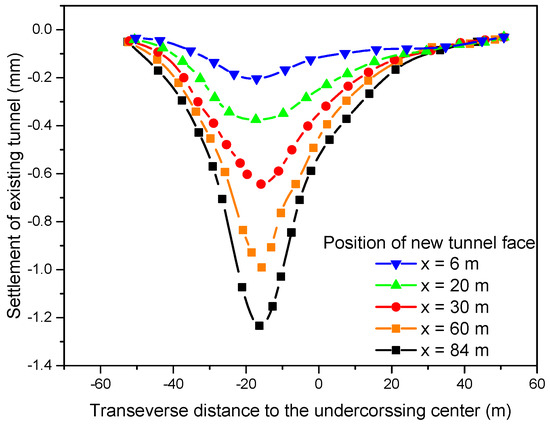
Figure 12.
Transverse settlement profile of Line 12 with advancement of shield tunnel face.
Figure 13 shows the comparison of monitoring data and the simulated results of the transverse settlement of the newly built tunnel Line 12 with different of the equivalent layer in the final excavation step. It can be seen in Figure 13 that the settlement with = 1.8 was the closest to the monitoring data, when E = 2 MPa. The simulated results of the settlement of the existing tunnel using the equivalent layer method with = 1.8 was consistent with the field monitoring data, which were considered as the calibrated values to predict the thickness of the equivalent layer. With the increase in , the deformation of the existing tunnel decreased. The physical mechanism of was closely related to the disturbance of surrounding soil during excavation. A larger represented a greater disturbance range to surrounding soil. In order to reduce the deformation of the existing tunnel, disturbance to the surrounding soil caused by tunnel over-excavation was supposed to be controlled. In this way, grouting materials with higher strengths were supposed to be injected into the tail gap. For the better control of the surface settlement, the should be reduced. The grouting volume should be reasonably controlled during tunnel construction. When the grouting volume is too little, the tail gap cannot be filled, which leads to the larger deformation of existing tunnels. When the grouting volume is too much, the grout disturbs the surrounding soil too much, which also leads to larger deformation. A more advanced shield machine should be put into use to reduce the over-excavation and disturbance induced by shield construction.
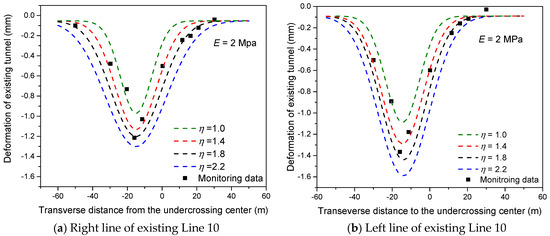
Figure 13.
Deformation of right line (a) and left line (b) of existing Line 10 after excavation of Line 12 with different η.
Figure 14 shows the comparison of monitoring data and the simulated results of the transverse settlement of the newly built tunnel Line 12 with different of the equivalent layer at the final excavation step. It can be seen in Figure 14 that the settlement with E = 2 MPa was the closest to the monitoring data when = 1.8. This is because the E of the grouting materials used in Beijing Metro Line 12 was close to 2 MPa. The value of E used in numerical analysis should refer to the properties of grouting materials in construction. With the increase in E, the deformation of existing tunnels reduced. This is because the higher strength of tail grouts could resist soil deformation. However, the higher strength of tail grouts needs more materials consumption, which will raise the budget for tunnel excavation. In order to pursue a balance between deformation control and budget, a proper ratio of grouting materials should be arranged. Materials with E = 2 MPa are suitable for the deformation control of undercrossed tunnels.
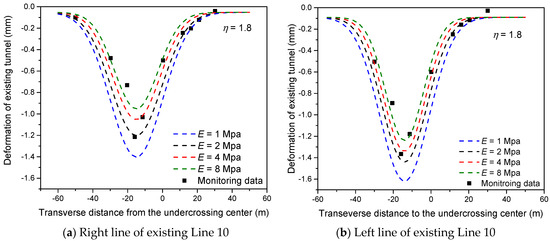
Figure 14.
Deformation of right line (a) and left line (b) of existing Line 10 after excavation of Line 12 with different E.
Figure 15 shows the comparison of monitoring data and the simulated settlement of a single point that varied with time of the newly built tunnel Line 12 when = 1.8 and E = 2 MPa. It can be seen from Figure 15 that the numerical model could accurately predict the settlement of the tunnels. Both the numerical results and the measured data show that the settlement of the left line of Line 10 was larger, which was due to the tunnel on the left line of Line 10 being closer to the excavation tunnel. For soft soil such as silt and silty clay, = 1.8 and E = 2 MPa were considered as proper empirical values for the equivalent layer method, which could be used as references for other shield tunnel constructions in soft soil.
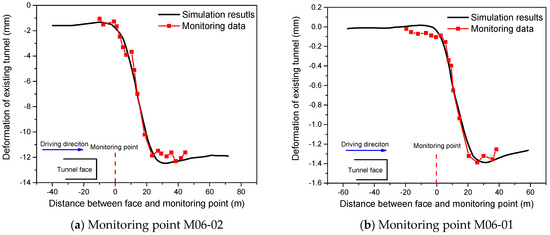
Figure 15.
Comparison of numerical results and monitoring data at monitoring point M06-02 (a) and M06-01 (b).
The empirical formulation proposed by Peck [8] was used to verify the rationality of the numerical results. It is the most extensively utilized empirical method in engineering practice, which assumes the transverse ground surface settlement trough can be represented by a Gaussian distribution curve. The formulation is:
where is the settlement at the offset distance x from the tunnel center line, is the maximum settlement above the tunnel center line, and i is the width coefficient of the surface settlement trough.
Figure 16 shows the comparison of numerical results and the Peck prediction of the right line and left line of the existing Line 10 after the excavation of Line 12 with the parameters calibrated above. It can be seen that the numerical results are close to the Peck prediction. The rationality of the equivalent layer method with calibrated parameters is verified. The numerical results show larger deformation at the tunnel center than that of Peck prediction. When the deformation restrictions are relatively strict, the method proposed by this paper can more accurately predict the deformation caused by tunnel undercrossing. In the process of construction, the strength and volume of grouts should be increased to control the excessive settlement.
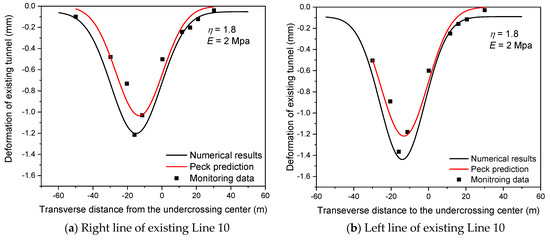
Figure 16.
Comparison of numerical results and Peck prediction of right line (a) and left line (b) of existing Line 10 after excavation of Line 12.
From the above analysis, it can be seen that the tail grouting and construction of a new tunnel undercrossing an existing tunnel could be accurately simulated by using the equivalent layer method. For soft soil such as silt and silty clay, the thickness of the equivalent layer () is suggested to be 1.8 times of the shield tail gap (= 1.8), which could be a reference for other shield tunnel constructions in soft soil. From the numerical results, it can be seen that after the new tunnel is excavated, the maximum settlement of the existing structure mainly occurs at the undercrossing position of the shield. Tunnel face excavation is the main cause of surface settlement. The effect of tail grouting also has an influence on the surface settlement. The surface settlement caused by grouting with different thicknesses and different proportions of grouts accounts for about 10% of the total settlement.
5. Conclusions
In this paper, the equivalent layer method was investigated, which was used to simulate ground deformation induced by shield construction and tail grouting by numerical analysis. A three-dimensional finite simulation was used to explore the equivalent layer method by parametric analysis. Based on a shield tunnel project of Beijing’s newly built Metro Line 12 undercrossing the existing Metro Line 10, the applicability of the equivalent layer method was verified, and the empirical value for the equivalent layer method was summarized. The conclusions are as follows:
- (1)
- The equivalent layer method uses a homogeneous, equal thickness, elastic soil layer to simulate the reinforced soil around the tunnel linings. Ground deformation is simulated by replacing the actual soil layer and grouting around the lining with the equivalent layer. The equivalent layer method is simple to use in numerical analysis to analyze the construction and tail grouting of shield tunnel with wide applicability.
- (2)
- The parametric analysis was carried out to study the influence of the thickness (δ) and elastic modulus (E) of the equivalent layer on surface settlement. The surface settlement increases almost linearly with the increase in the δ. The surface deformation is insensitive to changes in E. When the E of the equivalent layer is very large (10 MPa) or small (0.1 MPa), the surface settlement is rather small, while when the E of equivalent layer is in the middle value (1 MPa), the surface settlement is large. The δ is the dominating factor affecting the surface settlement.
- (3)
- Based on the case study of Beijing Metro Lines project, a numerical model was established with the equivalent layer method. The predicted surface settlement was analyzed and compared with monitoring data. The applicability of the equivalent layer method was verified. Tunnel face excavation was the main cause of surface settlement. Empirical values for the equivalent layer method were summarized, which were η = 1.8 and E equal to that of cement soil. The empirical values summarized from field data could be a reference for other shield tunnel constructions in soft soil. The accurate prediction using methods in this paper shows the influence of tail grouting on ground deformation; it could control the volume of grouting materials in construction, which is beneficial for reducing budgets and environmental protection.
- (4)
- There are still some limitations in this paper. The research in this paper was carried out based on the case study of Beijing Metro Line 10 and 12, and the empirical values of the equivalent layer method obtained are more suitable for soft soil. The empirical values for sand or other special soils require more back-analysis based on field cases. The E of the equivalent layer is derived from the empirical values and back analysis. If the grouting layer can be sampled on-site, a more accurate prediction can be obtained, and the empirical value can be compared and corrected. In the future, more research can be carried out based on the case of tunnels excavated in different soils.
Author Contributions
Conceptualization, J.L. and X.T.; methodology, J.L.; software, J.L. and J.Y.; validation, J.L., X.T. and T.W.; formal analysis, J.L.; investigation, W.L.; resources, C.F.; data curation, T.W.; writing—original draft preparation, J.L.; writing—review and editing, X.T.; visualization, T.W.; supervision, X.T.; project administration, C.F.; funding acquisition, X.T. All authors have read and agreed to the published version of the manuscript.
Funding
This work was funded by the Key Water Science and Technology Project of Zhejiang Province, grant number RB2027 and Zhejiang Province Public Welfare Technology Application Research Project, grant number LGG22E080002.
Institutional Review Board Statement
Not applicable.
Informed Consent Statement
Not applicable.
Data Availability Statement
Not applicable.
Conflicts of Interest
The authors declare no conflict of interest.
Abbreviations
| Notation | |
| Thickness of equivalent layer; | |
| E | Elastic modulus; |
| Computed shield tail gap; | |
| Coefficient of equivalent layer method; | |
| k | Permeability; |
| Unit weight; | |
| Compression modulus; | |
| c′ | Effective cohesion; |
| Effective internal friction angle; | |
| Poisson’s ratio; | |
| t | Thickness of lining; |
| Secant stiffness in standard drained triaxial test; | |
| Tangent stiffness for primary oedometer loading; | |
| Unloading/reloading stiffness from drained triaxial test; | |
| Reference shear modulus at very small strains; | |
| m | Power exponent; |
| Threshold shear strain; | |
| The settlement at the offset distance x from the tunnel center line; | |
| The maximum settlement above the tunnel center line; | |
| i | The width coefficient of the surface settlement trough. |
Appendix A
The parameters for the HSS model are listed as follows:
References
- Tang, X.W.; Gan, P.L.; Liu, W.; Zhao, Y. Surface Settlements Induced by Tunneling in Permeable Strata: A Case History of Shenzhen Metro. J. Zhejiang Univ.-Sci. A 2017, 18, 757–775. [Google Scholar] [CrossRef]
- Liu, W.; Zhao, Y.; Shi, P.; Li, J.; Gan, P. Face Stability Analysis of Shield-Driven Tunnels Shallowly Buried in Dry Sand Using 1-g Large-Scale Model Tests. Acta Geotech. 2018, 13, 693–705. [Google Scholar] [CrossRef]
- Yang, H.; Shi, H.; Jiang, X.; Liu, C. Influence of Construction Process of Double-Line Shield Tunnel Crossing Frame Structure on Ground Settlement. Geotech. Geol. Eng. 2020, 38, 1531–1545. [Google Scholar] [CrossRef]
- Tang, X.; Liang, J.; Liu, W.; Ye, Y.; Yu, Y. Modification of Peck Formula to Predict Ground Surface Settlement of Twin Tunnels in Low Permeability Soil. Adv. Civ. Eng. 2021, 2021, 6698673. [Google Scholar] [CrossRef]
- Liu, W.; Wu, B.; Shi, P.; Xu, X. Analysis on Face Stability of Rectangular Cross-Sectional Shield Tunneling Based on an Improved Two-Dimensional Rotational Mechanism. Acta Geotech. 2021, 16, 3725–3738. [Google Scholar] [CrossRef]
- Liu, W.; Wu, Y.; Zhao, H.; Xu, X.; Miao, L. Deformations of Subway Tunnels Induced by the Overcrossing Jacked Box Tunnels. Symmetry 2021, 13, 1800. [Google Scholar] [CrossRef]
- Peila, D.; Chieregato, A.; Martinelli, D.; Salazar, C.O.; Shch, R.; Boscaro, A.; Dal Negre, E.; Picchio, A. Long Term Behavior of Two Component Back-Fill Grout Mix Used in Full Face Mechanized Tunneling. 2015. Available online: https://core.ac.uk/download/pdf/76530807.pdf (accessed on 10 July 2022).
- Peck, R.B. Deep Excavations and Tunnelling in Soft Ground. In Proceedings of the 7th International Conference on Soil Mechanics and Foundations, Mexico City, Mexico, 1969; pp. 225–290. Available online: https://www.issmge.org/uploads/publications/1/38/1969_03_0005.pdf (accessed on 10 July 2022).
- O’Reilly, M.P.; New, B.M. Settlement above Tunnels in the United Kingdom—Their Magnitude and Prediction. In Tunnelling 82, Proceedings of the 3rd International Symposium, Brighton, UK, 7–11 June 1982; IMM: London, UK, 1982; pp. 173–181. [Google Scholar]
- Attewell, P.B.; Woodman, J.P. Predicting the Dynamics of Ground Settlement and Its Derivatives Caused by Tunnelling in Soil. Ground Eng. 1982, 15, 13–22. [Google Scholar]
- Suwansawat, S.; Einstein, H.H. Describing Settlement Troughs over Twin Tunnels Using a Superposition Technique. J. Geotech. Geoenviron. Eng. 2007, 133, 445–468. [Google Scholar] [CrossRef]
- Lin, Q.; Tian, Y.; Lu, D.; Gong, Q.; Du, X.; Gao, Z. A Prediction Method of Ground Volume Loss Variation with Depth Induced by Tunnel Excavation. Acta Geotech. 2021, 16, 3689–3707. [Google Scholar] [CrossRef]
- Loganathan, N. Analytical Prediction for Tunneling-Induced Ground Movements in Clays. J. Geotech. Geoenviron. Eng. 1998, 124, 846–856. [Google Scholar] [CrossRef]
- Chou, W.; Bobet, A. Predictions of Ground Deformations in Shallow Tunnels in Clay—ScienceDirect. Tunn. Undergr. Space Technol. Inc. Trenchless Technol. Res. 2002, 17, 3–19. [Google Scholar] [CrossRef]
- Bernat, S.; Cambou, B. Soil-Structure Interaction in Shield Tunnelling in Soft Soil. Comput. Geotech. 1998, 22, 221–242. [Google Scholar] [CrossRef]
- Chakeri, H.; Ozcelik, Y.; Unver, B. Investigation of Ground Surface Settlement in Twin Tunnels Driven with EPBM in Urban Area. Arab. J. Geosci. 2015, 8, 7655–7666. [Google Scholar] [CrossRef]
- Zhang, Z.X.; Liu, C.; Huang, X.; Kwok, C.Y.; Teng, L. Three-Dimensional Finite-Element Analysis on Ground Responses during Twin-Tunnel Construction Using the URUP Method. Tunn. Undergr. Space Technol. 2016, 58, 133–146. [Google Scholar] [CrossRef]
- Liang, J.; Tang, X.; Wang, T.; Ye, Y.; Liu, Y. Numerical Analysis of the Influence of a River on Tunnelling-Induced Ground Deformation in Soft Soil. J. Zhejiang Univ. Sci. A 2022, 23, 564–578. [Google Scholar] [CrossRef]
- Addenbrooke, T.I.; Potts, D.M. Twin Tunnel Interaction: Surface and Subsurface Effects. Int. J. Geomech. 2001, 1, 249–271. [Google Scholar] [CrossRef]
- Mollon, G.; Dias, D.; Soubra, A.-H. Probabilistic Analyses of Tunneling-Induced Ground Movements. Acta Geotech. 2013, 8, 181–199. [Google Scholar] [CrossRef]
- Do, N.-A.; Dias, D.; Oreste, P.; Djeran-Maigre, I. Three-Dimensional Numerical Simulation of a Mechanized Twin Tunnels in Soft Ground. Tunn. Undergr. Space Technol. 2014, 42, 40–51. [Google Scholar] [CrossRef]
- Zhang, Y.; Yin, Z.; Xu, Y. Analysis on Three-Dimensional Ground Surface Deformations due to Shield Tunnel. Chin. J. Rock Mech. Eng. 2002, 21, 388–392. (In Chinese) [Google Scholar]
- Yoo, C. Interaction between Tunneling and Groundwater—Numerical Investigation Using Three Dimensional Stress–Pore Pressure Coupled Analysis. J. Geotech. Geoenviron. Eng. 2005, 131, 240–250. [Google Scholar] [CrossRef]
- Song, J.; Miao, L.; Li, C.; Liu, Z. Construction Effect Analysis of near Tunnel Based on the Ground-Equivalent Circle Zone-Lining Model. In Proceedings of the 2011 International Conference on Electric Technology and Civil Engineering (ICETCE), Jiujiang, China, 22–24 April 2011; pp. 2059–2062. [Google Scholar]
- Liu, C.; Zhang, Z.; Regueiro, R.A. Pile and Pile Group Response to Tunnelling Using a Large Diameter Slurry Shield—Case Study in Shanghai. Comput. Geotech. 2014, 59, 21–43. [Google Scholar] [CrossRef]
- Xie, X.; Yang, Y.; Ji, M. Analysis of Ground Surface Settlement Induced by the Construction of a Large-Diameter Shield-Driven Tunnel in Shanghai, China. Tunn. Undergr. Space Technol. 2016, 51, 120–132. [Google Scholar] [CrossRef]
- Zhou, Z.; Chen, Y.; Liu, Z.; Miao, L. Theoretical Prediction Model for Deformations Caused by Construction of New Tunnels Undercrossing Existing Tunnels Based on the Equivalent Layered Method. Comput. Geotech. 2020, 123, 103565. [Google Scholar] [CrossRef]
- Tong, F.; Yang, J.; Duan, M.Q.; Ma, X.F.; Li, G.C. The Numerical Simulation of Rock Mass Grouting: A Literature Review. Eng. Comput. 2022, 39, 1902–1921. [Google Scholar] [CrossRef]
- Kasper, T.; Meschke, G. A 3D Finite Element Simulation Model for IBM Tunnelling in Soft Ground. Int. J. Numer. Anal. Methods Geomech. 2004, 28, 1441–1460. [Google Scholar] [CrossRef]
- Fu, C.; Gao, Y. Numerical Analysis on the Behavior of Existing Tunnels Subjected to the Undercrossed Shield Tunneling at a Small Proximity. Adv. Civ. Eng. 2020, 2020, 8823331. [Google Scholar] [CrossRef]
- Shiba, Y.; Kawashima, K.; Obinata, N.; Kano, T. An Evaluation Method of Longitudinal Stiffness of Shield Tunnel Linings for Application to Seismic Response Analyses. Doboku Gakkai Ronbunshu 1988, 398, 319–327. [Google Scholar] [CrossRef]
- Uchida, K.; Wasa, Y.; Kanai, M. Design of the Shield Tunnel for the Trans-Tokyo Bay Highway. Tunn. Undergr. Space Technol. 1992, 7, 251–261. [Google Scholar] [CrossRef]
- He, S.; Lai, J.; Wang, L.; Wang, K. A Literature Review on Properties and Applications of Grouts for Shield Tunnel. Constr. Build. Mater. 2020, 239, 117782. [Google Scholar] [CrossRef]
- Mao, J.; Yuan, D.; Jin, D.; Zeng, J. Optimization and Application of Backfill Grouting Material for Submarine Tunnel. Constr. Build. Mater. 2020, 265, 120281. [Google Scholar] [CrossRef]
- Liang, X.; Ying, K.; Ye, F.; Su, E.; Xia, T.; Han, X. Selection of Backfill Grouting Materials and Ratios for Shield Tunnel Considering Stratum Suitability. Constr. Build. Mater. 2022, 314, 125431. [Google Scholar] [CrossRef]
- Janbu, N. Soil Compressibility as Determined by Odometer and Triaxial Tests. In Proceedings of the European Conference on Soil Mechanics and Foundation Engineering, Wiesbaden, Germany, 11 November 1963; Volume 1, pp. 19–25. [Google Scholar]
- Bolton, M.D. The Strength and Dilatancy of Sands. Géotechnique 1986, 36, 65–78. [Google Scholar] [CrossRef]
- Wang, W.; Wang, H.; Xu, Z. Study of parameters of HS-Small model used in numerical analysis of excavations in Shanghai area. Rock Soil Mech. 2013, 34, 1766–1774. [Google Scholar] [CrossRef]
Publisher’s Note: MDPI stays neutral with regard to jurisdictional claims in published maps and institutional affiliations. |
© 2022 by the authors. Licensee MDPI, Basel, Switzerland. This article is an open access article distributed under the terms and conditions of the Creative Commons Attribution (CC BY) license (https://creativecommons.org/licenses/by/4.0/).