Article

A Study of Evaluation Method for Turbocharger Turbine Based on Joint Operation Curve

School of Automotive Studies, Tongji University, Shanghai 201804, China
*
Author to whom correspondence should be addressed.
Sustainability 2022, 14(16), 9952; https://doi.org/10.3390/su14169952
Submission received: 10 July 2022 / Revised: 9 August 2022 / Accepted: 10 August 2022 / Published: 11 August 2022

Abstract

:
Turbochargers have evolved with the advancement of engine technology. In this study, we pro-posed a concept of joint operation, based on the operating characteristics of the compressor and turbine. Furthermore, a turbine evaluation method was proposed based on this concept, and an optimization application study of the turbine impeller blade number and turbine casing was con-ducted and verified. The results showed that the performance evaluation method based on the joint point could predict the optimization trend of turbine performance more accurately, the turbine output power optimized based on our new method evidently had advantages over the original turbine, and the joint point showed better overall performance. The original single-entry turbine could be optimized into a 9-blade twin-entry turbine having better response characteristics. The maximum torque of the optimized engine was 5.4% higher than that of the original engine, and the minimum brake specific fuel consumption (BSFC) was reduced by 2.1%. In the low and medium speed operating region, engine torque was increased by up to 3.2% and BSFC was reduced by up to 1.1% compared to the turbine optimized by conventional methods. Hence, the optimization effect of our new method was proven.

1. Introduction

Due to rising fuel prices and stricter greenhouse gas emission regulations, reducing fuel consumption and emissions has become an endeavor for the internal combustion engine industry [1,2,3,4]. For example, the European Union has set a 37.5% reduction in fuel consumption for passenger cars by 2030 compared to 2021. For the internal combustion engine itself, stringent emission regulations and rising fuel control requirements have prompted the internal combustion engine industry to develop more advanced technologies [5,6,7,8]. To achieve this goal, exhaust gas turbochargers, a key component of the internal combustion engine’s air exchange system, could play a particularly important role. Similarly, the studies of alternative liquid fuels also need to consider the effect of the turbocharger [9]. The turbocharger and the engine match and interact with each other, and the operating characteristics of the engine must be considered while studying the turbocharger [10].
On account of the exhaust characteristics of the engine, the turbocharger turbine operates in an exhaust gas pulse environment where the turbine inlet pressure and temperature change periodically [11,12]. Under pulsed, unsteady conditions, the turbine mostly operates in deviation from the design point condition and even in a zero-admission condition [13]. Copeland et al. [14] studied the difference between the unsteady and steady flow performance of a separated twin-entry turbine, and the steady flow efficiency was found to be higher than the unsteady flow efficiency. Moreover, Rajoo [15] showed in his study that the pulsed, unsteady average efficiency of the turbine deviated from the corresponding quasi-steady efficiency value by up to 32%, indicating that the steady approach was inaccurate.
The automotive turbocharger pulse boost system sets the turbine to work in the engine’s periodic pulse, unsteady exhaust environment; the admission condition at the turbine end changes continuously, and the performance of the turbine further changes periodically with the change in the intake state at the turbine end. Multi-fluid turbine structures and various boost systems have emerged to improve the utilization of pulse energy [16,17]. Currently, the swallowing capacity and efficiency of a turbine can be easily improved by using a twin-entry turbine instead of a single-entry turbine [15]. Other research studies that have focused on the use of single-entry turbine are include [18,19,20]. Cerdoun [21] investigated the unsteady flow process in an asymmetric parallel twin-entry turbine and concluded that increasing the radius of the volute shape could enhance the centrifugal force of the airflow. In addition, Chiong MS [22,23] studied a one-dimensional (1D) numerical model of a twin-entry turbine under full admission pulse flow conditions and predicted the corresponding performance. The full admission condition of the twin-entry turbine occurs only momentarily, and the turbine operates with unequal admission [24,25,26].
In terms of unequal admission conditions, Newton [27] employed a computational fluid dynamics (CFD) software to investigate the flow loss of a twin-entry turbine under full and partial admissions. Costall [28] developed a twin-entry turbine model, which could be used as a simplified single-entry model under full admission conditions, while a more complex model is required for unequal admission conditions. Hajilouy [29] investigated the performance and internal flow field characteristics of a twin-entry turbine under full and extreme admission conditions. Other studies [30,31] have also performed the same experiment, and revealed the mechanism of the influence of the volute structure on the turbine performance.
The compressor is also the key component of the turbocharger, which directly determines the turbocharger performance, as well as the matching performance of the turbocharger and the engine. The compressor is affected by the fluctuation of the engine admission, which makes the flow rate and pressure of the compressor periodically change with the engine operating process. This could further affect the engine performance; for example, the compressed air supercharging system could improve the driving force during the phase of the engine’s increasing crankshaft rotational speed [32]. The works of [33] and [34] presented the periodic changes in air flow at the inlet and outlet of the compressor. Other studies related to the compressor of a turbocharger can be found in [35,36,37].
The performance of turbochargers in a harsh working environment of high temperature and high pressure for a long time will directly affect the performance of an engine. Fan proposed a novel Adaptive Local Maximum-Entropy Surrogate Model, carried out a turbine disk reliability analysis under geometrical uncertainty, and achieved a desirable result [38]. Meng constructed a smooth response surface of the turbine performance by the saddlepoint approximation reliability analysis method and solved a turbine blade design problem [39].
As can be seen from the brief description above, the actual operation of the booster has a non-constant flow at both ends, and the difference between the non-constant flow performance and the corresponding constant flow value is obvious. The performance at both ends of the turbocharger is limited by the structural properties of another end, and a complete performance map is usually unavailable [40]. Meanwhile, the current conventional method of calculating the total efficiency of a turbocharger is to multiply the turbine efficiency, the compressor efficiency, and the turbocharger mechanical efficiency [41]. This calculation method is not objective enough, because the maximum efficiency points of the turbine and compressor are often not in the same operating condition. Moreover, the operation of the turbocharger is a dynamic process of speed change, and the actual efficiency of both the turbine and the compressor is dynamically changing, therefore there are different total efficiencies of the turbocharger for different operating conditions. The internal matching of the compressor to the turbine fundamentally determines the actual operating performance of the turbocharger and the matching performance between the turbocharger and the engine.
There is no in-depth and systematic research on the internal matching between the compressor and turbine, and the important role of the internal matching of their joint, in the design of turbochargers, is not fully reflected. In this study, a combination of experimental and numerical simulations was used to study different turbine structures, and GT-Power and ANSYS CFX were used as the simulation platforms. First, an automotive engine turbocharger turbine was studied and verified. Second, different volutes and turbine impellers with different numbers of blades were designed to produce different turbine structures, and simulations were performed to compare the new turbine structure with the original turbine and determine the differences between the conventional evaluation method and new method. Lastly, different turbine structures were evaluated using our new method, and the best turbine structure was identified. Following this, the corresponding superposition of the compressor power consumption curve and turbine effective power curve were coupled. A new method for optimizing the actual operating performance of the turbine from the perspective of joint matching between the compressor and turbine was proposed. The turbine performance optimized by the two methods was compared, and the new optimization method was proven to be effective and feasible when using equal and unequal admission experiments. The evaluation process and correction method used in this study can provide a future reference for the research and optimal design of turbocharger turbines. Figure 1 shows the framework structure of this paper.

2. Materials and Methods

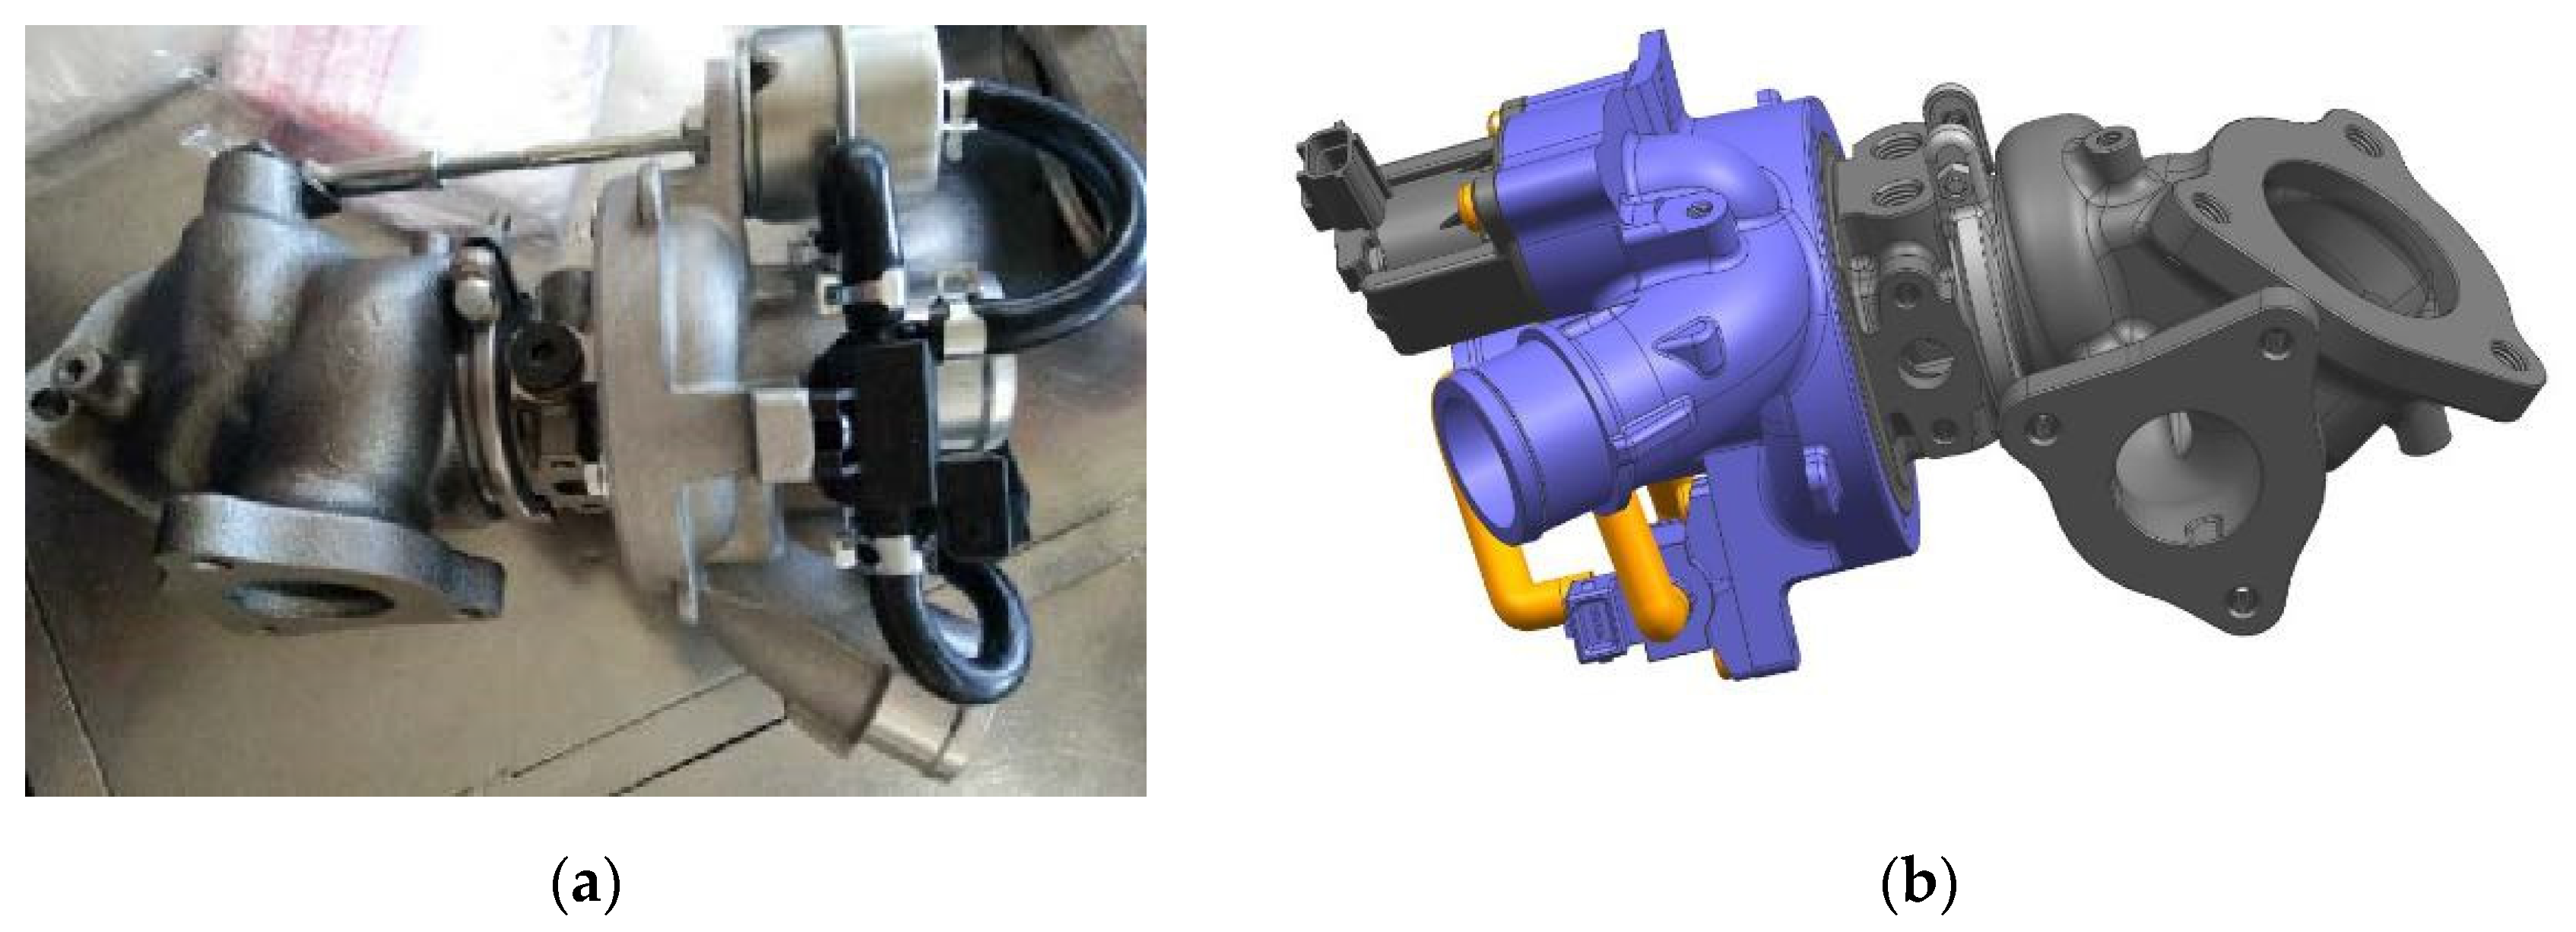
2.1. Research Methodology and Research Objects

A 4-cylinder automotive engine turbocharger turbine was used as the research object. Figure 2 shows the three-dimensional (3D) structure of the physical prototype of the turbocharger. There were five turbine impeller structures of 8-blade, 9-blade, 10-blade, 11-blade, and 12-blade in the optimized design scheme. The volute structures were single-entry and twin-entry, and the two types of volutes were matched with 11-blade and 9-blade impellers, respectively. A total of four turbine structures were combined, as shown in Table 1. Additionally, other structural parameters remained unchanged.

2.2. Setting Model Parameters

The turbine used a full-wheel disk turbine impeller, whose volute was a single-entry volute without a leaf nozzle, and the number of blades of the turbine impeller was 11. Table 2 lists turbine parameters.
The frozen rotor interface was selected as the interface type between the volute and rotation domains and between the rotation and outlet transition domains. The turbulence was modeled in the Navier–Stokes equation solver, using the k-epsilon equation [42]. The walls of the model were set to be smooth, nonslip, and adiabatic [43]. Ideal gas was used as the working fluid. The flow rate and total temperature were set as turbine inlet conditions. At the turbine outlet, where the flow is considered to be subsonic, the static pressure is imposed.
The complex structure of the separate turbine volute required the unstructured grid. The rotational domain of the turbine impeller was arranged with a perfectly matched circumferential grid, and an encrypted O-grid was set around the impeller blade to increase the number of grid layers in the blade top clearance region to obtain a more accurate top clearance flow. The turbine inlet duct and outlet duct were added for better computational convergence. Surface layer meshes were added at each working wall to increase the accuracy of the near-wall flow simulation. Table 3 lists the details for each domain of the turbine model.

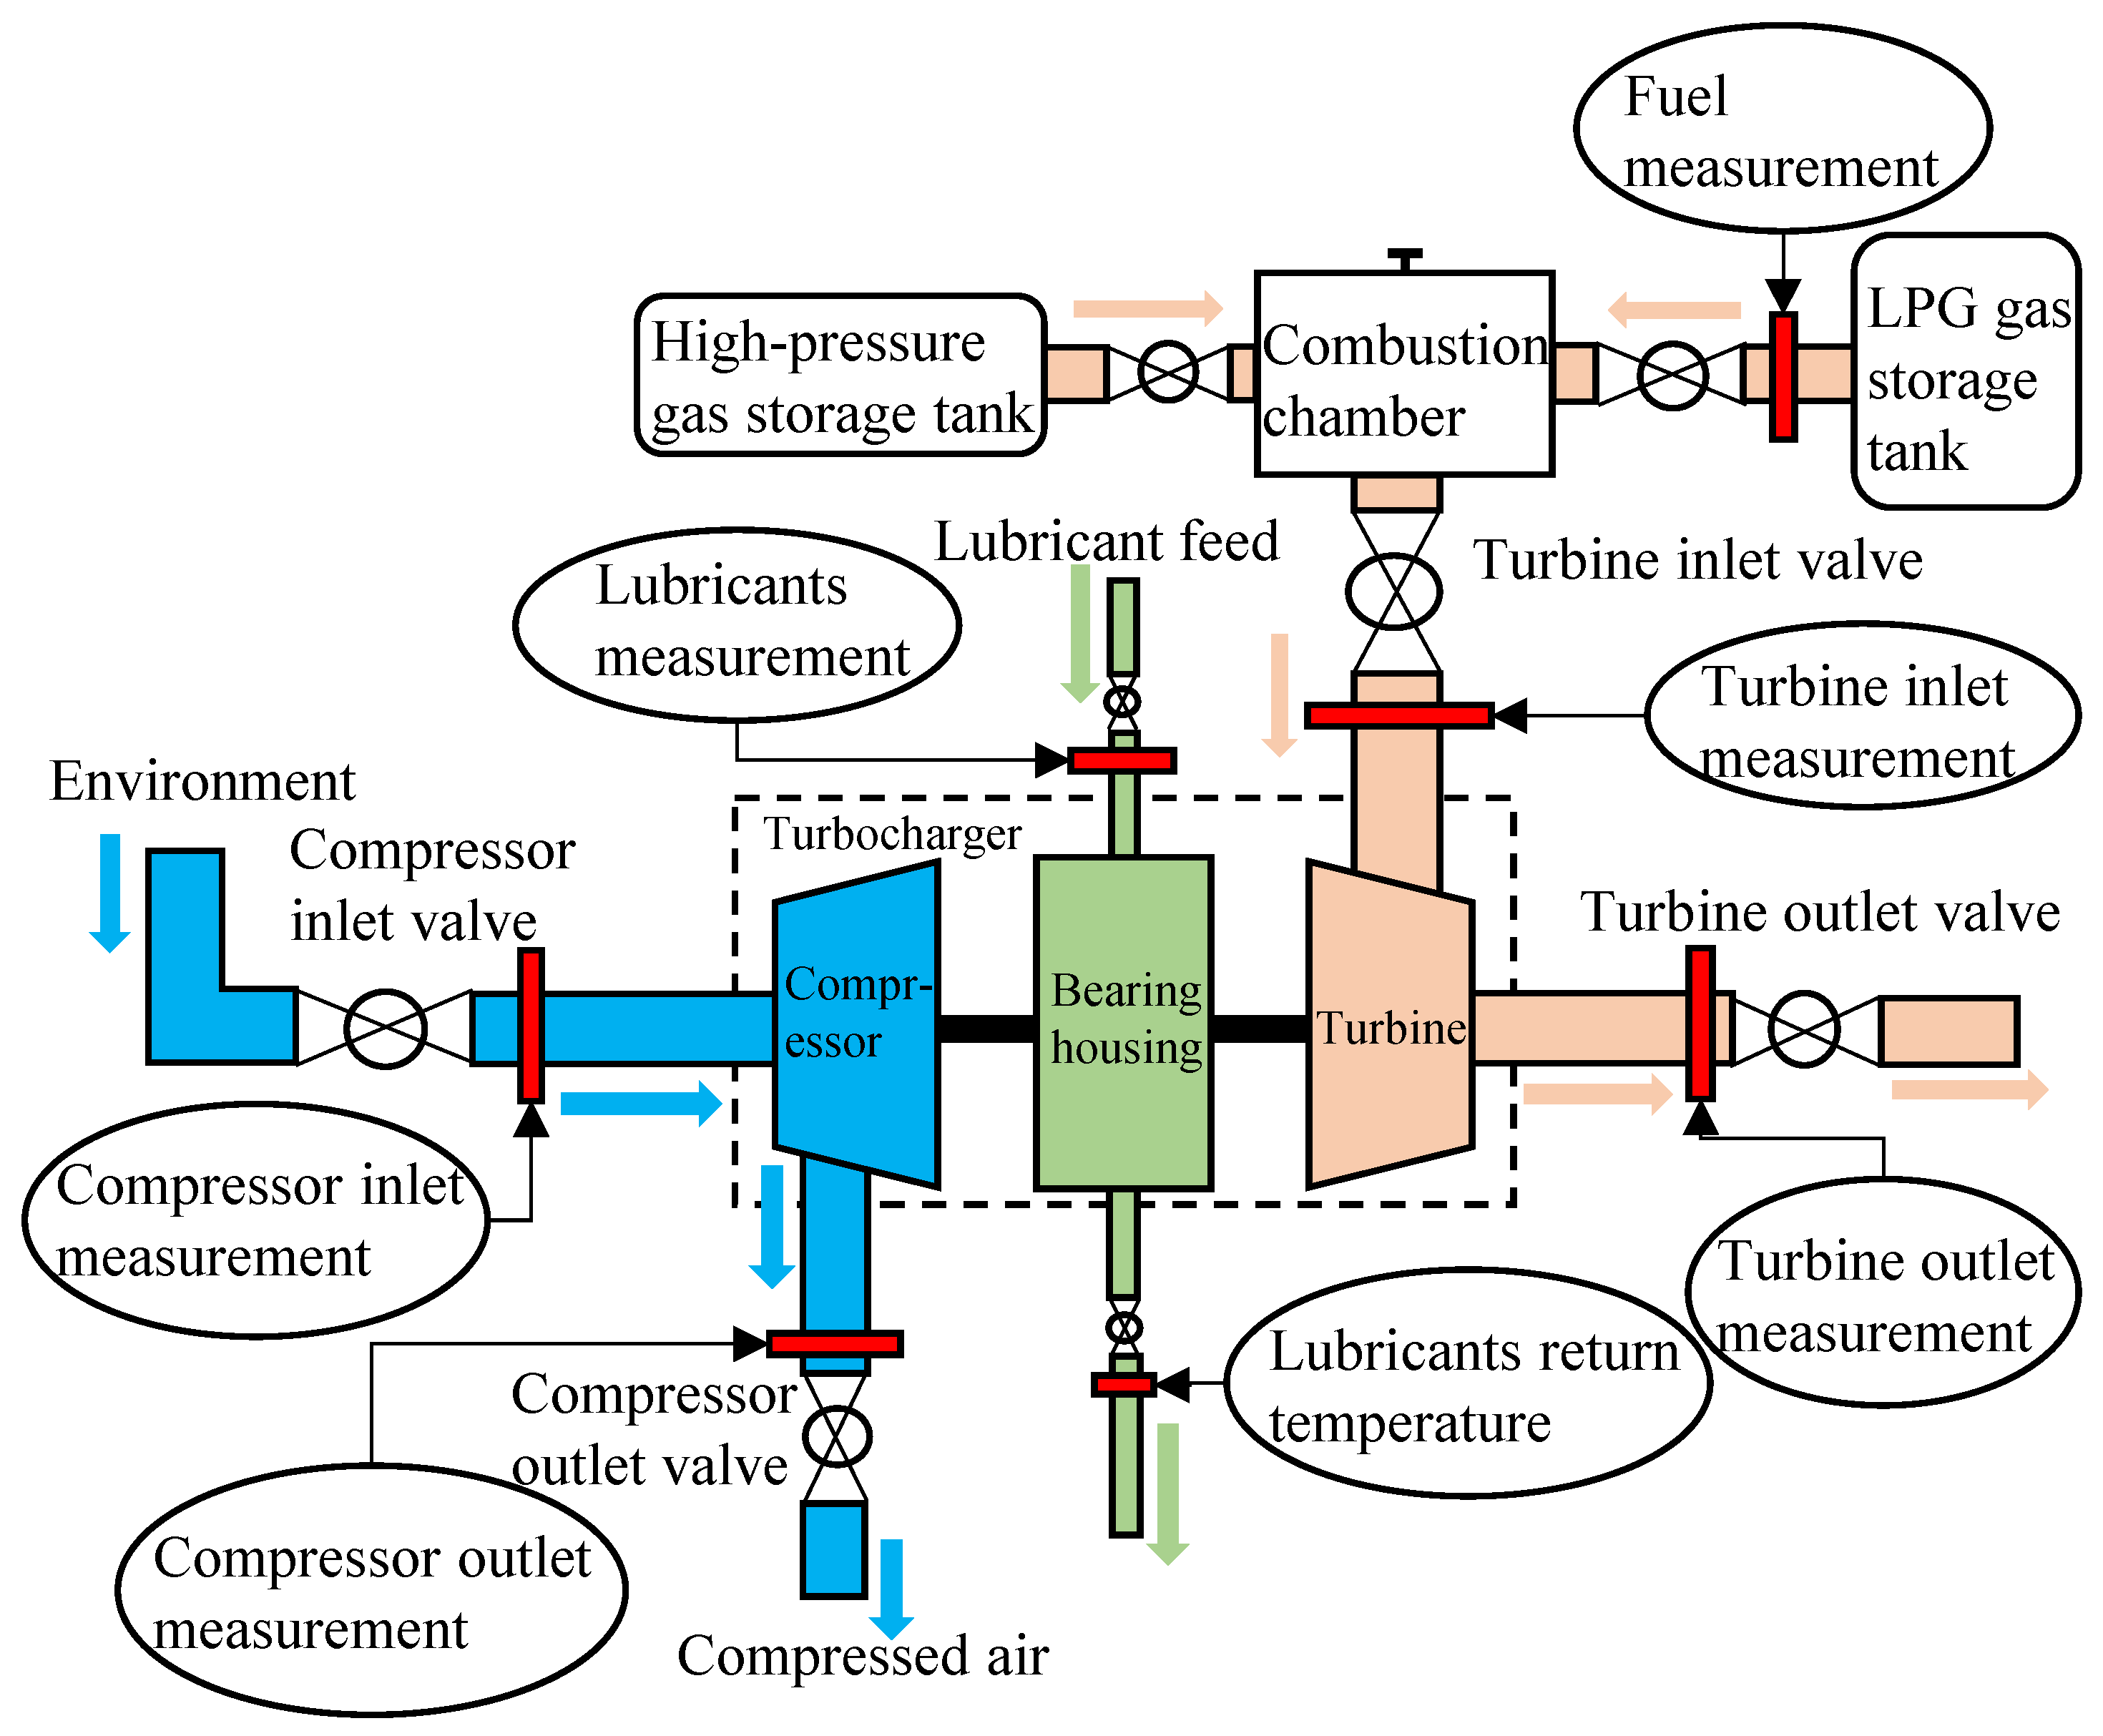
2.3. Test Preparation

In the test, the twin-entry volute was interchangeable with the single-entry volute of the original turbine, and the 9-blade turbine rotor assembly was interchangeable with the 11-blade turbine rotor assembly of the original turbine. The turbine performance tests were conducted on a Kratzer turbocharger test stand, and Figure 3 shows the schematic diagram of the bench arrangement.

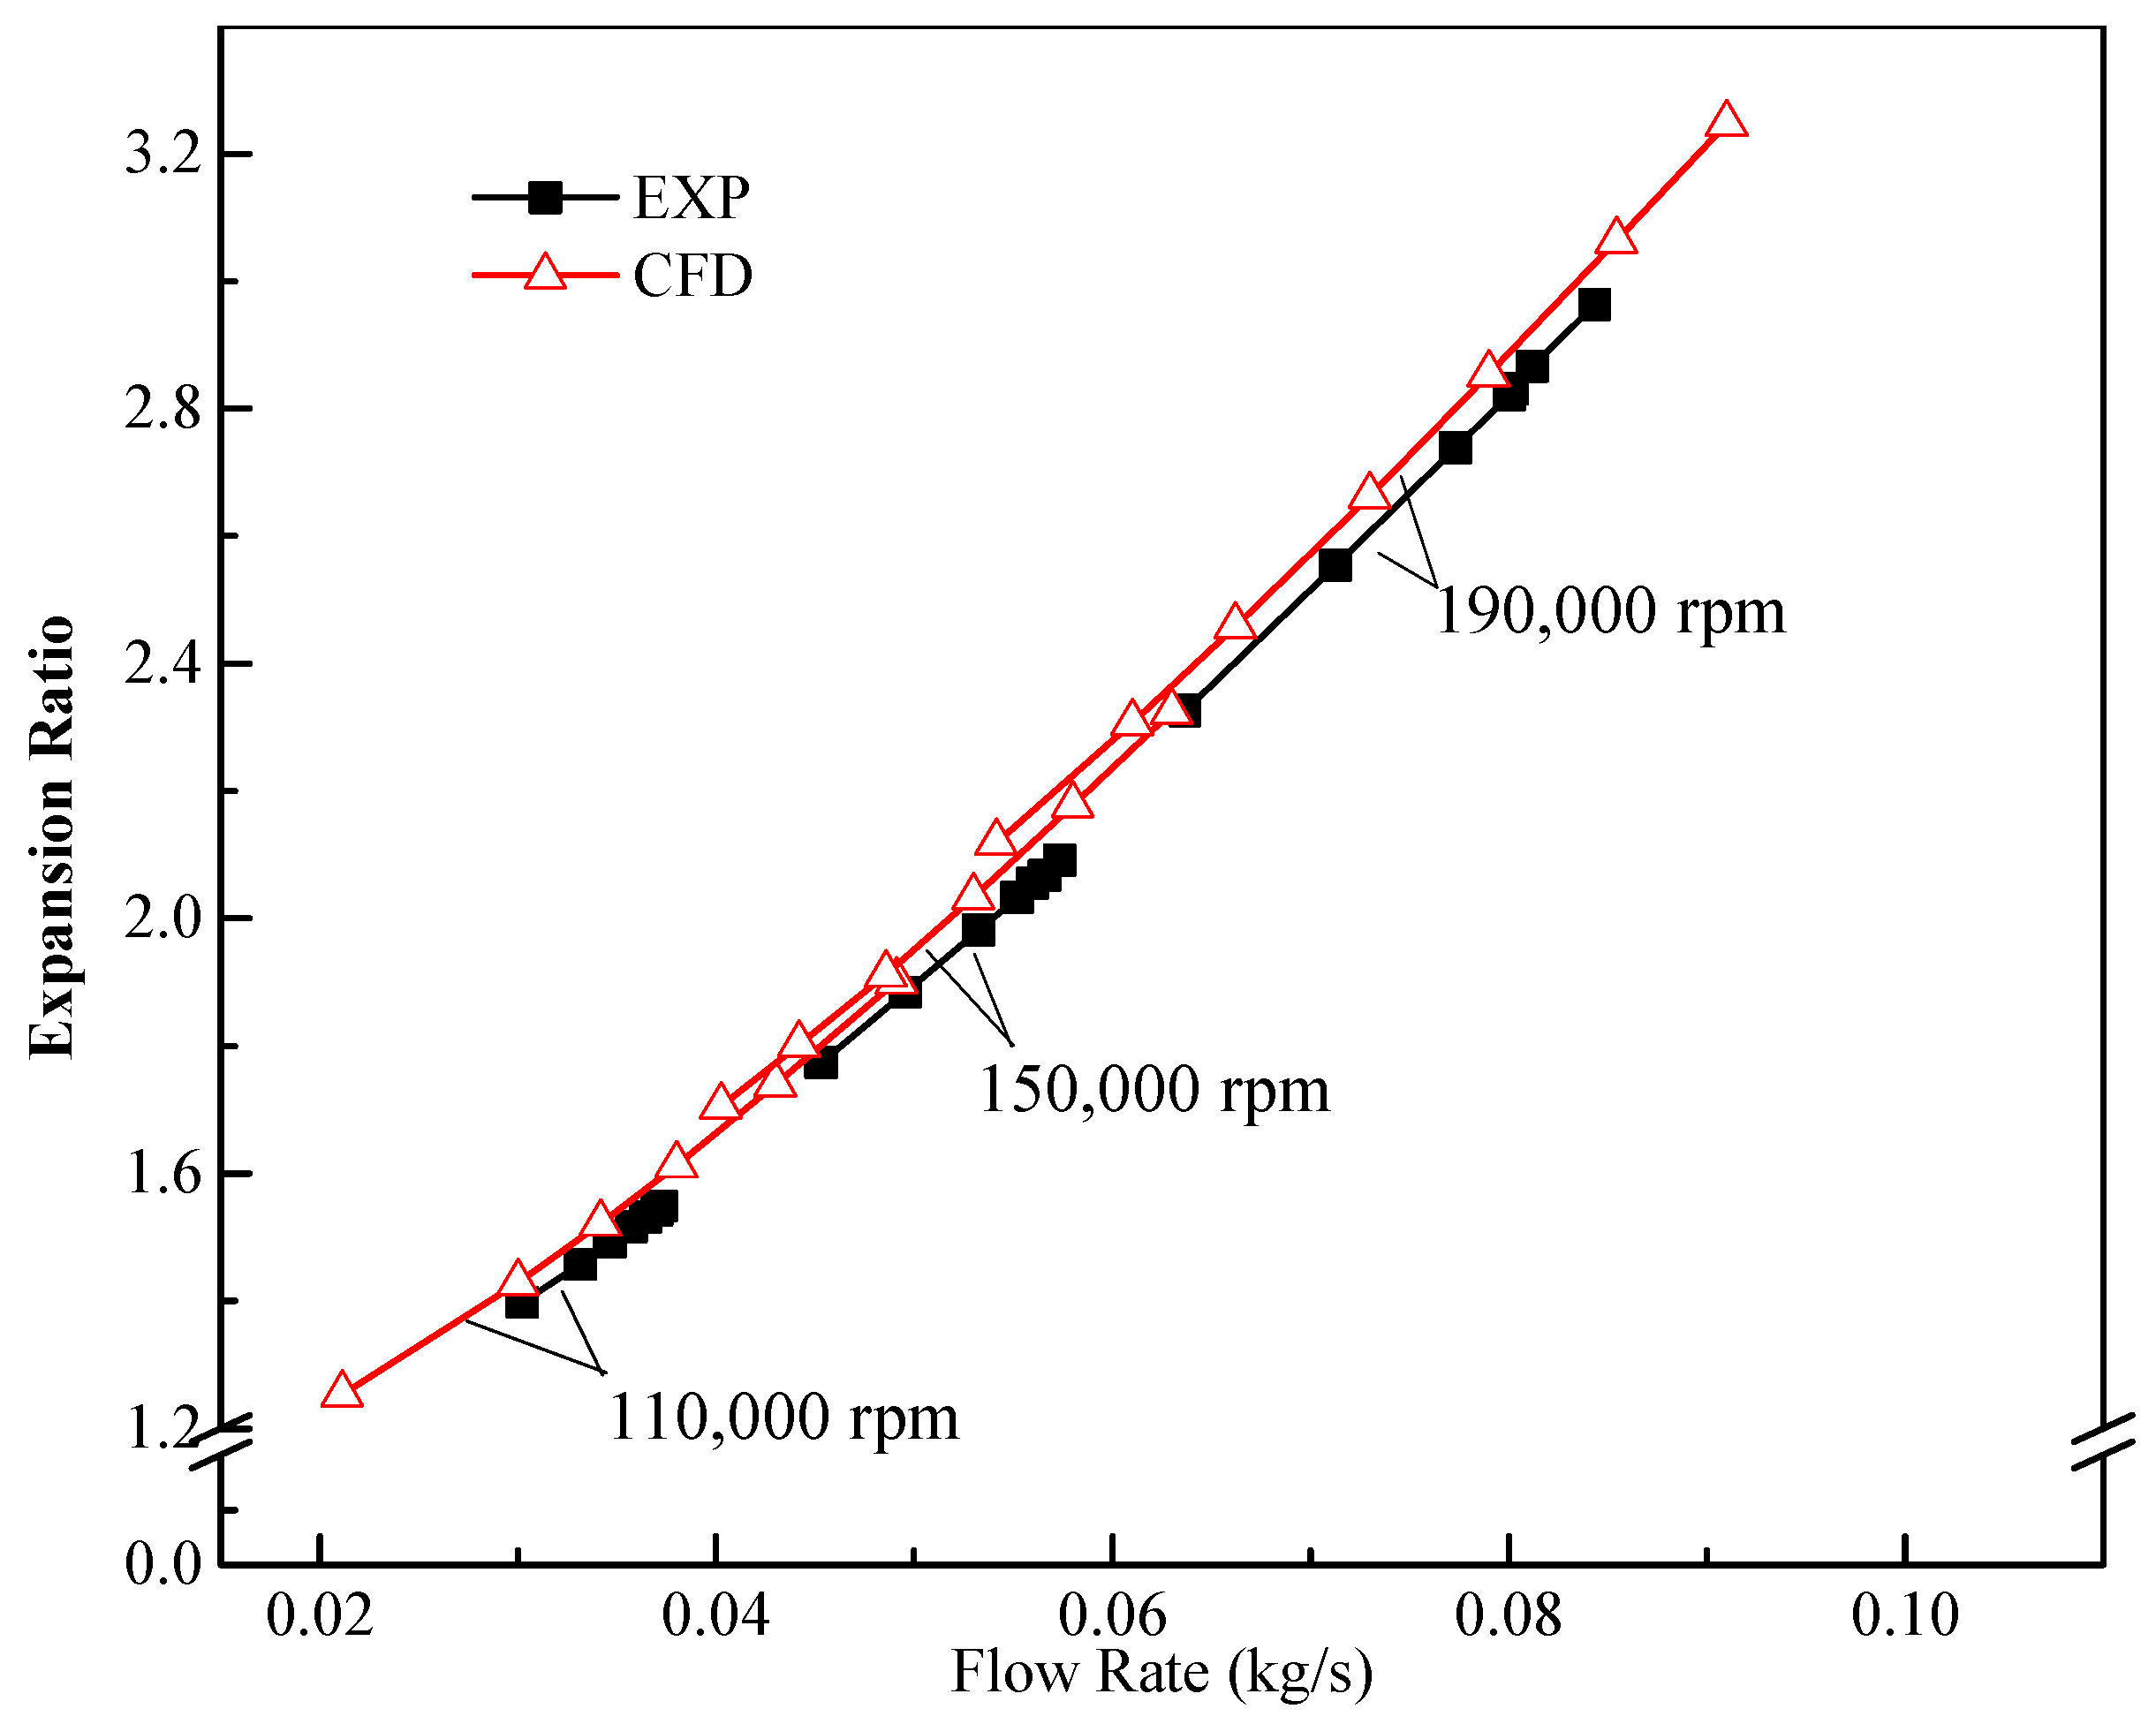
2.4. Model Validation

The validation test of the single-entry prototype was carried out on the Kratzer turbocharger test stand, and the following three speed conditions of 110,000 rpm, 150,000 rpm, and 190,000 rpm were selected to represent the low, medium, and high speeds of the turbocharger operation, respectively. In this study, we used the validation method published in previous papers [16,43,44].
Figure 4 shows the comparison between the test and simulation of the swallowing capacity of the original turbocharger turbine. Overall, the test and simulation of the swallowing capacity were in good agreement with each other and had a maximum error value of 2.62% at the speed of 150,000 rpm, which was within the acceptable range. This discrepancy was attributed to the simplification of the secondary feature in the geometry, the parameter settings for heat transfer in the simulation, and a manufacturing error [45,46]; moreover, it could be influenced by the optimal application scope of the SST model [47].

3. Results

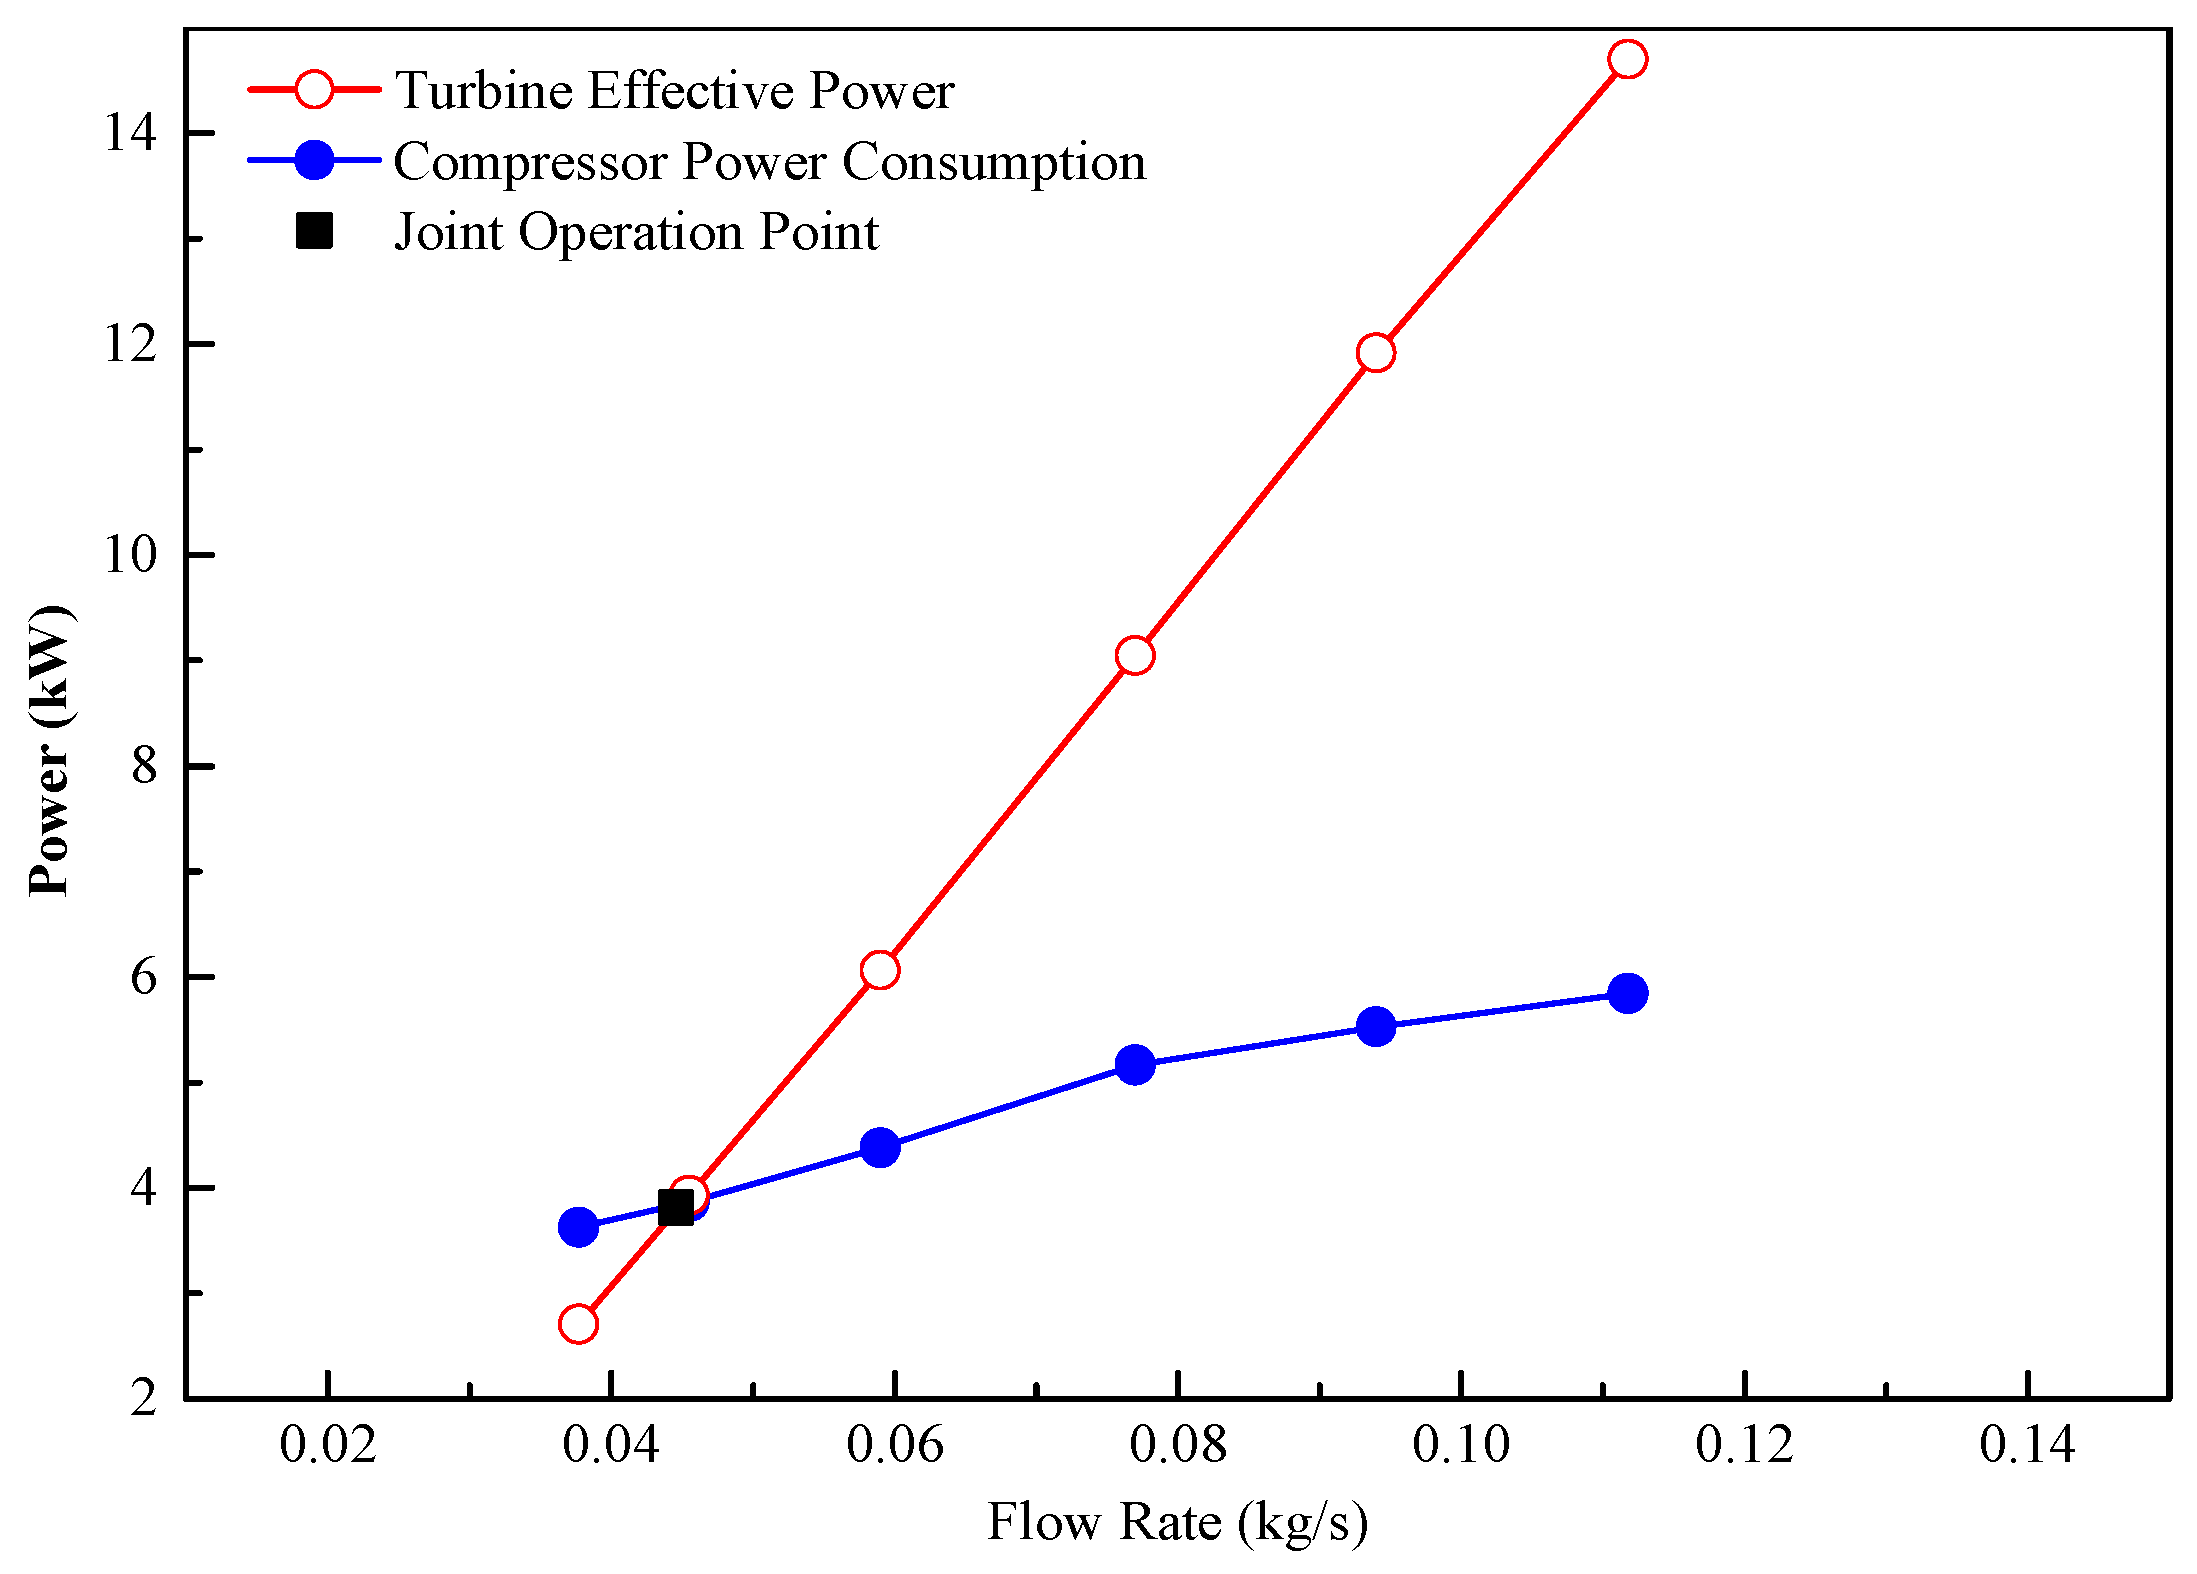
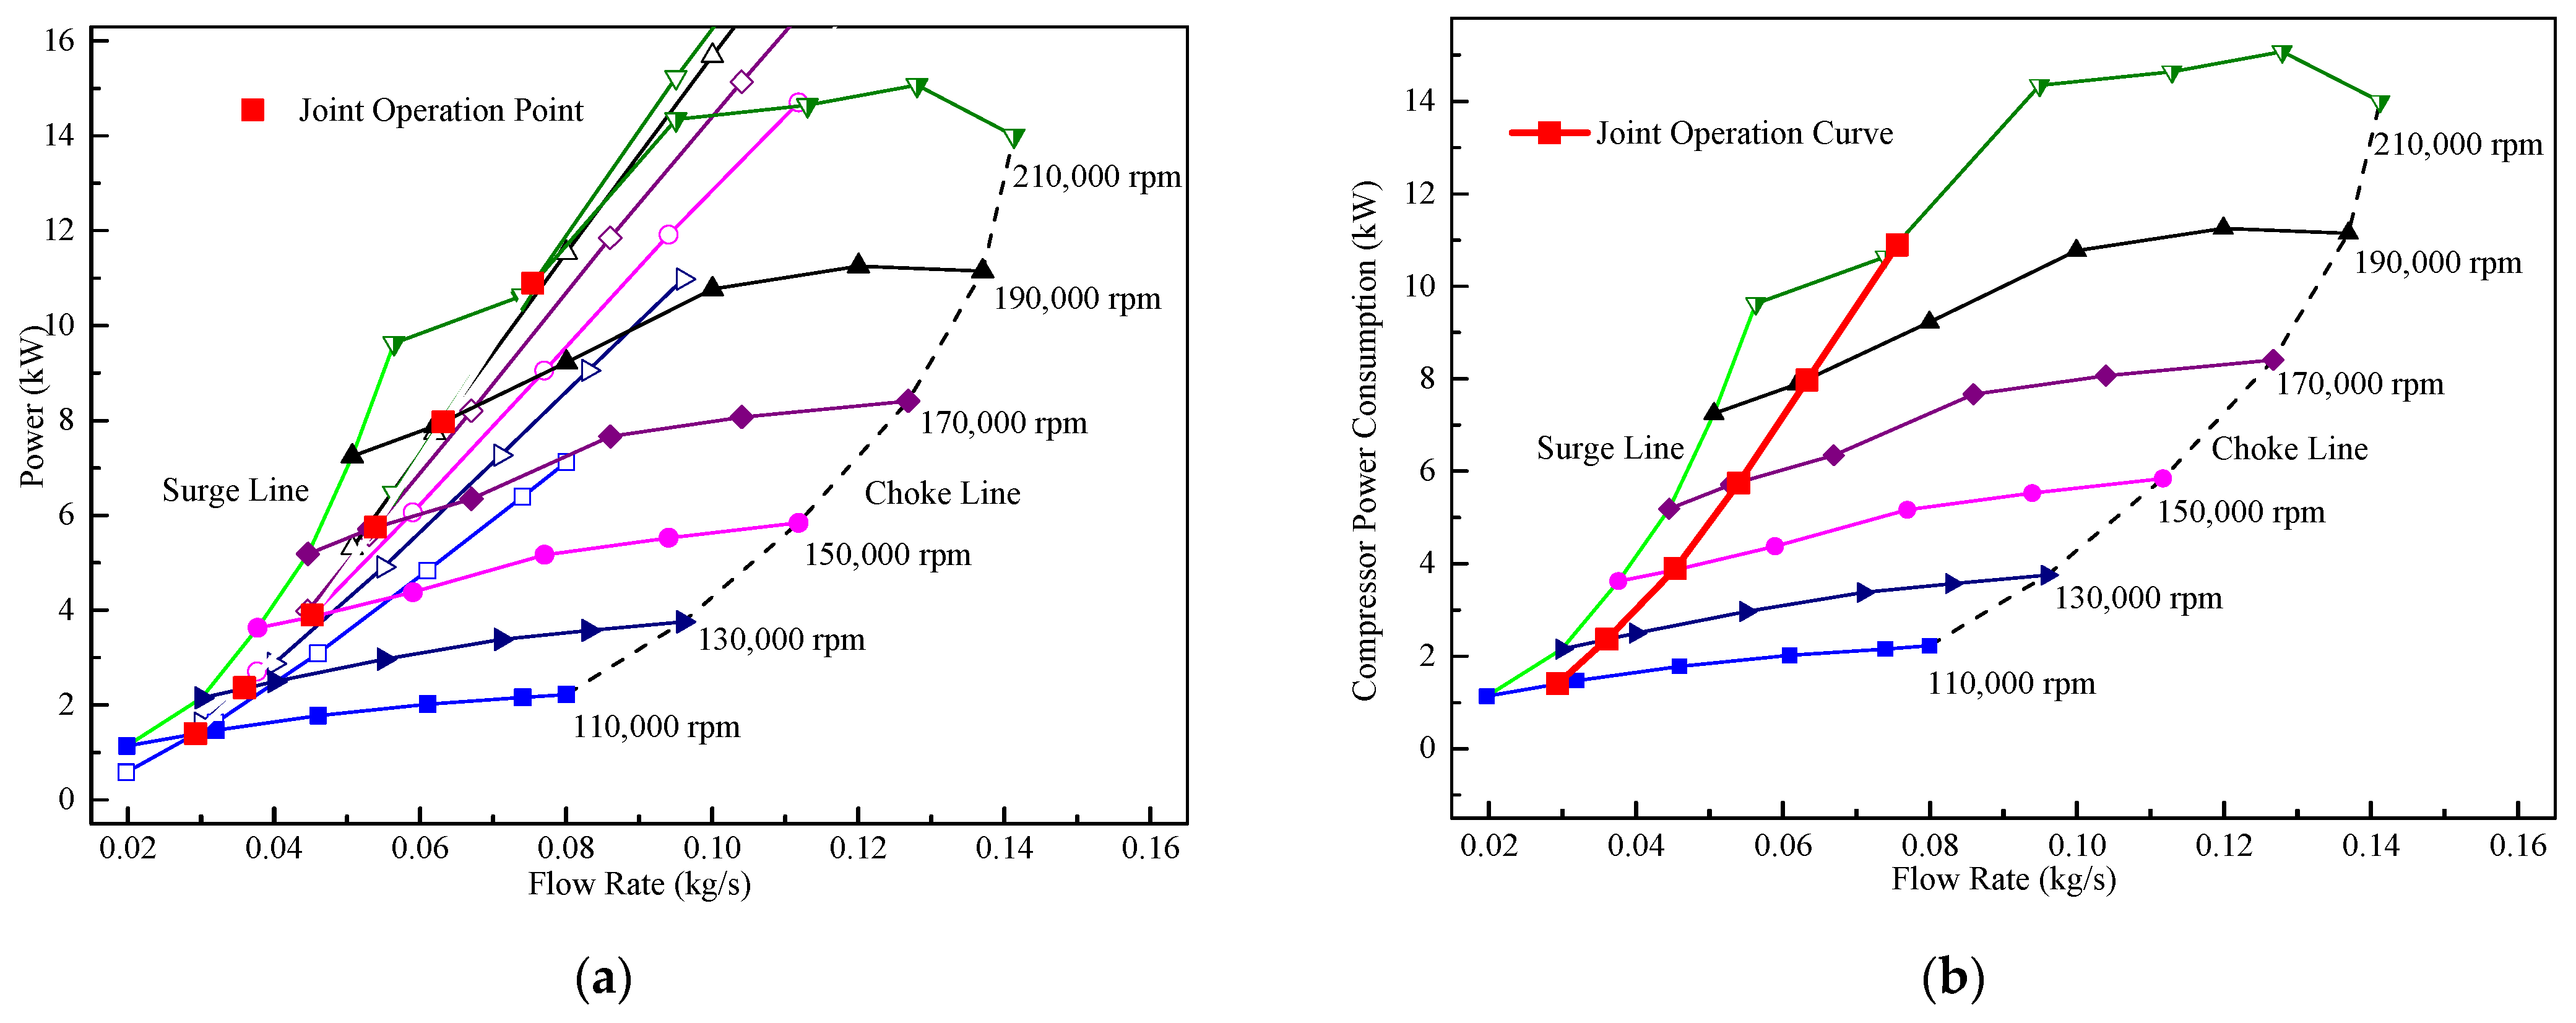
3.1. Coupling of Internal Joint Operating Curves

The compressor and turbine are rigidly connected by the rotor shaft. They have the same speed, and their working states are related to the operation of the engine. The following three are the basic conditions for the operation of the booster:
  • Speed balance: the compressor, turbine, and rotor shaft have the same speed.
    n C = n T = n R ,
    where n C is the compressor speed (rpm), n T is the turbine speed (rpm), and n R is the rotor shaft speed (rpm);
  • Flow rate balance: the compressor working mass flow rate plus the engine fuel mass flow rate is equal to the turbine working mass flow rate, and this flow rate balance condition is also followed when the turbine bypass valve is opened.
    m T = m C + m F ,
    where m T is the turbine operating flow rate (kg/s), m C is the compressor operating flow rate (kg/s), and m F is the fuel flow rate (kg/s);
  • Power balance: The power transfer from the turbine side to the compressor side will lose part of the power, which includes turbine rotor lubrication and cooling losses, as well as the heat radiation of the components and other losses. The turbine power output minus this loss is equal to the compressor power consumption.
    P T = P C + P L o s s ,
    where P T is the turbine output power (kW), P C is the compressor power consumption (kW), and P L o s s is the power loss during energy transfer (kW).
The turbocharger operation must comply with Equations (1)–(3). This shows that the matching of the turbocharger to the engine contains three aspects: the matching of the compressor to the engine, the matching of the turbine to the engine, and the internal matching between the compressor and turbine of the turbocharger [48].
In the fixed-speed line, the compressor power consumption curve and turbine effective power curve were superimposed and coupled. The intersection point of both the compressor and turbine at the time of coupling was the compressor flow rate, and the intersection point of the power balance was obtained, as shown in Figure 5.
In comparison, the compressor power consumption curves and turbine effective power curves for all speeds were superimposed and coupled to obtain the joint operation points of the turbocharger at each speed, as shown in Figure 6a. Connecting each joint operation point in turn formed the complete turbocharger joint operation curve for the condition of the turbine bypass valve being closed, as shown in Figure 6b. The parameters in Figure 5 and Figure 6 are for the common operating conditions of the matched engine, and the parameter ranges are from the engine calibration and turbocharger map.
Furthermore, the turbocharger joint operation curve was the joint operation matching curve between the compressor and the turbine. When matching a turbocharger with an engine, following the turbocharger joint operating curve must be prioritized. The joint operation curve reflects the matching performance between the turbocharger and the engine, which helps to simplify matching the work between the turbocharger and the engine and improves the matching accuracy.

3.2. Turbine Optimization Evaluation Method

The performance parameters were described and compared in the research. The data related to these parameters were obtained from experiments and CFD simulations. The turbine performance parameters mainly include the expansion ratio, efficiency, output power, etc. The expansion ratio reflects turbine swallowing capacity. Different parameters have different effects on turbine performance, and the calculation formula is shown in Equation (4), where variable parameters B 1 , B 2 , and B 3 are the corresponding performance weights, and the calculated turbine performance index, Φ T , is a dimensionless value.
Φ T = B 1 × P T 2 P T 1 + B 2 × π T 1 π T 2 + B 3 × η T 2 η T 2 ,
here, P is the joint point output power, π is the joint point expansion ratio, η is the joint point efficiency, T1 refers to the original turbine, and T2 refers to the modified turbine.
For the weight distribution of each parameter, the role of the turbine is to extract more engine exhaust gas energy and transfer it to the coaxial compressor; moreover, the turbine output power directly determines the distribution of the joint operating curve. Therefore, the weight distribution of the turbine output power is the largest. The swallowing capacity is the parameter that must be guaranteed by the turbine with the second highest weight, while the turbine efficiency weight is the last consideration. Table 4 lists the weight assignment of each performance parameter.

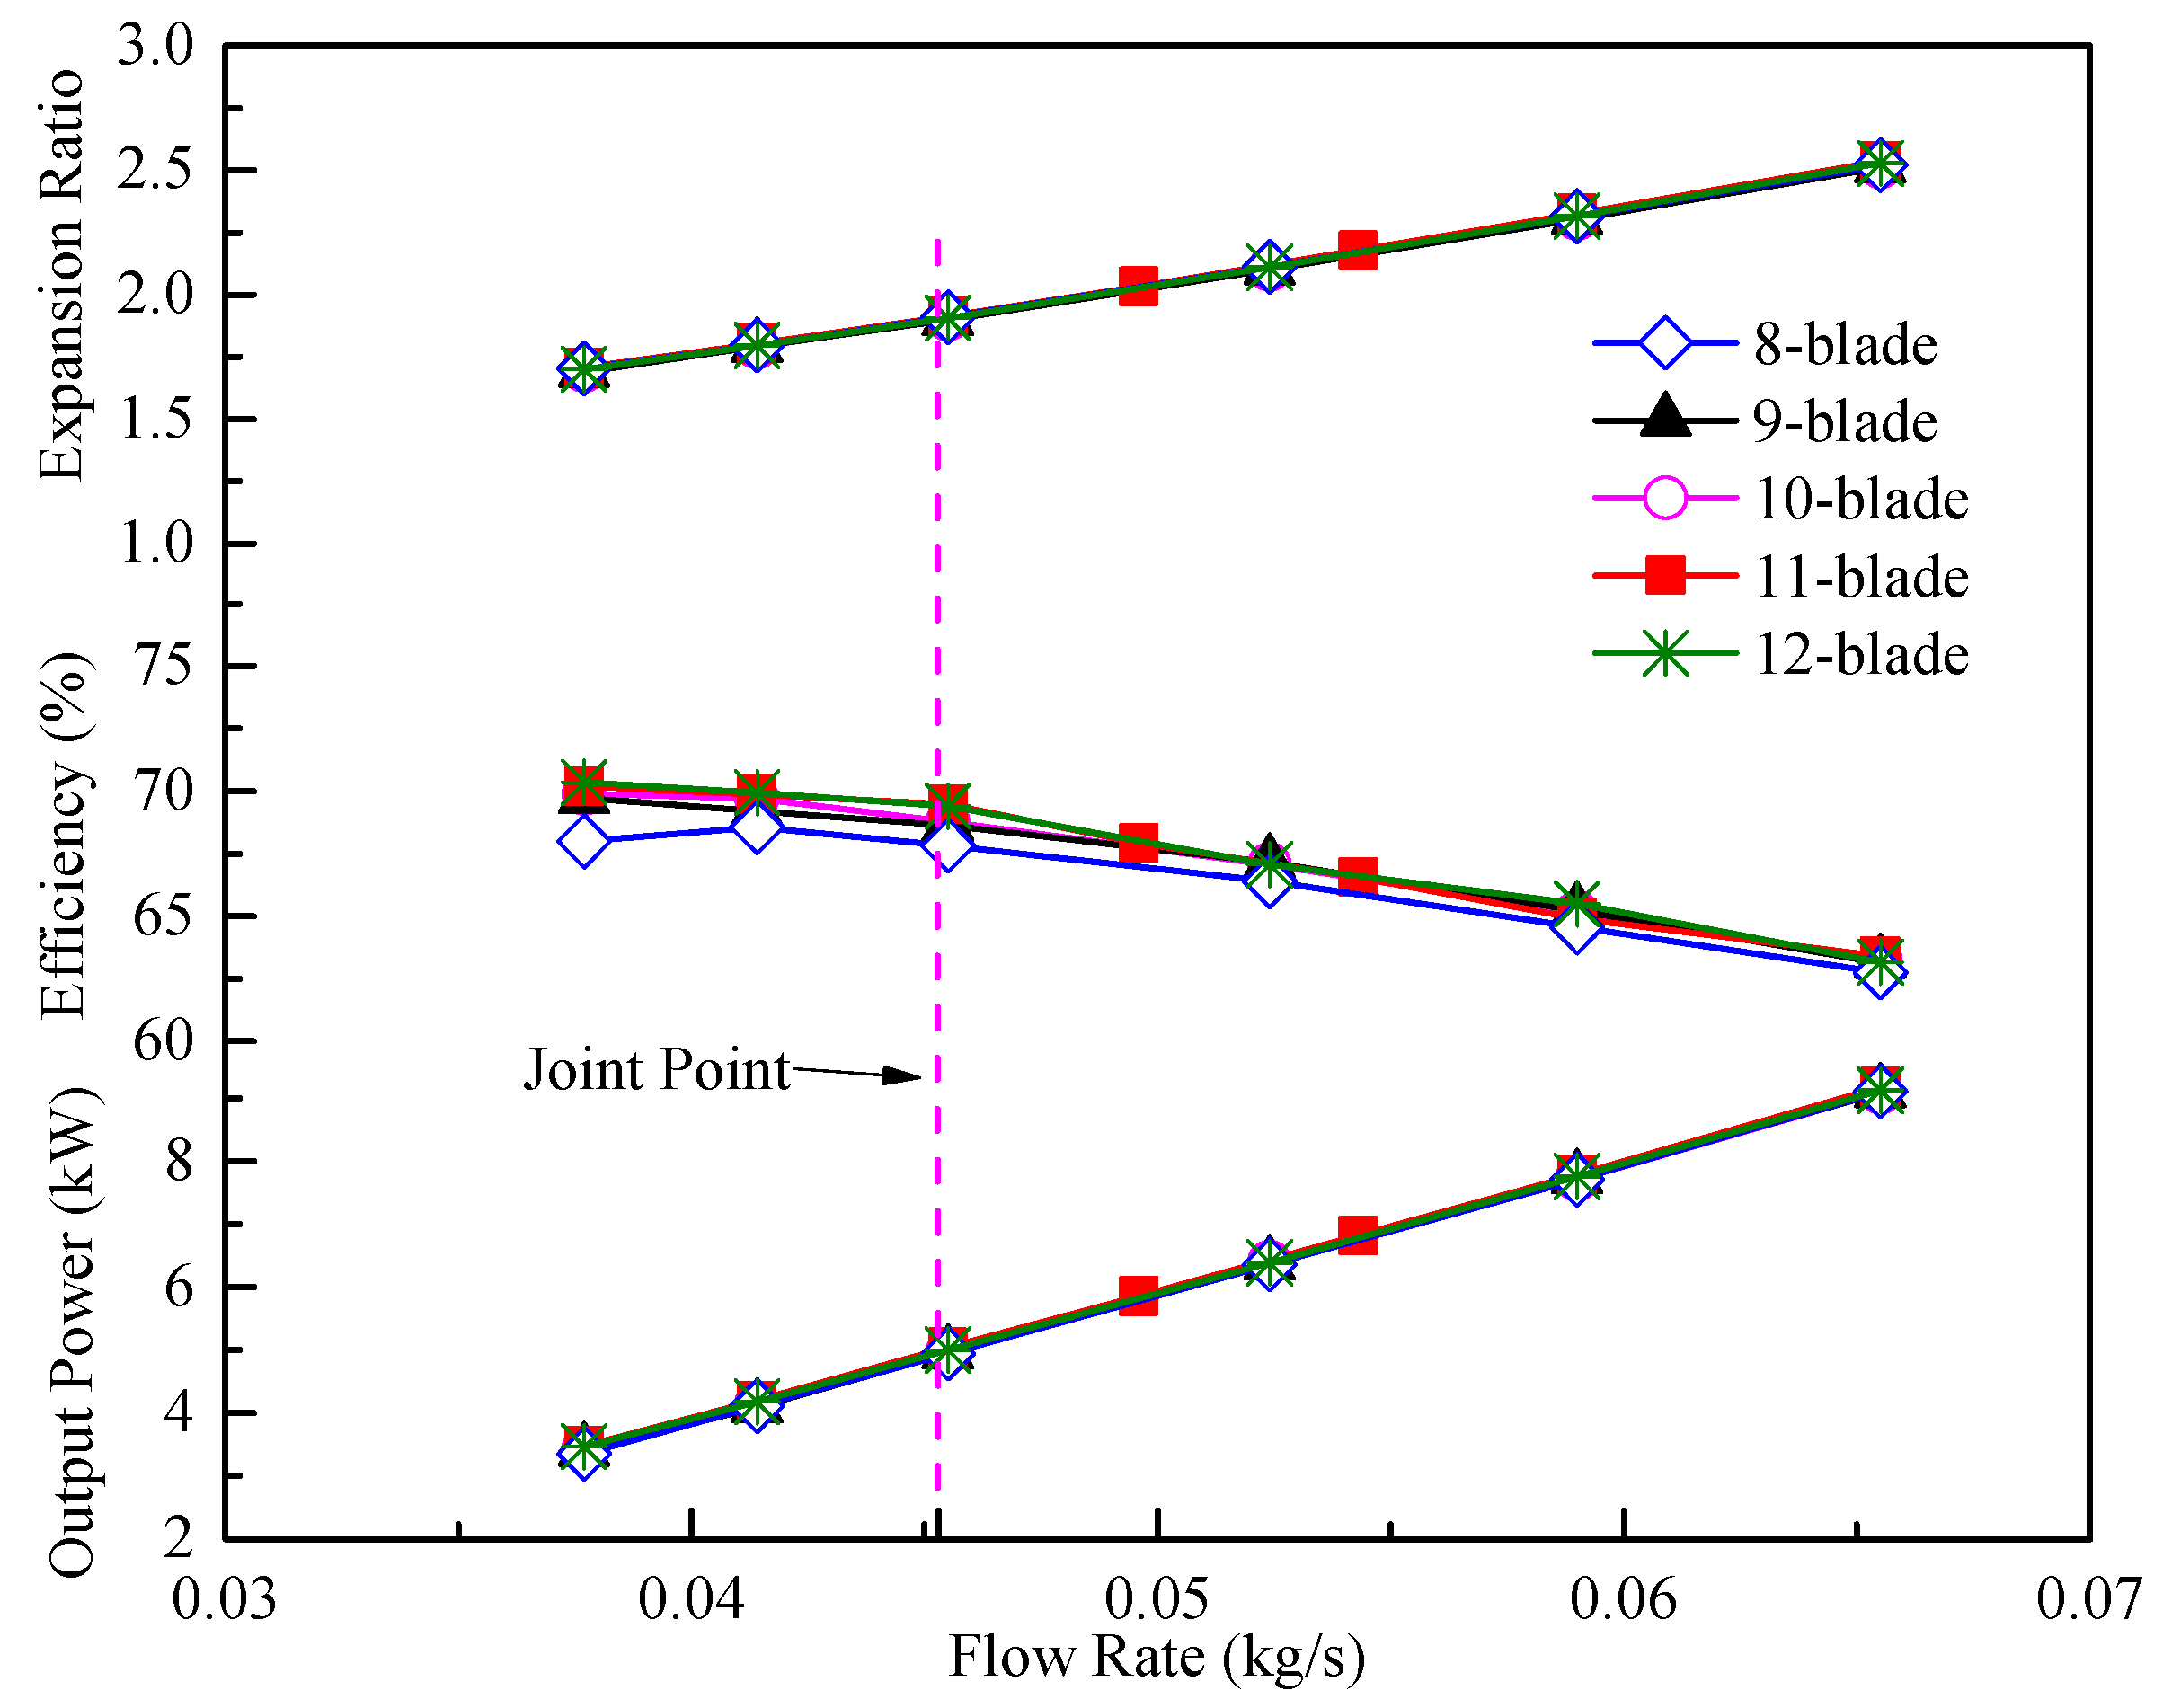
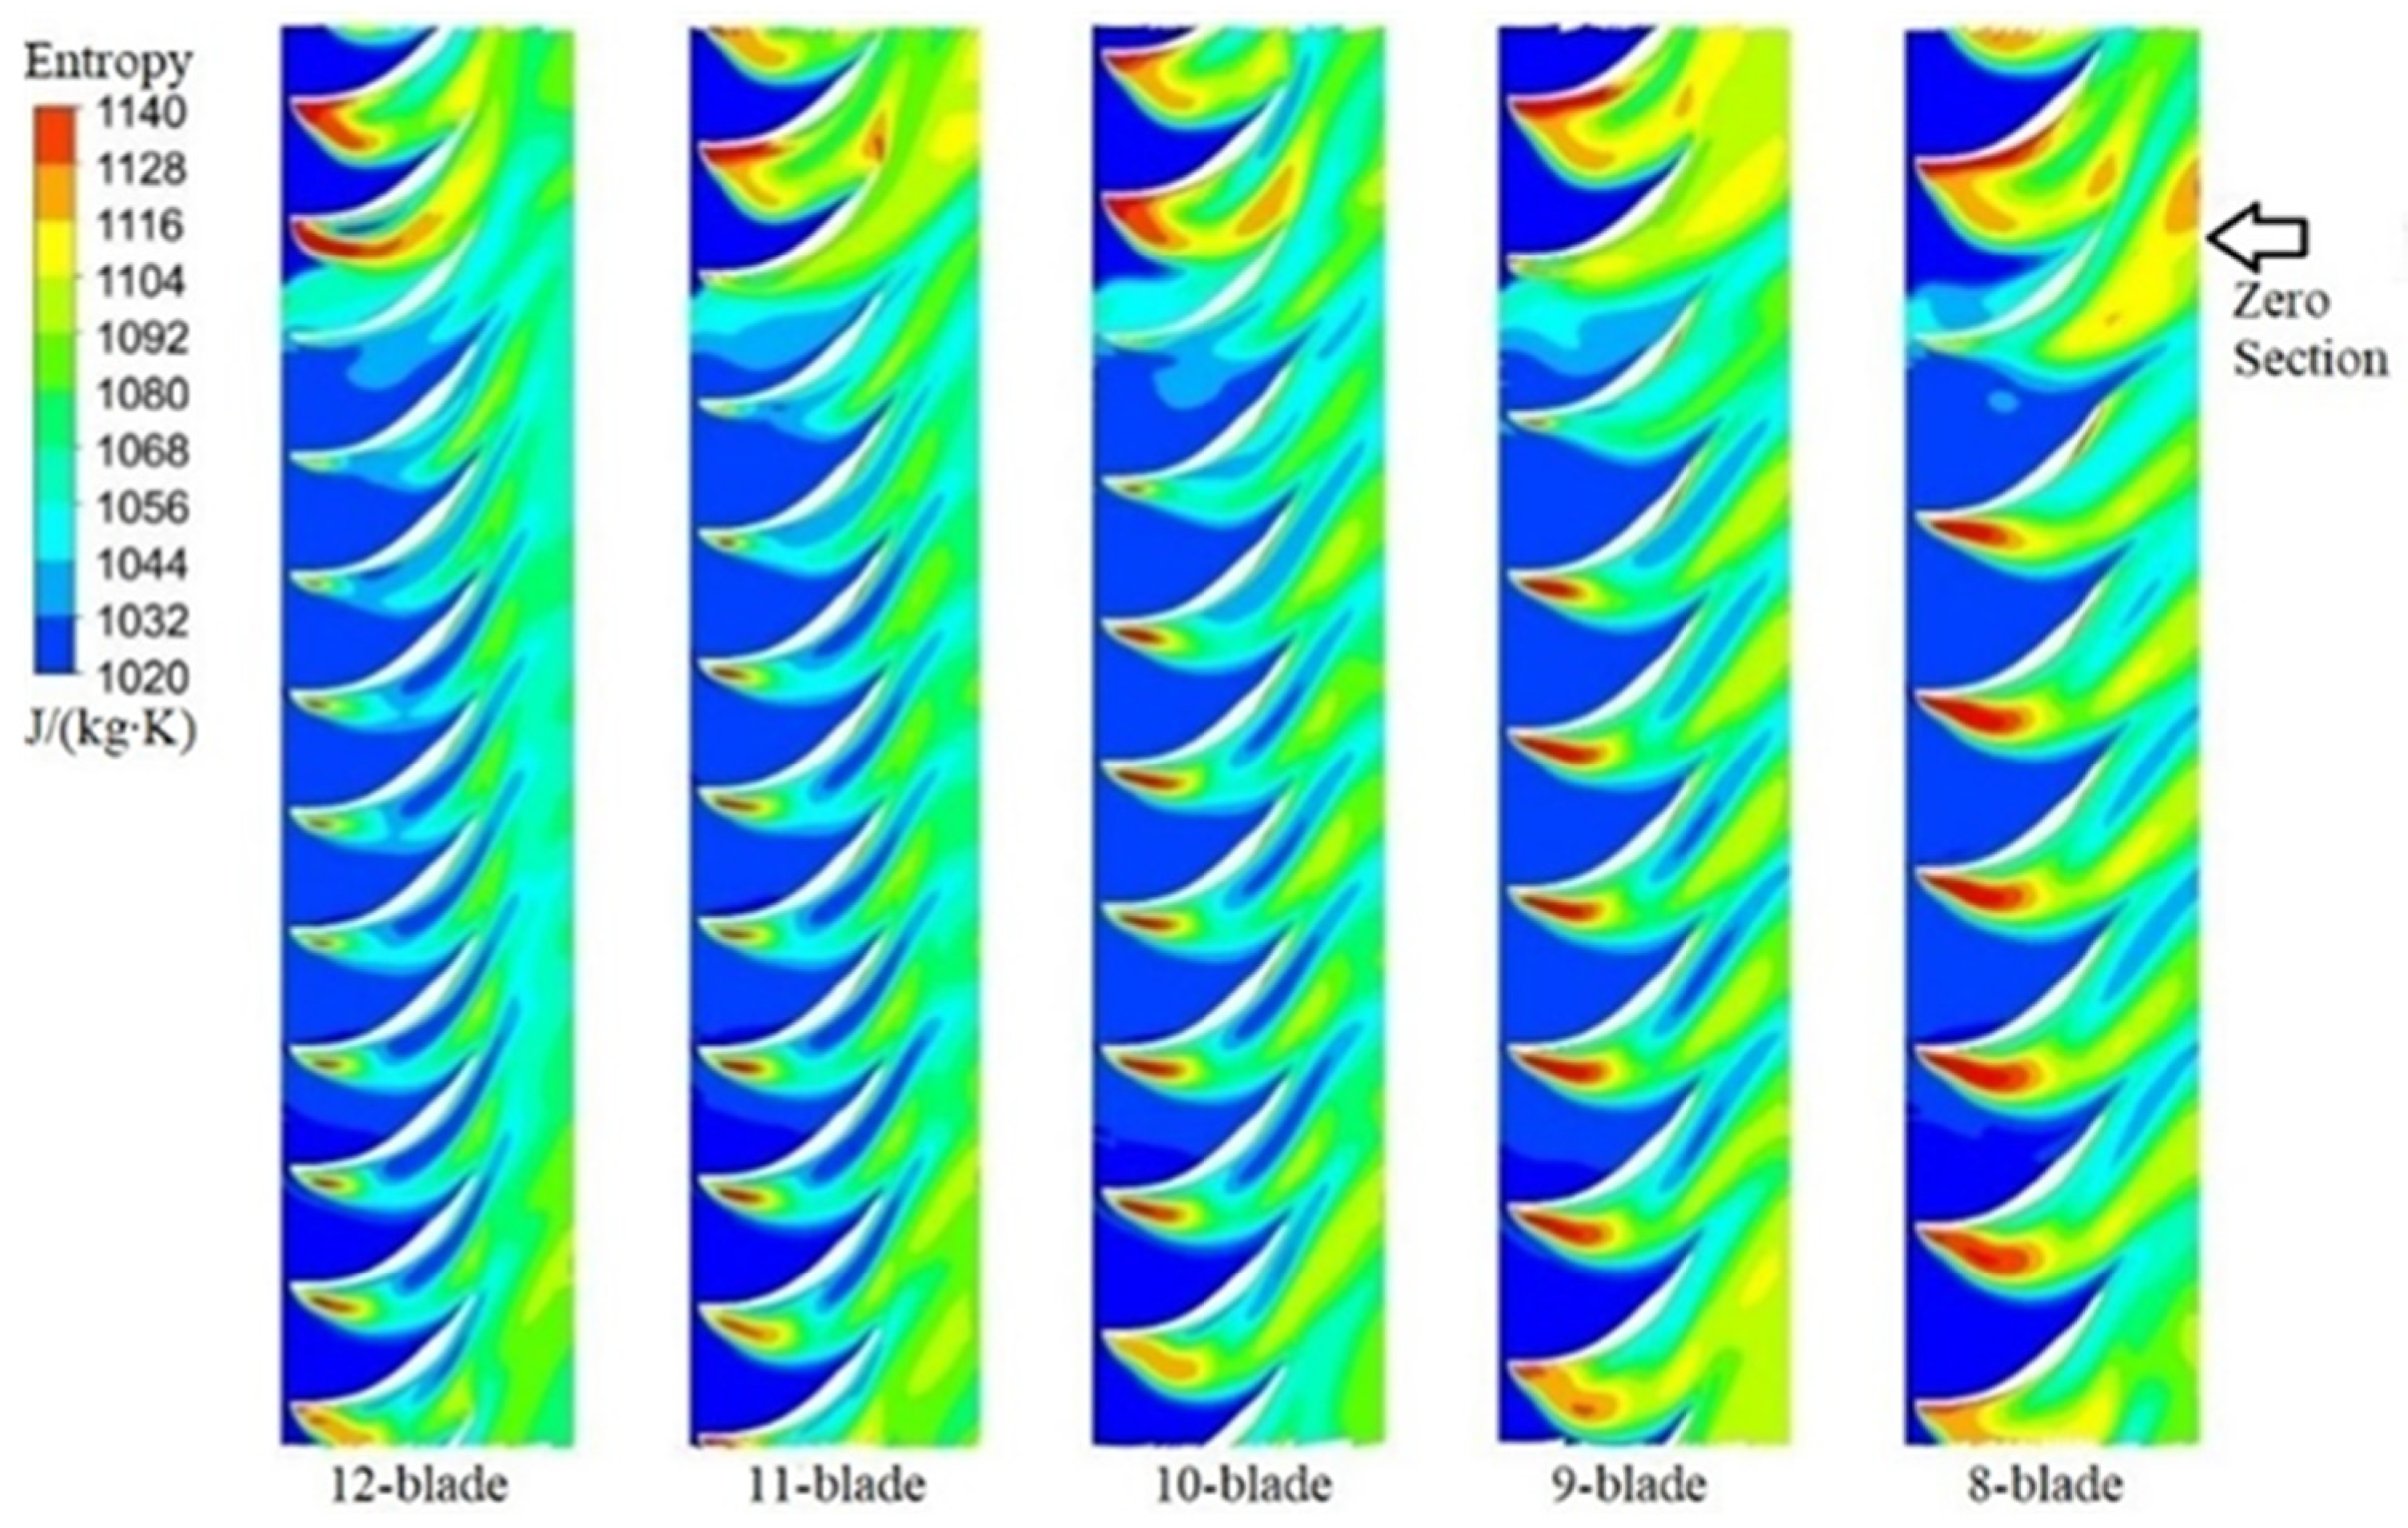
3.3. Analysis of Turbine Impeller Blade Number Based on Joint Point

Five groups of turbine impellers with blade numbers of 8, 9, 10, 11, and 12 were designed, and the 3D modeling of each group was kept consistent with that of the original turbine. The same topology and meshing method were used for the impeller models, and the optimization study was carried out at 150,000 rpm.
The turbine was evaluated based on the conventional method, which compares the turbine performance curves as one component rather than favoring the joint points. Figure 7 shows the effect of different blade numbers on the turbine performance, and all the turbine joint points are marked in the figure.
The output power, expansion ratio, and efficiency of the turbine decreased significantly at 150,000 rpm when the number of blades was lower than nine, which indicated that the number of turbine impeller blades should not be too small. When the number of blades was greater than nine, the turbine performances were very close.
This indicated that there was no significant difference in performance between the turbine structures for blade numbers greater than 9. Therefore, based on the conventional evaluation method, the number of turbine impeller blades could be reduced from 11 to 9 blades to reduce the turbine rotor mass and improve the turbocharger response characteristics without any significant reduction in the overall turbine performance.
The turbine was evaluated based on the joint point, and the output power and efficiency near the joint point of the nine-blade turbine were found to be lower than those of the original turbine at all speeds. Table 5 shows the joint point performance comparison of turbines with different numbers of blades based on a single-entry volute. With reference to the performance of the original turbine, the turbine performance changed with the number of blades. Whether the number of impeller blades was greater than 11 or less than 11, the turbine performance index was less than that of the original turbine. When the number of impeller blades was less than nine, the turbine performance index decreased significantly, in terms of turbine output power and efficiency. The nine-blade turbine performance was different from the 11-blade original turbine performance based on the joint point performance evaluation, and the turbine impeller blade number could not be reduced. For a single-entry turbine, the number of the original turbine blades was reasonable. This differed from the conclusions of the conventional method evaluation.
Flow field analysis was performed for the mid-speed joint point, and Figure 8 shows the entropy increase distribution at 80% leaf spread height of the impeller channel, with different numbers of blades at the mid-speed joint point. The lower the number of blades, the higher the entropy downstream of the blade channel was, and the larger the region of high entropy. The high entropy area near the suction surface of the blades increased significantly compared with the original turbine when the number of impeller blades was nine. The circumferential flow field of the impeller was not uniformly distributed, indicating that the internal flow evidently became turbulent, and that the flow loss downstream of the blade channel increased significantly, thus reducing the efficiency of the turbine.
According to the turbine working principle, the flow efficiency is high in the blade channel, and the Mach number or relative velocity of the flow in the airflow direction increases. The greater the relative Mach number and the lower the absolute velocity, the smaller the turbine outlet residual velocity loss and the higher the efficiency at the exit of the blade.
The Mach number of each scheme at the inlet of the blade channel was equal in the middle and downstream position of the blade channel. The greater the number of blades, the greater the Mach number was, which implied that the better the utilization of exhaust gas energy, the smaller the corresponding absolute speed at the exit of the impeller, as shown in Table 6. As seen in the following table, the difference in the absolute outlet velocity between blades 8 and 9 was large. Therefore, the number of turbine impeller blades could be reduced within a reasonable range to reduce the rotor mass.

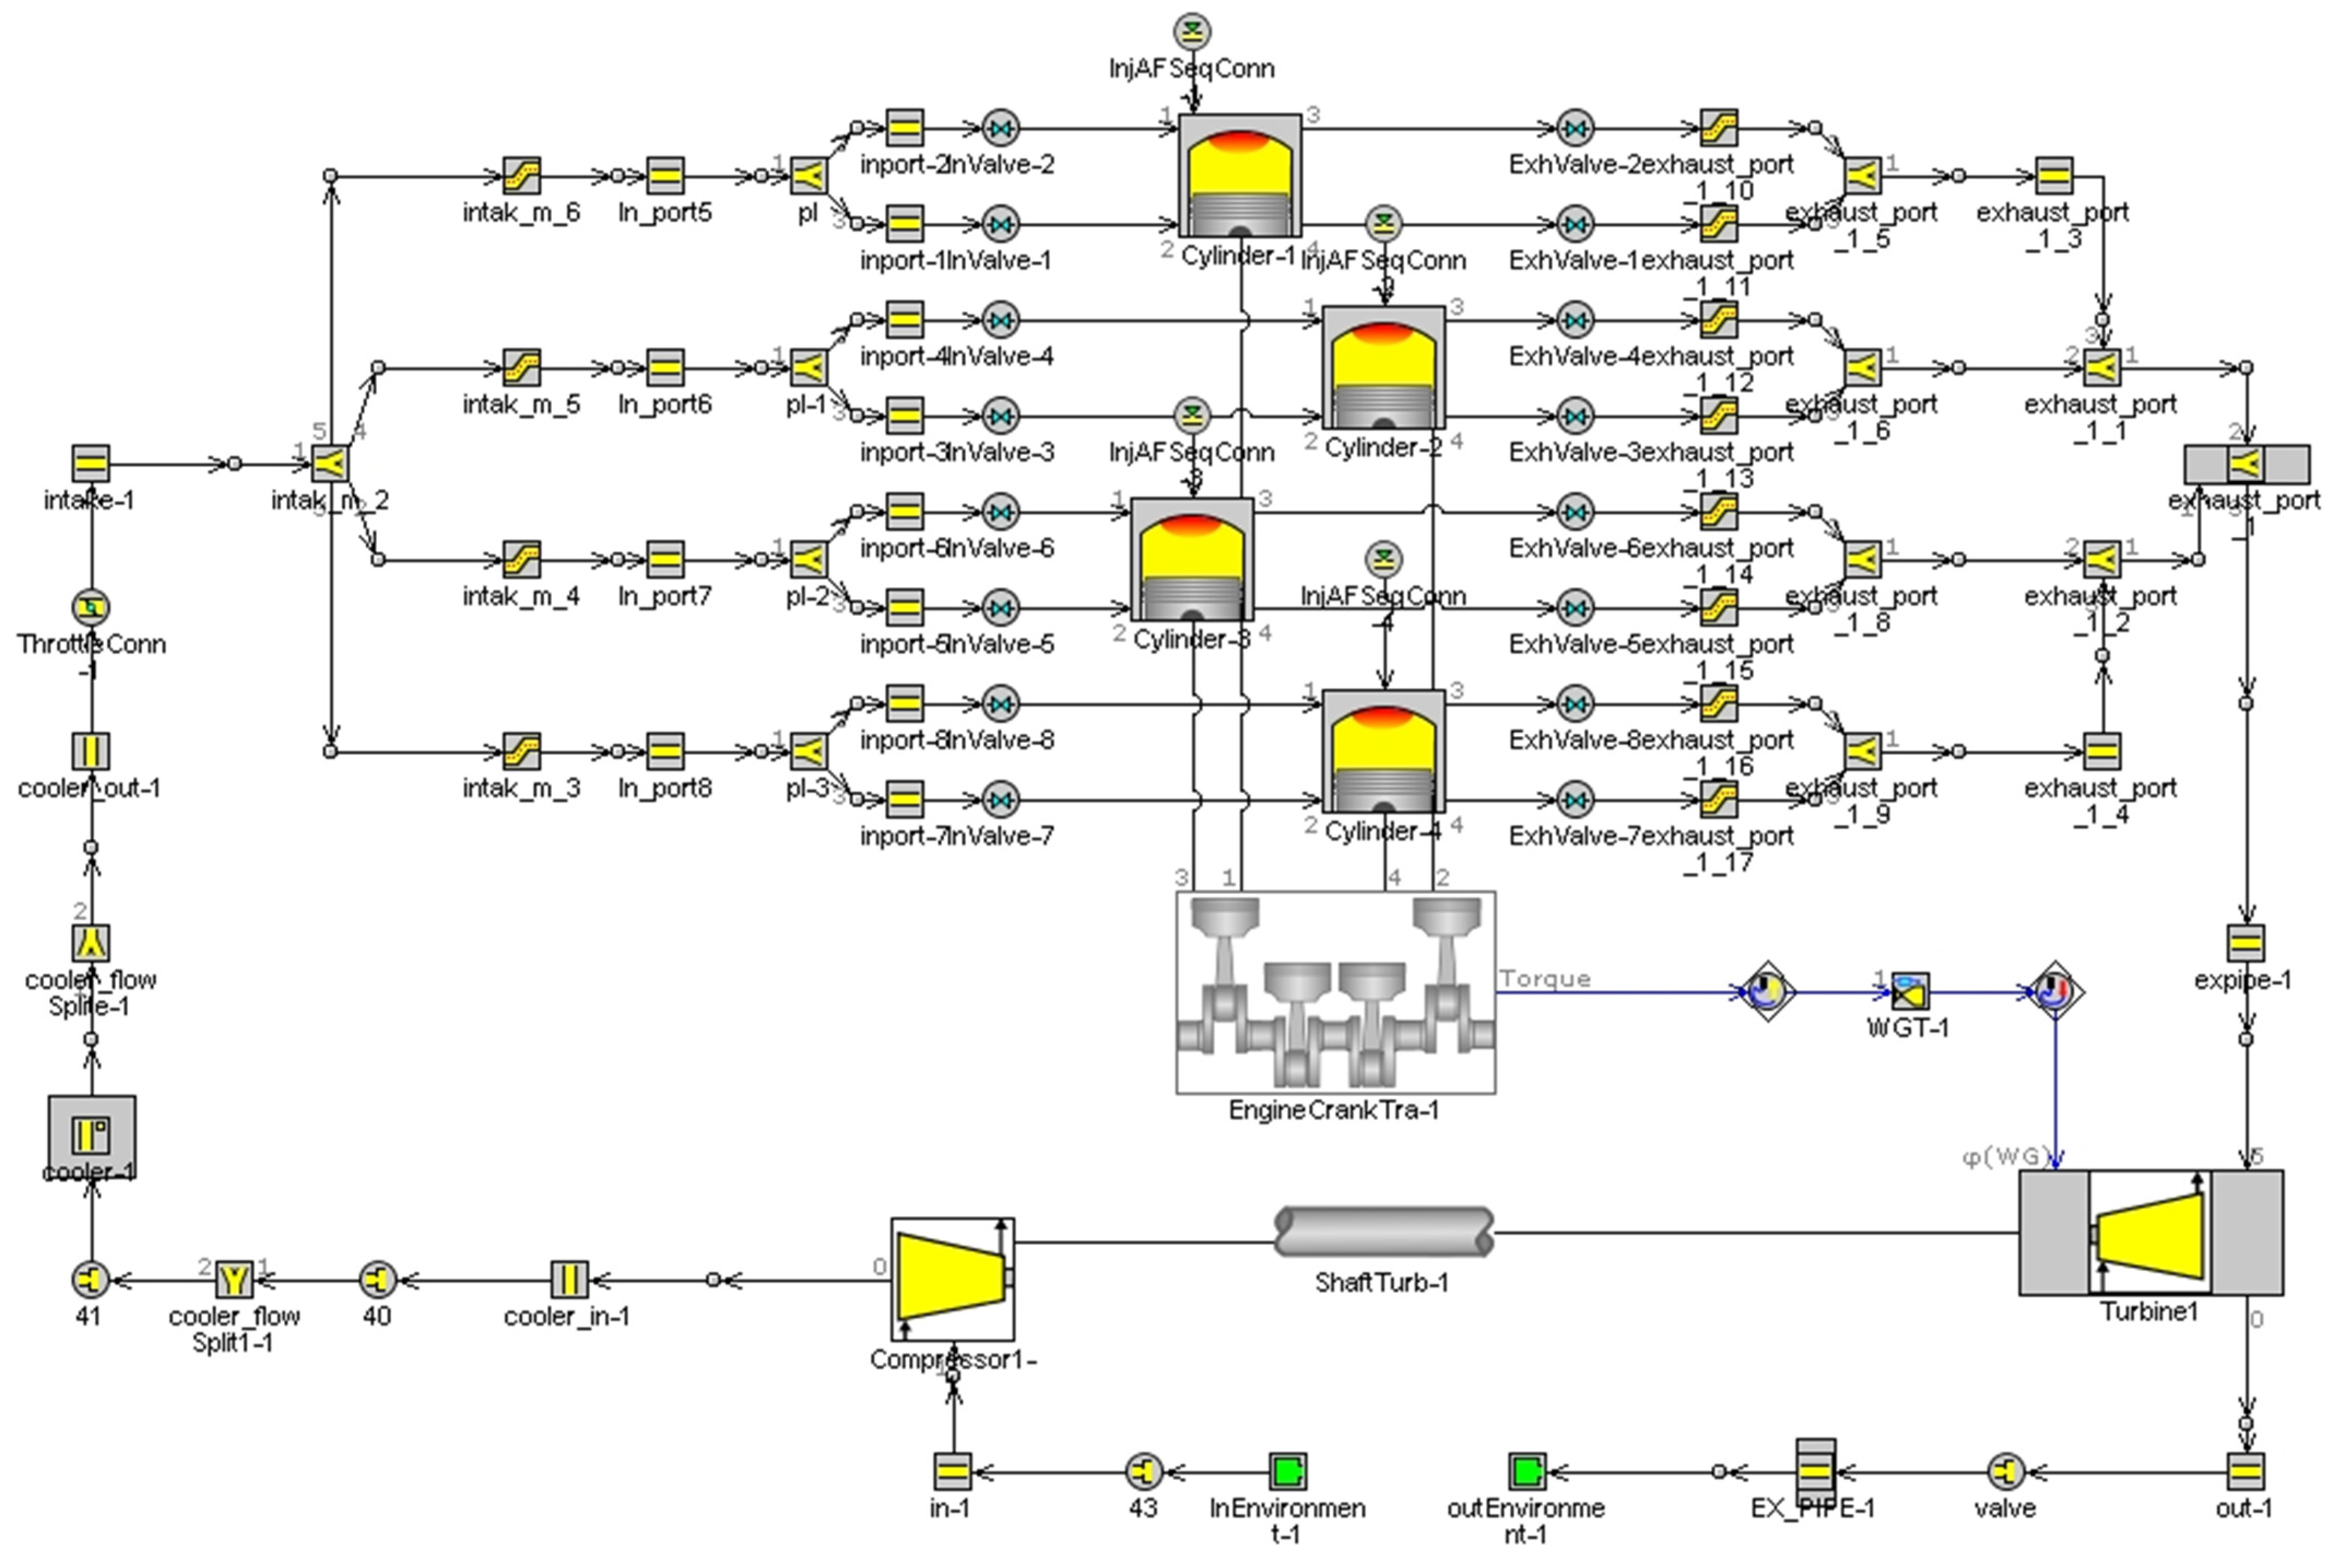
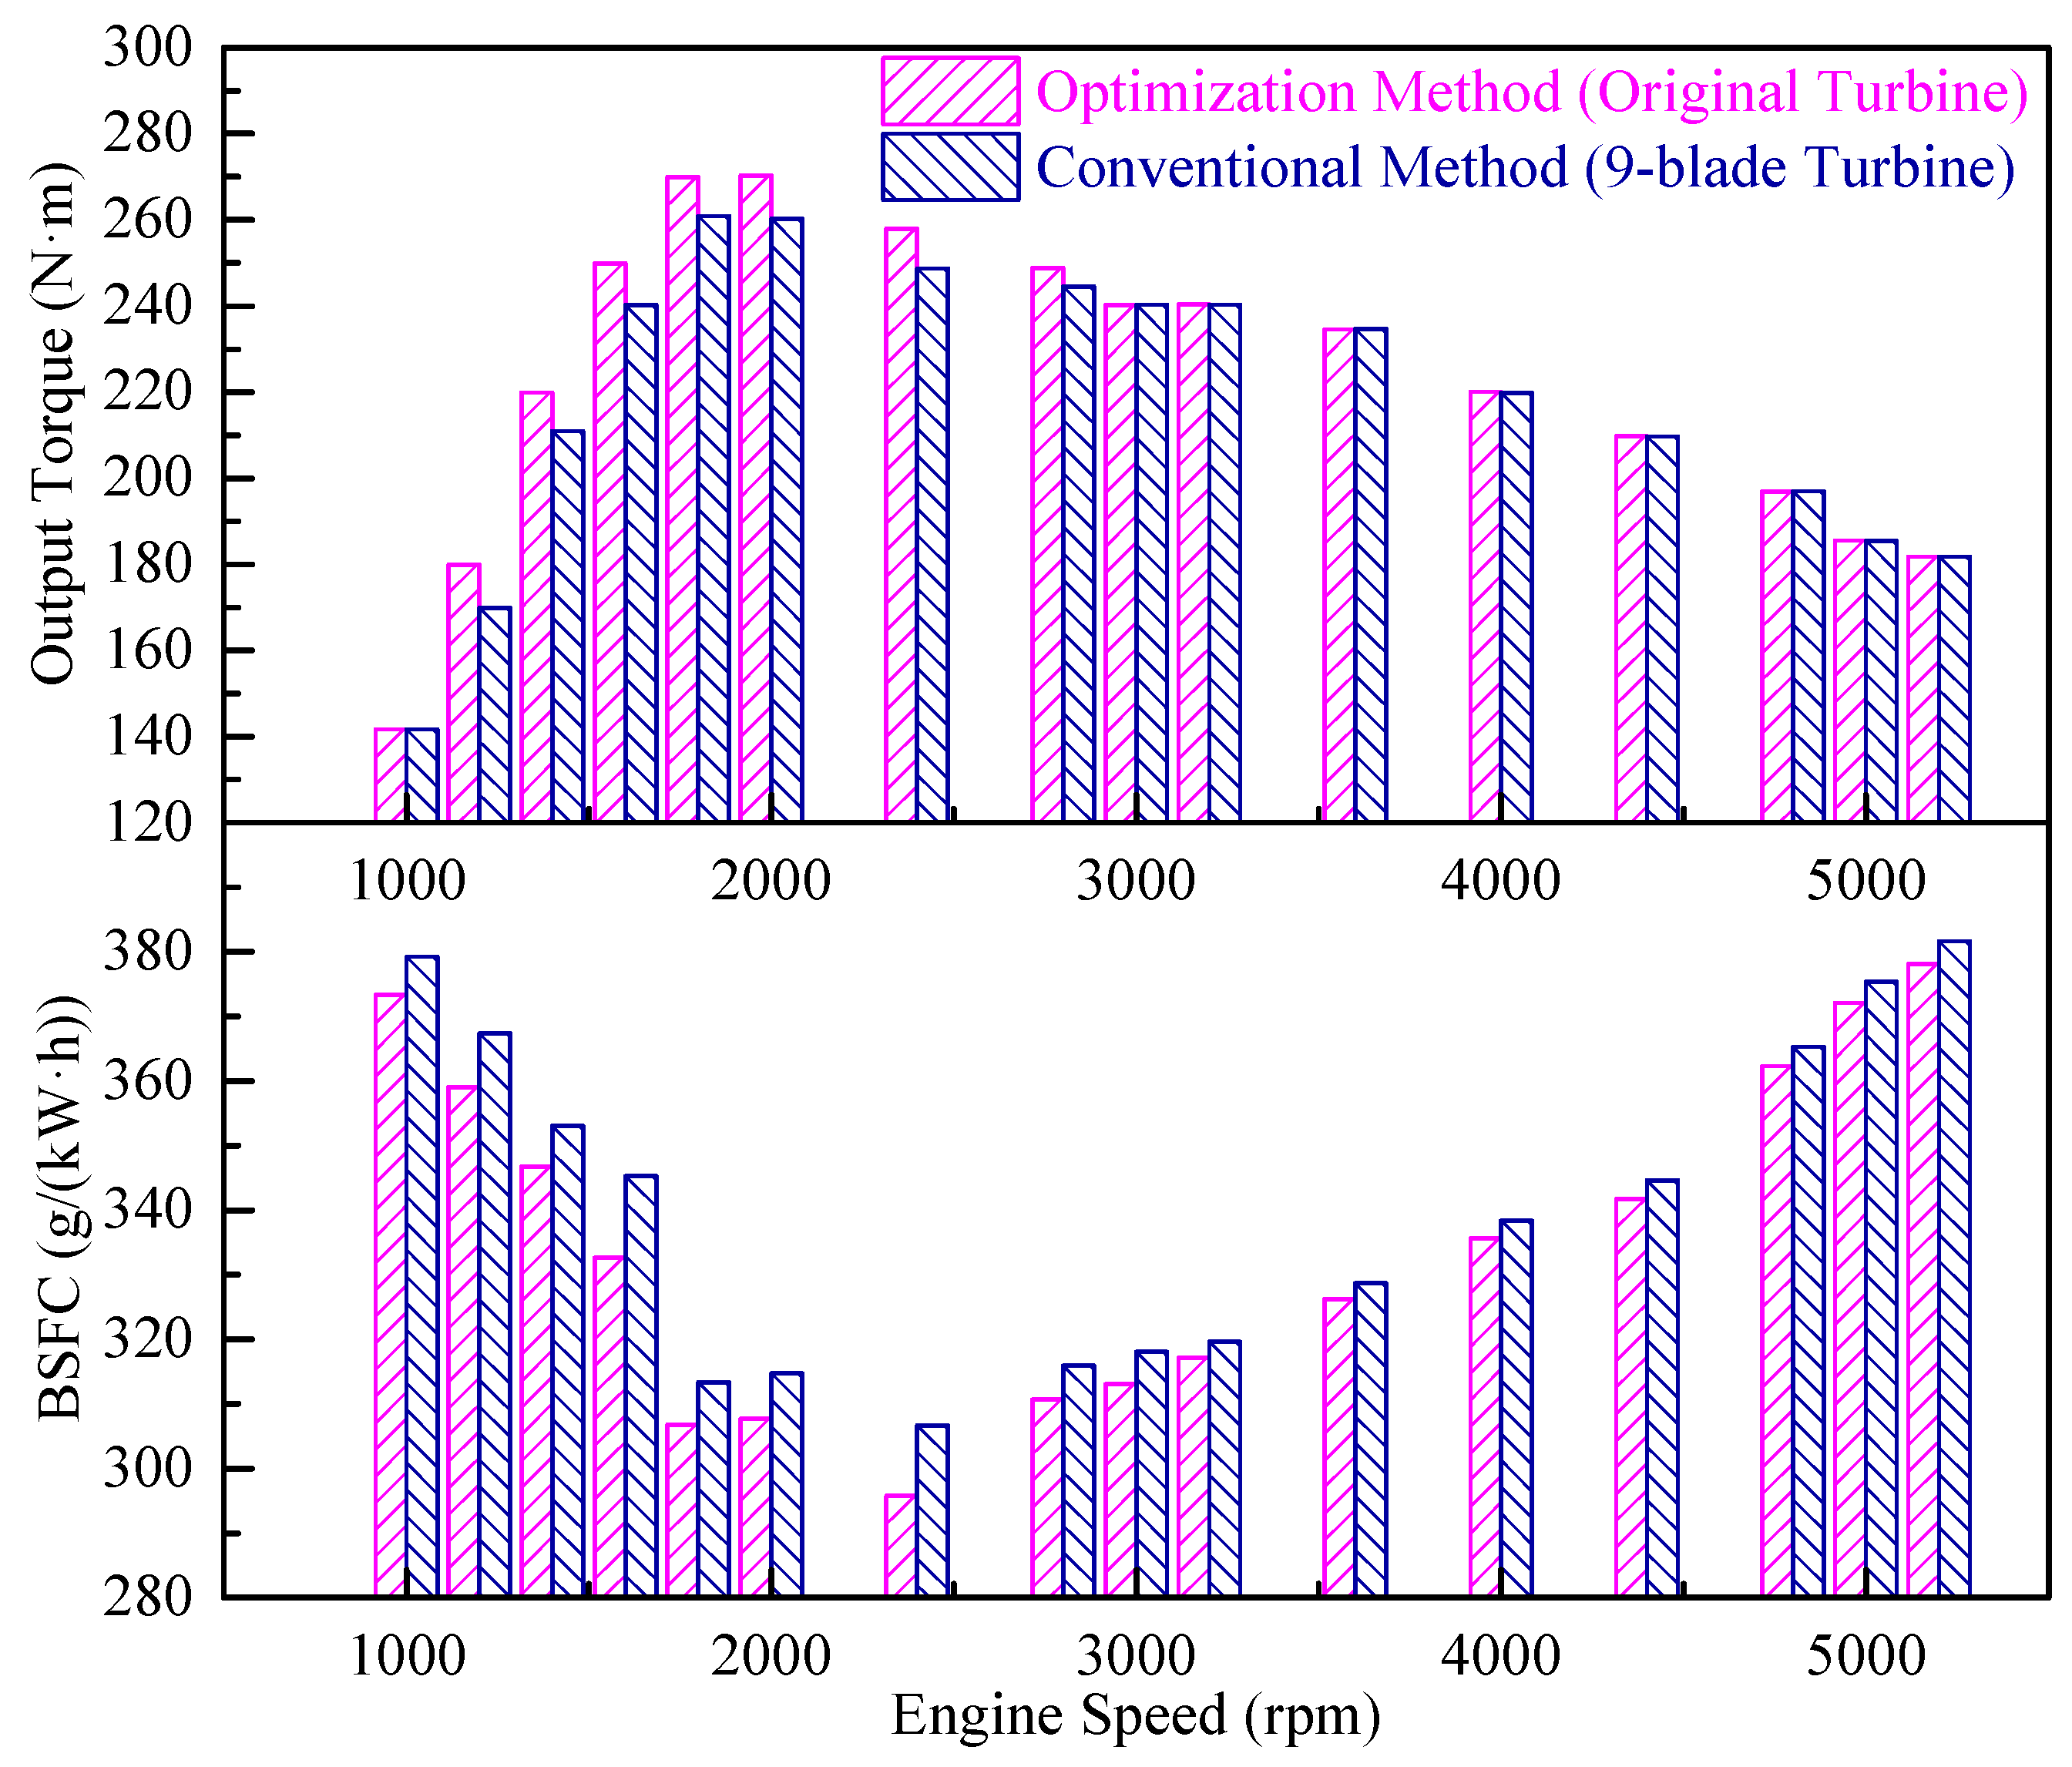
3.4. Comparative Analysis of Engine Performance with Optimized Structure of Two Methods

The difference between the conventional method and the joint point-based turbine optimization method was verified using the GT model. Figure 9 shows the 1D model constructed using GT-Power. The basic assumptions [49] in this simulation are as follows:
  • The working fluid is a uniform state, and the air entering the cylinder and the residual exhaust gas are completely mixed instantaneously;
  • Air and mixed gas are considered ideal gases, and their thermodynamic parameters are affected by the temperature and composition of the gas;
  • A steady flow process has been regarded for the process of working fluid;
  • The import and export kinetic energy of the working fluid is negligible, and there is no leakage during the combustion process;
  • The combustion heat release process is regarded as a thermodynamic process in which the external heats the working fluid inside the system in accordance with the established heat release law.
Keeping the compressor of the original turbine unchanged, the number of turbine impeller blades was varied to obtain the external characteristic torque and BSFC distribution of the engine, as shown in Figure 10. In the low- and medium-speed ranges of the engine, the output torque of the engine was significantly lower when matched with a nine-blade, single-entry turbine than when matched with the original turbine. Furthermore, the overall BSFC of the nine-blade, single-entry turbine was higher than that of the original turbine. Its maximum torque was 3.5% lower than that of the original turbine, and the minimum BSFC was 3.7% higher than that of the original turbine.
Reducing the number of turbine impeller blades reduced the engine power and fuel economy performance of the single-entry turbine. Therefore, the conclusion of reducing the number of turbine impeller blades obtained based on the conventional method was not reasonable, while the evaluation method based on the joint point performance could accurately predict the optimization trend of the number of turbine impeller blades.

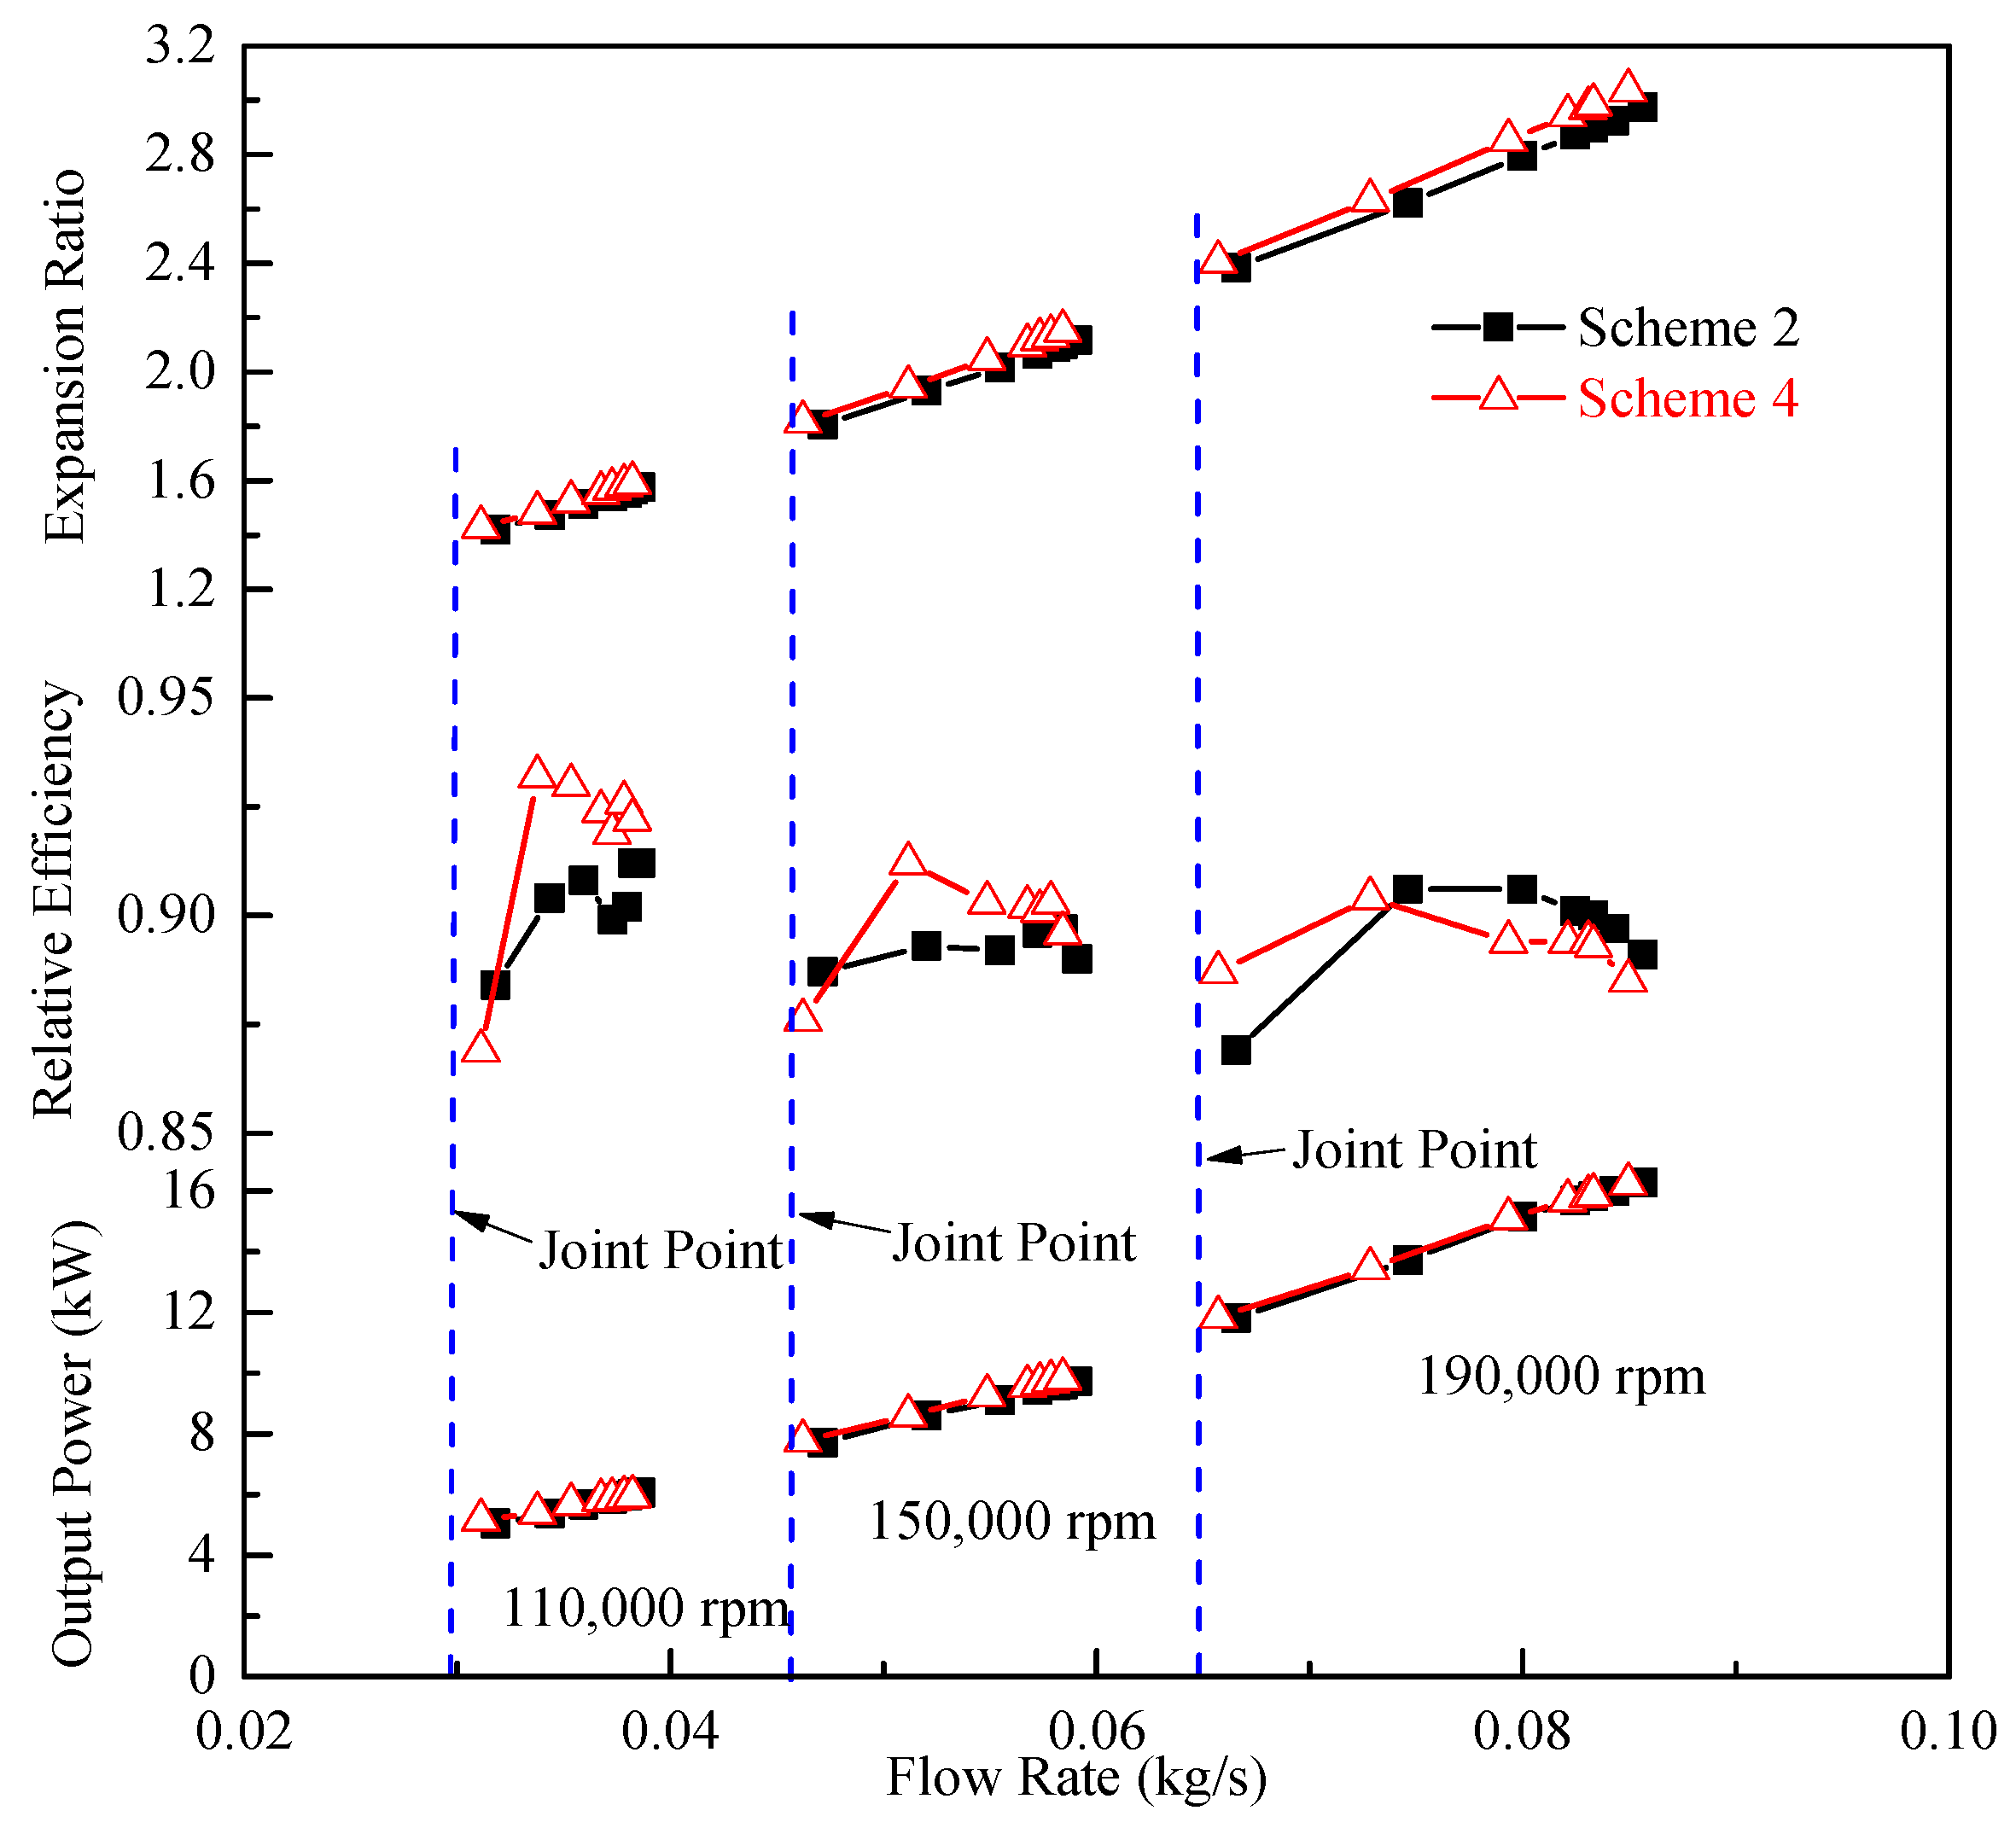
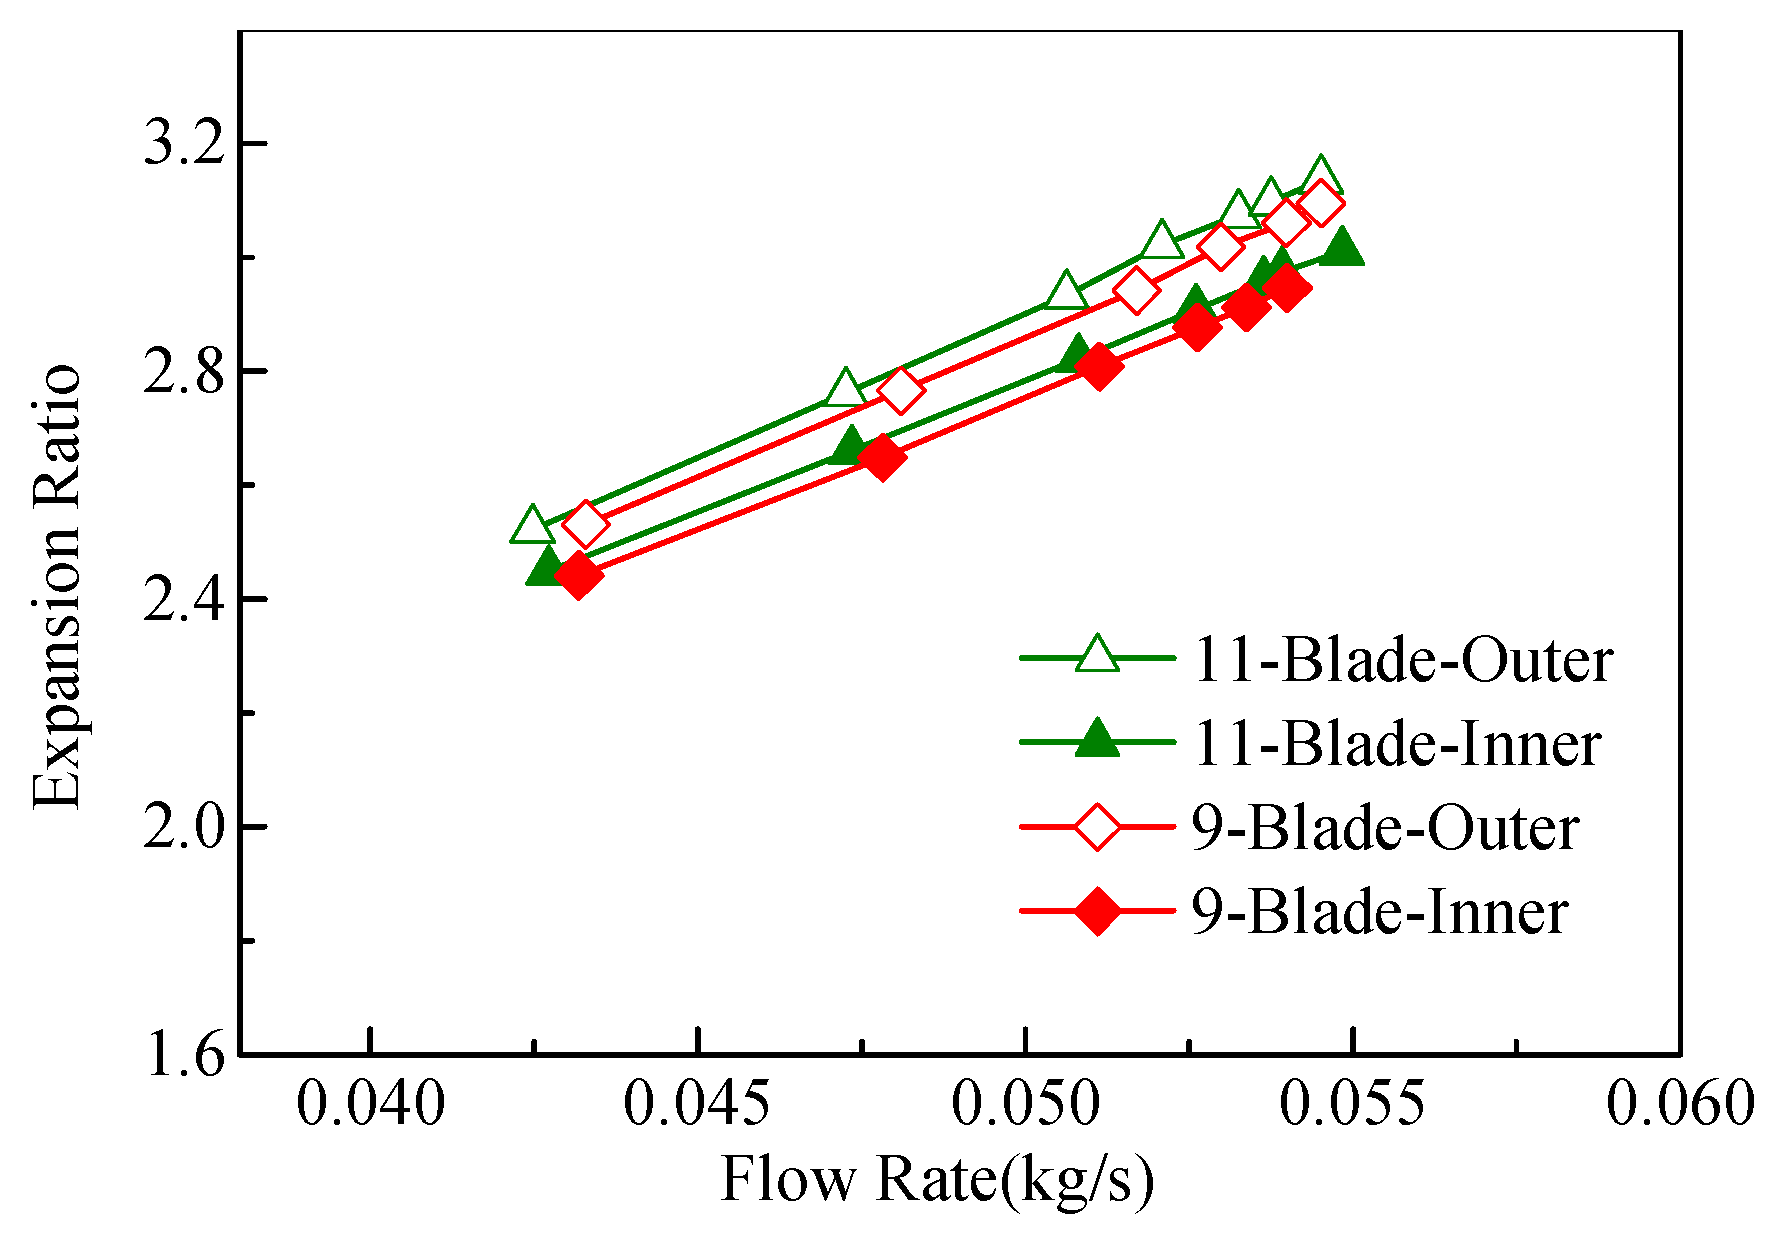
3.5. Optimized Design of Twin-Entry Turbine Structure under the Equal Admission Conditions

A twin-entry volute was designed based on the single-entry volute of the original turbine to compare its performance with a single-entry turbine under the same conditions. The two air inlets of the twin-entry turbine used equal-flow balanced admission. Figure 11 shows the performance comparison of two volute structures at 150,000 rpm. Compared to the single-entry turbine, the overall output of the twin-entry turbine was higher at the joint point. However, its expansion ratio was also higher, thus making the twin-entry turbine performance index only slightly greater than that of the original turbine. The performance indices of the 9-blade and 11-blade twin-entry turbines were equal at the joint point, indicating that the number of impeller blades could be reduced from 11 to 9 for the twin-entry turbine.
The output power of the twin-entry turbine was slightly higher than that of the single-entry turbine at the joint operating point, and there was no significant difference in the overall swallowing capacity. Furthermore, the efficiency of the joint point of the twin-entry turbine was slightly lower; however, the flow inside the impeller was more uniform. The overall performance of the joint point of the twin-entry turbine was slightly higher than that of the original turbine, and the joint point performance indices of the 9-blade and 11-blade, twin-entry turbines were equal. Therefore, the original 11-blade, single-entry turbine could be optimized to a 9-blade, twin-entry turbine, and the 9-blade, twin-entry turbine exhibited better response characteristics and a more stable operation.
Equal admission performance tests of the twin-entry turbine with different numbers of blades were conducted to illustrate the feasibility of optimizing the number of blades of the twin-entry turbine impeller. Figure 12 shows the equal admission experimental comparison of the performance of the 11-blade and 9-blade, twin-entry turbines. The maximum difference between the two expansion ratios (of 2.0%) was located at the high evolution speed joint point. The maximum difference in the relative efficiency at the joint point was 1.5%. The output powers of the two were close to each other near the joint working condition; the maximum difference between them was 2.1% at the joint point of 150,000 rpm, and the absolute difference was less than 0.2 kW.
From the analysis of the equal admission test, it was found that the swallowing capacity, efficiency, and output power of the 11-blade and 9-blade, twin-entry turbines were relatively close near the joint operating conditions, and there was no obvious difference between the two performances, indicating that the number of blades of the twin-entry turbine impeller could be optimized from 11 to 9 blades, which was consistent with the optimization conclusion from the simulation.

3.6. Analysis of the Unequal Admission Performance of the Twin-Entry Turbine

The exhaust pipes of cylinders 1 and 2 were connected to the outer runner of the twin-entry turbine, and the exhaust pipes of cylinders 3 and 4 were connected to the inner runner. The comprehensive performance comparisons of the turbine in different states under unequal admission condition were carried out at 150,000 rpm, as shown in Table 7. The output power of the twin-entry turbine had a significant advantage over the single-entry turbine, and its performance index was higher than that of the single-entry turbine. For the twin-entry turbine, the performance index was slightly larger for the outer runner.
Under unequal admission conditions, there was no significant difference in expansion ratio, efficiency, and output power overall between the 11-blade and 9-blade, twin-entry turbines with a fixed inlet. Therefore, the original 11-blade, single-entry turbine can be optimized to a 9-blade, twin-entry turbine with better performance.
The device for an unequal admission turbine inlet performance test was used to add a gasket at the inlet of the twin-entry turbine housing to cut off the flow rate to one inlet while the other inlet was normal. The unequal admission experiment of the twin-entry turbine swallowing capacity was carried out, as shown in Figure 13. When the same runner was closed, the expansion ratios of the 11-blade and 9-blade turbines were very close to each other, which was the same as the simulated trend. For the same number of blades, the turbine expansion ratio of the inner runner admission was slightly smaller than that of the outer runner intake; however, the expansion ratio error of the inner and outer runner admission was within the allowable range, indicating that there was no significant difference in the swallowing capacity of the inner and outer runners, and the experimental trend agreed well with the simulation conclusion.

4. Discussion

Based on the above method, all the performance points of engine meet the joint operating point requirements. Keeping the compressor of the original structure unchanged, the turbine structure was varied to obtain the external characteristic torque and the BSFC distribution of the engine based on the joint operating points, as shown in Figure 14. In the low- and middle-speed range of the engine, the output torque of the engine was significantly higher when matched with a twin-entry turbine than when matched with a single-entry turbine. However, its BSFC was lower than that of the single-entry turbine.
For the twin-entry volute, the torque and BSFC curves of the 11-blade and 9-blade turbines overlapped, showing no significant difference. Hence, the 9-blade impeller could replace the 11-blade impeller and significantly reduce the turbine rotor mass and improve the response characteristics of the turbocharger and engine. The maximum engine torque of the 9-blade, twin-entry turbine was 5.4% higher than that of the original engine, and its lowest BSFC was 2.1% lower than that of the original engine. It was seen that the 9-blade, twin-entry turbine could effectively improve the engine performance at low- and medium-speed, and that the turbine performance was significantly improved.
Figure 14 shows the results of the 1D engine performance simulation, which shows that the torque and BSFC are basically nonlinear. This conclusion has also been confirmed by Samuel et al. [50] and Yusaf et al. [51]. On the other hand, the turbine obtained by the optimization method based on the joint operating curve has no significant difference at high speed compared to the conventional method. However, the turbine with the new optimized method has improved torque and BSFC in the low and medium speed. In this operating region, engine torque was increased by up to 3.2% and BSFC was reduced by up to 1.1% compared to the turbine optimized by conventional methods.

5. Conclusions

In this study, according to the basic conditions of turbocharger internal operation, the turbocharger joint point was determined, and the internal joint operation curve was obtained. A turbine evaluation method was proposed based on the internal joint operation, and the number of impeller blades and turbine housing were selected for optimal application design. The following conclusions were obtained within the scope of this study:
(1)
Based on the joint operating characteristics of the two ends of the turbocharger compressor and turbine, the internal joint operating curve of the turbocharger was coupled using the performance distribution of the compressor and turbine, which was closer to the actual situation and was more practical;
(2)
The evaluation method based on the joint point performance could predict the optimization trend of the turbine more accurately. Based on the internal joint operation curve of the turbocharger, the number of turbine impeller blades was optimized compared with the conventional evaluation method. The 1D engine performance simulation showed that the engine power and fuel economy of the turbine structure optimized by the conventional method were worse than those of the original engine;
(3)
The turbine based on joint point optimization has better overall performance under the unequal admission condition. The output power of the twin-entry turbine has a significant advantage over the original turbine. Under the unequal admission condition, the 11-blade and 9-blade, twin-entry turbines have a similar performance, and the optimized turbine with 9-blade outer runner has the best overall performance, which is 1.7% higher than the original turbine;
(4)
The turbine structure determined using the optimization method showed clear advantages. The findings of the study were verified using performance tests. The engine 1D performance simulation further showed that the maximum torque of the engine with the 9-blade, twin-entry turbine was 5.4% higher than that of the original engine and that the minimum BSFC was reduced by 2.1%.
The analysis determined that the optimal turbocharger was a 9-blade, twin-entry turbine. The performance of the optimized turbocharger was verified using the turbocharger test and the engine 1D performance simulation results. In the low- and medium-speed operating regions, the engine torque was increased by up to 3.2%, and BSFC was reduced by up to 1.1% compared to the turbine optimized by conventional methods.
In this study, from the perspective of internal joint matching between the compressor and turbine, and by coupling the internal joint operation curve of the turbocharger, the optimization application study of the turbine was carried out with the objective of improving the performance of the turbocharger turbine under internal joint operation conditions. This optimization method can provide future reference for the research and design optimization of the turbocharger turbine.

Author Contributions

Conceptualization, S.Y. and H.F.; methodology, S.Y.; software, H.F.; validation, S.Y., H.F. and R.H.; formal analysis, H.F.; writing—original draft preparation, S.Y.; writing—review and editing, S.Y.; project administration, J.N.; funding acquisition, J.N. and X.S. All authors have read and agreed to the published version of the manuscript.

Funding

This research was funded by the National Natural Science Foundation of China youth Science Foundation project (Grant No. 22102116) and Nanchang Intelligent New Energy Vehicle Research Institute Foresight Project (TPD-TC202110-12).

Institutional Review Board Statement

Not applicable.

Informed Consent Statement

Not applicable.

Data Availability Statement

The data presented in this study are available in the main text of the article.

Acknowledgments

The team of authors acknowledges anonymous reviewers for their feedback, which certainly improved the clarity and quality of this paper.

Conflicts of Interest

The authors declare no conflict of interest.

References

  1. Helmers, E.; Leitao, J.; Tietge, U.; Butler, T. CO2-equivalent emissions from European passenger vehicles in the years 1995–2015 based on real-world use: Assessing the climate benefit of the European “diesel boom”. Atmos. Environ. 2019, 198, 122–132. [Google Scholar] [CrossRef]
  2. Chen, Y.S.; Ma, J.Q.; Han, B.; Zhang, P.; Hua, H.N.; Chen, H.; Su, X. Emissions of automobiles fueled with alternative fuels based on engine technology: A review. J. Traffic Transp. Eng.-Engl. Ed. 2018, 5, 318–334. [Google Scholar] [CrossRef]
  3. Cha, J.; Lee, J.; Chon, M.S. Evaluation of real driving emissions for Euro 6 light-duty diesel vehicles equipped with LNT and SCR on domestic sales in Korea. Atmos. Environ. 2019, 196, 133–142. [Google Scholar] [CrossRef]
  4. Ko, J.; Jin, D.; Jang, W.; Myung, C.L.; Kwon, S.; Park, S. Comparative investigation of NOx emission characteristics from a Euro 6-compliant diesel passenger car over the NEDC and WLTC at various ambient temperatures. J. Appl. Energy 2017, 187, 652–662. [Google Scholar] [CrossRef]
  5. Liang, X.Y.; Wang, Y.S.; Chen, Y.; Deng, S. Advances in emission regulations and emission control technologies for internal combustion engines. SAE J. Steep 2021, 2, 101–119. [Google Scholar] [CrossRef]
  6. Krishnamoorthi, M.; Malayalamurthi, R.; He, Z.X.; Kandasamy, S. A review on low temperature combustion engines: Performance, combustion and emission characteristics. Renew. Sustain. Energy Rev. 2019, 116, 109404. [Google Scholar] [CrossRef]
  7. Shi, C.; Zhang, Z.; Ji, C.W.; Li, X.Y.; Wu, Z.R. Potential improvement in combustion and pollutant emissions of a hydrogen-enriched rotary engine by using novel recess configuration. Chemosphere 2022, 299, 134491. [Google Scholar] [CrossRef] [PubMed]
  8. Shi, X.Y.; Qian, W.W.; Wang, H.Y.; Pan, M.Z.; Wang, Q.W.; Ni, J.M. Development and verification of a reduced dimethoxymethane/n-heptane/toluene kinetic mechanism and modelling for CI engines. Appl. Therm. Eng. 2022, 214, 118855. [Google Scholar] [CrossRef]
  9. Rosdi, S.M.; Mamat, R.; Azri, A.; Sudhakar, K. Effects of lean combustion on Bioethanol-Gasoline blends using turbocharged spark ignition engine. Int. J. Automot. Mech. Eng. 2021, 18, 9140–9148. [Google Scholar] [CrossRef]
  10. Lujan, J.M.; Serrano, J.R.; Piqueras, P.; Diesel, B. Turbine and exhaust ports thermal insulation impact on the engine efficiency and aftertreatment inlet temperature. J. Appl. Energy 2019, 240, 409–423. [Google Scholar] [CrossRef]
  11. Lavagnoli, S.; De Maesschalck, C.; Paniagua, G. Uncertainty analysis of adiabatic wall temperature measurements in turbine experiments. Appl. Therm. Eng. 2015, 82, 170–181. [Google Scholar] [CrossRef]
  12. Burke, R.D.; Vagg, C.R.M.; Chalet, D.; Chesse, P. Heat transfer in turbocharger turbines under steady, pulsating and transient conditions. Int. J. Heat Fluid Flow. 2015, 52, 185–197. [Google Scholar] [CrossRef]
  13. Schorn, N. The radial turbine for small turbocharger applications: Evolution and analytical methods for twin-entry turbine turbochargers. SAE Int. J. Engines 2014, 7, 1422–1442. [Google Scholar] [CrossRef]
  14. Copeland, C.D.; Martinez-Botas, R.; Seiler, M. Unsteady performance of a double entry turbocharger turbine with a comparison to steady flow conditions. J. Turbomach. 2012, 134, 021022. [Google Scholar] [CrossRef]
  15. Rajoo, S.; Romagnoli, A.; Martinez-Botas, R.F. Unsteady performance analysis of a twin-entry variable geometry turbocharger turbine. Energy 2012, 38, 176–189. [Google Scholar] [CrossRef]
  16. Fan, H.C.; Ni, J.M.; Wang, H.; Zhu, Z.F.; Liu, Y.G. Numerical study of unsteady performance of a double-Entry turbocharger turbine under different A/R value conditions. In Proceedings of the SAE 2016 World Congress and Exhibition, Detroit, MI, USA, 5 April 2016. [Google Scholar] [CrossRef]
  17. Romagnoli, A.; Copeland, C.D.; Martinez-Botas, R.; Seiler, M.; Rajoo, S.; Costall, A.W. Comparison between the steady performance of double-entry and twin-entry turbocharger turbines. J. Turbomach. 2013, 135, 011042. [Google Scholar] [CrossRef]
  18. Romagnoli, A.; Martinez-Botas, R.F.; Rajoo, S. Steady state performance evaluation of variable geometry twin-entry turbine. Int. J. Heat Fluid Flow 2011, 32, 477–489. [Google Scholar] [CrossRef]
  19. Chiong, M.S.; Rajoo, S.; Romagnoli, A.; Costall, A.W.; Martinez-Botas, R.F. Integration of meanline and one-dimensional methods for prediction of pulsating performance of a turbocharger turbine. Energy Convers. Manag. 2014, 81, 270–281. [Google Scholar] [CrossRef]
  20. Romagnoli, A.; Martinez-Botas, R.F. Performance prediction of a nozzled and nozzleless mixed-flow turbine in steady conditions. Int. J. Mech. Sci. 2011, 53, 557–574. [Google Scholar] [CrossRef]
  21. Cerdoun, M.S.; Ghenaiet, A. Unsteady behaviour of a twin entry radial turbine under engine like inlet flow conditions. Appl. Therm. Eng. 2018, 130, 93–111. [Google Scholar] [CrossRef]
  22. Chiong, M.S.; Rajoo, S.; Martinez-Botas, R.F.; Costall, A.W. Engine turbocharger performance prediction: One-dimensional modeling of a twin entry turbine. Energy Convers. Manag. 2012, 57, 68–78. [Google Scholar] [CrossRef]
  23. Chiong, M.S.; Rajoo, S.; Romagnoli, A.; Costall, A.W.; Martinez-Botas, R.F. One-dimensional pulse-flow modeling of a twin-scroll turbine. Energy 2016, 115, 1291–1304. [Google Scholar] [CrossRef]
  24. Padzillah, M.H.; Rajoo, S.; Martinez-Botas, R.F. Influence of speed and frequency towards the automotive turbocharger turbine performance under pulsating flow conditions. Energy Convers. Manag. 2014, 80, 416–428. [Google Scholar] [CrossRef]
  25. Ding, Z.; Zhuge, W.; Zhang, Y.; Chen, H.; Martinez-Botas, R.; Yang, M. A one-dimensional unsteady performance model for turbocharger turbines. Energy 2017, 132, 341–355. [Google Scholar] [CrossRef]
  26. Galindo, J.; Tiseira, A.; Fajardo, P.; Garcıa-Cuevas, L.M. Development and validation of a radial variable geometry turbine model for transient pulsating flow applications. Energy Convers. Manag. 2014, 85, 190–203. [Google Scholar] [CrossRef]
  27. Newton, P.; Copeland, C.; Martinez-Botas, R.; Seiler, M. An audit of aerodynamic loss in a double entry turbine under full and partial admission. Int. J. Heat Fluid Flow 2012, 33, 70–80. [Google Scholar] [CrossRef]
  28. Costall, A.W.; McDavid, R.M.; Martinez-Botas, R.F.; Baines, N.C. Pulse performance modeling of a twin entry turbocharger turbine under full and unequal admission. J. Turbomach. 2011, 133, 021005. [Google Scholar] [CrossRef]
  29. Hajilouy-Benisi, A.; Rad, M.; Shahhosseini, M.R. Flow and performance characteristics of twin-entry radial turbine under full and extreme partial admission conditions. Arch. Appl. Mech. 2009, 79, 1127–1143. [Google Scholar] [CrossRef]
  30. Cai, L.X.; Xiao, J.F.; Wang, S.S.; Gao, S.; Duan, J.Y.; Mao, J.R. Gas-particle flows and erosion characteristic of large capacity dry top gas pressure recovery turbine. Energy 2017, 120, 498–506. [Google Scholar] [CrossRef]
  31. Xue, Y.X.; Yang, M.Y.; Martinez-Botas, R.F.; Romagnoli, A.; Deng, K.Y. Loss analysis of a mix-flow turbine with nozzled twin-entry volute at different admissions. Energy 2019, 166, 775–788. [Google Scholar] [CrossRef]
  32. Mamala, J.J.; Praznowski, K.; Kołodziej, S.; Ligus, G. The Use of Short-Term Compressed Air Supercharging in a Combustion Engine with Spark Ignition. Int. J. Automot. Mech. Eng. 2021, 18, 8704–8713. [Google Scholar] [CrossRef]
  33. Galindo, J.; Serrano, J.R.; Climent, H.; Tiseira, A. Experiments and modelling of surge in small centrifugal compressor for automotive engines. Exp. Thermal. Fluid Sci. 2008, 32, 818–826. [Google Scholar] [CrossRef]
  34. Bellis, V.D.; Marelli, S.; Bozza, F.; Capobianco, M. 1d simulation and experimental analysis of a turbocharger turbine for automotive engines under steady and unsteady flow conditions. Energy Procedia 2014, 45, 909–918. [Google Scholar] [CrossRef]
  35. Fatsis, A.; Vlachakis, N.; Leontis, G. A centrifugal compressor performance Map empirical prediction method for automotive turbochargers. Int. J. Turbo. Jet. Eng. 2019, 38, 411–420. [Google Scholar] [CrossRef]
  36. Kim, S.; Park, J.; Ahn, K.; Baek, J. Improvement of the performance of a centrifugal compressor by modifying the volute inlet. J. Fluids Eng. 2010, 132, 091101. [Google Scholar] [CrossRef]
  37. Chung, J.; Lee, S.; Kim, N.; Lee, B.; Kim, D.; Choi, S.; Kim, G. Study on the effect of turbine inlet temperature and backpressure conditions on reduced turbine flow rate performance characteristics and Correction Method for Automotive Turbocharger. Energies 2019, 12, 3934. [Google Scholar] [CrossRef]
  38. Fan, J.; Yuan, Q.H.; Jing, F.L.; Xu, H.B.; Wang, H.; Meng, Q.Z. Adaptive local maximum-entropy surrogate model and its application to turbine disk reliability analysis. Aerospace 2022, 9, 353. [Google Scholar] [CrossRef]
  39. Meng, D.B.; Yang, S.Q.; Zhang, Y.; Zhu, S.P. Structural reliability analysis and uncertainties-based collaborative design and optimization of turbine blades using surrogate model. Fatigue Fract. Eng. Mater. Struct. 2019, 42, 1219–1227. [Google Scholar] [CrossRef]
  40. Payri, F.; Serrano, J.R.; Fajardo, P.; Reyes-Belmonte, M.A.; Gozalbo-Belles, R. A physically based methodology to extrapolate performance maps of radial turbines. Energy Convers. Manag. 2012, 55, 149–163. [Google Scholar] [CrossRef]
  41. Cheng, L.; Dimitriou, P.; Wang, W.; Peng, J.; Aitouche, A. A novel fuzzy logic variable geometry turbocharger and exhaust gas recirculation control scheme for optimizing the performance and emissions of a diesel engine. Int. J. Engine Res. 2020, 21, 1298–1313. [Google Scholar] [CrossRef]
  42. Xu, C.; Wang, S.; Mao, Y. Numerical study of porous treatments on controlling flow around a circular cylinder. Energies 2022, 15, 1981. [Google Scholar] [CrossRef]
  43. Fan, H.C.; Ni, J.M.; Shi, X.Y.; Jiang, N.; Qu, D.Y.; Zheng, Y.; Zheng, Y.H. Unsteady performance simulation analysis of a waste-gated turbocharger turbine under different valve opening conditions. In Proceedings of the SAE 2017 International Powertrains, Fuels and Lubricants Meeting, Detroit, MI, USA, 8 October 2017. [Google Scholar] [CrossRef]
  44. Fan, H.C.; Ni, J.M.; Shi, X.Y.; Qu, D.Y.; Zheng, Y.; Zheng, Y.H. Simulation of a combined nozzled and nozzleless twin-entry turbine for improved efficiency. J. Eng. Gas Turbines Power 2019, 141, 051019. [Google Scholar] [CrossRef]
  45. Romagnoli, A.; Martinez-Botas, R. Heat Transfer Analysis in a turbocharger turbine: An experimental and computational evaluation. Appl. Therm. Eng. 2012, 38, 58–77. [Google Scholar] [CrossRef]
  46. Bohn, D.; Heuer, T.; Kusterer, K. Conjugate flow and heat transfer investigation of a turbo charger. J. Eng. Gas Turbines Power 2005, 127, 663–669. [Google Scholar] [CrossRef]
  47. Wang, Z.H.; Ma, C.C.; Zhang, H.; Zhu, F. A novel pulse-adaption flow control method for a turbocharger turbine: Elastically restrained guide vane. Proc. Inst. Mech. Eng. Part C 2020, 234, 2581–2594. [Google Scholar] [CrossRef]
  48. Galindo, J.; Fajardo, P.; Navarro, R.; Garcia-Cuevas, L.M. Characterization of a radial turbocharger turbine in pulsating flow by means of CFD and its application to engine modeling. Appl. Energy 2013, 103, 116–127. [Google Scholar] [CrossRef]
  49. Duan, Y.F.; Shi, X.Y.; Kang, Y.; Liao, Y.; Duan, L.S. Effect of Hydrous Ethanol Combined with EGR on Performance of GDI Engine. In Proceedings of the SAE 2020 World Congress and Exhibition, Detroit, MI, USA, 14 April 2016. [Google Scholar] [CrossRef]
  50. Samuel, O.D.; Waheed, M.A.; Taheri-Garavand, A.; Verma, T.N.; Dairo, O.U.; Bolaji, B.O.; Afzal, A. Prandtl number of optimum biodiesel from food industrial waste oil and diesel fuel blend for diesel engine. Fuel 2021, 285, 119049. [Google Scholar] [CrossRef]
  51. Yusaf, T.F.; Buttsworth, D.R.; Saleh, K.H.; Yousif, B.F. CNG-diesel engine performance and exhaust emission analysis with the aid of artificial neural network. Appl. Energy 2009, 87, 1661–1669. [Google Scholar] [CrossRef]
Figure 1. Flow chart of study framework.
Sustainability 14 09952 g001
Figure 2. (a) Physical prototype; (b) three-dimensional structure model.
Sustainability 14 09952 g002
Figure 3. Schematic diagram of the bench arrangement.
Sustainability 14 09952 g003
Figure 4. Experimental verification of the original turbine model.
Sustainability 14 09952 g004
Figure 5. Schematic diagram of the power balance at both ends of the turbocharger at 150,000 rpm.
Sustainability 14 09952 g005
Figure 6. (a) Distribution of the joint operation points at each speed; (b) distribution of the joint operation curve on the compressor power consumption map.
Sustainability 14 09952 g006
Figure 7. The effect of the number of blades on performance at 150,000 rpm.
Sustainability 14 09952 g007
Figure 8. Entropy increase distribution at 80% leaf spreading height of impeller channels.
Sustainability 14 09952 g008
Figure 9. Engine 1D model.
Sustainability 14 09952 g009
Figure 10. Effect of turbine structure on engine performance.
Sustainability 14 09952 g010
Figure 11. The effect of different turbine structures on performance at 150,000 rpm.
Sustainability 14 09952 g011
Figure 12. The equal admission experimental comparison of twin-entry turbines with a different number of blades.
Sustainability 14 09952 g012
Figure 13. The unequal admission experimental comparison of the twin-entry turbine swallowing capacity.
Sustainability 14 09952 g013
Figure 14. (a) The effect of different turbine structures on engine torque; (b) the effect of different turbine structures on engine BSFC.
Sustainability 14 09952 g014
Table 1. Optimization design schemes.
SchemeVolute StructureImpeller Blades
1 (Original Turbine)Single-entry11-blade
2Twin-entry11-blade
3Single-entry9-blade
4Twin-entry9-blade
Table 2. Turbine parameters.
No.ParameterProfile
1Volute inlet diameter/mm36.0
2Volute nozzle width/mm5.0
3Impeller inlet diameter/mm37.6
4Impeller outlet diameter/mm33.1
5Impeller axial length/mm18.9
6Impeller inlet blade height/mm5.1
7Impeller inlet blade angle/deg0
8Impeller exit mean blade angle/deg56.4
9Radial and axial tip clearance/mm0.5
10Number of blades11
11Flow range/(kg/s)0.02–0.13
Table 3. Details for each domain.
Fluid DomainMesh TypeMesh Numbers
Inlet ductStructured73,219
Separate turbine voluteUnstructured620,189
Impeller single blade channelStructured203,038
Wheel back clearanceUnstructured242,283
Outlet transitionUnstructured527,878
Outlet ductStructured169,575
Total 3,866,562
Table 4. Weight assignment for each performance parameter.
Joint Point Performance
Parameters
Output PowerExpansion RatioEfficiency
Weight assignment603010
Table 5. Comparison of turbines with different number of blades.
Number of Blades891011
Joint point output power (kW)3.583.603.623.63
Joint point expansion ratio1.721.711.711.72
Joint point efficiency (%)66.1467.367.2567.61
Turbine Performance Index98.999.799.9100.0
Table 6. Turbine outlet residual velocity loss.
Number of Blades89101112
Outlet Absolute Speed (m/s)201.42196.87190.68190.50190.11
Table 7. Performance comparison under unequal admission conditions at 150,000 rpm.
Turbine StateScheme 111-Blade-Outer11-Blade-Inner9-Blade-Outer9-Blade-Inner
Joint point output power (kW)8.0810.0710.0310.0710.07
Joint point expansion ratio2.413.943.963.953.98
Joint point efficiency (%)62.5953.6552.5453.7952.23
Turbine Performance Index100101.6101.1101.7101.3
Publisher’s Note: MDPI stays neutral with regard to jurisdictional claims in published maps and institutional affiliations.

