Assessment of Genetic Diversity of Bread Wheat Genotypes for Drought Tolerance Using Canopy Reflectance-Based Phenotyping and SSR Marker-Based Genotyping
Abstract
1. Introduction
2. Materials and Methods
2.1. Phenotyping
2.1.1. Experimental Conditions and Measurement of VIs and Yield Traits
2.1.2. Statistical Analysis
2.2. Genotyping
2.2.1. SSR Markers and Extraction of Genomic DNA
2.2.2. Polymerase Chain Reaction (PCR) Amplification and Gel Electrophoresis
2.2.3. SSR Marker Data Analysis
3. Results
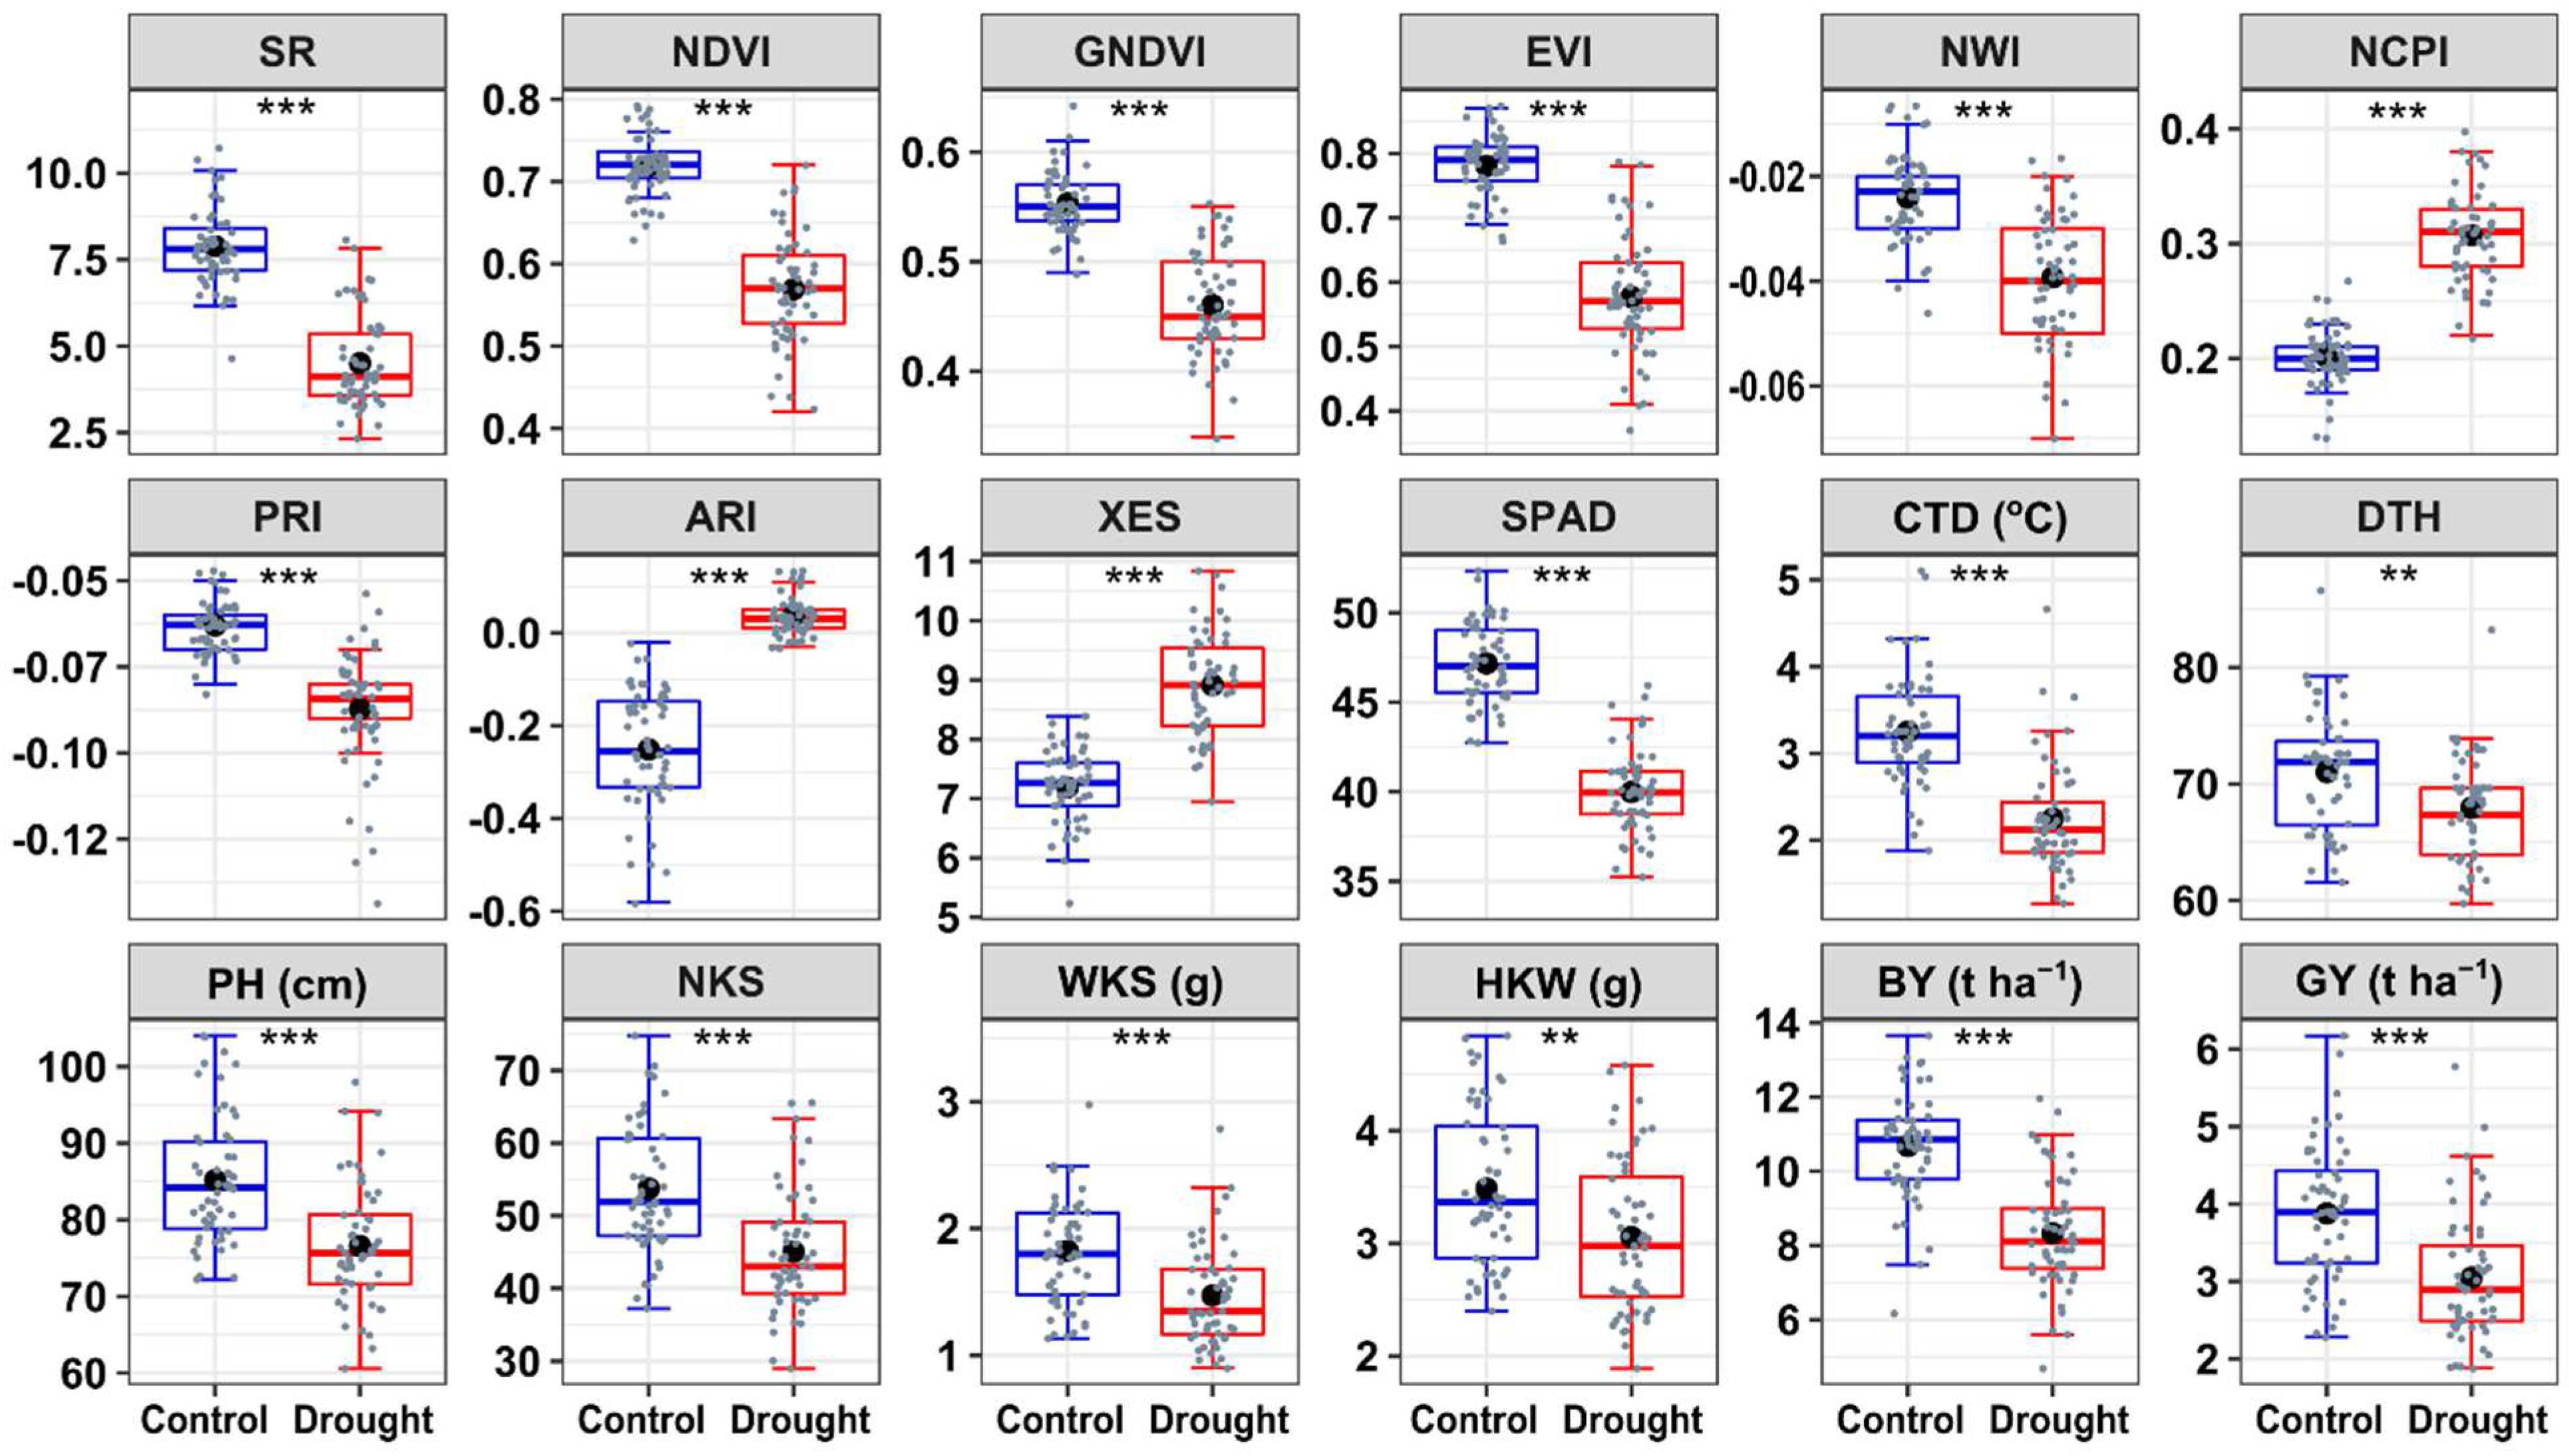
3.1. VIs and Yield Traits
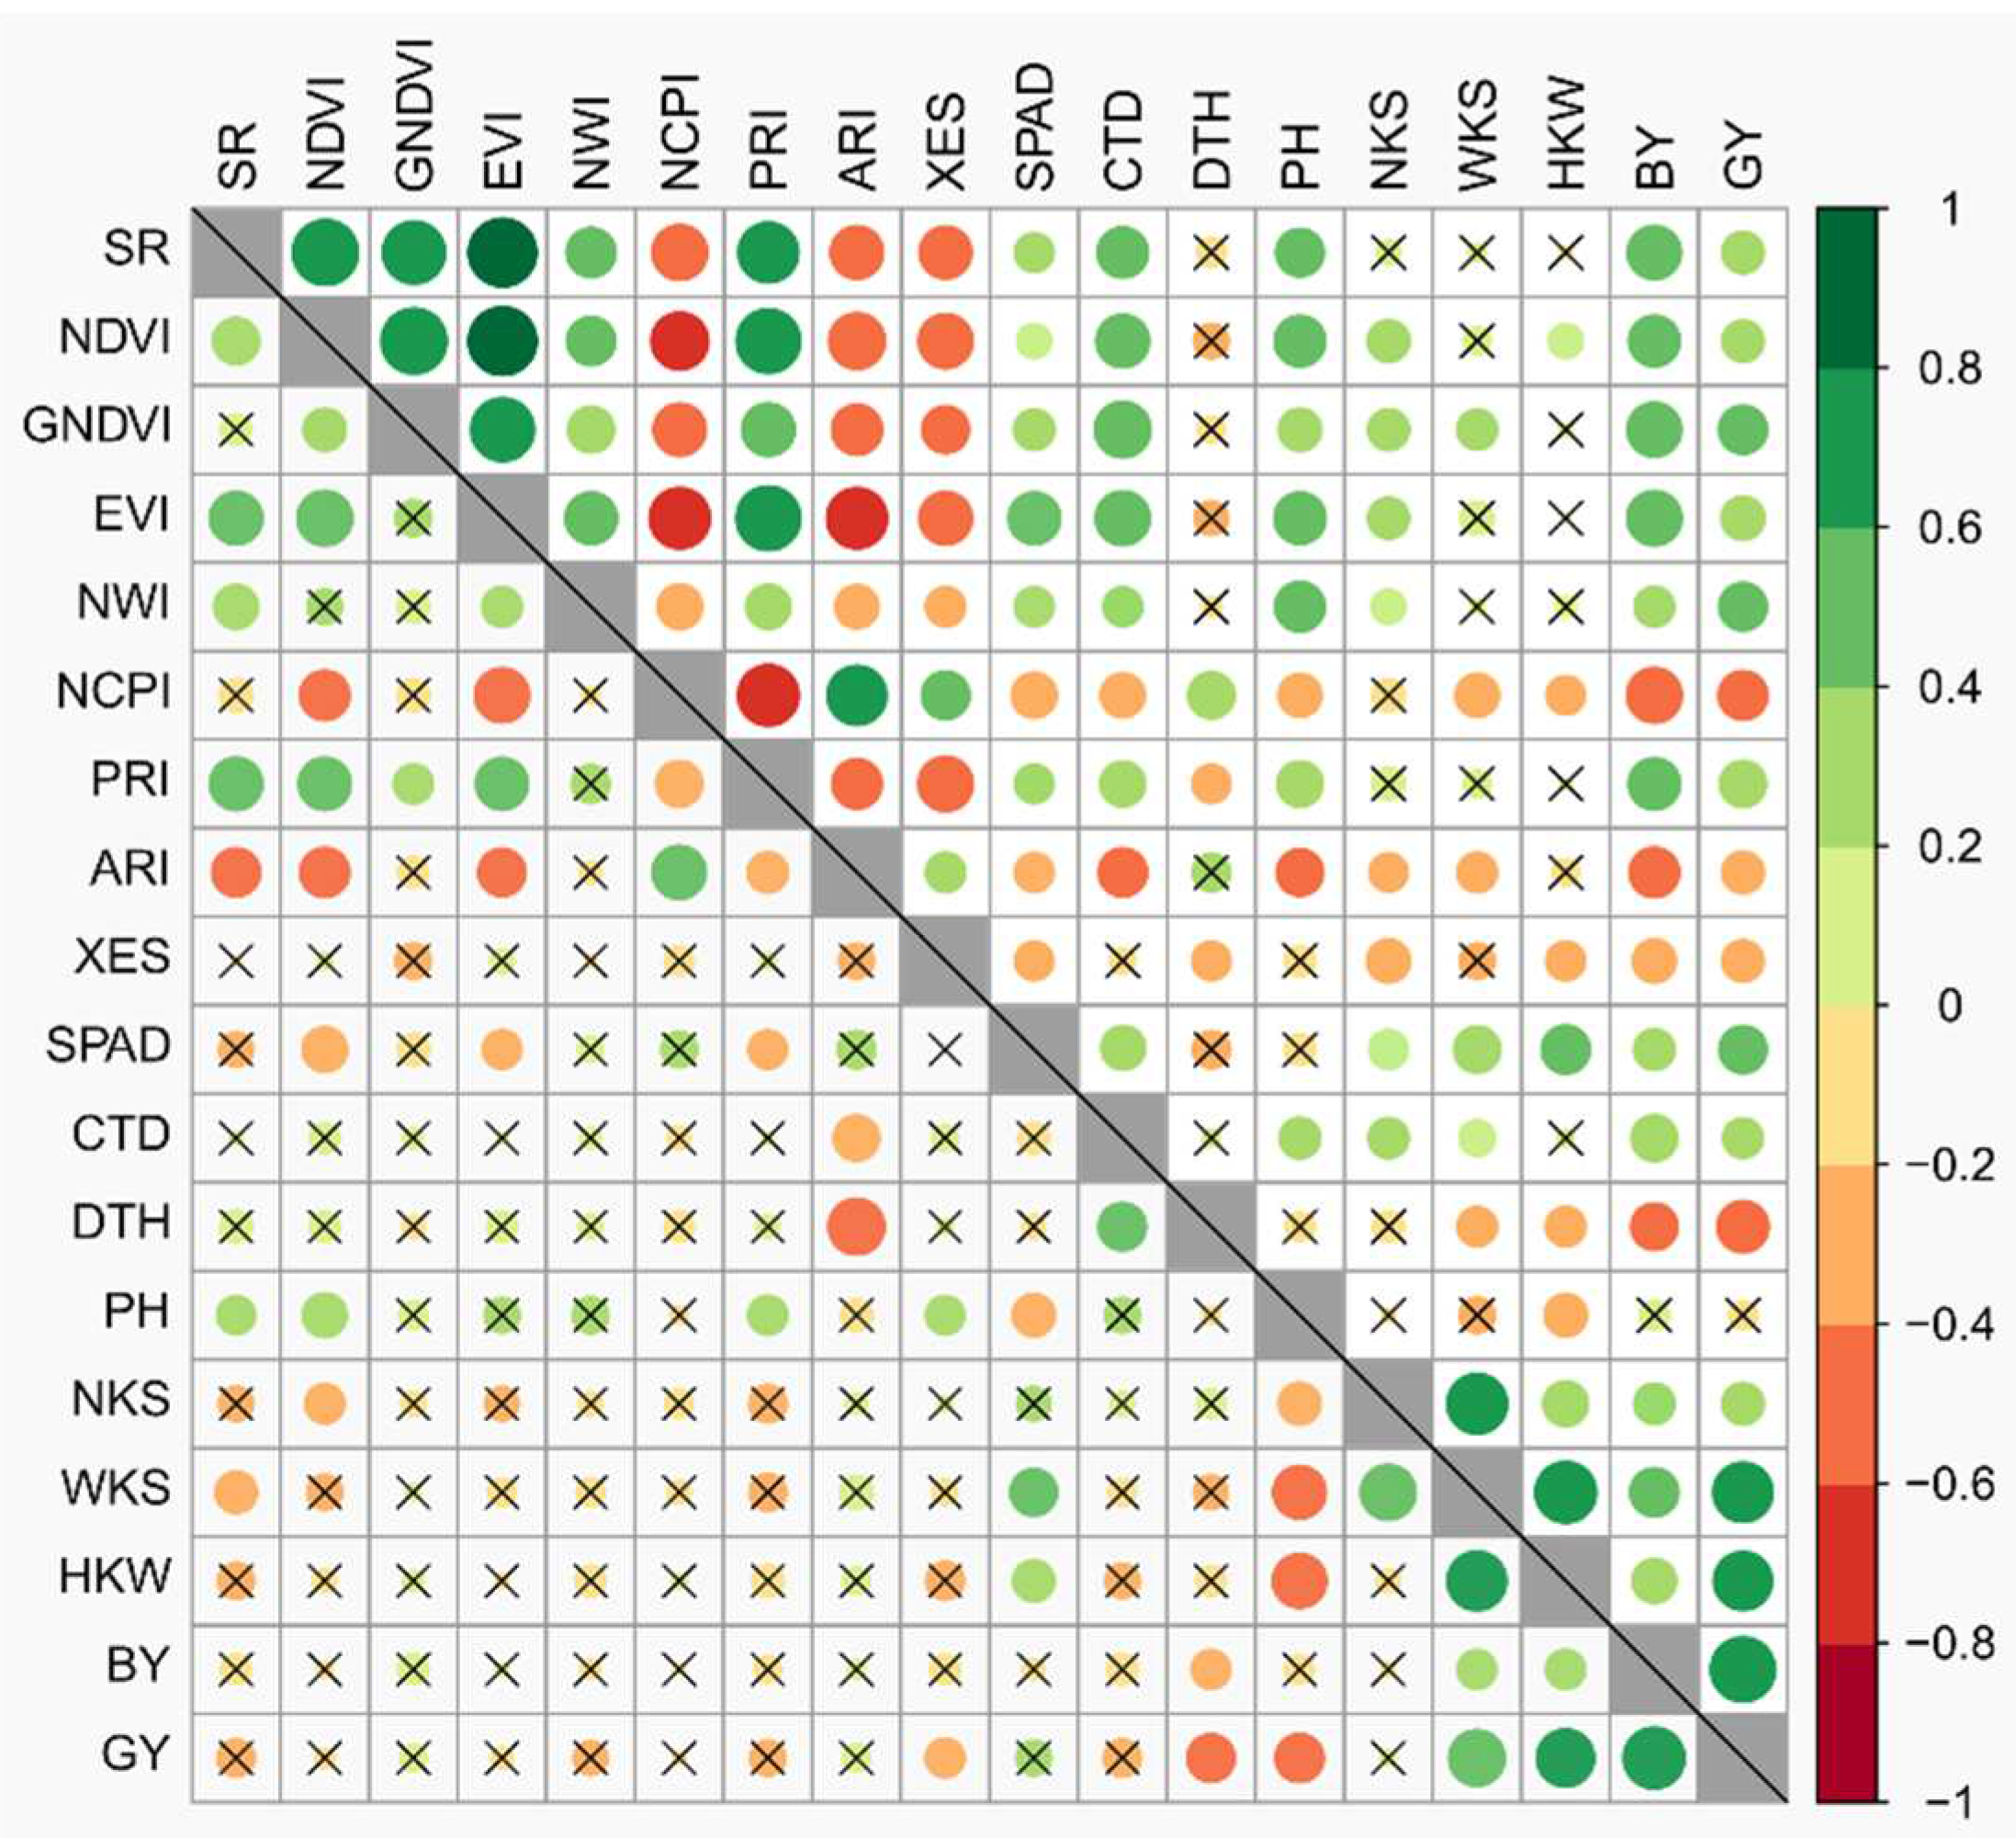
3.2. Association among Phenotypic Traits
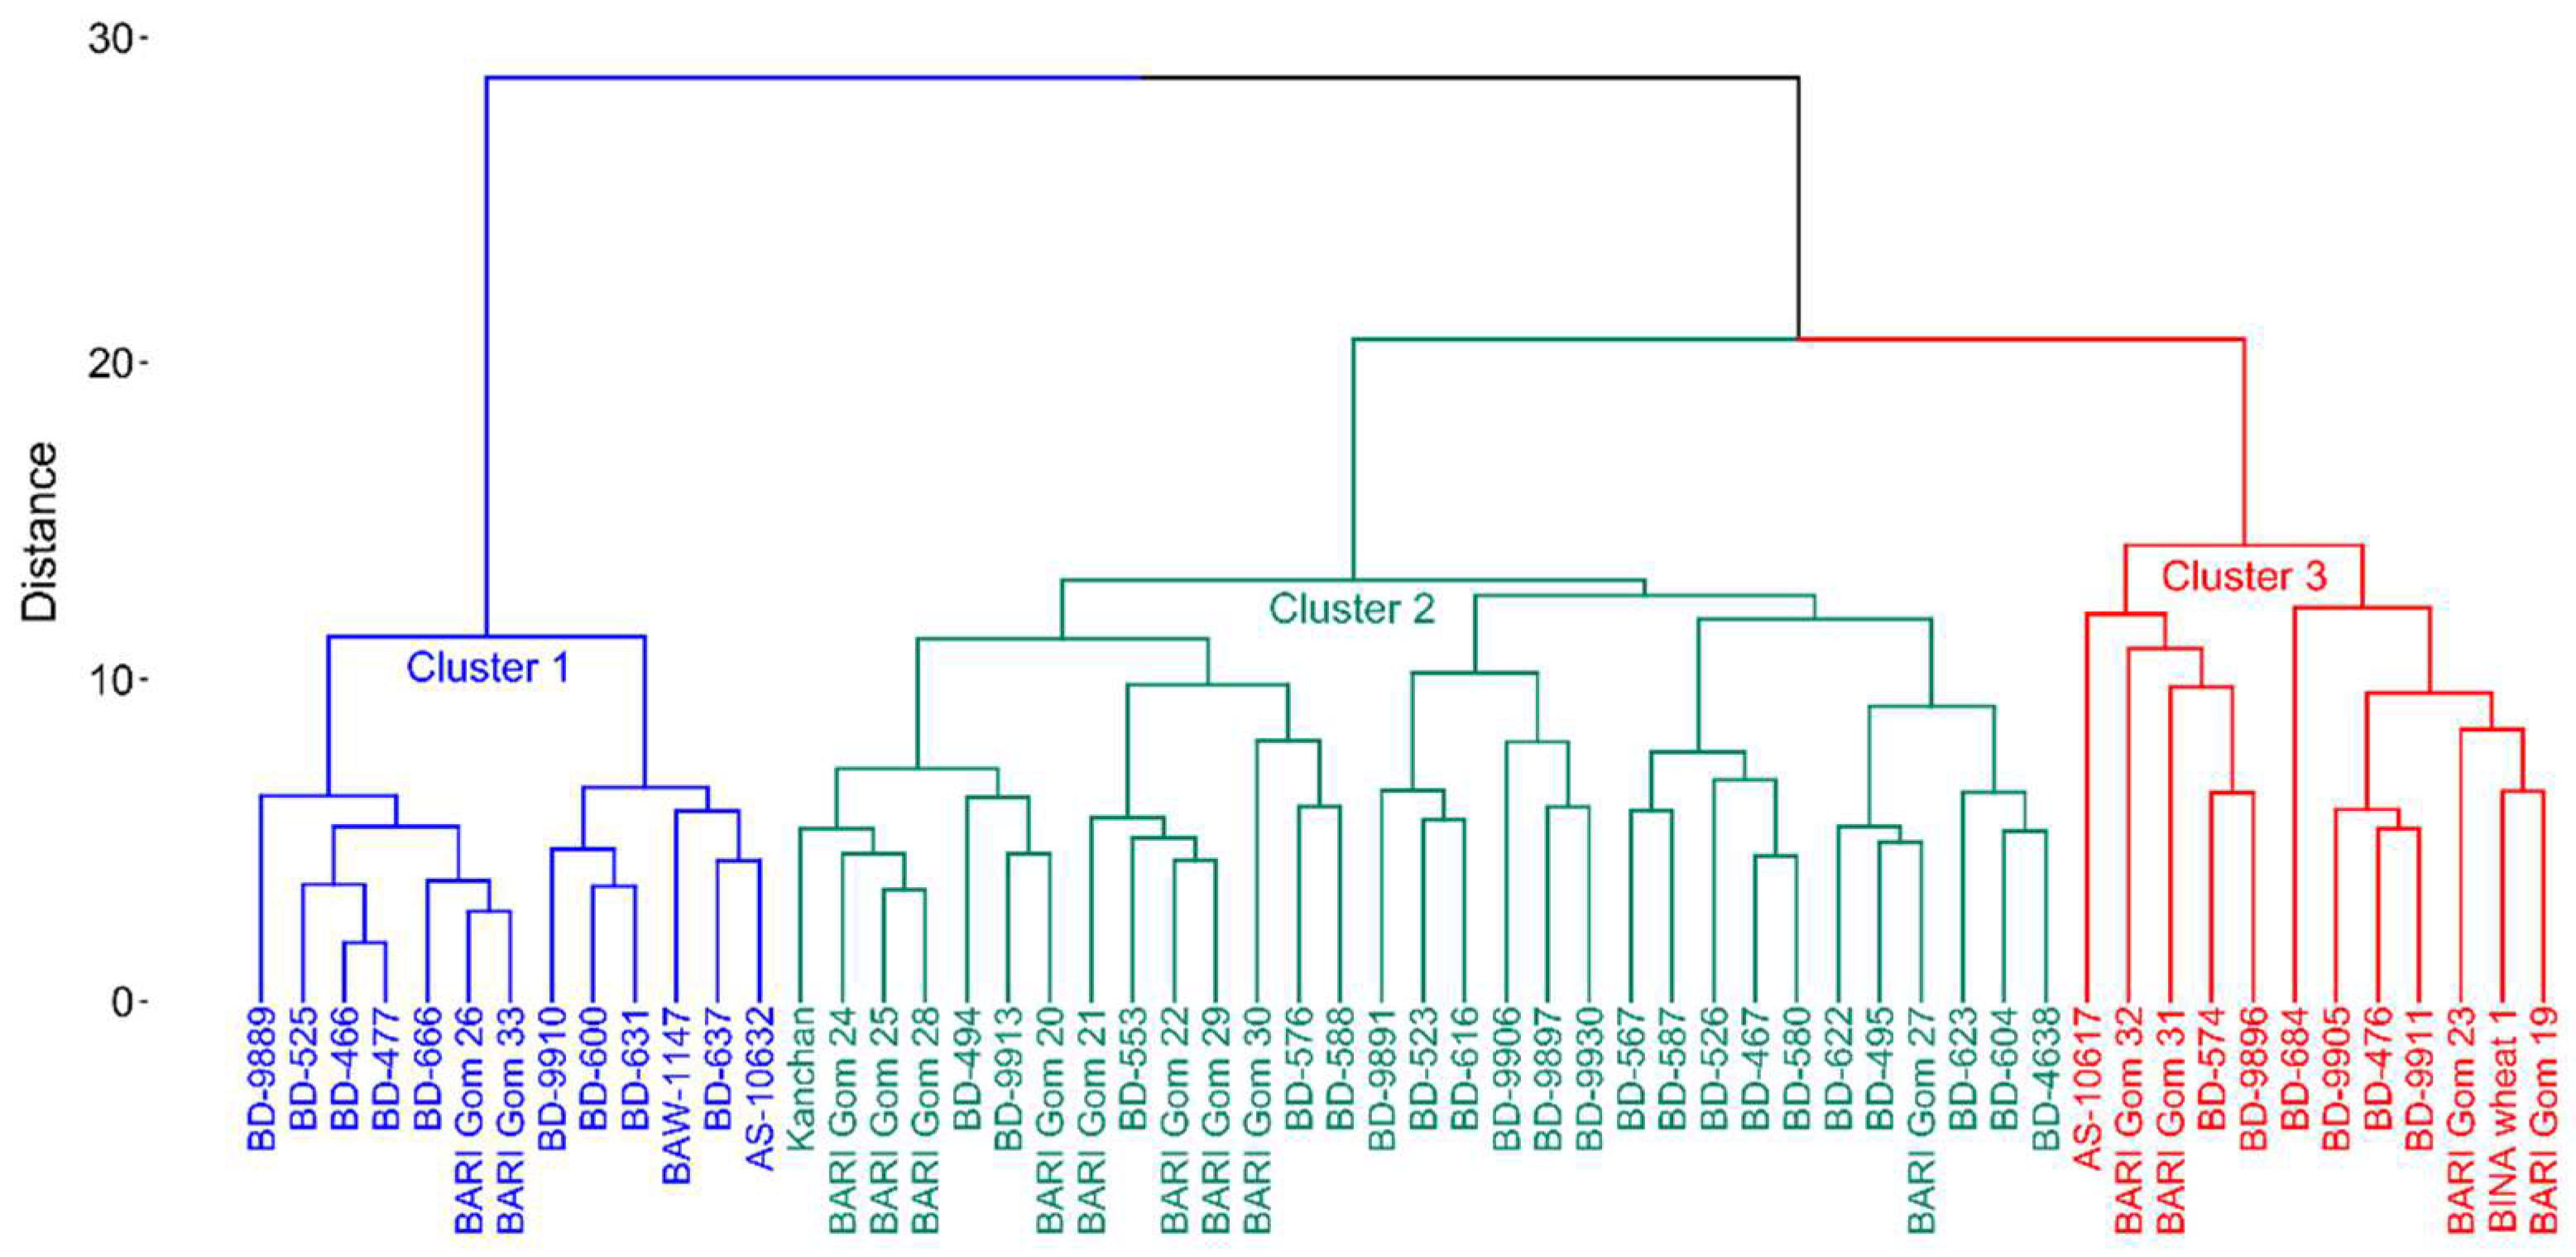
3.3. Hierarchical Cluster Analysis of Wheat Genotypes
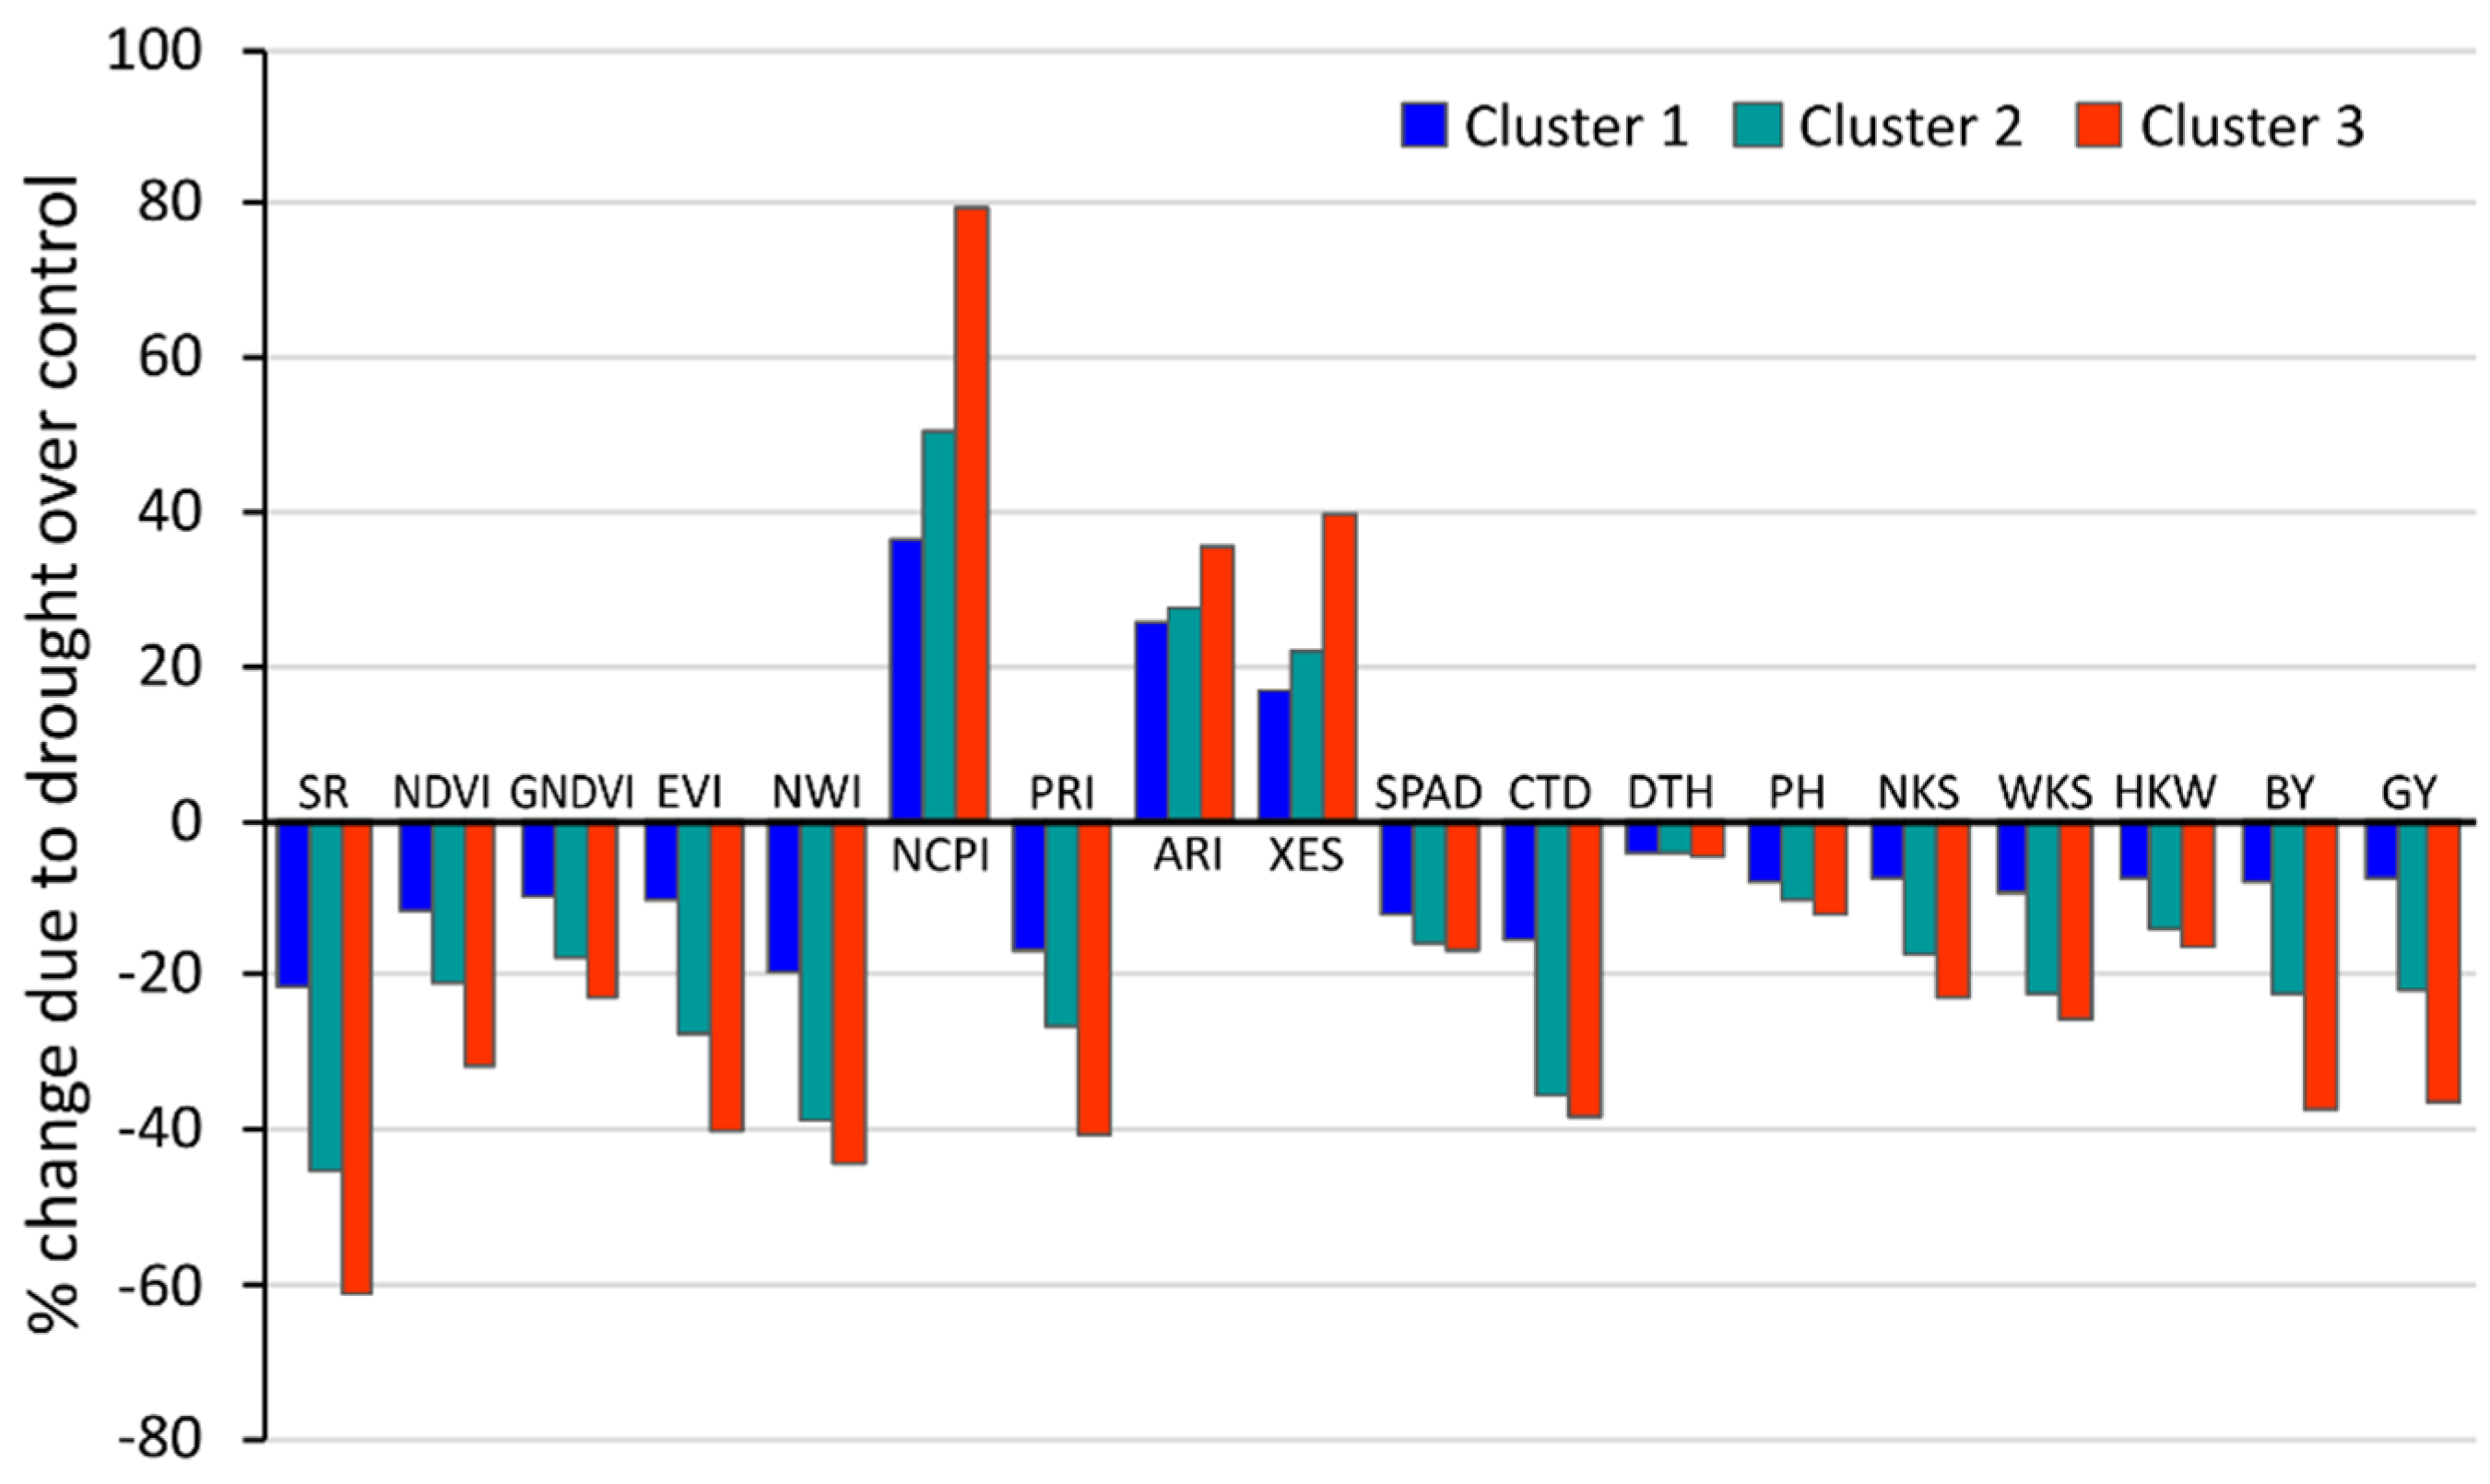
3.4. Cluster-Based Changes in Phenotypic Traits under Drought
3.5. Genetic Diversity Estimates of SSR Markers
3.6. Drought Tolerance Pattern and Diversity of SSR Markers
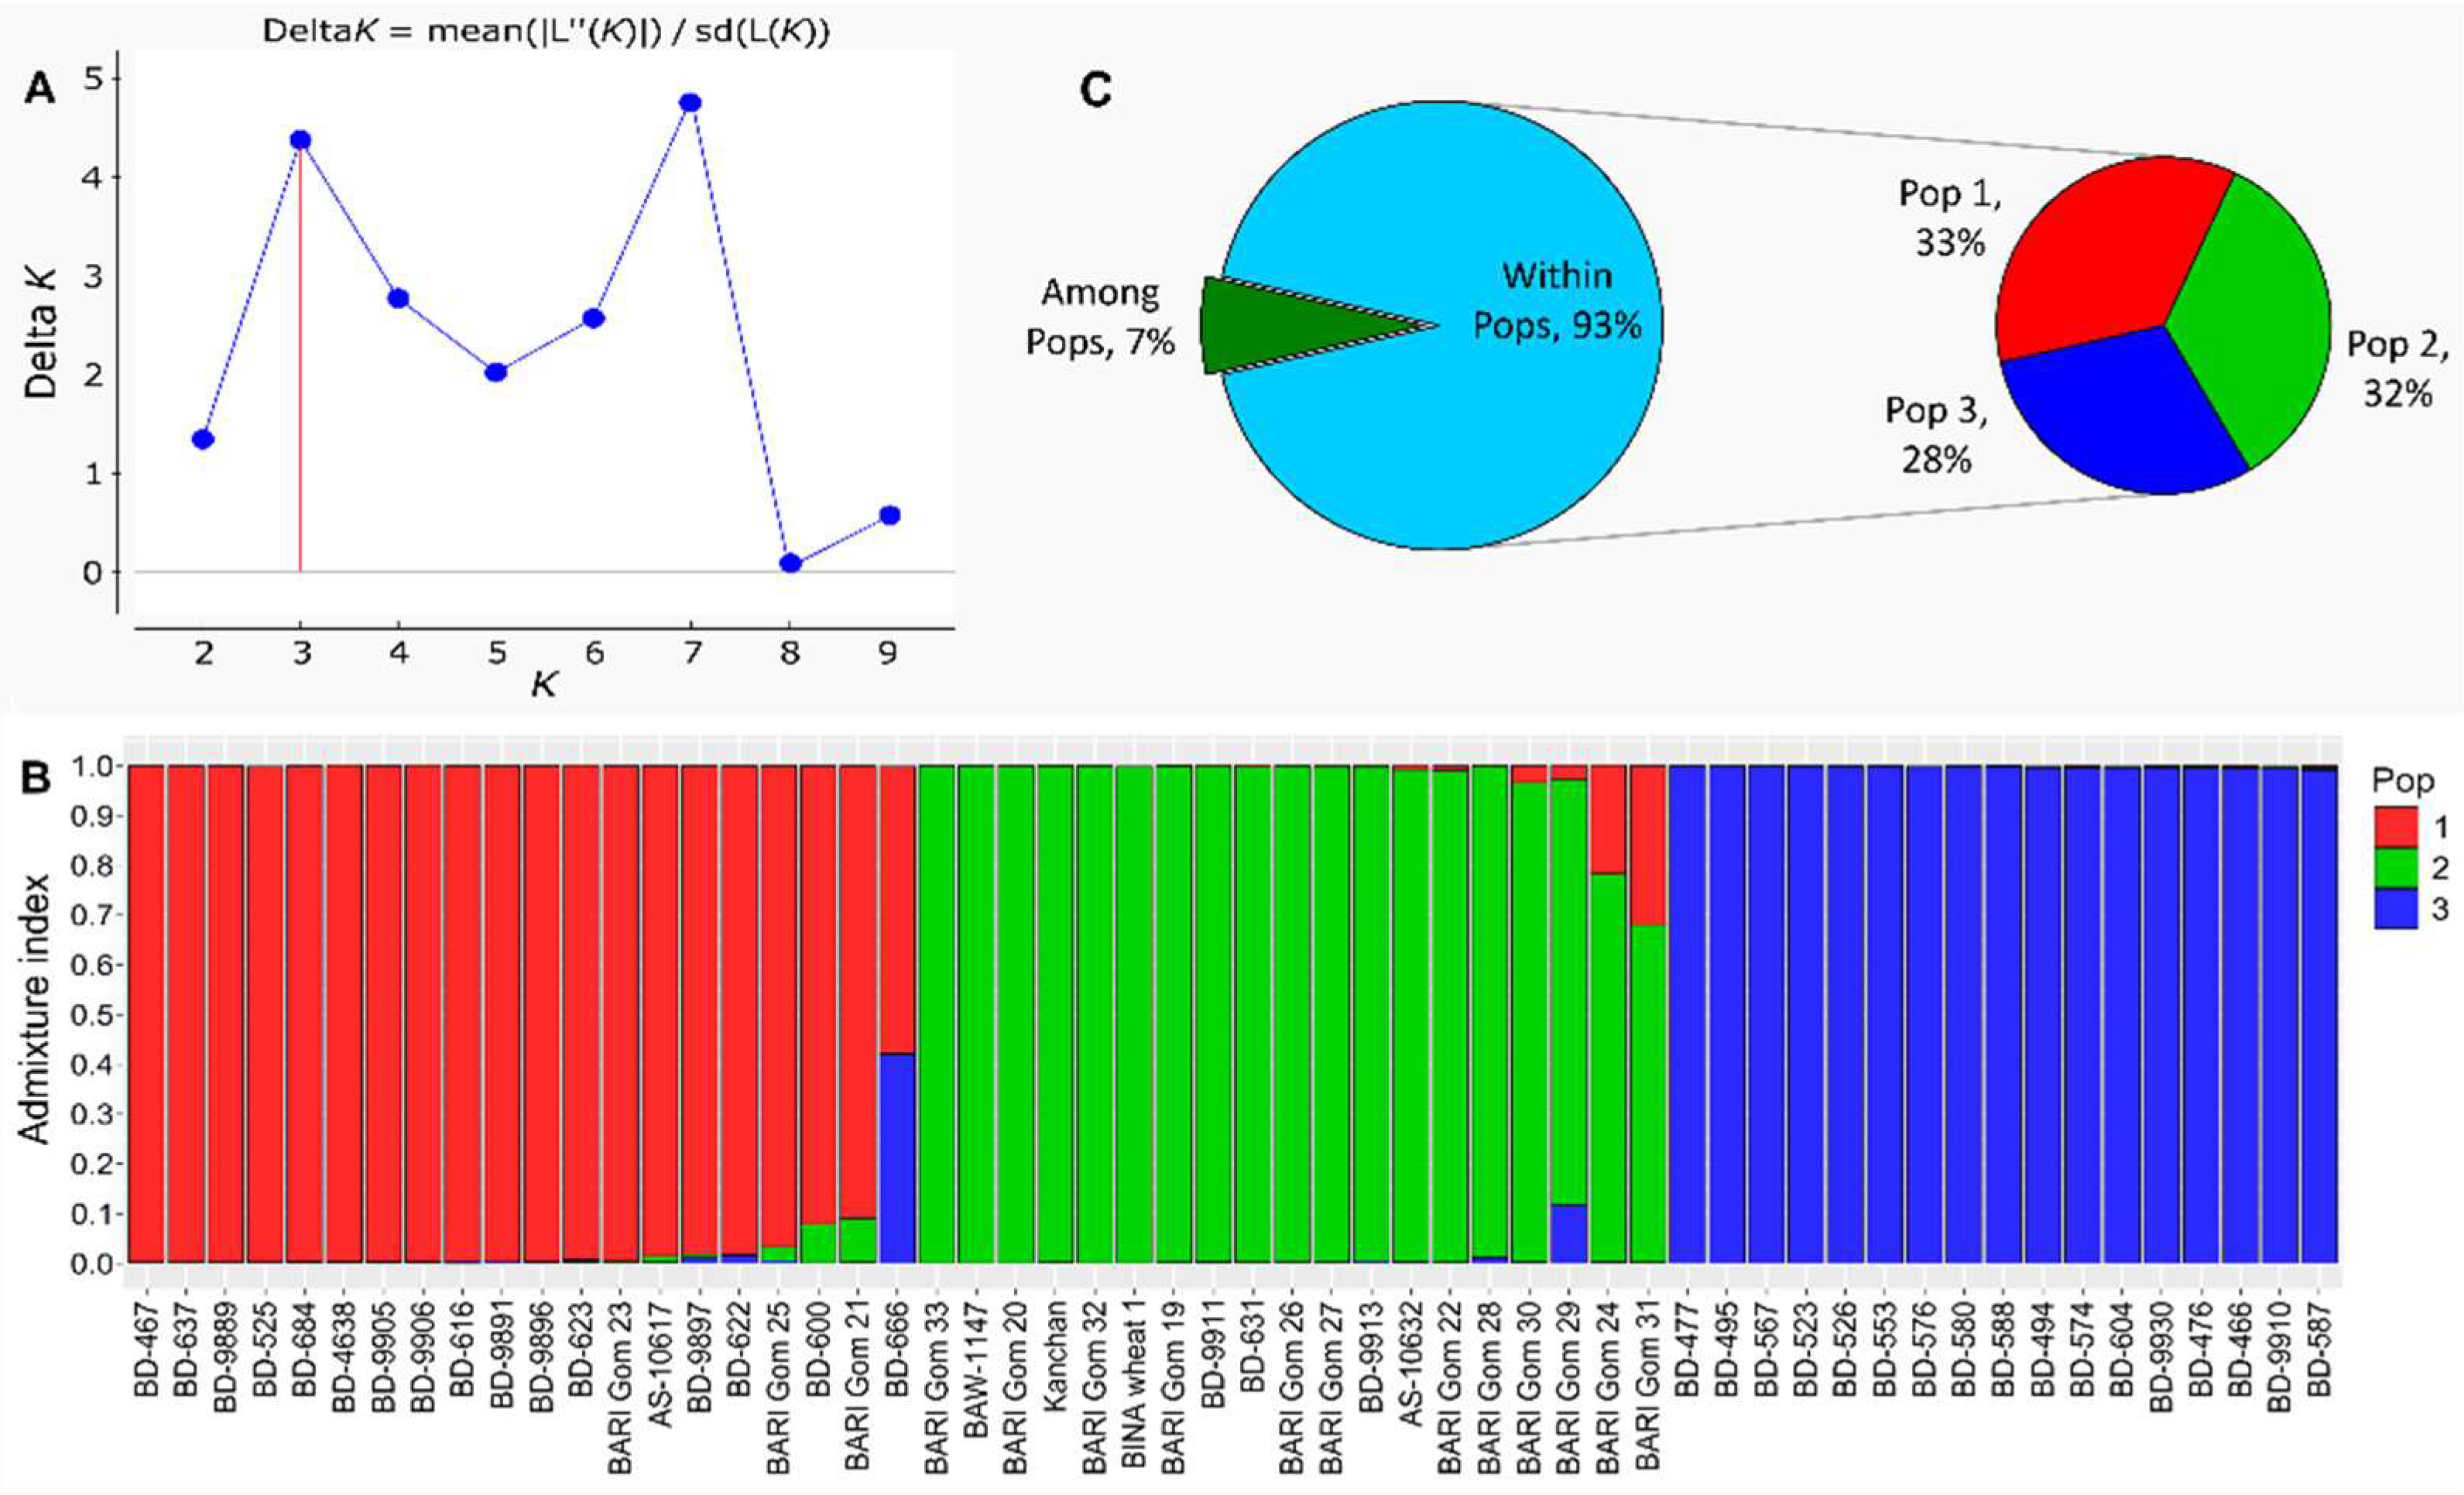
3.7. Population (Pop) Structure and Diversity of SSR Markers
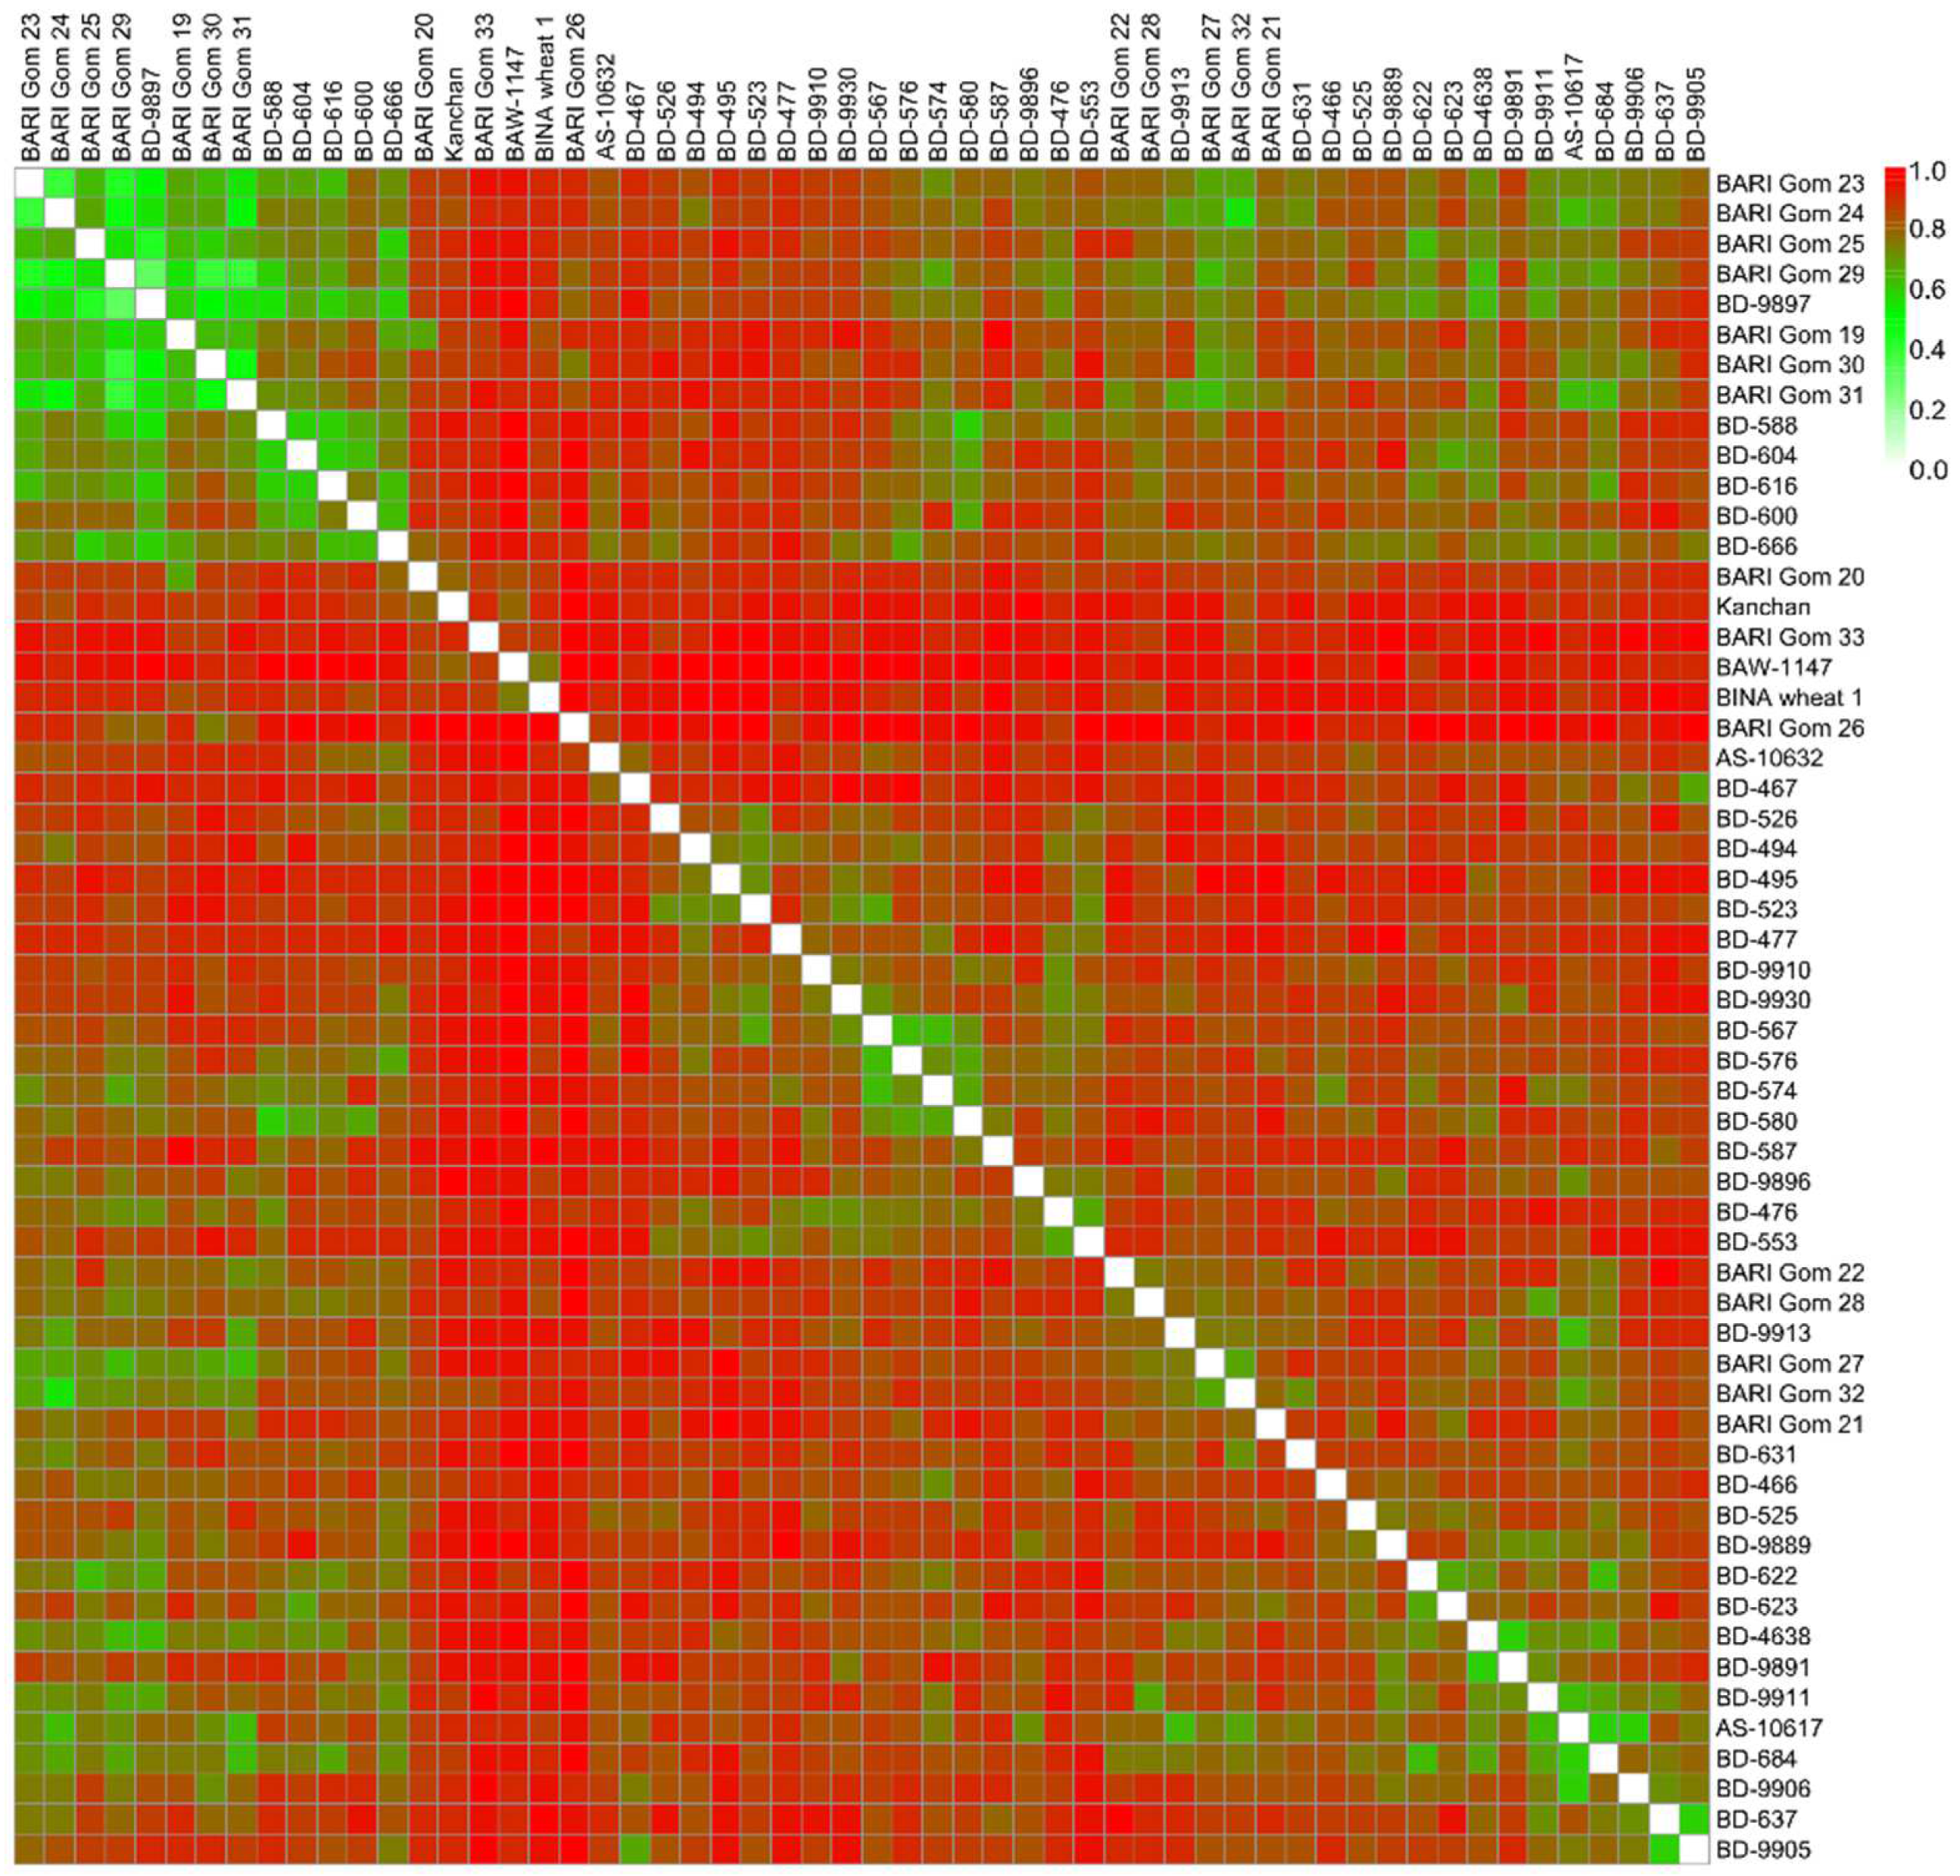
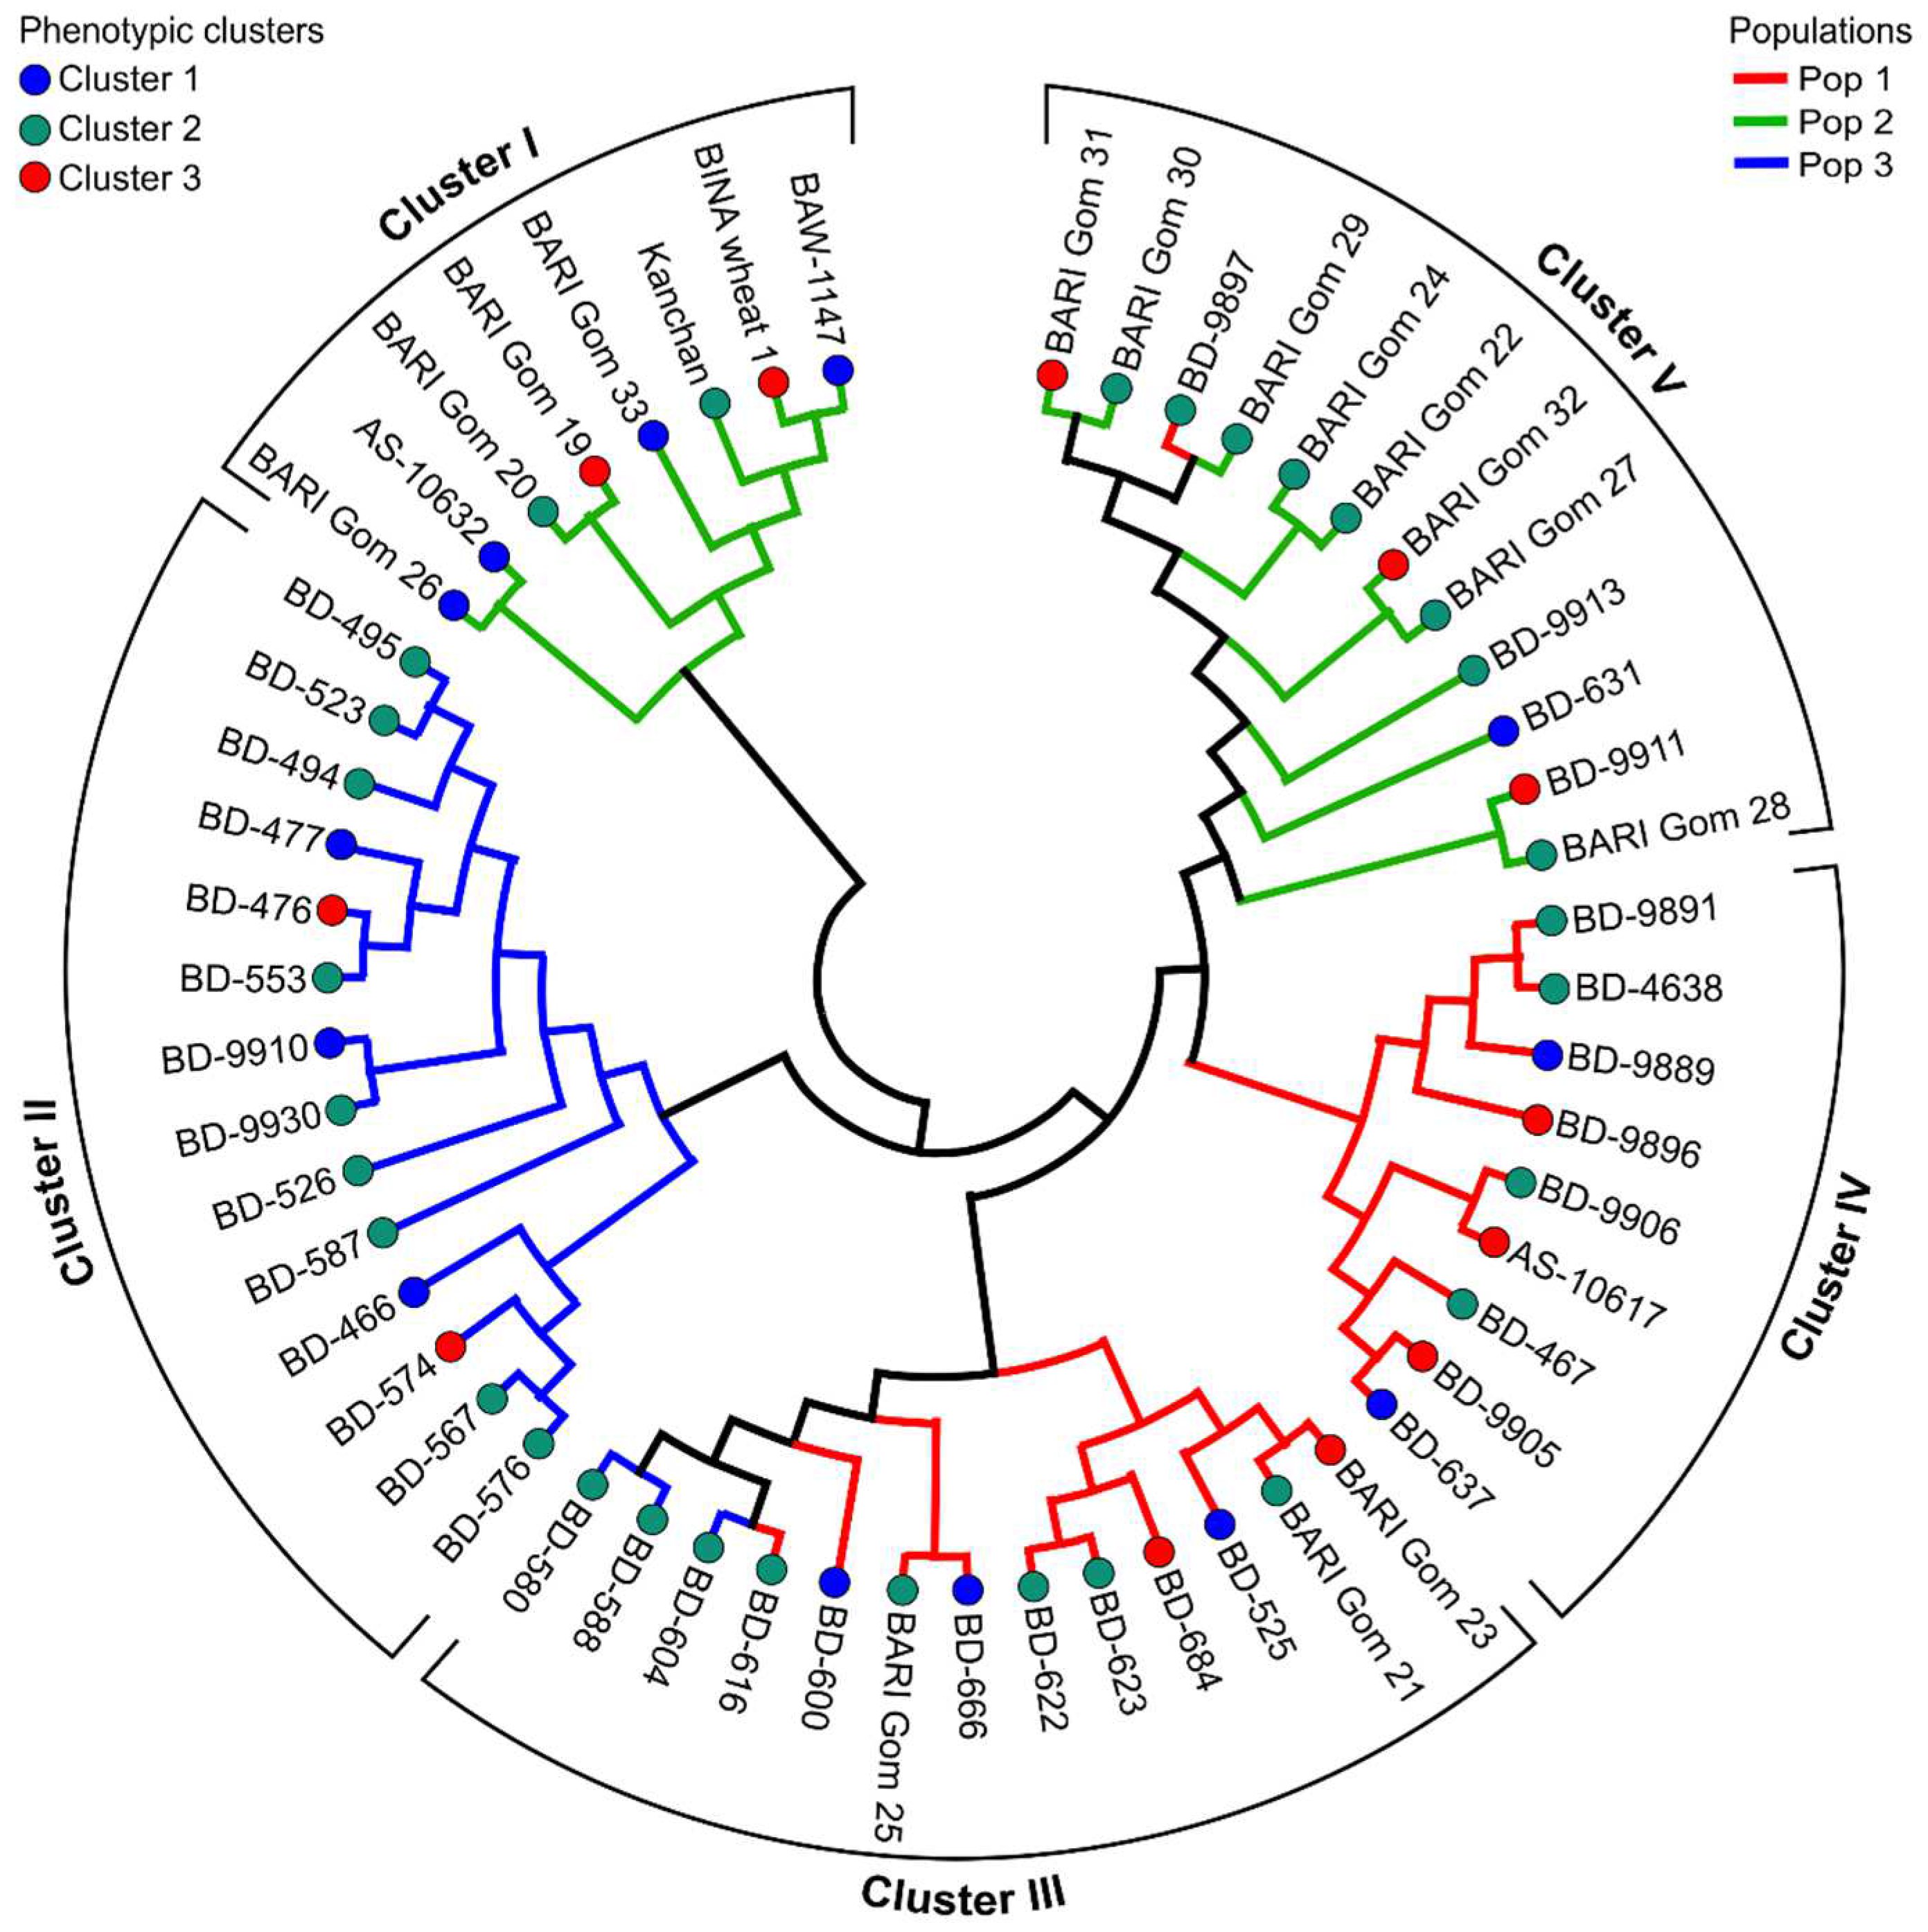
3.8. Cluster Analysis of Marker-Based Allelic Data
3.9. Co-Linearity between SSR-Based Clusters and Model-Based Populations
4. Discussion
5. Conclusions
Supplementary Materials
Author Contributions
Funding
Institutional Review Board Statement
Informed Consent Statement
Data Availability Statement
Acknowledgments
Conflicts of Interest
References
- Iqbal, M.S.; Singh, A.K.; Ansari, M.I. Effect of drought stress on crop production. In New Frontiers in Stress Management for Durable Agriculture; Springer: Berlin/Heidelberg, Germany, 2020; pp. 35–47. [Google Scholar] [CrossRef]
- Cook, B.I.; Ault, T.R.; Smerdon, J.E. Unprecedented 21st century drought risk in the American Southwest and Central Plains. Sci. Adv. 2015, 1, e1400082. [Google Scholar] [CrossRef]
- Schwalm, C.R.; Anderegg, W.R.L.; Michalak, A.M.; Fisher, J.B.; Biondi, F.; Koch, G.; Litvak, M.; Ogle, K.; Shaw, J.D.; Wolf, A.; et al. Global patterns of drought recovery. Nature 2017, 548, 202–205. [Google Scholar] [CrossRef]
- El-Hendawy, S.; Al-Suhaibani, N.; Salem, A.E.-A.; Rehman, S.U.; Schmidhalter, U. Spectral reflectance indices as a rapid and nondestructive phenotyping tool for estimating different morphophysiological traits of contrasting spring wheat germplasms under arid conditions. Turk. J. Agric. For. 2015, 39, 572–587. [Google Scholar] [CrossRef]
- Hannan, A.; Hoque, M.N.; Hassan, L.; Robin, A.H.K. Drought affected wheat production in Bangladesh and breeding strategies for drought tolerance. In Current Trends in Wheat Research; Ansari, M.-U.-R., Ed.; IntechOpen: London, UK, 2021. [Google Scholar] [CrossRef]
- Bapela, T.; Shimelis, H.; Tsilo, T.J.; Mathew, I. Genetic Improvement of Wheat for Drought Tolerance: Progress, Challenges and Opportunities. Plants 2022, 11, 1331. [Google Scholar] [CrossRef] [PubMed]
- Belete, Y.; Shimelis, H.; Laing, M.; Mathew, I. Genetic diversity and population structure of bread wheat genotypes determined via phenotypic and SSR marker analyses under drought-stress conditions. J. Crop Improv. 2021, 35, 303–325. [Google Scholar] [CrossRef]
- Perrino, E.V.; Wagensommer, R.P.; Medagli, P. The genus Aegilops L. (Poaceae) in Italy: Taxonomy, geographical distribution, ecology, vulnerability and conservation. Syst. Biodivers. 2014, 12, 331–349. [Google Scholar] [CrossRef]
- Dodig, D.; Zorić, M.; Kobiljski, B.; Šurlan-Momirović, G.; Quarrie, S.A. Assessing drought tolerance and regional patterns of genetic diversity among spring and winter bread wheat using simple sequence repeats and phenotypic data. Crop Pasture Sci. 2010, 61, 812–824. [Google Scholar] [CrossRef]
- Arora, A.; Kundu, S.; Dilbaghi, N.; Sharma, I.; Tiwari, R. Population structure and genetic diversity among Indian wheat varieties using microsatellite (SSR) markers. Aust. J. Crop Sci. 2014, 8, 1281–1289. [Google Scholar]
- El-Rawy, M.A.; Hassan, M.I. Assessment of Genetic Diversity in Durum and Bread Wheat Genotypes Based on Drought Tolerance and SSR Markers. Plant Breed. Biotechnol. 2021, 9, 89–103. [Google Scholar] [CrossRef]
- Gizaw, S.A.; Garland-Campbell, K.; Carter, A.H. Evaluation of agronomic traits and spectral reflectance in Pacific Northwest winter wheat under rain-fed and irrigated conditions. Field Crops Res. 2016, 196, 168–179. [Google Scholar] [CrossRef]
- Elsayed, S.; Rischbeck, P.; Schmidhalter, U. Comparing the performance of active and passive reflectance sensors to assess the normalized relative canopy temperature and grain yield of drought-stressed barley cultivars. Field Crops Res. 2015, 177, 148–160. [Google Scholar] [CrossRef]
- Fufa, H.; Baenziger, P.; Beecher, B.; Dweikat, I.; Graybosch, R.; Eskridge, K. Comparison of phenotypic and molecular marker-based classifications of hard red winter wheat cultivars. Euphytica 2005, 145, 133–146. [Google Scholar] [CrossRef]
- Mulualem, T.; Mekbib, F.; Shimelis, H.; Gebre, E.; Amelework, B. Genetic diversity of yam (Dioscorea spp.) landrace collections from Ethiopia using simple sequence repeat markers. Aust. J. Crop Sci. 2018, 12, 1222–1230. [Google Scholar] [CrossRef]
- Salem, K.F.M.; Röder, M.S.; Börner, A. Assessing genetic diversity of Egyptian hexaploid wheat (Triticum aestivum L.) using microsatellite markers. Genet. Resour. Crop Evol. 2015, 62, 377–385. [Google Scholar] [CrossRef]
- Prasad, B.; Babar, M.; Xu, X.; Bai, G.; Klatt, A.R. Genetic diversity in the U.S. hard red winter wheat cultivars as revealed by microsatellite markers. Crop Pasture Sci. 2009, 60, 16–24. [Google Scholar] [CrossRef]
- Verma, H.; Borah, J.L.; Sarma, R.N. Variability Assessment for Root and Drought Tolerance Traits and Genetic Diversity Analysis of Rice Germplasm using SSR Markers. Sci. Rep. 2019, 9, 16513. [Google Scholar] [CrossRef]
- Ateş Sönmezoğlu, Ö.; Terzi, B. Characterization of some bread wheat genotypes using molecular markers for drought tolerance. Physiol. Mol. Biol. Plants 2018, 24, 159–166. [Google Scholar] [CrossRef] [PubMed]
- Vieira, M.L.; Santini, L.; Diniz, A.L.; Munhoz Cde, F. Microsatellite markers: What they mean and why they are so useful. Genet. Mol. Biol. 2016, 39, 312–328. [Google Scholar] [CrossRef]
- Poudel, M.R.; Ghimire, S.; Pandey, M.; Dhakal, K.; Thapa, D.; Khadka, D. Assessing genetic diversity for drought and heat stress tolerance of Nepalese wheat genotypes by SSR markers. EurAsian J. BioSci. 2019, 13, 941–948. [Google Scholar]
- Semahegn, Y.; Shimelis, H.; Laing, M.; Mathew, I. Evaluation of bread wheat (Triticum aestivum L.) genotypes for yield and related traits under drought stress conditions. Acta Agric. Scand. Sect. B Soil Plant Sci. 2020, 70, 474–484. [Google Scholar] [CrossRef]
- Slim, A.; Piarulli, L.; Chennaoui Kourda, H.; Rouaissi, M.; Robbana, C.; Chaabane, R.; Pignone, D.; Montemurro, C.; Mangini, G. Genetic Structure Analysis of a Collection of Tunisian Durum Wheat Germplasm. Int. J. Mol. Sci. 2019, 20, 3362. [Google Scholar] [CrossRef] [PubMed]
- Yang, X.; Tan, B.; Liu, H.; Zhu, W.; Xu, L.; Wang, Y.; Fan, X.; Sha, L.; Zhang, H.; Zeng, J.; et al. Genetic Diversity and Population Structure of Asian and European Common Wheat Accessions Based on Genotyping-By-Sequencing. Front. Genet. 2020, 11, 580782. [Google Scholar] [CrossRef] [PubMed]
- Haque, M.S.; Saha, N.R.; Islam, M.T.; Islam, M.M.; Kwon, S.-J.; Roy, S.K.; Woo, S.-H. Screening for drought tolerance in wheat genotypes by morphological and SSR markers. J. Crop Sci. Biotechnol. 2021, 24, 27–39. [Google Scholar] [CrossRef]
- Moraga, F.; Alcaíno, M.; Matus, I.; Castillo, D.; del Pozo, A. Leaf and Canopy Traits Associated with Stay-Green Expression Are Closely Related to Yield Components of Wheat Genotypes with Contrasting Tolerance to Water Stress. Plants 2022, 11, 292. [Google Scholar] [CrossRef] [PubMed]
- Pandey, A.; Khobra, R.; Mamrutha, H.M.; Wadhwa, Z.; Krishnappa, G.; Singh, G.; Singh, G.P. Elucidating the Drought Responsiveness in Wheat Genotypes. Sustainability 2022, 14, 3957. [Google Scholar] [CrossRef]
- Mohi-Ud-Din, M.; Hossain, M.A.; Rohman, M.M.; Uddin, M.N.; Haque, M.S.; Ahmed, J.U.; Hossain, A.; Hassan, M.M.; Mostofa, M.G. Multivariate analysis of morpho-physiological traits reveals differential drought tolerance potential of bread wheat genotypes at the seedling stage. Plants 2021, 10, 879. [Google Scholar] [CrossRef]
- Fischer, R.; Rees, D.; Sayre, K.; Lu, Z.M.; Condon, A.; Saavedra, A.L. Wheat yield progress associated with higher stomatal conductance and photosynthetic rate, and cooler canopies. Crop Sci. 1998, 38, 1467–1475. [Google Scholar] [CrossRef]
- Bates, D.; Mächler, M.; Bolker, B.; Walker, S. Fitting linear mixed-effects models using lme4. J. Stat. Softw. 2015, 67, 48. [Google Scholar] [CrossRef]
- Mendiburu, F. Agricolae: R Package Version 1.3–3, Statistical Procedures for Agricultural Research; R Foundation for Statistical Computing: Vienna, Austria, 2020. [Google Scholar]
- Wickham, H. ggplot2: Elegant Graphics for Data Analysis; Springer: New York, NY, USA, 2016. [Google Scholar]
- Julkowska, M.M.; Saade, S.; Agarwal, G.; Gao, G.; Pailles, Y.; Morton, M.; Awlia, M.; Tester, M. MVApp—multivariate analysis application for streamlined data analysis and curation. Plant Physiol. 2019, 180, 1261–1276. [Google Scholar] [CrossRef]
- Galili, T. dendextend: An R package for visualizing, adjusting and comparing trees of hierarchical clustering. Bioinformatics 2015, 31, 3718–3720. [Google Scholar] [CrossRef]
- Ferrari, C.d.S.; Valente, L.L.; Brod, F.C.A.; Tagliari, C.; Sant’Anna, E.S.; Arisi, A.C.M. Evaluation of polymerase chain reaction and DNA isolation protocols for detection of genetically modified soybean. Int. J. Food Sci. Technol. 2007, 42, 1249–1255. [Google Scholar] [CrossRef]
- Ciucă, M.; Petcu, E. SSR markers associated with membrane stability in wheat (Triticum aestivum L.). Rom. Agric. Res. 2009, 26, 21–24. [Google Scholar]
- Huda, M.; Hasan, M.; Abdullah, H.M.; Sarker, U. Spatial distribution and genetic diversity of wild date palm (Phoenix sylvestris) growing in coastal Bangladesh. Tree Genet. Genomes 2019, 15, 3. [Google Scholar] [CrossRef]
- Liu, K.; Muse, S.V. PowerMarker: An integrated analysis environment for genetic marker analysis. Bioinformatics 2005, 21, 2128–2129. [Google Scholar] [CrossRef]
- PEAKALL, R.; SMOUSE, P.E. genalex 6: Genetic analysis in Excel. Population genetic software for teaching and research. Mol. Ecol. Notes 2006, 6, 288–295. [Google Scholar] [CrossRef]
- Pritchard, J.K.; Stephens, M.; Donnelly, P. Inference of Population Structure Using Multilocus Genotype Data. Genetics 2000, 155, 945–959. [Google Scholar] [CrossRef]
- Evanno, G.; Regnaut, S.; Goudet, J. Detecting the number of clusters of individuals using the software STRUCTURE: A simulation study. Mol. Ecol. 2005, 14, 2611–2620. [Google Scholar] [CrossRef]
- Earl, D.A.; VonHoldt, B.M. Structure Harvester: A website and program for visualizing STRUCTURE output and implementing the Evanno method. Conserv. Genet. Resour. 2012, 4, 359–361. [Google Scholar] [CrossRef]
- Criscuolo, N.G.; Angelini, C. StructuRly: A novel shiny app to produce comprehensive, detailed and interactive plots for population genetic analysis. PLoS ONE 2020, 15, e0229330. [Google Scholar] [CrossRef]
- Nei, M.; Tajima, F.; Tateno, Y. Accuracy of estimated phylogenetic trees from molecular data. J. Mol. Evol. 1983, 19, 153–170. [Google Scholar] [CrossRef]
- Kolde, R. pheatmap: Pretty Heatmaps. R package Version 1.0.12. rdrr.io 2019. Available online: https://rdrr.io/cran/pheatmap/ (accessed on 25 November 2021).
- Kumar, S.; Stecher, G.; Li, M.; Knyaz, C.; Tamura, K. MEGA X: Molecular evolutionary genetics analysis across computing platforms. Mol. Biol. Evol. 2018, 35, 1547. [Google Scholar] [CrossRef]
- Oliveros, J.C. VENNY. An Interactive Tool for Comparing Lists with Venn Diagrams. 2007. Available online: http://bioinfogp.cnb.csic.es/tools/venny/index.html (accessed on 27 November 2021).
- Cabrera-Bosquet, L.; Crossa, J.; von Zitzewitz, J.; Serret, M.D.; Luis Araus, J. High-throughput phenotyping and genomic selection: The frontiers of crop breeding converge F. J. Integr. Plant Biol. 2012, 54, 312–320. [Google Scholar] [CrossRef]
- Gutierrez, M.; Reynolds, M.P.; Klatt, A.R. Association of water spectral indices with plant and soil water relations in contrasting wheat genotypes. J. Exp. Bot. 2010, 61, 3291–3303. [Google Scholar] [CrossRef]
- El-Hendawy, S.E.; Hassan, W.M.; Al-Suhaibani, N.A.; Schmidhalter, U. Spectral assessment of drought tolerance indices and grain yield in advanced spring wheat lines grown under full and limited water irrigation. Agric. Water Manag. 2017, 182, 1–12. [Google Scholar] [CrossRef]
- Prasad, B.; Carver, B.F.; Stone, M.L.; Babar, M.A.; Raun, W.R.; Klatt, A.R. Potential Use of Spectral Reflectance Indices as a Selection Tool for Grain Yield in Winter Wheat under Great Plains Conditions. Crop Sci. 2007, 47, 1426–1440. [Google Scholar] [CrossRef]
- Mwadzingeni, L.; Shimelis, H.; Dube, E.; Laing, M.D.; Tsilo, T.J. Breeding wheat for drought tolerance: Progress and technologies. J. Integr. Agric. 2016, 15, 935–943. [Google Scholar] [CrossRef]
- Pour-Aboughadareh, A.; Mohammadi, R.; Etminan, A.; Shooshtari, L.; Maleki-Tabrizi, N.; Poczai, P. Effects of Drought Stress on Some Agronomic and Morpho-Physiological Traits in Durum Wheat Genotypes. Sustainability 2020, 12, 5610. [Google Scholar] [CrossRef]
- Lopes, M.S.; Reynolds, M.P. Stay-green in spring wheat can be determined by spectral reflectance measurements (normalized difference vegetation index) independently from phenology. J. Exp. Bot. 2012, 63, 3789–3798. [Google Scholar] [CrossRef]
- Weber, V.S.; Araus, J.L.; Cairns, J.E.; Sanchez, C.; Melchinger, A.E.; Orsini, E. Prediction of grain yield using reflectance spectra of canopy and leaves in maize plants grown under different water regimes. Field Crops Res. 2012, 128, 82–90. [Google Scholar] [CrossRef]
- Aparicio, N.; Villegas, D.; Casadesus, J.; Araus, J.L.; Royo, C. Spectral vegetation indices as nondestructive tools for determining durum wheat yield. Agron. J. 2000, 92, 83–91. [Google Scholar] [CrossRef]
- Grzesiak, S.; Hordyńska, N.; Szczyrek, P.; Grzesiak, M.T.; Noga, A.; Szechyńska-Hebda, M. Variation among wheat (Triticum easativum L.) genotypes in response to the drought stress: I–selection approaches. J. Plant Interact. 2019, 14, 30–44. [Google Scholar] [CrossRef]
- Islam, M.A.; De, R.K.; Hossain, M.A.; Haque, M.S.; Uddin, M.N.; Fakir, M.S.A.; Kader, M.A.; Dessoky, E.S.; Attia, A.O.; El-Hallous, E.I.; et al. Evaluation of the Tolerance Ability of Wheat Genotypes to Drought Stress: Dissection through Culm-Reserves Contribution and Grain Filling Physiology. Agronomy 2021, 11, 1252. [Google Scholar] [CrossRef]
- Henkrar, F.; El-Haddoury, J.; Ouabbou, H.; Nsarellah, N.; Iraqi, D.; Bendaou, N.; Udupa, S.M. Genetic diversity reduction in improved durum wheat cultivars of Morocco as revealed by microsatellite markers. Sci. Agric. 2016, 73, 134–141. [Google Scholar] [CrossRef]
- Nagy, S.; Poczai, P.; Cernák, I.; Gorji, A.M.; Hegedűs, G.; Taller, J. PICcalc: An online program to calculate polymorphic information content for molecular genetic studies. Biochem. Genet. 2012, 50, 670–672. [Google Scholar] [CrossRef] [PubMed]
- Ramadugu, C.; Keremane, M.L.; Hu, X.; Karp, D.; Federici, C.T.; Kahn, T.; Roose, M.L.; Lee, R.F. Genetic analysis of citron (Citrus medica L.) using simple sequence repeats and single nucleotide polymorphisms. Sci. Hortic. 2015, 195, 124–137. [Google Scholar] [CrossRef]
- Honore, T.; Ngonkeu, E.; Francois, P.; Aletta, E.; Lendzemo, V.; Hess, L.; Moulin, L.; Klonowska, A.; Diouf, D.; Botes, W.; et al. Genetic diversity of Cameroonian bread wheat (Triticum aestivum L.) cultivars revealed by microsatellite markers. Afr. J. Biotechnol. 2017, 16, 1832–1839. [Google Scholar] [CrossRef][Green Version]
- Jaiswal, S.; Sheoran, S.; Arora, V.; Angadi, U.B.; Iquebal, M.A.; Raghav, N.; Aneja, B.; Kumar, D.; Singh, R.; Sharma, P. Putative microsatellite DNA marker-based wheat genomic resource for varietal improvement and management. Front. Plant Sci. 2017, 8, 2009. [Google Scholar] [CrossRef]
- El-Rawy, M.A. Assessment of genetic diversity for some Egyptian wheat varieties based on morphological characters and SSR markers. Sci. J. Agric. Sci. 2020, 2, 144–160. [Google Scholar] [CrossRef]
- Hartl, D.L. A Primer of Population Genetics; Sinauer Associates Incorporated: Sunderland, MA, USA, 2000. [Google Scholar]
- Wright, S. Evolution and the Genetics of Populations Volume 4. Variability within and among Natural Populations; University of Chicago Press: Chicago, IL, USA, 1978; p. 590. [Google Scholar] [CrossRef]
- Anupam, A.; Imam, J.; Quatadah, S.M.; Siddaiah, A.; Das, S.P.; Variar, M.; Mandal, N.P. Genetic diversity analysis of rice germplasm in Tripura State of Northeast India using drought and blast linked markers. Rice Sci. 2017, 24, 10–20. [Google Scholar] [CrossRef]
- Singh, N.; Choudhury, D.R.; Tiwari, G.; Singh, A.K.; Kumar, S.; Srinivasan, K.; Tyagi, R.K.; Sharma, A.D.; Singh, N.K.; Singh, R. Genetic diversity trend in Indian rice varieties: An analysis using SSR markers. BMC Genet. 2016, 17, 127. [Google Scholar] [CrossRef] [PubMed]
- Lowe, I.; Jankuloski, L.; Chao, S.; Chen, X.; See, D.; Dubcovsky, J. Mapping and validation of QTL which confer partial resistance to broadly virulent post-2000 North American races of stripe rust in hexaploidy wheat. Theor. Appl. Genet. 2011, 123, 143–157. [Google Scholar] [CrossRef] [PubMed][Green Version]
- Olson, E.L.; Rouse, M.N.; Pumphrey, M.O.; Bowden, R.L.; Gill, B.S.; Poland, J.A. Introgression of stem rust resistance genes SrTA10187 and SrTA10171 from Aegilops tauschii to wheat. Theor. Appl. Genet. 2013, 126, 2477–2484. [Google Scholar] [CrossRef] [PubMed]
- Somers, D.J.; Isaac, P. SSRs from the Wheat Microsatellite Consortium. 2004. Available online: https://wheat.pw.usda.gov/ggpages/SSR/WMC/ (accessed on 12 September 2021).
- Somers, D.J.; Isaac, P.; Edwards, K. A high-density microsatellite consensus map for bread wheat (Triticum aestivum L.). Theor. Appl. Genet. 2004, 109, 1105–1114. [Google Scholar] [CrossRef] [PubMed]
- Stephenson, P.; Bryan, G.J.; Kirby, J.; Collins, A.J.; Devos, K.M.; Busso, C.S.; Gale, M.D. Fifty new microsatellite loci for the wheat genetic map. Theor. Appl. Genet. 1998, 97, 946–949. [Google Scholar] [CrossRef]

| Vegetation Index | Formula a |
|---|---|
| Simple ratio (SR) | R800/R680 |
| Normalized difference vegetation index (NDVI) | (R800 − R680)/(R800 + R680) |
| Green-NDVI (GNDVI) | (R780 − R550)/(R780 + R550) |
| Enhanced vegetation index (EVI) | 2.5 × (RNIR − RRED)/(RNIR + 6 × RRED − 7.5 × RBLUE + 1) |
| Normalized water band index (NWI) | (R900 − R970)/(R900 + R970) |
| Normalized chlorophyll pigment ratio index (NCPI) | (R680 − R430)/(R680 + R430) |
| Photochemical reflectance index (PRI) | (R530 − R570)/(R530 + R570) |
| Anthocyanin reflectance index (ARI) | R800×(1/R550 − 1/R700) |
| Xanthophyll pigment epoxidation state (XES) | R531 |
| Marker (Location) | Major Allele Freq. | Allele Number | Allele Size (bp) | Shannon Index | Gene Diversity | PIC |
|---|---|---|---|---|---|---|
| wms136 (1A) | 0.286 | 22 | 100−300 | 1.634 | 0.885 | 0.879 |
| wmc177 (2A) | 0.125 | 24 | 115−295 | 1.598 | 0.936 | 0.932 |
| wms304 (2A) | 0.161 | 22 | 135−350 | 1.468 | 0.920 | 0.915 |
| wms369 (3A) | 0.286 | 20 | 180−350 | 1.354 | 0.872 | 0.863 |
| wms165 (4A) | 0.393 | 21 | 100−290 | 1.370 | 0.823 | 0.815 |
| wms186 (5A) | 0.732 | 8 | 85−260 | 0.468 | 0.450 | 0.434 |
| wms169 (6A) | 0.196 | 16 | 140−265 | 1.323 | 0.890 | 0.881 |
| psp3071 (6A) | 0.304 | 12 | 150−270 | 1.001 | 0.844 | 0.829 |
| barc108 (7A) | 0.464 | 21 | 100−260 | 1.237 | 0.768 | 0.760 |
| wmc9 (7A) | 0.357 | 21 | 150−300 | 1.363 | 0.846 | 0.839 |
| wms260 (7A) | 0.304 | 18 | 100−225 | 1.420 | 0.869 | 0.861 |
| Genome A | 0.328 | 18.6 | − | 1.294 | 0.828 | 0.819 |
| wms11 (1B) | 0.214 | 18 | 135−295 | 1.444 | 0.889 | 0.880 |
| wms257 (2B) | 0.125 | 19 | 155−285 | 1.674 | 0.920 | 0.914 |
| wms389 (3B) | 0.214 | 16 | 145−245 | 1.336 | 0.879 | 0.868 |
| wms149 (4B) | 0.268 | 22 | 100−300 | 1.431 | 0.893 | 0.887 |
| wms375 (4B) | 0.125 | 15 | 200−300 | 1.542 | 0.916 | 0.910 |
| wms118 (5B) | 0.679 | 14 | 100−240 | 0.832 | 0.530 | 0.521 |
| Genome B | 0.271 | 17.3 | − | 1.377 | 0.838 | 0.830 |
| wmc179 (1D) | 0.179 | 23 | 110−300 | 1.499 | 0.928 | 0.924 |
| wms337 (1D) | 0.250 | 22 | 120−300 | 1.434 | 0.895 | 0.888 |
| wms30 (2D) | 0.214 | 15 | 170−240 | 1.411 | 0.885 | 0.875 |
| wms484 (2D) | 0.161 | 15 | 110−250 | 1.534 | 0.911 | 0.905 |
| wms161 (3D) | 0.179 | 21 | 160−300 | 1.498 | 0.914 | 0.908 |
| wms292 (5D) | 0.268 | 24 | 115−285 | 1.521 | 0.895 | 0.889 |
| psp3200 (6D) | 0.696 | 15 | 110−460 | 0.627 | 0.508 | 0.500 |
| wms295 (7D) | 0.214 | 14 | 185−290 | 1.155 | 0.879 | 0.867 |
| Genome D | 0.270 | 18.6 | − | 1.335 | 0.852 | 0.845 |
| Mean | 0.296 | 18.3 | − | 1.327 | 0.838 | 0.830 |
| Category | Cluster 1 | Cluster 2 | Cluster 3 |
|---|---|---|---|
| Number of genotypes | 13 | 31 | 12 |
| Number of alleles | 264 | 529 | 218 |
| Mean alleles per loci | 10.6 | 21.2 | 8.7 |
| Mean alleles per genotype | 20.3 | 16.5 | 19.8 |
| Number of unique alleles | 123 | 215 | 92 |
| % unique alleles | 47 | 41 | 42 |
| Gene diversity | 0.879 | 0.849 | 0.807 |
| Source of Variation | df | Est. Variance * | % Variation |
|---|---|---|---|
| Among clusters | 2 | 0.580 | 5 |
| Within clusters | 53 | 10.306 | 95 |
| Total | 55 | 10.886 | 100 |
| F-statistics | Value | P (rand >= data) | |
| FST | 0.053 | 0.001 | |
| FIS | 1.000 | 0.001 | |
| FIT | 1.000 | 0.001 | |
| Nm | 4.010 |
| Category | Population | ||
|---|---|---|---|
| 1 | 2 | 3 | |
| Number of Genotypes | 20 | 19 | 17 |
| Number of alleles | 388 | 351 | 272 |
| Mean allelic richness | 6.88 | 6.43 | 6.54 |
| Number of unique alleles | 98 | 73 | 106 |
| % unique alleles | 25.3 | 20.8 | 39.0 |
| Gene diversity | 0.827 | 0.798 | 0.834 |
Publisher’s Note: MDPI stays neutral with regard to jurisdictional claims in published maps and institutional affiliations. |
© 2022 by the authors. Licensee MDPI, Basel, Switzerland. This article is an open access article distributed under the terms and conditions of the Creative Commons Attribution (CC BY) license (https://creativecommons.org/licenses/by/4.0/).
Share and Cite
Mohi-Ud-Din, M.; Hossain, M.A.; Rohman, M.M.; Uddin, M.N.; Haque, M.S.; Dessoky, E.S.; Alqurashi, M.; Aloufi, S. Assessment of Genetic Diversity of Bread Wheat Genotypes for Drought Tolerance Using Canopy Reflectance-Based Phenotyping and SSR Marker-Based Genotyping. Sustainability 2022, 14, 9818. https://doi.org/10.3390/su14169818
Mohi-Ud-Din M, Hossain MA, Rohman MM, Uddin MN, Haque MS, Dessoky ES, Alqurashi M, Aloufi S. Assessment of Genetic Diversity of Bread Wheat Genotypes for Drought Tolerance Using Canopy Reflectance-Based Phenotyping and SSR Marker-Based Genotyping. Sustainability. 2022; 14(16):9818. https://doi.org/10.3390/su14169818
Chicago/Turabian StyleMohi-Ud-Din, Mohammed, Md. Alamgir Hossain, Md. Motiar Rohman, Md. Nesar Uddin, Md. Sabibul Haque, Eldessoky S. Dessoky, Mohammed Alqurashi, and Salman Aloufi. 2022. "Assessment of Genetic Diversity of Bread Wheat Genotypes for Drought Tolerance Using Canopy Reflectance-Based Phenotyping and SSR Marker-Based Genotyping" Sustainability 14, no. 16: 9818. https://doi.org/10.3390/su14169818
APA StyleMohi-Ud-Din, M., Hossain, M. A., Rohman, M. M., Uddin, M. N., Haque, M. S., Dessoky, E. S., Alqurashi, M., & Aloufi, S. (2022). Assessment of Genetic Diversity of Bread Wheat Genotypes for Drought Tolerance Using Canopy Reflectance-Based Phenotyping and SSR Marker-Based Genotyping. Sustainability, 14(16), 9818. https://doi.org/10.3390/su14169818


