Design, Development and Validation of an Intelligent Collision Risk Detection System to Improve Transportation Safety: The Case of the City of Popayán, Colombia
 , , , and
Abstract
1. Introduction
- The design of the ICRDS was performed considering the limitations of the context of interest. The research works reviewed were focused on other types of cities.
- The ICRDS data collection was performed by simultaneously using two types of devices, allowing data cross-validation.
- Test design and execution, and the analysis of results in the context of interest were included.
- Two data sets were collected with relevant information regarding vehicular routes, taken from two devices. High-risk near-crash events were identified in such data sets [43].
- A classification of critical areas with a higher risk of occurrence of TAs in the city used as a case study (Section 3.3).
- What are the main components of a system that allows collision risk detection in a medium-sized city of a developing country?
- How to collect relevant data on vehicular trips, through an experiment that uses ND, to identify high-risk collision events in cities of the target context?
- How to determine the areas of high probability of TA in the target context?
2. Materials and Methods
2.1. Identification of Devices, Kinematic Variables and Algorithms
- Use of components adjusted to the context of interest.
- More than a driving variable was considered.
- Field tests in real driving environments were performed.
- Data acquired during the field tests.
- Analysis of the collected data.
- Instrumented vehicle.
- Smartphone.
- On Board Diagnostic II (OBD-II) system.
- Inertial Measurement Unit (IMU).
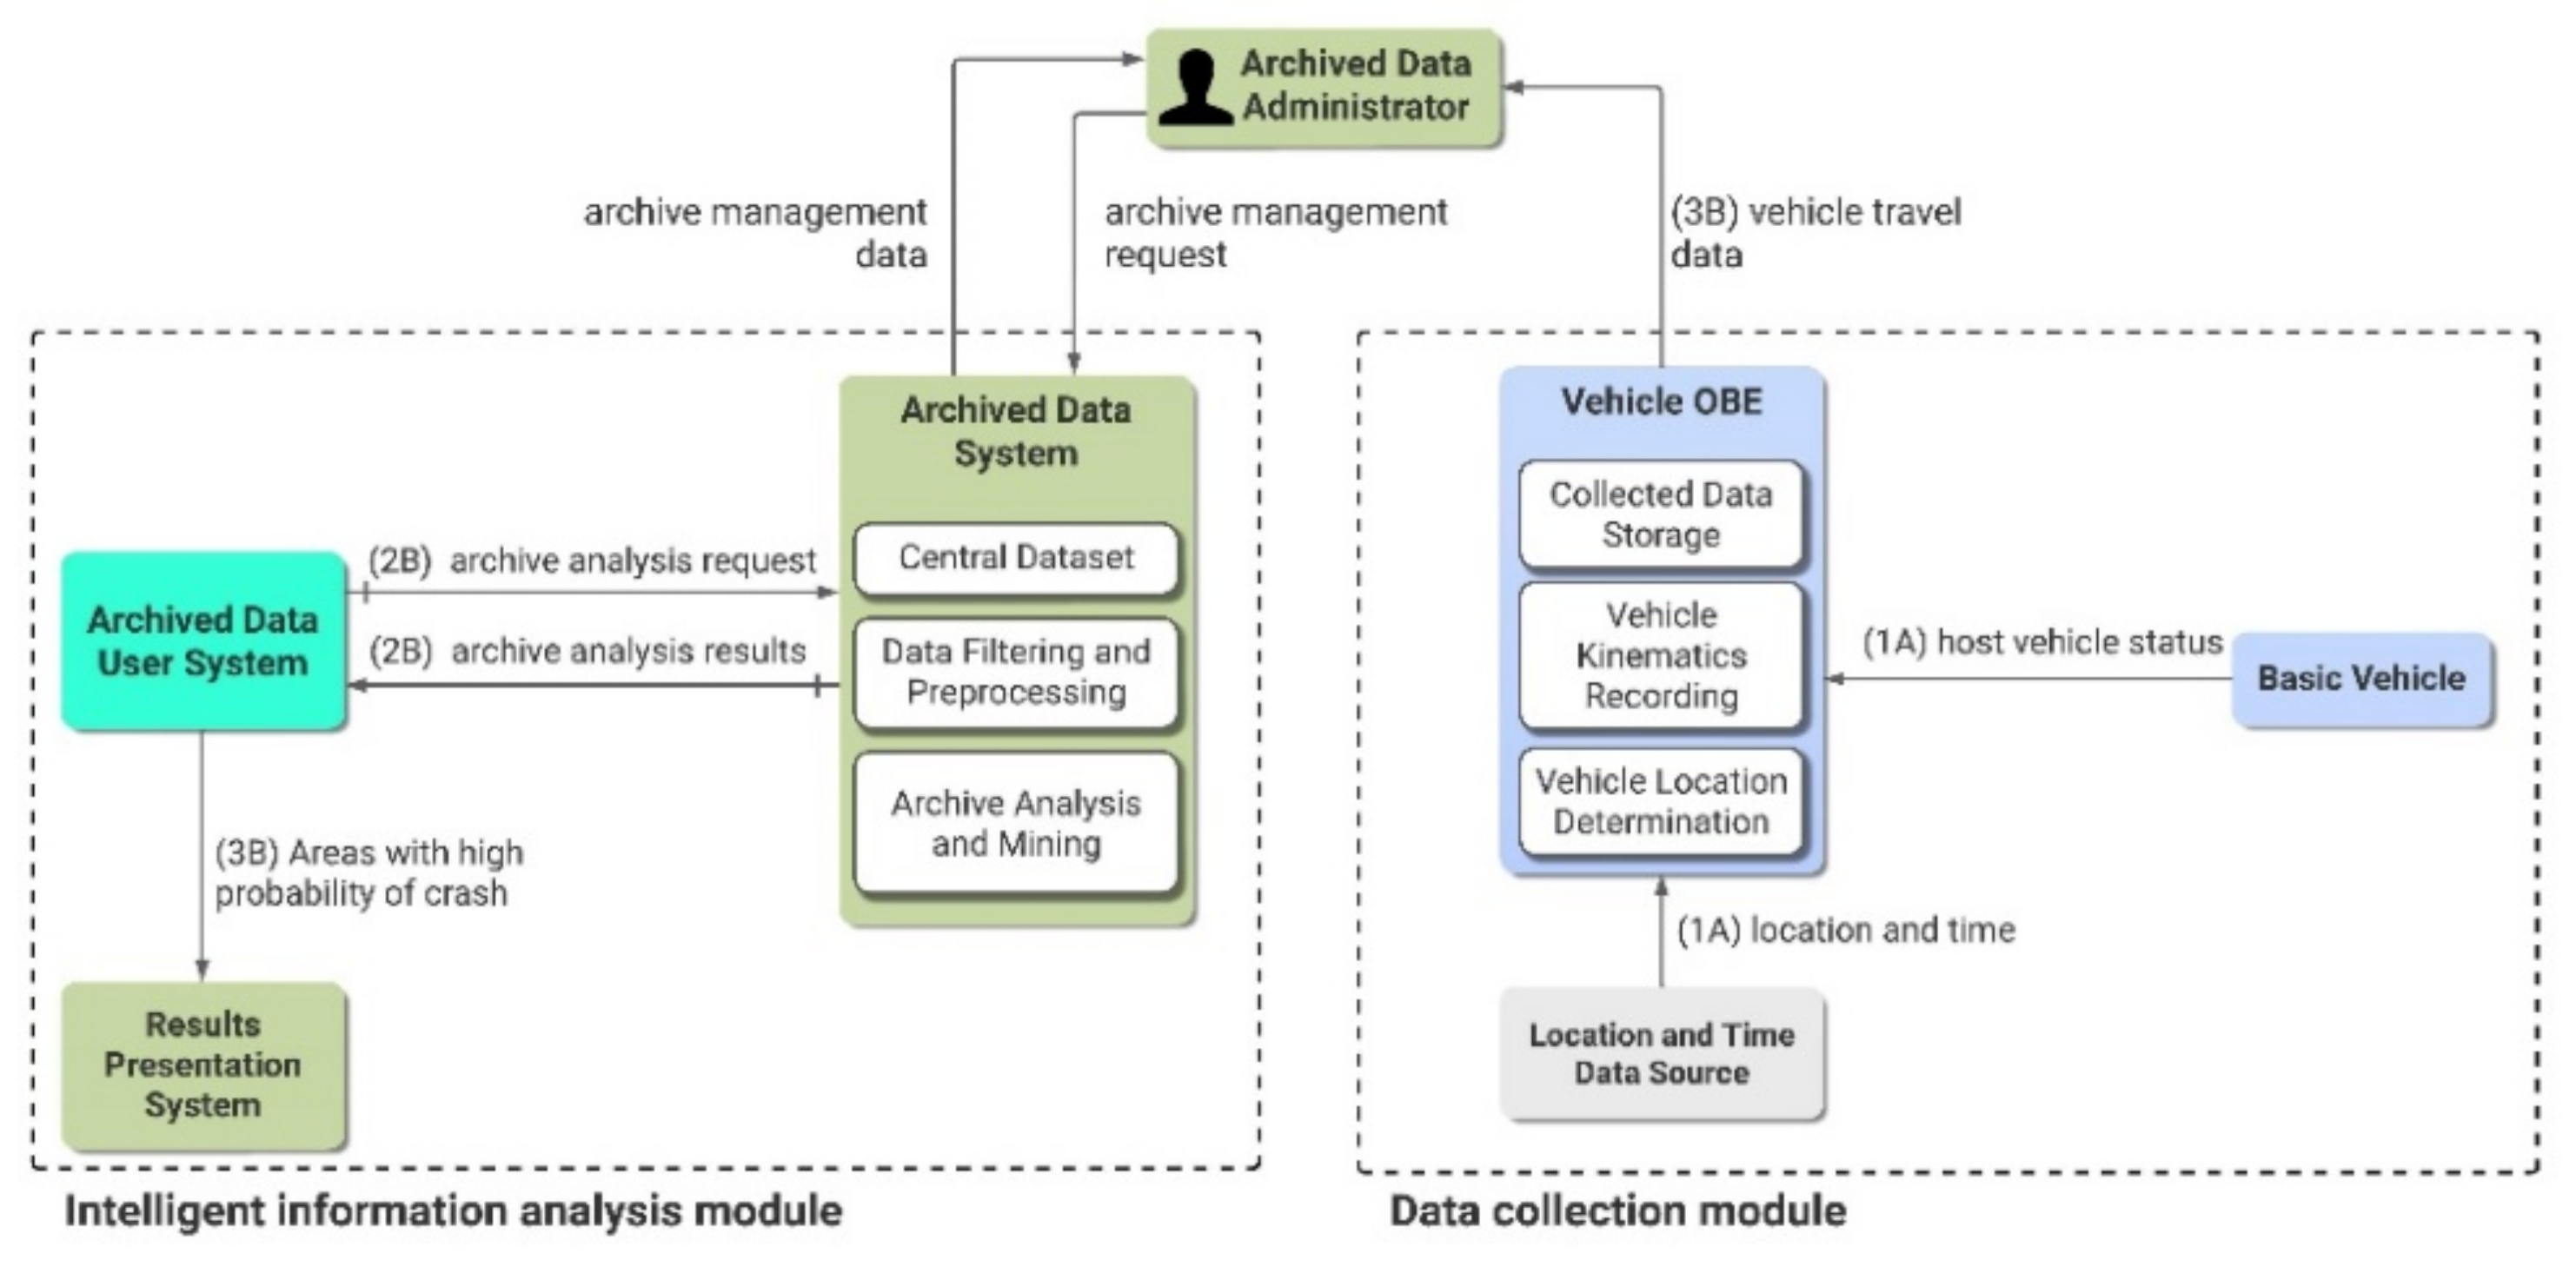
2.2. Architecture Design for the System
2.3. Design and Development of a System Prototype
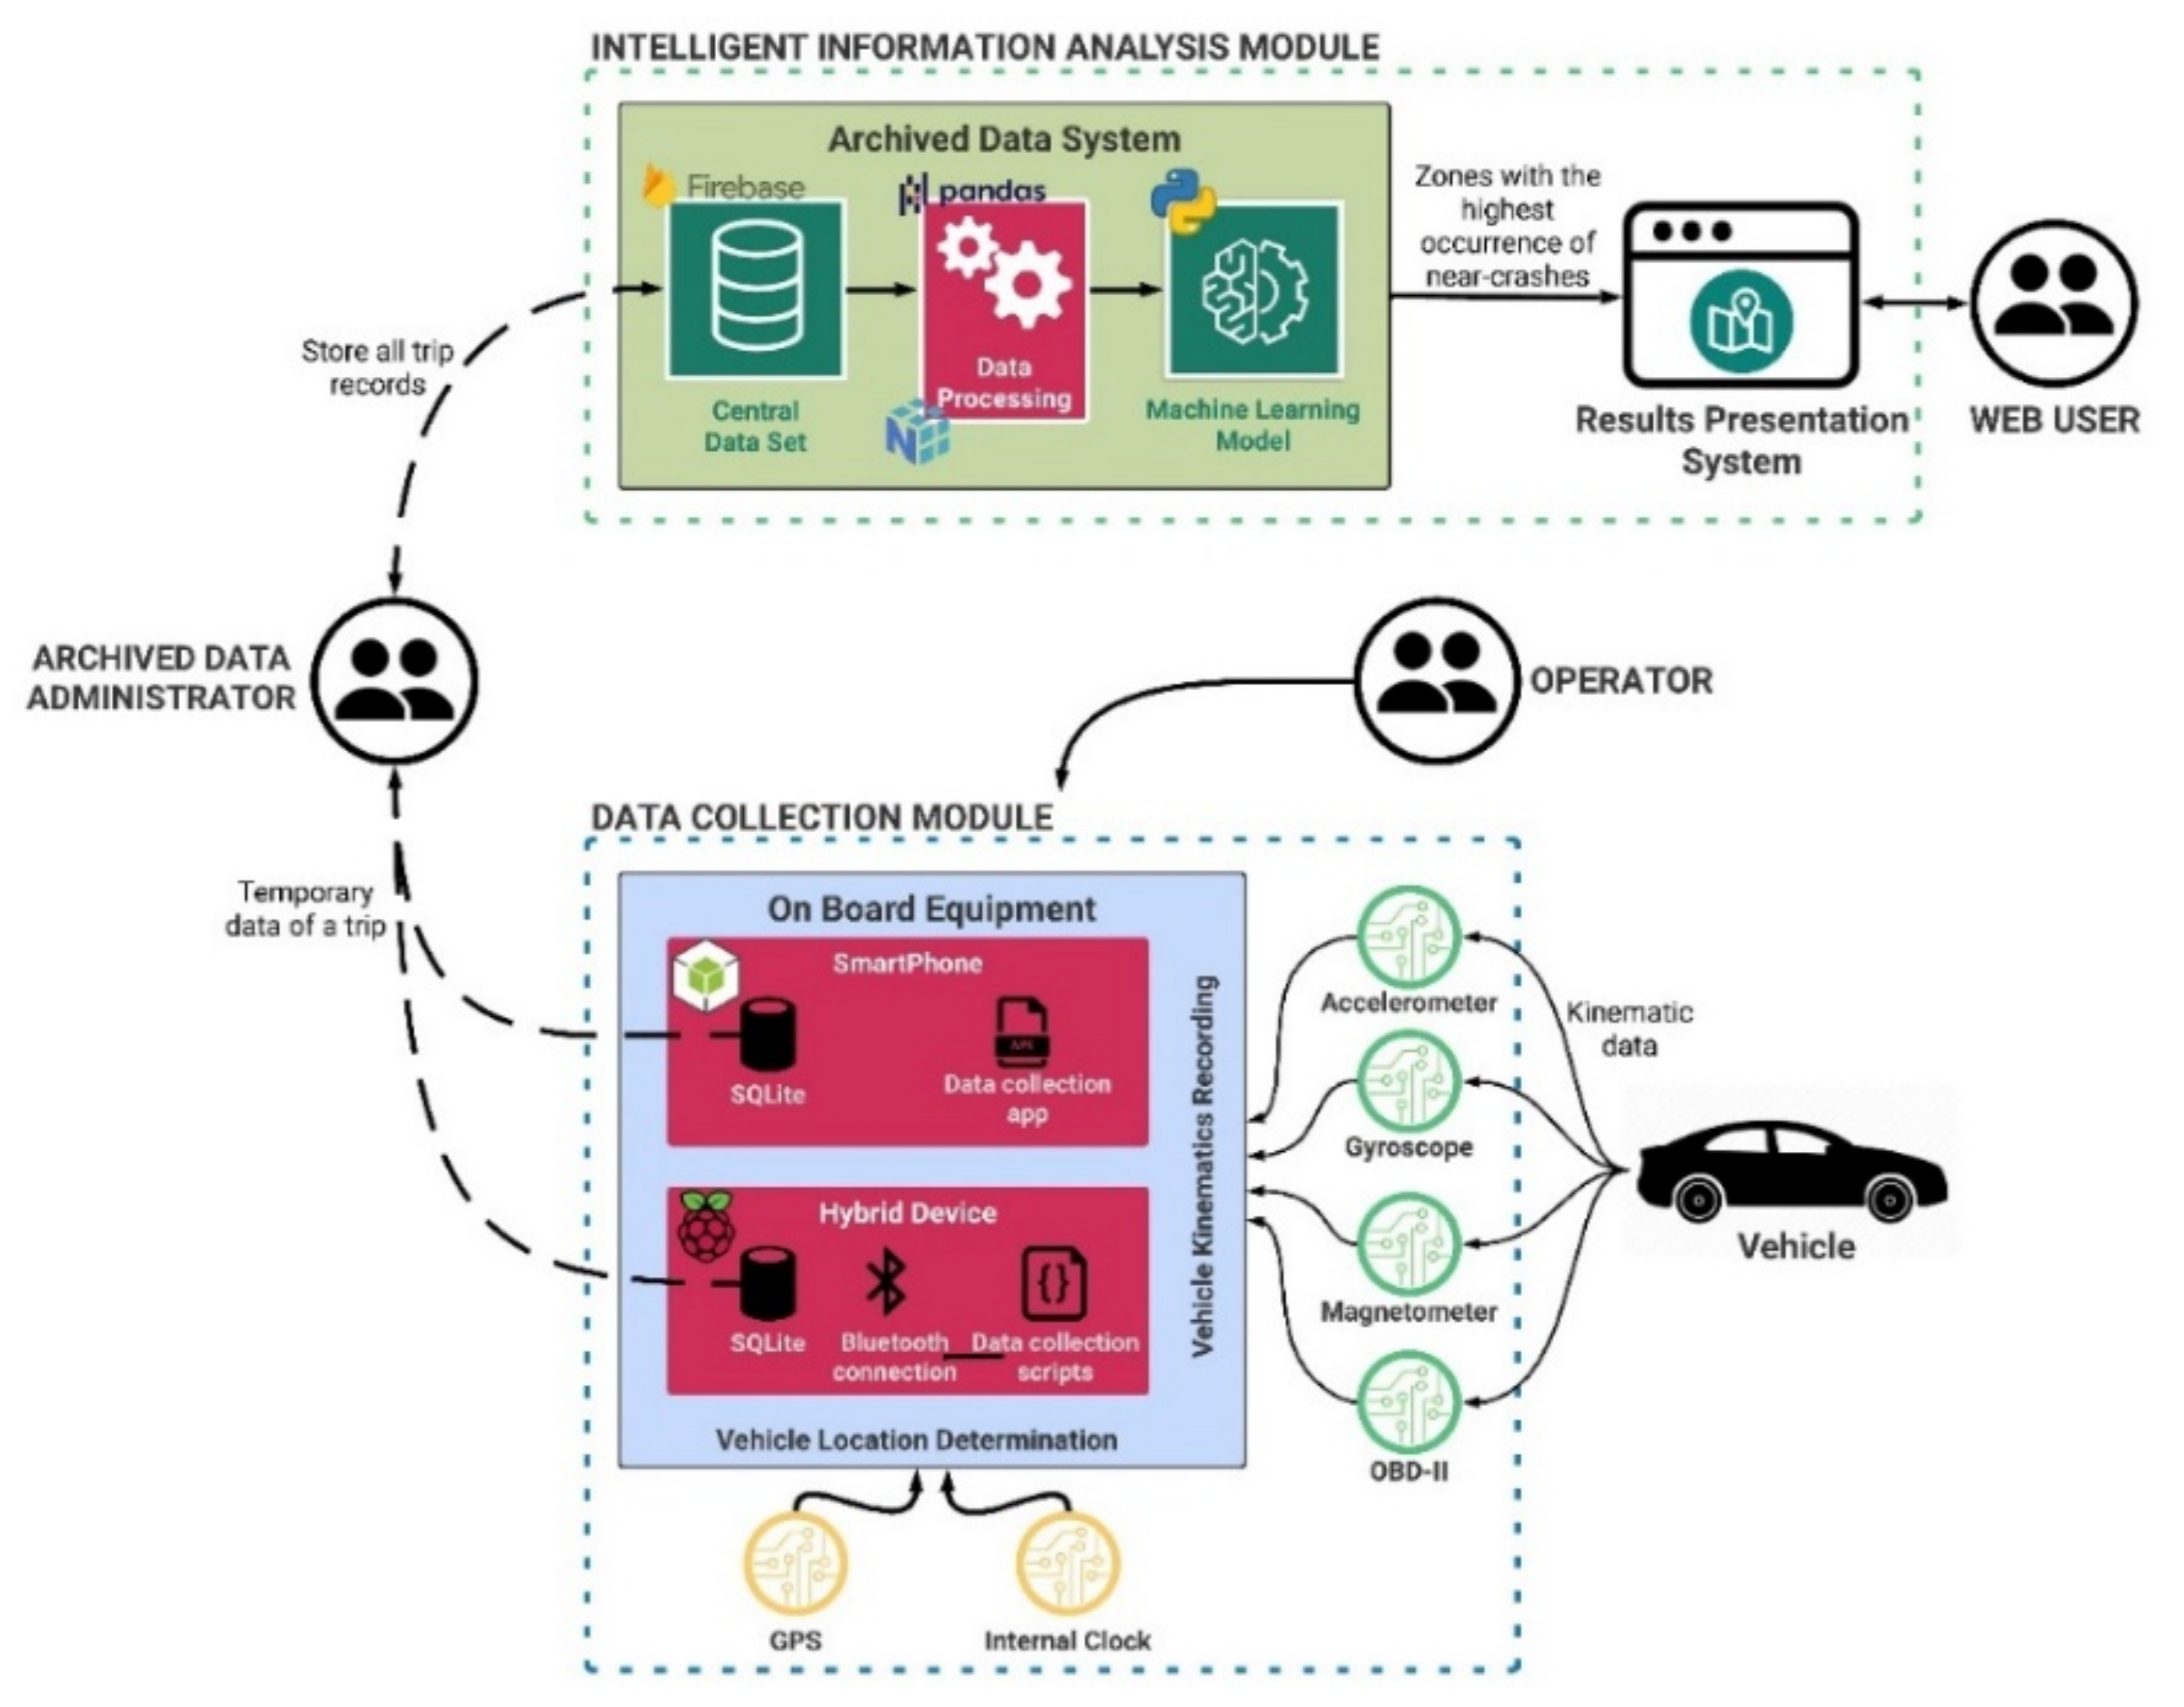
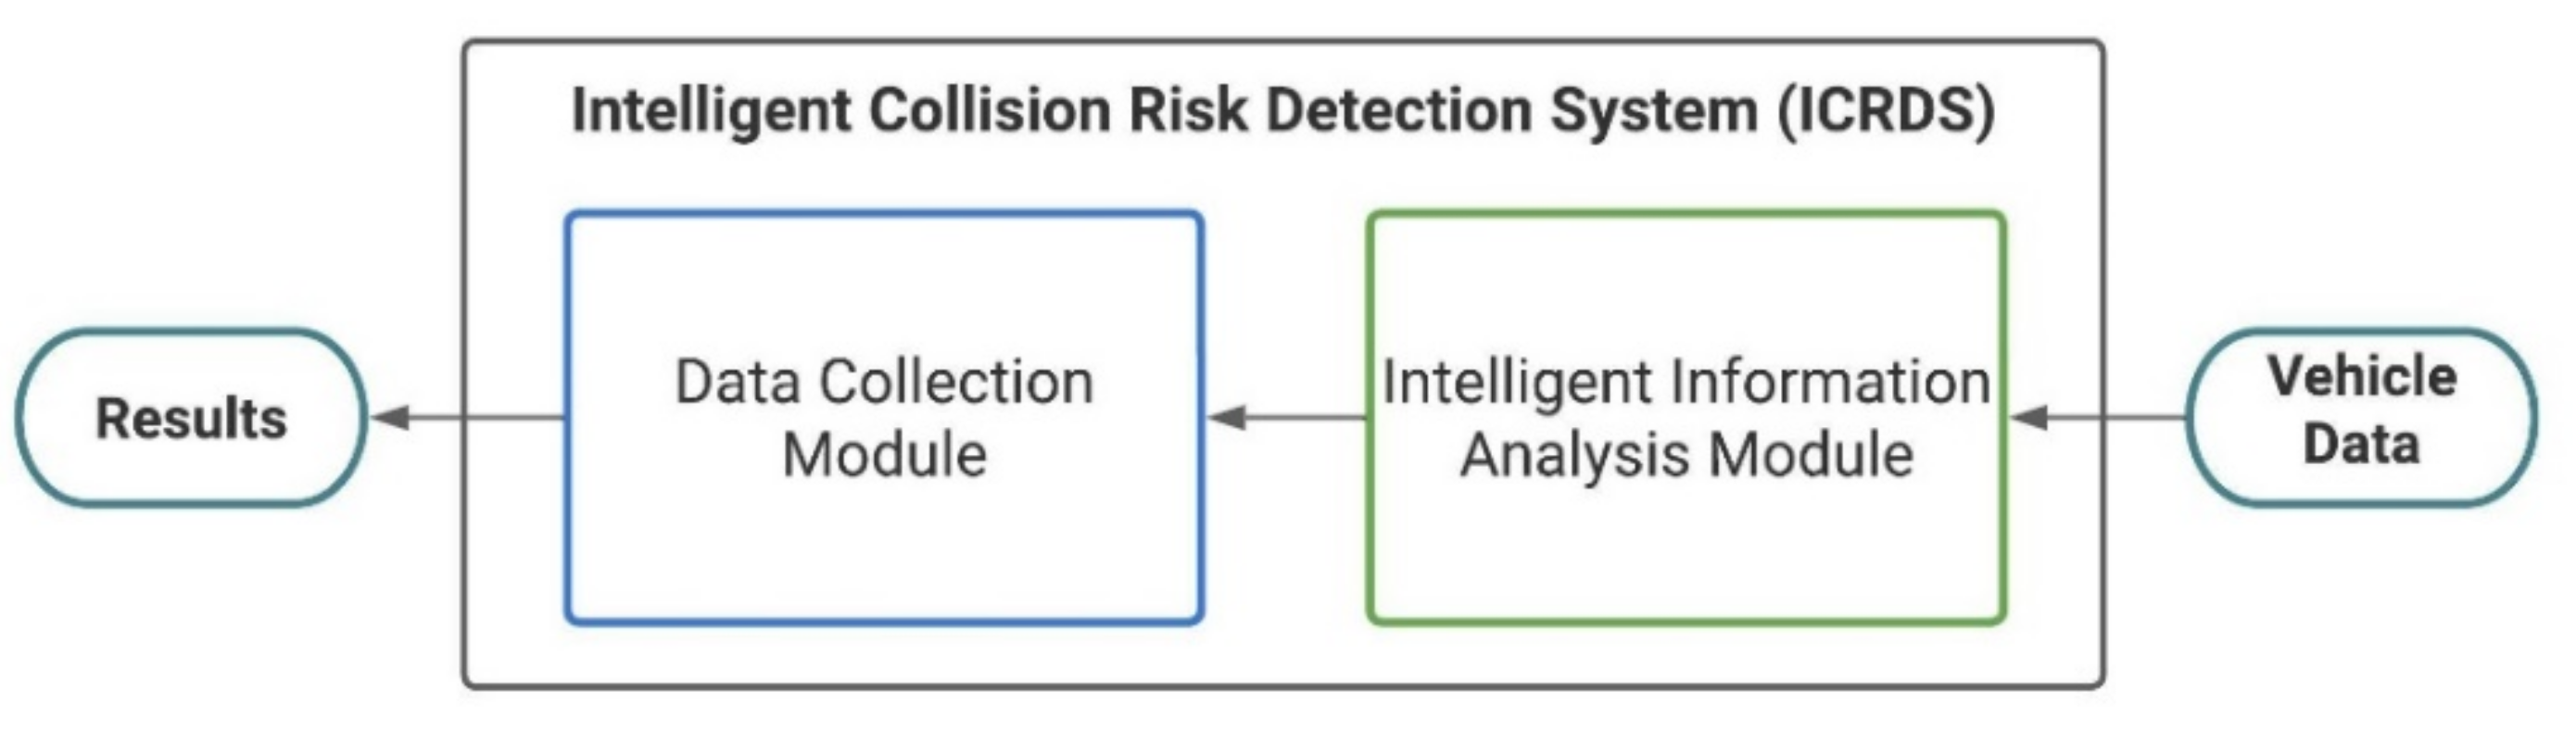
- Data Collection Module (DCM). This module has the necessary hardware (HW) and software (SW) for collection and storage of vehicle kinematic data. This process encompasses three main operations: kinematic variable capture, location and time data tagging, and temporary storage of collected data.
- Intelligent information analysis module (IIAM). This module contains the necessary components for information processing and data cleaning, ML algorithms and presentation of results.
- OBE—Collected Data Storage (OBE-CDS).
- OBE—Vehicle Kinematics Recording (OBE-VKR).
- OBE—Vehicle Location Determination (OBE-VLD).
- ADS Central Data set (ADS-CD).
- ADS Data Filtering and Preprocessing (ADS-DFP).
- ADS Archived Analysis and Mining (ADS-AAM).
- Details of functional objects of the ICRDS prototype are presented in Appendix C.
2.4. ML Model Development
2.4.1. Phase I: Business Understanding
- Extract data where the near-crash driving maneuvers occur.
- Clean and filter the data obtained when executing the driving maneuvers.
- Select the features from the data set that best represent each maneuver.
- Perform the feature extraction process to determine the final input data set of the classifier algorithm.
- Train and optimize each one of the classifiers to select the one that obtains the best performance classifying the driving maneuvers.
- Select the classifier that obtained the best performance to generate the ML model that allows the detection of the different maneuvers.
- Deploy the classifier on the ICRDS prototype web platform.
2.4.2. Phase II: Data Understanding
- Data ID (input);
- Trip ID (input);
- Vehicle ID (input);
- Route ID (input);
- Timestamp (input);
- Speed (input);
- Acceleration in X (input);
- Acceleration in Y (input);
- Acceleration in Z (input);
- Angular velocity in X (input);
- Angular velocity in Y (input);
- Angular velocity in Z (input);
- Magnetometer in X (input);
- Magnetometer in Y (input);
- Magnetometer in Z (input);
- Latitude (Input);
- Longitude (Input);
- Event Class (output). It is a binary variable, where 1 indicates the occurrence of a near-crash and 0 indicates normal driving. All columns are numeric data except for the timestamp and the event class (binary).
2.4.3. Phase III: Data Preparation
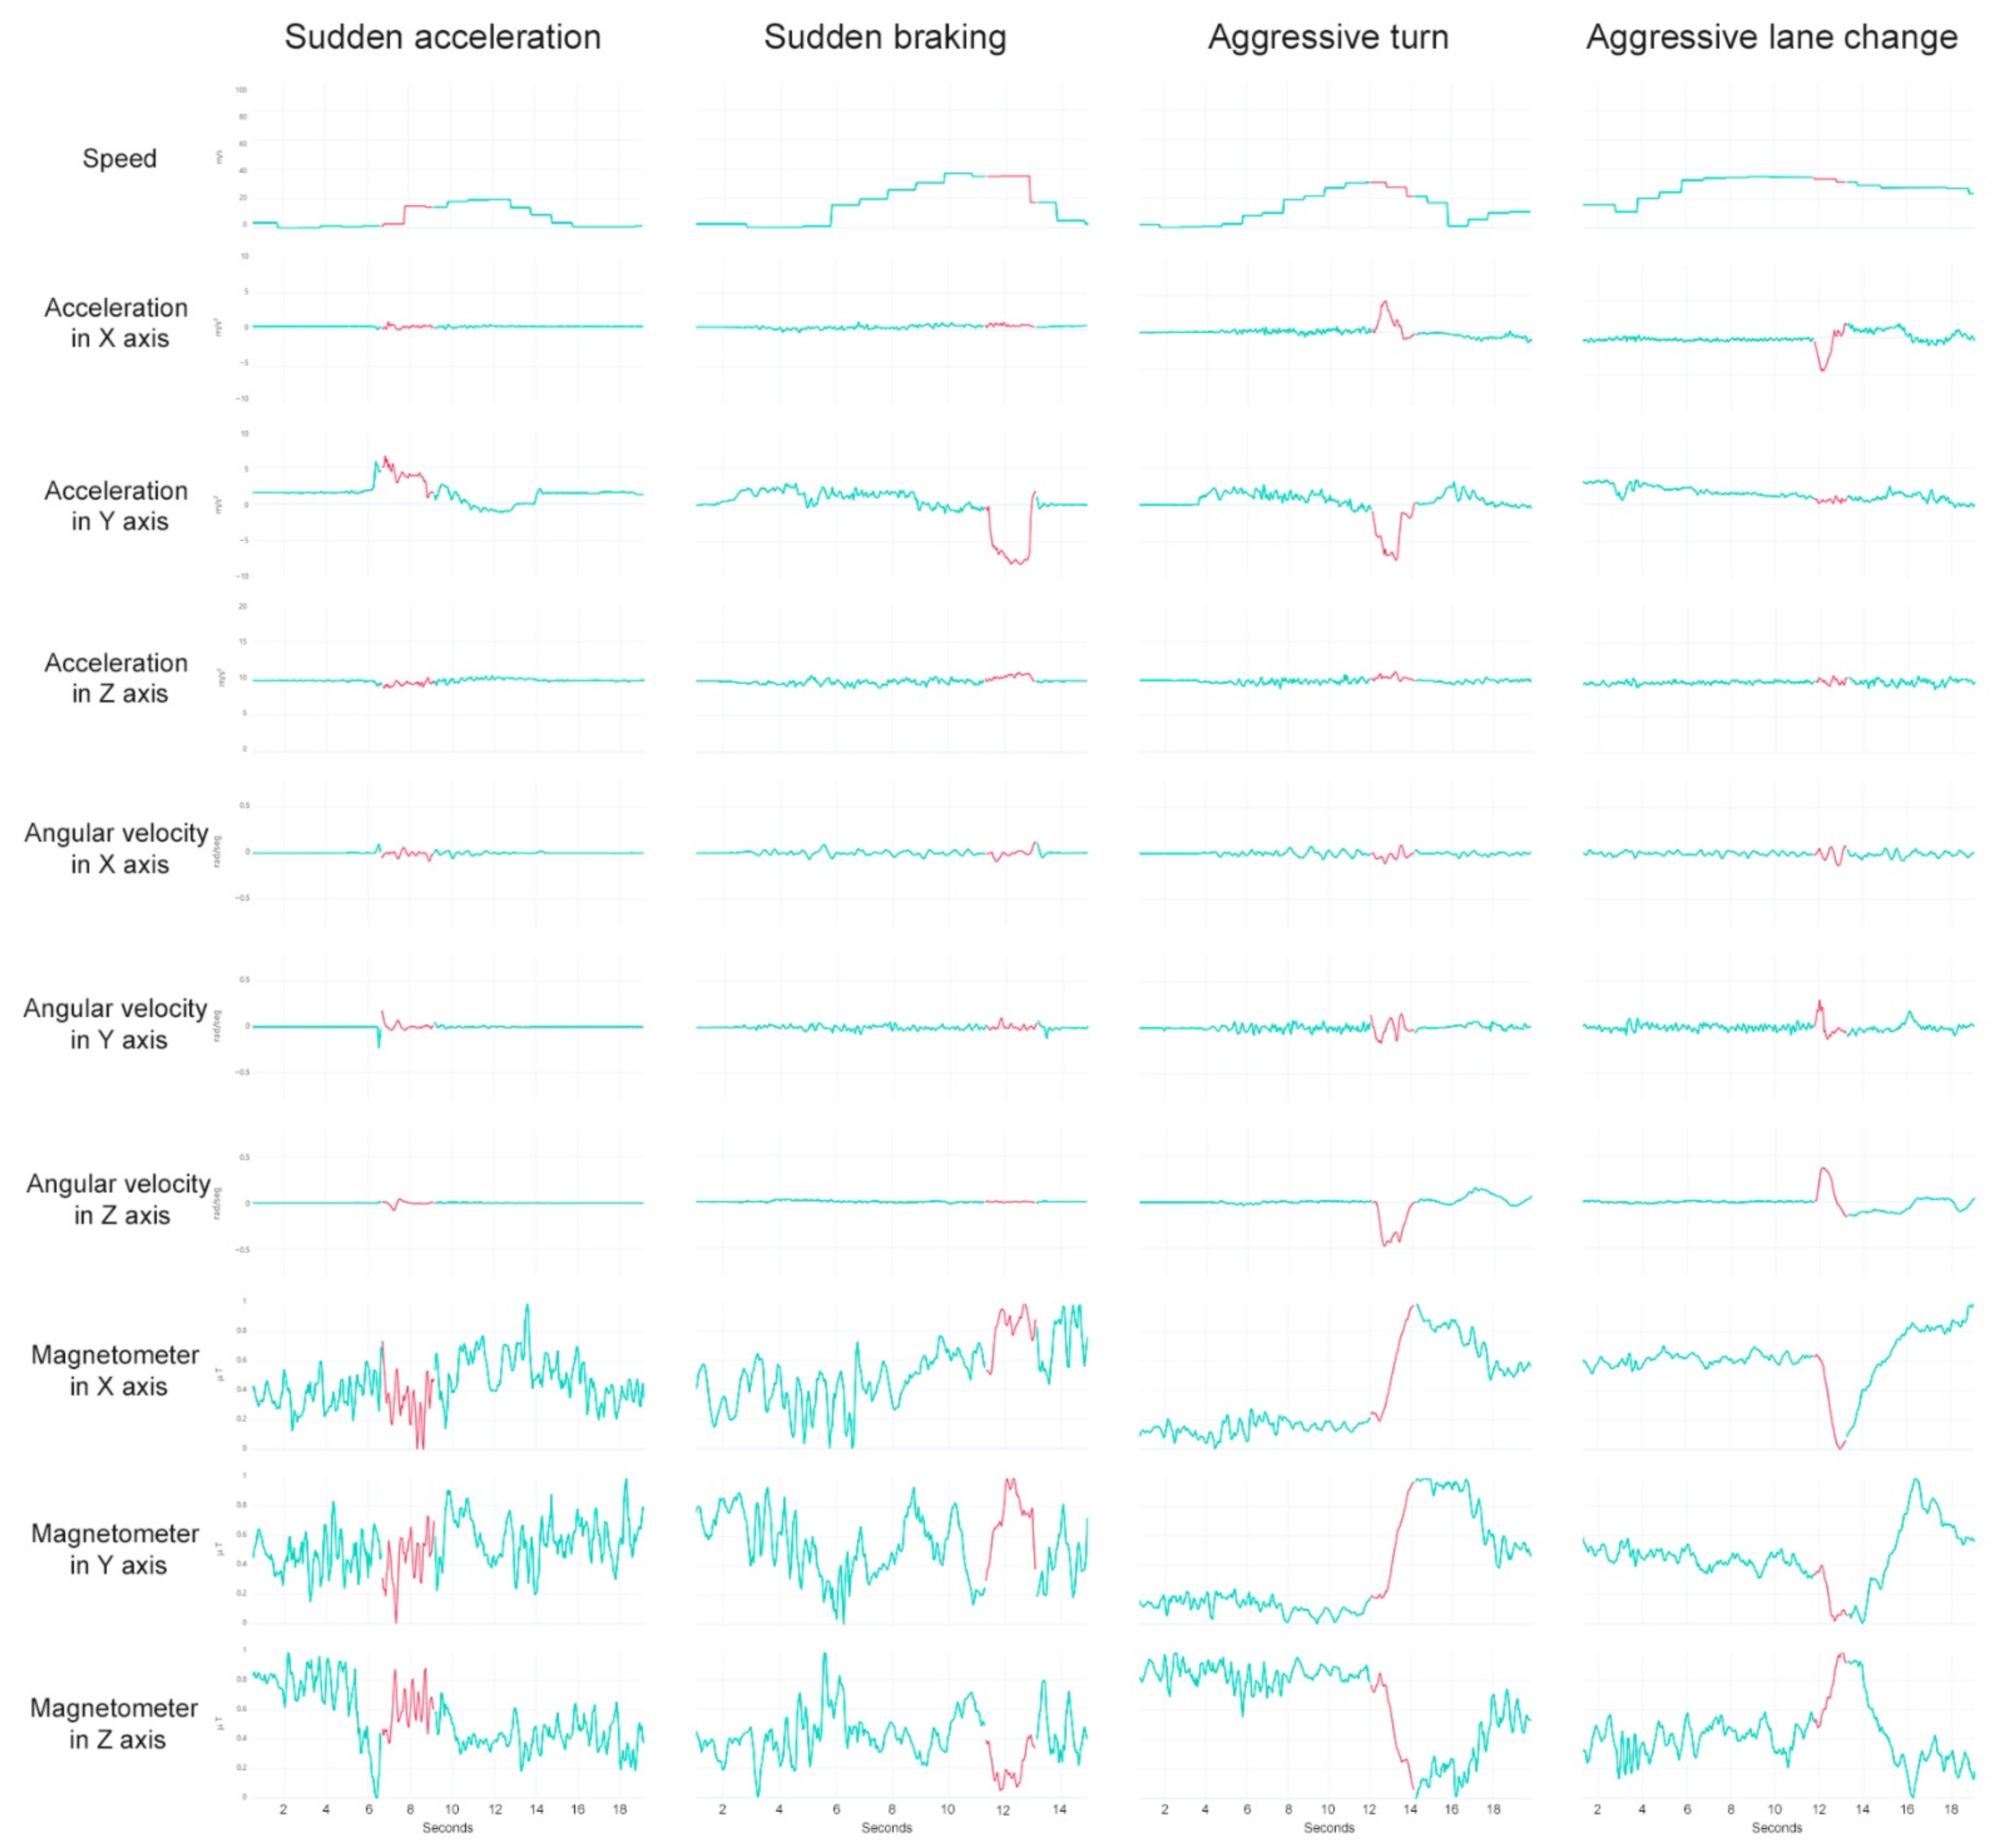
- Feature selection. It was necessary to identify the variables that had better correlation in the dispersion matrix, notable changes in the data according to the performed maneuver (Figure 5), and relevant information based on the current state of knowledge. The characteristics totally discarded from the data set with raw data were the acceleration in “Z” axis, because it is constant and equal to 1 g; angular velocity in the “X” and “Y” axes, because the variations observed in the files of the data set were tiny compared to the angular velocity in “Z” axis; and finally, the measurement of the magnetometer in the “Z” axis was discarded, because the “Z” axis always remained orthogonal to the ground plane. With the review performed, it was possible to define the different driving maneuvers from different kinematic variables (Table 1).
- Data cleaning. This activity consisted of two parts, a manual part and an automated part. In the first part, the necessary corrections were made for 3 problems related to data quality. The problems were related to the disconnection of the ELM 327 scanner, the operator mislabeling of a driving event, and a shift in the acceleration data due to the presence of tilt where the devices were placed. The second part of the data cleaning was focused on solving a problem related to the presence of noise in the IMU’s data due to factors such as engine or wheel friction. To solve this problem, a wide variety of denoising methods can be applied [14], in the case of this work a Kalman filter was selected. This filter was applied to all the columns that were related to kinematic data using a Python script [18].
- Feature extraction. The sliding time window was the technique used for feature extraction. This type of technique is frequently used to characterize time series data. The sliding time window contains two adjustment features: the size of the window, and the sliding interval. For the development of this work, only the size of the window was varied, taking values of 20 or 40 data samples.
2.4.4. Phase IV: Modeling
2.4.5. Phase V: Evaluation
2.4.6. Phase VI: Deployment
2.5. Design and Development of Field Tests in the Target Context
2.5.1. Controlled Training Field Tests
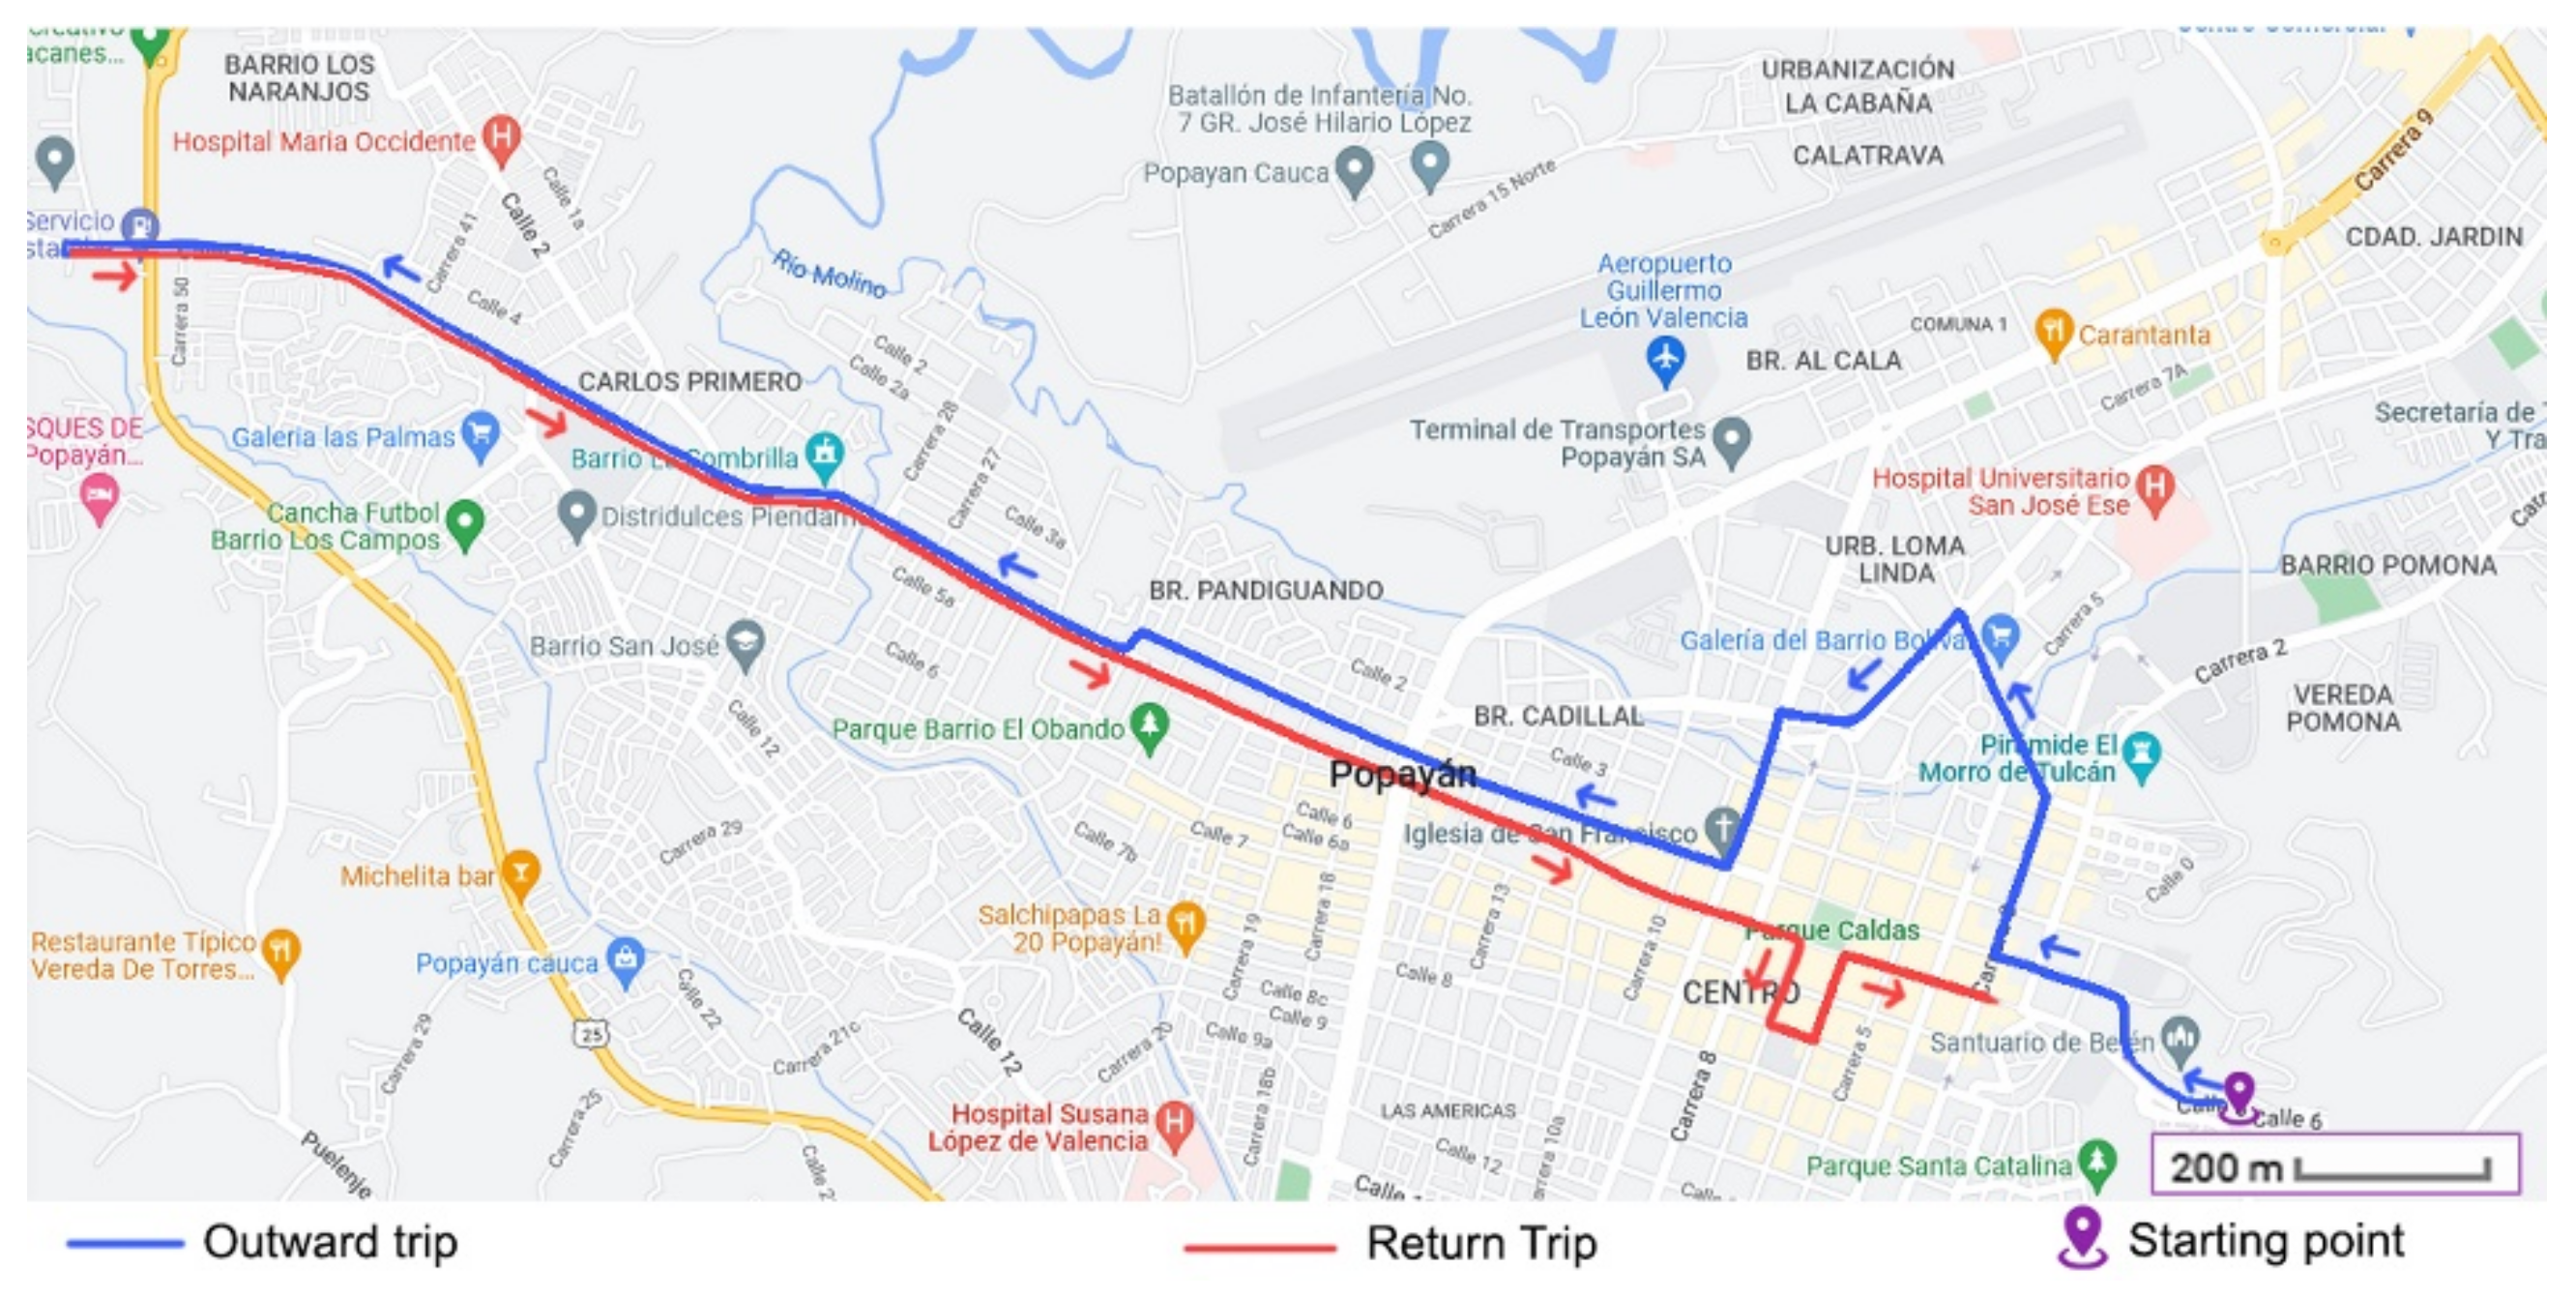
2.5.2. Uncontrolled Validation Field Tests
3. Results
3.1. ICRDS Prototype Development Results
3.1.1. DCM Development Results
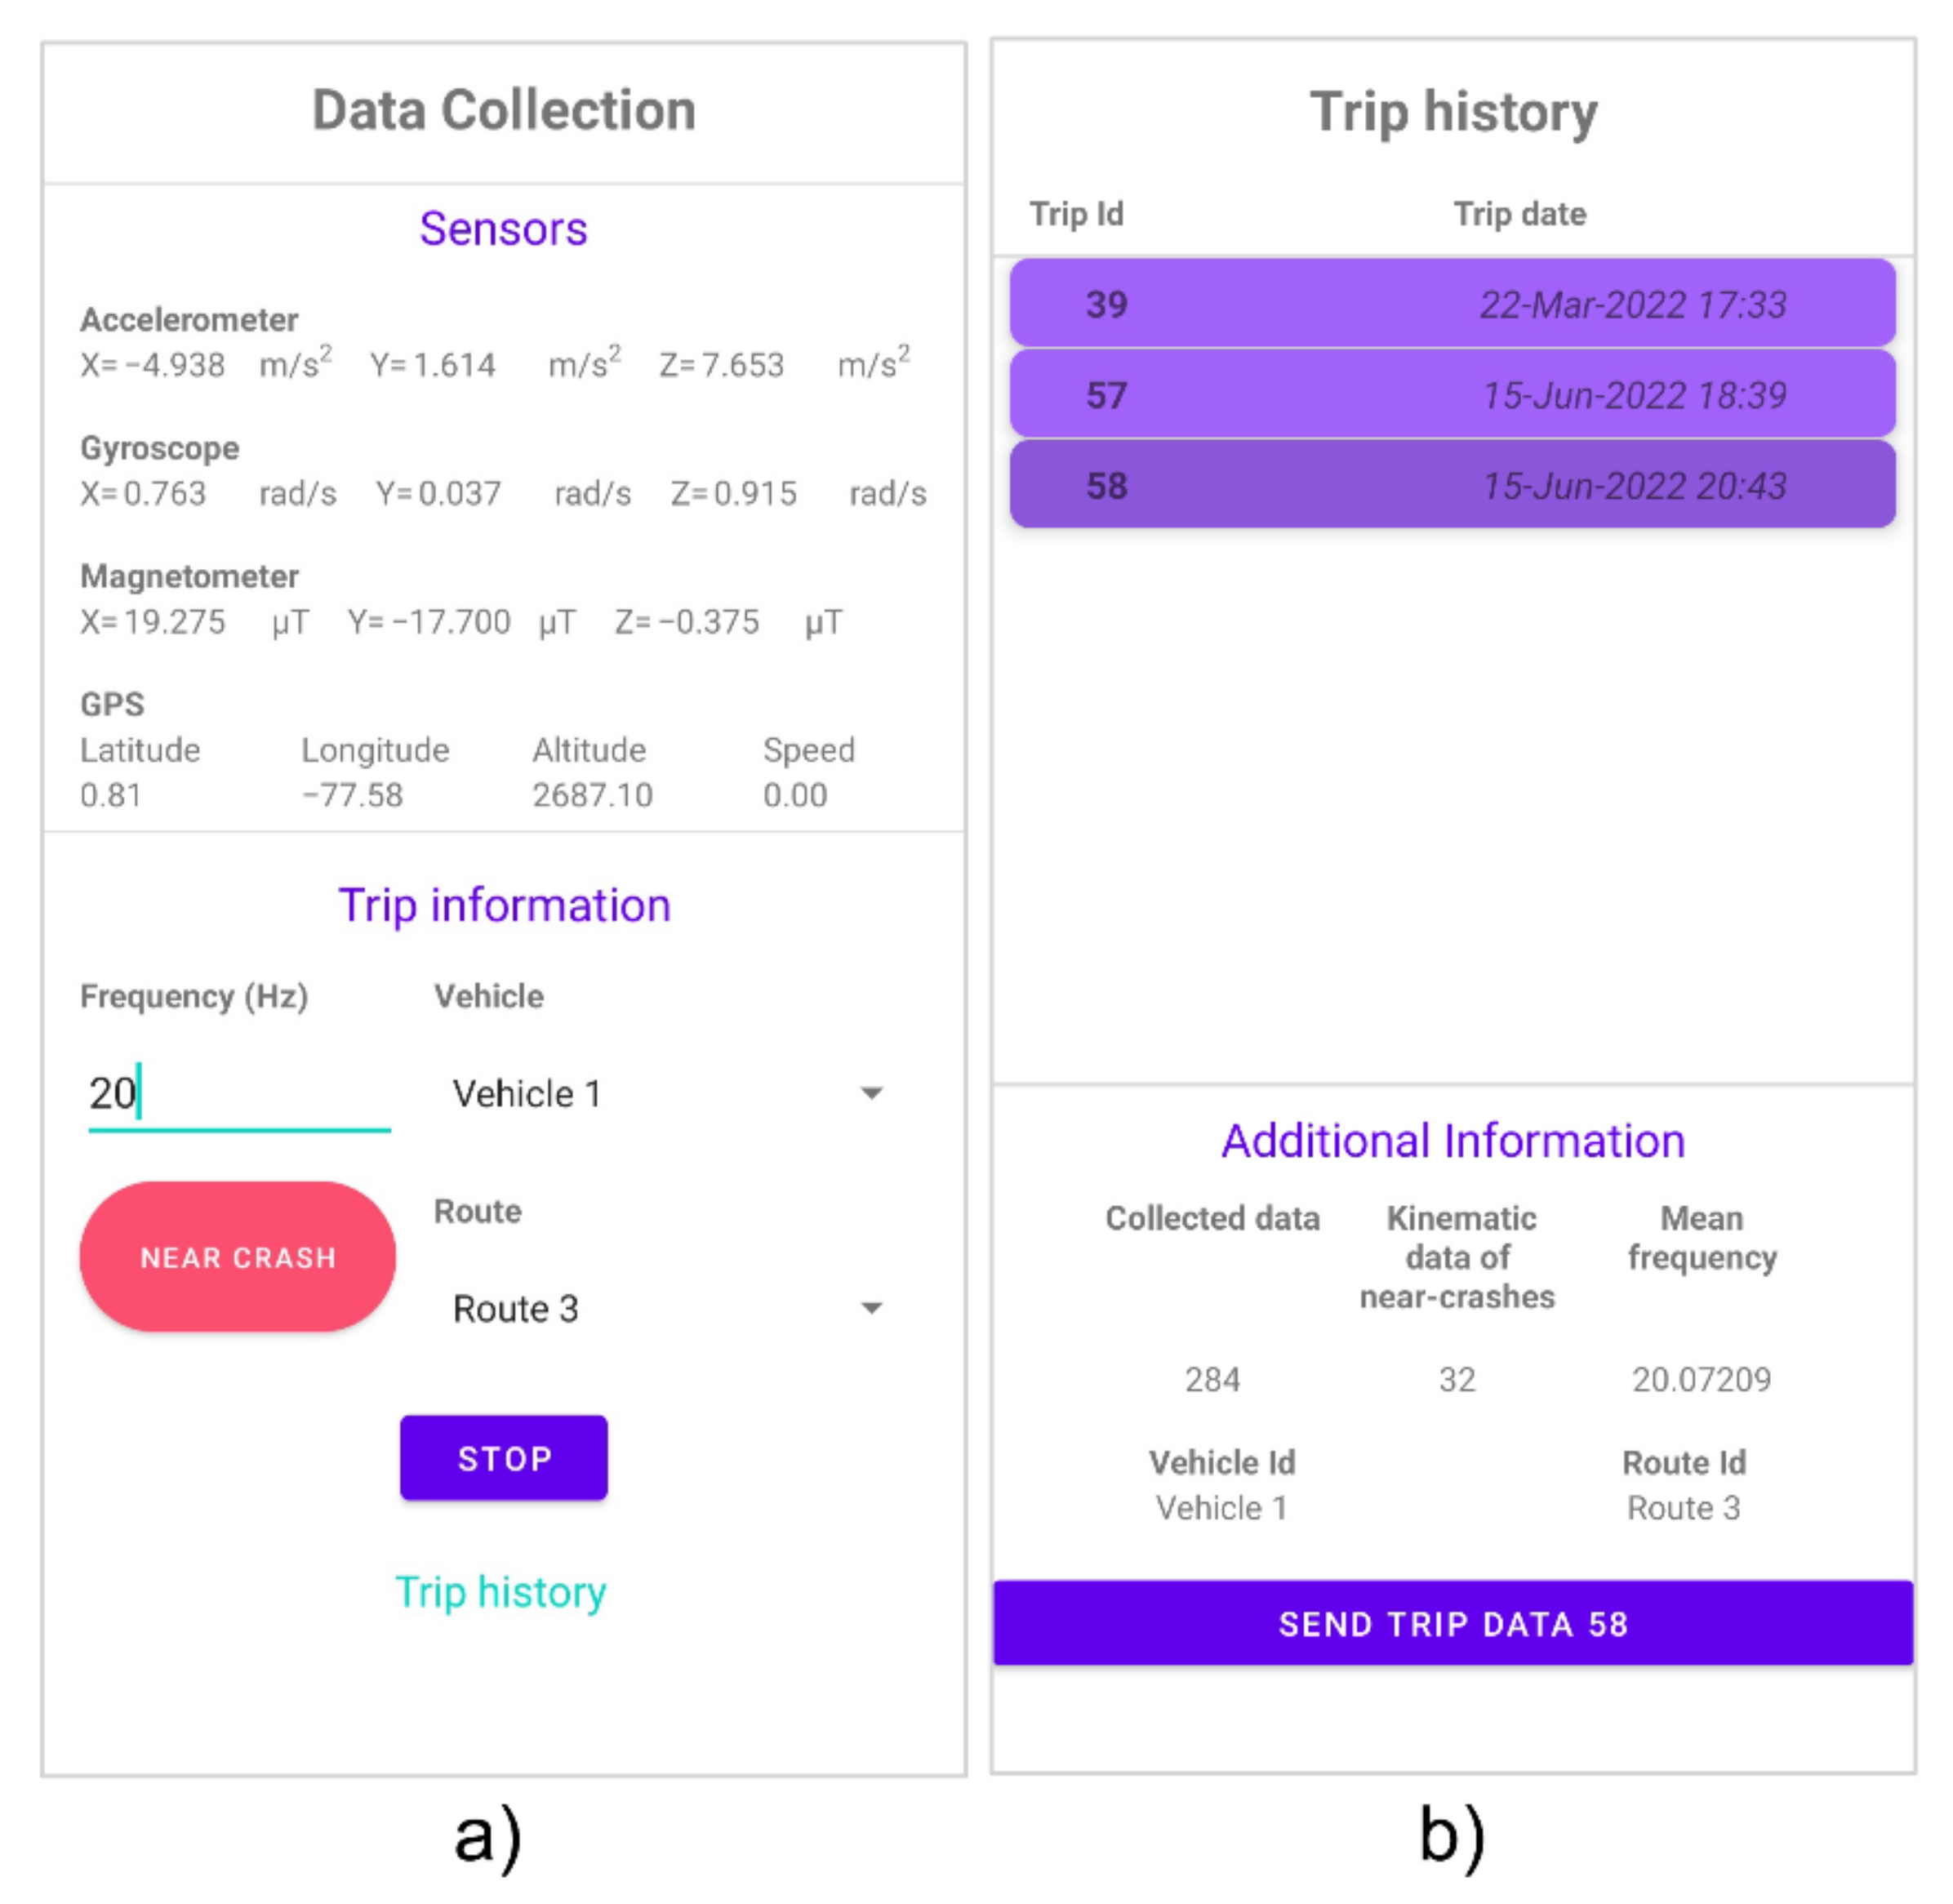
- Smartphone:
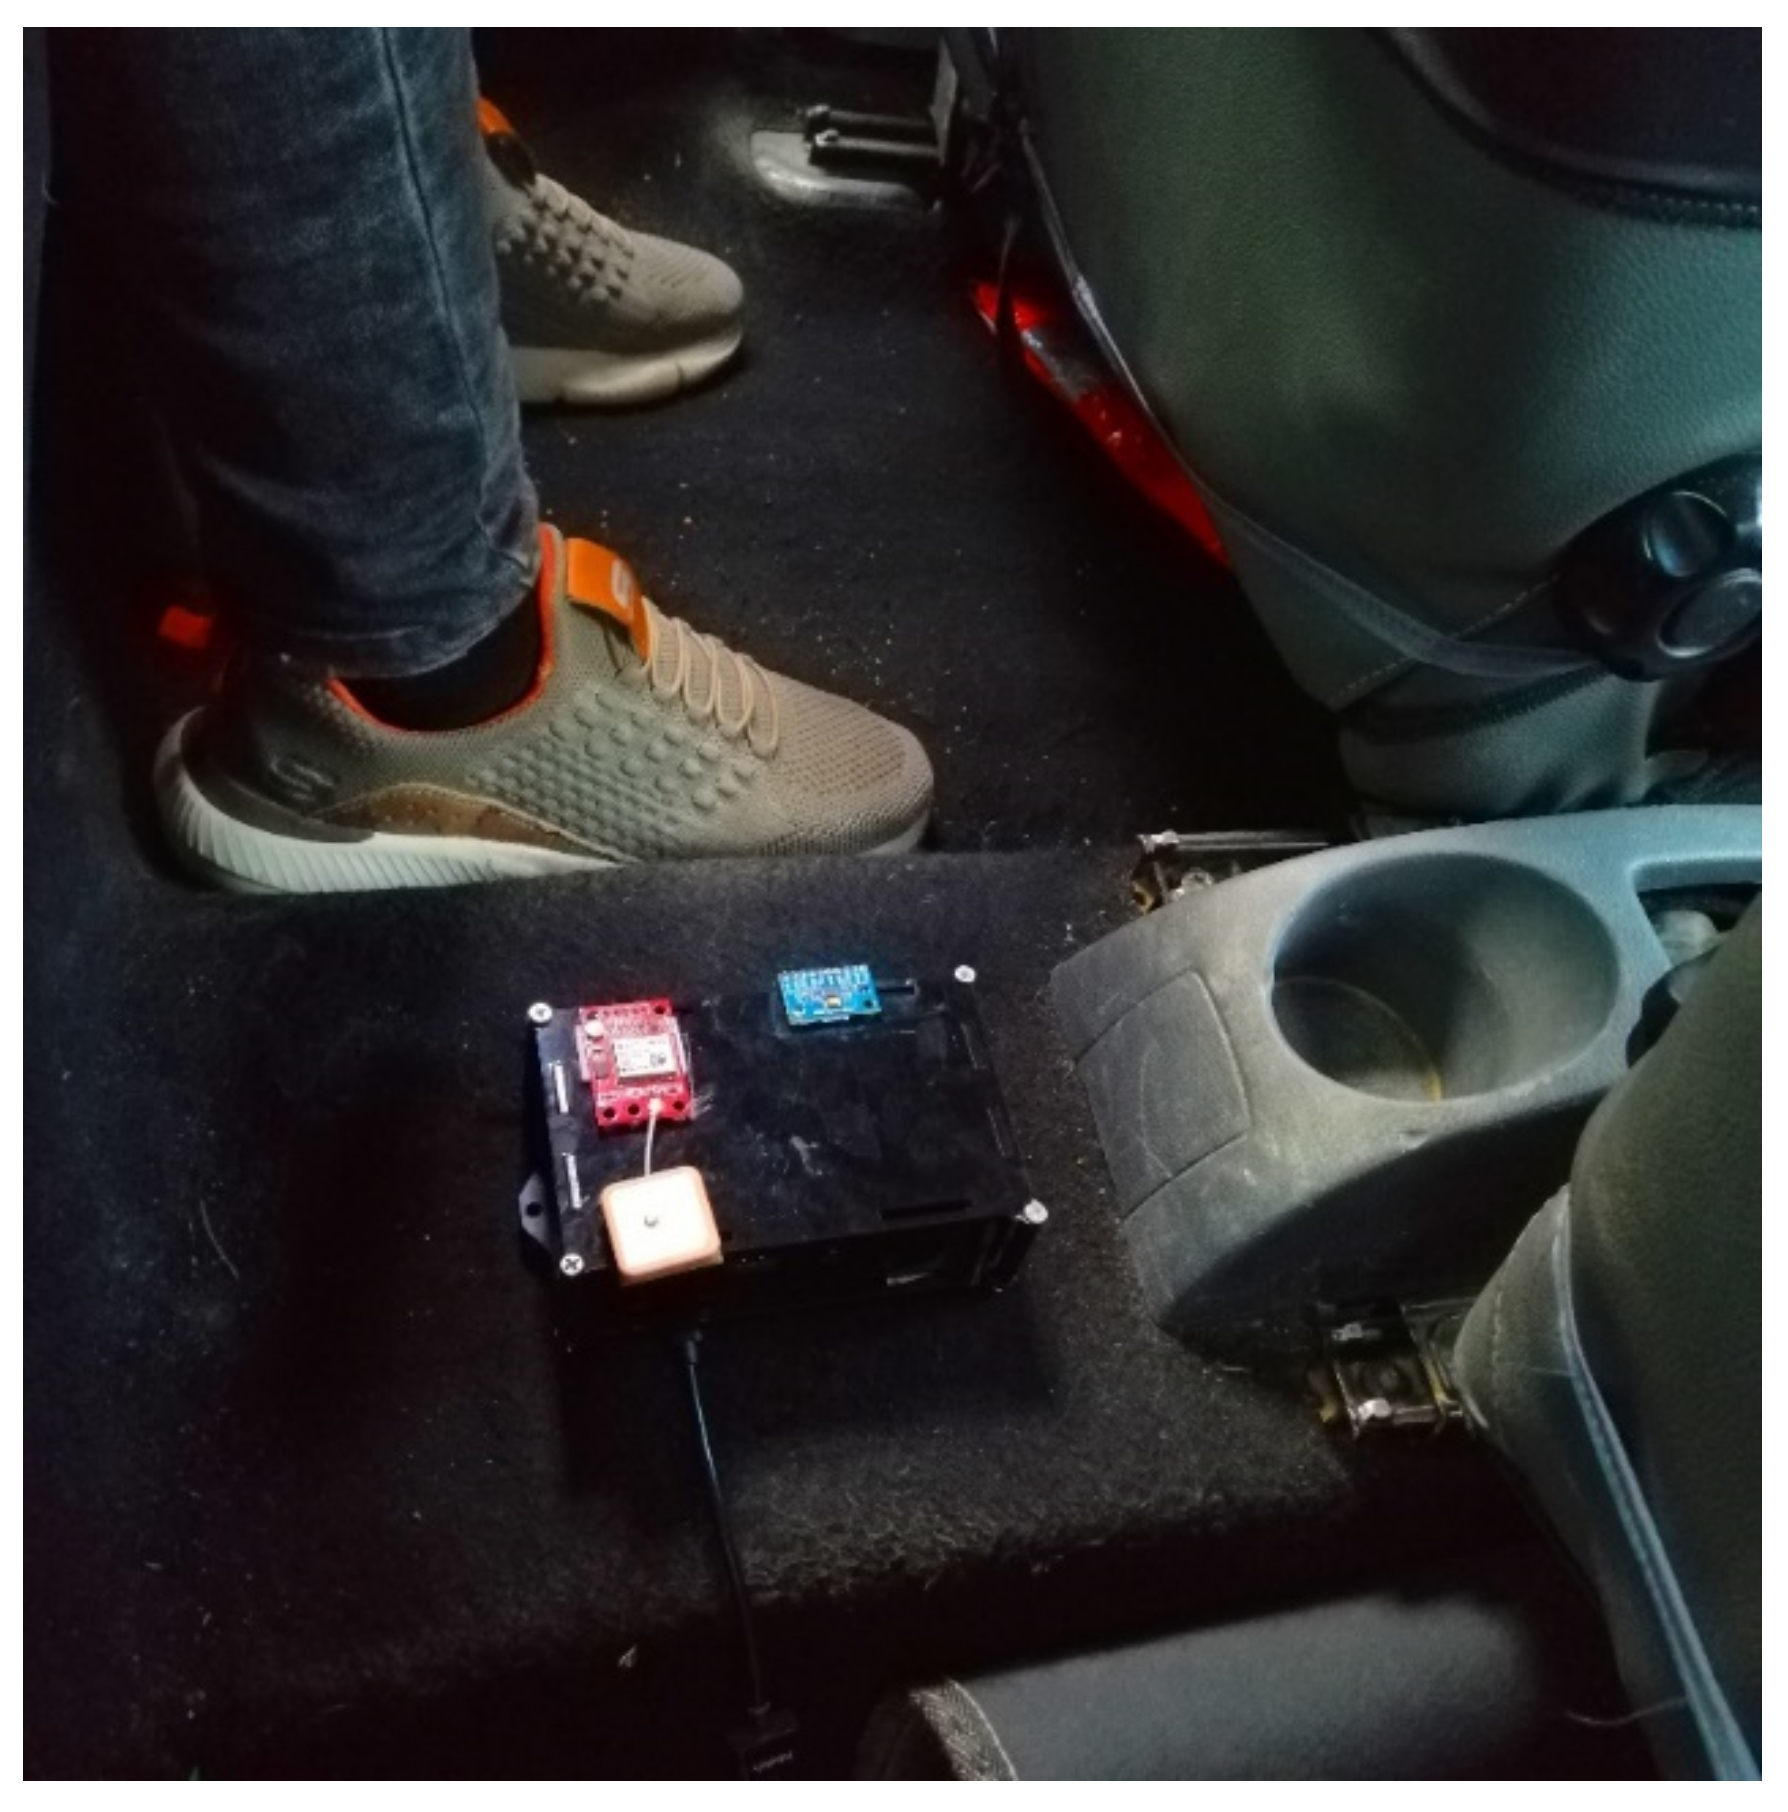
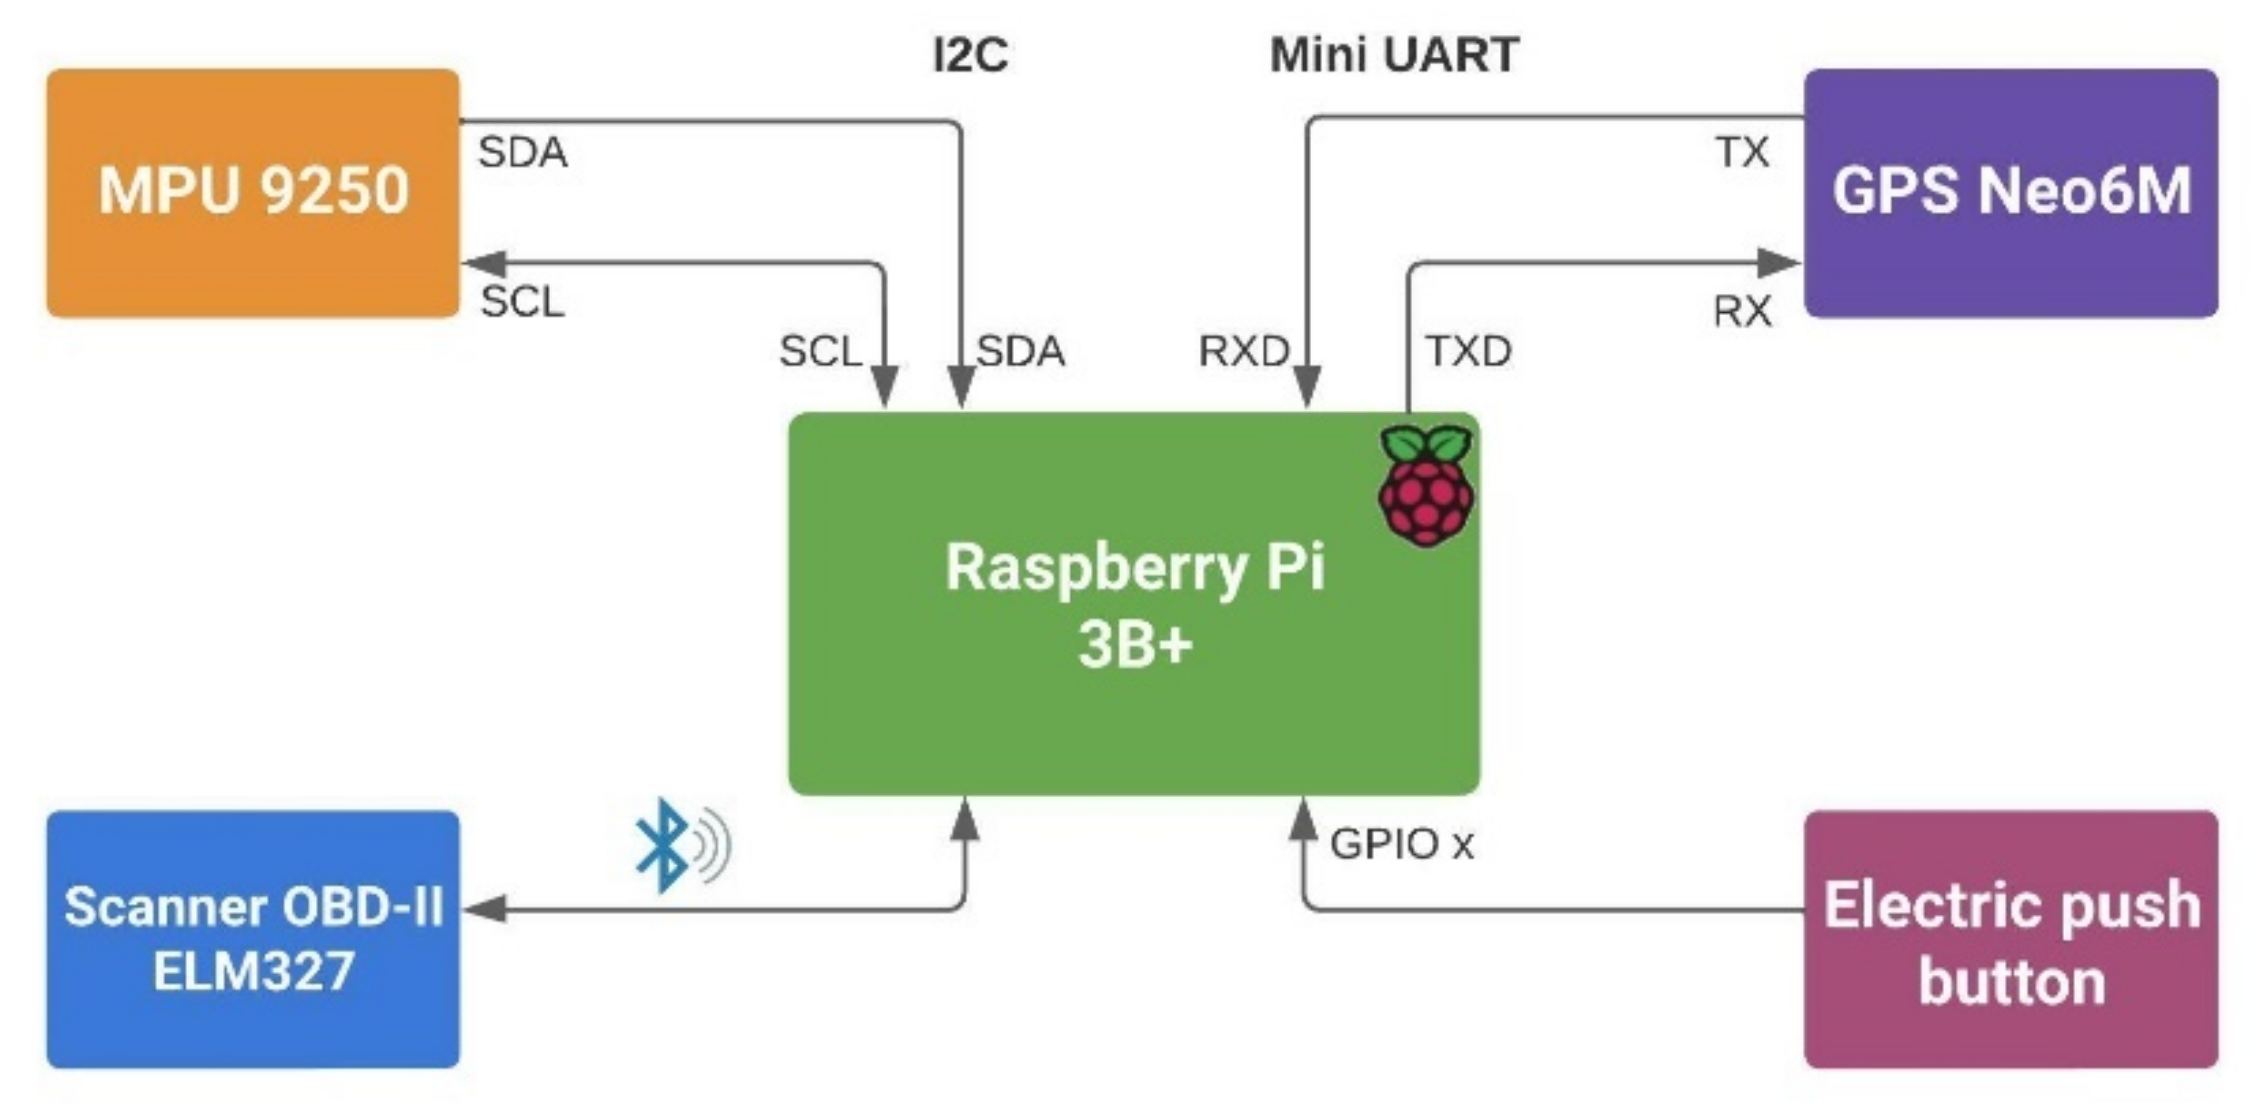
- Hybrid device and web application:
- An OBD-II ELM 327 scanner with Bluetooth connection, used to read the speed and the position of the accelerator pedal.
- An IMU MPU 9250, used to read the kinematic values of the vehicle (acceleration, angular velocity and magnetic field intensity, in the “X”, “Y”, and “Z” axes). This IMU was connected to the Raspberry Pi using the I2C (Inter Integrated Circuit) serial communication port and protocol.
- A GPS module Neo 6M, used to obtain the geospatial location of the hybrid device (latitude and longitude).
- A pushbutton connected to a GPIO pin configured as an input. This button was used for data labeling during controlled data collection tests for training the ML algorithm.
3.1.2. IIAM Development Results
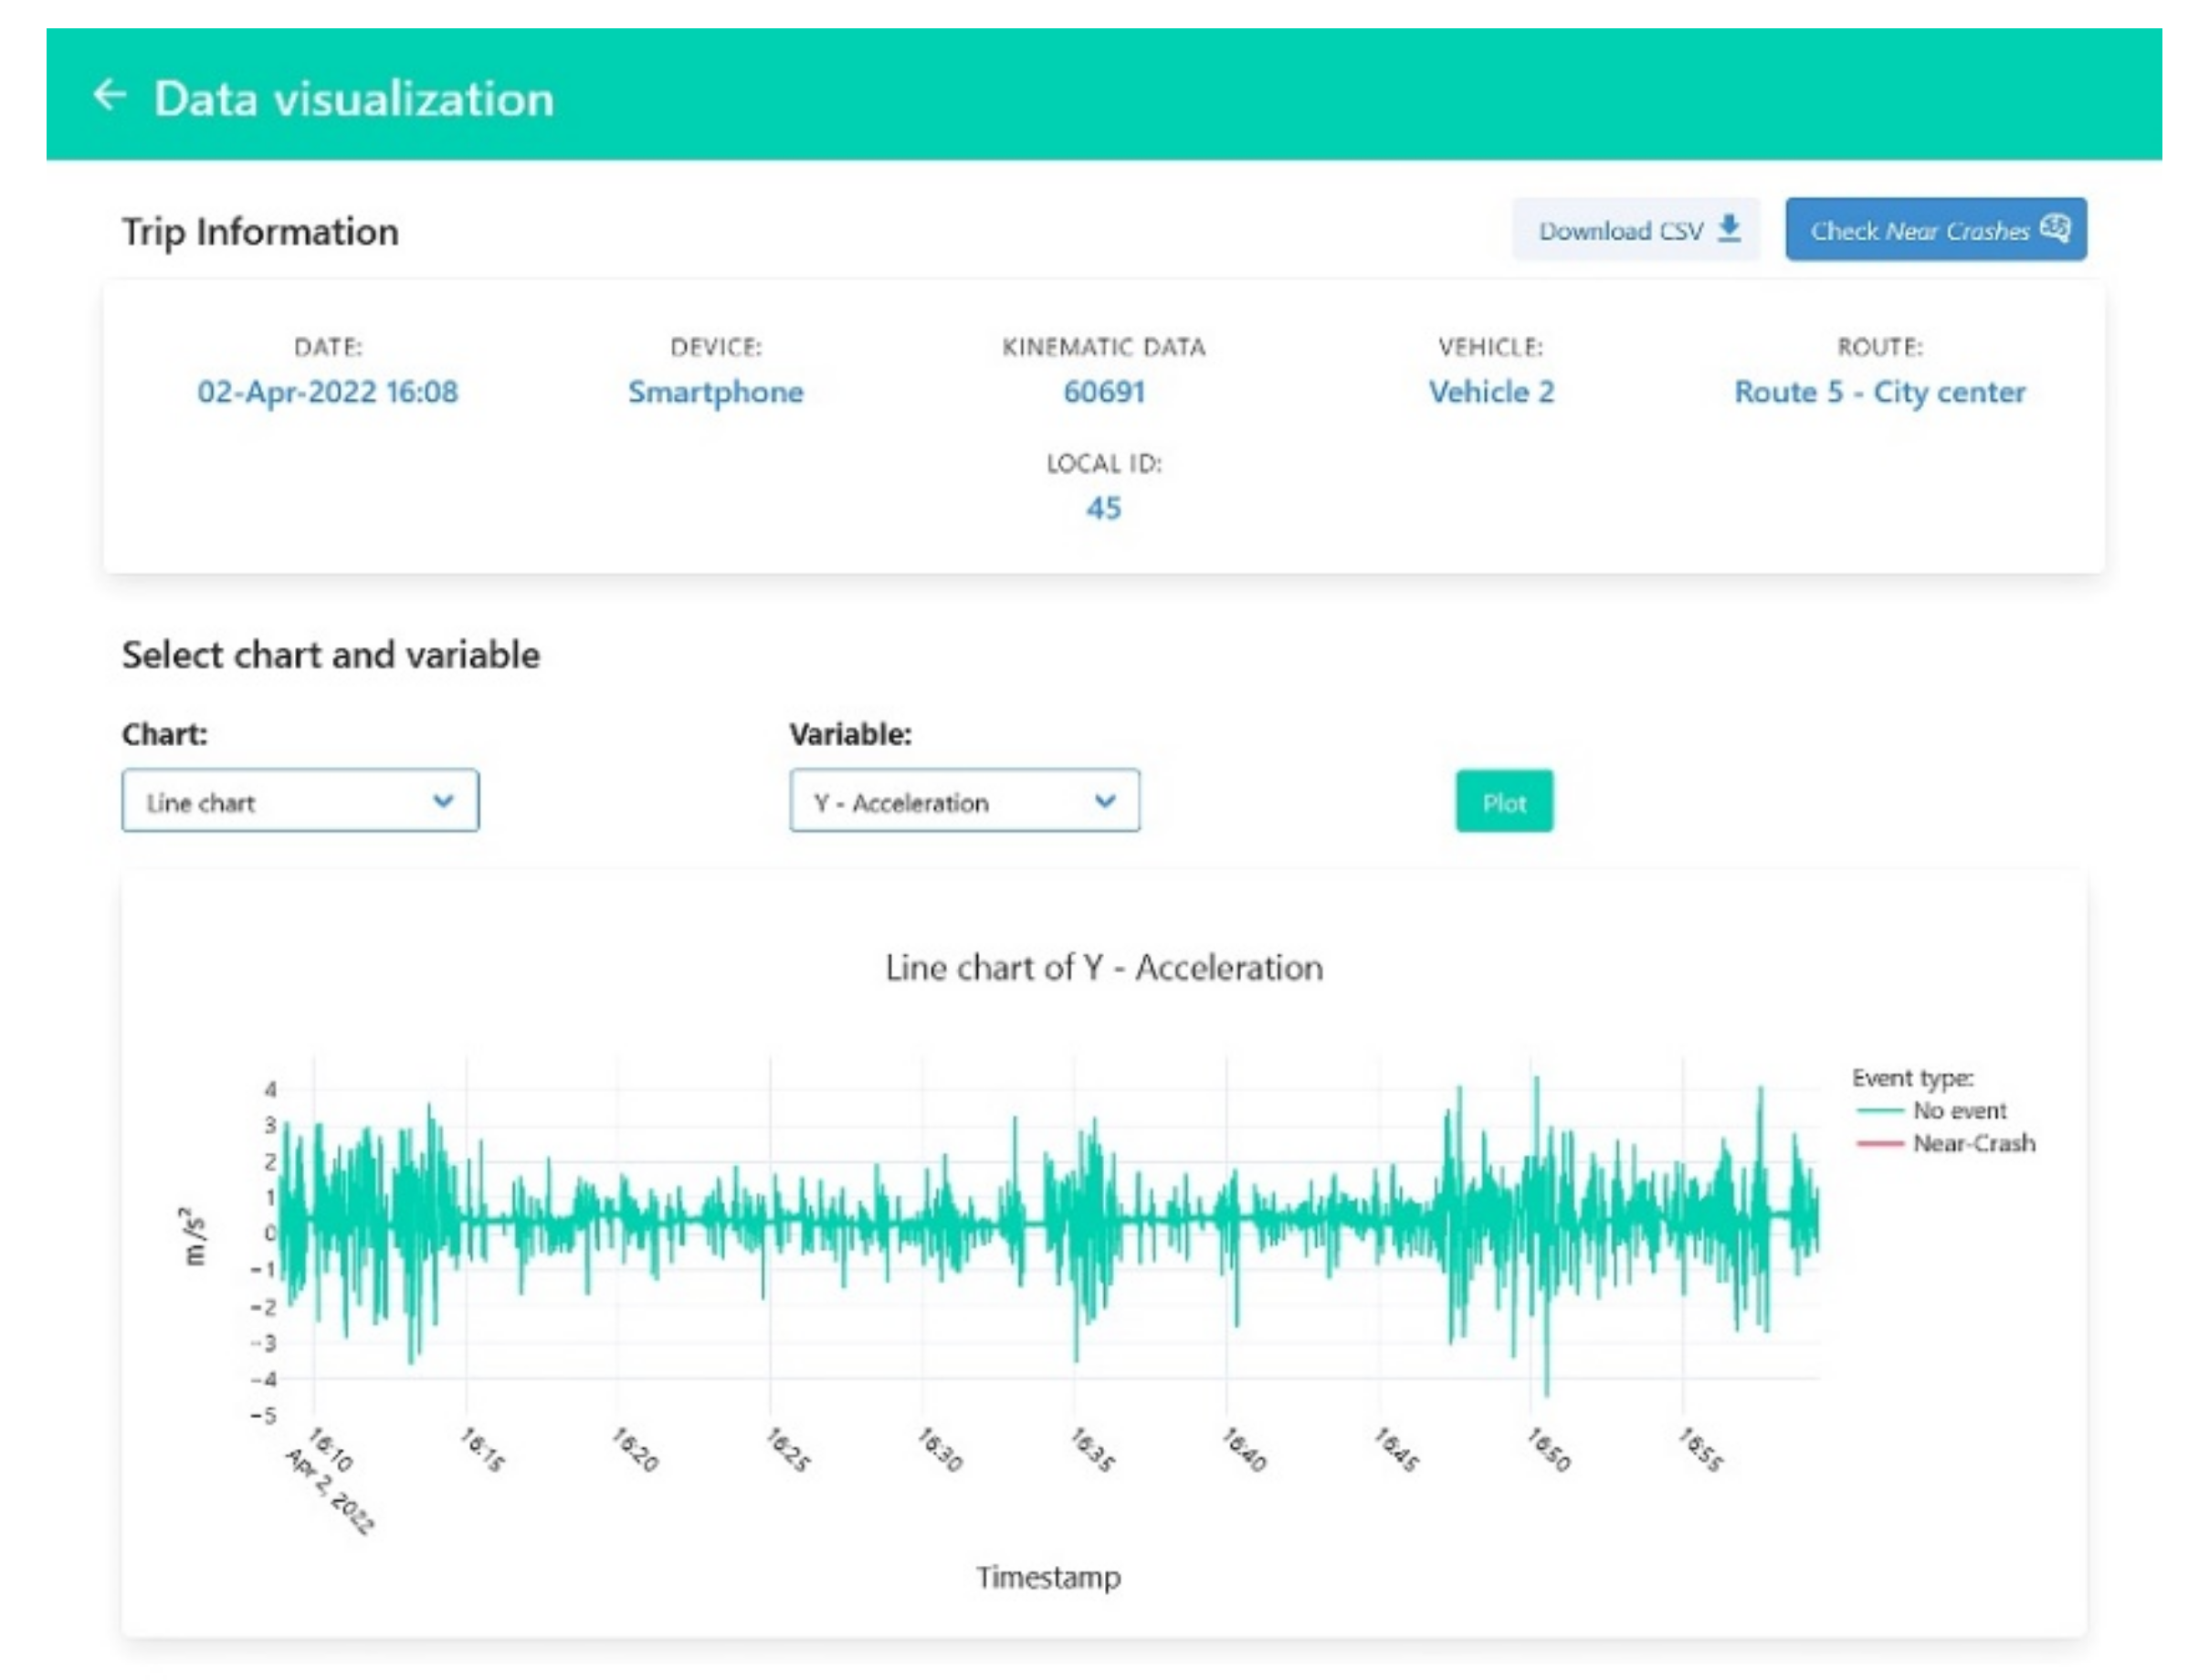
- Travel data management and analysis submodule.
- Results display submodule.
3.2. Results of the Controlled Tests for the Development of the ML Model
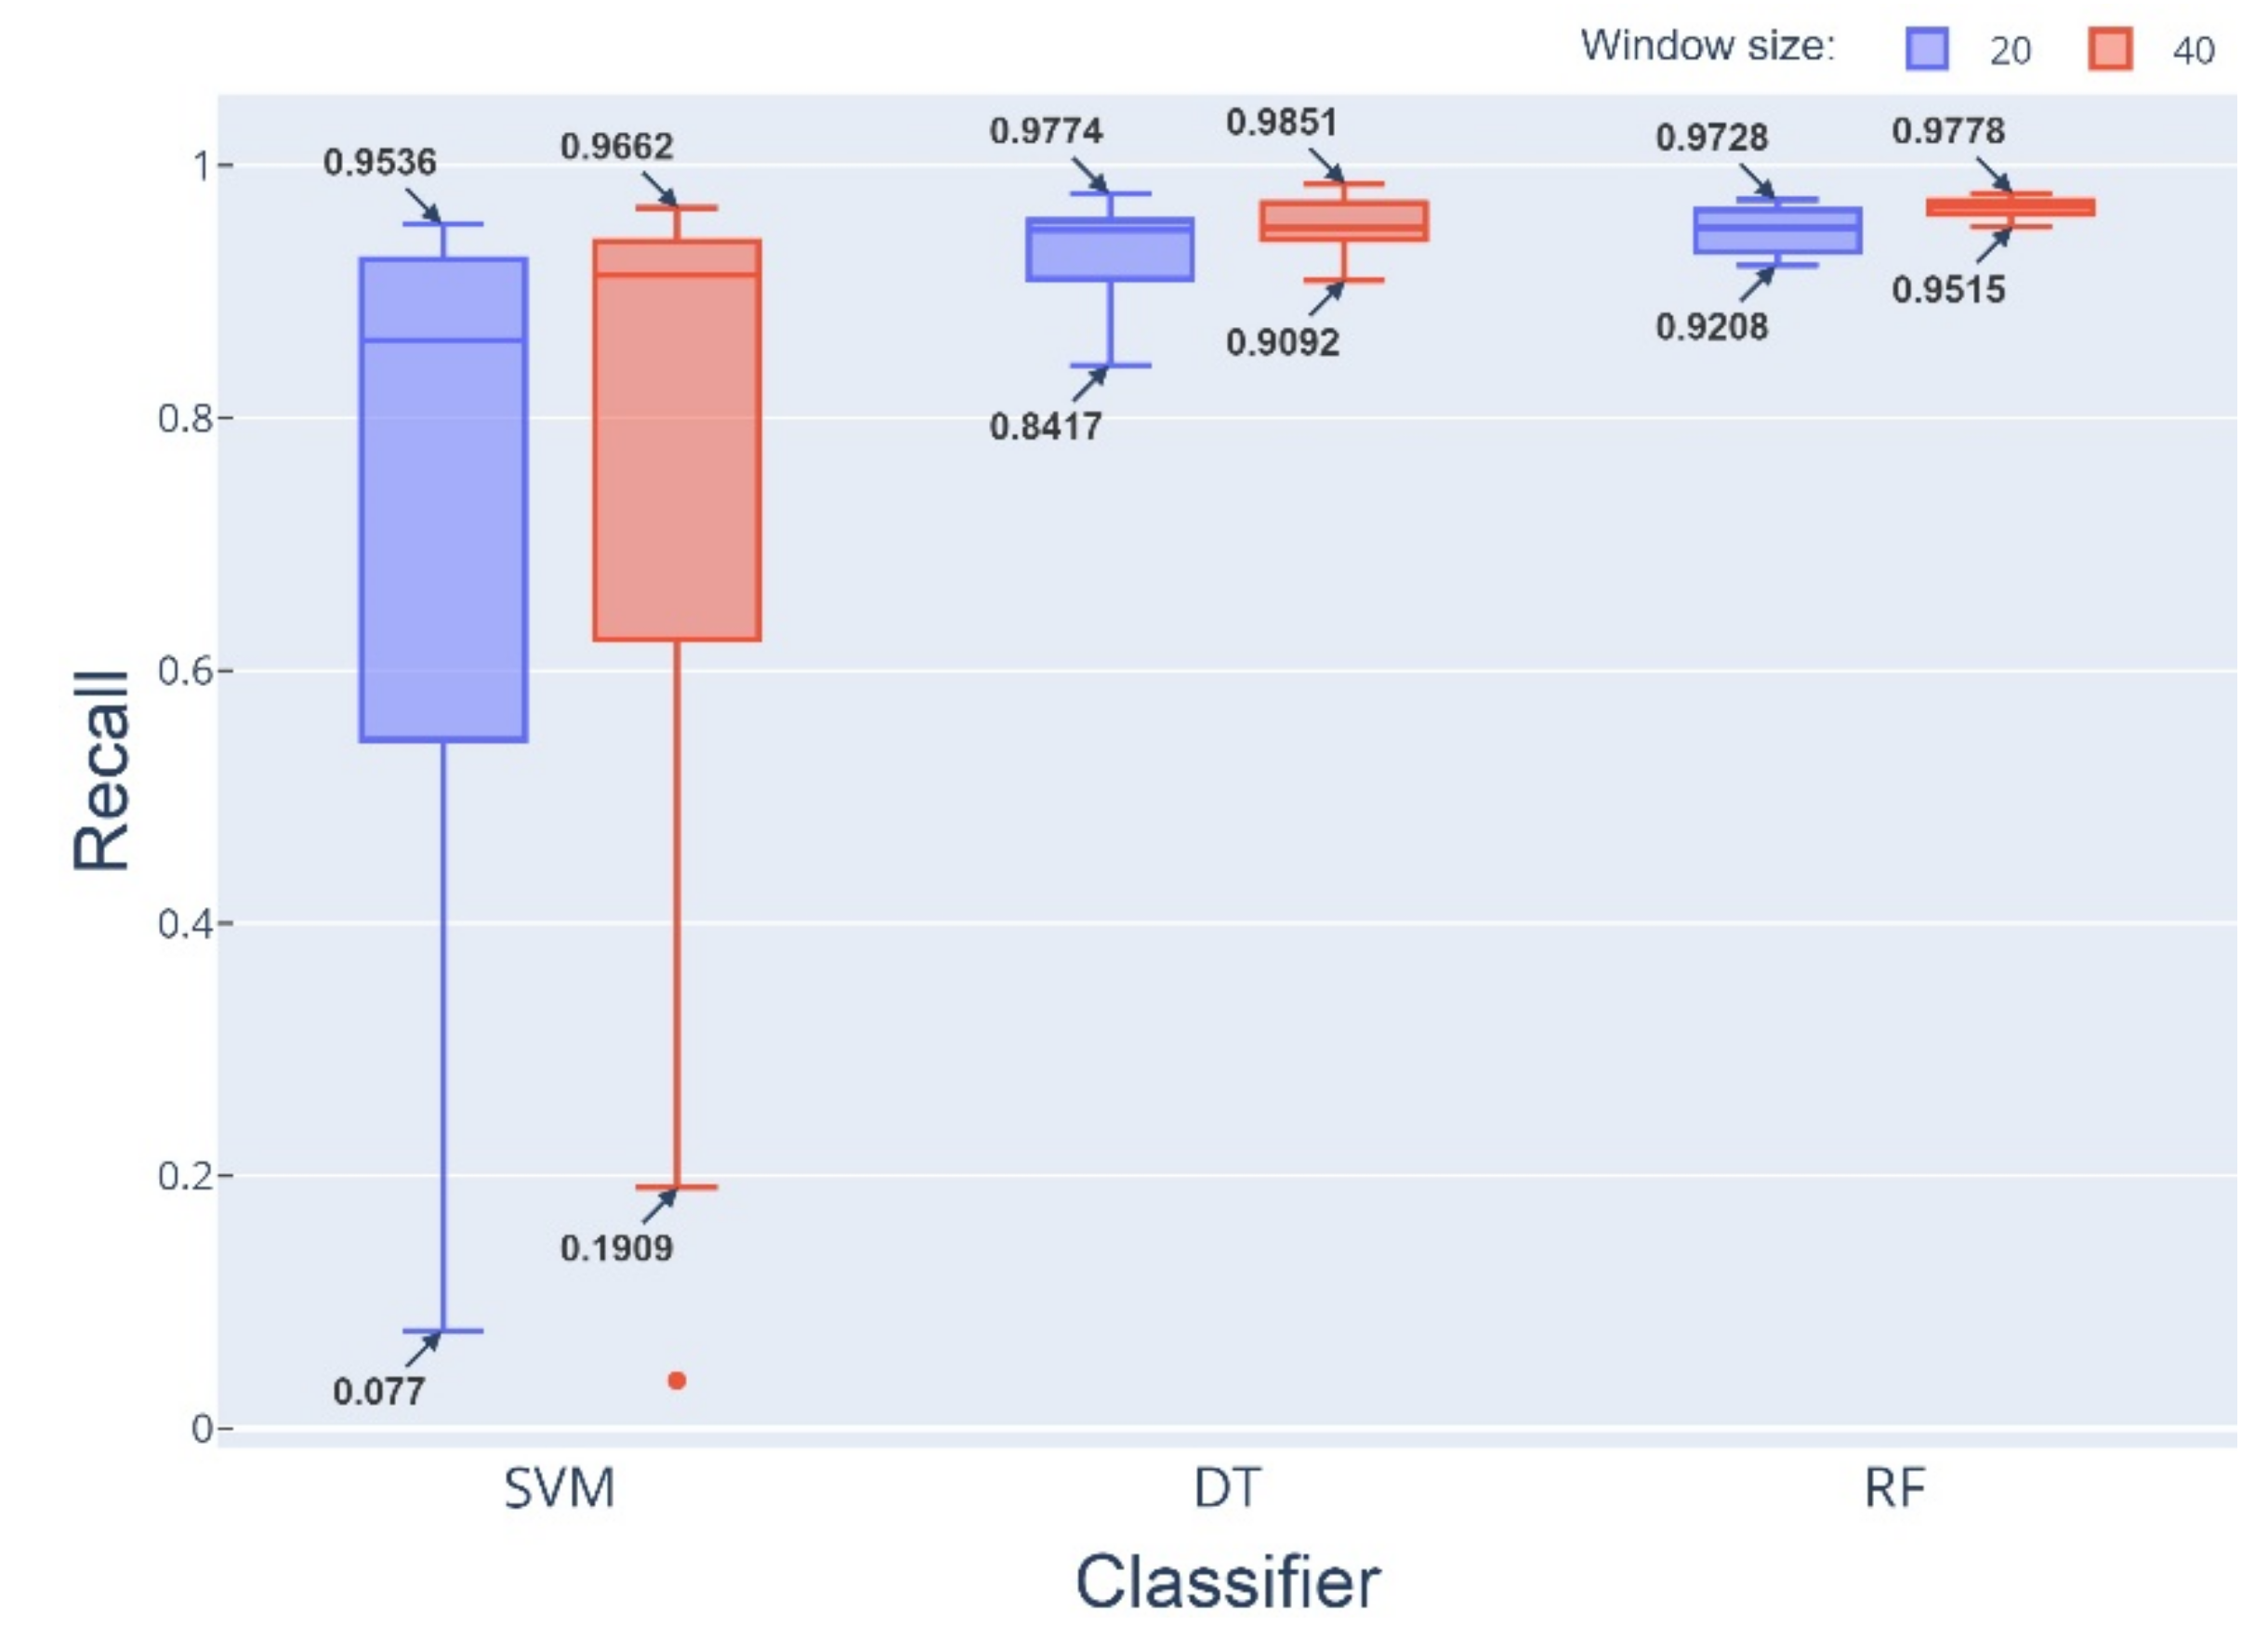
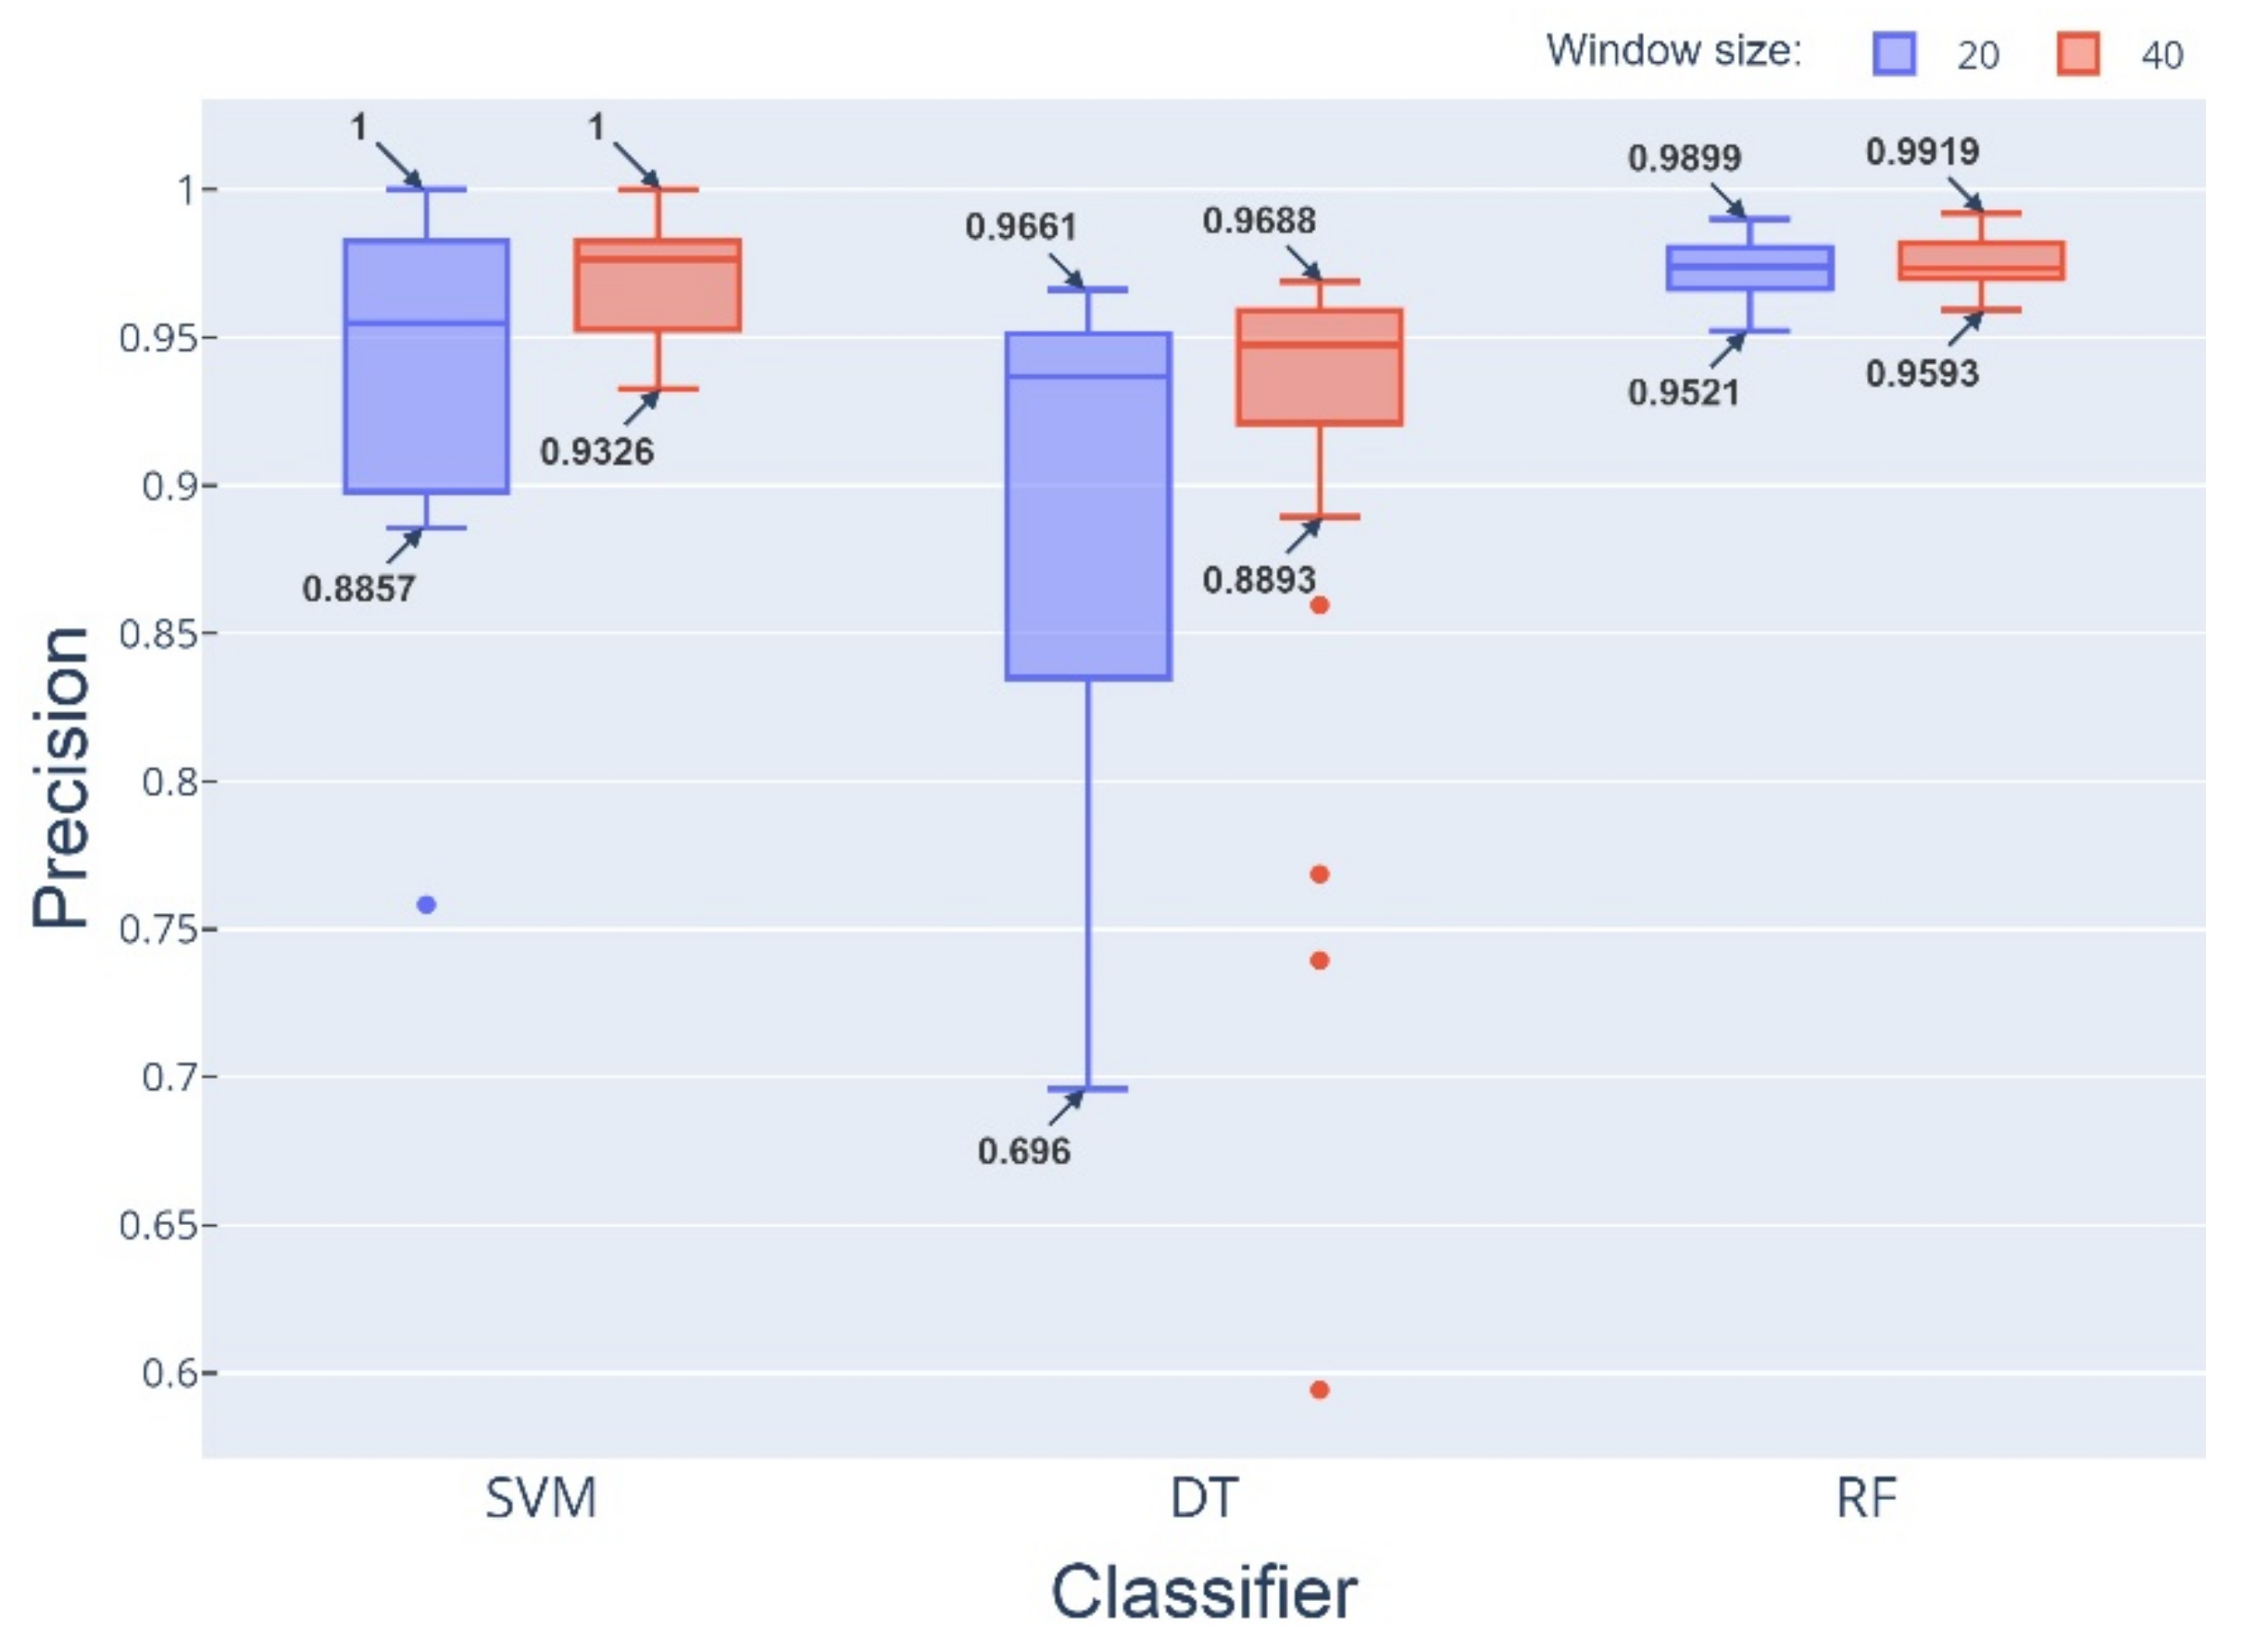
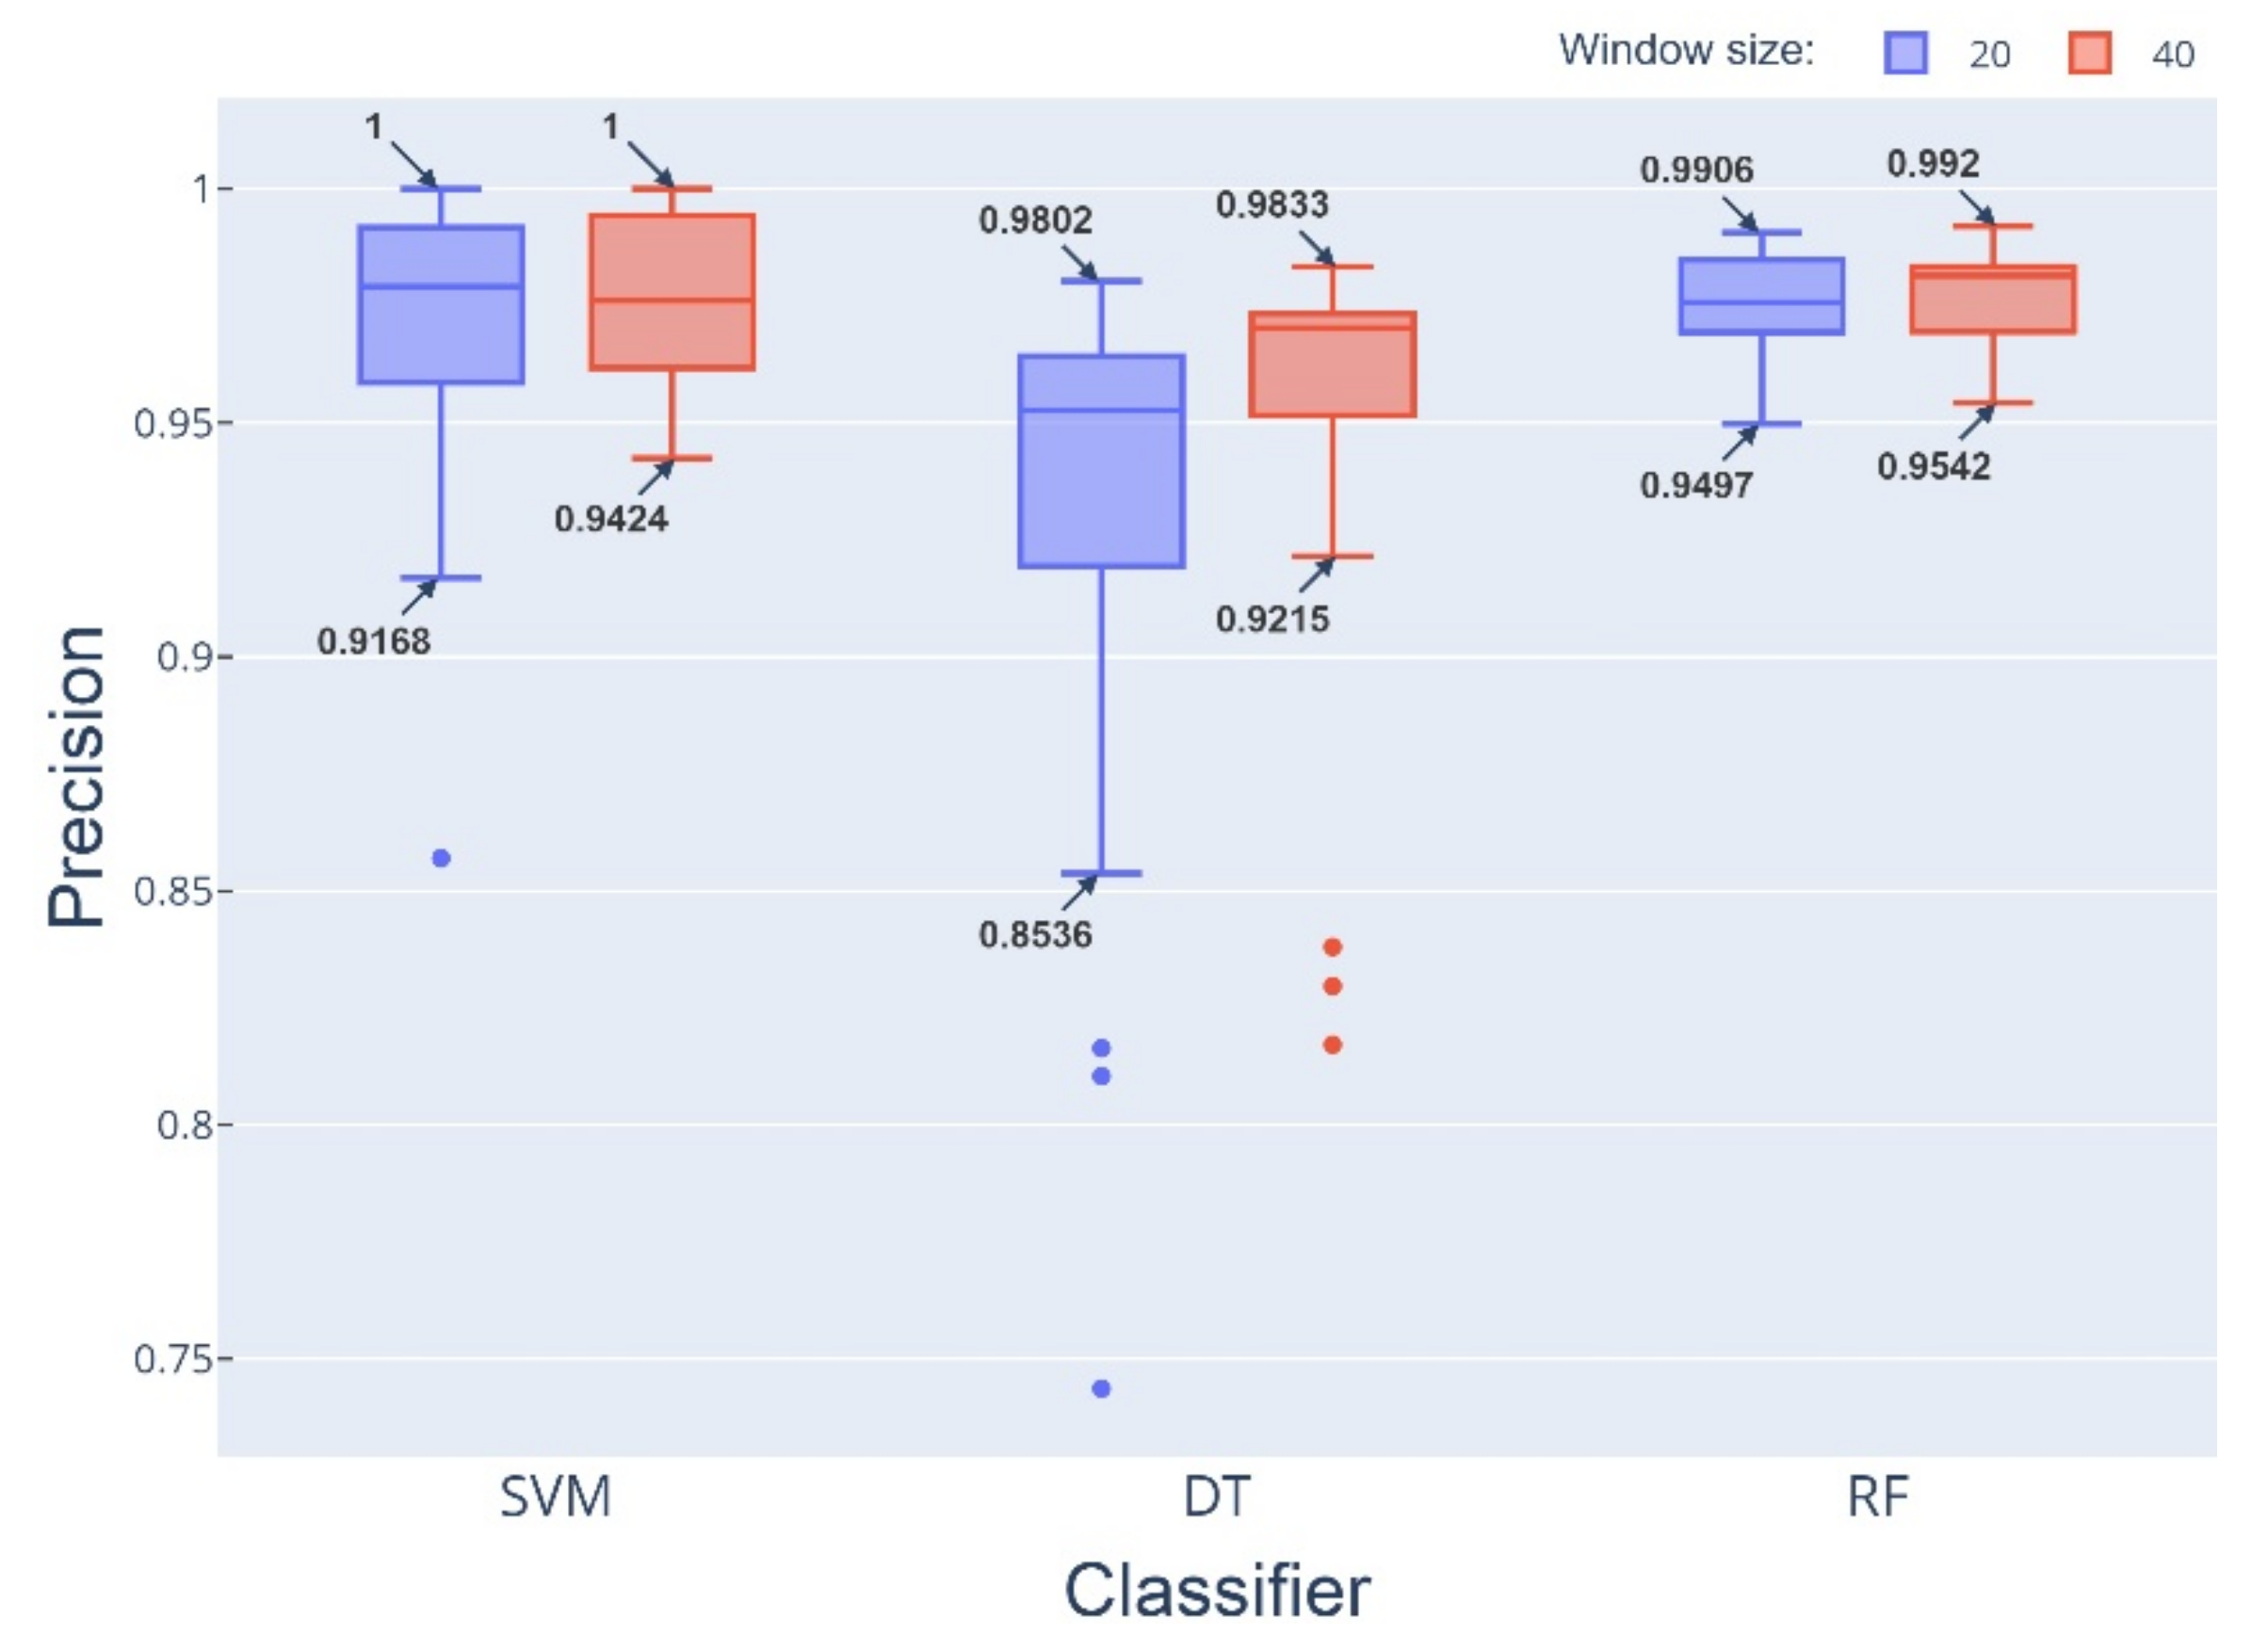
- The SVM algorithm reached a perfect precision in the maximum value of the box plot, but the RF algorithm had a better average in this metric.
- The SVM algorithm presented many variations in the distribution of the precision performance values, unlike the RF algorithm.
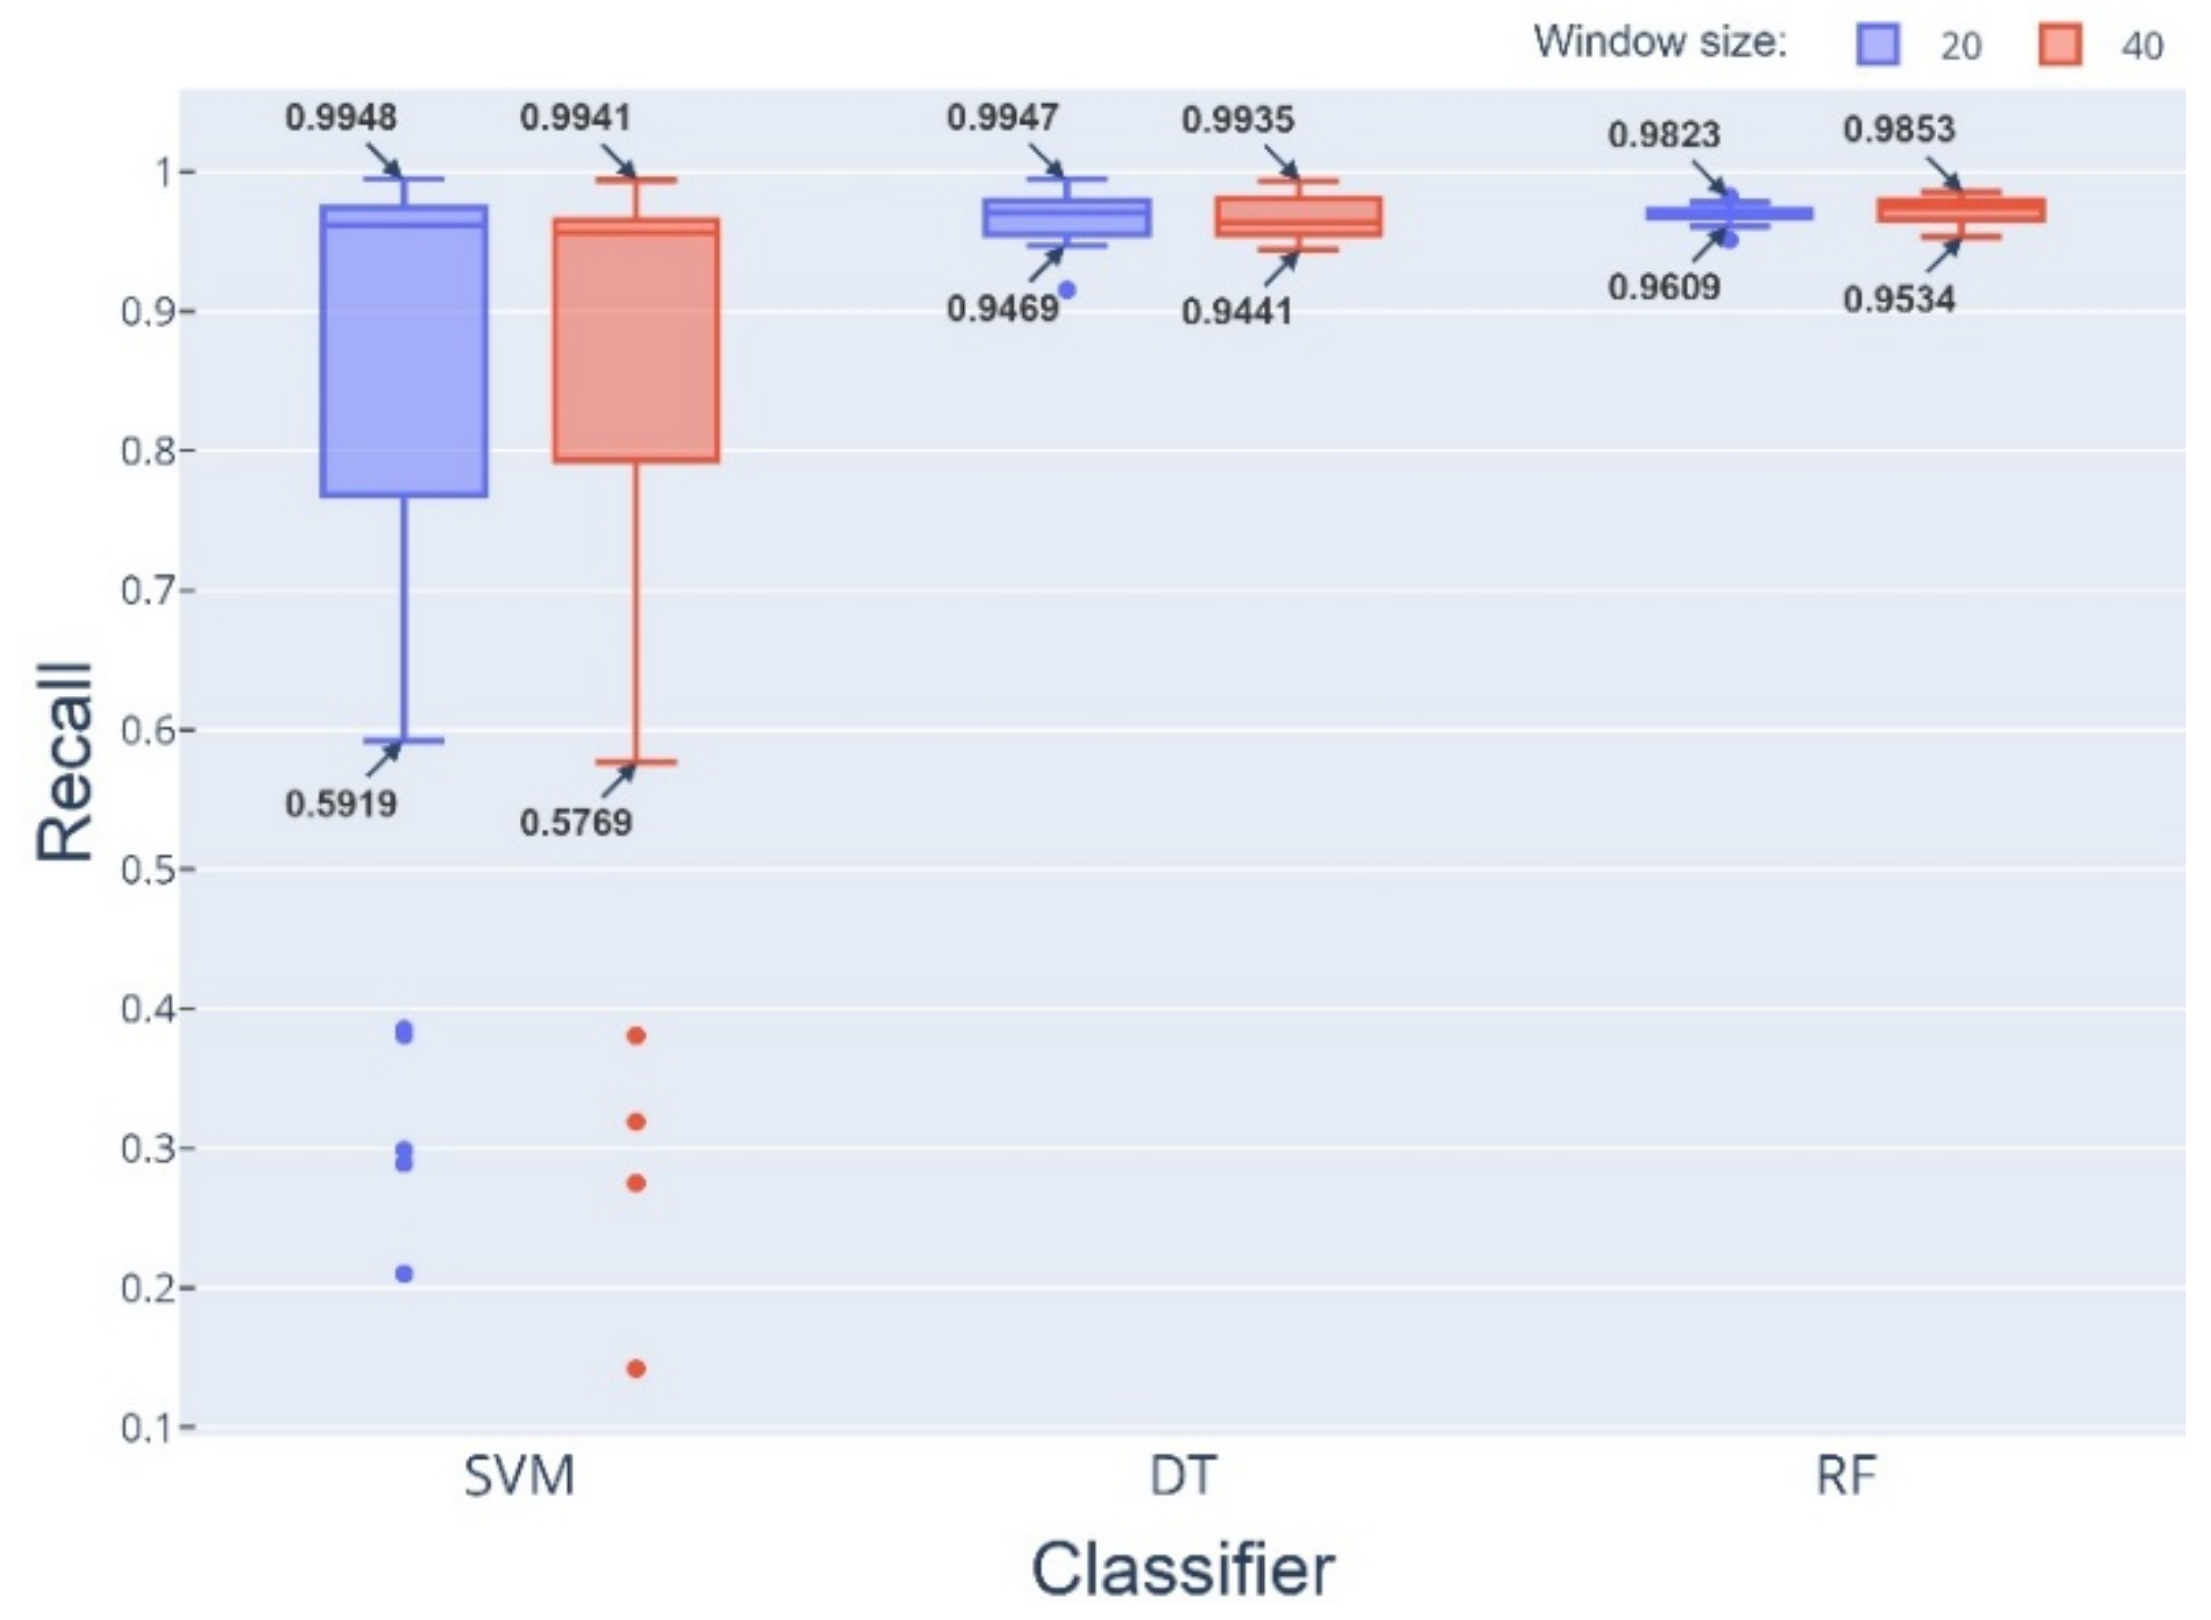
- The RF algorithm obtained the best performance in the results of the recall metric using a time window of 40 samples.
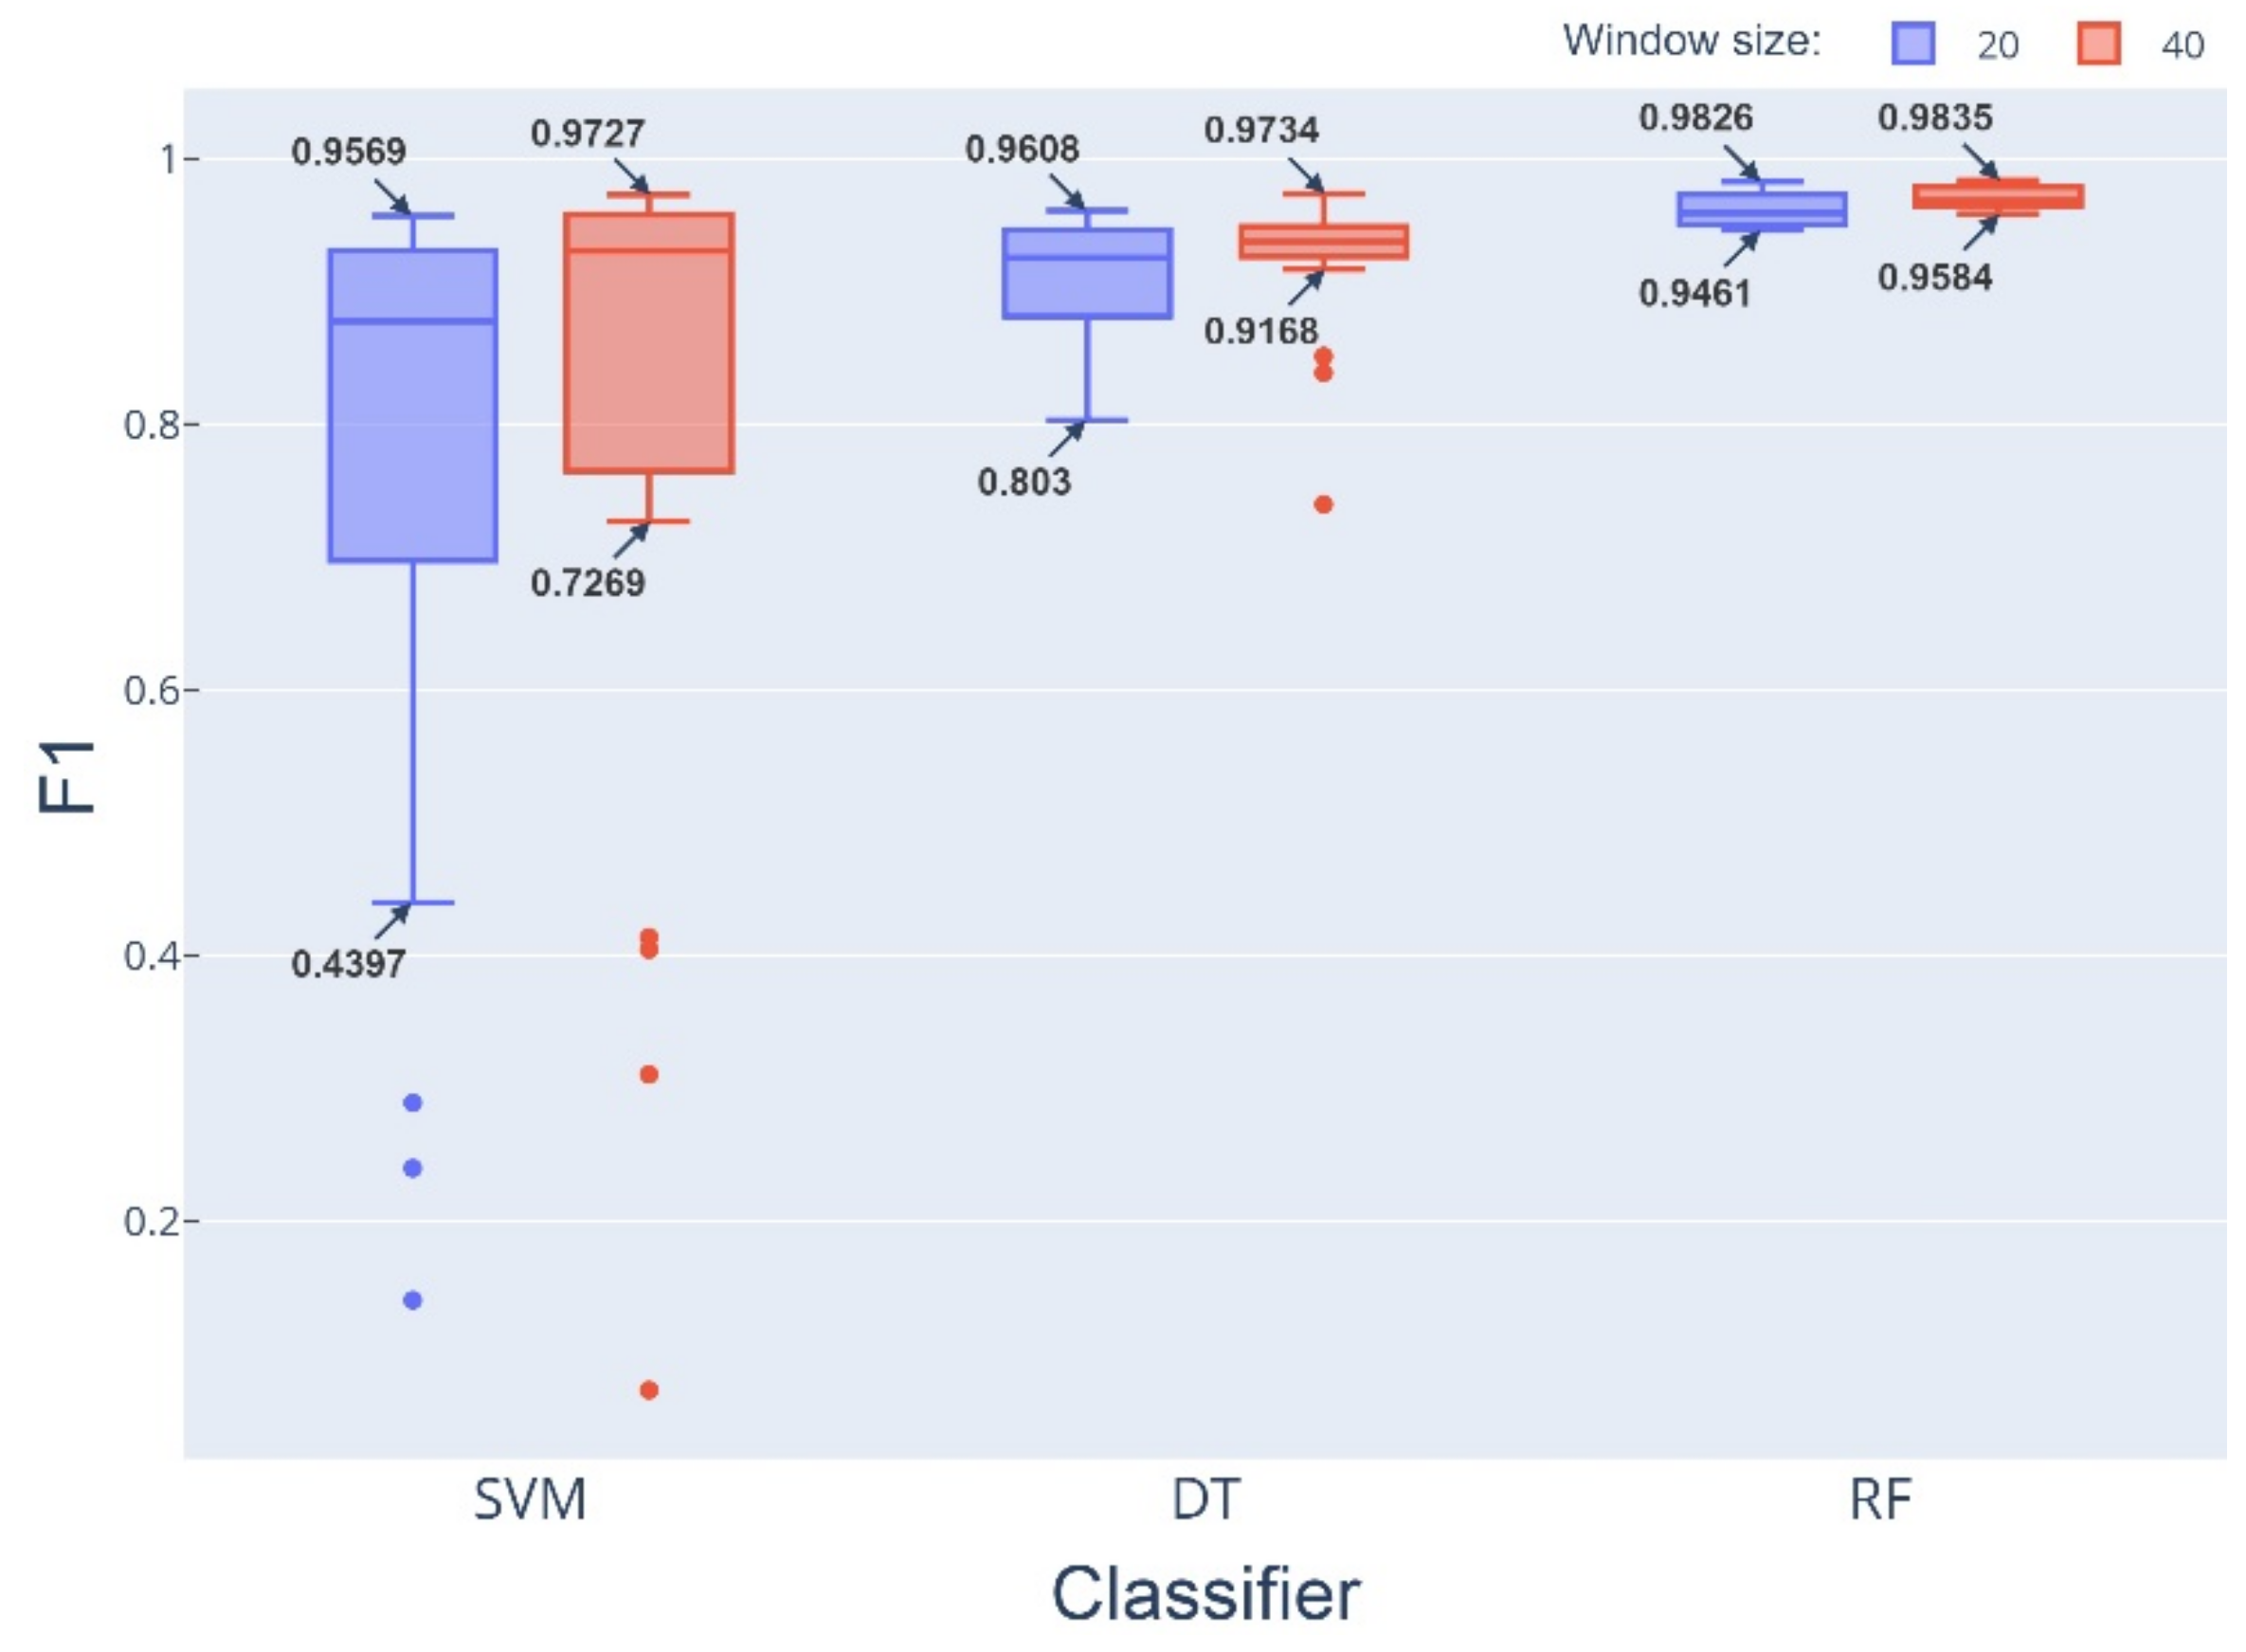
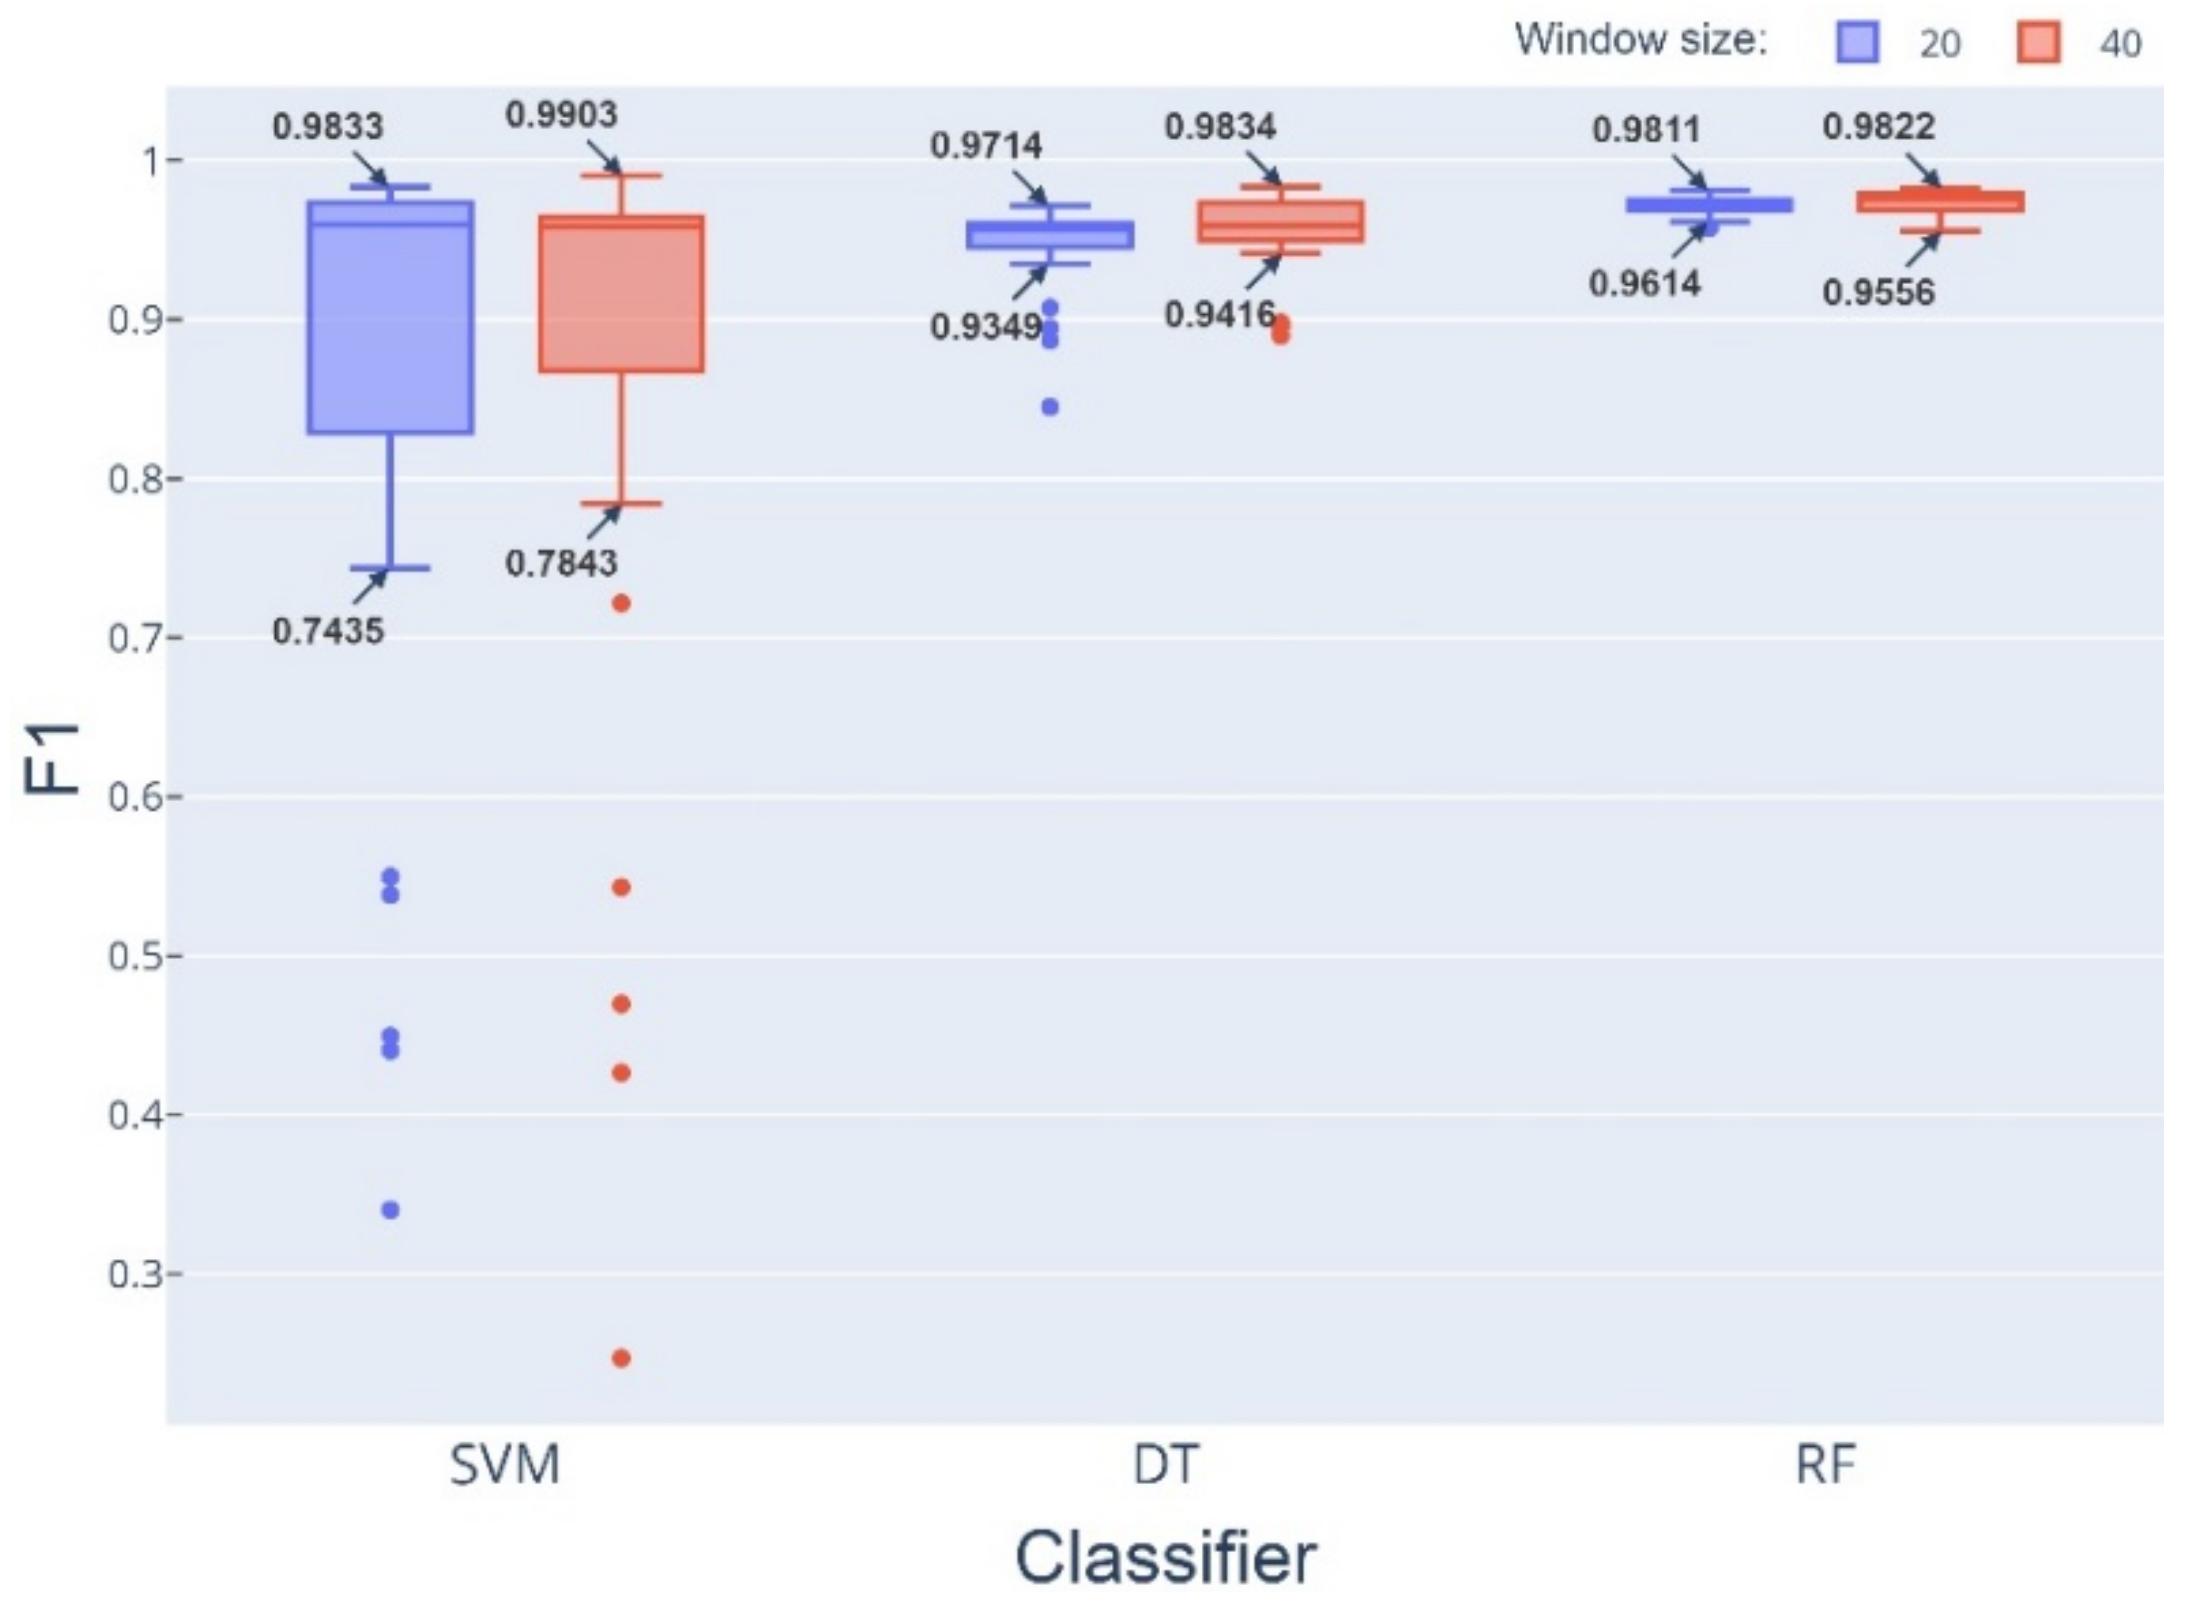
- The results of the recall and F1-score metrics were similar for the three algorithms, but in the case of F1-score, the SVM and DT presented several outliers.
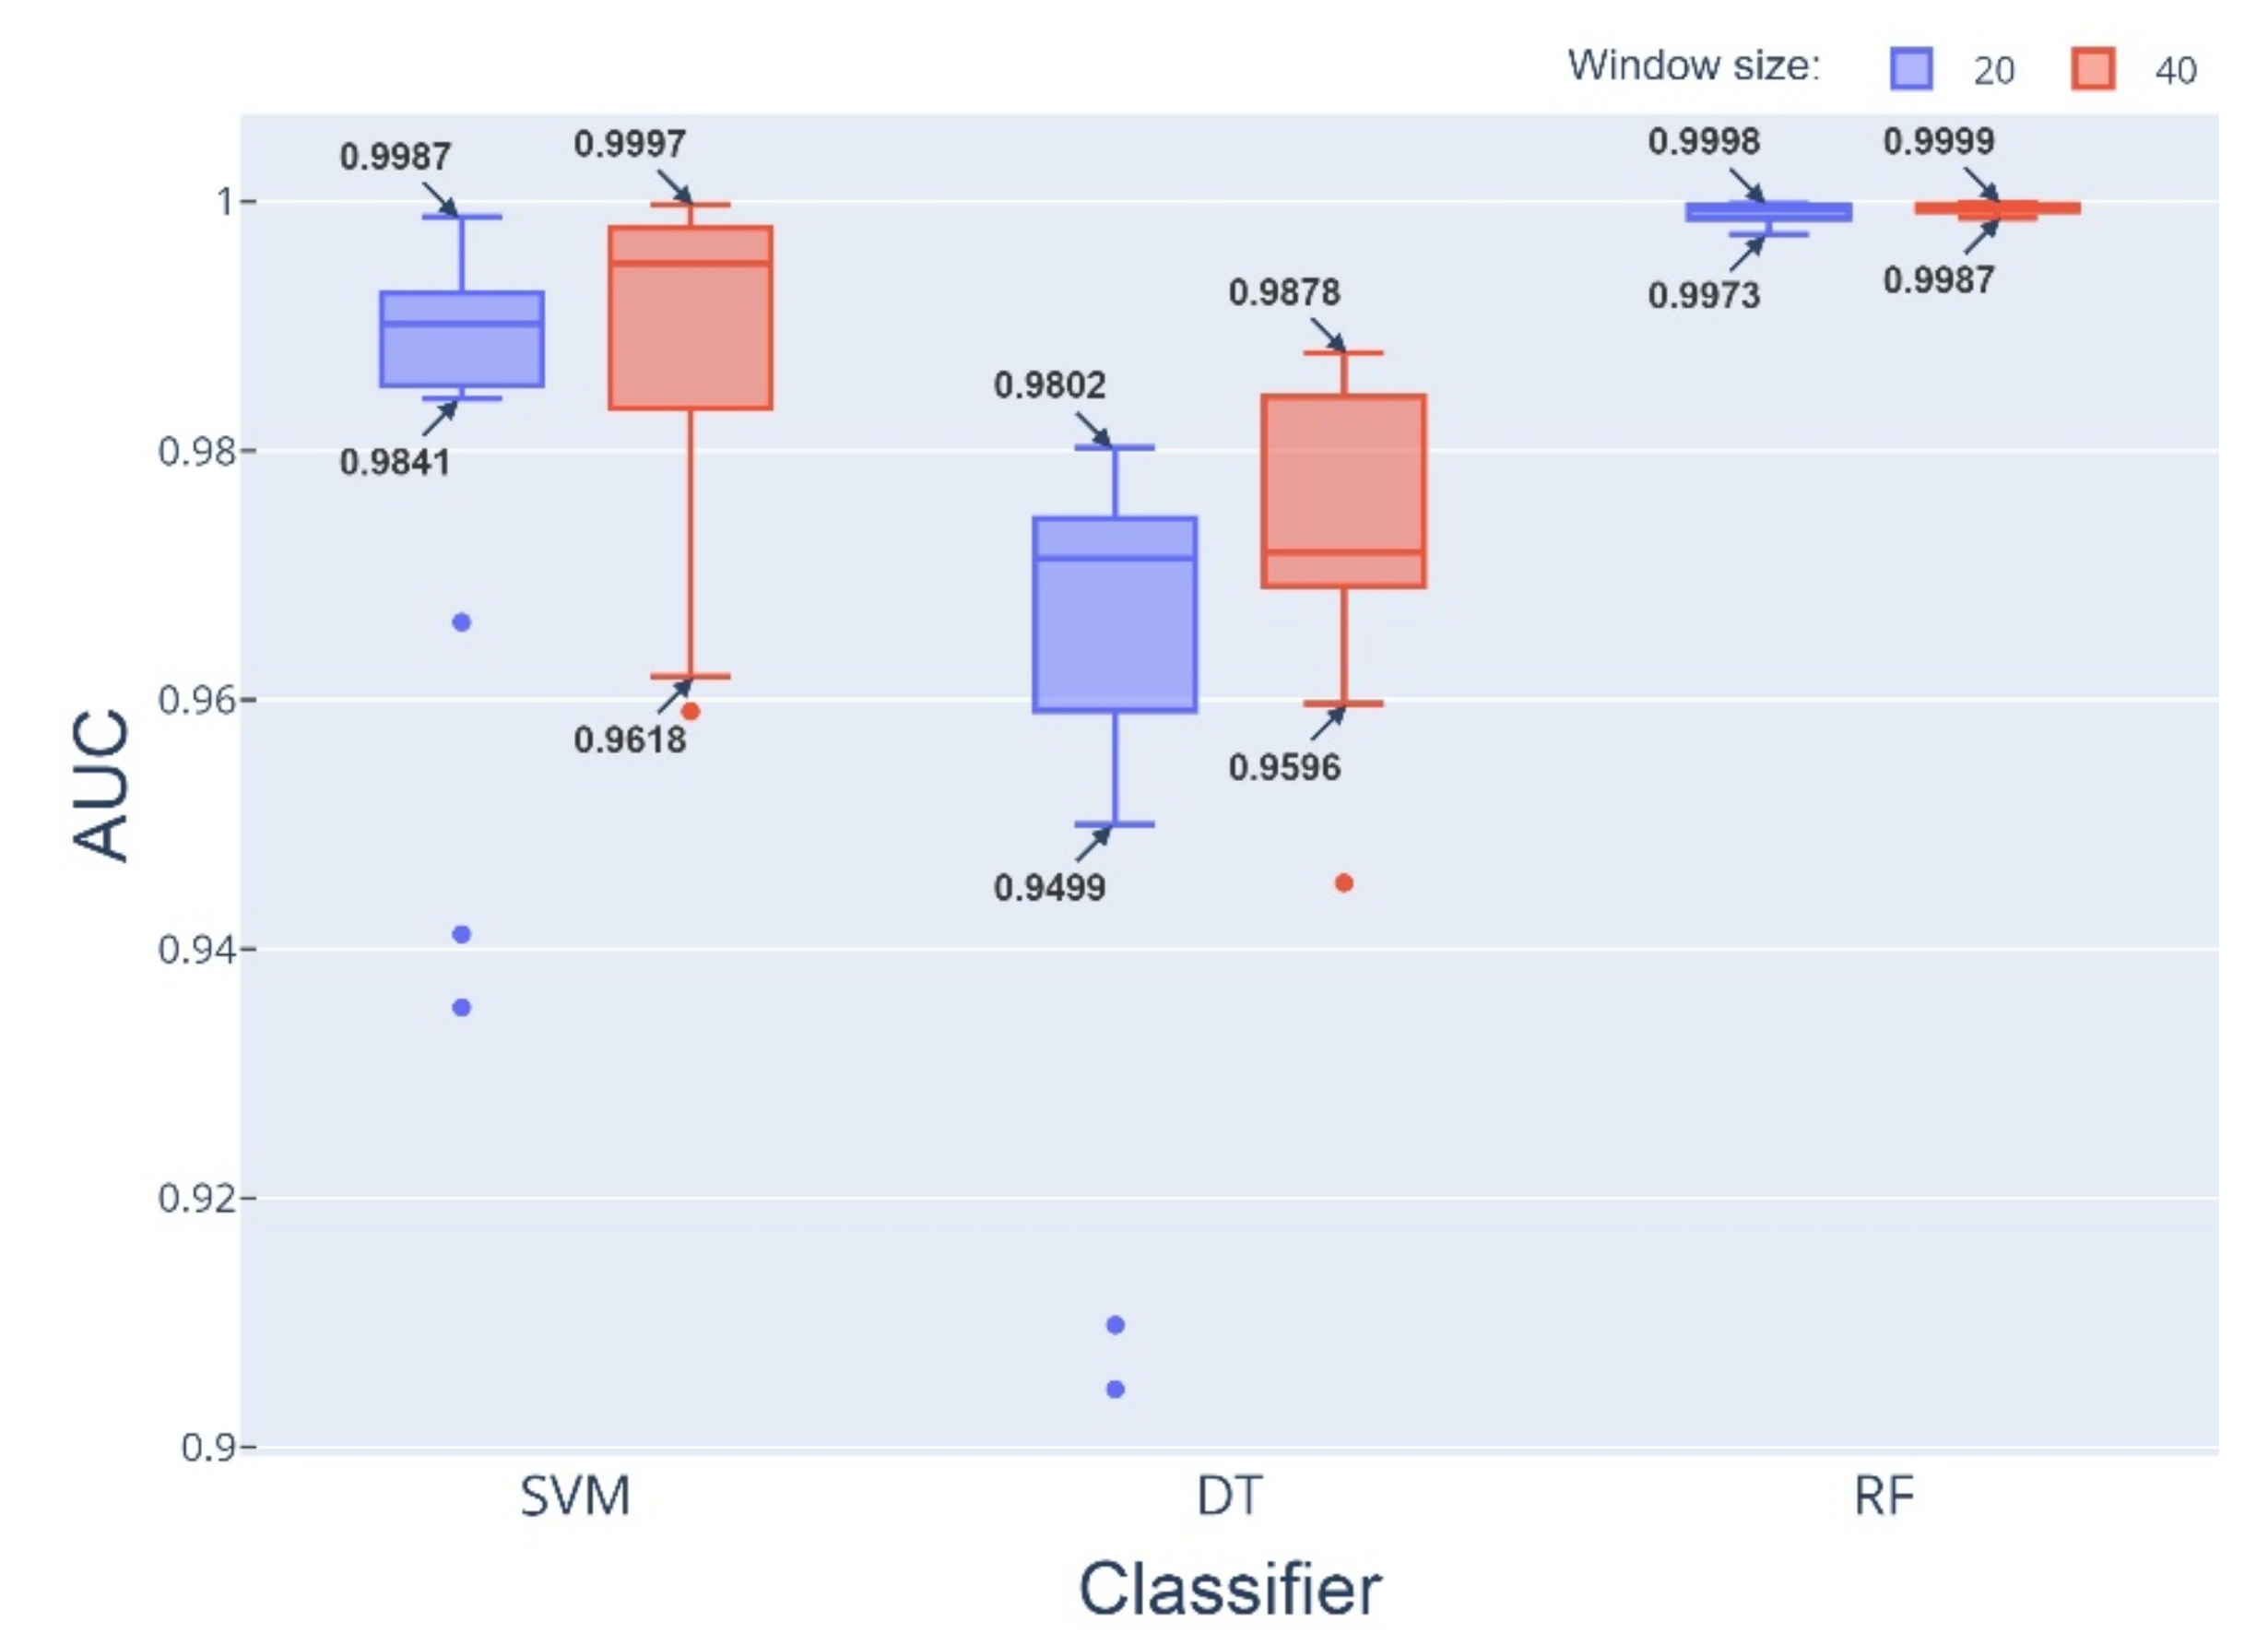
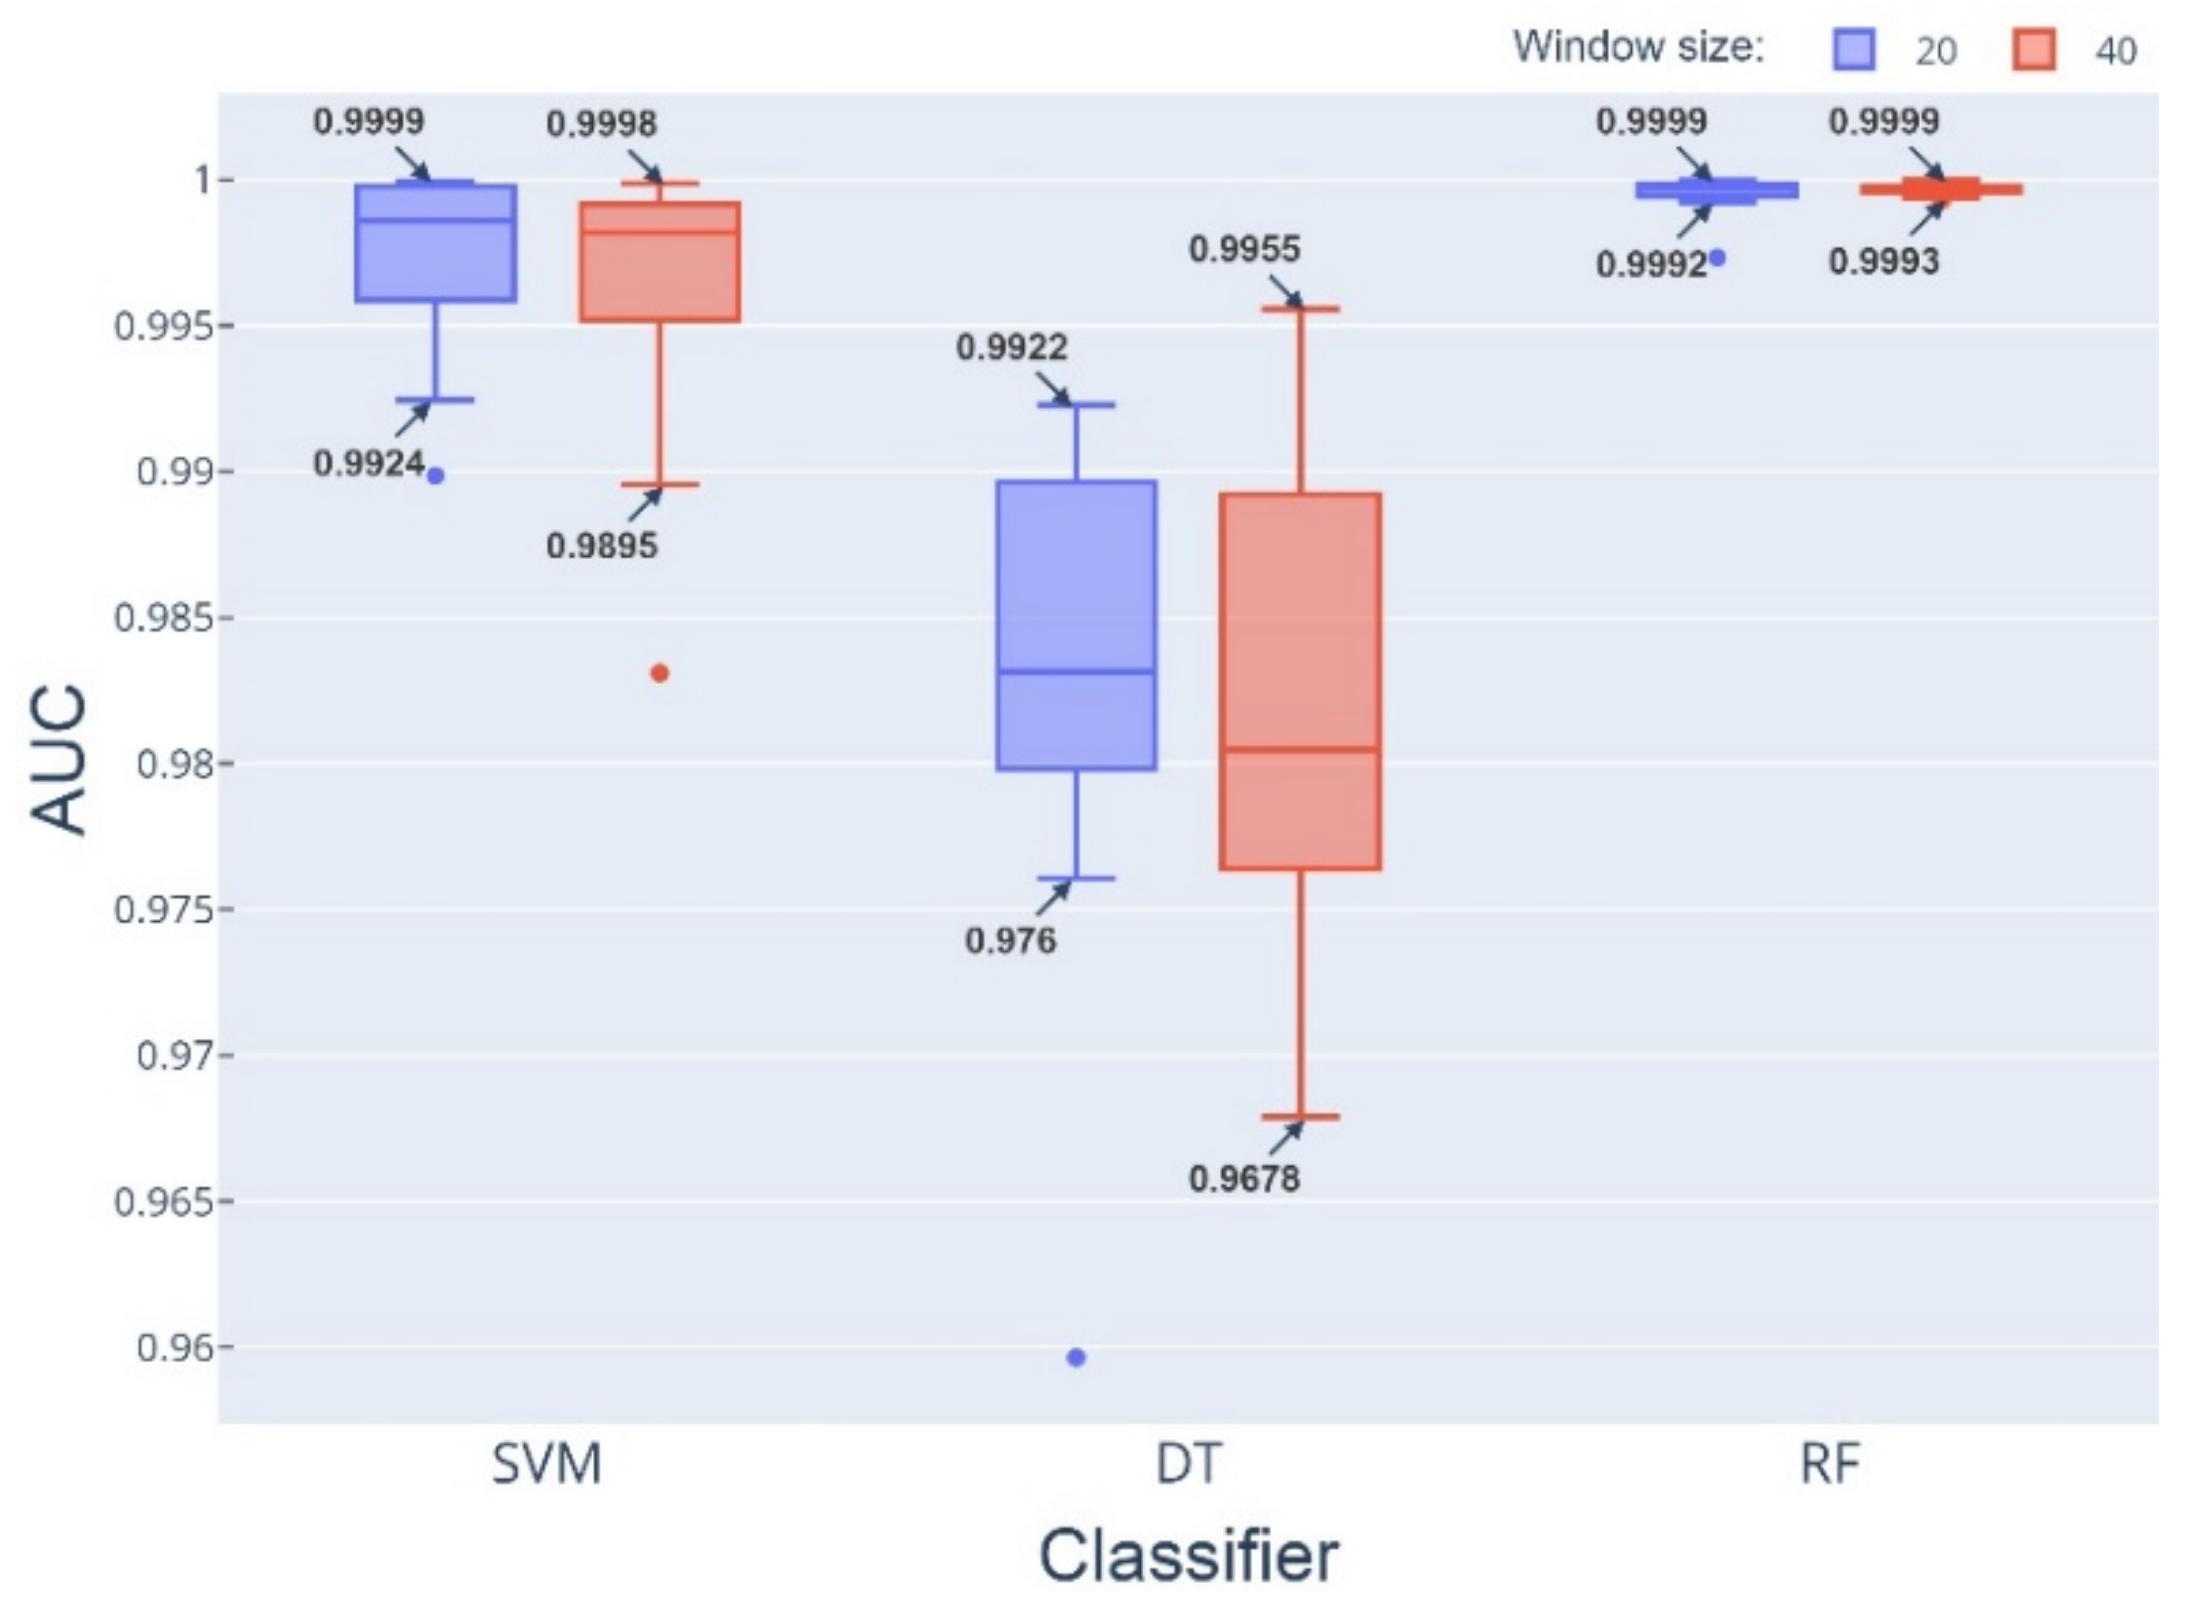
- The performance achieved by the three algorithms in the results of the AUC metric had stable and high values (greater than 0.9).
- The SVM algorithm reached a perfect precision in the maximum value of the box plot, but the RF algorithm had a better average for the case of a time window with 40 samples.
- The DT and RF algorithms performed well on the recall and F1-score metrics, while the SVM algorithm performed poorly.
- The SVM algorithm presented a large number of outliers in the results of the recall and “F1-score” metrics.
- The performance of the AUC metric was again the best for each of the algorithms, achieving values greater than 0.96 and with few outliers.
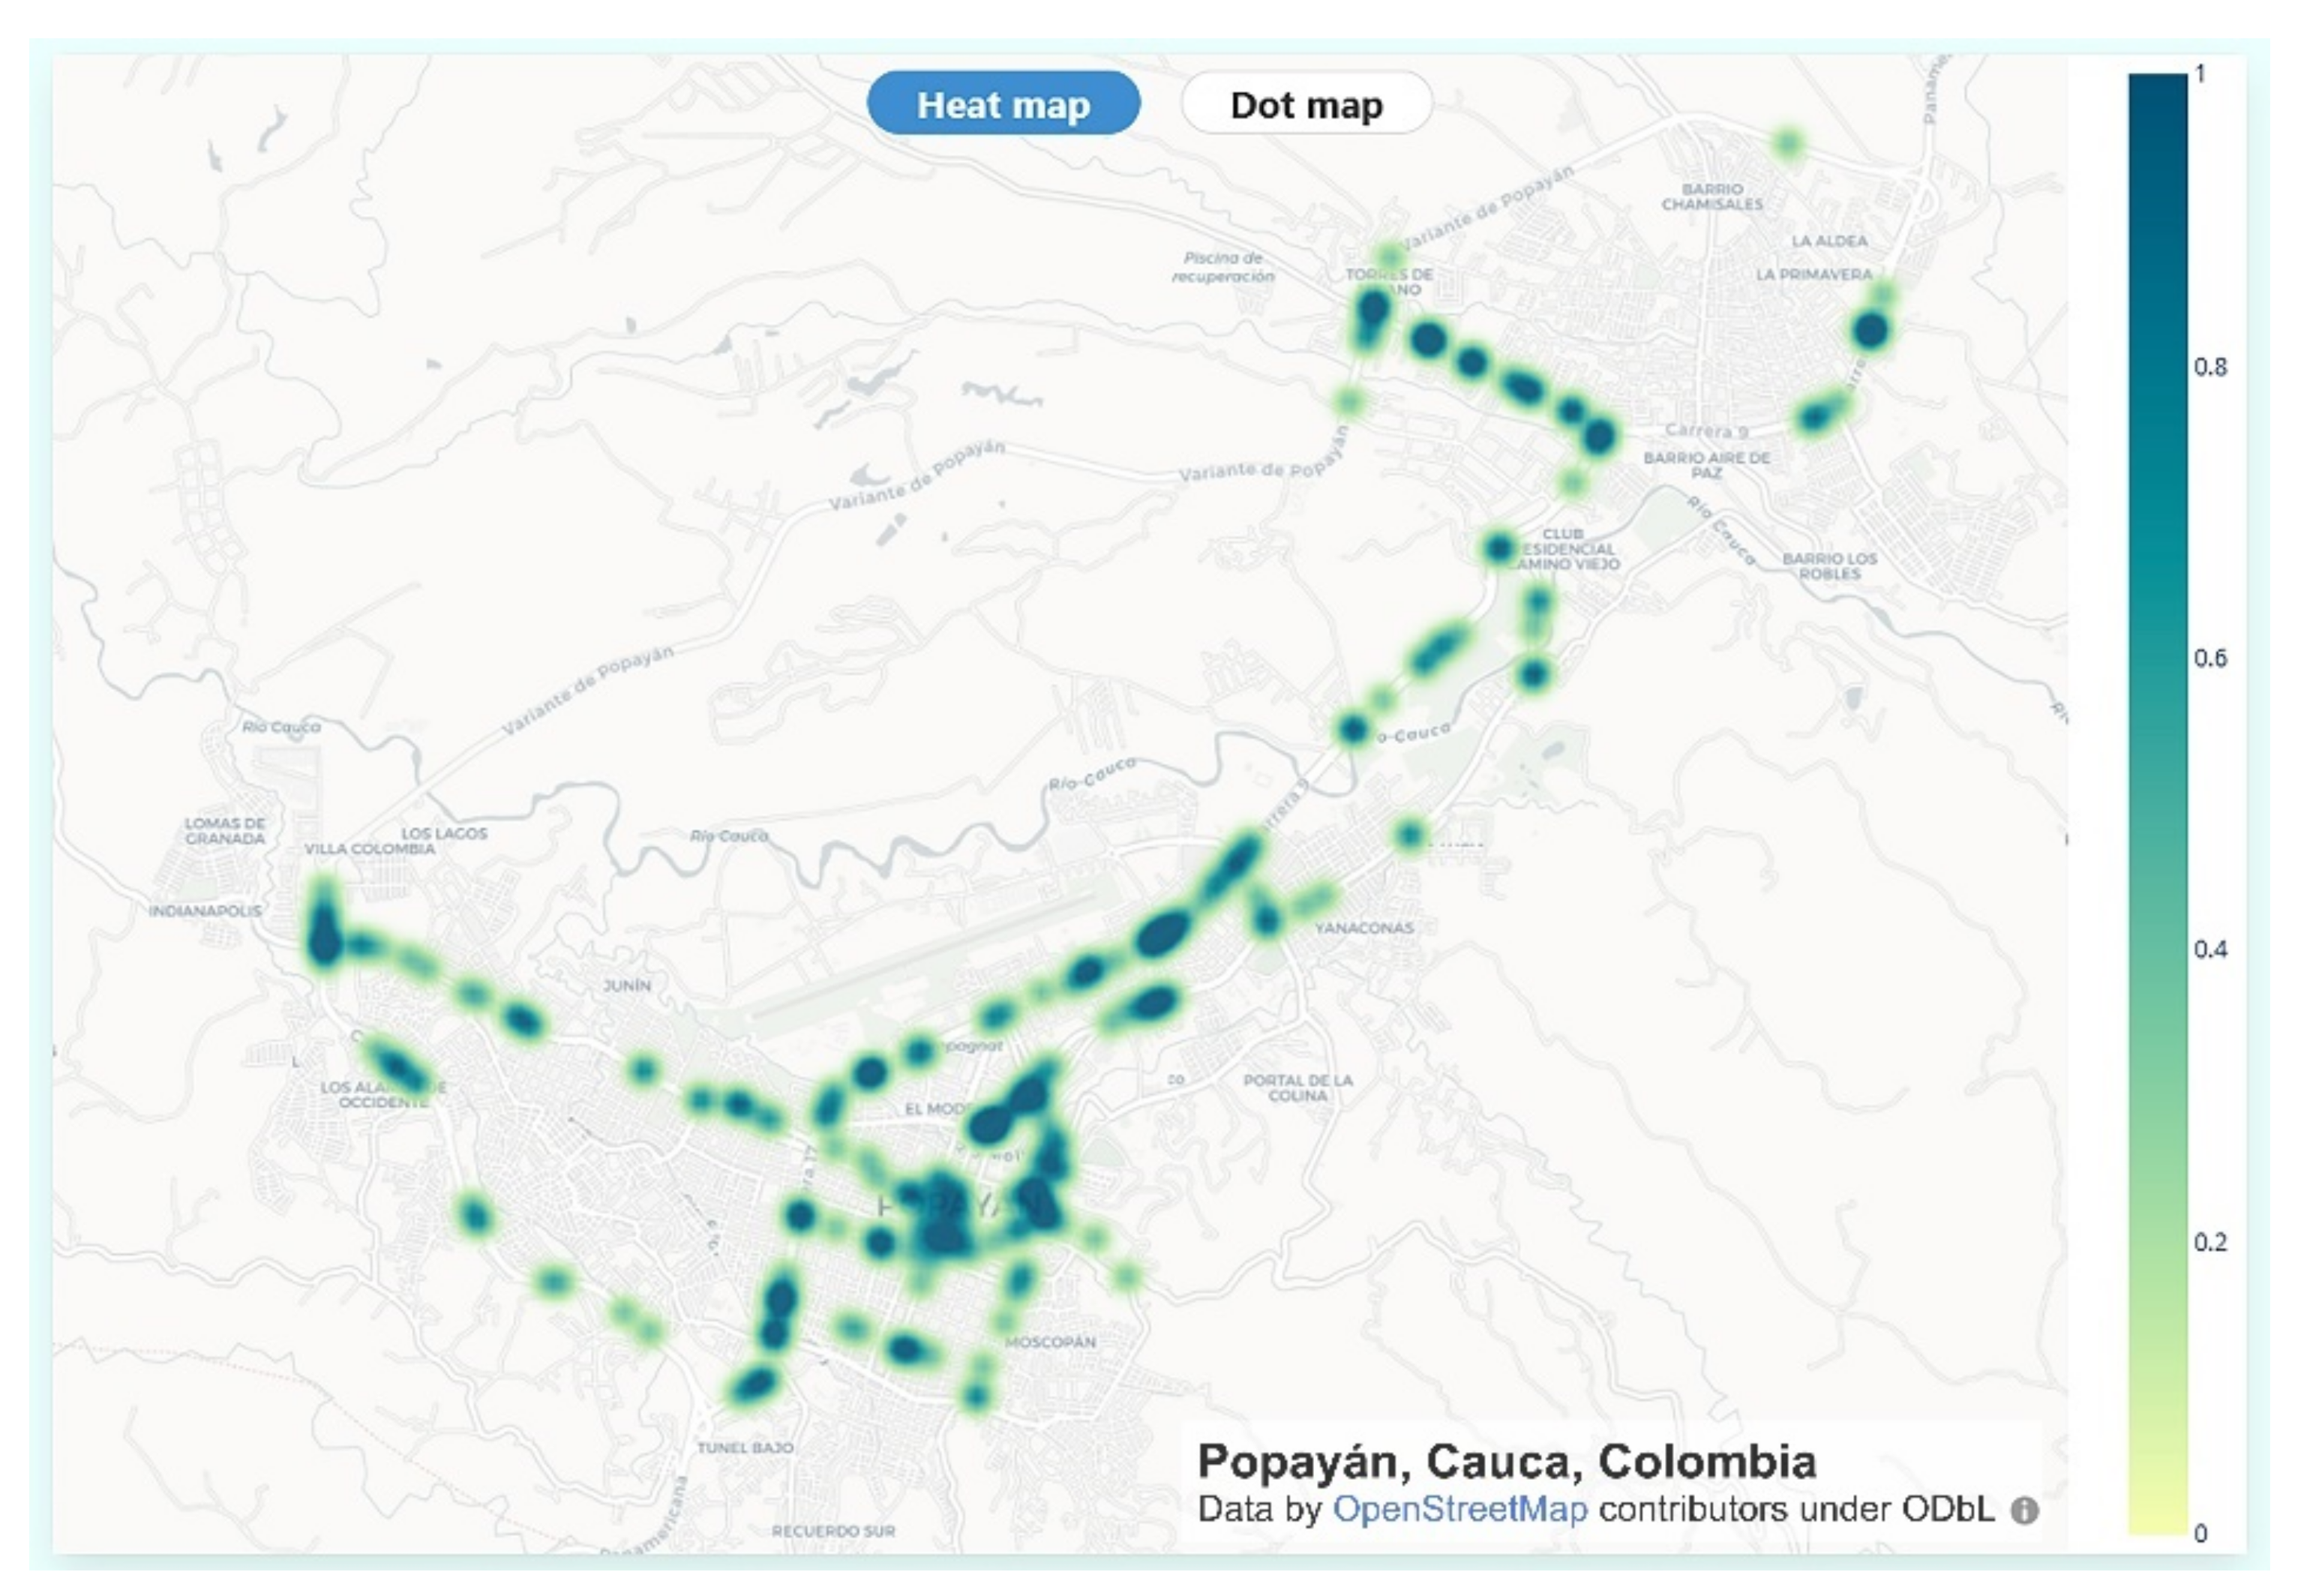
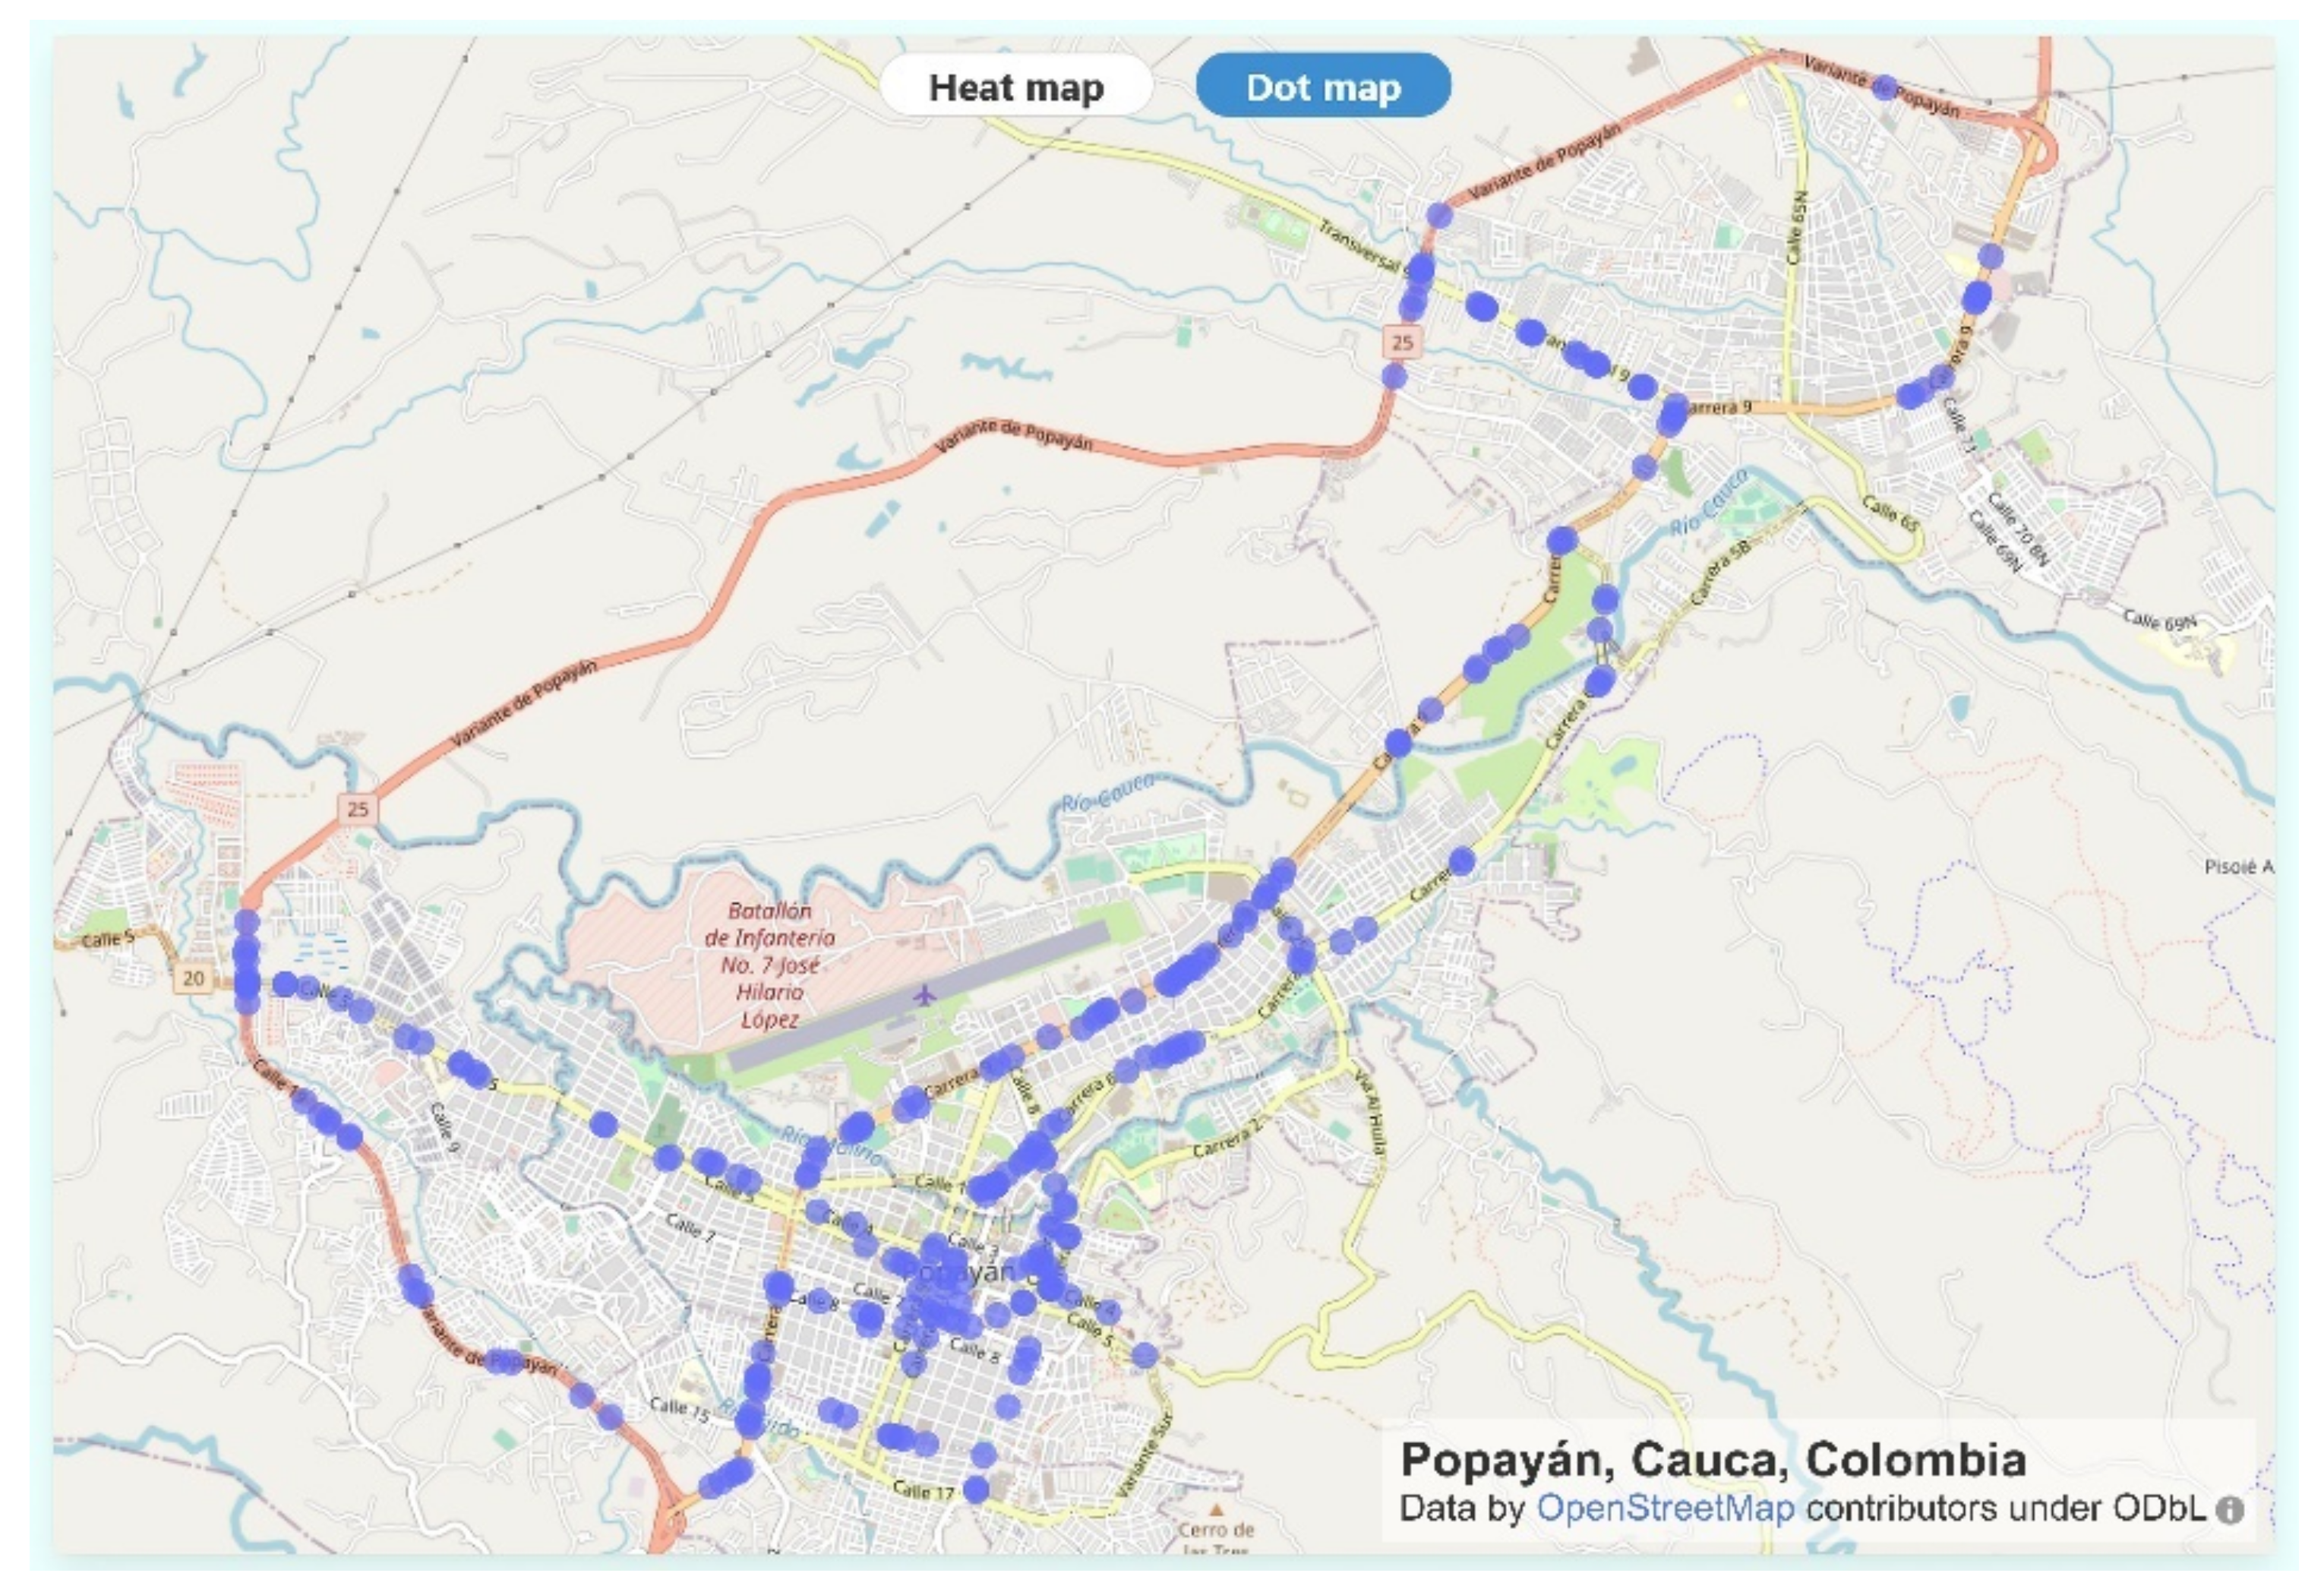
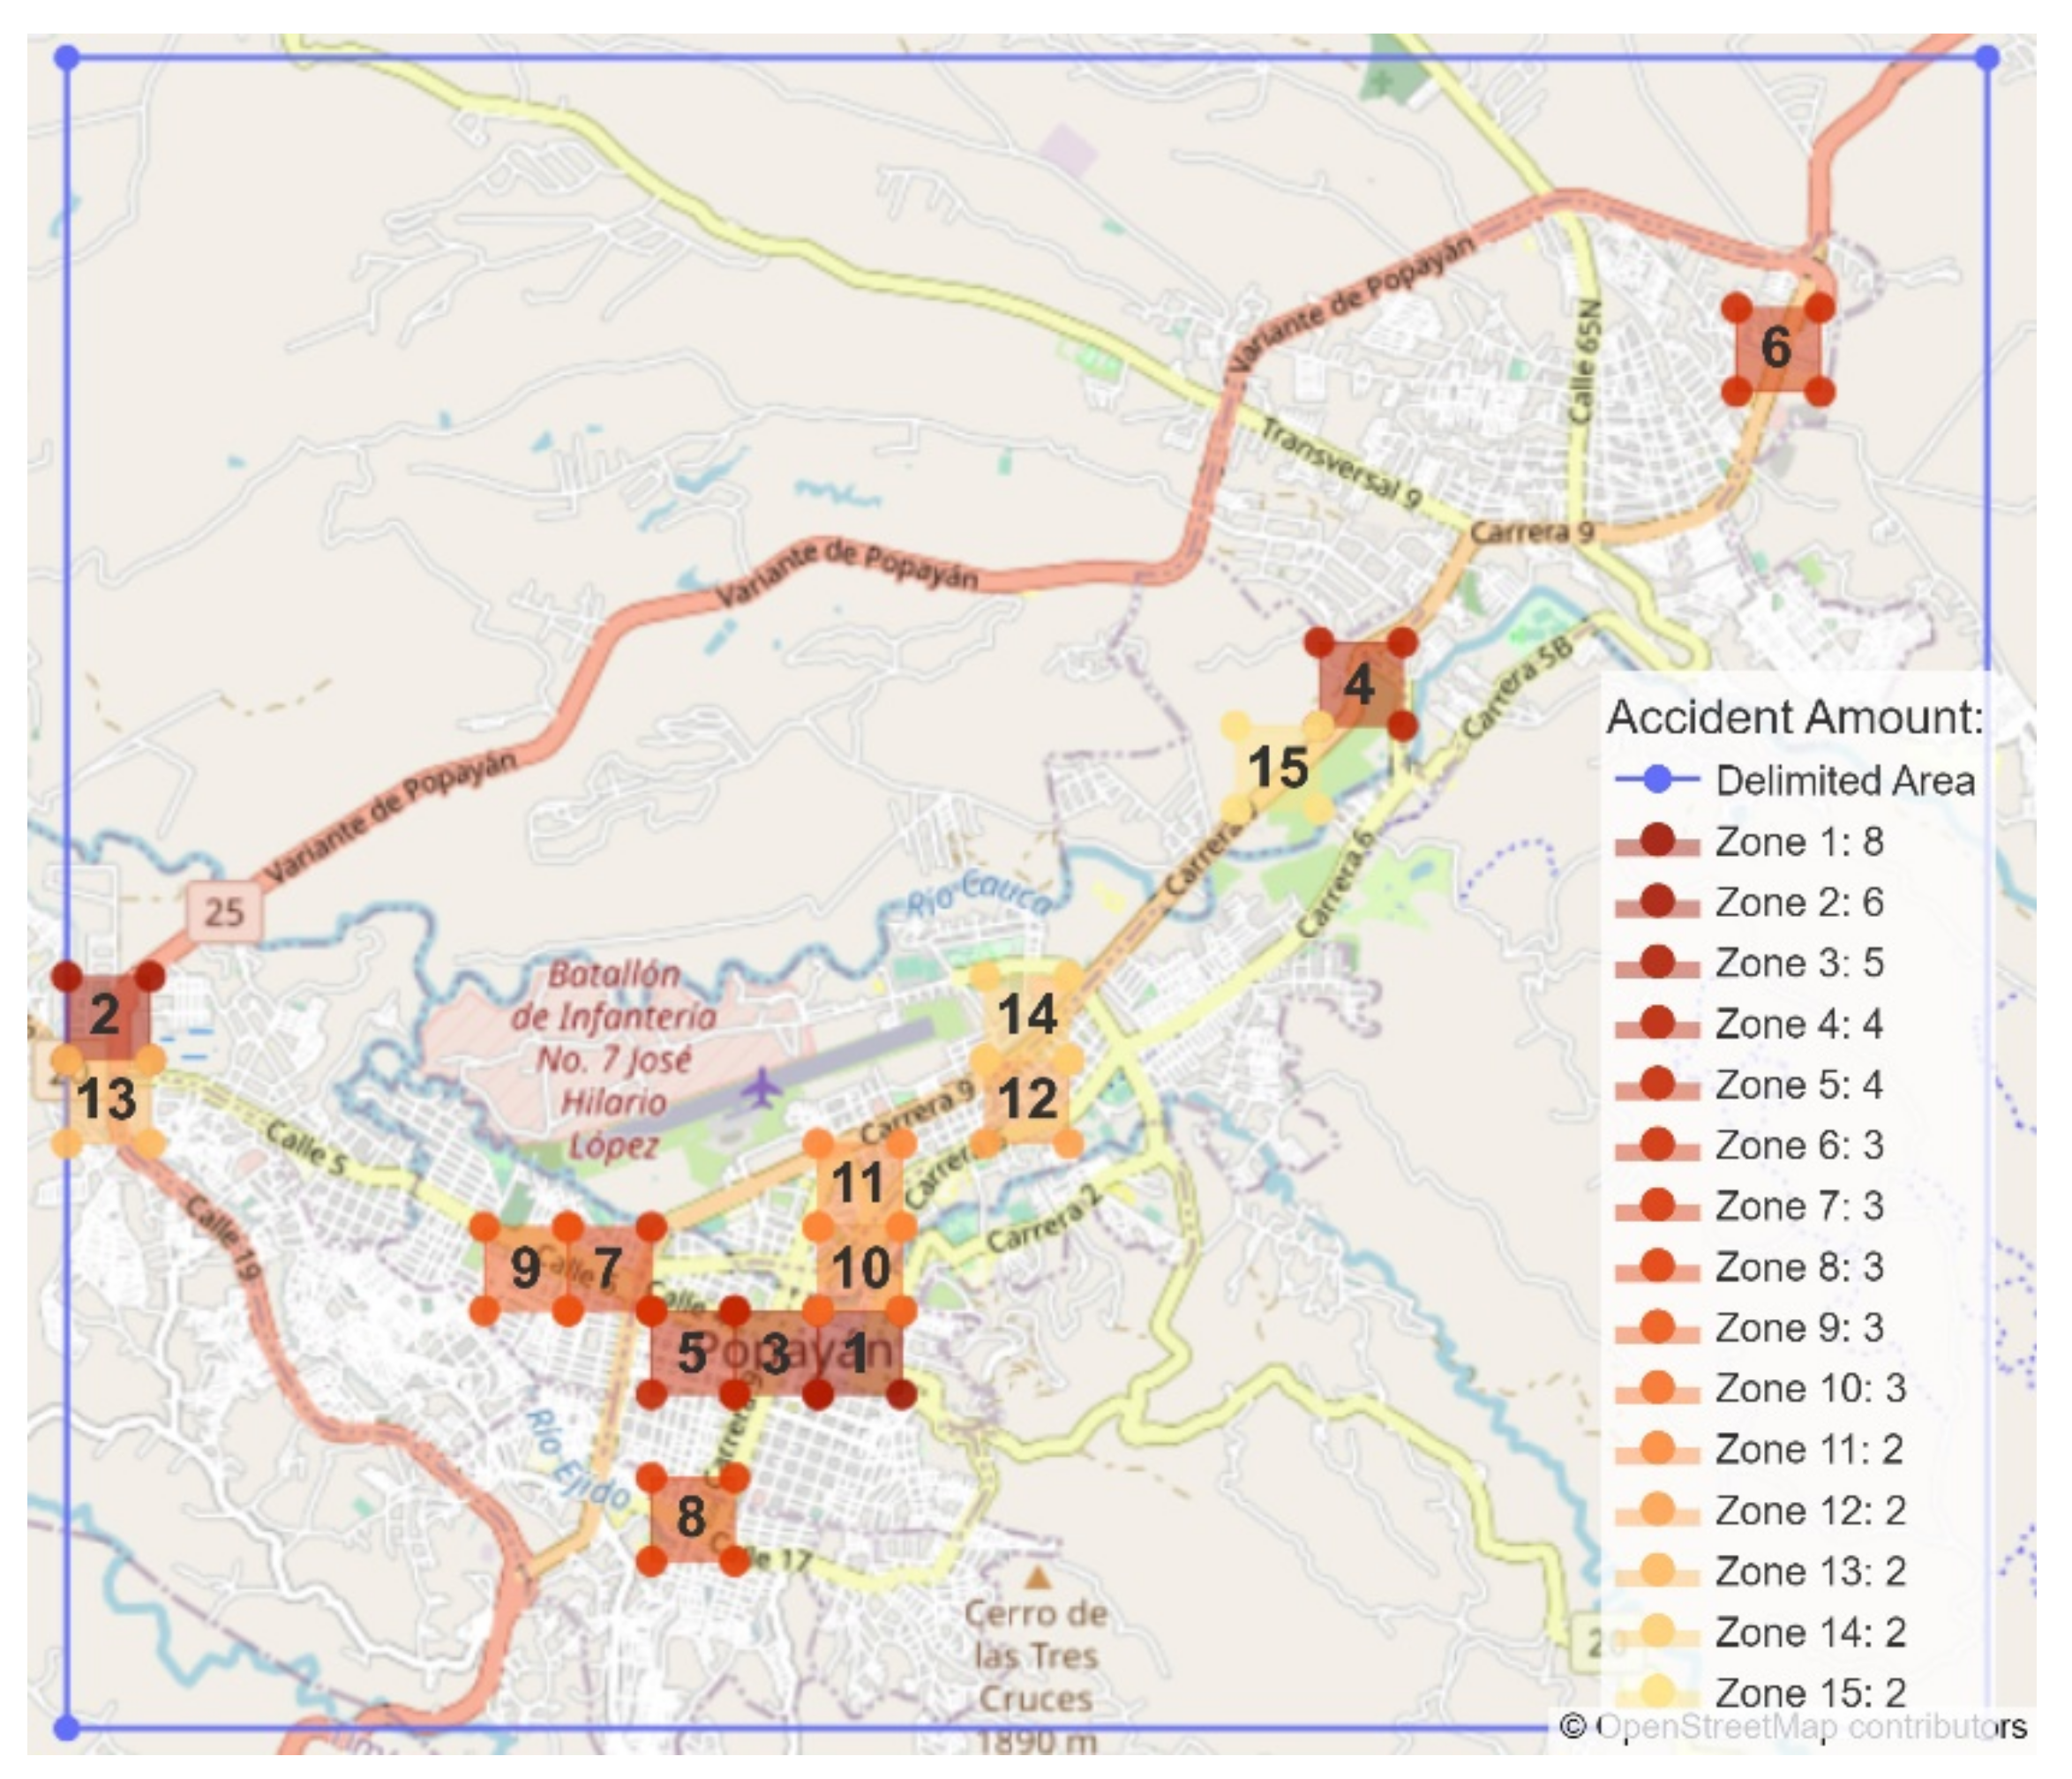
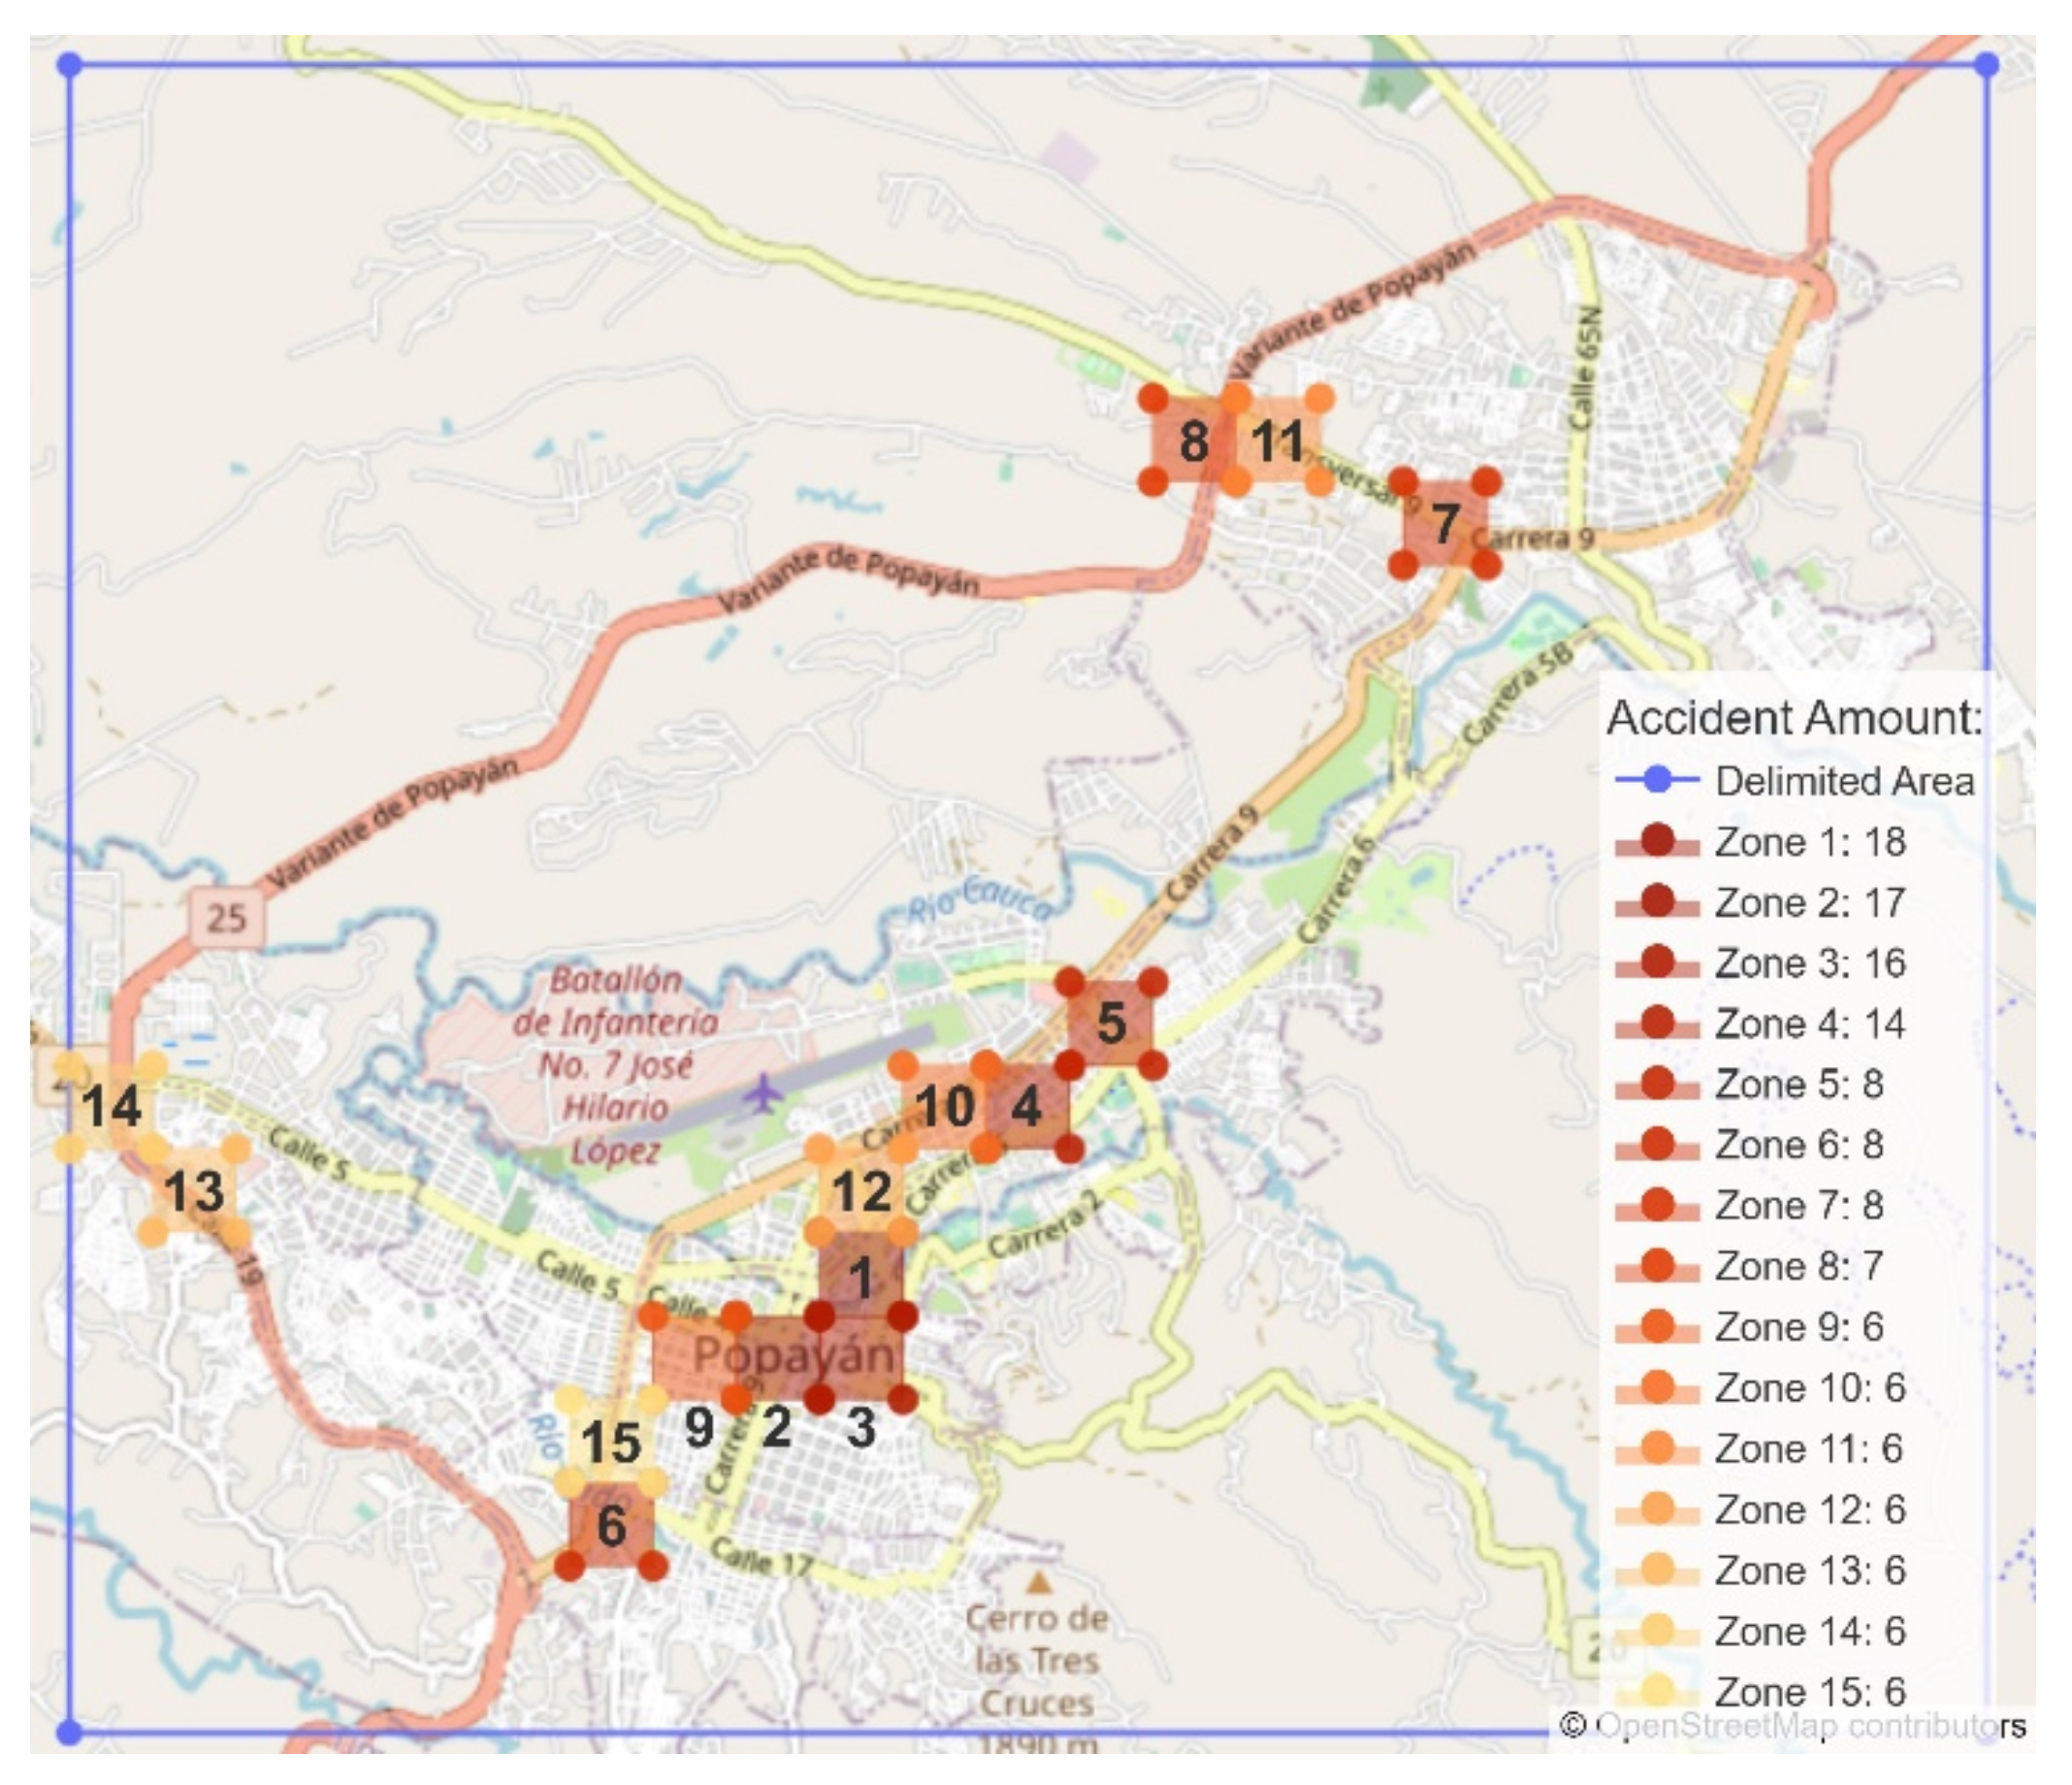
3.3. Results of Uncontrolled Tests, Used to Identify Areas with the Highest Number of Near-Crashes and Areas with a High Probability of Accidents
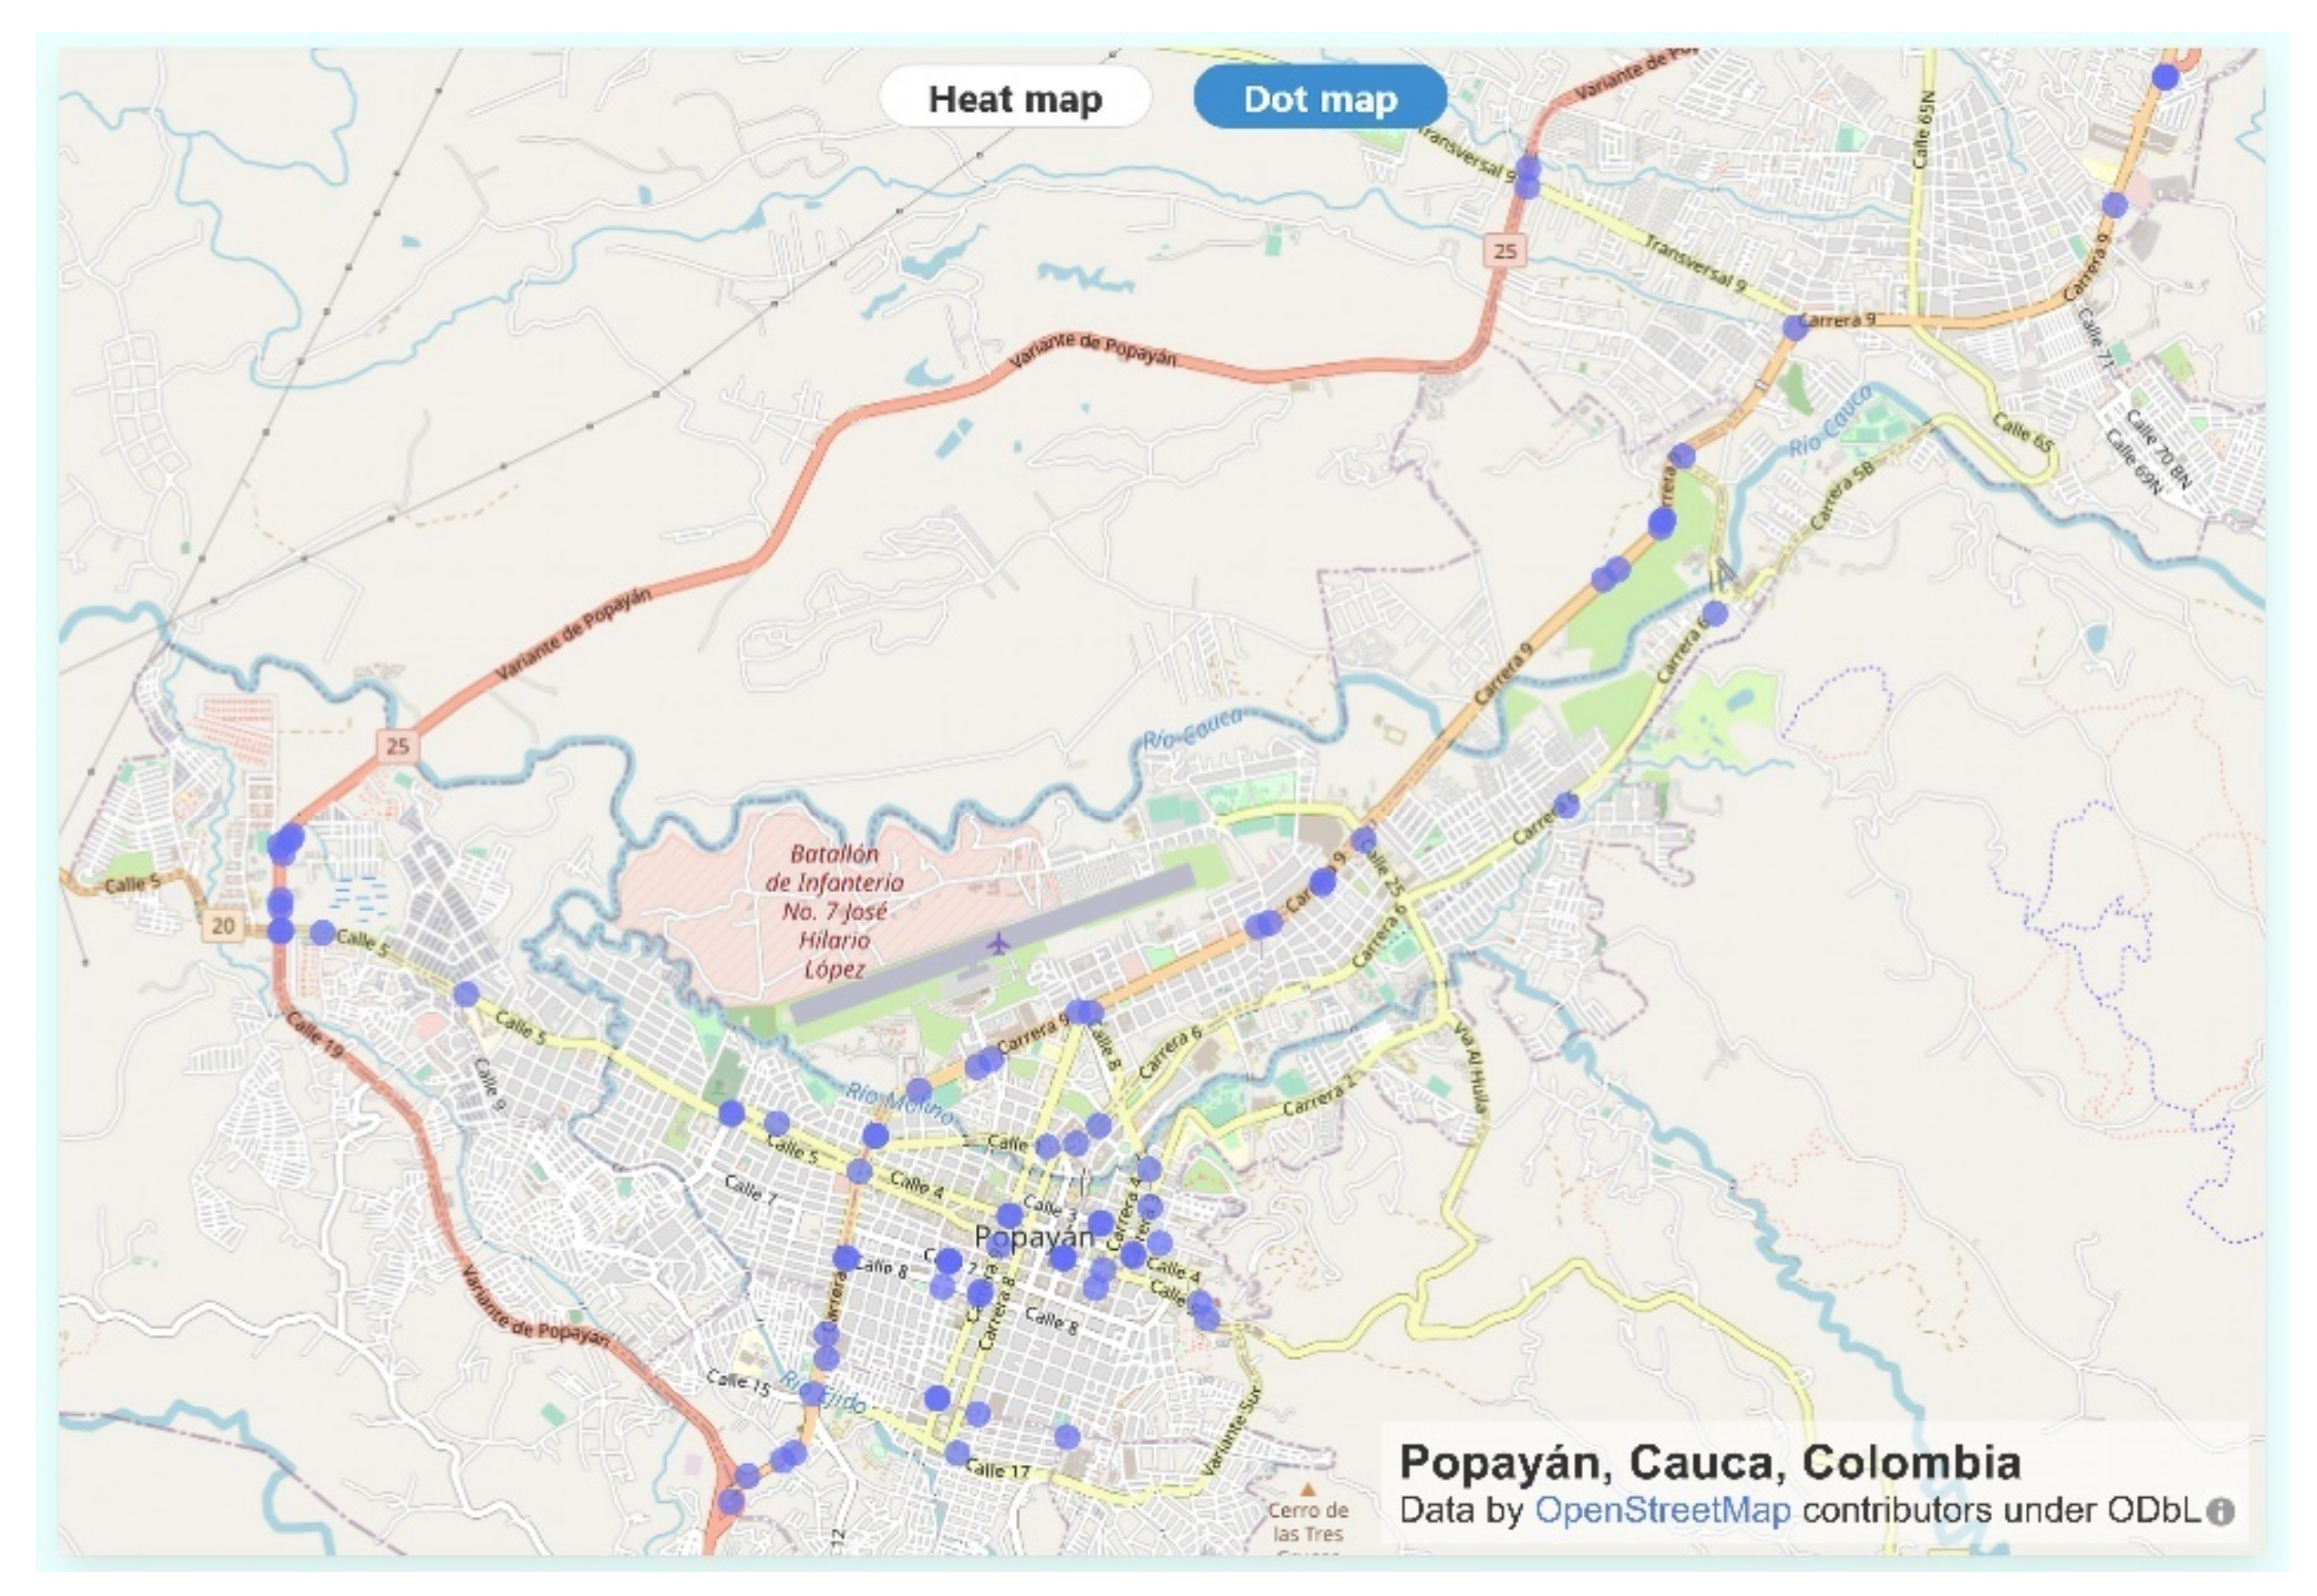
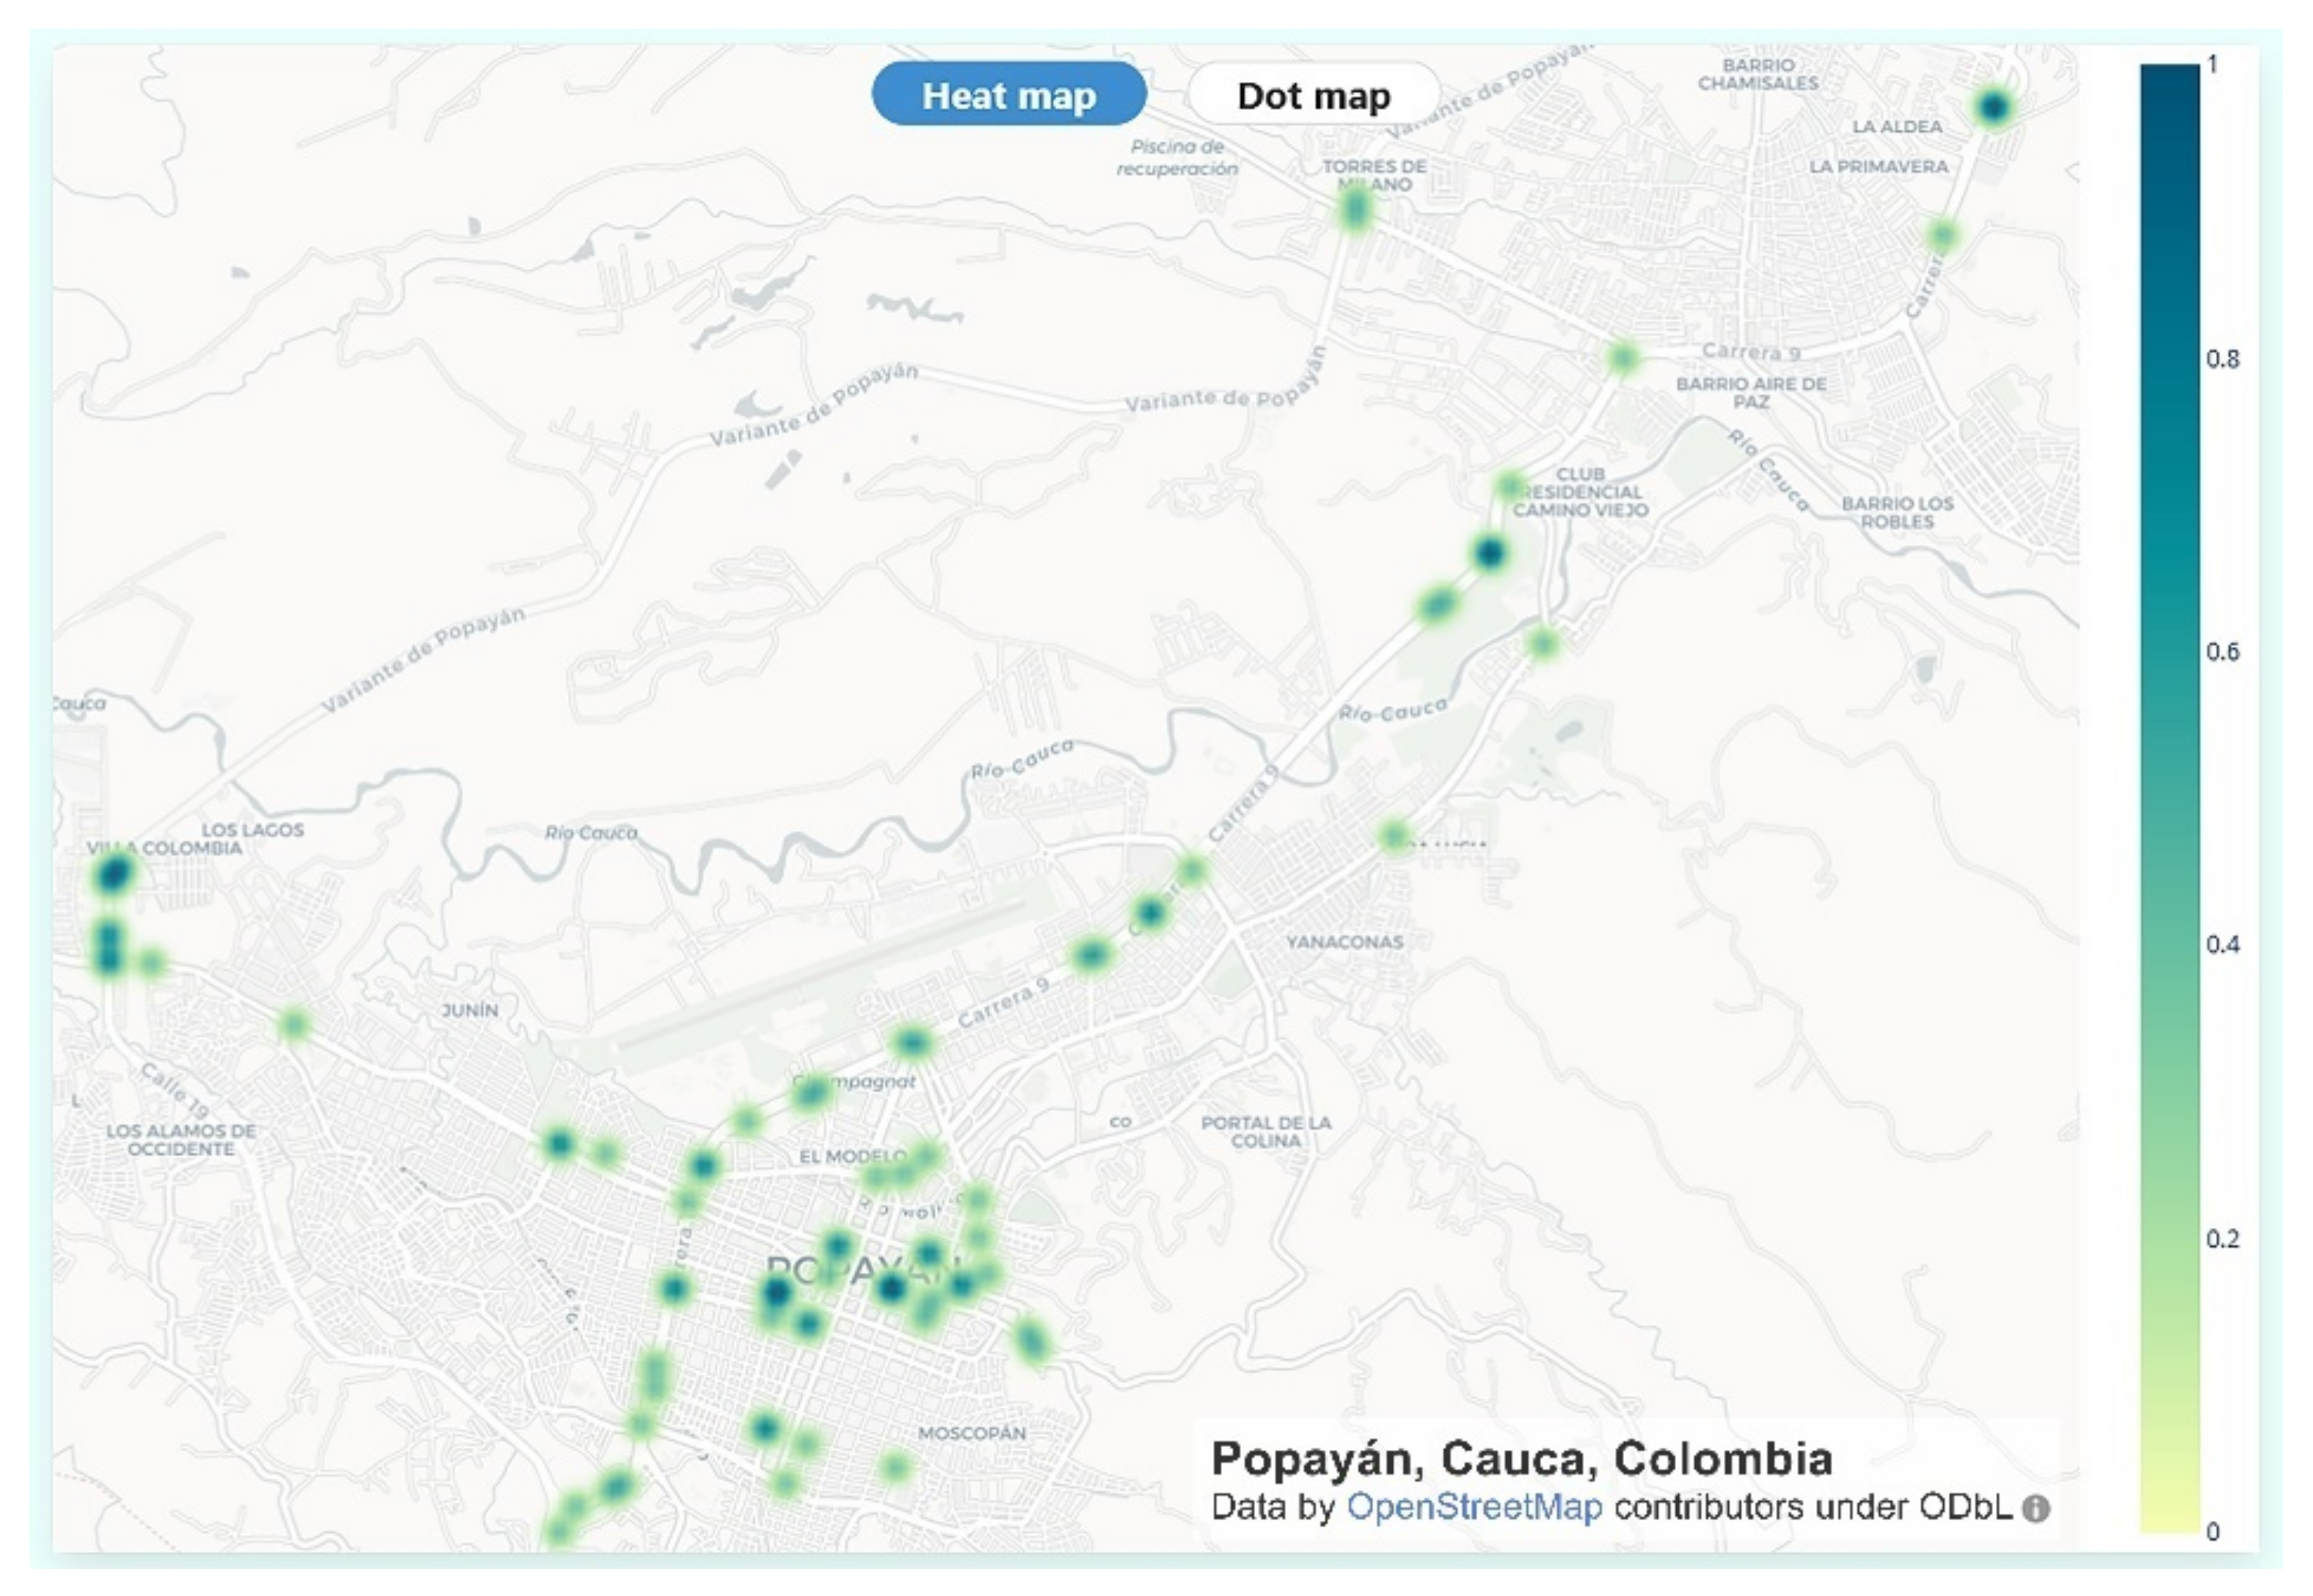
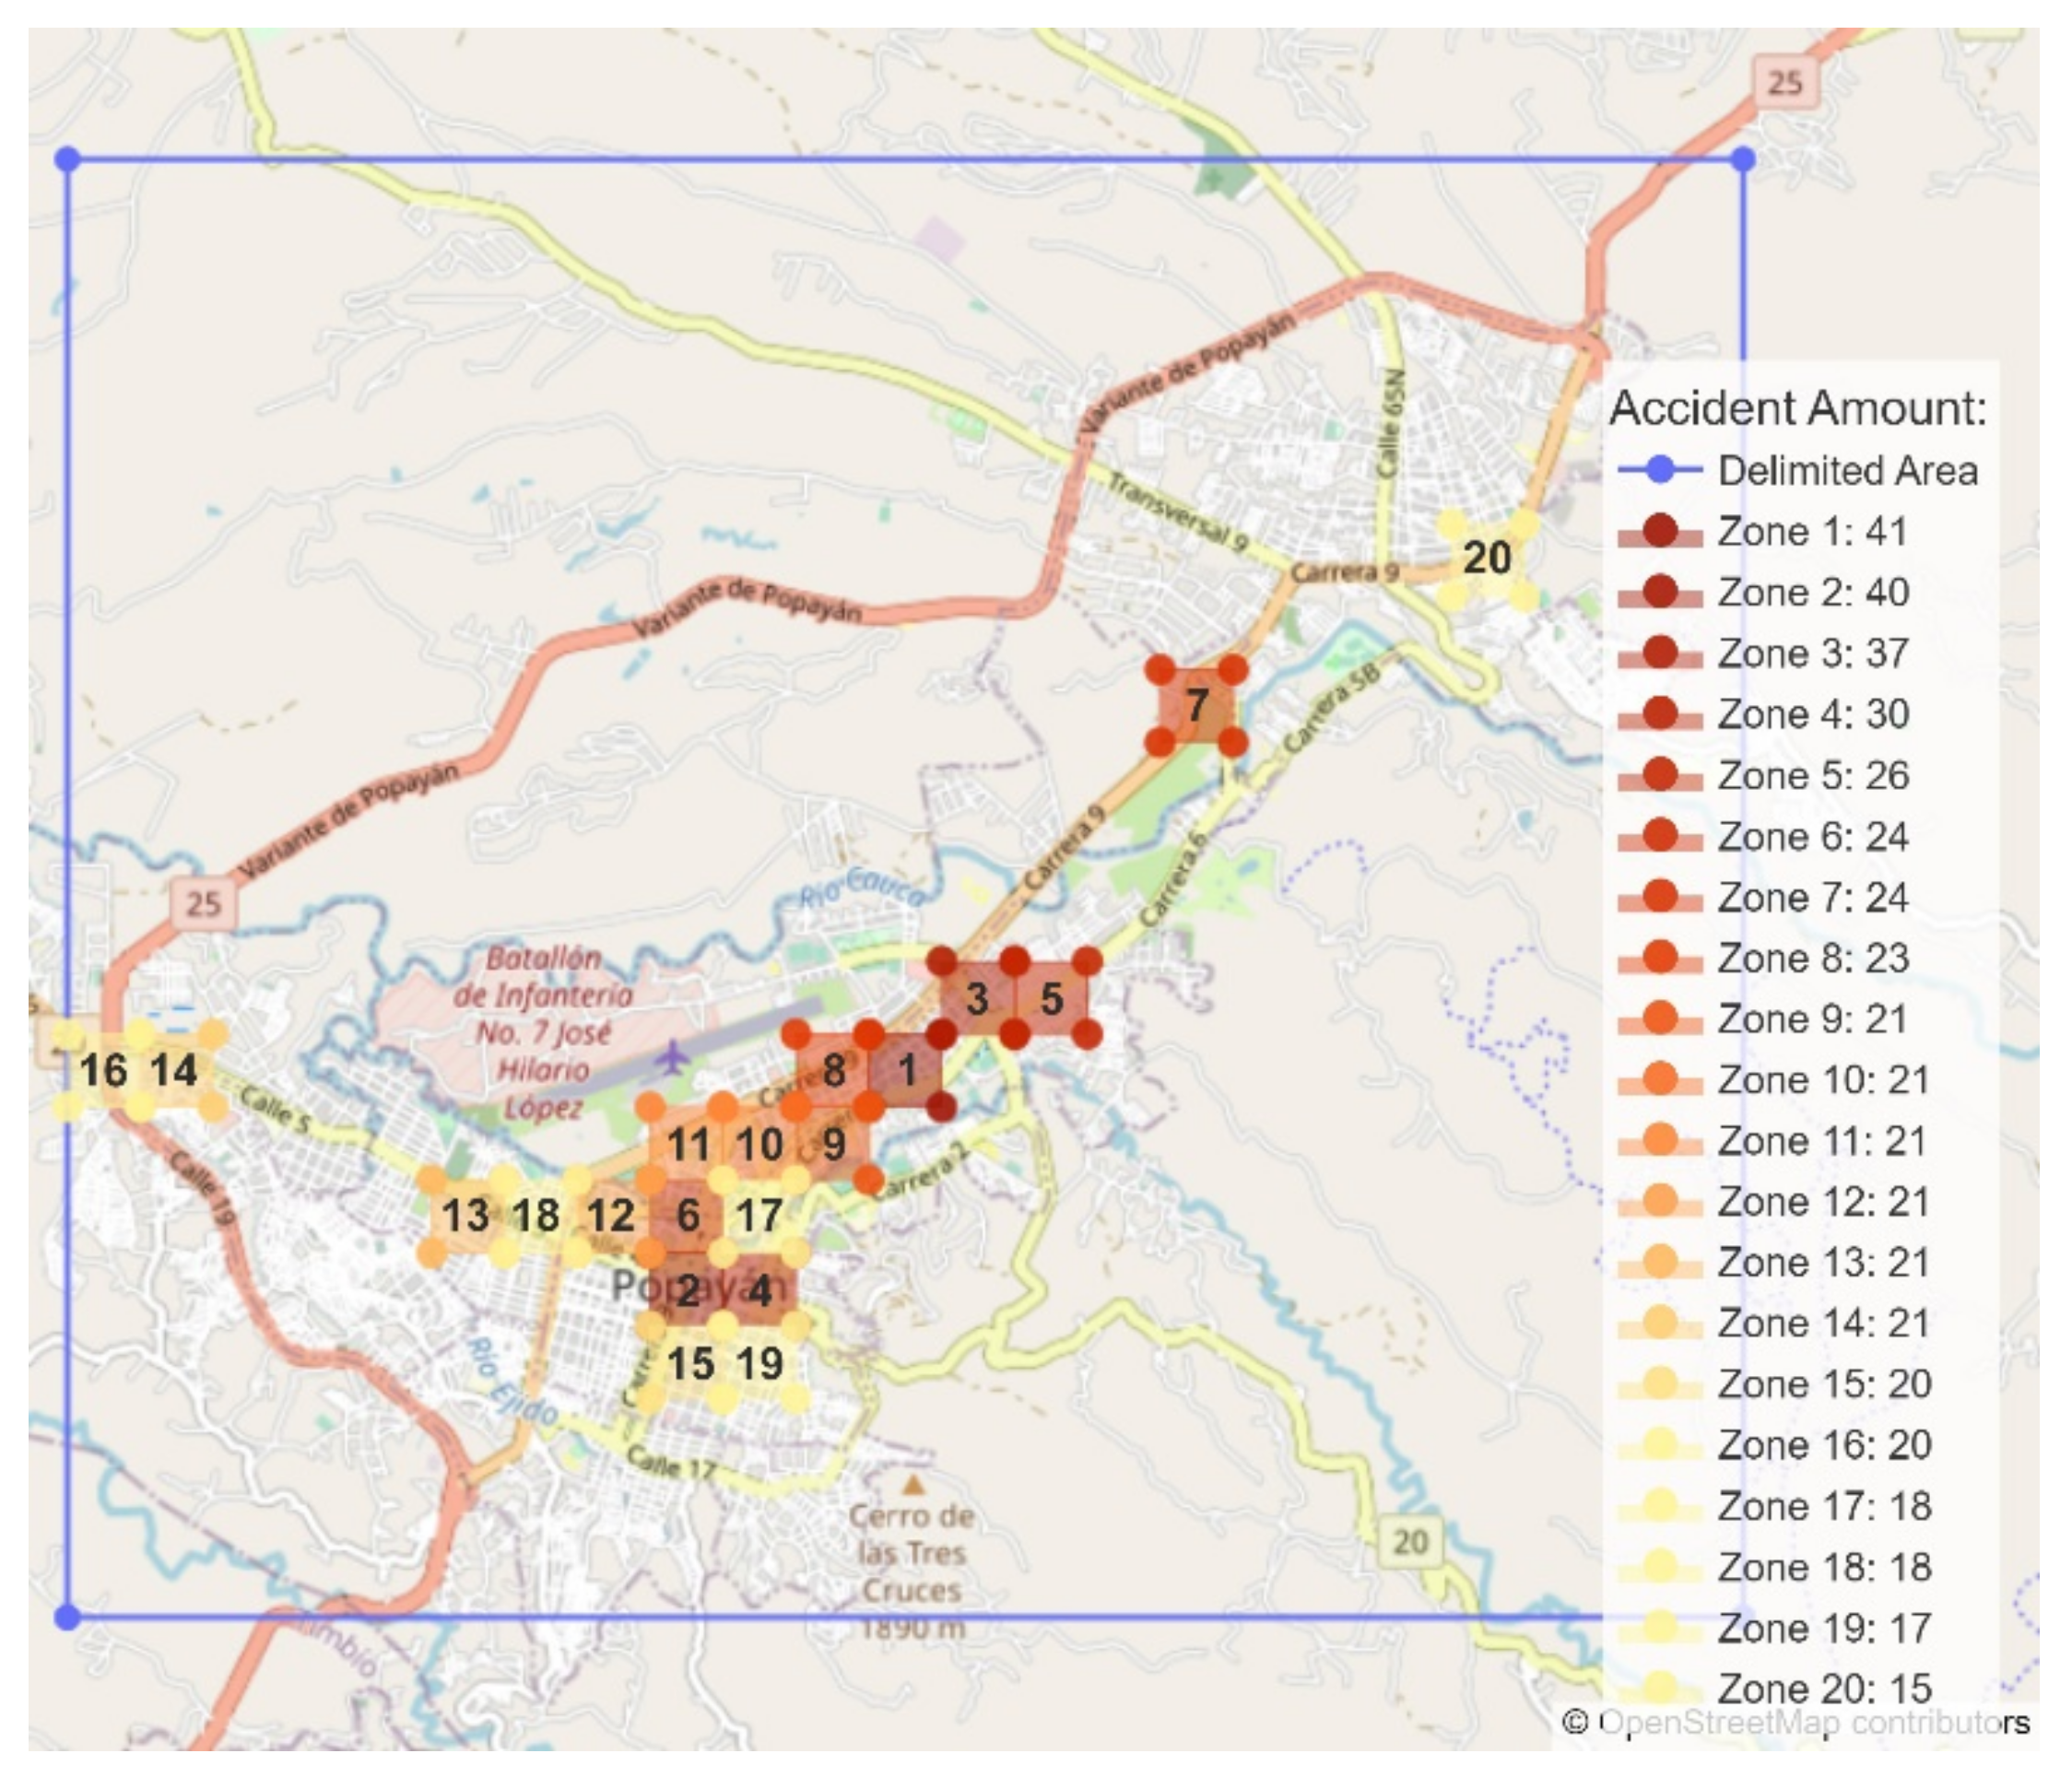
- A total of 12 of these areas coincided with one of the 20 DMV’s reference zones.
- The top 4 of these areas continuously coincided with some reference zone. From the fifth zone, the coincidences occurred discontinuously or intermittently.
- A total of 8 of these areas coincided with one of the 20 DMV’s reference zones.
- The top 5 of these areas continuously coincided with some reference zone. From the sixth zone, the coincidences occurred discontinuously or intermittently.
4. Discussion
4.1. Results, Contraints and Limitation of This Work
- The training of ML model was performed with data collected in controlled tests, trying to identify the six most frequent types of high-risk maneuvers. Although these tests had very good results, it would be convenient to retrain the ML algorithms with a larger data set, performing the controlled tests on the routes where the uncontrolled tests were performed. In this way, although they will continue to be controlled tests (where the event would be manually labeled as a “near-crash”), the environment of such tests will be more realistic, similar to that of uncontrolled tests. The proposed retraining is also suggested to use different filters and/or pre-processing techniques.
- Considering the experiments with the ND method that have been performed by previous works, it could be considered that the number of routes, vehicles, trips, and distance traveled in this work, were very low. However, it must be considered that the focus of the work was on medium-sized cities in developing countries, while previous work was performed in scenarios of developed countries. The low number of trips made in tests can be a reason for not identifying a direct relationship between the detected near-crashes and the TAs that have occurred in the city of Popayán in recent years. Considering this, it is recommended that for future work these parameters of the programmed tests be increased (both the controlled ones to train the ML model, and the uncontrolled ones, to validate the operation of the system prototype). Performing field tests with many more routes than those used in this work, employing more drivers, and making repetitions of the trips at different times, could help discover trends and relationships between the amounts of near-crashes and TAs for a certain area.
- The approach proposed and evaluated based on the ICRDS to identify areas with a high probability of TAs presents a clear advantage compared to traditional techniques for collecting statistical data on road accidents. The use of near-crashes and the ND technique allows data related to road safety to be obtained in shorter times and without the need for an incident to occur. This allows to analyze data and diagnose problems in a more agile way, and the results could be reflected in the implementation of TA prevention plans, modifications to mobility policies or improvements in road infrastructure.
- The proposed work identifies high-risk driving maneuvers, through the proposed sensors, using two types of devices (Smartphone and hybrid device). Although a rigorous process was performed for the selection of the variables to be measured and the sensors that would allow an adequate measurement, the possibility of including additional variables that allow the identification of the 6 maneuvers identified as high risk can be evaluated.
4.2. Contribution to Sustainability and Safety in the Transportation of a City
5. Conclusions and Future Work
- Scaling the DCM with functionalities such as a reorientation algorithm, applying architectures such as the publish-subscribe pattern to constantly send data to the cloud and in real time to the ICRDS web application. In this way, the prototype could adopt an approach based on IoT technologies and expand its possible applications.
- Scale the IIAM with functionalities such as data processing through tools in the cloud, execution of algorithms in the cloud and use of extract, load, transform (ELT) and extract, transform, load (ETL) tools for data management and transformation.
- Apply a new filter or optimize the Kalman filter used in the ICRDS, since the use of this filter considerably increased the data pre-processing time.
- Improve the ML model based on new data captured in ND field tests or retrain it using data from maneuvers executed by drivers with different driving styles.
- Address new ML techniques for the classification of near-crash events, these techniques could use unsupervised algorithms or neural networks.
- Execute validation field tests, by making more trips on new routes or on those designed for this work, using a greater number of drivers, to collect more ND data and perform a more complete evaluation of the system.
- Evaluate the usability of the system in entities such as DMVs or in entities related to the area of transport and road safety.
Author Contributions
Funding
Informed Consent Statement
Data Availability Statement
Acknowledgments
Conflicts of Interest
Appendix A
- Data collection module (DCM). This module groups the physical objects having functionalities related to sensing, storage and collection of vehicle data.
- Intelligent information analysis module (IIAM). This module groups the physical objects having functionalities related to analysis or management of previously collected vehicle data.
- Basic vehicle (BV). It represents the vehicle in operation, including its interfaces, platforms and electronic data on board the vehicle.
- Location and Time Data Source (LTDS). Device that provides the measurement of time and location.
- Vehicle On Board Equipment (Vehicle OBE). It provides the vehicle with sensory, processing, storage and communication functions based on the routes.
- Archived Data Administrator (ADA). It represents the operations performed by a human operator. In the proposed architecture, this object moves the data between the two modules.
- Archived Data System (ADS). Collect, archive, manage and distribute the data delivered through the ADA.
- Archive Data User System (ADUS). Object used to access, manipulate, analyze and process the archived data.
- Results Presentation System (RPS). Object used to visualize the information of the vehicular routes.
- Collected Data Storage (CDS). Allows to store the vehicular data collected on trips.
- Vehicle Kinematics Recording (VKR). Allows the collection of kinematic data through sensors on board the vehicle.
- Vehicle Location Determination (VLD). Allows determining the current location.
- Data Filtering and Preprocessing (DFP). Allows data filtering and pre-processing, to have reliable data for later analysis.
- Archived Analysis and Mining (AAM). Enables running advanced analysis, summary, and mining functions on large data sets.
Appendix B
- Data Collection Module (DCM):
- Intelligent information analysis module (IIAM):
Appendix C
- OBE—Collected Data Storage (OBE-CDS):
- OBE—Vehicle Kinematics Recording (OBE-VKR):
- OBE—Vehicle Location Determination (OBE-VLD):
- ADS Central Data set (ADS-CD):
- ADS Data Filtering and Preprocessing (ADS-DFP):
- ADS Archived Analysis and Mining (ADS-AAM):
Appendix D

References
- WHO. Global Status Report on Road Safety 2018. Available online: https://www.who.int/publications/i/item/9789241565684 (accessed on 11 July 2022).
- Nantulya, V.M.; Reich, M.R. The Neglected Epidemic: Road Traffic Injuries in Developing Countries. BMJ 2002, 324, 1139–1141. [Google Scholar] [CrossRef] [Scilit] [PubMed]
- The World Bank Group About the World Bank. Available online: https://www.worldbank.org/en/about (accessed on 11 July 2022).
- Piyasena, P.; Olvera-Herrera, V.O.; Chan, V.F.; Clarke, M.; Wright, D.M.; MacKenzie, G.; Virgili, G.; Congdon, N. Vision Impairment and Traffic Safety Outcomes in Low-Income and Middle-Income Countries: A Systematic Review and Meta-Analysis. Lancet Glob. Health 2021, 9, e1411–e1422. [Google Scholar] [CrossRef] [Scilit]
- Grupo Centro de Referencia Nacional Sobre Violencia Reporte Forensis. Datos Para La Vida. 2018. Available online: https://www.medicinalegal.gov.co/documents/20143/386932/Forensis+2018.pdf (accessed on 13 June 2022).
- Agencia Nacional de Seguridad Víal Observatorio Nacional de Seguridad Vial. Available online: https://ansv.gov.co/es/observatorio (accessed on 21 October 2020).
- U.S. Census Bureau’s American Community Survey (ACS). Available online: https://www.census.gov/programs-surveys/acs (accessed on 11 July 2022).
- Salazar-Cabrera, R.; Pachon, A. Metodología Para El Diseño de Una Arquitectura de Un Sistema Inteligente de Transporte Para Una Ciudad Intermedia Colombiana. Ing. Y Compet. 2019, 21, 47–60. [Google Scholar] [CrossRef] [Scilit]
- Haghani, M.; Behnood, A.; Dixit, V.; Oviedo-Trespalacios, O. Road Safety Research in the Context of Low- and Middle-Income Countries: Macro-Scale Literature Analyses, Trends, Knowledge Gaps and Challenges. Saf. Sci. 2022, 146, 105513. [Google Scholar] [CrossRef] [Scilit]
- Google Trends Data Science-Explore-Google Trends. Available online: https://trends.google.com/trends/explore?cat=47&date=today5-y&q=datascience (accessed on 21 October 2020).
- Gutierrez-Osorio, C.; Pedraza, C. Modern Data Sources and Techniques for Analysis and Forecast of Road Accidents: A Review. J. Traffic Transp. Eng. 2020, 7, 432–446. [Google Scholar] [CrossRef] [Scilit]
- Mehdizadeh, A.; Cai, M.; Hu, Q.; Yazdi, M.A.A.; Mohabbati-Kalejahi, N.; Vinel, A.; Rigdon, S.E.; Davis, K.C.; Megahed, F.M. A Review of Data Analytic Applications in Road Traffic Safety. Part 1: Descriptive and Predictive Modeling. Sensors 2020, 20, 1107. [Google Scholar] [CrossRef] [Scilit]
- Parseh, M.; Asplund, F.; Svensson, L.; Sinz, W.; Tomasch, E.; Törngren, M. A Data-Driven Method Towards Minimizing Collision Severity for Highly Automated Vehicles. IEEE Trans. Intell. Veh. 2021, 6, 723–735. [Google Scholar] [CrossRef] [Scilit]
- Chen, X.; Wu, S.; Shi, C.; Huang, Y.; Yang, Y.; Ke, R.; Zhao, J. Sensing Data Supported Traffic Flow Prediction via Denoising Schemes and ANN: A Comparison. IEEE Sens. J. 2020, 20, 14317–14328. [Google Scholar] [CrossRef] [Scilit]
- Ehsani, J.P.; Harbluk, J.L.; Bärgman, J.; Williamson, A.; Michael, J.P.; Grzebieta, R.; Olivier, J.; Eusebio, J.; Charlton, J.; Koppel, S.; et al. Naturalistic Driving Studies: An Overview and International Perspective; Vickerman, R., Ed.; Elsevier: Oxford, UK, 2021; pp. 20–38. ISBN 978-0-08-102672-4. [Google Scholar]
- Naji, H.A.H.; Xue, Q.; Lyu, N.; Wu, C.; Zheng, K. Evaluating the Driving Risk of Near-Crash Events Using a Mixed-Ordered Logit Model. Sustainability 2018, 10, 2868. [Google Scholar] [CrossRef] [Scilit]
- Guo, F.; Klauer, S.G.; Hankey, J.M.; Dingus, T.A. Near Crashes as Crash Surrogate for Naturalistic Driving Studies. Transp. Res. Rec. 2010, 2174, 66–74. [Google Scholar] [CrossRef] [Scilit]
- Wu, M.; Zhang, S.; Dong, Y. A Novel Model-Based Driving Behavior Recognition System Using Motion Sensors. Sensors 2016, 16, 1746. [Google Scholar] [CrossRef] [Scilit]
- Ferreira, J.; Carvalho, E.; Ferreira, B.V.; De Souza, C.; Suhara, Y.; Pentland, A.; Pessin, G. Driver Behavior Profiling: An Investigation with Different Smartphone Sensors and Machine Learning. PLoS ONE 2017, 12, e0174959. [Google Scholar] [CrossRef] [Scilit]
- Abdelrahman, A.; Hassanein, H.S.; Abu-Ali, N. Data-Driven Robust Scoring Approach for Driver Profiling Applications. In Proceedings of the 2018 IEEE Global Communications Conference, Abu Dhabi, United Arab Emirates, 9–13 December 2018; pp. 1–6. [Google Scholar] [CrossRef] [Scilit]
- Hamzeie, R.; Savolainen, P.T.; Gates, T.J. Driver Speed Selection and Crash Risk: Insights from the Naturalistic Driving Study. J. Saf. Res. 2017, 63, 187–194. [Google Scholar] [CrossRef] [Scilit]
- Monselise, M.; Liang, O.S.; Yang, C.C. Identifying Important Risk Factors Associated with Vehicle Injuries Using Driving Behavior Data and Predictive Analytics. In Proceedings of the 2019 IEEE International Conference on Healthcare Informatics (ICHI), Xi’an, China, 10–13 June 2019; pp. 1–10. [Google Scholar]
- Perez, M.A.; Sudweeks, J.D.; Sears, E.; Antin, J.; Lee, S.; Hankey, J.M.; Dingus, T.A. Performance of Basic Kinematic Thresholds in the Identification of Crash and Near-Crash Events within Naturalistic Driving Data. Accid. Anal. Prev. 2017, 103, 10–19. [Google Scholar] [CrossRef] [Scilit]
- Wali, B.; Khattak, A.J.; Karnowski, T. Exploring Microscopic Driving Volatility in Naturalistic Driving Environment Prior to Involvement in Safety Critical Events—Concept of Event-Based Driving Volatility. Accid. Anal. Prev. 2019, 132, 105277. [Google Scholar] [CrossRef] [Scilit]
- Xiong, X.; Wang, M.; Cai, Y.; Chen, L.; Farah, H.; Hagenzieker, M. A Forward Collision Avoidance Algorithm Based on Driver Braking Behavior. Accid. Anal. Prev. 2019, 129, 30–43. [Google Scholar] [CrossRef] [Scilit]
- Daptardar, S.; Lakshminarayanan, V.; Reddy, S.; Nair, S.; Sahoo, S.; Sinha, P. Hidden Markov Model Based Driving Event Detection and Driver Profiling from Mobile Inertial Sensor Data. In Proceedings of the 2015 IEEE Sensors, Busan, Korea, 1–4 November 2015. [Google Scholar] [CrossRef] [Scilit]
- Huang, H.; Li, Y.; Zheng, X.; Wang, J.; Xu, Q.; Zheng, S. Objective and Subjective Analysis to Quantify Influence Factors of Driving Risk. In Proceedings of the 2019 IEEE Intelligent Transportation Systems Conference, Auckland, New Zealand, 27–30 October 2019; pp. 4310–4316. [Google Scholar] [CrossRef] [Scilit]
- Najaf, P.; Duddu, V.R.; Pulugurtha, S.S. Predictability and Interpretability of Hybrid Link-Level Crash Frequency Models for Urban Arterials Compared to Cluster-Based and General Negative Binomial Regression Models. Int. J. Inj. Control. Saf. Promot. 2018, 25, 3–13. [Google Scholar] [CrossRef] [Scilit]
- Parsa, A.B.; Movahedi, A.; Taghipour, H.; Derrible, S.; Mohammadian, A. (Kouros) Toward Safer Highways, Application of XGBoost and SHAP for Real-Time Accident Detection and Feature Analysis. Accid. Anal. Prev. 2020, 136, 105405. [Google Scholar] [CrossRef] [Scilit]
- Ziakopoulos, A.; Tselentis, D.; Kontaxi, A.; Yannis, G. A Critical Overview of Driver Recording Tools. J. Saf. Res. 2019, 72, 203–212. [Google Scholar] [CrossRef] [Scilit]
- Vlahogianni, E.I.; Barmpounakis, E.N. Driving Analytics Using Smartphones: Algorithms, Comparisons and Challenges. Transp. Res. Part C: Emerg. Technol. 2017, 79, 196–206. [Google Scholar] [CrossRef] [Scilit]
- Camlica, Z.; Hilal, A.; Kulic, D. Feature Abstraction for Driver Behaviour Detection with Stacked Sparse Auto-Encoders. In Proceedings of the 2016 IEEE International Conference on Systems, Man, and Cybernetics, Budapest, Hungary, 9–12 October 2016; pp. 3299–3304. [Google Scholar] [CrossRef] [Scilit]
- Nugroho, S.A.; Ariyanto, E.; Rakhmatsyah, A. Utilization of Onboard Diagnostic II (OBD-II) on Four Wheel Vehicles for Car Data Recorder Prototype. In Proceedings of the 2018 6th International Conference on Information and Communication Technology (ICoICT), Bandung, Indonesia, 3–5 May 2018; pp. 7–11. [Google Scholar]
- Deng, C.; Wu, C.; Lyu, N.; Huang, Z. Driving Style Recognition Method Using Braking Characteristics Based on Hidden Markov Model. PLoS ONE 2017, 12, e0182419. [Google Scholar] [CrossRef] [Scilit]
- Osman, O.A.; Hajij, M.; Bakhit, P.R.; Ishak, S. Prediction of Near-Crashes from Observed Vehicle Kinematics Using Machine Learning. Transp. Res. Rec. 2019, 2673, 463–473. [Google Scholar] [CrossRef] [Scilit]
- Amiri, A.M.; Nadimi, N.; Yousefian, A. Comparing the Efficiency of Different Computation Intelligence Techniques in Predicting Accident Frequency. IATSS Res. 2020, 44, 285–292. [Google Scholar] [CrossRef] [Scilit]
- Tao, L.; Zhu, D.; Yan, L.; Zhang, P. The Traffic Accident Hotspot Prediction: Based on the Logistic Regression Method. In Proceedings of the 2015 International Conference on Transportation Information and Safety (ICTIS)s, Wuhan, China, 25–28 June 2015; pp. 107–110. [Google Scholar] [CrossRef] [Scilit]
- Wang, J.; Zheng, Y.; Li, X.; Yu, C.; Kodaka, K.; Li, K. Driving Risk Assessment Using Near-Crash Database through Data Mining of Tree-Based Model. Accid. Anal. Prev. 2015, 84, 54–64. [Google Scholar] [CrossRef] [Scilit]
- Bao, J.; Liu, P.; Ukkusuri, S.V. A Spatiotemporal Deep Learning Approach for Citywide Short-Term Crash Risk Prediction with Multi-Source Data. Accid. Anal. Prev. 2019, 122, 239–254. [Google Scholar] [CrossRef] [Scilit]
- Liu, S.; Koch, K.; Gahr, B.; Wortmann, F. Brake Maneuver Prediction-An Inference Leveraging RNN Focus on Sensor Confidence. In Proceedings of the 2019 IEEE Intelligent Transportation Systems Conference, Auckland, New Zealand, 27–30 October 2019; pp. 3249–3255. [Google Scholar] [CrossRef] [Scilit]
- Peng, L.; Sotelo, M.A.; He, Y.; Ai, Y.; Li, Z. Rough Set Based Method for Vehicle Collision Risk Assessment Through Inferring Driver’s Braking Actions in Near-Crash Situations. IEEE Intell. Transp. Syst. Mag. 2019, 11, 54–69. [Google Scholar] [CrossRef]
- Formosa, N.; Quddus, M.; Ison, S.; Abdel-Aty, M.; Yuan, J. Predicting Real-Time Traffic Conflicts Using Deep Learning. Accident Analysis and Prevention 2020, 136, 105429. [Google Scholar] [CrossRef] [Scilit]
- Chamorro, S.Y.; Paredes, J.J. Naturalistic Driving Data Sets for ICRDS. Available online: https://doi.org/10.34740/KAGGLE/DS/2271186 (accessed on 13 July 2022).
- Moher, D.; Liberati, A.; Tetzlaff, J.; Altman, D.G.; The PRISMA Group. Preferred Reporting Items for Systematic Reviews and Meta-Analyses: The PRISMA Statement. PLoS Med. 2009, 6, e1000097. [Google Scholar] [CrossRef] [Scilit]
- United States Department of Transportation. ARC-IT Architecture Reference for Cooperative and Intelligent Transportation. Available online: https://local.iteris.com/arc-it/ (accessed on 24 June 2021).
- AustriaTech Frame Architecture. Available online: https://frame-online.eu/ (accessed on 24 June 2021).
- Salazar-Cabrera, R.; Pachón de la Cruz, Á.; Madrid Molina, J.M. Proof of Concept of an IoT-Based Public Vehicle Tracking System, Using LoRa (Long Range) and Intelligent Transportation System (ITS) Services. J. Comput. Netw. Commun. 2019, 2019, 9198157. [Google Scholar] [CrossRef] [Scilit]
- Joblib Developers Joblib: Running Python Functions as Pipeline Jobs—Joblib 1.2.0. Documentation. Available online: https://joblib.readthedocs.io/en/latest/index.html (accessed on 27 April 2022).
- OpenStreetMap Foundation © OpenStreetMap Contributors. Available online: https://www.openstreetmap.org/copyright (accessed on 23 April 2022).
- Passmore, J.; Yon, Y.; Mikkelsen, B. Progress in Reducing Road-Traffic Injuries in the WHO European Region. Lancet Public Health 2019, 4, e272–e273. [Google Scholar] [CrossRef] [Scilit]
- Adamidis, F.K.; Mantouka, E.G.; Vlahogianni, E.I. Effects of Controlling Aggressive Driving Behavior on Network-Wide Traffic Flow and Emissions. Int. J. Transp. Sci. Technol. 2020, 9, 263–276. [Google Scholar] [CrossRef] [Scilit]
- Google Cloud Platform Service Firebase. Available online: https://firebase.google.com/ (accessed on 12 April 2022).
- James, T. Firebase Expands to Become a Unified App Platform. Available online: https://firebase.blog/posts/2016/05/firebase-expands-to-become-unified-app-platform (accessed on 16 April 2022).
- McKinney, W. Data Structures for Statistical Computing in Python. In Proceedings of the 9th Python in Science Conference, Austin, TX, USA, 28 June–3 July 2010; pp. 56–61. [Google Scholar] [CrossRef] [Scilit]
- SQLite Home Page. Available online: https://www.sqlite.org/index.html (accessed on 30 October 2021).
- Pedregosa, F. Scikit-Learn: Machine Learning in Python. J. Mach. Learn. Res. 2011, 12, 2825–2830. [Google Scholar]
- Schwaber, K.; Sutherland, J. The Scrum Guide: The Definitive The Rules of the Game. Available online: https://scrumguides.org/docs/scrumguide/v2020/2020-Scrum-Guide-US.pdf (accessed on 8 July 2022).
- Pete, C.; Julian, C.; Randy, K.; Thomas, K.; Thomas, R.; Colin, S.; Wirth, R. Crisp-Dm 1.0. Available online: https://www.kde.cs.uni-kassel.de/wp-content/uploads/lehre/ws2012-13/kdd/files/CRISPWP-0800.pdf (accessed on 22 July 2022).



| Driving Maneuver | Kinematic Features | |||||||||||
|---|---|---|---|---|---|---|---|---|---|---|---|---|
| spd 1 | spd OBD-II 2 | acc Pos 3 | acc 4 X | acc 4 Y | acc 4 Z | vel Ang 5 X | vel Ang 5 Y | vel Ang 5 Z | mag 6 X1 | mag 6 Y1 | mag 6 Z | |
| Sudden acceleration (Smartphone) | √ | √ | ||||||||||
| Sudden braking (Smartphone) | √ | √ | ||||||||||
| Aggressive turn (Smartphone) | √ | √ | √ | √ | √ | |||||||
| Aggressive lane change (Smartphone) | √ | √ | ||||||||||
| Sudden acceleration (Hybrid device) | √ | √ | √ | |||||||||
| Sudden braking (Hybrid device) | √ | √ | ||||||||||
| Aggressive turn (Hybrid device) | √ | √ | √ | √ | √ | √ | ||||||
| Aggressive lane change (Hybrid device) | √ | √ | ||||||||||
| Type of Maneuver | Number of Repetitions |
|---|---|
| Sudden acceleration | 12 |
| Sudden braking | 9 |
| Aggressive right turn | 8 |
| Aggressive left turn | 7 |
| Aggressive line change to the right | 9 |
| Aggressive line change to the right | 11 |
| Trajectory Id | Vehicle | Route | Date | Start Time | Duration | Number of Records |
|---|---|---|---|---|---|---|
| 1 | Kia Picanto Ion 2014 | 1 | 25 March 2022 | 4:16 p.m. | 55 min | 65,900 |
| 2 | Kia Picanto Ion 2014 | 2 | 30 March 2022 | 4:18 p.m. | 53 min | 64,040 |
| 3 | Kia Picanto Ion 2014 | 3 | 31 March 2022 | 11:23 a.m. | 43 min | 51,456 |
| 4 | Kia Picanto Ion 2014 | 4 | 1 April 2022 | 11:39 a.m. | 48 min | 58,206 |
| 5 | Kia Picanto Ion 2014 | 5 | 2 April 2022 | 4:08 p.m. | 51 min | 60,691 |
| 6 | Renault Logan 2007 | 1 | 7 April 2022 | 9:41 a.m. | 72 min | 85,884 |
| 7 | Renault Logan 2007 | 2 | 7 April 2022 | 4:17 p.m. | 66 min | 79,730 |
| 8 | Renault Logan 2007 | 3 | 6 April 2022 | 3:49 p.m. | 67 min | 80,560 |
| 9 | Renault Logan 2007 | 4 | 6 April 2022 | 9:33 a.m. | 48 min | 57,824 |
| 10 | Renault Logan 2007 | 5 | 1 April 2022 | 10:27 a.m. | 36 min | 43,909 |
Publisher’s Note: MDPI stays neutral with regard to jurisdictional claims in published maps and institutional affiliations. |
© 2022 by the authors. Licensee MDPI, Basel, Switzerland. This article is an open access article distributed under the terms and conditions of the Creative Commons Attribution (CC BY) license (https://creativecommons.org/licenses/by/4.0/).
Share and Cite
Yepes Chamorro, S.F.; Paredes Rosero, J.J.; Salazar-Cabrera, R.; Pachón de la Cruz, Á.; Madrid Molina, J.M. Design, Development and Validation of an Intelligent Collision Risk Detection System to Improve Transportation Safety: The Case of the City of Popayán, Colombia. Sustainability 2022, 14, 10087. https://doi.org/10.3390/su141610087
Yepes Chamorro SF, Paredes Rosero JJ, Salazar-Cabrera R, Pachón de la Cruz Á, Madrid Molina JM. Design, Development and Validation of an Intelligent Collision Risk Detection System to Improve Transportation Safety: The Case of the City of Popayán, Colombia. Sustainability. 2022; 14(16):10087. https://doi.org/10.3390/su141610087
Chicago/Turabian StyleYepes Chamorro, Santiago Felipe, Juan Jose Paredes Rosero, Ricardo Salazar-Cabrera, Álvaro Pachón de la Cruz, and Juan Manuel Madrid Molina. 2022. "Design, Development and Validation of an Intelligent Collision Risk Detection System to Improve Transportation Safety: The Case of the City of Popayán, Colombia" Sustainability 14, no. 16: 10087. https://doi.org/10.3390/su141610087
APA StyleYepes Chamorro, S. F., Paredes Rosero, J. J., Salazar-Cabrera, R., Pachón de la Cruz, Á., & Madrid Molina, J. M. (2022). Design, Development and Validation of an Intelligent Collision Risk Detection System to Improve Transportation Safety: The Case of the City of Popayán, Colombia. Sustainability, 14(16), 10087. https://doi.org/10.3390/su141610087