Article

Acidified Carbon with Variable Irrigation Sources Impact on Rice Growth and Yield under Cd Toxic Alkaline Soil Conditions

1
Department of Soil Science, Faculty of Agricultural Sciences and Technology, Bahauddin Zakariya University, Multan 60800, Pakistan
2
Department of Geology and Pedology, Faculty of Forestry and Wood Technology, Mendel University in Brno, Zemedelska 1, 61300 Brno, Czech Republic
3
Department of Biology, College of Science, Princess Nourah bint Abdulrahman University, P.O. Box 84428, Riyadh 11671, Saudi Arabia
*
Authors to whom correspondence should be addressed.
Sustainability 2022, 14(16), 10086; https://doi.org/10.3390/su141610086
Submission received: 18 July 2022 / Revised: 6 August 2022 / Accepted: 8 August 2022 / Published: 15 August 2022

Abstract

:
Cadmium (Cd) is one of the potential carcinogenic toxins for humans, plants, and animals. Higher uptake of Cd in plants causes a significant reduction in productivity that can be remediated using organic amendments. Biochar can absorb Cd and decrease its toxicity. However, the high pH of biochar minimizes its adaptation as an amendment in alkaline soils. As Cd is highly soluble in water, its uptake in rice is a major issue. That is why the current experiment was conducted to examine chemically produced acidified carbon (AC) effectiveness in alleviating Cd-induced stress in rice. There were three levels of Cd (0, 4, and 8 mg kg−1 soil) applied with three levels of AC (0, 0.5, and 1%) for the cultivation of rice irrigated with ground water (GW) and waste water irrigation (WW). Results confirmed that applying 1% AC improved plant height, spike length, and 1000 grains weight over 0% AC under GW and WW irrigations at 8 mg Cd kg−1 soil (8Cd) toxicity. A significant increase in photosynthetic rate, transpiration rate, and stomatal conductance by 1% AC validated its effectiveness in alleviating 8Cd stress in rice under GW and WW. Overall, 1% AC is an effective amendment in alleviating Cd toxicity in rice irrigated with GW and WW at 8Cd. More investigations are recommended at the field level to declare 1% AC as the most effective application rate for mitigating Cd stress in rice.

1. Introduction

Heavy metal contamination of the soil is a significant threat to the environment as it gets stored in soil and enters the food chain. Among heavy metals, cadmium (Cd) is highly toxic and a potential threat to human and plant health. It readily gets absorbed by the plant root and transportation to the leaf. Cadmium bioavailability to plants depends on its concentration and available Cd speciation. Higher Cd supply to the soil resulted in increased Cd2+ uptake by plant roots [1]. In roots, it gets entered through the pathways of other divalent cations [2]. Photosynthetic systems of the plant get heavily damaged by Cd, which includes irregularity in chlorophyll biosynthesis and carbon fixation by Rubisco, which disrupt carboxylation reactions of photosynthesis [3,4].
Low photosynthetic rate under the Cd toxicity caused restriction of plant metabolic activities, resulting in poor yield [5]. It also affects plant growth and distorts the structure of cells due to the production of reactive oxygen species (ROS). Although plants have their tolerance mechanisms, i.e., localized excess Cd in vacuoles, increasing Cd concentration greater than 0.01% of plant dry weight can cause phytotoxicity [6].
In the 21st century, water scarcity is considered a significant intricate environmental issue. Due to water scarcity, waste water is widely used for irrigating agricultural land. Especially in Pakistan, this practice is common, which creates a problem [7]. Due to increased domestic consumption and industrialization, freshwater consumption increased, yielding a large quantity of waste water [8]. In Pakistan, waste water production is almost 962,334 M gallons [8], containing both sewage and disposed of industrial water. Among that water, 30% of total waste water is consumed for irrigation in urban and semi-urban agricultural lands (mostly vegetables) [9]. According to an assessment in Pakistan, 22 M ha of land received waste water as irrigation water [8].
Farmers usually prefer waste water irrigation due to several reasons, e.g., (i) it is readily available, (ii) cost-effective, and (iii) enriched with essential nutrients (nitrogen (N), phosphorus (P), potassium (K), sulfur (S), and iron (Fe), etc.) [10]. Despite all the benefits mentioned above, waste water irrigation imparted detrimental effects on soil, plants, and humans [11]. This is because waste water (which comes from any source, e.g., sewage or industries) contains a variety of heavy metals and organic pollutants. Heavy metals pose a major concern due to their accumulation, non-biodegradability, and persistent nature [12]. Studies show that in Punjab (province of Pakistan), waste water contains a significant amount of heavy metals (Cd), surpassing the threshold limit formulated for agriculture purpose utilization [13]. Cadmium concentration in Faisalabad (province of Pakistan) waste water is three times more than its safe limits, and Vehari is two times more than its safe limits [9,11].
Various strategies have been adopted to overcome the problem of waste water Cd pollution [14]. However, these methodologies and techniques are not cost-effective and are active/beneficial for a short duration. The time needs to manage the Cd on a sustainable basis through organic amendments in soil. Therefore, bio-sorbents have been suggested for the remediation of heavy metals like Cd. Biochar is a low-cost porous material that can remove or sorb heavy metals on its surface [15,16,17]. Biochar is a high carbon-containing pyrolysis product of organic residues. Its incorporation into the soil not only improves soil productivity but also influences the nutrient accumulation in plant tissues and the yield of crops [15,18,19,20,21,22,23,24,25,26,27,28]. Metal ions (Cd) get absorbed on the surface of biochar due to their high cation exchange capacity (CEC), surface charges, and stability, and they are no longer bioavailable for the plants [29].
More than 50 million people consume rice grains as their regular meal [30]. According to the FAO survey report, analysis of rice nutritional status from different regions in the world, it contains various essential nutrients like N, P, K, Ca, Zn, Fe, and Na. It is estimated that 100 grams of rice contains 349–373 kcal energy, proteins (6.3–7.1 g), lipids (0.3–0.5 g), carbohydrates (77–78 g), fibers (0.2–0.5 g), riboflavin (0.02–0.06 mg), niacin (1.3–2.4 mg), thiamine (0.02–0.11 mg), and vitamin E (0.075–0.30 mg) are obtained [31]. In Bangladesh, Vietnam, and Indonesia, 60% of calories are taken from rice [32]. However, the toxicity of Cd in rice plays a notorious role in decreasing its growth and yield [33]. Cultivation of rice in Cd-polluted soil caused a significant reduction in photosynthesis, germination, yield, and growth attributes. Such negative impacts of Cd on rice plants can be minimized by applying organic amendments to the soil [33].
That is why the current experiment was conducted to check the effect of acidified carbon in mitigating Cd stress in rice plants. We hypothesized that combining waste water and chemically produced acidified carbon can effectively decrease Cd uptake and improve rice growth and yield under Cd toxic conditions.

2. Materials and Methods

2.1. Experimental Site and Design

A pot experiment was conducted to test the effect of acidified carbon on rice (Oryza sativa L.; Super Basmati) growth and yield under Cd contaminated soil irrigated with waste water. The study was conducted in the research area of the Department of Soil Science, Bahauddin Zakariya University Multan, Pakistan, from May to December 2019. The study was designed in a complete randomized design. The research area is in a semi-arid region characterized by low average rainfall and high mean temperature.

2.2. Treatment Plan

There were 18 treatments with three replicates. The treatments were control + GW (no Cd + no AC), 4Cd + GW (4 mg Cd kg−1 soil + noAC), 8Cd + GW (8 mg Cd kg−1 soil + noAC), control + WW (no Cd + no AC), 4Cd + WW (4 mg Cd kg−1 soil + noAC), 8Cd + WW (8 mg Cd kg−1 soil + noAC), control + GW + 0.5AC (no Cd + 0.5% AC), 4Cd + GW + 0.5AC (4 mg Cd kg−1 soil + 0.5% AC), 8Cd + GW + 0.5AC (8 mg Cd kg−1 soil + 0.5% AC), control + WW + 0.5AC (no Cd + 0.5% AC), 4Cd + WW + 0.5AC (4 mg Cd kg−1 soil + 0.5% AC), 8Cd + WW + 0.5AC (8 mg Cd kg−1 soil + 0.5% AC), control + GW + 1AC (no Cd + 1% AC), 4Cd + GW + 1AC (4 mg Cd kg−1 soil + 1% AC), 8Cd + GW + 1AC (8 mg Cd kg−1 soil + 1% AC), control + WW + 1AC (no Cd + 1% AC), 4Cd + WW + 1 AC (4 mg Cd kg−1 soil + 1% AC) and 8Cd + WW + 1AC (8 mg Cd kg−1 soil + 1% AC).

2.3. Preparation of Acidified Carbon

Acidified carbon (AC) was prepared from waste sugar syrup and collected from the sugar mill, according to the method of Sultan et al. [34]. Sugar syrup and H2SO4 (98% concentrated) were added to a designed reactor at 2:1 (v/v). In an immediate and irreversible reaction, water vaporized and left behind the AC. The following reaction occurred by mixing H2SO4 and syrup:
Carbohdrate + Sulfuric   acid concentrated Water + AC
According to McLaughlin et al., the ash content, volatile matter, and fixed carbon in AC were determined using gravimetric analysis [34]. The pH and EC of biochar were determined in filtered aliquots of biochar and distilled water at a ratio of 1:10 [35] with the help of pH and EC meter. Ash content, fixed carbon, and volatile contents were determined as described by Danish and Zafar-ul-Hye [36]. Physiochemical characteristics of AC are provided in Table 1.
The soil was collected from the mango orchard of Bahauddin Zakariya University. The soil was sieved into 2 mm mesh. The properties of experimental soil are given in Table 2. The recommended rate of NPK fertilizers was added at 136:89:62 kg ha−1 for rice. Except for that, 14.8 kg/ha of ZnSO4 (33% Zn) and 7.41 kg ha−1 boric acid (10.5% Boron) were also mixed uniformly in the soil. According to the study design, the soil was divided into three portions for Cd concentration. Along with control soil, 4 and 8 mg kg−1 of Cd was applied using a cadmium chloride (CdCl2) source. After incubating the soil for three days with Cd, the soil was properly mixed, and 7 kg of soil was filled into pots for further application of AC treatments to control and Cd contaminated soil. AC was incorporated well in the soil at 0.5% and 1% rates. About 8–10 kg of rice seedlings was transplanted from the nursery on 31st May 2019. Transplantation was done manually.

2.4. Irrigation

Sewage water and ground water was used as a treatment for irrigation purpose. The biochemical and chemical properties of waste water are described in Table 2.

2.5. Harvesting of Crop

The crop was harvested manually after full maturity in November 2019. Following agronomic parameters were noted in rice by taking the average value of each treatment’s plants. The height of the rice plants was recorded with a meter scale from spike top to shoot bottom. The length of each spike was recorded with a scale and the average value of all spikes in each pot was determined. The number of tillers was recorded manually, and means were taken. Freshly harvested whole plants (shoot and spikes) were weighed on a weighing balance. After the separation of kernels from spikes, thousand grains were separated and weighed to determine the seed quality.

2.6. Electrolyte Leakage

To estimate plants’ electrolyte leakage (EL), 0.2 g of fresh plant sample was taken and chopped into small pieces and immersed in 10 mL of distilled water [37]. Incubation was done at 25 °C for 24 h. The electrical conductivity (EC1) was examined using a pre-calibrated EC meter. The second EC (EC2) was measured by heating the test tubes in a water bath at 120 °C for 20 min. The final value of EL was calculated using the equation as follows:
EL   % = EC 1 / EC 2 × 100

2.7. Chlorophyll Contents and Gas Exchange Attributes

Assessment of chlorophyll contents in fresh leaves was done by grinding the leaves in 80% acetone solution. The extract was collected after grinding to examine the spectrophotometer color intensity at 645 and 663 nm [38]. The final computation of chlorophyll was made using the equation:
Chlorophyll   a   mg   g 1 = 12.7 × Optical   density 663 2.69 × Optical   density   645 × Final   volumn   made 1000 × Leaf   Weight
Chlorophyll   b   mg   g 1 = 22.9 × Optical   density 645 4.68 × Optical   density 663 × Final   volumn   made 1000 × Leaf   Weight
Total   chlorophyll   mg   g 1 = Chlorophyll   a + Chlorophyll   b
An infrared gas analyzer (CI-340 Photosynthesis system, CID, Inc. USA) was utilized on a sunny day to evaluate the photosynthetic rate and stomatal conductance. All readings were recorded from 10:30 to 11:30 AM [39].

2.8. Plant Digestion

Plants shoot, leaves, and grains samples were ovens dried and ground separately to form a homogeneous powder. A mixture of di-acid was prepared by 10:1:4 HNO3, H2SO4, and HClO4. Plant material was mixed with concentrated (98%) H2SO4 and kept overnight. Before heating, 10 mL acid mixture was added to that suspension. The mixture was heated till clearing the solution, and white fumes emerged [40]. The mixture was then cooled and stored for further nutrient analysis. The sample was filtered and directly run on an atomic spectrophotometer for Cd determination.

2.9. Acidified Carbon and Soil Total Cadmium

Cadmium can be quantified by the soil di-acid wet digestion. For this one-gram air-dried soil, 3 mL HNO3 was added and heated on a hot plate at 145 °C for an hour. After that, 4 mL of perchloric acid (HClO4) was added, and the hot plated temperature was raised to 240 °C for one hour again [41]. After clearing the solution, the flask was removed and kept for cooling. When the temperature of the digested solution reached room temperature, 50 mL DI water was added to it, and filtration was done. The sample was run with deionized water as blank at atomic absorption spectrophotometer (graphite furner; Agilant 200) to estimate the Cd concentration in the soil.

2.10. Statistical Analysis

Data computation was made on Microsoft Excel 2013®, and statistical analysis Two-way ANOVA was performed by Origin 2020b. The difference among treatment means was assessed using the Fisher least square difference (LSD) at p ≤ 0.05. Pearson correlation and principal component analysis were done [42].

3. Results

Treatment control and 4Cd (4 mg Cd kg−1) were statistically alike to each other but differed significantly higher over 8Cd (8 mg Cd kg−1) for plant height in ground water (GW) and waste water (WW) irrigations at 0 and 0.5% AC (Figure 1). A similar trend was also observed in plant height at 1% AC where GW was applied as irrigation. However, in WW irrigation, control, 4Cd, and 8Cd were significantly different from each other at 1% AC for plant height. Overall, application of 1% and 0.5% AC significantly increased rice plant height compared to control even at an increasing level of Cd, i.e., 4 and 8 mg Cd kg−1 soil. However, without AC, 4Cd and 8Cd significantly decreased the plant height of rice.
In the case of spike length treatment control, 4Cd and 8Cd were significantly different from each other for spike length in GW irrigations at 0% AC (Figure 2). Treatment control and 4Cd were non-significant to each other but control remained significantly better over 8Cd for spike length at 0% AC. No significant change in spike length was noted among control, 4Cd, and 8Cd where rice was irrigated with GW and WW at 0.5% AC. However, in WW irrigation, control, and 4Cd were significantly higher than 8Cd at 1% AC. Spike length was statistically alike in 4Cd + GW and 8Cd + GW but differed significantly over control + GW at 1% AC for spike length. Overall, application of 1% and 0.5% AC significantly increased the spike length of rice as compared to control even at an increasing level of Cd, i.e., 4 and 8 mg Cd kg−1 soil. However, without AC, 4Cd and 8Cd significantly decreased the spike length of rice.
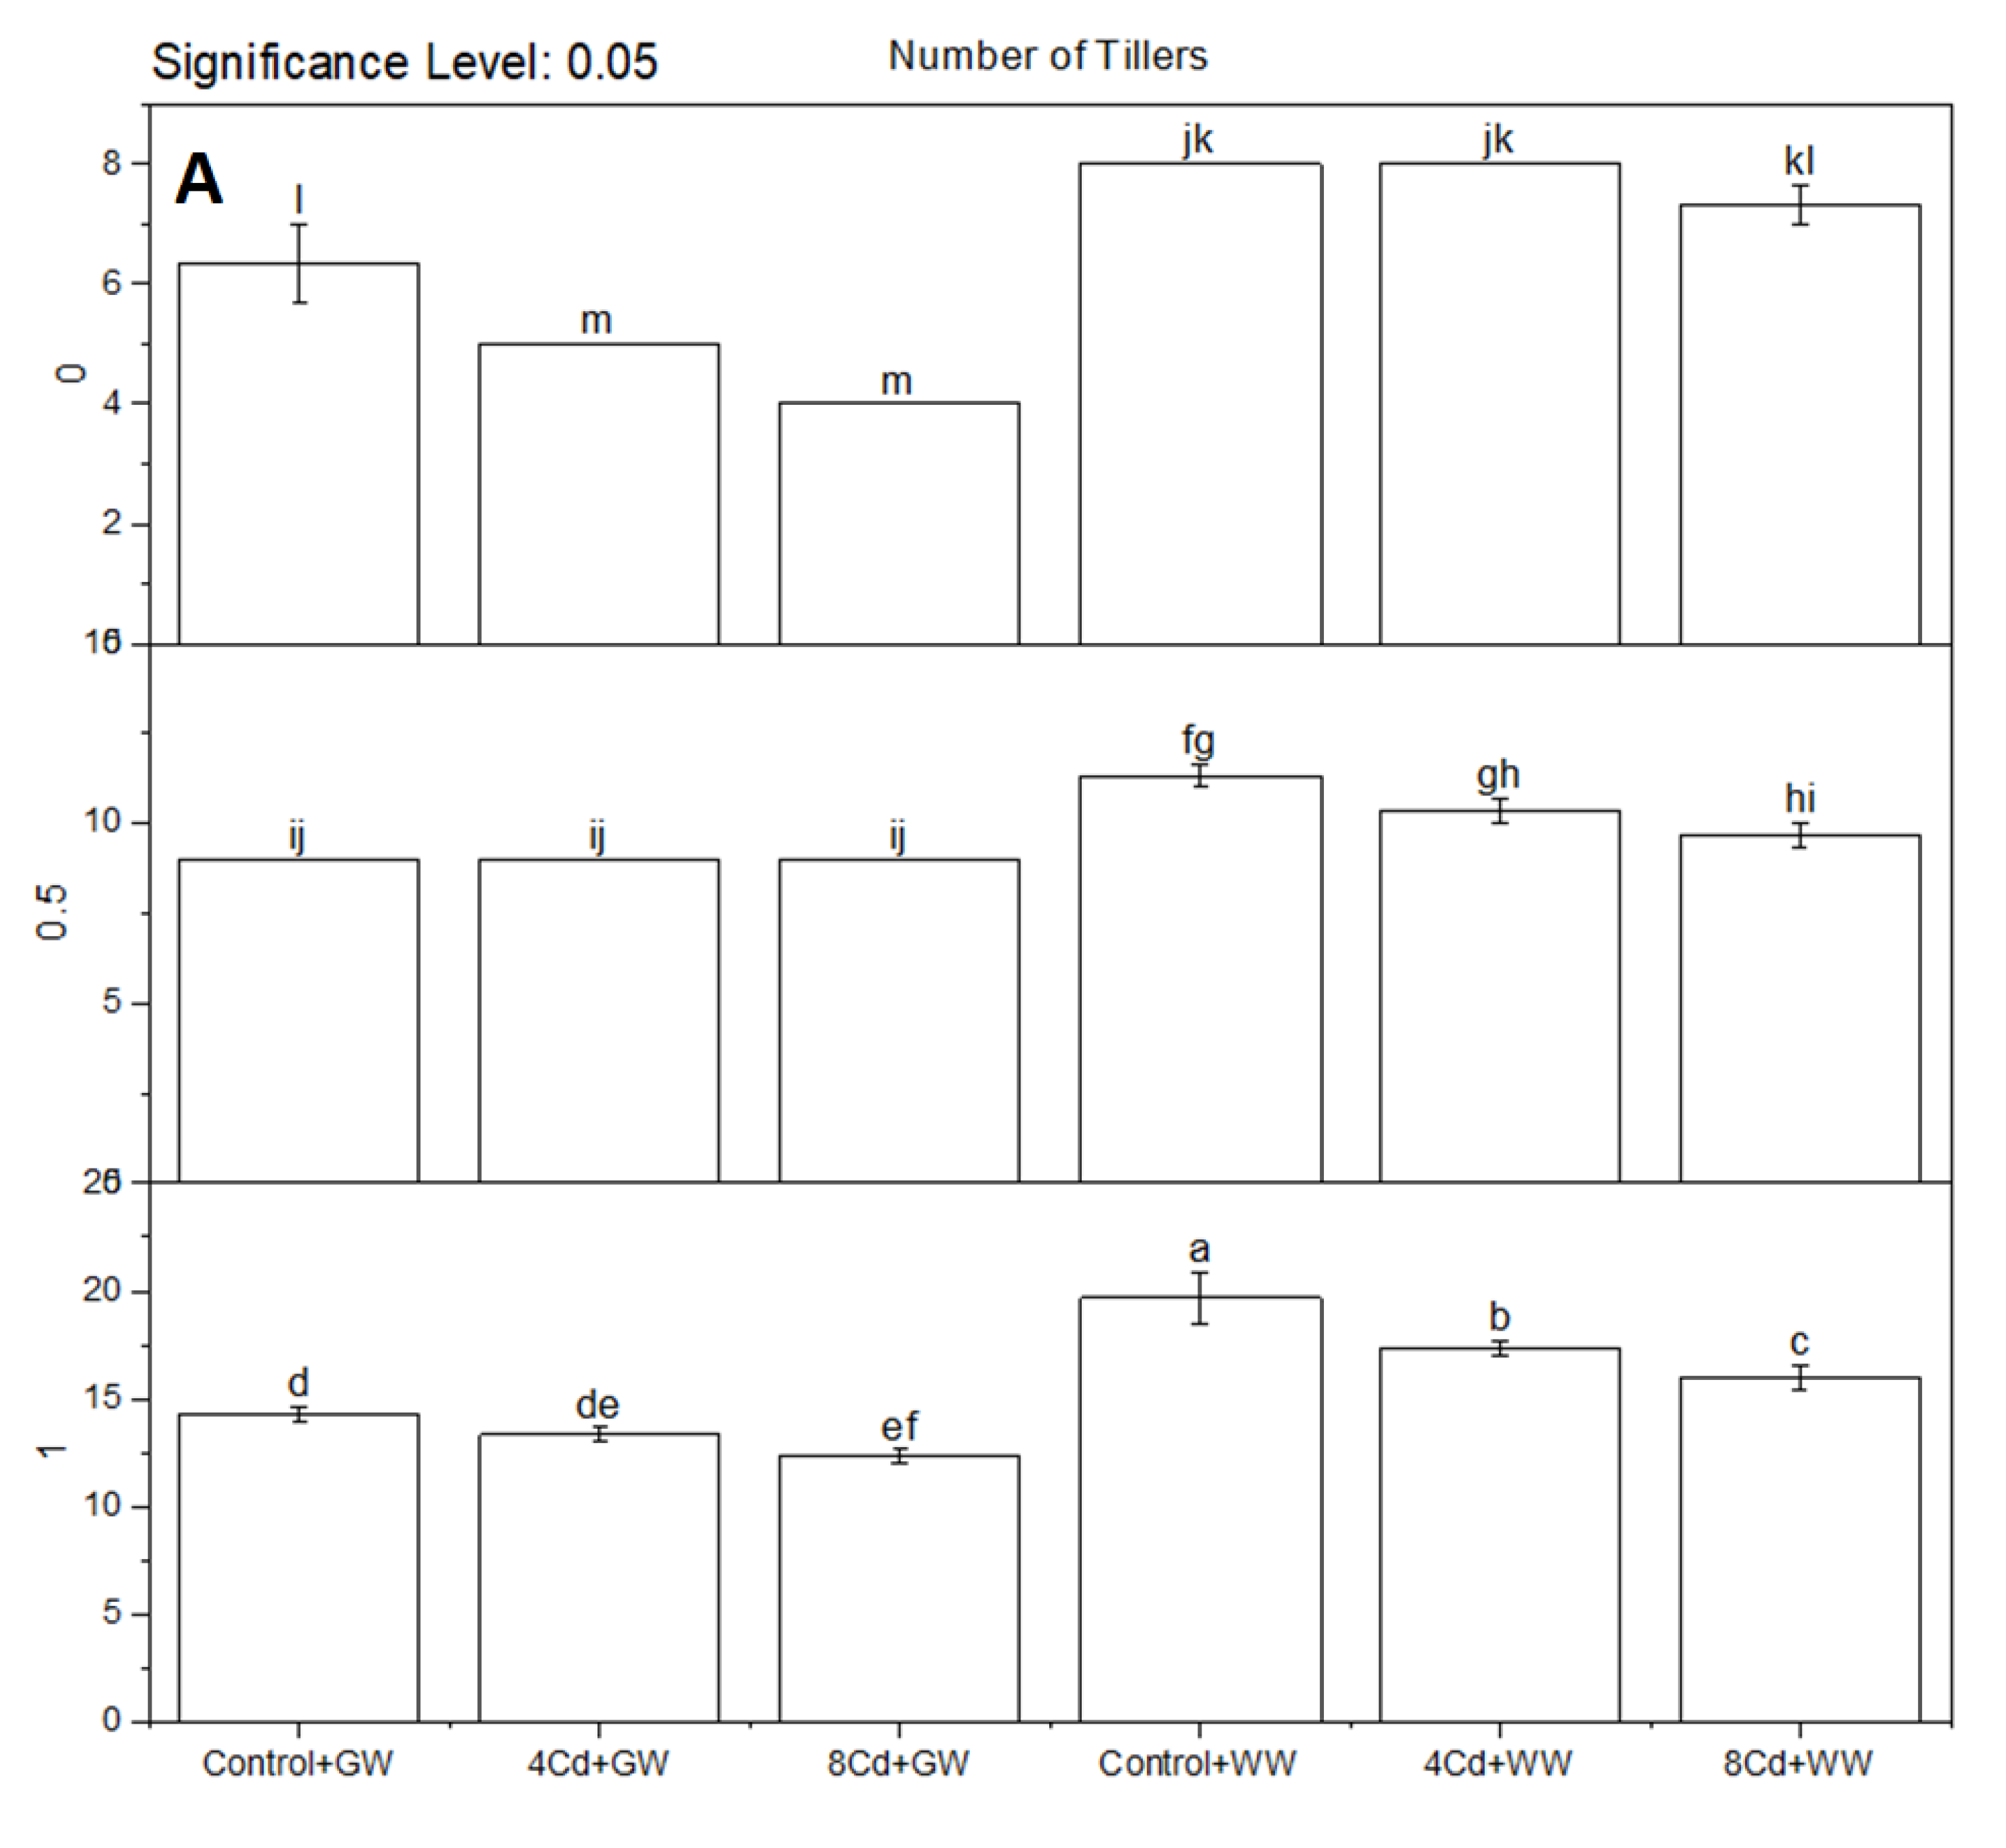
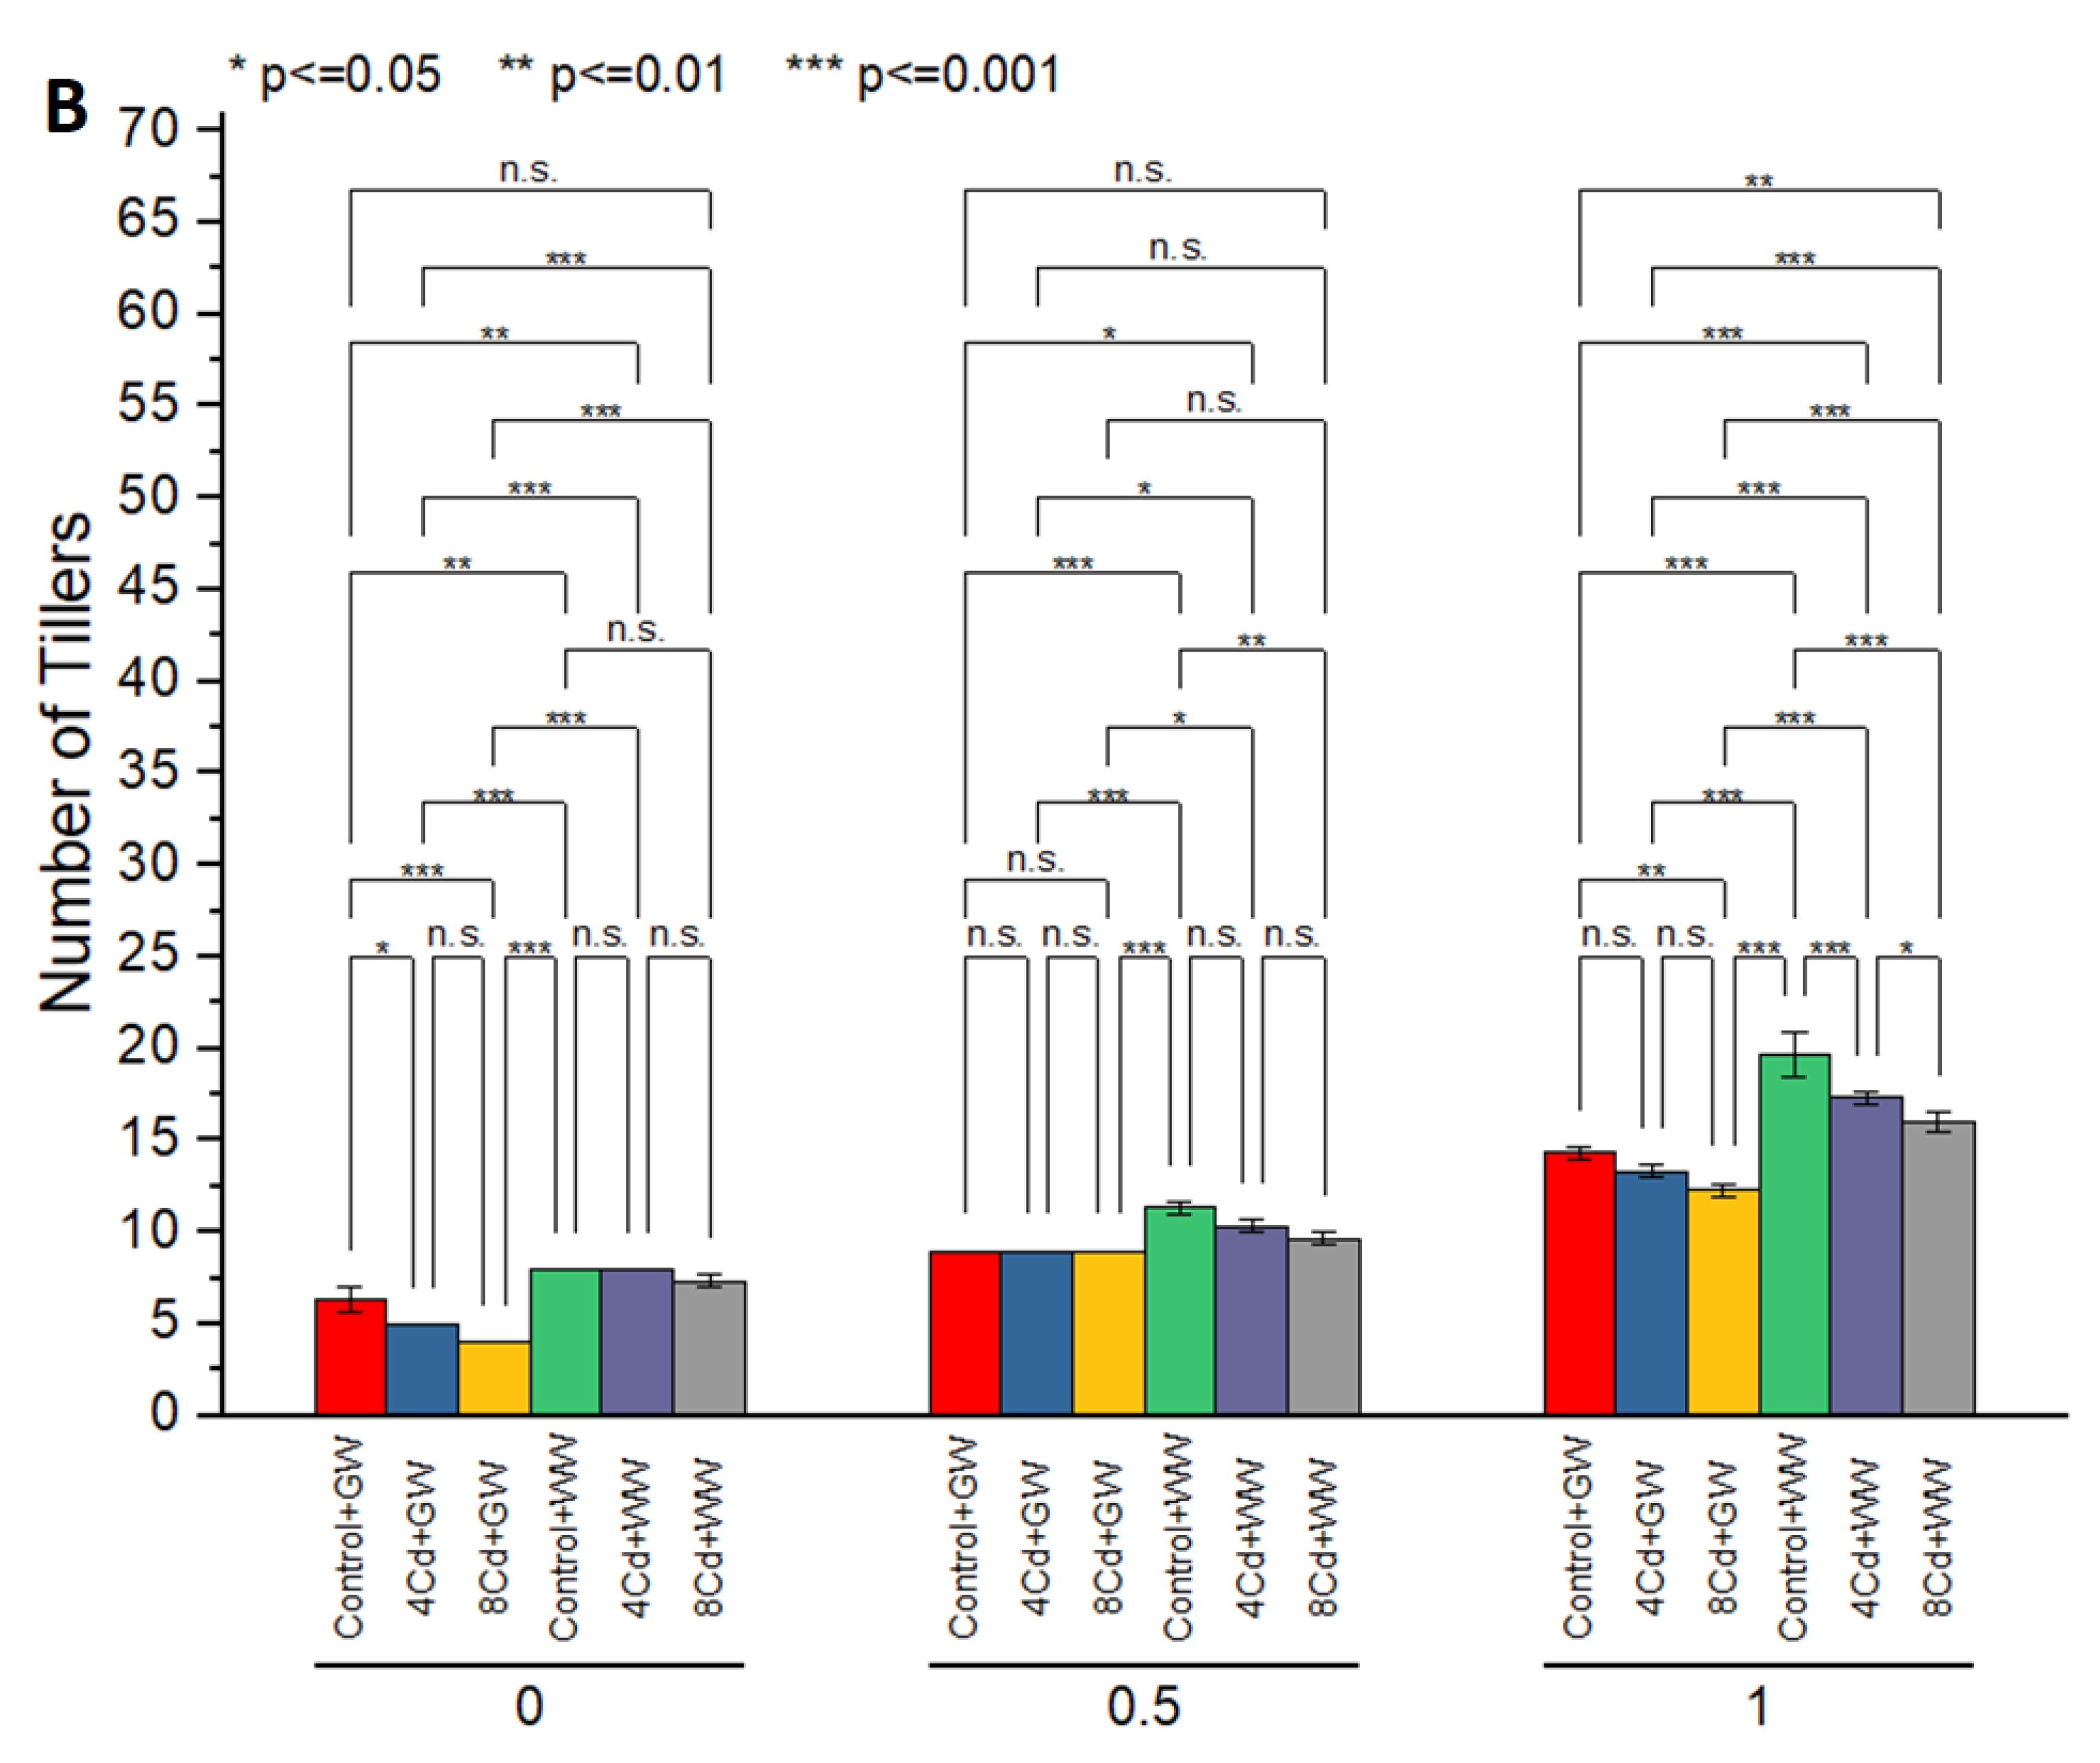
Results show that control was significantly high over 4Cd and 8Cd for the number of tillers in GW irrigations at 0% AC (Figure 3). No significant change was noted in control + WW, 4Cd + WW, and 8Cd + WW at 0% AC. Treatment control, 4Cd, and 8Cd were non-significant to each other for the number of tillers at 0.5% AC where GW was applied. A significant increase in the number of tillers was noted in control over 8Cd where rice was irrigated with WW at 0.5% AC. The number of tillers was statistically alike in 4Cd + GW and 8Cd + GW but 8Cd + GW differed significantly low over control + GW at 1% AC. However, in WW irrigation, control, 4Cd, and 8Cd were significantly different from each other at 1 % AC for number of tillers. Overall, application of 1% and 0.5% AC significantly increased the number of tillers of rice as compared to control even at the increasing level of Cd, i.e., 4 and 8 mg Cd kg−1 soil. However, without AC, 4Cd and 8Cd, significantly decreased the number of tillers of rice.
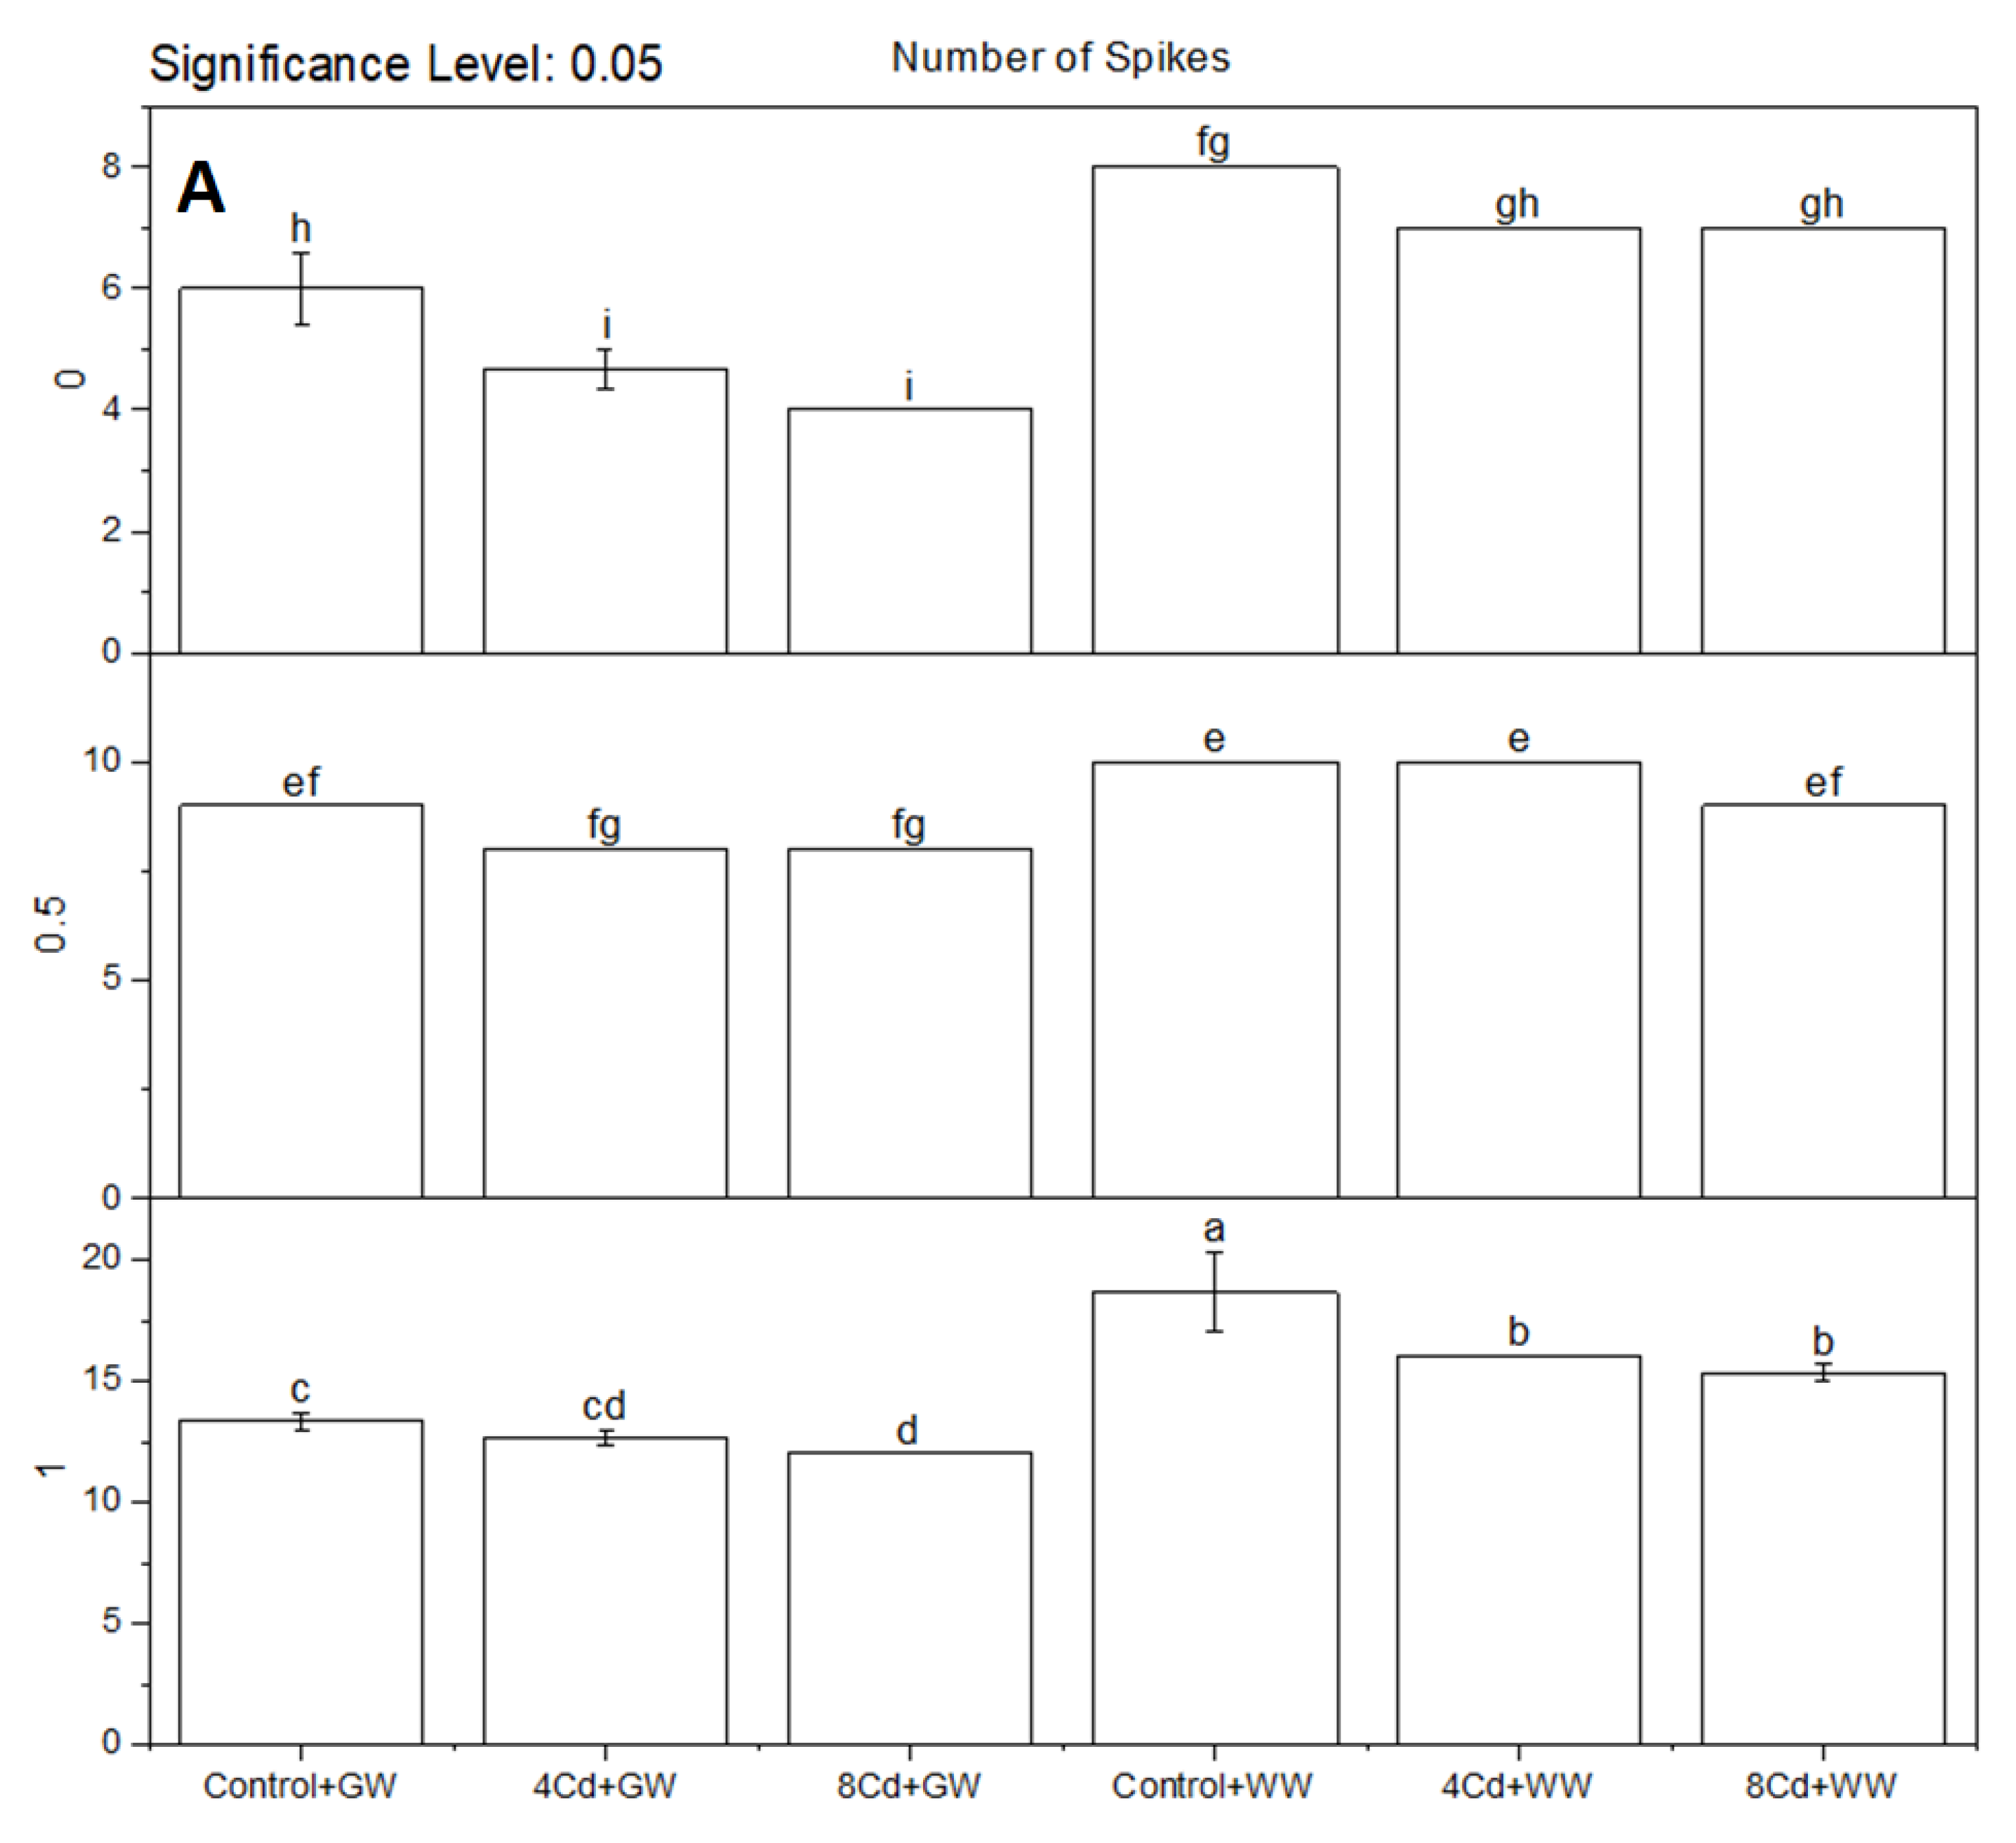
Treatment control showed a significant increase from 4Cd and 8Cd for the number of spikes in GW irrigations at 0% AC (Figure 4). Application of control + WW, 4Cd + WW, and 8Cd + WW remained non-significant at 0% AC for the number of spikes. A significant increase was observed in control and 8Cd for the number of spikes at 0.5% AC where GW was applied. There was no significant change in the number of spikes was noted among control, 4Cd, and 8Cd, where rice was irrigated with WW at 0.5% AC. The number of spikes was non-significant in 4Cd + GW and 8Cd + GW but 8Cd + GW was significantly lower over control + GW at 1% AC. However, in WW irrigation, control was significant over 4Cd and 8Cd at 1% AC for the number of spikes. Overall, the application of 1% and 0.5% AC significantly enhanced the number of spikes of rice as compared to control even at an increasing level of Cd, i.e., 4 and 8 mg Cd kg−1 soil. However, without AC, 4Cd and 8Cd significantly decreased the number of spikes of rice.
Treatment control and 4Cd showed a significant increase in fresh weight of straw from 8Cd where GW irrigations were given at 0% AC. Non-significant change was noted in control + WW and 4Cd + WW but significant with 8Cd + WW at 0% AC for the fresh weight of straw (Figure 5). Plants in control and 8Cd remained significant to each other for the fresh weight of straw at 0.5% AC where GW was applied. At 0.5% AC, the fresh weight of straw was non-significant among control and 4Cd but differed significantly over 8Cd where rice was irrigated with WW. Fresh weight of straw was non-significant in 4Cd + GW and 8Cd + GW but remained significant over control + GW at 1% AC. Overall, application of 1% and 0.5% AC significantly increased the fresh weight of straw of rice as compared to control even at an increasing level of Cd, i.e., 4 and 8 mg Cd kg−1 soil. However, without AC, 4Cd and 8Cd significantly decreased the fresh weight of straw of rice.
In WW irrigation, control differed significantly from 4Cd and 8Cd at 1% AC for fresh weight of a straw. However, control was significant over 8Cd for the fresh weight of spikes in GW irrigations at 0% AC (Figure 6). Control + WW, 4Cd + WW and 8Cd + WW were significantly different at 0% AC for the fresh weight of spikes. Treatment control and 8Cd differed significantly from each other for the fresh weight of spikes at 0.5% AC where GW was applied. No significant change in fresh weight of spikes was noted among control, 4Cd, and 8Cd where rice was irrigated with WW at 0.5% AC. Fresh weight of spikes remained non-significant in 4Cd + GW and 8Cd + GW but 8Cd + GW significant over control + GW at 1% AC. In WW irrigation, control was significantly different over 4Cd and 8Cd at 1% AC for the fresh weight of spike. Overall, application of 1% and 0.5% AC significantly increased the fresh weight of spikes of rice as compared to control even at an increasing level of Cd, i.e., 4 and 8 mg Cd kg−1 soil. However, without AC, 4Cd and 8Cd significantly decreased the fresh weight of spikes of rice.
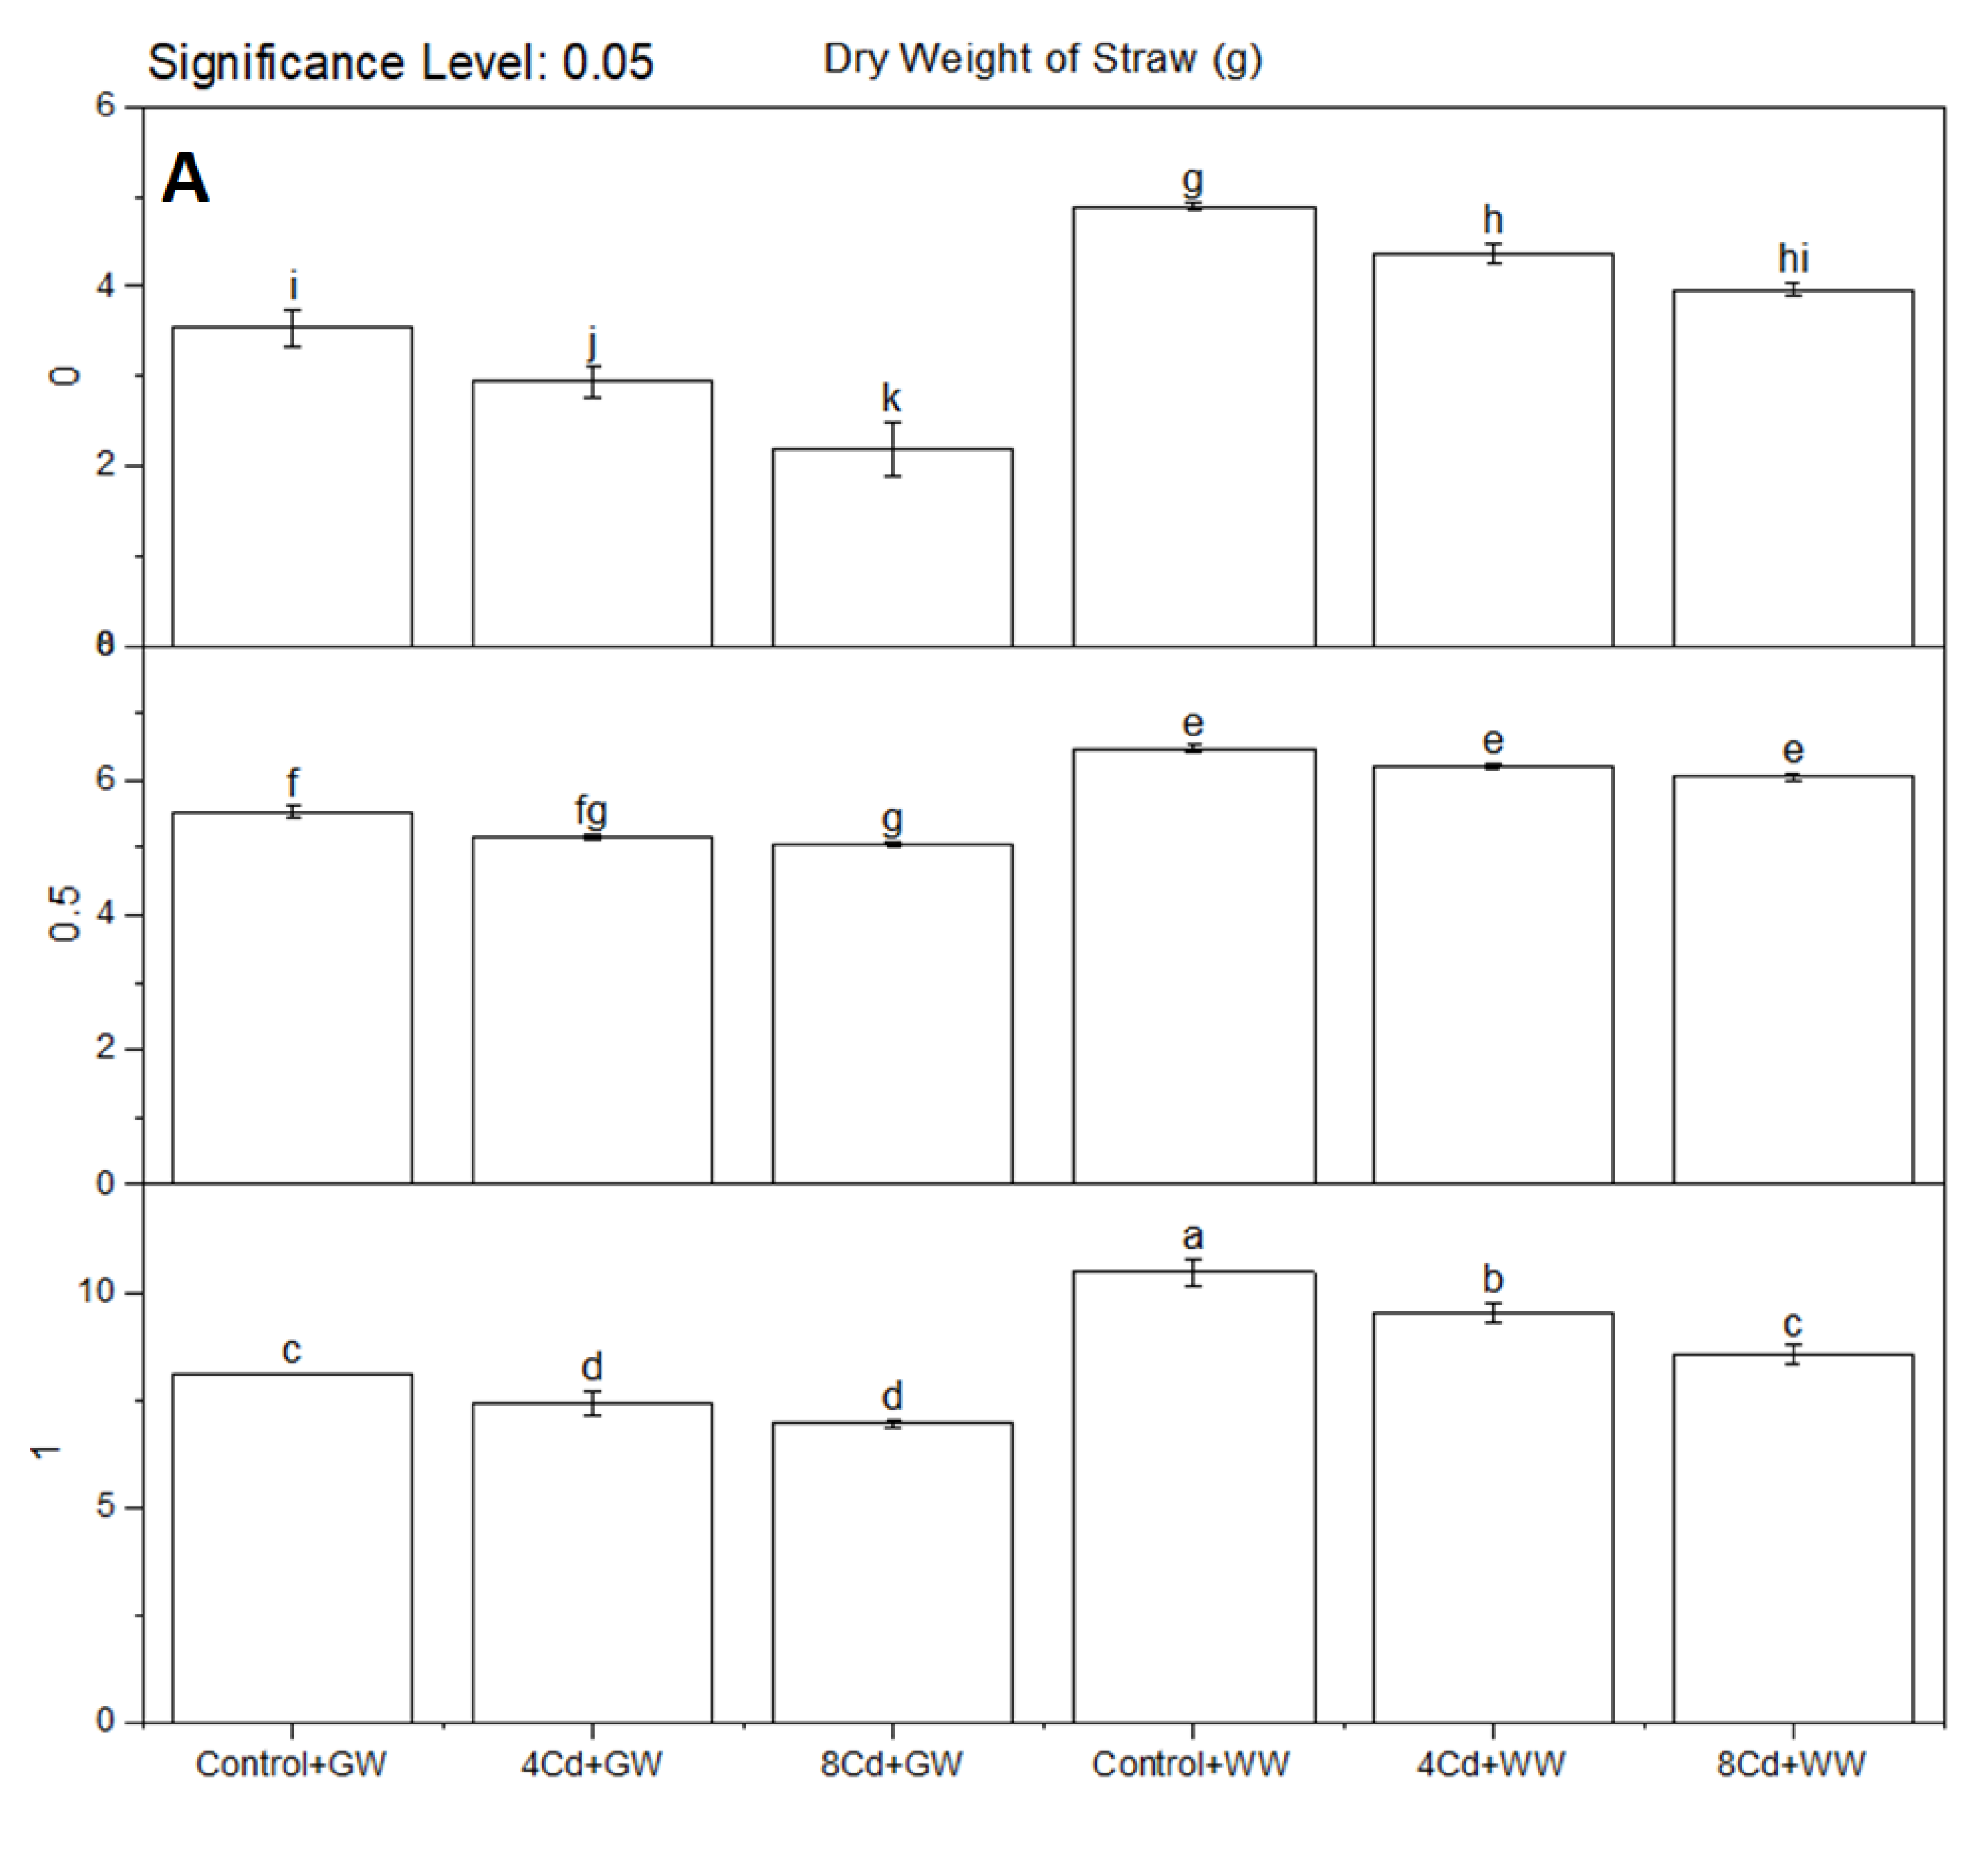
In GW irrigations at 0% AC, control treatment was significant over 4Cd and 8Cd for dry weight of straw. A significant change was observed in control + WW over 4Cd + WW and 8Cd + WW at 0% AC for dry weight of straw (Figure 7). Results show that control and 8Cd remained significant to each other for dry weight of straw at 0.5% AC with GW irrigation. No significant change in dry weight of straw was noted among control, 4Cd, and 8Cd where rice was irrigated with WW at 0.5% AC. Dry weight of straw remained non-significant in 4Cd + GW and 8Cd + GW but differed significantly over control + GW at 1% AC. Overall, application of 1% and 0.5% AC significantly increased the dry weight of straw of rice as compared to control even at an increasing level of Cd, i.e., 4 and 8 mg Cd kg−1 soil. However, without AC, 4Cd and 8Cd significantly decreased dry weight of straw of rice.
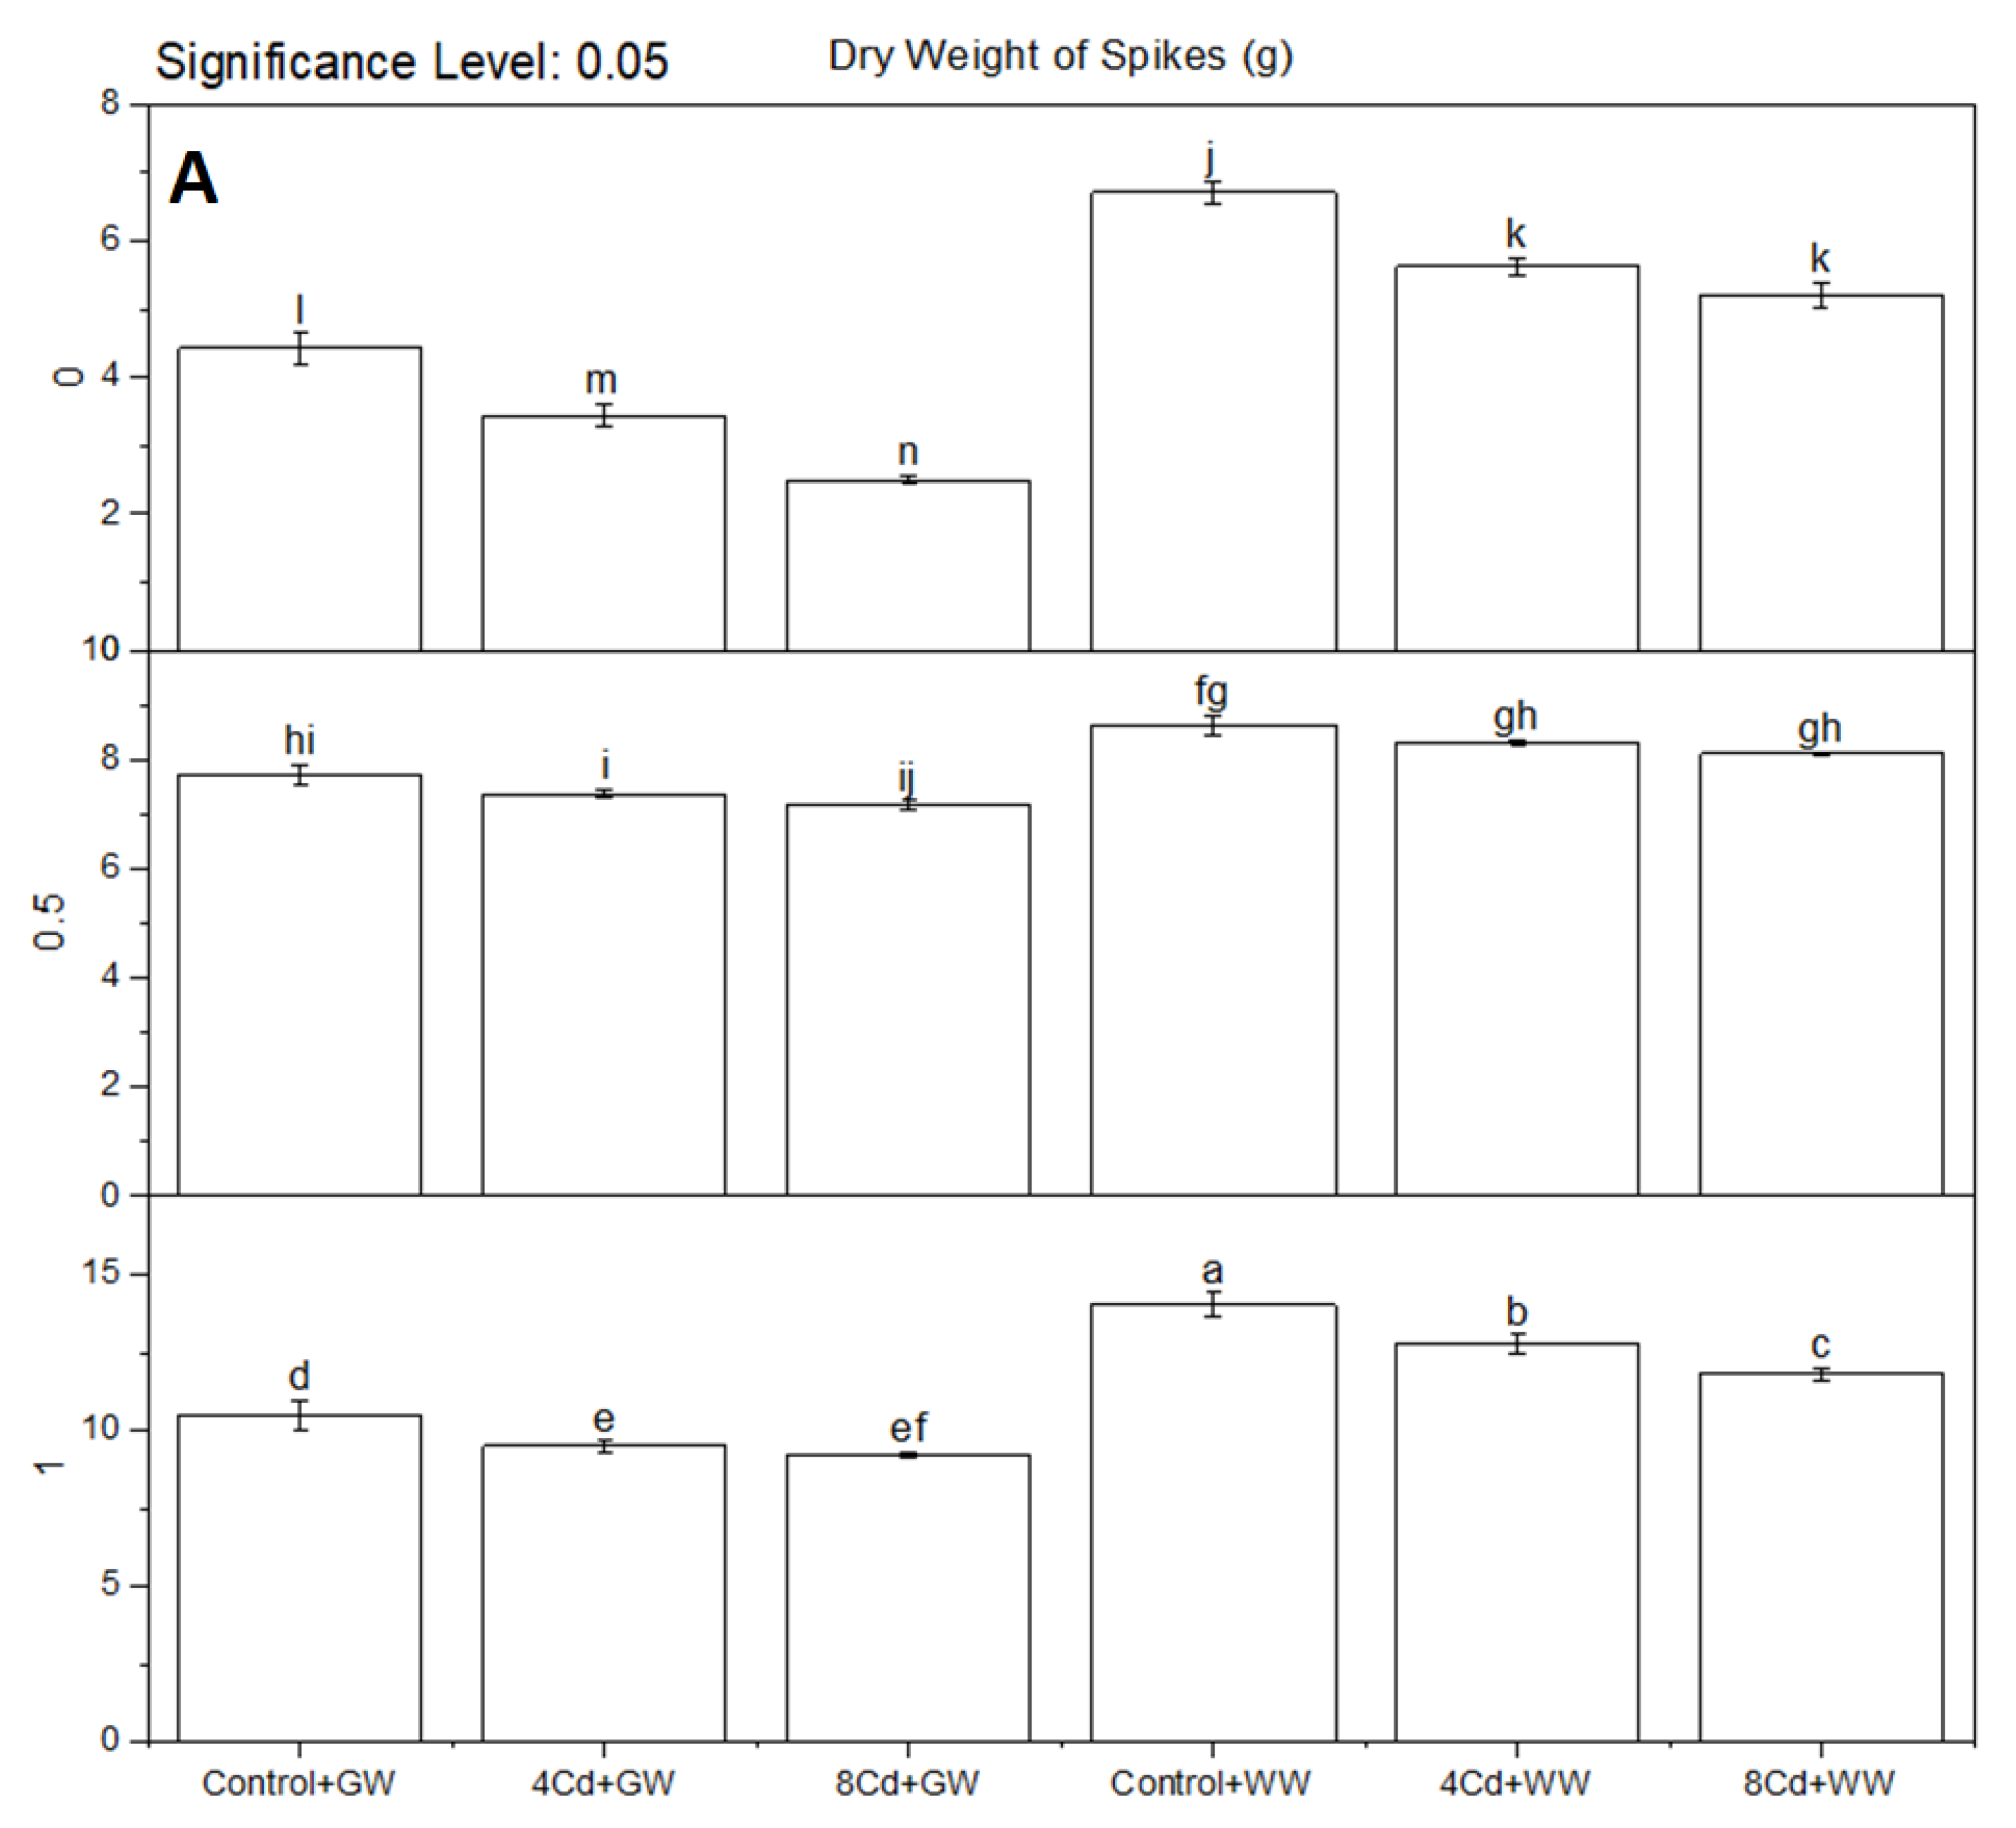
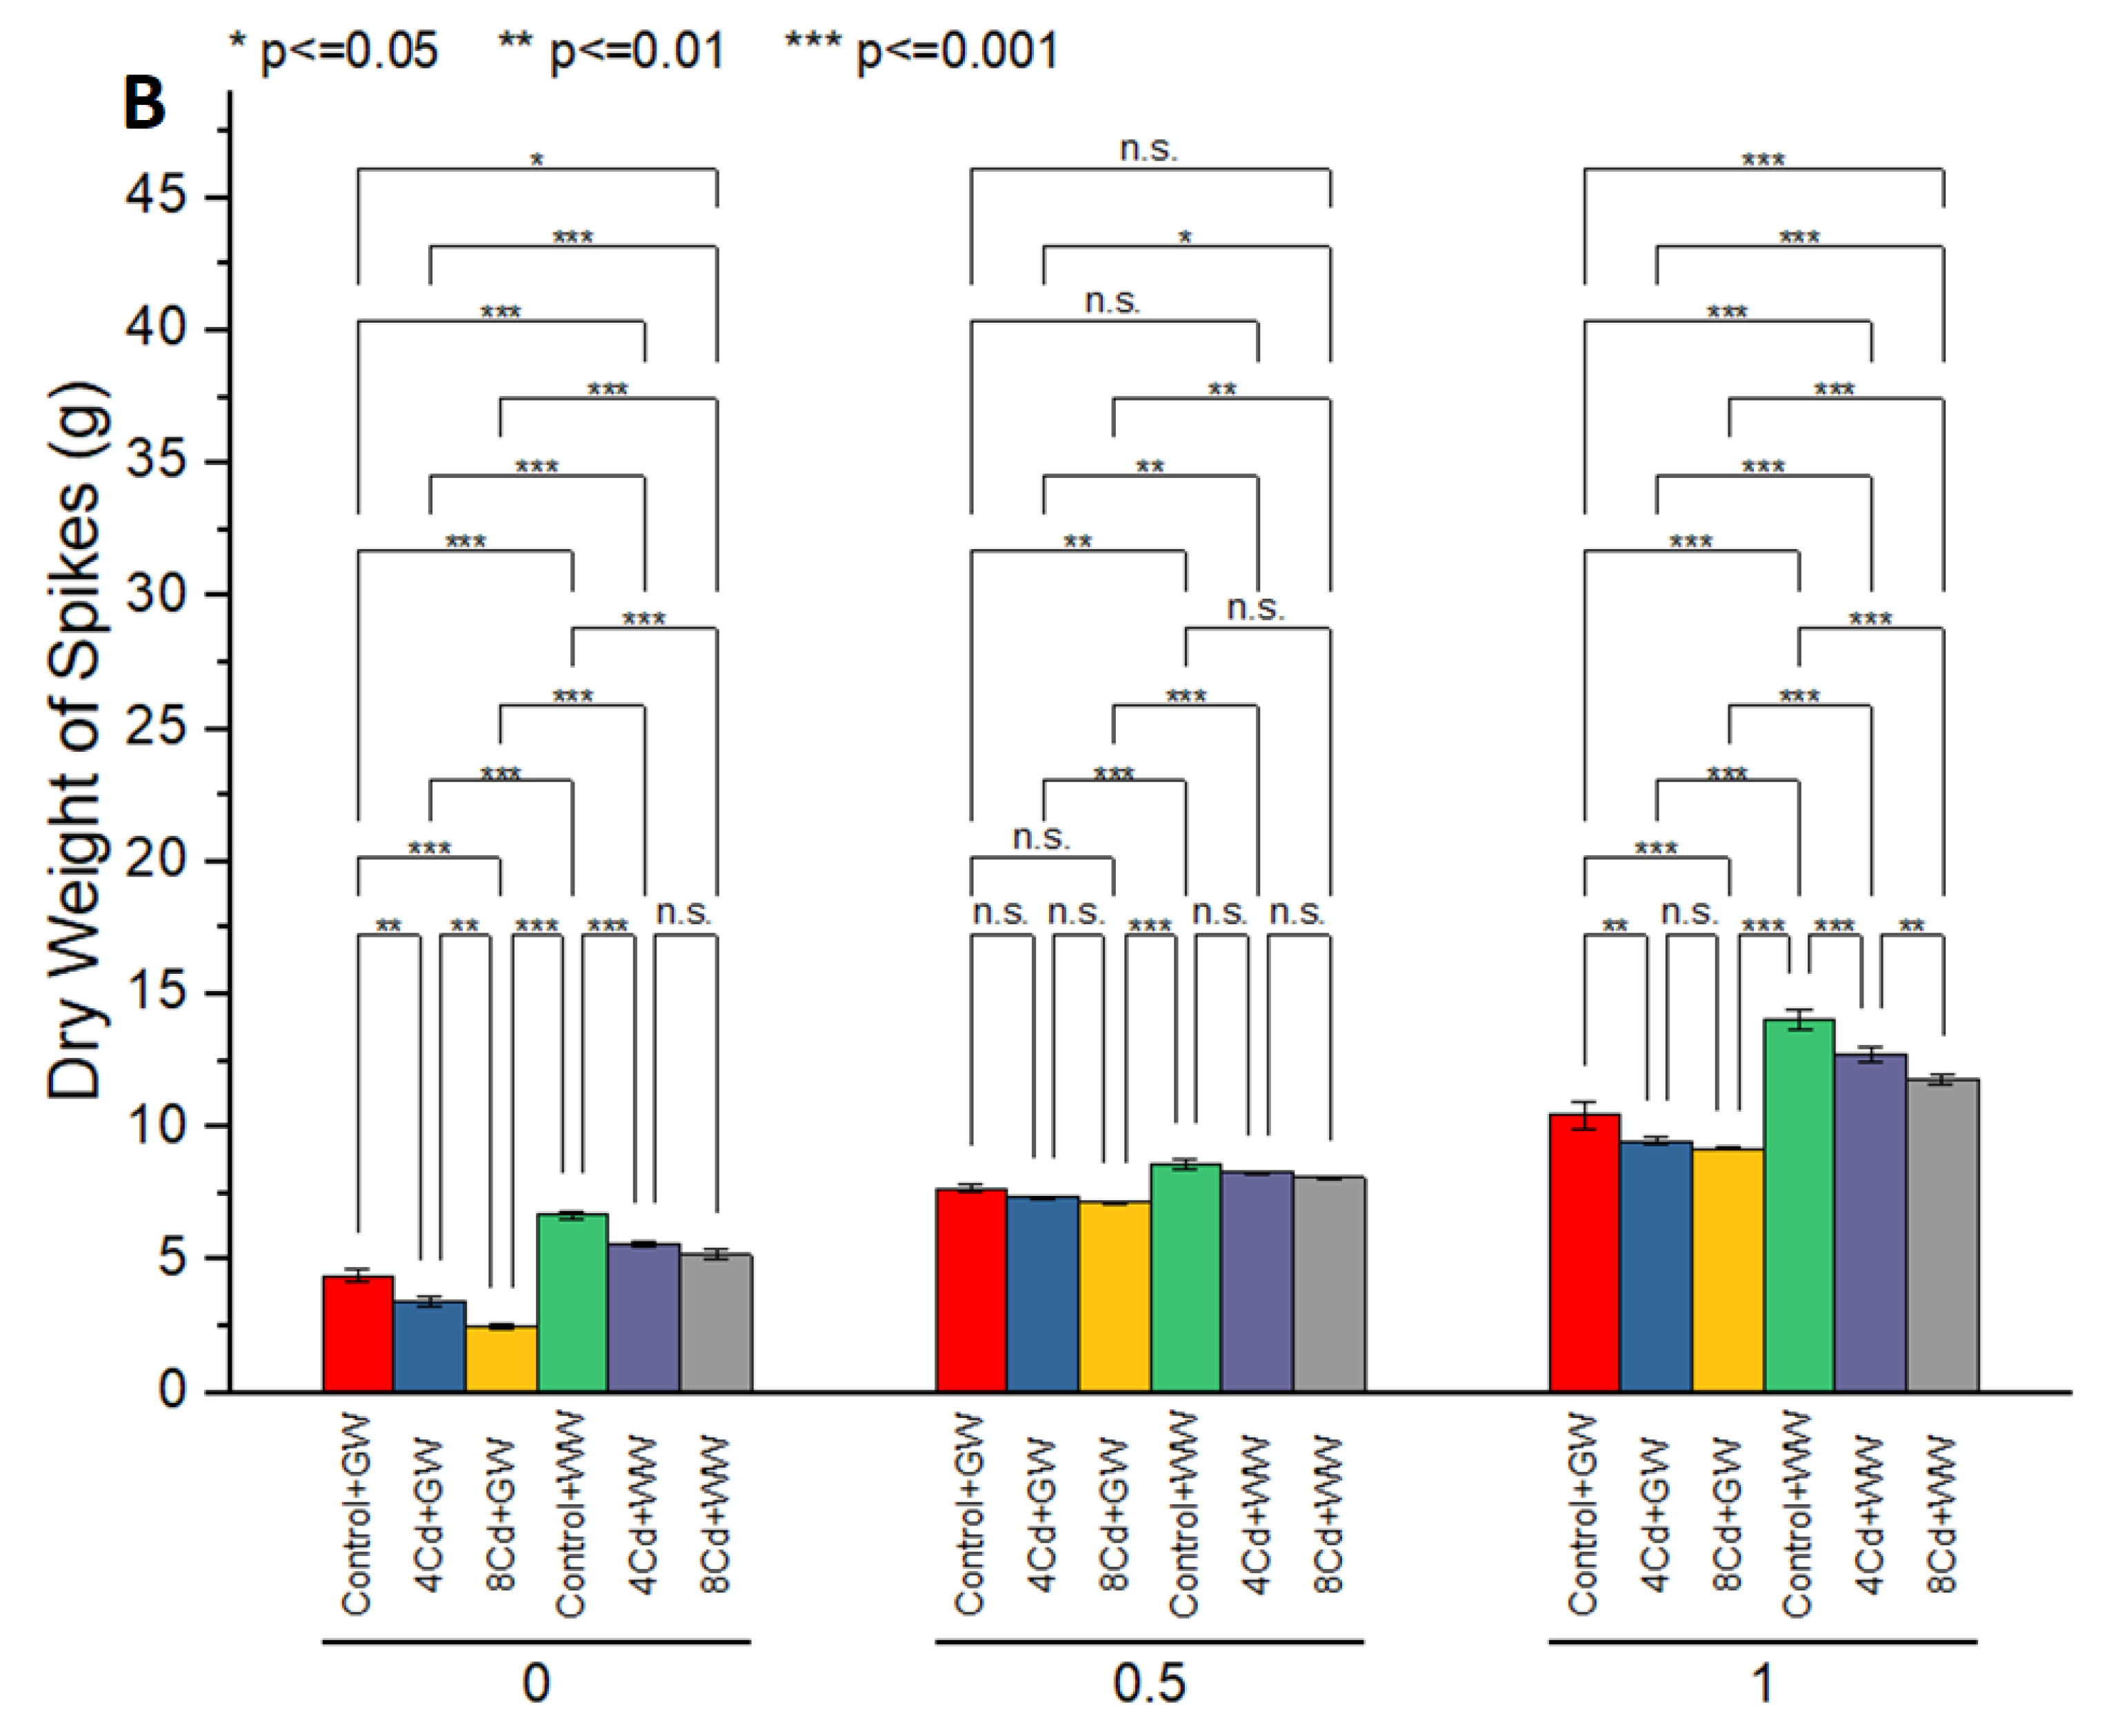
In WW irrigation, control was significantly different over 4Cd and 8Cd at 1% AC for dry weight of straw. Treatment control was significantly different over 4Cd and 8Cd for dry weight of spikes in GW irrigations at 0% AC. A significant change was noted in control + WW over 4Cd + WW and 8Cd + WW at 0% AC for dry weight of spikes (Figure 8). Treatment control, 4Cd, and 8Cd were non-significant to each other for dry weight of spikes at 0.5% AC where GW was applied. No significant change, also in dry weight of spikes, was noted among control, 4Cd, and 8Cd where rice was irrigated with WW at 0.5% AC. Dry weight of spikes was statistically alike in 4Cd + GW and 8Cd + GW but differed significantly over control + GW at 1% AC. In WW irrigation, control was significantly different over 4Cd and 8Cd at 1% AC for dry weight of spikes. Overall, application of 1% and 0.5% AC significantly increased the dry weight of spikes of rice as compared to control even at an increasing level of Cd, i.e., 4 and 8 mg Cd kg−1 soil. However, without AC, 4Cd and 8Cd significantly decreased dry weight of spikes of rice.
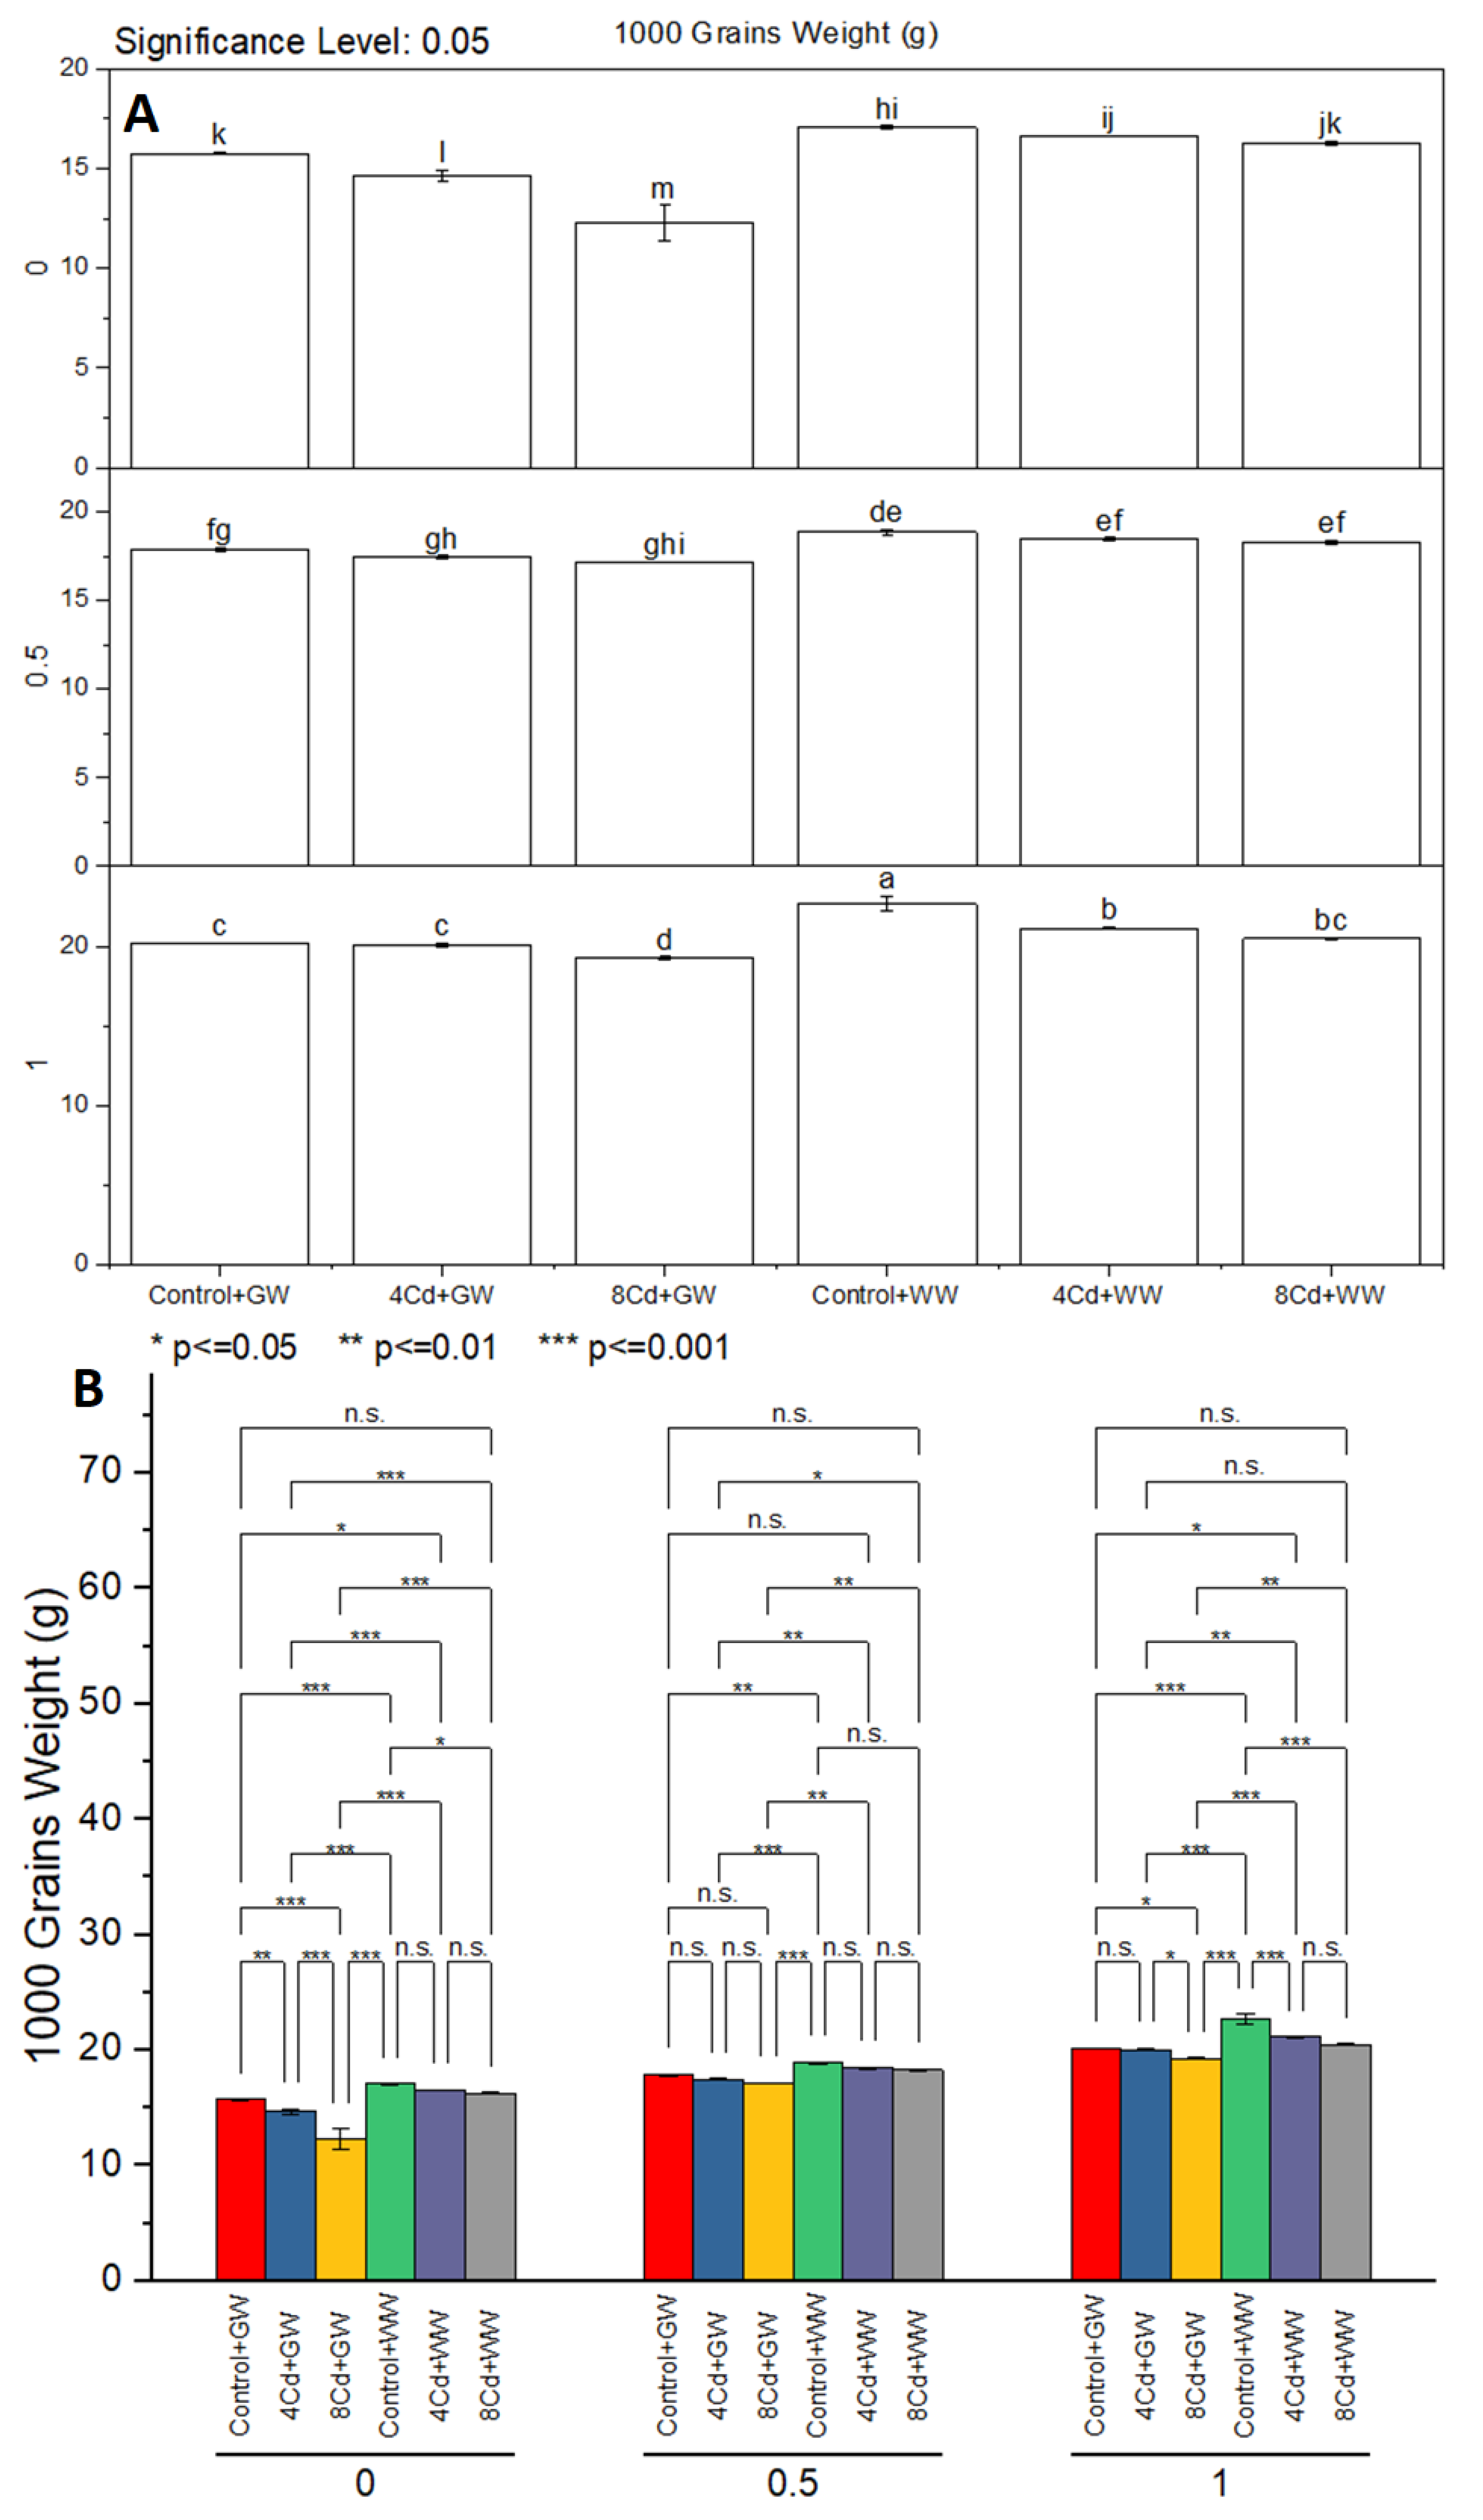
Application of 4Cd and 8Cd significantly decreased 1000 grains weight over control in GW irrigations at 0% AC. A significant change was noted in control + WW over 8Cd + WW at 0% AC for 1000 grains weight (Figure 9). Treatment control, 4Cd, and 8Cd were non-significant to each other for 1000 grains weight at 0.5% AC where GW was applied. No significant change was also in 1000 grains weight was noted among control, 4Cd, and 8Cd where rice was irrigated with WW at 0.5% AC. The 1000 grains weight in control was statistically alike with 4Cd + GW but differed significantly over 8Cd + GW at 1% AC. In WW irrigation, control was significantly different over 4Cd and 8Cd at 1% AC for 1000 grains weight.
Treatment and 4Cd control were significantly different over 8Cd for chlorophyll content in GW irrigations at 0% AC. A significant change was noted in control + WW over 8Cd + WW at 0% AC for chlorophyll content. Treatment control and 4Cd were non-significant to each other but control was significant over 8Cd for chlorophyll content at 0.5% AC where GW was applied (Figure 10). No significant change was also in chlorophyll content was noted among control, 4Cd, and 8Cd where rice was irrigated with WW at 0.5% AC. The chlorophyll content in control was statistically alike with 4Cd + GW but differed significantly over 8Cd + GW at 1% AC. In WW irrigation, control was significantly different over 8Cd at 1% AC for chlorophyll content.
Treatment control was significantly different over 4Cd and 8Cd for electrolyte leakage in GW irrigations at 0% AC. A significant change was noted in control + WW over 8Cd + WW at 0% AC for electrolyte leakage. Treatment control and 4Cd were non-significant to each other but control was significant over 8Cd for electrolyte leakage at 0.5% AC where GW was applied (Figure 11). No significant change was also in electrolyte leakage was noted among 4Cd and 8Cd where rice was irrigated with WW at 0.5% AC. The electrolyte leakage in control + GW differed significantly over 4Cd + GW and 8Cd + GW at 1% AC. In WW irrigation, control was significantly different over 4Cd and 8Cd at 1% AC for electrolyte leakage.
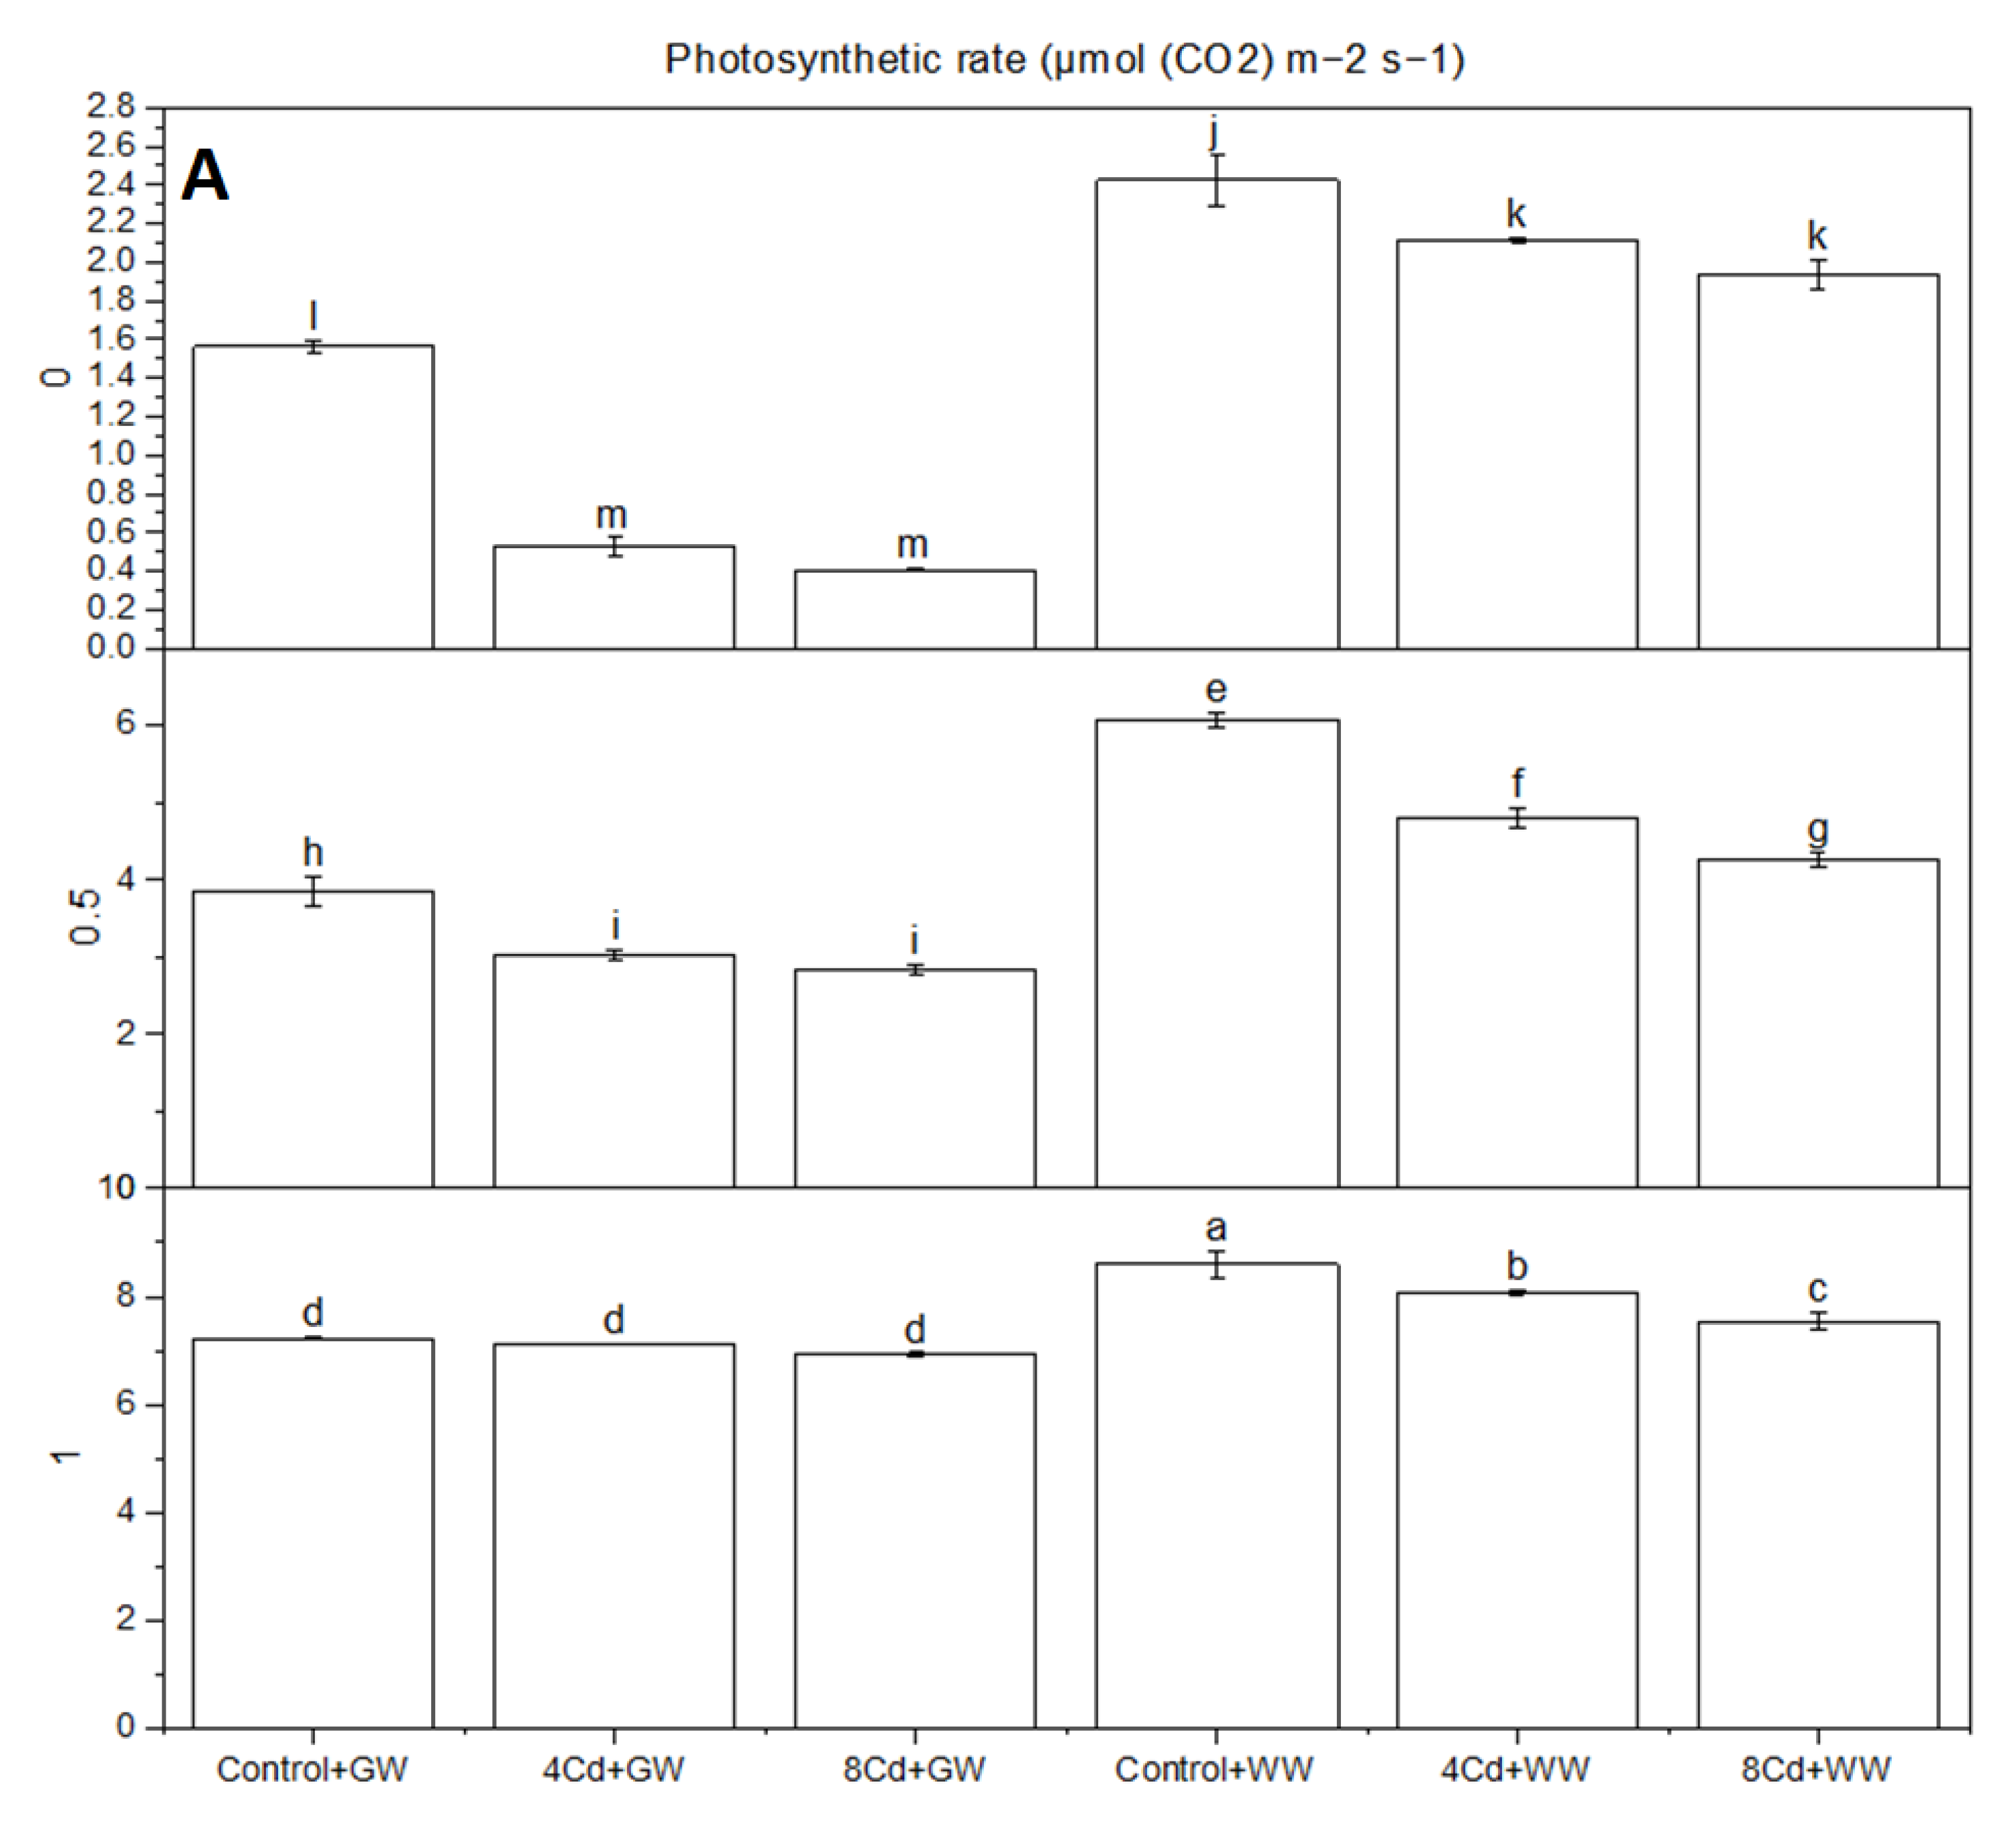
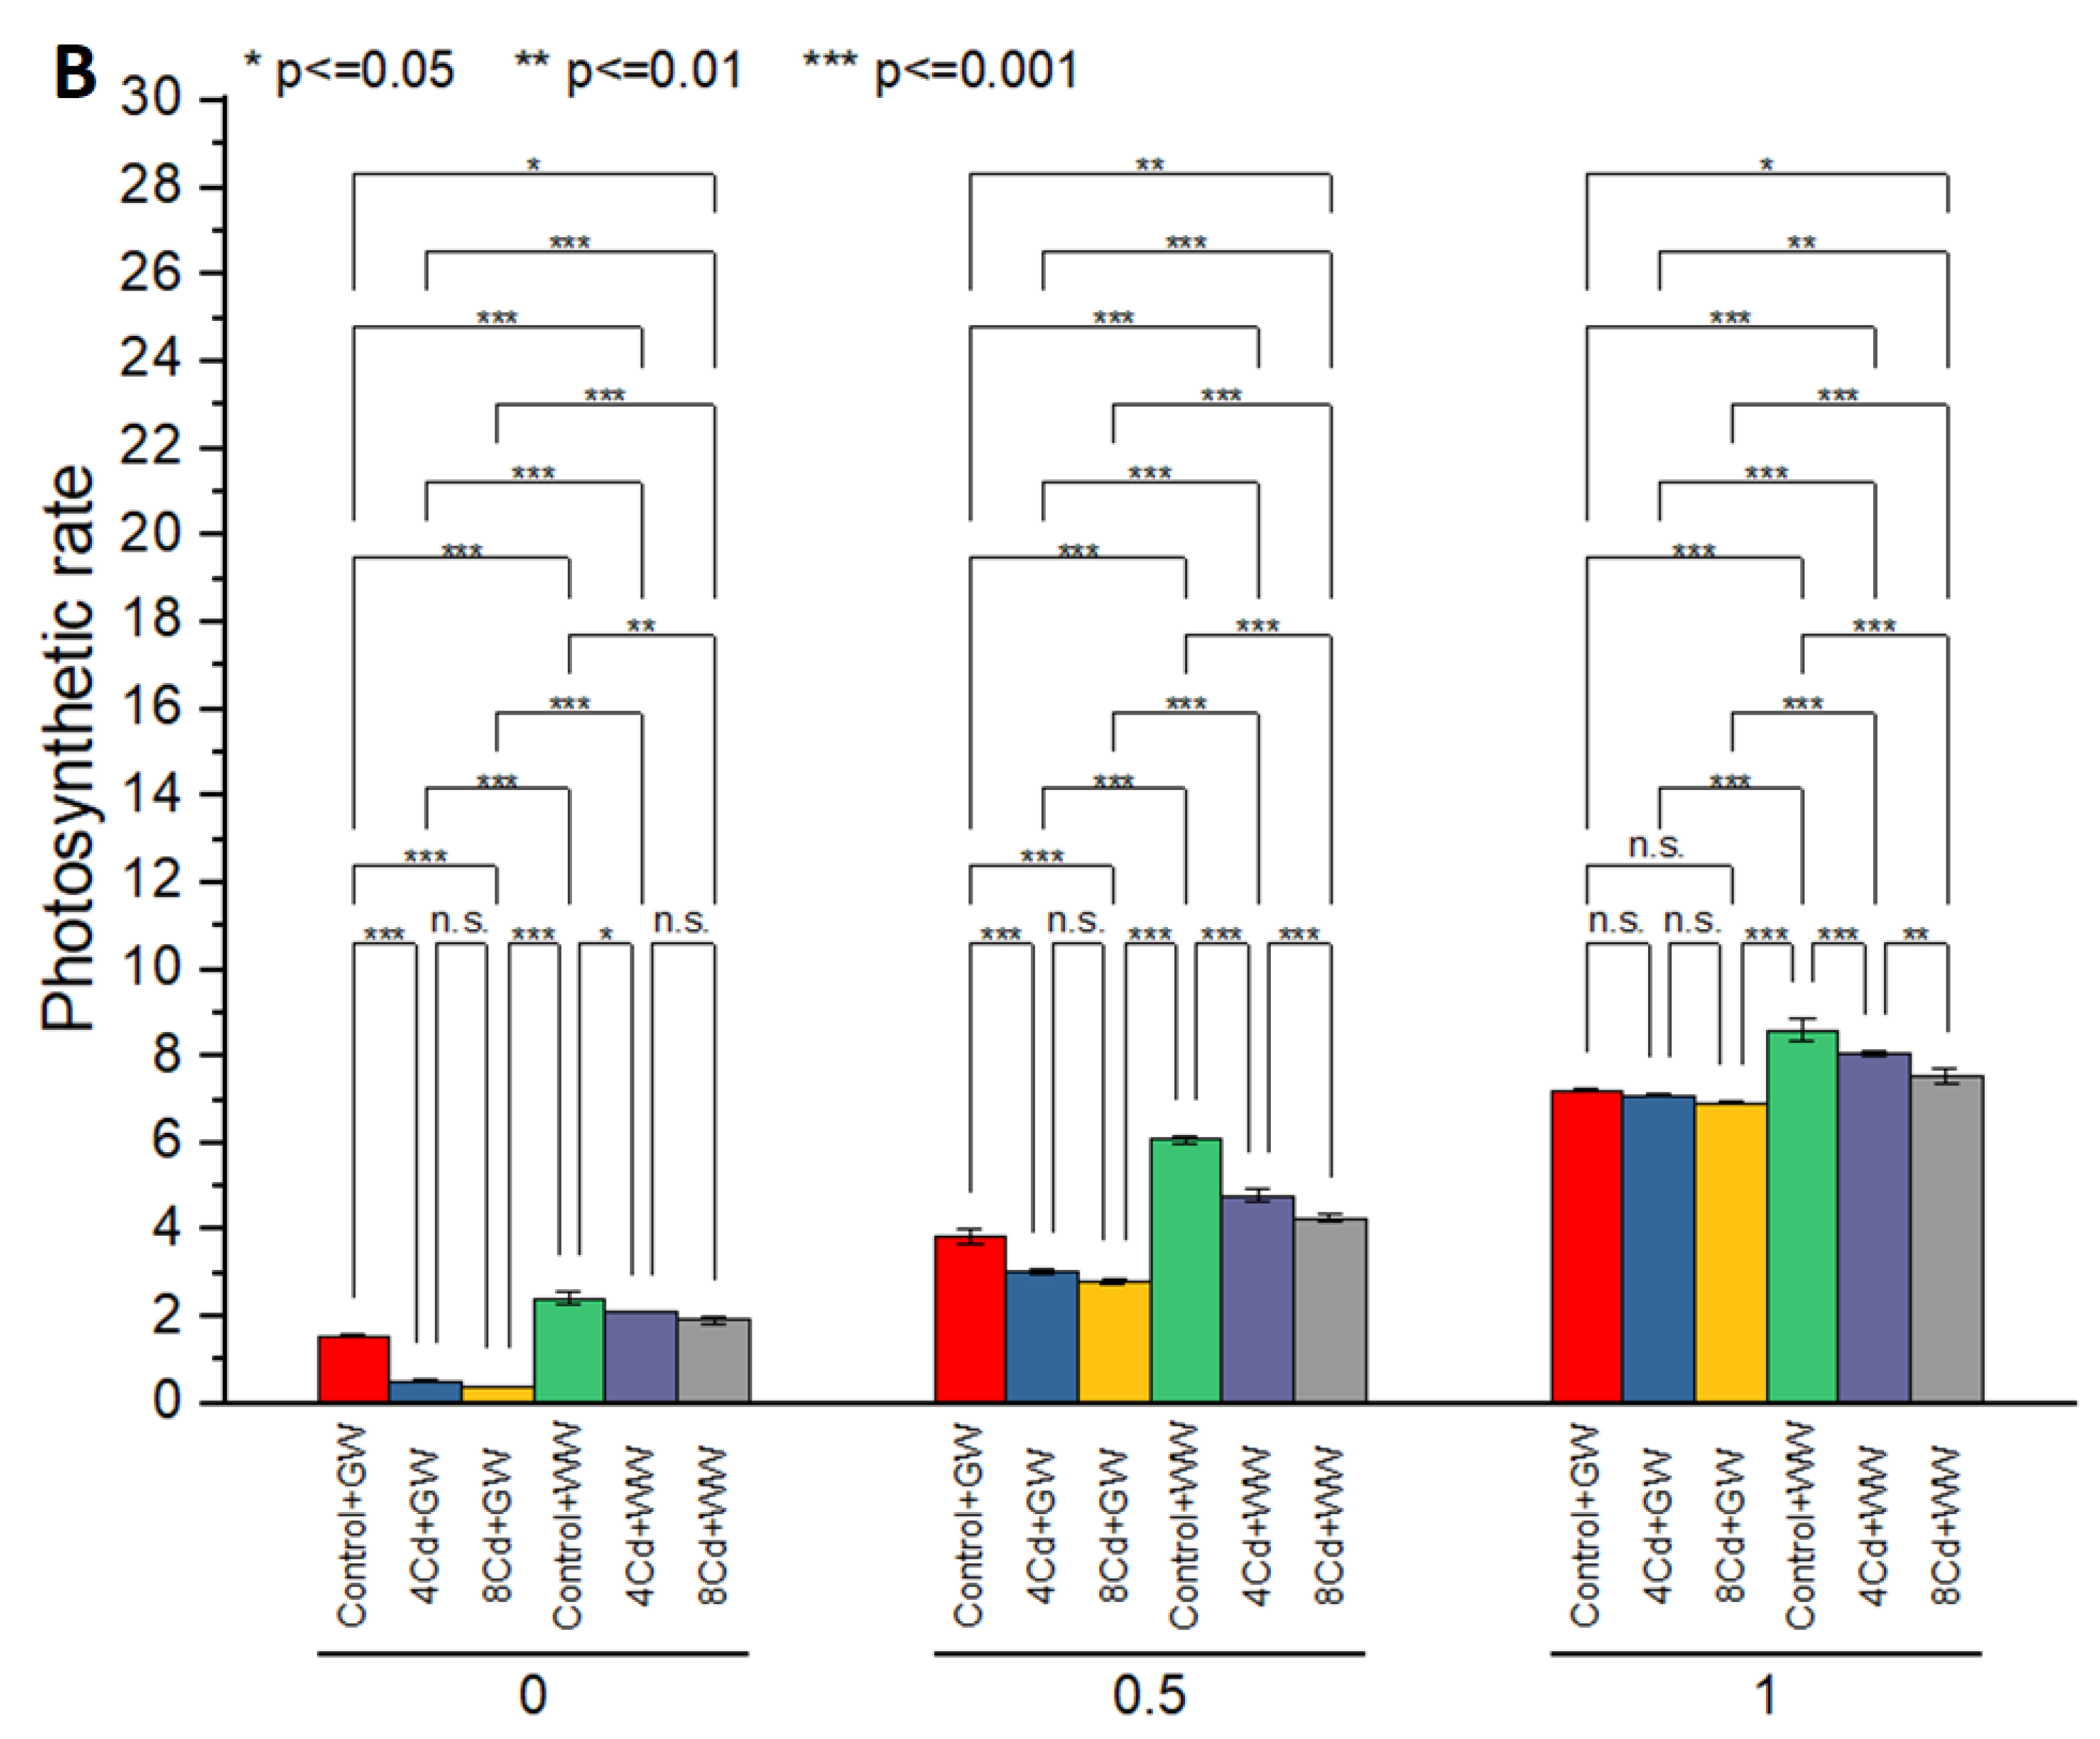
Application of 4Cd and 8Cd significantly decreased photosynthetic rate over control in GW and WW irrigations at 0 and 0.5% AC. A significant change was noted in 4Cd + WW and 8Cd + WW at 0.5% AC for photosynthetic rate (Figure 12). However, control + GW, 4Cd + GW and 8Cd + GW did not differ significantly from each other for the photosynthetic rate at 1% AC. It was observed that control + WW showed a significantly higher photosynthetic rate over 4Cd + WW and 8Cd + WW at 1% AC. An increasing level of AC also enhanced the photosynthetic rate even at 4Cd and 8Cd.
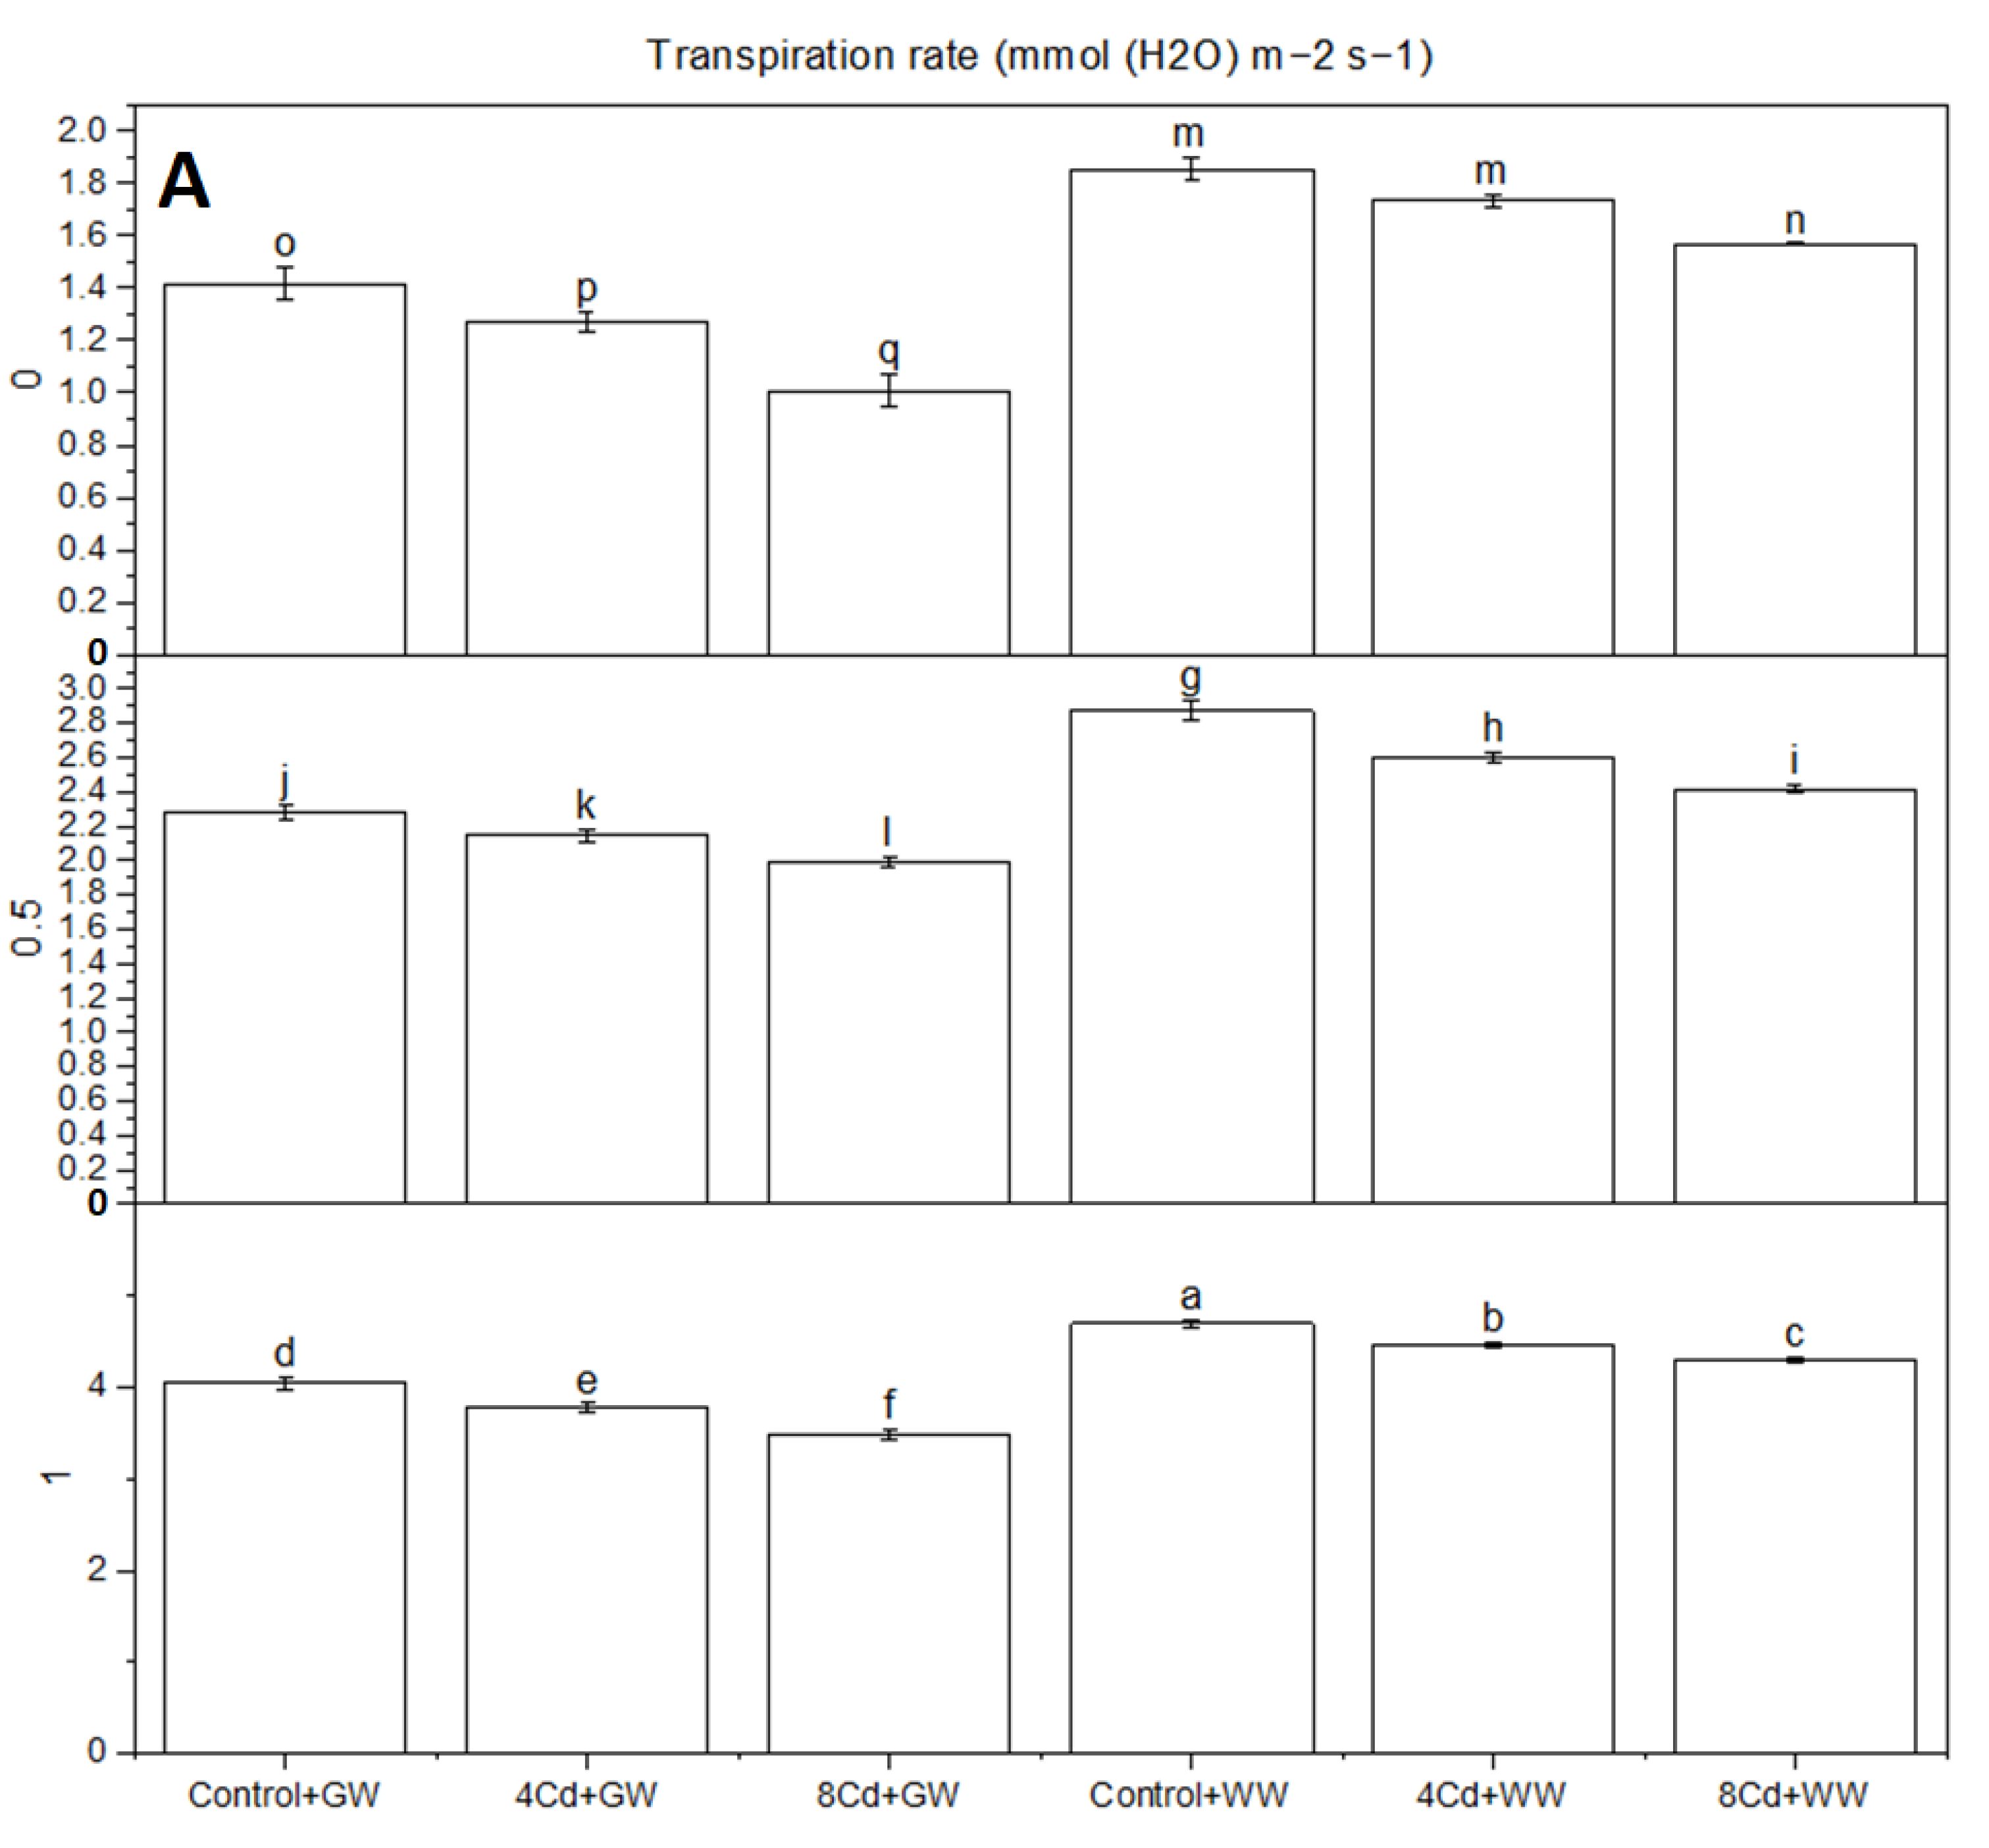
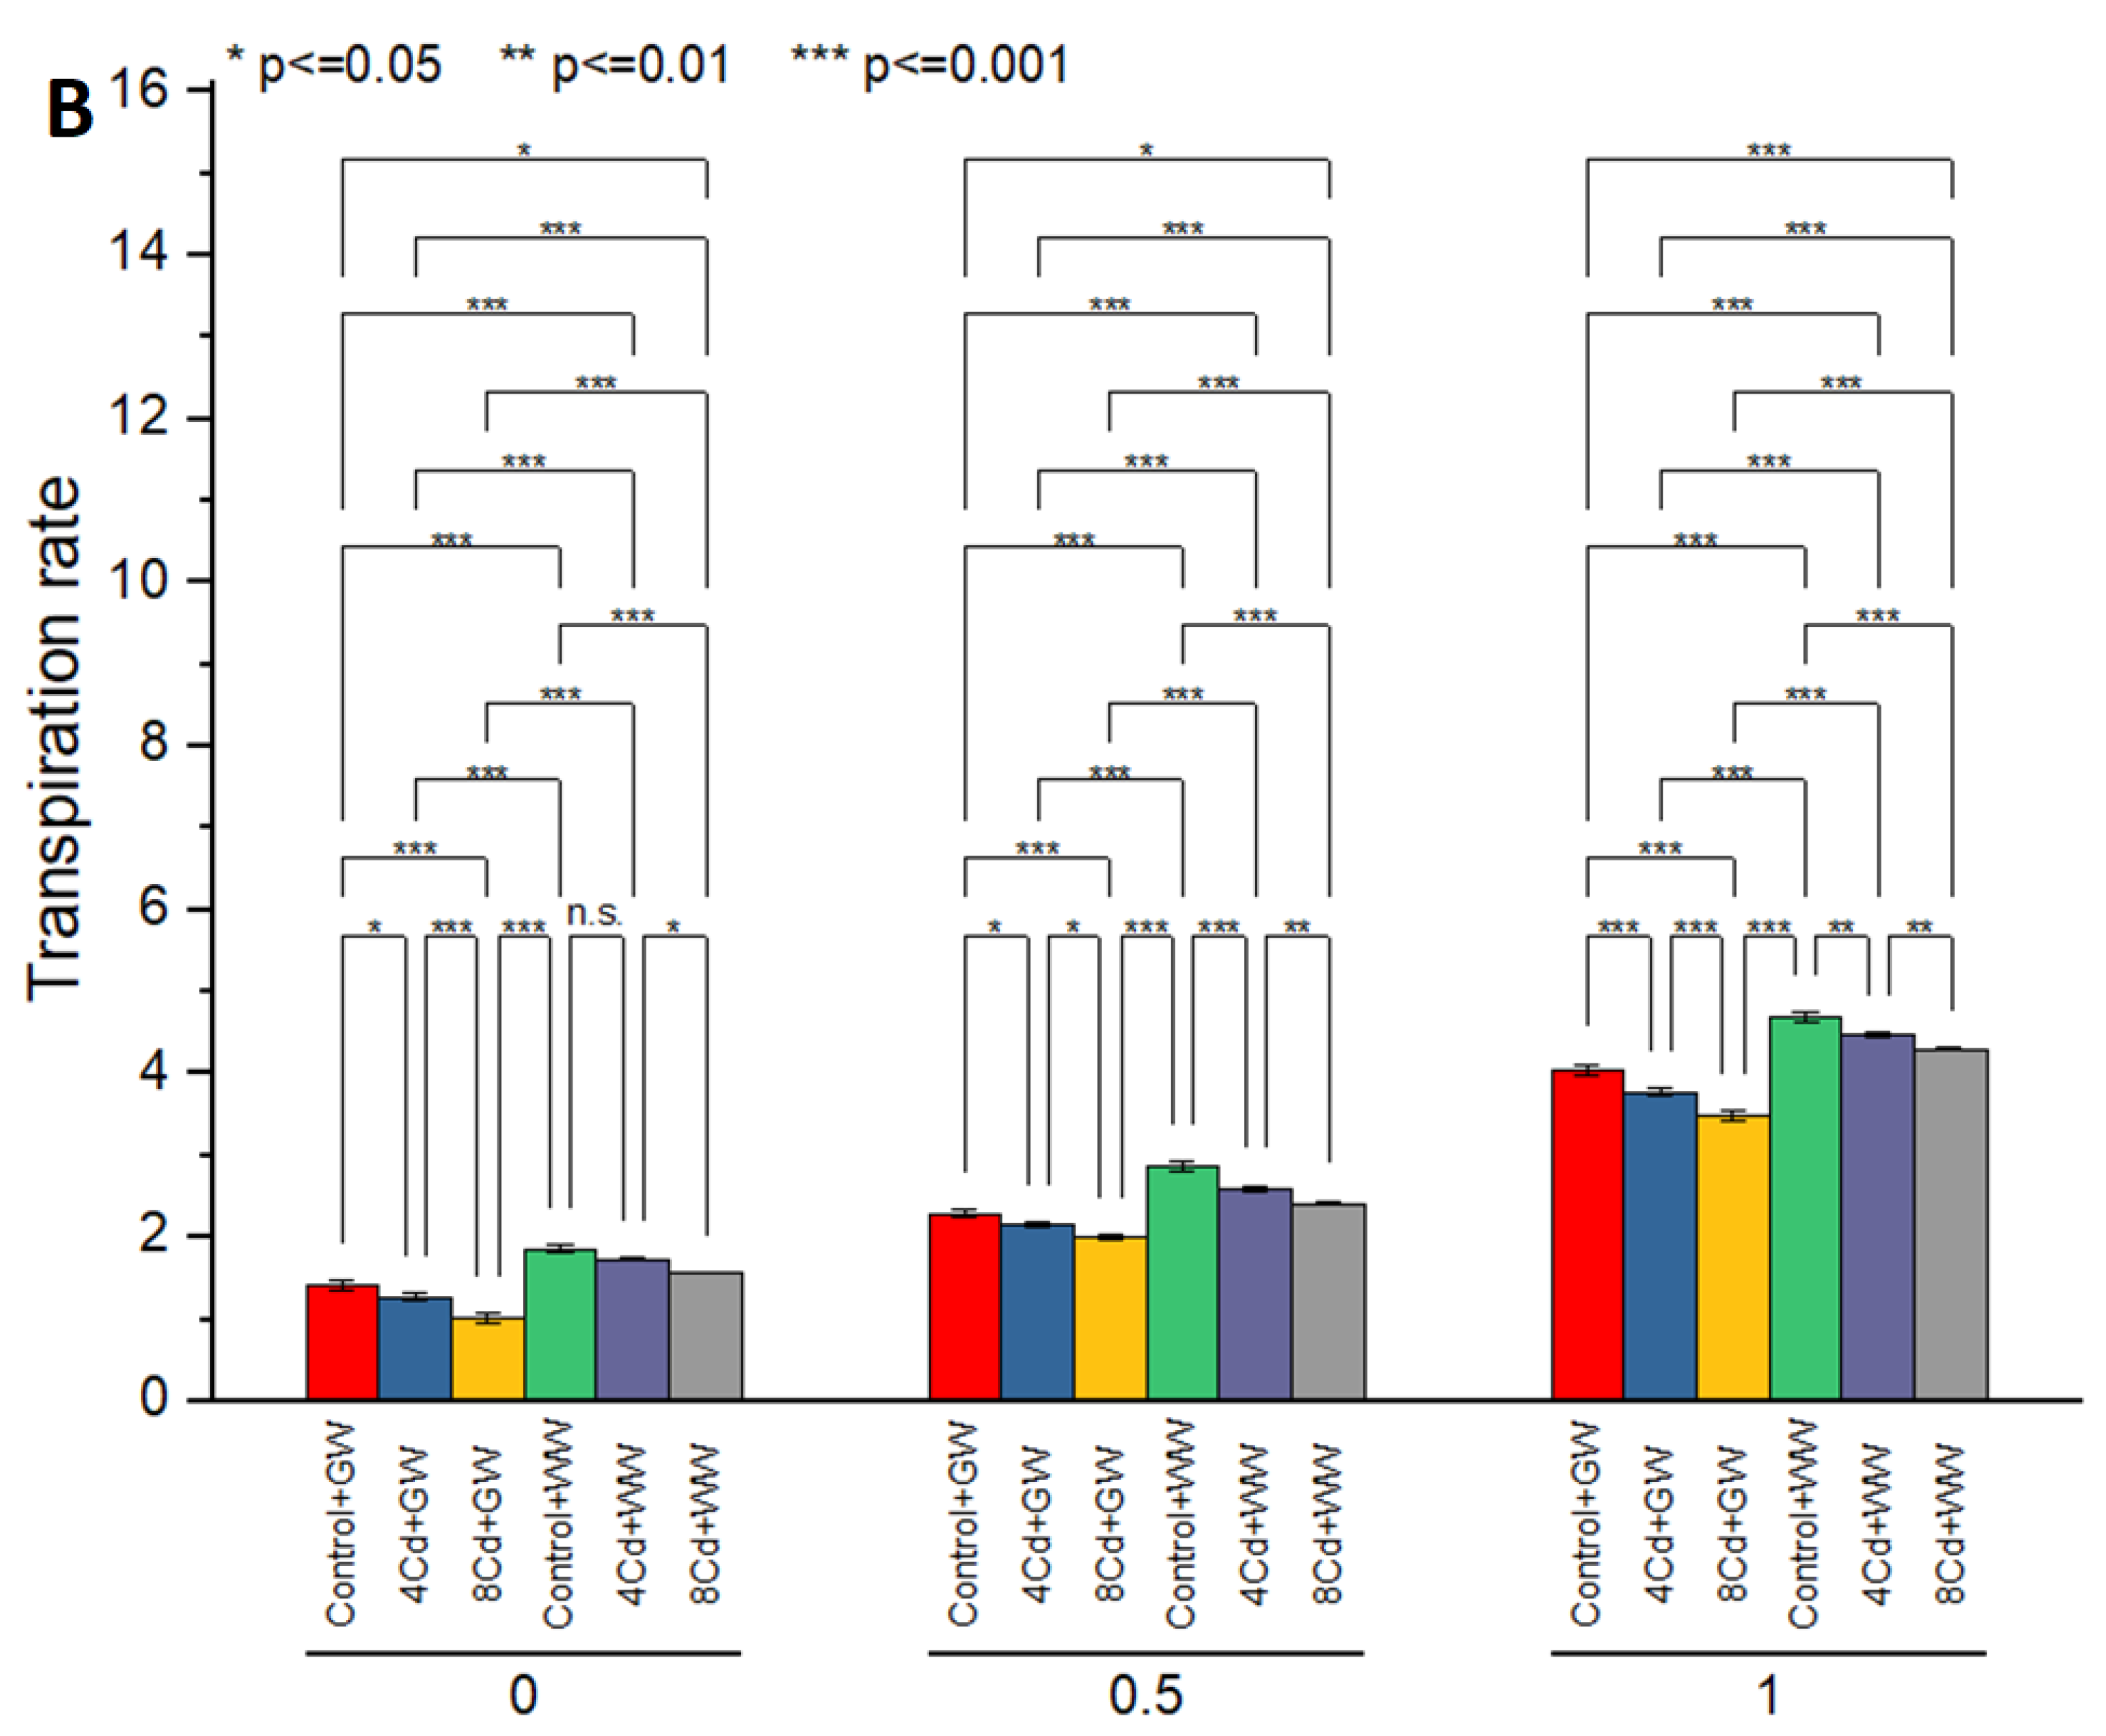
For transpiration rate, 8Cd + GW and 4Cd + GW differed significantly over control at 0% AC. No significant change was observed among control + WW and 4Cd + WW for transpiration rate at 0, 0.5 and 1% AC (Figure 13). However, 8Cd + WW was significantly different over control + WW and 4Cd + WW for transpiration rate at 0%AC. Results show that increasing levels of Cd, i.e., 4Cd and 8Cd significantly decreased transpiration rate over control at 0.5 and 1% AC where WW was irrigated. Application of 0.5 and 1% AC enhanced the transpiration rate over control (0% AC).
In the case of stomatal conductance, no significant change was observed in control + GW and 4Cd + GW at 0% AC. It was noted that 8Cd + GW differed significantly for stomatal conductance over control + GW at 0% AC (Figure 14). The same trend was also noted where WW was applied at 0% AC. Stomatal conductance showed non-significant change among 4Cd and 8Cd but significant over control at 0.5% AC in GW and WW irrigation. Results also confirmed that stomatal conductance showed non-significant change among 4Cd and 8Cd in GW but significant in WW with each other at 1% AC.
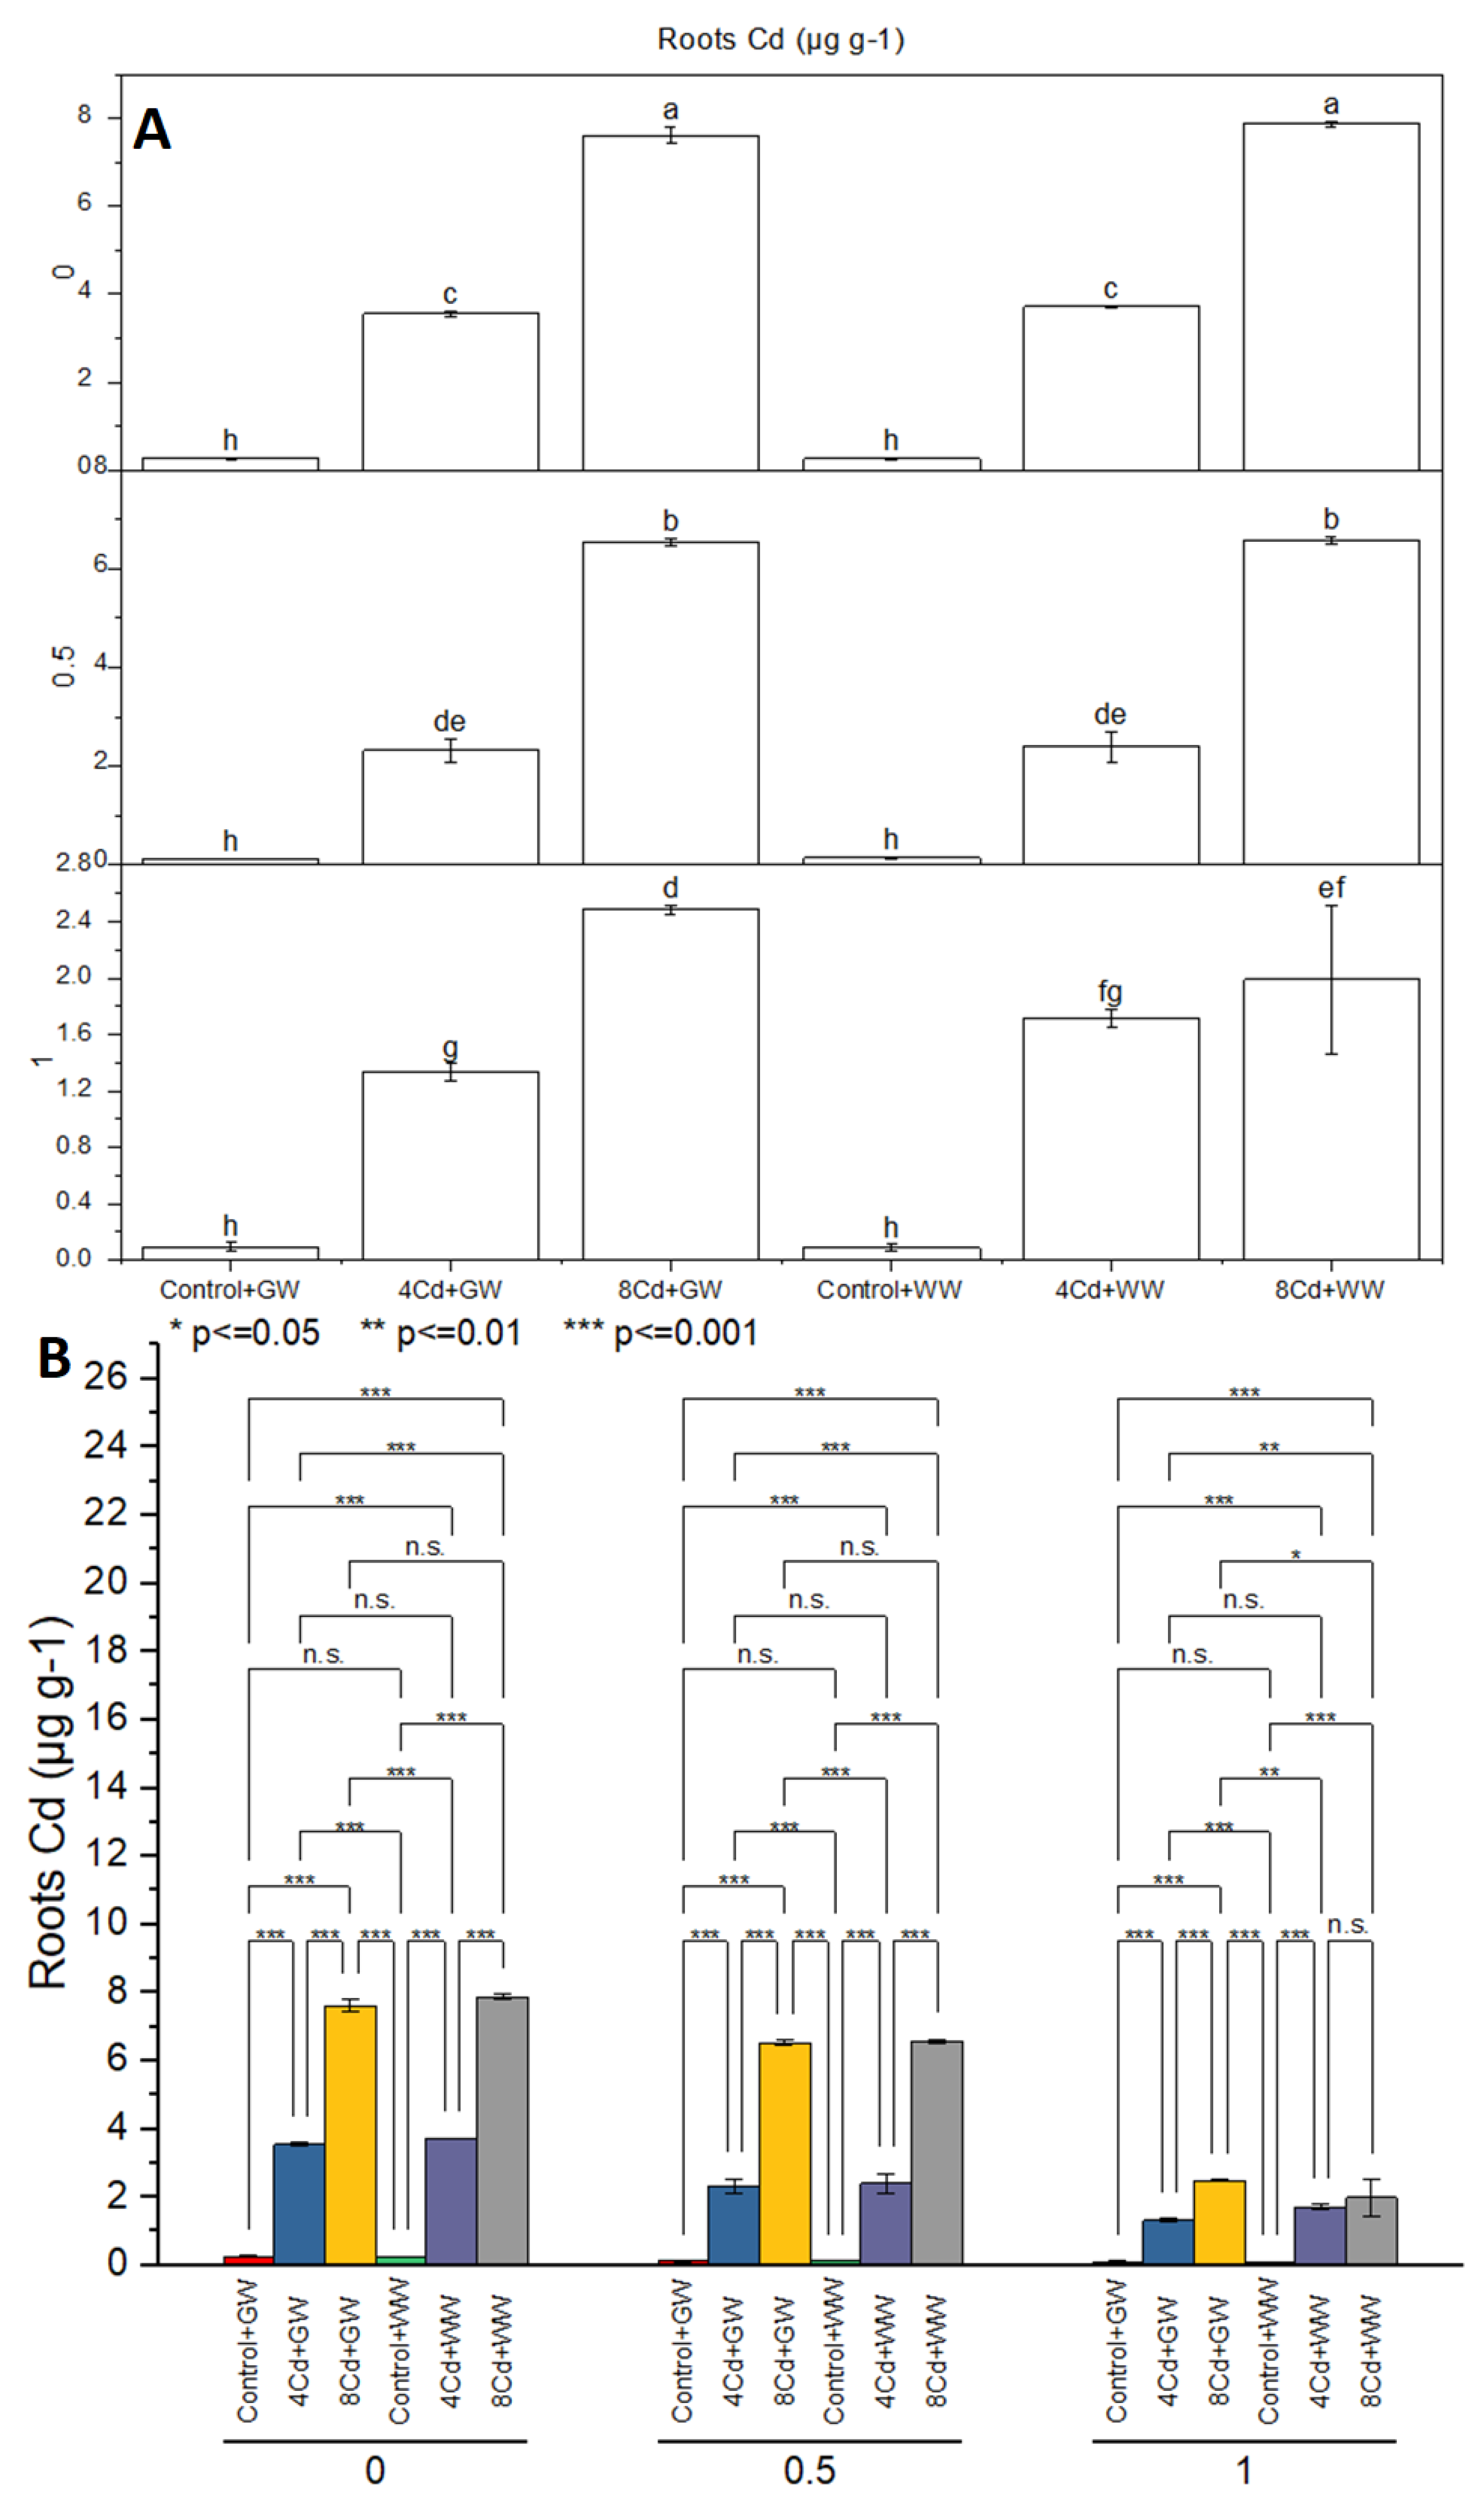
Treatment control was significantly different over 4Cd and 8Cd for root Cd concentration in GW irrigations at 0, 0.5 and 1.0% AC (Figure 15). A significant change was noted in control + WW over 4Cd + WW and 8Cd + WW at 0, 0.5 and 1.0% AC for root Cd concentration. Application of 0.5% AC significantly decreased the concentration of Cd in roots. Similarly, 1% AC differed significantly better over 0.5% and 0% AC for the decrease in Cd concentration of roots. However, the concentration of Cd was lower in 8Cd + GW over 8Cd + WW at 1% AC.
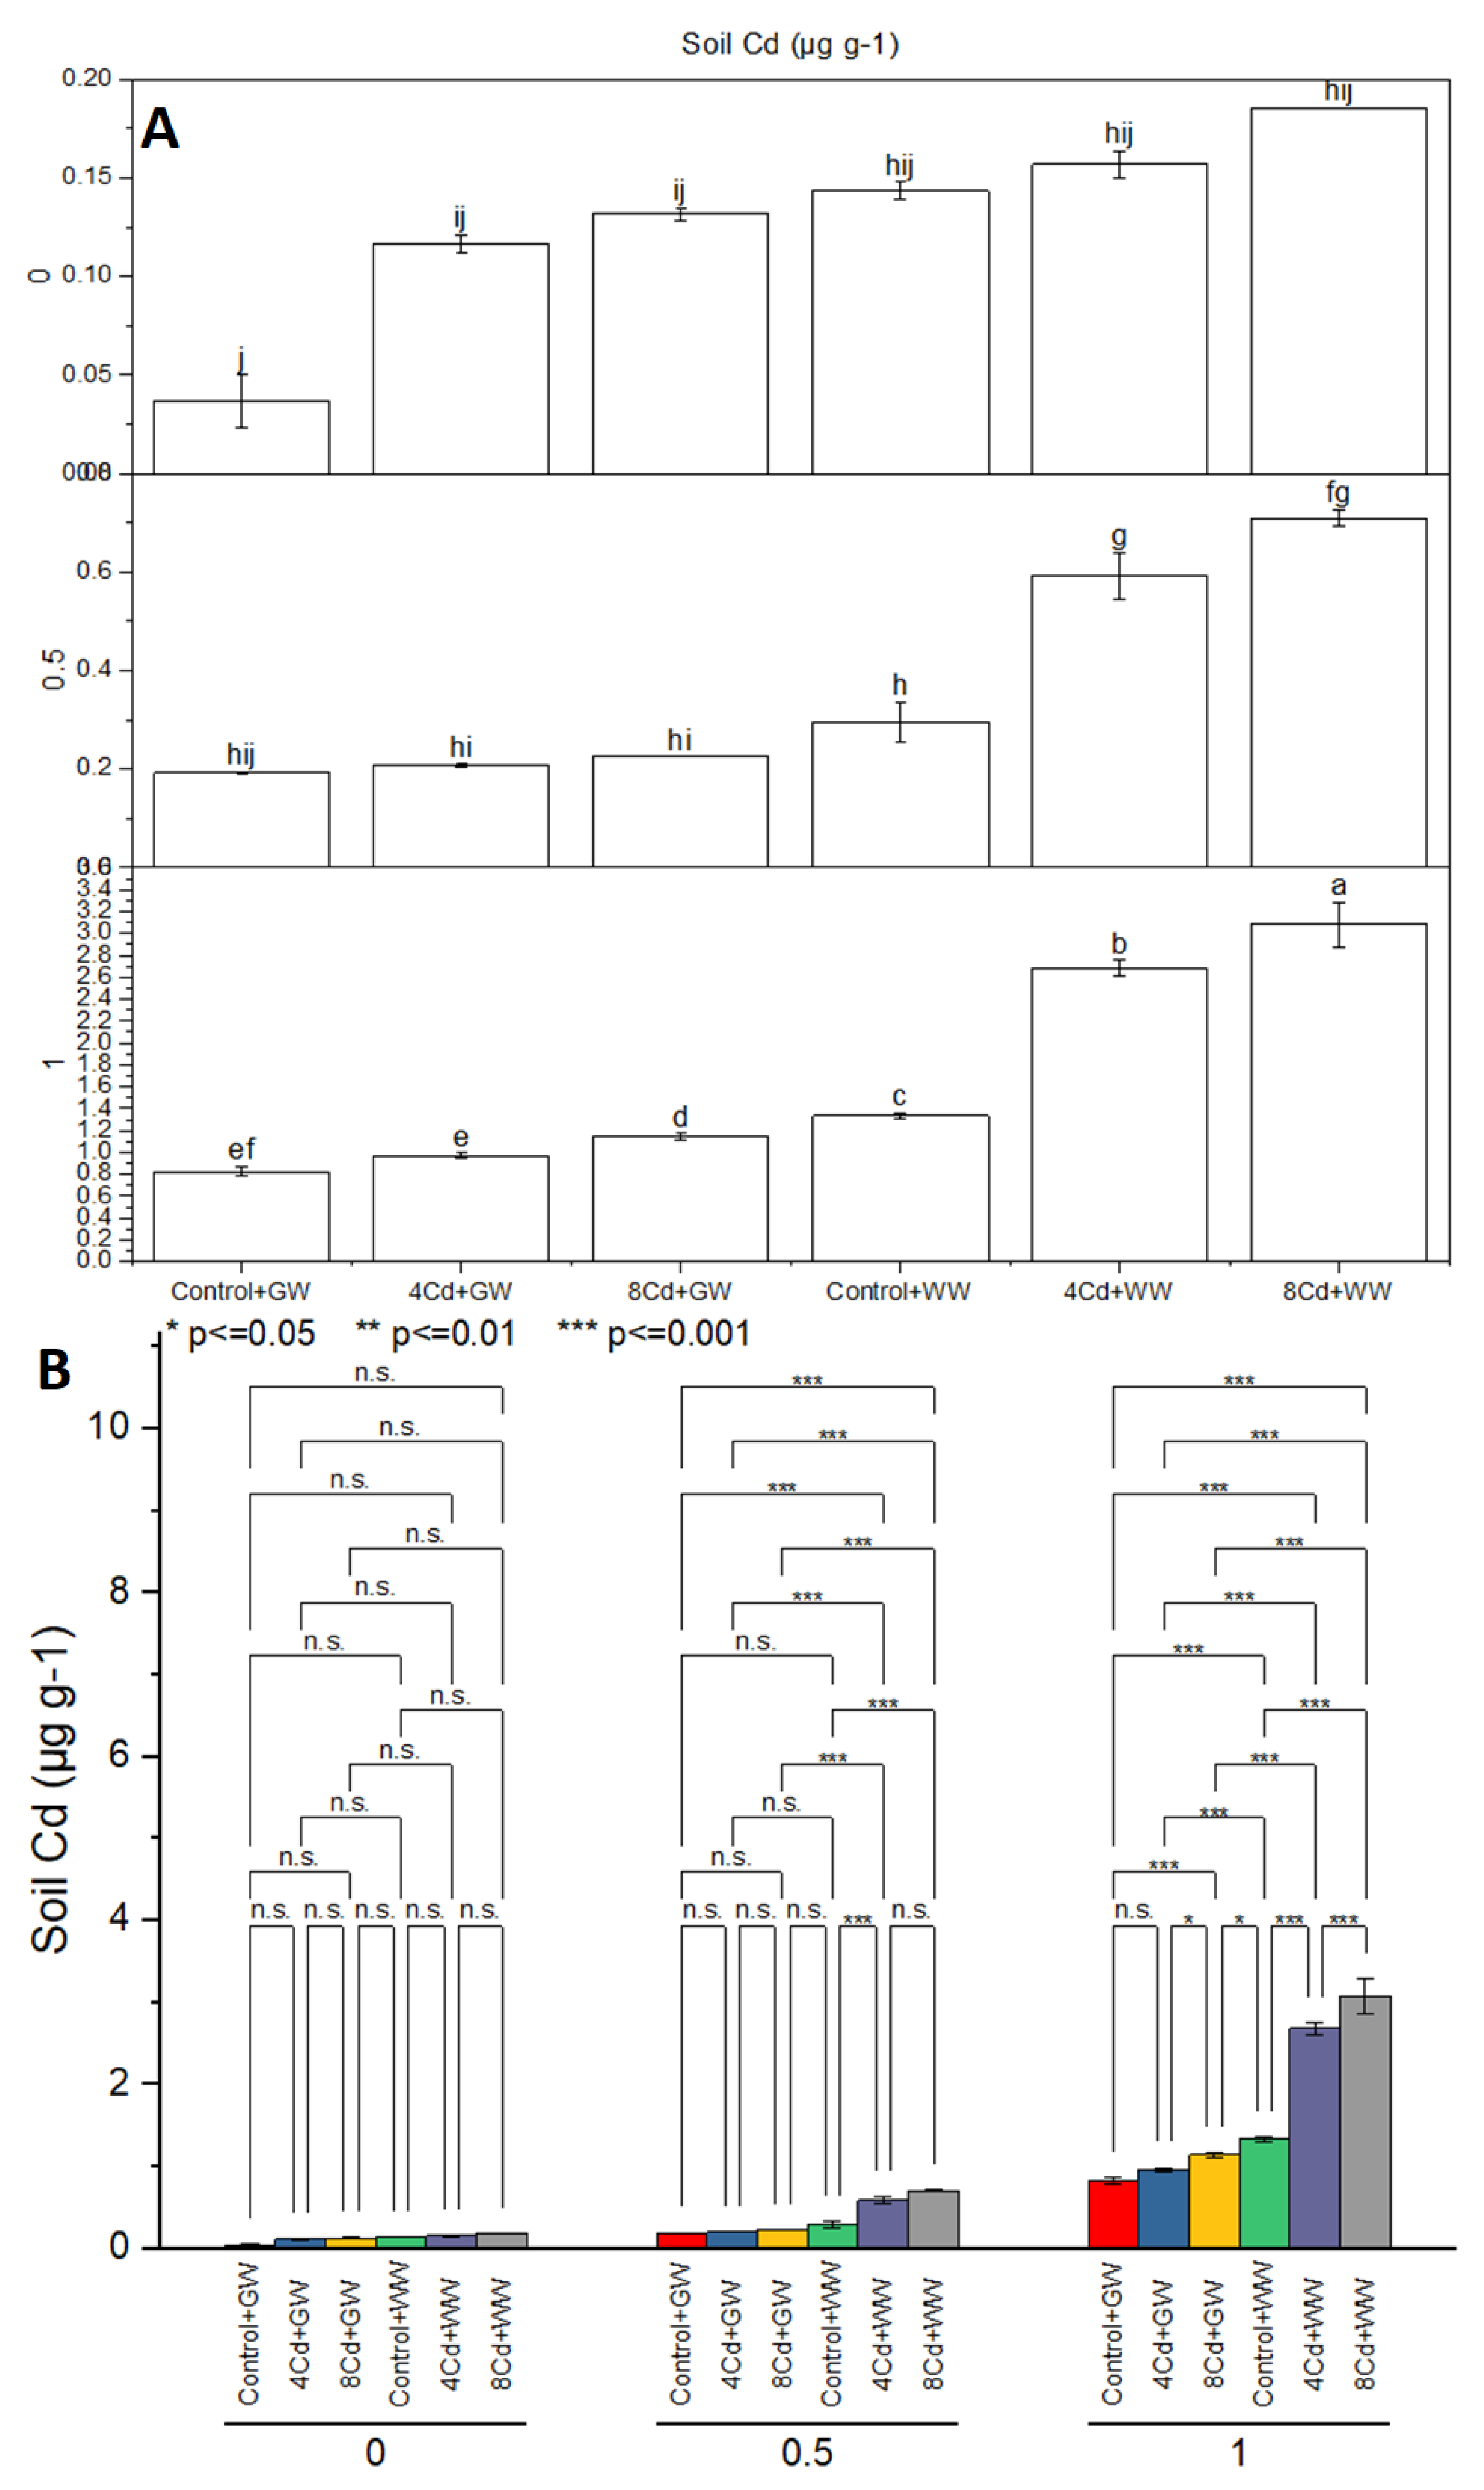
Treatment control was significantly different over 4Cd and 8Cd for electrolyte leakage in GW irrigations at 0% AC. No significant change was noted in control over 4Cd and 8Cd at 0% AC for soil Cd concentration in both GW and WW irrigations (Figure 16). Treatment control and 4Cd + WW and 8Cd + WW were significant over 4Cd + GW and 8Cd + GW for Cd concentration in soil at 0.5% AC. No significant change was noted in control + GW and 4Cd + GW, but a significant increase was noted in 8Cd + GW for soil Cd concentration at 1% AC. A significant increase in soil Cd was noted by application of 1% AC in 4Cd and 8Cd as compared to control where WW was irrigated.
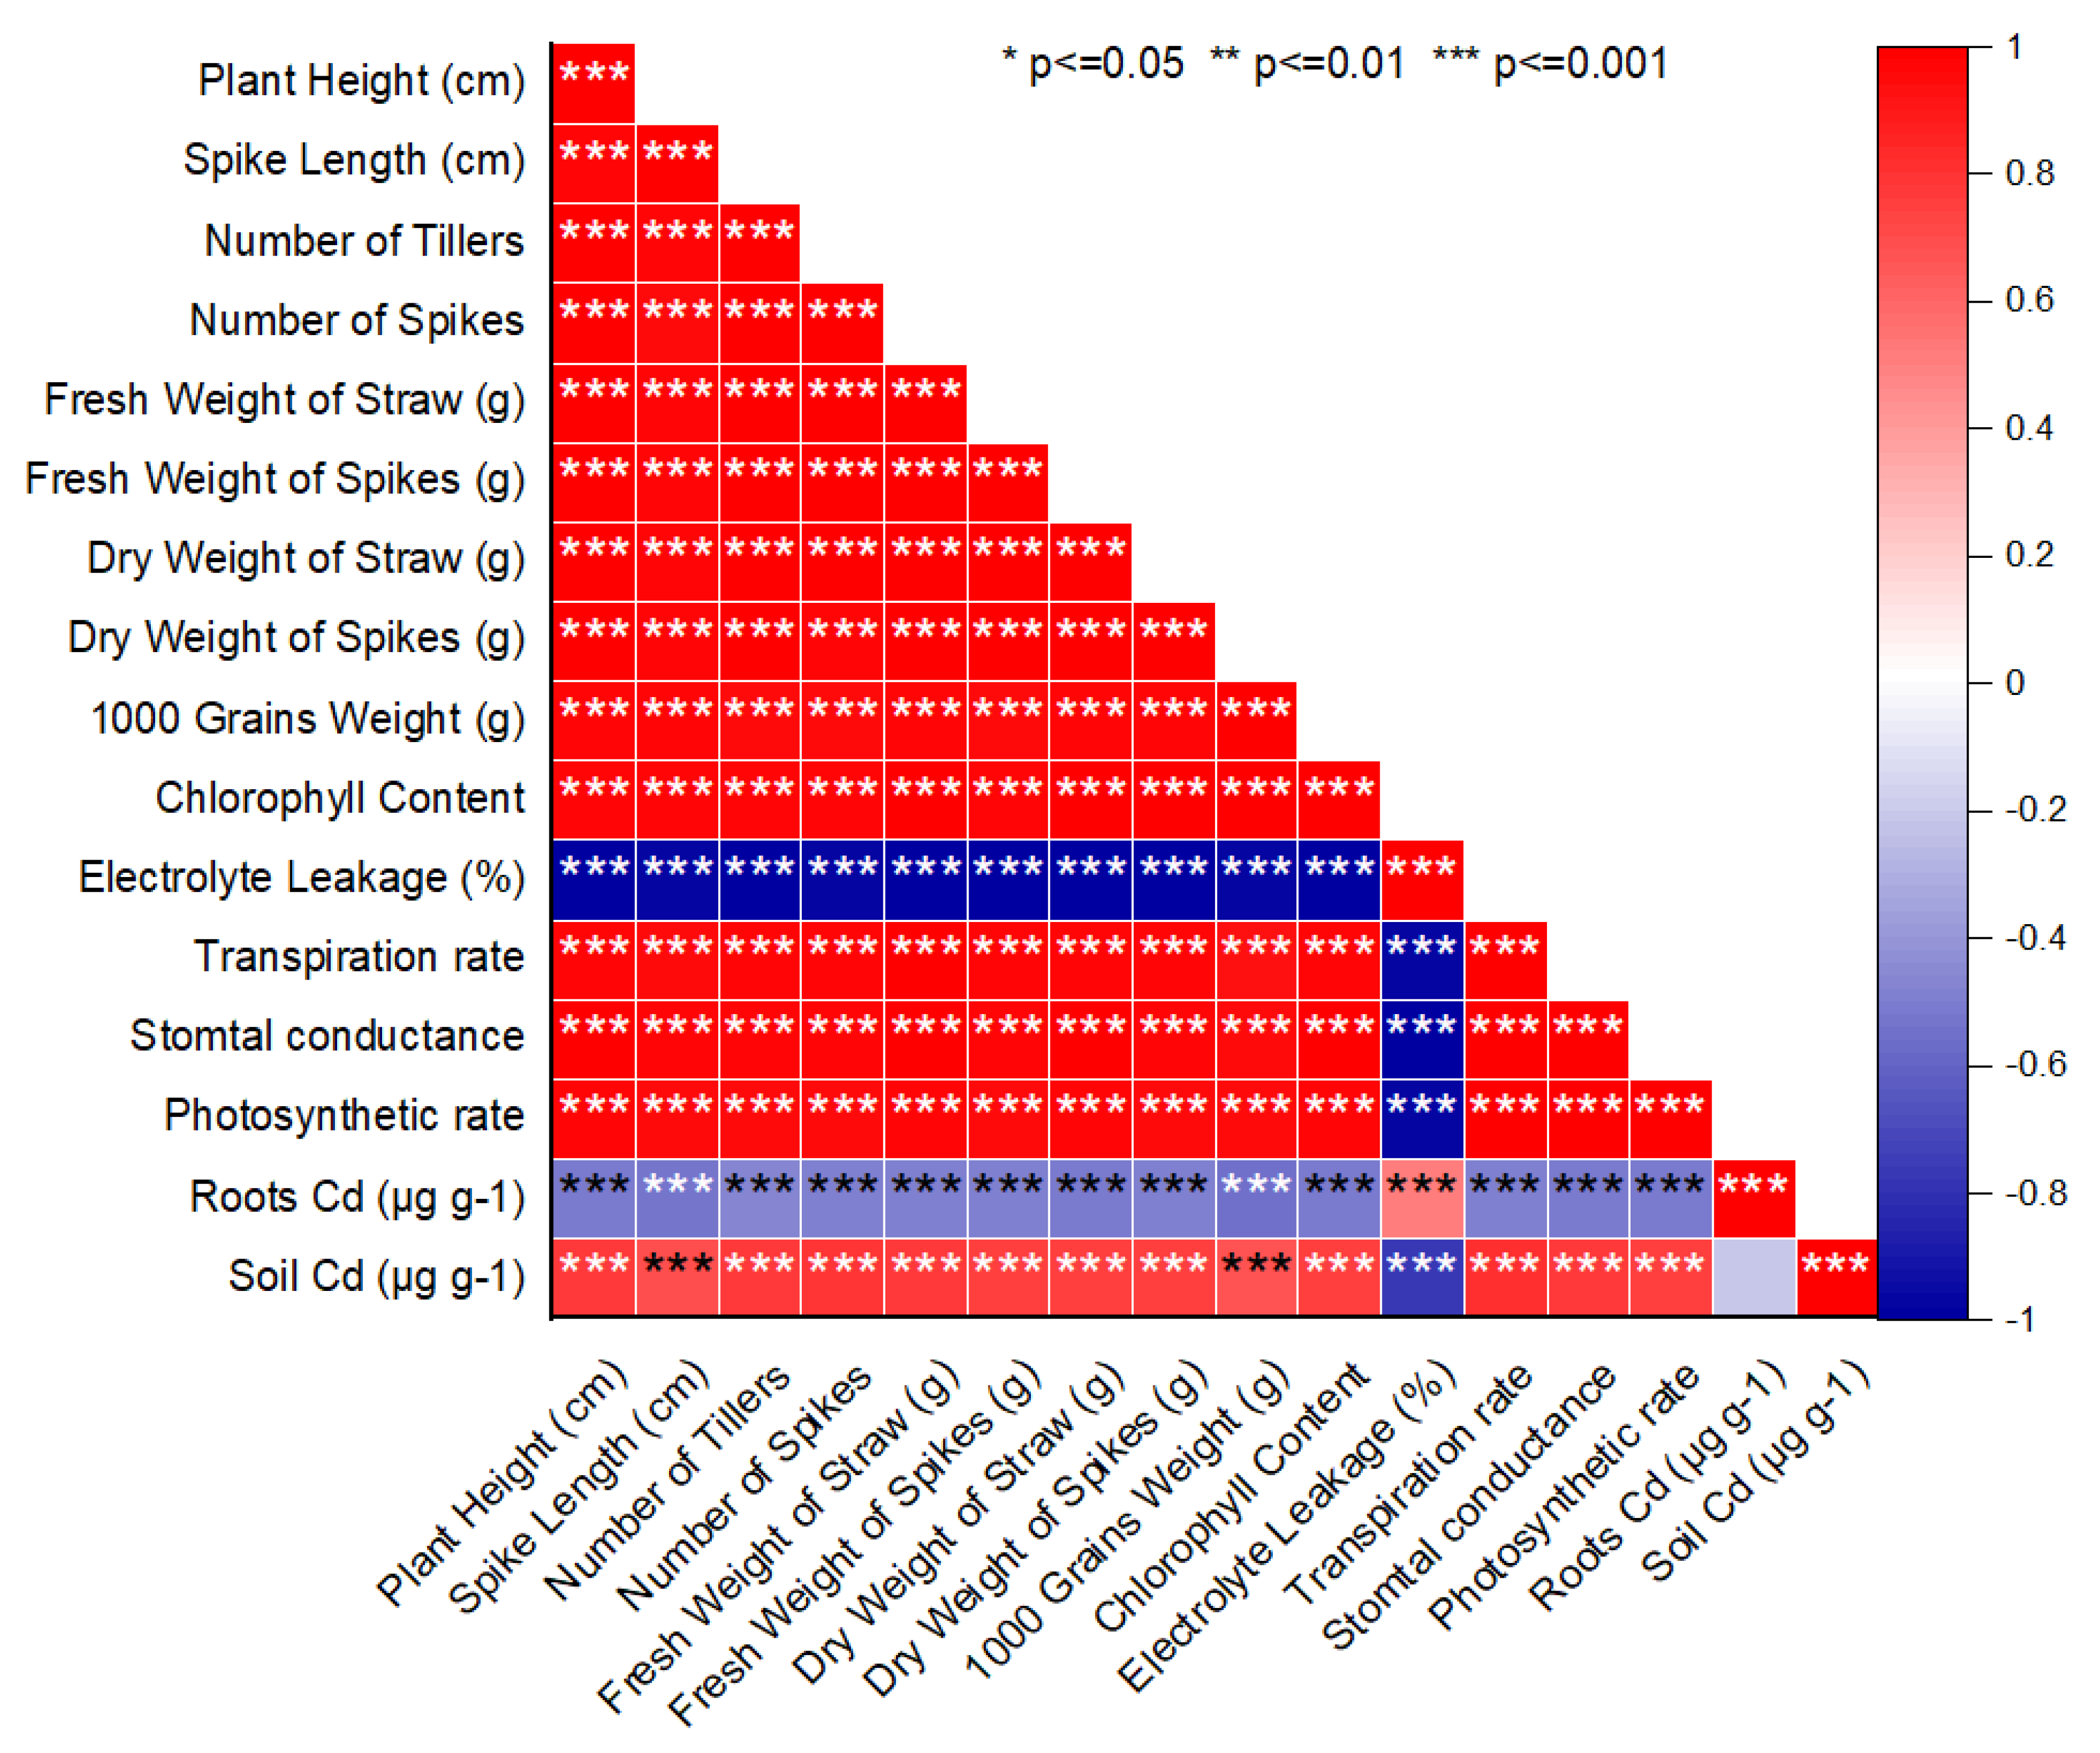
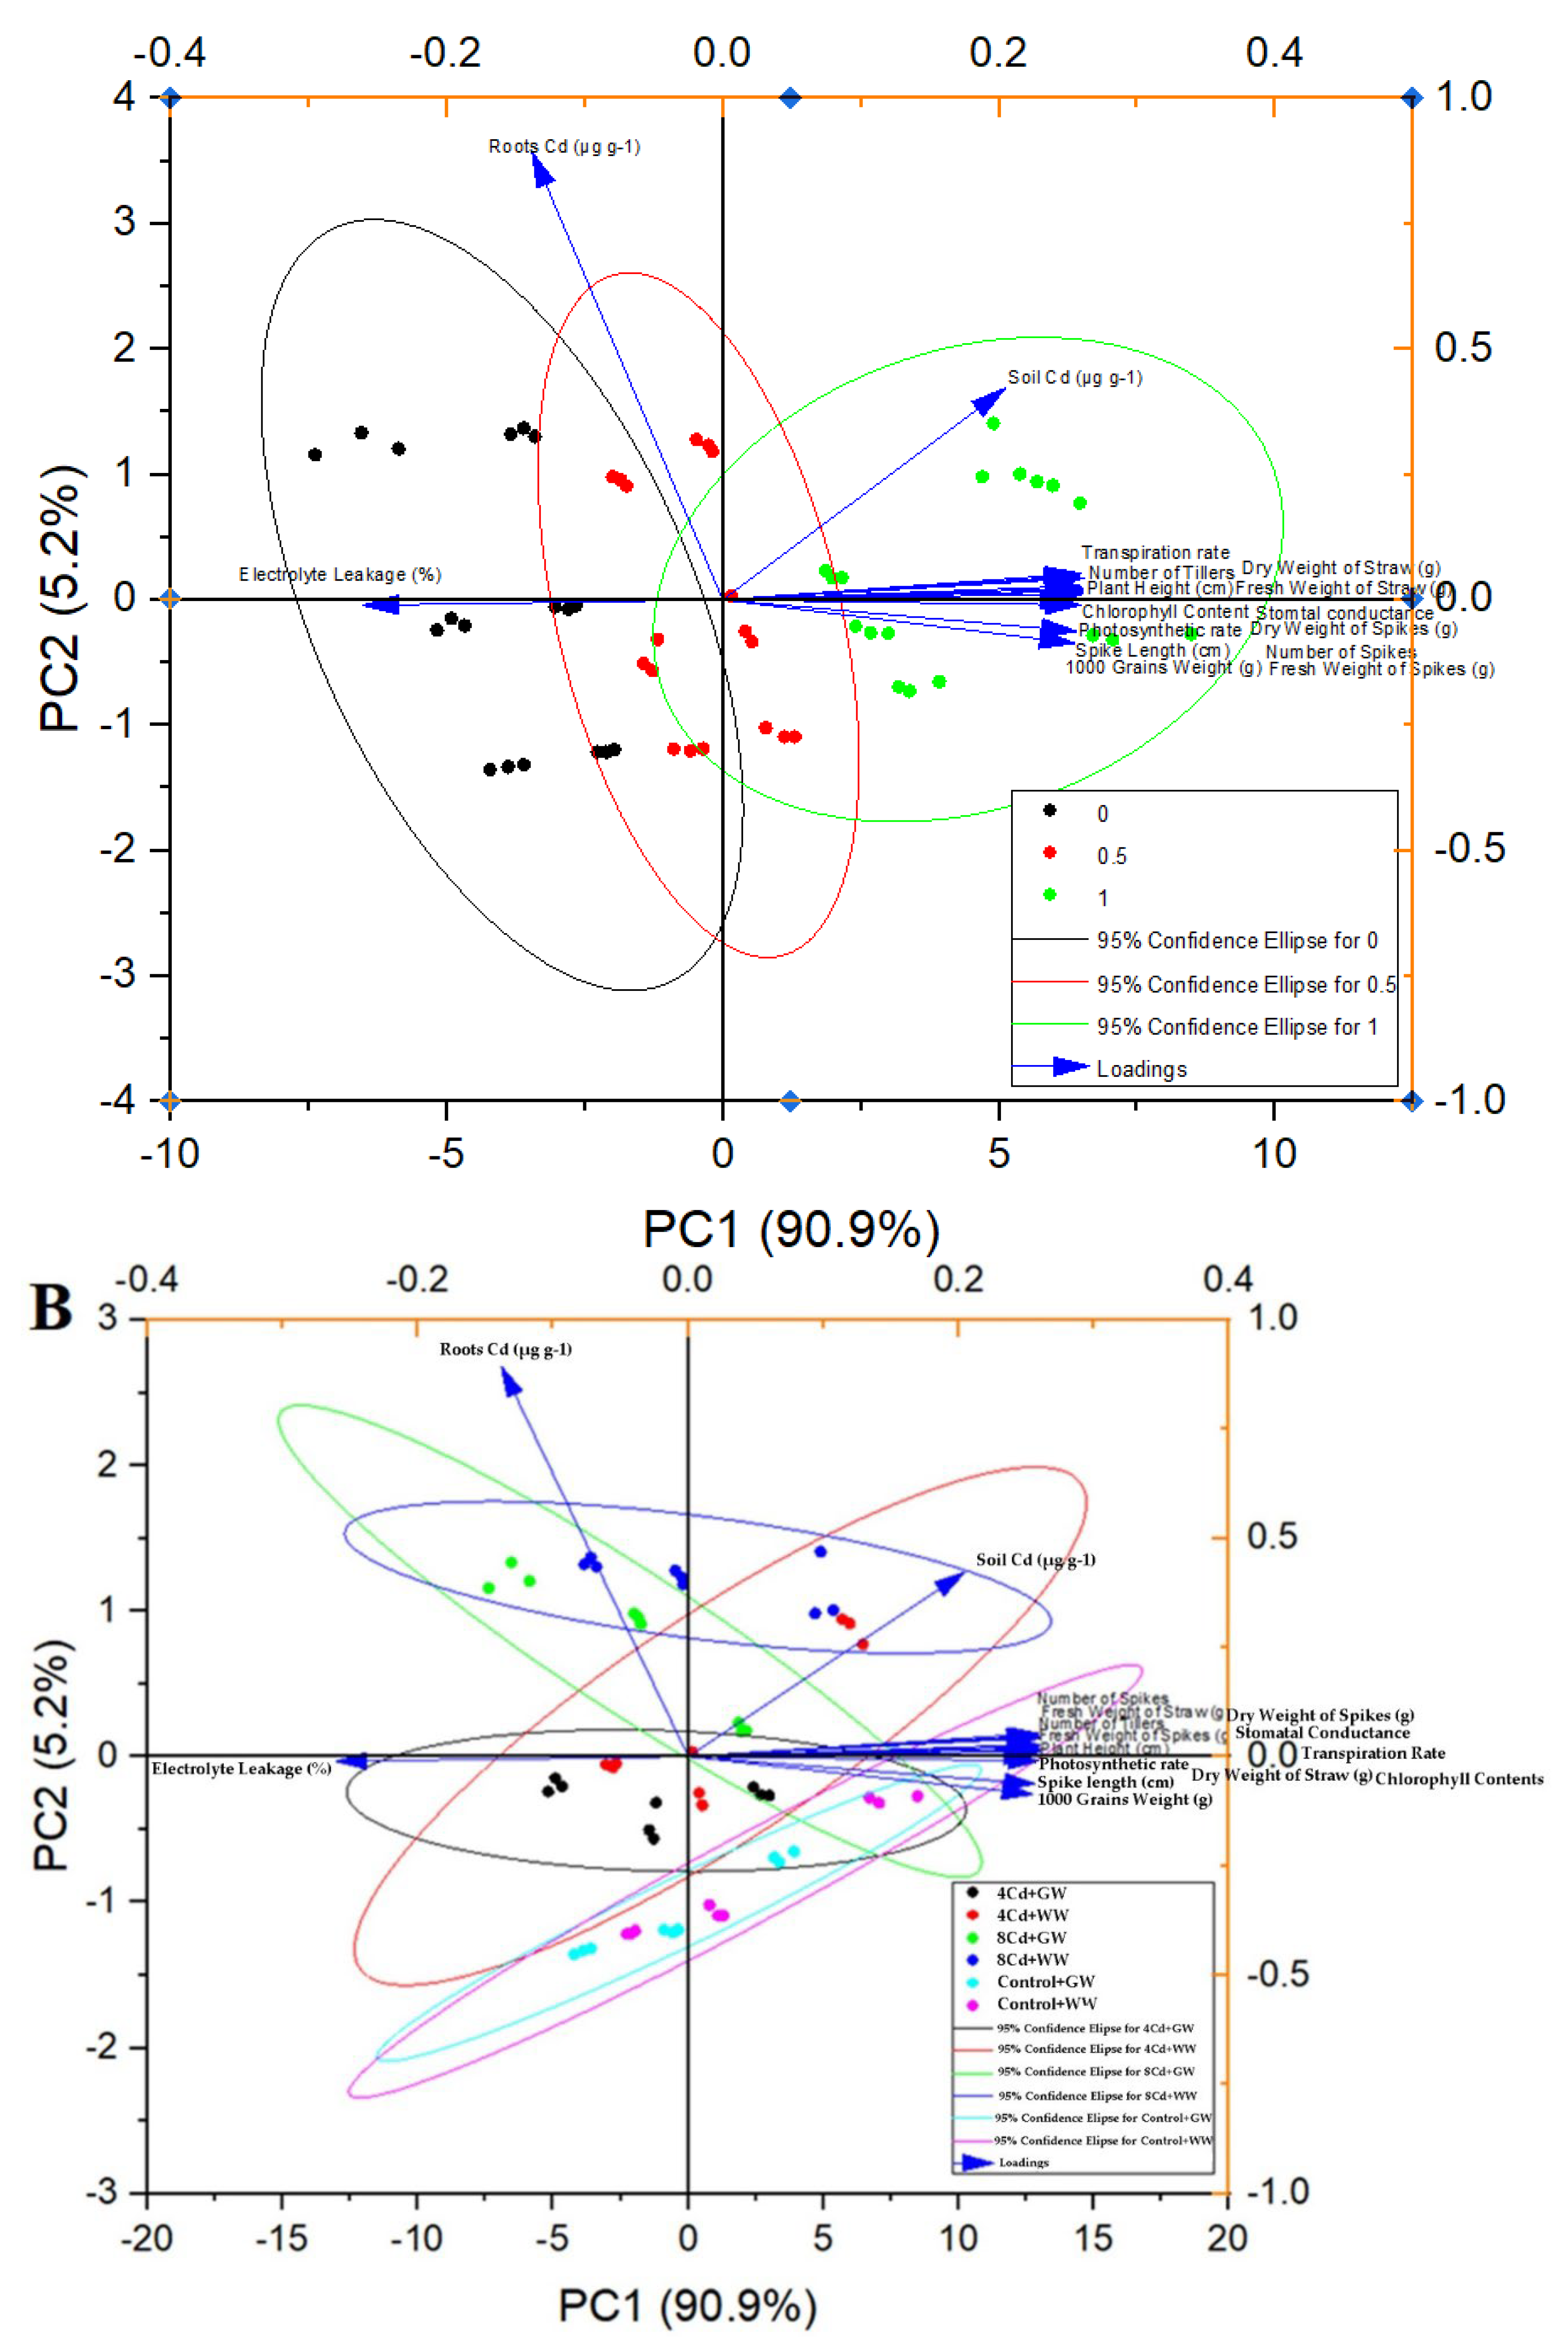
Pearson correlation shows that electrolyte leakage and root Cd concentration were significant and negative in correlation with all their growth attributes of rice under Cd toxicity. Electrolyte leakage was significant negative in correlation with soil Cd concentration (Figure 17). Principal component analysis shows that the majority of growth attributes were significantly affected by 1% AC (Figure 18).

4. Discussion

Different levels of Cd in rice plants significantly decreased the yield and growth indices. It has been observed that the higher production of reactive oxygen species (ROS) by the toxicity of heavy metals in plants plays a notorious role in poor growth and productivity. Oxidative stress generated by the higher accumulation of ROS negatively affects the normal growth of plants when cultivated in heavy metals toxicity [43]. It has been documented that ROS inhibits the normal functioning of the electron transport chain. They also create hurdles in optimum uptake of nutritional elements in the crops [44,45]. Heavy metal, i.e., Cd restricted the activity of enzymes that plays an imperative role in maintaining nutrient uptake in plants [46,47]. These heavy metals are also active in decreasing the stability and permeability of the membrane due to the reactivity of sulfhydryl groups, especially at the cellular level [46,47]. According to Matile et al. [48], heavy metals induce abiotic stress in plants. This abiotic stress stimulates the synthesis of stress ethylene. Endogenous stress ethylene reacts with the cell membrane and starts its degradation. When ethylene comes in contact with chlase gene, it activates chlase, resulting in the deterioration of chlorophyll structure. In addition to the above, the roots of plants usually become thick, and their elongation is also decreased due to the accumulation of stress ethylene. The thickness of plant roots due to stress ethylene accumulation is mainly attributed to a result of dead cell deposition in the cortex of the root. Successive deposition of dead cells in the cortex of roots produced lysigenous aerenchyma. In the hypocotyls region, stress ethylene also decreases cell division. Low cell division eventually results in poor elongation of roots and shoots in plants [49].
Better uptake of macronutrients, i.e., N, P, and K that are present in waste water as compared to ground water are associated with the improvement in growth and yield indices of crops. Tak [8] also documented similar results. According to them, waste water is a rich source of nutrition that promotes crops’ growth. Application of water where overcomes the irrigation water supply deficiency and decreases the inorganic fertilizer application rates for crop production [50].
Furthermore, a decrease in soil pH facilitates the formation of Cd-carbonates in soil insoluble in water. Less Cd-carbonate solubility also plays an important role in minimizing Cd uptake in plants, eventually decreasing its potential toxic impacts on cultivated crops [51]. In our experiment, acidic pH and high carbonates and bicarbonates concentration of waste water were major causes that might play an important role in less uptake of Cd in roots. In addition, the acidic pH of AC might be an allied factor for forming Cd-carbonates in soil, which significantly minimizes Cd uptake in plant’s roots.
The porous structure of activated carbon absorbs a significant amount of nutrients that reduce the losses of volatile nutrients (NH4+) thus improving the uptake of nutrients in the plants [51,52]. In addition, geometry, size, distribution, and the number of microspores in activated carbon play an efficacious role in the sorption of nutrients and water. The application of activated carbon in the soil also makes rapid cycling of nutrients. Higher retention of nutrients and diversity of rhizobacteria improve the fertility level of soil and nutrient availability to the plants [53]. Chan et al. [54] argued that the high surface area of activated carbon is a major cause of improvement in cation exchange sites in the soil. Such improvements in exchange sites resulted in a better supply of nutrients to the crops. It also releases significant nutrients in the soil solution that becomes part of the activated carbon structure during pyrolysis. The concentration of nutrients present in activated carbon is dependent on the type of waste feedstock that is used to develop the activated carbon [55].
Younis et al. [51] reported a better P uptake by adding cotton sticks with activated carbon. According to [56], the higher amount of K in activated carbon ash improves K concentration in plants. Better uptake of K might have maintained the turgor of cells and stomatal conductance by osmoregulation [57,58]. The polar and dispersive surface of biochar and solid surface energy is directly associated with water molecule retention. The negative zeta potential of biochar in most cases shows the presence of negative charges at the biochar surface. The electrostatic force of attraction between negatively charged biochar surface and cations in soil solution facilitates the adsorption of nutrients at the biochar surface [59]. Progressive degradation of cellulose and lignin in waste feedstock makes the amorphous surface of biochar. This amorphous surface of biochar has micropores. The emission of volatile compounds during pyrolysis creates spaces that play a role in water absorption when biochar is applied to the soil as an amendment [60].

5. Conclusions

The application of 1% AC positively affects the growth attributes of rice. Improvement in gas exchange attributes, less electrolyte leakage, and low Cd concentration in roots signified the effective role of 1% AC in rice under different levels of Cd in soil. The presence of high Cd in 1% AC soil over 0% AC soil depicts that AC has sorbed the Cd and decreased its availability to plant roots. Waste water irrigation can also be helpful in the improvement of rice growth attributed to 0.5 and 1% AC. In conclusion, 1% AC + WW is the most effective amendment to enhance rice growth in Cd contaminated soils. More investigations are suggested at the field level to declare the best treatment for enhancing rice productivity under Cd contamination.

Author Contributions

Conceptualization, N.A. and A.R.S.; methodology, N.A., software, S.D.; validation, S.D.; formal analysis, N.A. and A.R.S.; investigation, N.A. and A.R.S.; resources, N.A. and A.R.S.; data curation, A.R.S.; writing—original draft preparation, S.D., R.D. and K.A.; writing—review and editing, S.D., R.D. and K.A. supervision, N.A. All authors have read and agreed to the published version of the manuscript.

Funding

This research was funded by Princess Nourah bint Abdulrahman University, Researchers Supporting Project number (PNURSP2022R188) Riyadh, Saudi Arabia.

Institutional Review Board Statement

Not applicable.

Informed Consent Statement

Not applicable.

Data Availability Statement

Not applicable.

Acknowledgments

This research was funded by Princess Nourah bint Abdulrahman University, Researchers Supporting Project number (PNURSP2022R188) Riyadh, Saudi Arabia.

Conflicts of Interest

The authors declare no conflict of interest.

References

  1. Abid, M.; Danish, S.; Zafar-ul-Hye, M.; Shaaban, M.; Iqbal, M.M.; Rehim, A.; Qayyum, M.F.; Naqqash, M.N. Biochar Increased Photosynthetic and Accessory Pigments in Tomato (Solanum lycopersicum L.) Plants by Reducing Cadmium Concentration under Various Irrigation Waters. Environ. Sci. Pollut. Res. 2017, 24, 22111–22118. [Google Scholar] [CrossRef]
  2. Roth, U.; Von Roepenack-Lahaye, E.; Clemens, S. Proteome Changes in Arabidopsis thaliana Roots upon Exposure to Cd2+. J. Exp. Bot. 2006, 57, 4003–4013. [Google Scholar] [CrossRef] [PubMed]
  3. Ekmekçi, Y.; Tanyolac, D.; Ayhan, B. Effects of Cadmium on Antioxidant Enzyme and Photosynthetic Activities in Leaves of Two Maize Cultivars. J. Plant Physiol. 2008, 165, 600–611. [Google Scholar] [CrossRef] [PubMed]
  4. Vassilev, A.; Perez-Sanz, A.; Semane, B.; Carleer, R.; Vangronsveld, J. Cadmium Accumulation and Tolerance of Two Salix Genotypes Hydroponically Grown in Presence of Cadmium. J. Plant Nutr. 2005, 28, 2159–2177. [Google Scholar] [CrossRef]
  5. Uraguchi, S.; Mori, S.; Kuramata, M.; Kawasaki, A.; Arao, T.; Ishikawa, S. Root-to-Shoot Cd Translocation via the Xylem Is the Major Process Determining Shoot and Grain Cadmium Accumulation in Rice. J. Exp. Bot. 2009, 60, 2677–2688. [Google Scholar] [CrossRef]
  6. Verbruggen, N.; Hermans, C.; Schat, H. Molecular Mechanisms of Metal Hyperaccumulation in Plants. New Phytol. 2009, 181, 759–776. [Google Scholar] [CrossRef]
  7. Randhawa, M.A.; Ahmad, G.; Anjum, F.M.; Asghar, A.; Sajid, M.W. Heavy Metal Contents and Their Daily Intake in Vegetables under Peri-Urban Farming System of Multan, Pakistan. Pak. J. Agric. Sci. 2014, 51, 1125–1131. [Google Scholar]
  8. Ensink, J.H.J.; Simmons, R.W.; van der Hoek, W. Wastewater Use in Pakistan: The Cases of Haroonabad and Faisalabad. In Wastewater Use in Irrigated Agriculture: Confronting the Livelihood and Environmental Realities; International Water Management Institute (IWMI): Battaramulla, Sri Lanka, 2009; pp. 91–99. [Google Scholar]
  9. Qadir, M.; Ghafoor, A.; Murtaza, G. Cadmium Concentration in Vegetables Grown on Urban Soils Irrigated with Untreated Municipal Sewage. Environ. Dev. Sustain. 2000, 2, 13–21. [Google Scholar] [CrossRef]
  10. Murtaza, G.; Ghafoor, A.; Qadir, M. Accumulation and Implications of Cadmium, Cobalt and Manganese in Soils and Vegetables Irrigated with City Effluent. J. Sci. Food Agric. 2008, 88, 100–107. [Google Scholar] [CrossRef]
  11. Sarwar, T.; Shahid, M.; Natasha; Khalid, S.; Shah, A.H.; Ahmad, N.; Naeem, M.A.; ul Haq, Z.; Murtaza, B.; Bakhat, H.F. Quantification and Risk Assessment of Heavy Metal Build-up in Soil–Plant System after Irrigation with Untreated City Wastewater in Vehari, Pakistan. Environ. Geochem. Health 2020, 42, 4281–4297. [Google Scholar] [CrossRef] [PubMed]
  12. Khan, S.A.; Khan, L.; Hussain, I.; Marwat, K.B.; Akhtar, N. Profile of Heavy Metals in Selected Medicinal Plants. J. Weed Sci. Res. 2008, 14, 101–110. [Google Scholar]
  13. Hussain, S.I.; Ghafoor, A.; Ahmad, S.; Murtaza, G.; Sabir, M. Irrigation of Crops with Raw Sewage: Hazard Assessment of Effluent, Soil and Vegetables. Pak. J. Agric. Sci. 2006, 43, 97–102. [Google Scholar]
  14. Malamis, S.; Katsou, E.; Haralambous, K.J. Study of Ni (II), Cu (II), Pb (II), and Zn (II) Removal Using Sludge and Minerals Followed by MF/UF. Water Air Soil Pollut. 2011, 218, 81–92. [Google Scholar] [CrossRef]
  15. Freddo, A.; Cai, C.; Reid, B.J. Environmental Contextualisation of Potential Toxic Elements and Polycyclic Aromatic Hydrocarbons in Biochar. Environ. Pollut. 2012, 171, 18–24. [Google Scholar] [CrossRef] [PubMed]
  16. Abbas, T.; Rizwan, M.; Ali, S.; Zia-ur-Rehman, M.; Farooq Qayyum, M.; Abbas, F.; Hannan, F.; Rinklebe, J.; Ok, Y.S. Effect of Biochar on Cadmium Bioavailability and Uptake in Wheat (Triticum aestivum L.) Grown in a Soil with Aged Contamination. Ecotoxicol. Environ. Saf. 2017, 140, 37–47. [Google Scholar] [CrossRef]
  17. Sun, J.; Fan, Q.; Ma, J.; Cui, L.; Quan, G.; Yan, J.; Wu, L.; Hina, K.; Abdul, B.; Wang, H. Effects of Biochar on Cadmium (Cd) Uptake in Vegetables and Its Natural Downward Movement in Saline-Alkali Soil. Environ. Pollut. Bioavailab. 2020, 32, 36–46. [Google Scholar] [CrossRef]
  18. Vinh, N.C.; Hien, N.V.; Anh, M.T.L.; Lehmann, J.; Joseph, S. Biochar Treatment and Its Effects on Rice and Vegetable Yields in Mountainous Areas of Northern Vietnam. Int. J. Agric. Soil Sci. 2014, 2, 5–13. [Google Scholar]
  19. Joseph, S.; Pow, D.; Dawson, K.; Rust, J.; Munroe, P.; Taherymoosavi, S.; Mitchell, D.R.G.; Robb, S.; Solaiman, Z.M. Biochar Increases Soil Organic Carbon, Avocado Yields and Economic Return over 4 Years of Cultivation. Sci. Total Environ. 2020, 724, 138153. [Google Scholar] [CrossRef] [PubMed]
  20. Madiba, O.F.; Solaiman, Z.M.; Carson, J.K.; Murphy, D.V. Biochar Increases Availability and Uptake of Phosphorus to Wheat under Leaching Conditions. Biol. Fertil. Soils 2016, 52, 439–446. [Google Scholar] [CrossRef]
  21. Danish, S.; Younis, U.; Akhtar, N.; Ameer, A.; Ijaz, M.; Nasreen, S.; Huma, F.; Sharif, S.; Ehsanullah, M. Phosphorus Solubilizing Bacteria and Rice Straw Biochar Consequence on Maize Pigments Synthesis. Int. J. Biosci. 2015, 5, 31–39. [Google Scholar] [CrossRef]
  22. Fiaz, K.; Danish, S.; Younis, U.; Malik, S.A.; Raza Shah, M.H.; Niaz, S. Drought Impact on Pb/Cd Toxicity Remediated by Biochar in Brassica Campestris. J. Soil Sci. Plant Nutr. 2014, 14, 845–854. [Google Scholar] [CrossRef]
  23. Younis, U.; Qayyum, M.F.; Shah, M.H.R.; Danish, S.; Shahzad, A.N.; Malik, S.A.; Mahmood, S. Growth, Survival, and Heavy Metal (Cd and Ni) Uptake of Spinach (Spinacia oleracea) and Fenugreek (Trigonella corniculata) in a Biochar-Amended Sewage-Irrigated Contaminated Soil. J. Plant Nutr. Soil Sci. 2015, 178, 209–217. [Google Scholar] [CrossRef]
  24. Danish, S.; Younis, U.; Nasreen, S.; Akhtar, N.; Iqbal, M.T. Biochar Consequences on Cations and Anions of Sandy Soil. J. Biodivers. Environ. Sci. 2015, 6, 121–131. [Google Scholar]
  25. Zafar-ul-Hye, M.; Danish, S.; Abbas, M.; Ahmad, M.; Munir, T.M. ACC Deaminase Producing PGPR Bacillus amyloliquefaciens and Agrobacterium fabrum along with Biochar Improve Wheat Productivity under Drought Stress. Agronomy 2019, 9, 343. [Google Scholar] [CrossRef]
  26. Zafar-ul-Hye, M.; Tahzeeb-ul-Hassan, M.; Abid, M.; Fahad, S.; Brtnicky, M.; Dokulilova, T.; Datta, R.; Danish, S. Potential Role of Compost Mixed Biochar with Rhizobacteria in Mitigating Lead Toxicity in Spinach. Sci. Rep. 2020, 10, 12159. [Google Scholar] [CrossRef] [PubMed]
  27. Danish, S.; Zafar-ul-Hye, M.; Fahad, S.; Saud, S.; Brtnicky, M.; Hammerschmiedt, T.; Datta, R. Drought Stress Alleviation by ACC Deaminase Producing Achromobacter Xylosoxidans and Enterobacter Cloacae, with and without Timber Waste Biochar in Maize. Sustainability 2020, 12, 6286. [Google Scholar] [CrossRef]
  28. Hashmi, S.; Younis, U.; Danish, S.; Munir, T.M. Pongamia Pinnata L. Leaves Biochar Increased Growth and Pigments Syntheses in Pisum sativum L. Exposed to Nutritional Stress. Agriculture 2019, 9, 153. [Google Scholar] [CrossRef]
  29. El-Naggar, A.; Lee, S.S.; Awad, Y.M.; Yang, X.; Ryu, C.; Rizwan, M.; Rinklebe, J.; Tsang, D.C.W.; Ok, Y.S. Influence of Soil Properties and Feedstocks on Biochar Potential for Carbon Mineralization and Improvement of Infertile Soils. Geoderma 2018, 332, 100–108. [Google Scholar] [CrossRef]
  30. Workman, D. Rice Exports by Country. World’s Top Exports 2019, 16–18. Available online: https://www.worldstopexports.com/rice-exports-country/ (accessed on 17 July 2022).
  31. Juliano, B.O. Rice in Human Nutrition; Food and Agriculture Organization of the United Nations: Rome, Italy, 1993; ISBN 9251031495. [Google Scholar]
  32. Wasim, M.P. A Study of Rice in the Major Growing Countries of the World: Their Growth Instability and World Share. Pak. Econ. Soc. Rev. 2002, 40, 153–183. [Google Scholar]
  33. Rizwan, M.; Ali, S.; Adrees, M.; Rizvi, H.; Zia-ur-Rehman, M.; Hannan, F.; Qayyum, M.F.; Hafeez, F.; Ok, Y.S. Cadmium Stress in Rice: Toxic Effects, Tolerance Mechanisms, and Management: A Critical Review. Environ. Sci. Pollut. Res. 2016, 23, 17859–17879. [Google Scholar] [CrossRef]
  34. Mclaughlin, H. Characterizing Biochars Prior to Addition to Soils–Version I, Jan 2010. In Proceedings of the North America Biochar Conference, Boulder, CO, USA, 12–15 September 2010; pp. 1–8. Available online: https://www.google.com.hk/url?sa=t&rct=j&q=&esrc=s&source=web&cd=&cad=rja&uact=8&ved=2ahUKEwiEhOzC5r35AhWWBaYKHcWODgsQFnoECAIQAQ&url=http%3A%2F%2Fterrapreta.bioenergylists.org%2Ffiles%2FCharacterizing%2520Biochars%2520-%2520Version%2520I%2520-%2520Jan%25202010.pdf&usg=AOvVaw2XTwIoj5woAFx5_VeTTHAx (accessed on 17 July 2022).
  35. Singh, B.; Singh, B.P.; Cowie, A.L. Characterisation and Evaluation of Biochars for Their Application as a Soil Amendment. Aust. J. Soil Res. 2010, 48, 516–525. [Google Scholar] [CrossRef]
  36. Danish, S.; Zafar-ul-Hye, M. Co-Application of ACC-Deaminase Producing PGPR and Timber-Waste Biochar Improves Pigments Formation, Growth and Yield of Wheat under Drought Stress. Sci. Rep. 2019, 9, 5999. [Google Scholar] [CrossRef] [PubMed]
  37. Lutts, S.; Kinet, J.M.; Bouharmont, J. NaCl-Induced Senescence in Leaves of Rice (Oryza sativa L.) Cultivars Differing in Salinity Resistance. Ann. Bot. 1996, 78, 389–398. [Google Scholar] [CrossRef]
  38. Arnon, D.I. Copper Enzymes in Isolated Chloroplasts. Polyphenoloxidase in Beta Vulgaris. Plant Physiol. 1949, 24, 1–15. [Google Scholar] [CrossRef] [PubMed]
  39. Nazar, R.; Khan, M.I.R.; Iqbal, N.; Masood, A.; Khan, N.A. Involvement of Ethylene in Reversal of Salt-Inhibited Photosynthesis by Sulfur in Mustard. Physiol. Plant. 2014, 152, 331–344. [Google Scholar] [CrossRef] [PubMed]
  40. Rashid, A. Mapping Zinc Fertility of Soils Using Indicator Plants and Soil Analyses. Ph.D. Thesis, University of Hawaii at Manoa, Honolulu, HI, USA, 1986. [Google Scholar]
  41. Hue, N.V.; Evans, C.E. Procedures Used for Soil and Plant Analysis University Soil Testing Laboratory; Department of Agronomy and Soils, Alabama Agricultural Experiment Station, Auburn University: Auburn, AL, USA, 1986. [Google Scholar]
  42. Steel, R.G.; Torrie, J.H.; Dickey, D.A. Principles and Procedures of Statistics: A Biometrical Approach, 3rd ed.; McGraw Hill Book International Co.: Singapore, 1997. [Google Scholar]
  43. Mithöfer, A.; Schulze, B.; Boland, W. Biotic and Heavy Metal Stress Response in Plants: Evidence for Common Signals. FEBS Lett. 2004, 566, 1–5. [Google Scholar] [CrossRef] [PubMed]
  44. Qadir, S.; Qureshi, M.I.; Javed, S.; Abdin, M.Z. Genotypic Variation in Phytoremediation Potential of Brassica Juncea Cultivars Exposed to Cd Stress. Plant Sci. 2004, 167, 1171–1181. [Google Scholar] [CrossRef]
  45. Dong, J.; Wu, F.; Zhang, G. Influence of Cadmium on Antioxidant Capacity and Four Microelement Concentrations in Tomato Seedlings (Lycopersicon esculentum). Chemosphere 2006, 64, 1659–1666. [Google Scholar] [CrossRef] [PubMed]
  46. Sharma, P.; Dubey, R.S. Lead Toxicity in Plants. Braz. J. Plant Physiol. 2005, 17, 35–52. [Google Scholar] [CrossRef]
  47. Reddy, A.M.; Kumar, S.G.; Jyothsnakumari, G.; Thimmanaik, S.; Sudhakar, C. Lead Induced Changes in Antioxidant Metabolism of Horsegram (Macrotyloma uniflorum (Lam.) Verdc.) and Bengalgram (Cicer arietinum L.). Chemosphere 2005, 60, 97–104. [Google Scholar] [CrossRef] [PubMed]
  48. Matile, P.; Schellenberg, M.; Vicentini, F. Localization of Chlorophyllase in the Chloroplast Envelope. Planta 1997, 201, 96–99. [Google Scholar] [CrossRef]
  49. Skirycz, A.; Claeys, H.; de Bodt, S.; Oikawa, A.; Shinoda, S.; Andriankaja, M.; Maleux, K.; Eloy, N.B.; Coppens, F.; Yoo, S.D.; et al. Pause-and-Stop: The Effects of Osmotic Stress on Cell Proliferation during Early Leaf Development in Arabidopsis and a Role for Ethylene Signaling in Cell Cycle Arrest. Plant Cell 2011, 23, 1876–1888. [Google Scholar] [CrossRef]
  50. Tak, H.I.; Babalola, O.O.; Huyser, M.H.; Inam, A. Urban Wastewater Irrigation and Its Effect on Growth, Photosynthesis and Yield of Chickpea under Different Doses of Potassium. Soil Sci. Plant Nutr. 2013, 59, 156–167. [Google Scholar] [CrossRef]
  51. Younis, U.; Danish, S.; Shah, M.H.R.; Malik, S.A. Nutrient Shifts Modeling in Spinacea oleracea L. and Trigonella corniculata L. in Contaminated Soil Amended with Biochar. Int. J. Biosci. 2014, 5, 89–98. [Google Scholar] [CrossRef]
  52. Gao, D.; Zhang, L.; Liu, Q.; Rong, X.; Zhang, Y.; Tian, C. Application of Biochar in Dryland Soil Decreasing Loss of Nitrogen and Improving Nitrogen Using Rate. Trans. Chin. Soc. Agric. Eng. 2014, 30, 54–61. [Google Scholar]
  53. Lehmann, J.; Rondon, M. Bio-Char Soil Management on Highly Weathered Soils in the Humid Tropics. In Biological Approaches to Sustainable Soil Systems; Uphoff, N., Ed.; CRC Press: Boca Raton, FL, USA, 2002; pp. 517–530. [Google Scholar]
  54. Chan, K.Y.; Van Zwieten, L.; Meszaros, I.; Downie, A.; Joseph, S. Using Poultry Litter Biochars as Soil Amendments. Aust. J. Soil Res. 2008, 46, 437–444. [Google Scholar] [CrossRef]
  55. Novak, J.M.; Lima, I.; Gaskin, J.W.; Steiner, C.; Das, K.C.; Ahmedna, M.; Watts, D.W.; Warren, J.; Schomberg, H. Characterization of Designer Biochar Produced at Different Temperatures and Their Effects on a Loamy Sand. Ann. Environ. Sci. 2009, 3, 195–206. [Google Scholar]
  56. Singh, A.; Singh, A.P.; Singh, S.K.; Rai, S.; Kumar, D. Impact of Addition of Biochar Along with PGPR on Rice Yield, Availability of Nutrients and Their Uptake in Alluvial Soil. J. Pure Appl. Microbiol. 2016, 10, 2181–2188. [Google Scholar]
  57. Wilkinson, S.; Davies, W.J. ABA-based Chemical Signalling: The Co-ordination of Responses to Stress in Plants. Plant Cell Environ. 2002, 25, 195–210. [Google Scholar] [CrossRef]
  58. Shabala, S. Regulation of Potassium Transport in Leaves: From Molecular to Tissue Level. Ann. Bot. 2003, 95, 627–634. [Google Scholar] [CrossRef]
  59. Glaser, B.; Lehmann, J.; Zech, W. Ameliorating Physical and Chemical Properties of Highly Weathered Soils in the Tropics with Charcoal—A Review. Biol. Fertil. Soils 2002, 35, 219–230. [Google Scholar] [CrossRef]
  60. Zhao, S.X.; Ta, N.; Wang, X.D. Effect of Temperature on the Structural and Physicochemical Properties of Biochar with Apple Tree Branches as Feedstock Material. Energies 2017, 10, 1293. [Google Scholar] [CrossRef]
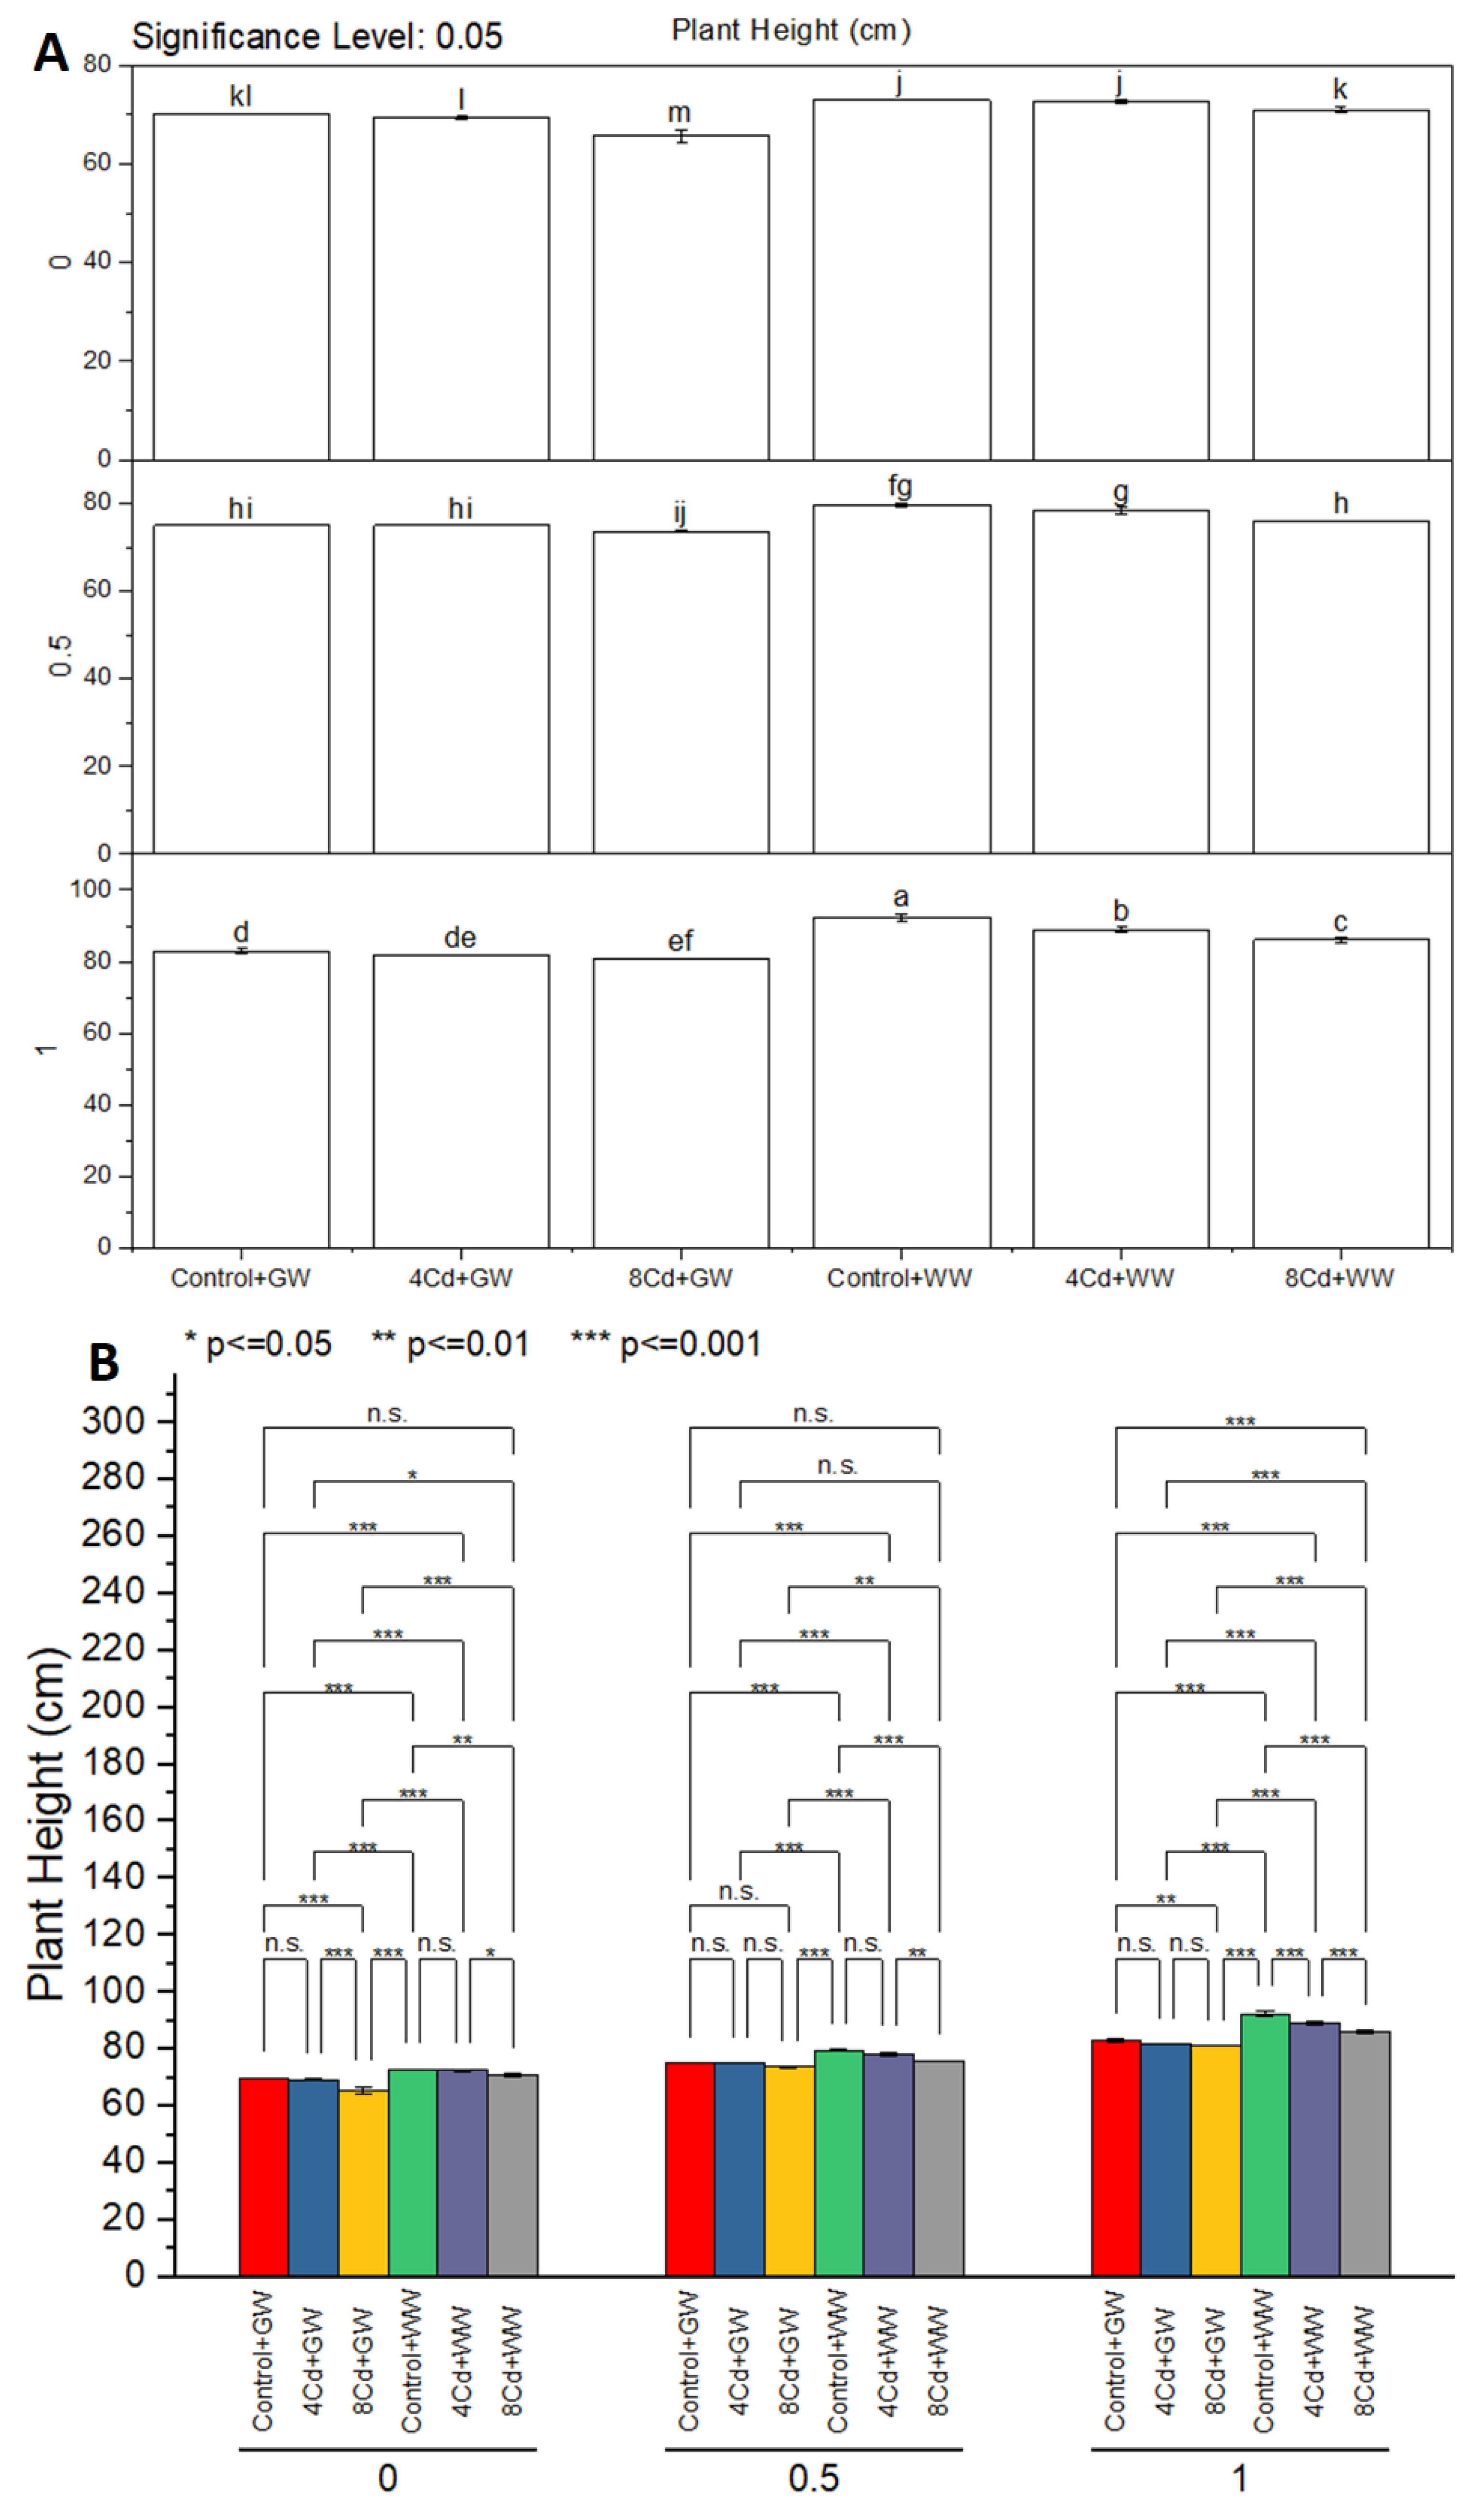
Figure 1. Effect of treatments on rice plant height irrigated with waste water (WW) and ground water (SW) cultivated under Cd toxicity. Bars are means of three replicates. Different values on bars show significant differences at p ≤ 0.05; Fisher LSD test (A). Probability bar graph shows the p values where n.s. = non-significant, * = ≤ 0.05, ** = ≤ 0.01, and *** = ≤ 0.001 (B).
Sustainability 14 10086 g001
Figure 2. Effect of treatments on rice spike length irrigated with waste and ground water cultivated under Cd toxicity. Bars are means of three replicates. Different values on bars show significant differences at p ≤ 0.05; Fisher LSD test (A). Probability bar graph shows the p values where n.s. = non-significant, * = ≤ 0.05, ** = ≤ 0.01, and *** = ≤ 0.001 (B).
Sustainability 14 10086 g002
Figure 3. Effect of treatments on rice number of tillers irrigated with waste and ground water cultivated under Cd toxicity. Bars are means of three replicates. Different values on bars show significant differences at p ≤ 0.05; Fisher LSD test (A). Probability bar graph shows the p values where n.s. = non-significant, * = ≤ 0.05, ** = ≤ 0.01, and *** = ≤ 0.001 (B).
Sustainability 14 10086 g003aSustainability 14 10086 g003b
Figure 4. Effect of treatments on rice number of spikes irrigated with waste and ground water cultivated under Cd toxicity. Bars are means of three replicates. Different values on bars show significant differences at p ≤ 0.05; Fisher LSD test (A). Probability bar graph shows the p values where n.s. = non-significant, * = ≤ 0.05, ** = ≤ 0.01, and *** = ≤ 0.001 (B).
Sustainability 14 10086 g004aSustainability 14 10086 g004b
Figure 5. Effect of treatments on rice fresh weight of straw irrigated with waste and ground water cultivated under Cd toxicity. Bars are means of three replicates. Different values on bars show significant differences at p ≤ 0.05; Fisher LSD test (A). Probability bar graph shows the p values where n.s. = non-significant, * = ≤ 0.05, ** = ≤ 0.01, and *** = ≤ 0.001 (B).
Sustainability 14 10086 g005
Figure 6. Effect of treatments on rice fresh weight of spikes irrigated with waste and ground water cultivated under Cd toxicity. Bars are means of three replicates. Different values on bars show significant differences at p ≤ 0.05; Fisher LSD test (A). Probability bar graph shows the p values where n.s. = non-significant, * = ≤ 0.05, ** = ≤ 0.01, and *** = ≤ 0.001 (B).
Sustainability 14 10086 g006
Figure 7. Effect of treatments on rice dry weight of straw irrigated with waste and ground water cultivated under Cd toxicity. Bars are means of three replicates. Different values on bars show significant differences at p ≤ 0.05; Fisher LSD test (A). Probability bar graph shows the p values where n.s. = non-significant, * = ≤ 0.05, ** = ≤ 0.01, and *** = ≤ 0.001 (B).
Sustainability 14 10086 g007aSustainability 14 10086 g007b
Figure 8. Effect of treatments on rice dry weight of spikes irrigated with waste and ground water cultivated under Cd toxicity. Bars are means of three replicates. Different values on bars show significant differences at p ≤ 0.05; Fisher LSD test (A). Probability bar graph shows the p values where n.s. = non-significant, * = ≤ 0.05, ** = ≤ 0.01, and *** = ≤ 0.001 (B).
Sustainability 14 10086 g008aSustainability 14 10086 g008b
Figure 9. Effect of treatments on rice 1000 grains weight irrigated with waste and ground water cultivated under Cd toxicity. Bars are means of three replicates. Different values on bars show significant differences at p ≤ 0.05; Fisher LSD test (A). Probability bar graph shows the p values where n.s. = non-significant, * = ≤ 0.05, ** = ≤ 0.01, and *** = ≤ 0.001 (B).
Sustainability 14 10086 g009
Figure 10. Effect of treatments on rice chlorophyll contents irrigated with waste and ground water cultivated under Cd toxicity. Bars are means of three replicates. Different values on bars show significant differences at p ≤ 0.05; Fisher LSD test (A). Probability bar graph shows the p values where n.s. = non-significant, * = ≤ 0.05, ** = ≤ 0.01, and *** = ≤ 0.001 (B).
Sustainability 14 10086 g010
Figure 11. Effect of treatments on rice electrolyte leakages irrigated with waste and ground water cultivated under Cd toxicity. Bars are means of three replicates. Different values on bars show significant differences at p ≤ 0.05; Fisher LSD test (A). Probability bar graph shows the p values where n.s. = non-significant, * = ≤ 0.05, ** = ≤ 0.01, and *** = ≤ 0.001 (B).
Sustainability 14 10086 g011aSustainability 14 10086 g011b
Figure 12. Effect of treatments on rice photosynthetic rate irrigated with waste and ground water cultivated under Cd toxicity. Bars are means of three replicates. Different values on bars show significant differences at p ≤ 0.05; Fisher LSD test (A). Probability bar graph shows the p values where n.s. = non-significant, * = ≤ 0.05, ** = ≤ 0.01, and *** = ≤ 0.001 (B).
Sustainability 14 10086 g012aSustainability 14 10086 g012b
Figure 13. Effect of treatments on rice transpiration rate irrigated with waste and ground water cultivated under Cd toxicity. Bars are means of three replicates. Different values on bars show significant differences at p ≤ 0.05; Fisher LSD test (A). Probability bar graph shows the p values where n.s. = non-significant, * = ≤ 0.05, ** = ≤ 0.01, and *** = ≤ 0.001 (B).
Sustainability 14 10086 g013aSustainability 14 10086 g013b
Figure 14. Effect of treatments on rice stomatal conductance irrigated with waste and ground water cultivated under Cd toxicity. Bars are means of three replicates. Different values on bars show significant differences at p ≤ 0.05; Fisher LSD test (A). Probability bar graph shows the p values where n.s. = non-significant, * = ≤ 0.05, ** = ≤ 0.01, and *** = ≤ 0.001 (B).
Sustainability 14 10086 g014
Figure 15. Effect of treatments on rice root Cd concentration irrigated with waste and ground water cultivated under Cd toxicity. Bars are means of three replicates. Different values on bars show significant differences at p ≤ 0.05; Fisher LSD test (A). Probability bar graph shows the p values where n.s. = non-significant, * = ≤ 0.05, ** = ≤ 0.01, and *** = ≤ 0.001 (B).
Sustainability 14 10086 g015
Figure 16. Effect of treatments on soil Cd concentration irrigated with waste and ground water cultivated under Cd toxicity. Bars are means of three replicates. Different values on bars show significant differences at p ≤ 0.05; Fisher LSD test (A). Probability bar graph shows the p values where n.s. = non-significant, * = ≤ 0.05, ** = ≤ 0.01, and *** = ≤ 0.001 (B).
Sustainability 14 10086 g016
Figure 17. Pearson correlation for different rice attributes. Red color indicates positive and blue color shows negative correlation.
Sustainability 14 10086 g017
Figure 18. Principal component analysis for rice growth attributes under different levels of acidified carbon (A), sources of irrigation, and cadmium toxicity levels (B).
Sustainability 14 10086 g018
Table 1. Chemical properties of acidified carbon.
ParametersUnitsValues
pH-5.98
ECdS m−13.42
Ash%10
Fixed Carbon%77
Volatile Contents%13
Total Cadmiumµg g−10.19
Total Znµg g−10.29
Total Bµg g−10.17
Table 2. Characterization of experimental soil and irrigation water.
Soil ParameterUnitsValueIrrigation ParameterUnitsValue
WWGW
pHs-8.56pH-6.547.59
ECedSm−13.00ECdS m−11.530.44
Organic Matter%0.30Carbonatesmeq./L1.230.00
Organic Nitrogen%0.15Bicarbonatesmeq./L4.042.36
Available Phosphorusmg kg−14.53Chloridesmeq./L1.500.10
Extractable Potassiummg kg−1107Ca + Mgmeq./L4.413.21
Total Cadmiummg kg−10.42Soluble Cadmiummg kg−10.19ND
Extractable Zincmg kg−10.23Soluble Zincmg kg−10.05ND
Extractable Boronmg kg−10.17Soluble Boronmg kg−10.10ND
ND = Not Detected.
Publisher’s Note: MDPI stays neutral with regard to jurisdictional claims in published maps and institutional affiliations.