Article

Multimodal Evaluation of Changes in National Potential Passenger and Freight Accessibility during the EU-Driven Big Push to Transport Infrastructure

1
Institute of Geography and Spatial Organization, Polish Academy of Sciences, Twarda Str. 51/55, 00-818 Warsaw, Poland
2
Department of Geography, Complutense University of Madrid, Ciudad Universitaria, 28040 Madrid, Spain
*
Author to whom correspondence should be addressed.
Sustainability 2022, 14(16), 10044; https://doi.org/10.3390/su141610044
Submission received: 15 July 2022 / Revised: 8 August 2022 / Accepted: 9 August 2022 / Published: 13 August 2022
(This article belongs to the Special Issue The Role of Transport Infrastructure in Regional Development)

Abstract

:
The main purpose of the paper is to present a methodical approach to differences in changes in intra-national potential accessibility. Research concerns level of accessibility and its dispersion, both for freight and passenger transport regarding four transport modes. The main added value of the paper is an indication of how to monitor changes in the accessibility of many modes of transport at the municipal level, as a result of investment processes, while taking into account the available data sources, both on the land use data and travel times, with the support of regional and central offices. We focus on the intensive development of transport infrastructure after Poland’s accession to the EU. We conclude that outcomes of reducing territorial differences in accessibility are diverse depending on the transport mode: from a generally positive effect in passenger transport to varied effects in freight transport, including particularly highly polarising effects in rail transport. The research method provides the possibility of analysing multimodal changes in accessibility concerning numerous transport modes for any large country or group of countries. Certain development opportunities of the model to be implemented in the future are discussed.

1. Introduction

The accession of new countries to the European Union has usually been associated with the intensive development of transport infrastructure and an improvement in accessibility. This was particularly the case with the 2004, 2007 and 2013 enlargements [1,2,3,4,5,6], but also with earlier ones, including Spain [7,8,9], Portugal [10,11,12] and Greece [13]. Most of the aforementioned studies focused on changes in accessibility concerning one selected mode of transport. This is mostly because the comprehensive evaluation of multimodal accessibility changes is difficult due to its complexity and the multidimensionality of the analysis, which needs to include road, rail, air and inland waterway developments which, additionally, are interconnected, influencing one another. Moreover, the big push to transport infrastructure may be associated with the need to implement key intra-agglomeration and inter-agglomeration investment projects, resulting in an uneven distribution of investments, increased spatial polarisation and less balanced development [14,15,16,17]. As a result, all changes should be evaluated multidimensionally, including spatial as well as intermodal differences in the impacts of the changes that are implemented.
The difficulty in properly evaluating the impact of transport infrastructure development on accessibility is related to the fact that the big push to roads, railways, airports or ports is usually carried out (1) within a fairly short timescale compared to the programming period/periods of the European Union, calculated in years rather than decades, (2) simultaneously in many modes of transport, and (3) simultaneously in passenger and freight transport. It is true that some modes are almost exclusively important in the transport of goods, e.g., inland waterway transport, while in other modes, passenger transport still dominates, e.g., in air transport. However, road and rail transport serve both passengers as well as goods, which is often omitted in road and rail accessibility analyses with some important exceptions such as the ESPON TRACC report [18].
Continuous monitoring of accessibility indicators raises questions related not only to the mode and type of transport, but also other dimensions of accessibility, such as impedance, origins, destinations or spatial equity [19]. For example, on the same category of road, e.g., on motorways, we are dealing with different speeds in truck and individual transport. Similarly, different speeds of passenger and freight trains should be considered as a result of a rail investment project. The densities of networks of particular modes also differ between each other. As a result, the same change in transport infrastructure might have a completely different impact, depending on the dimension of accessibility being analysed. Moreover, in order to provide insightful conclusions for sustainable strategy planning, all results should be provided in a potentially detailed spatial scale. Another challenge in the evaluation of multidimensional accessibility is related to the quantification of the attractiveness of destinations, and particularly differences between passenger and freight transport.
All the above-mentioned challenges show the complexity of the multidimensional analysis of changes of accessibility level and its spatial pattern. Thus, the main aim of the paper is to present a methodical approach to differences in changes in intra-national potential accessibility, its level and dispersion. This is applied to both freight and passenger transport simultaneously for four modes during the intensive development of transport infrastructure stimulated by EU funding in the post-accession period, with particular emphasis on the 2007–2013 programming period in Poland (with forecasts concerning the 2014–2020 programming period until 2023). The results include both ex post and ex ante evaluation of changes in accessibility, taking into account three modes of passenger transport (road, rail and air) and three modes of freight transport (road, rail and inland waterways). In the case of each transport mode and type, we consider (1) the percentage change in accessibility level at the municipal level, (2) the absolute and relative change in accessibility at the national level and (3) the change in regional dispersion in accessibility (both in percentage and absolute terms).
We propose an innovative study to fill a research gap in the context of monitoring sustainable and territorially balanced development. To the best of the authors’ knowledge, there is no country in Europe where there would be constant monitoring of changes in accessibility, taking into account land use data and changes in travel times, which would enable accessibility analysis at the commune level. The innovative approach to the discussed issue has great application value. Our model was applied by the Ministry of Funds and Regional Policy, and the results of the accessibility monitoring are used to supply the STRATEG database (Statistics Poland), which collects annual indicators, and are used for the purposes of monitoring the effects of, inter alia, the Strategy for Sustainable Transport Development until 2030. Summing up the paper’s novelty, it is focused on a descriptive and explanatory model based on available data sources.
The paper is divided into five sections. The Section 2 presents the methods of accessibility measurement applied and defines the potential accessibility dispersion index (PAD) and mean centre of potential accessibility distribution. Section 2 also focuses on the methods applied in relation to the analysis of the land use and transport components of the accessibility indicator. Moreover, in this section, we describe our study area, including an analysis of accessibility and its spatial patterns for particular modes and types of transport. In the Section 3, we discuss the results regarding both spatial differentiation in changes in accessibility and change in the level of accessibility and its dispersion. The Section 4 discusses the pros and cons of our approach and shows the avenues for future research. The Section 5 summarises the results.

2. Materials and Methods

2.1. Model

Accessibility is one of those parameters that has not been given one universal definition. As Gould [20] indicates, accessibility is a term many times used, but which hardly anyone can ultimately define or measure. Therefore, the multidimensional character of accessibility implies the possibility of studying this phenomenon using different methods [21,22,23]. Due to the lack of appropriate data, the dynamic approach to accessibility analysis at the national scale excludes the application of advanced research methods, such as utility-based measures (see an overview of the variety of accessibility indicators in Geurs and van Wee [24], Bruinsma and Rietveld [25], and Spiekermann and Neubauer [19]). In turn, simple accessibility methods such as infrastructure-based measures and geographical measures are mainly suitable for research on a small spatial scale. As a result, the most common method for evaluating changes resulting from the implementation of individual projects or investment programmes is potential accessibility [18].
Potential accessibility is based on the assumption that destination attractiveness increases with size of opportunity (land use component of Formula (1)) and decreases with increasing distance, travel time or cost (transport component of Formula (1)). The decrease in destination attractiveness with increasing distance is described by the distance decay function. If one assumes the most frequently used exponential function of a distance decay measure (see Rosik et al. [26], Beria et al. [27], Stępniak and Jacobs-Crisioni, [28], and Reggiani et al. [29]), and time as a distance decay element, we obtain the basic accessibility formula:
A i ( T , M ) = j = 1 n O j e x p ( t i j ( T , M ) )
where A i ( T , M ) is the accessibility of transport zone i by transport type T and mode M, Oj is the attractiveness of zone j drawn from a set of a total of n zones in the study area (ji), and t i j ( T , M ) is the travel time from i to j with transport type T and mode M. The value of Ai is further increased by the term Oitii, which is the self-potential, reflecting zone i’s own attractiveness Oi and the average intra-zonal travel time tii [14,30].
Depending on the transport mode and type, there are different ways of assessing the attractiveness of the destination. In accessibility surveys at national level, regardless of the transport mode or type, the opportunity is usually understood as the total population living in a transport zone or its total GDP [18]. Nevertheless, it is particularly difficult to measure destination attractiveness for air or inland waterway accessibility. For this reason, researchers often rely on simple measures. For example, Sellner and Nagl [31] define air accessibility by the total number of passengers within a country divided by the population. Generally, access to airports is understood mainly as accessibility using individual transport [32] or also using rail [13]. In the case of inland waterway transport, we mostly find studies comparing travel times in a multimodal way, e.g., with truck transport, as in Nam and Win [33]. The relationship between inland waterway transport and truck transport in the context of industrial accessibility is also described in Button et al. [34]. To the best of the authors’ knowledge, there is a lack of comprehensive research combining accessibility by inland waterway transport with accessibility by other modes. This type of accessibility analysis of the transport of goods by water is much more frequently applied to sea transport (compare Spiekermann et al. [18]).
In the case of the simultaneous analysis of multiple modes of transport (a multimodal approach), there are three possible approaches to calculating accessibility: (1) unimodal indices calculated independently for each transport mode; the possibility of integration in a synthetic indicator, e.g., on the basis of shares in transport performance of particular modes [35]; (2) multimodal indicator obtained using, (a) the fastest or least costly transport mode for each OD relation, irrespective of the other modes, (b) the average time or travel cost for different modes, and (c) a composite generalised cost [36]; (3) an intermodal indicator, taking into account the possibility of transfers between two or more modes of transport during a journey, particularly important in freight transport (logistics chains) and in passenger transport over longer distances [19]; this approach requires the calculation of the shortest travel paths for the intermodal generalised cost taking into account the time, cost and discomfort associated with transfers and access and egress links [37].
A dynamic approach in accessibility studies is increasingly related to spatial diversity [15,17,38,39,40,41]. This is particularly important for countries in a stage of rapid development, both in economic as well as in infrastructural terms. The aim of cohesion policy is to reduce the backlog of infrastructure, including the remoteness of peripheral areas [42]. One of the possible methodological approaches is to use the dispersion indicator PAD (potential accessibility dispersion), which is created through the ratio of the standard deviation of the accessibility indicator to the average weighted by the population indicator value at the level of the commune (see Formula (2)):
P A D = S D ( A i ) A i * P i P i
where A i is the value of the potential accessibility indicator calculated for unit i, P i is the population of unit i, and S D ( A i ) is the standard deviation of A i values weighted by population. The higher the indicator value, the higher the accessibility differences, and the lower the indicator, the lower the differences. If dynamics are taken into account, a decrease in spatial polarisation occurs as a result of the indicator value decreasing in time, while there is an increase in polarisation as a result of the indicator increasing.
The spatial distribution of potential accessibility concerns not only accessibility dispersion but also the weighted mean centre. The weighted mean centre gives interesting information about the direction of the trajectory of the centroid point. In general, the weighted mean centre, also called the geographic centre, is a two-dimensional average weighted by a variable, and for accessibility, it is calculated according to the following formula:
x ¯ = i = 1 n A i ( T , M ) x i i = 1 n A i ( T , M ) ; y ¯ = i = 1 n A i ( T , M ) y i i = 1 n A i ( T , M )
where x ¯ , y ¯ represents the centre (centroid), Ai is accessibility of transport zone I by transport type T and mode M, xi, yi are the coordinates of a transport zone i, and n is number of transport zones (2321). For the calculation, we used the mean centre [43] tool in the QGIS Desktop 3.6.0 application with GRASS 7.6.0.

2.2. Data Source and Processing

The land use component reflects the land use system, including the spatial distribution of opportunities [24]. The need for continuous monitoring forces the researcher to only use those variables that are available on a regular basis in the public statistics. In order to simplify the procedure, the number of variables determining the attractiveness of the destination for road and railway transport was limited to two, i.e., population and GDP. The calculation of indicators of population accessibility was adopted for passenger transport by road and rail. For freight transport by road and rail, population accessibility was also used, but in order to take into consideration the economic (market) element, the additional supplementation of the GDP data on the sub-regional level was added. We assume that in 2004, which is the year of accession into the EU, the share of the market element (GDP) determining the attractiveness of all destinations in Poland equals 25% of the total sum of opportunities. For freight transport, it is particularly evident that if the attractiveness of the destination changes quickly both at the national and local scale, then when testing the accessibility in dynamic terms, this can have a big impact on the final results of the study [16,44].
Unlike road and rail, in the case of air transport, destination attractiveness was assumed to be analogous to airport capacity. Therefore, air accessibility results on one hand from the car travel time to all airports in the country and, on the other hand, from airport capacity (see Table 1). For inland waterway transport, the investments included those significantly improving technical conditions on the Oder Waterway, the lower course of the Vistula, and Noteć as a waterway linking the Vistula with the Oder. River harbours were assigned, analogously as in the case of airports, a specific “capacity” following from the class of waterway that was indicated as “mass” in the accessibility model. Thus, the accessibility change followed on from the improvement of the class of waterways or the improvement of HGV access to waterways resulting from road investments (see Table 1).
Summing up, the land use component determining the attractiveness of the destination has been defined depending on transport mode and type: (a) in passenger transport (road and rail), population; (b) in freight transport (road and rail), population and GDP; (c) in air transport, airport capacity; (d) in inland waterway transport, waterway classes assigned to river ports.
The transportation component describes the transport system including the time, cost or effort involved in using a specific transport mode and type to cover the distance between an origin and a destination [24]. We assume the exponential function f (cij) = exp (−βtij) as the measure of distance decay, where the appropriate parameter was indicated as β = 0.023105 (see Spiekermann et al. [18], Stępniak and Rosik [38], and Rosik et al. [45,46]), which means that destination attractiveness decreases by half for a travel time amounting to exactly 30 min, while for about 100 min the attractiveness reduces to ca. 10%. In order to enable a comparative analysis in dynamic terms, the same parameter was used for all modes of transport.
For road transport we use the speed model developed at IGSO PAS, which indirectly takes into account both regulations (speed limits on a dozen categories of road, a lower speed in a location within built-up areas) and travel conditions (population density in the 5 km buffer around the road section and topographic impediments). The speed model for both individual and heavy good vehicles (trucks with trailers) is based mainly on earlier works [47]. The major investments on the national and voivodeship road network and, in exceptional cases, on key poviat roads were taken into account. We cooperated with both the General Directorate for National Roads and Motorways (GDDKiA) on investments on national roads and with the 16 Marshal’s Offices on investments on voivodeship roads and asked them to provide the relevant data characterising the investment including the exact courses and location of the nodes.
For the railway network managed by the Polish railway infrastructure manager PKP PLK S.A., we base our analysis on the maximum technical speeds for passenger and freight trains. The change in speed results from either network degradation (reduction in speed) or infrastructural investment (increase in speed). If there was no railway station in the municipality or the station was located outside the municipal town, the model allows access to the station by the road network with the use of the adjusted speed model with correspondingly reduced car speeds. Analysis was carried out in cooperation with PKP PLK S.A. and the 16 Marshal’s Offices, which resulted in us obtaining information on all the largest investments carried out on the railway network, including information on changes in the maximum technical speeds resulting from the investments carried out.
Furthermore, all major investments carried out at airports and inland waterway ports and sections designed to increase the capacity of terminals and waterways were taken into consideration. The most important investments affecting the spatial pattern of accessibility are described in the next subsection of the paper.

2.3. Study Area

Poland in general is one of the largest beneficiaries of structural aid. In the 2007–2013 perspective alone, the total value of transport projects exceeded PLN 99 billion, with most of the money allocated to road investments. The investment process started earlier, i.e., at the beginning of the 2000s, initially as part of the pre-accession ISPA programme, and after accession within the programming period 2004–2006. However, the infrastructure development was of a limited range and had a random character, mainly due to the lack of environmental decisions and problems with land purchase (Rosik et al. [39], 2015). The next programming period (2007–2013) brought a really big push to provide infrastructure, with the main road investments concentrated within the Operational Programme Infrastructure and Environment. The peripherally located macro-region of Eastern Poland was designated for special assistance under the cohesion policy within the separate Development of Eastern Poland Operational Programme. Furthermore, the reform of administrative divisions created the conditions for implementing a more sustainable spatial policy within the 16 Regional Operational Programmes targeting intraregional transport networks.
In a spatial context, the European Union funds were used for, among other purposes, the building of most of the sections of the A2 and A4 motorways linking the Polish–German with the Polish–Belarussian and Polish–Ukrainian borders. In addition, over a thousand kilometres of express roads were built, not differing a lot in parameters from motorways. With the railway infrastructure, the largest investment projects lasted for a very long time, and were continued through consecutive financial perspectives. Such projects included modernisations of the Warsaw–Gdańsk, Warsaw–Łódź and Wrocław–Kraków lines. A specific feature of the utilisation of European Union funds in the transport sector in Poland was a considerable share of projects in conurbations, including the underground in Warsaw [48], new tram lines, intra-urban road routes, port projects (facilities in Gdańsk, Gdynia, Szczecin and Świnoujście), modernisation of almost all the airports operating in the country, as well as the construction of three new airports in Modlin, Lublin and Szymany. Inland waterway transport is a bit neglected, although in this case, there were also a few investments that improved the class of sections of waterway, in particular on the River Oder.
As a result, a large proportion of the investments made over the last two decades have been realised with the participation of European Union funds. Thus, the periods of time covered by the evaluation analyses are determined by the programming periods. In Polish conditions, apart from the first, relatively short period of 2004–2006, this is above all 2007–2013. The possibility of spending funds up to two years after the close of the period, which is permitted due to the “n+2 rule” applied to the annual allocation provided in the EU programming period 2007–2013, means that the spending can take place up to the end of 2015. Last but not least, one should not forget the current period of 2014–2020 (2023). As a result, our study consists of ex post as well as ex ante analysis, although we focus more on the 2007–2013 programming period. We use a unified set of 2321 transport zones which correspond to Polish municipalities. In order to provide background information to our readers, we present the spatial pattern of potential accessibility at the end of the programming period analysed (2015) for three modes of passenger transport and three modes of freight transport (Figure 1).
The spatial differentiation of accessibility in Poland for road (individual and truck), rail (passenger and freight) and air transport is of a bipolar pattern, which results in the highest accessibility level in: (1) the Warsaw–Łódź pole in central Poland and (2) the Kraków–Katowice pole in southern Poland. The other cities within the so-called hexagon, i.e., the network metropolis, Wrocław, Poznań and the Tri-City, have a good, but correspondingly lower level of accessibility. In general, a higher level of accessibility is associated with inter-metropolitan sections of all the main transport corridors including the Baltic–Adriatic and North Sea–Baltic TEN-T corridors as well as the third Pan-European transport corridor in the south of Poland. The importance of the location of the corridors is visible in particular between Warsaw and the Tri-city, where the municipalities along the A2 motorway and E65 railway line create a corridor of better accessibility. At the intranational level, the least accessible areas are border municipalities, in particular in northern Poland, although the range of extreme periphery in terms of distance to the border varies depending on the mode and type of transport [49]. The accessibility pattern for inland waterway transport looks different and is much more west-oriented due to its dependence on the classes of sections of waterway on the Oder and lower Vistula rivers.

3. Results

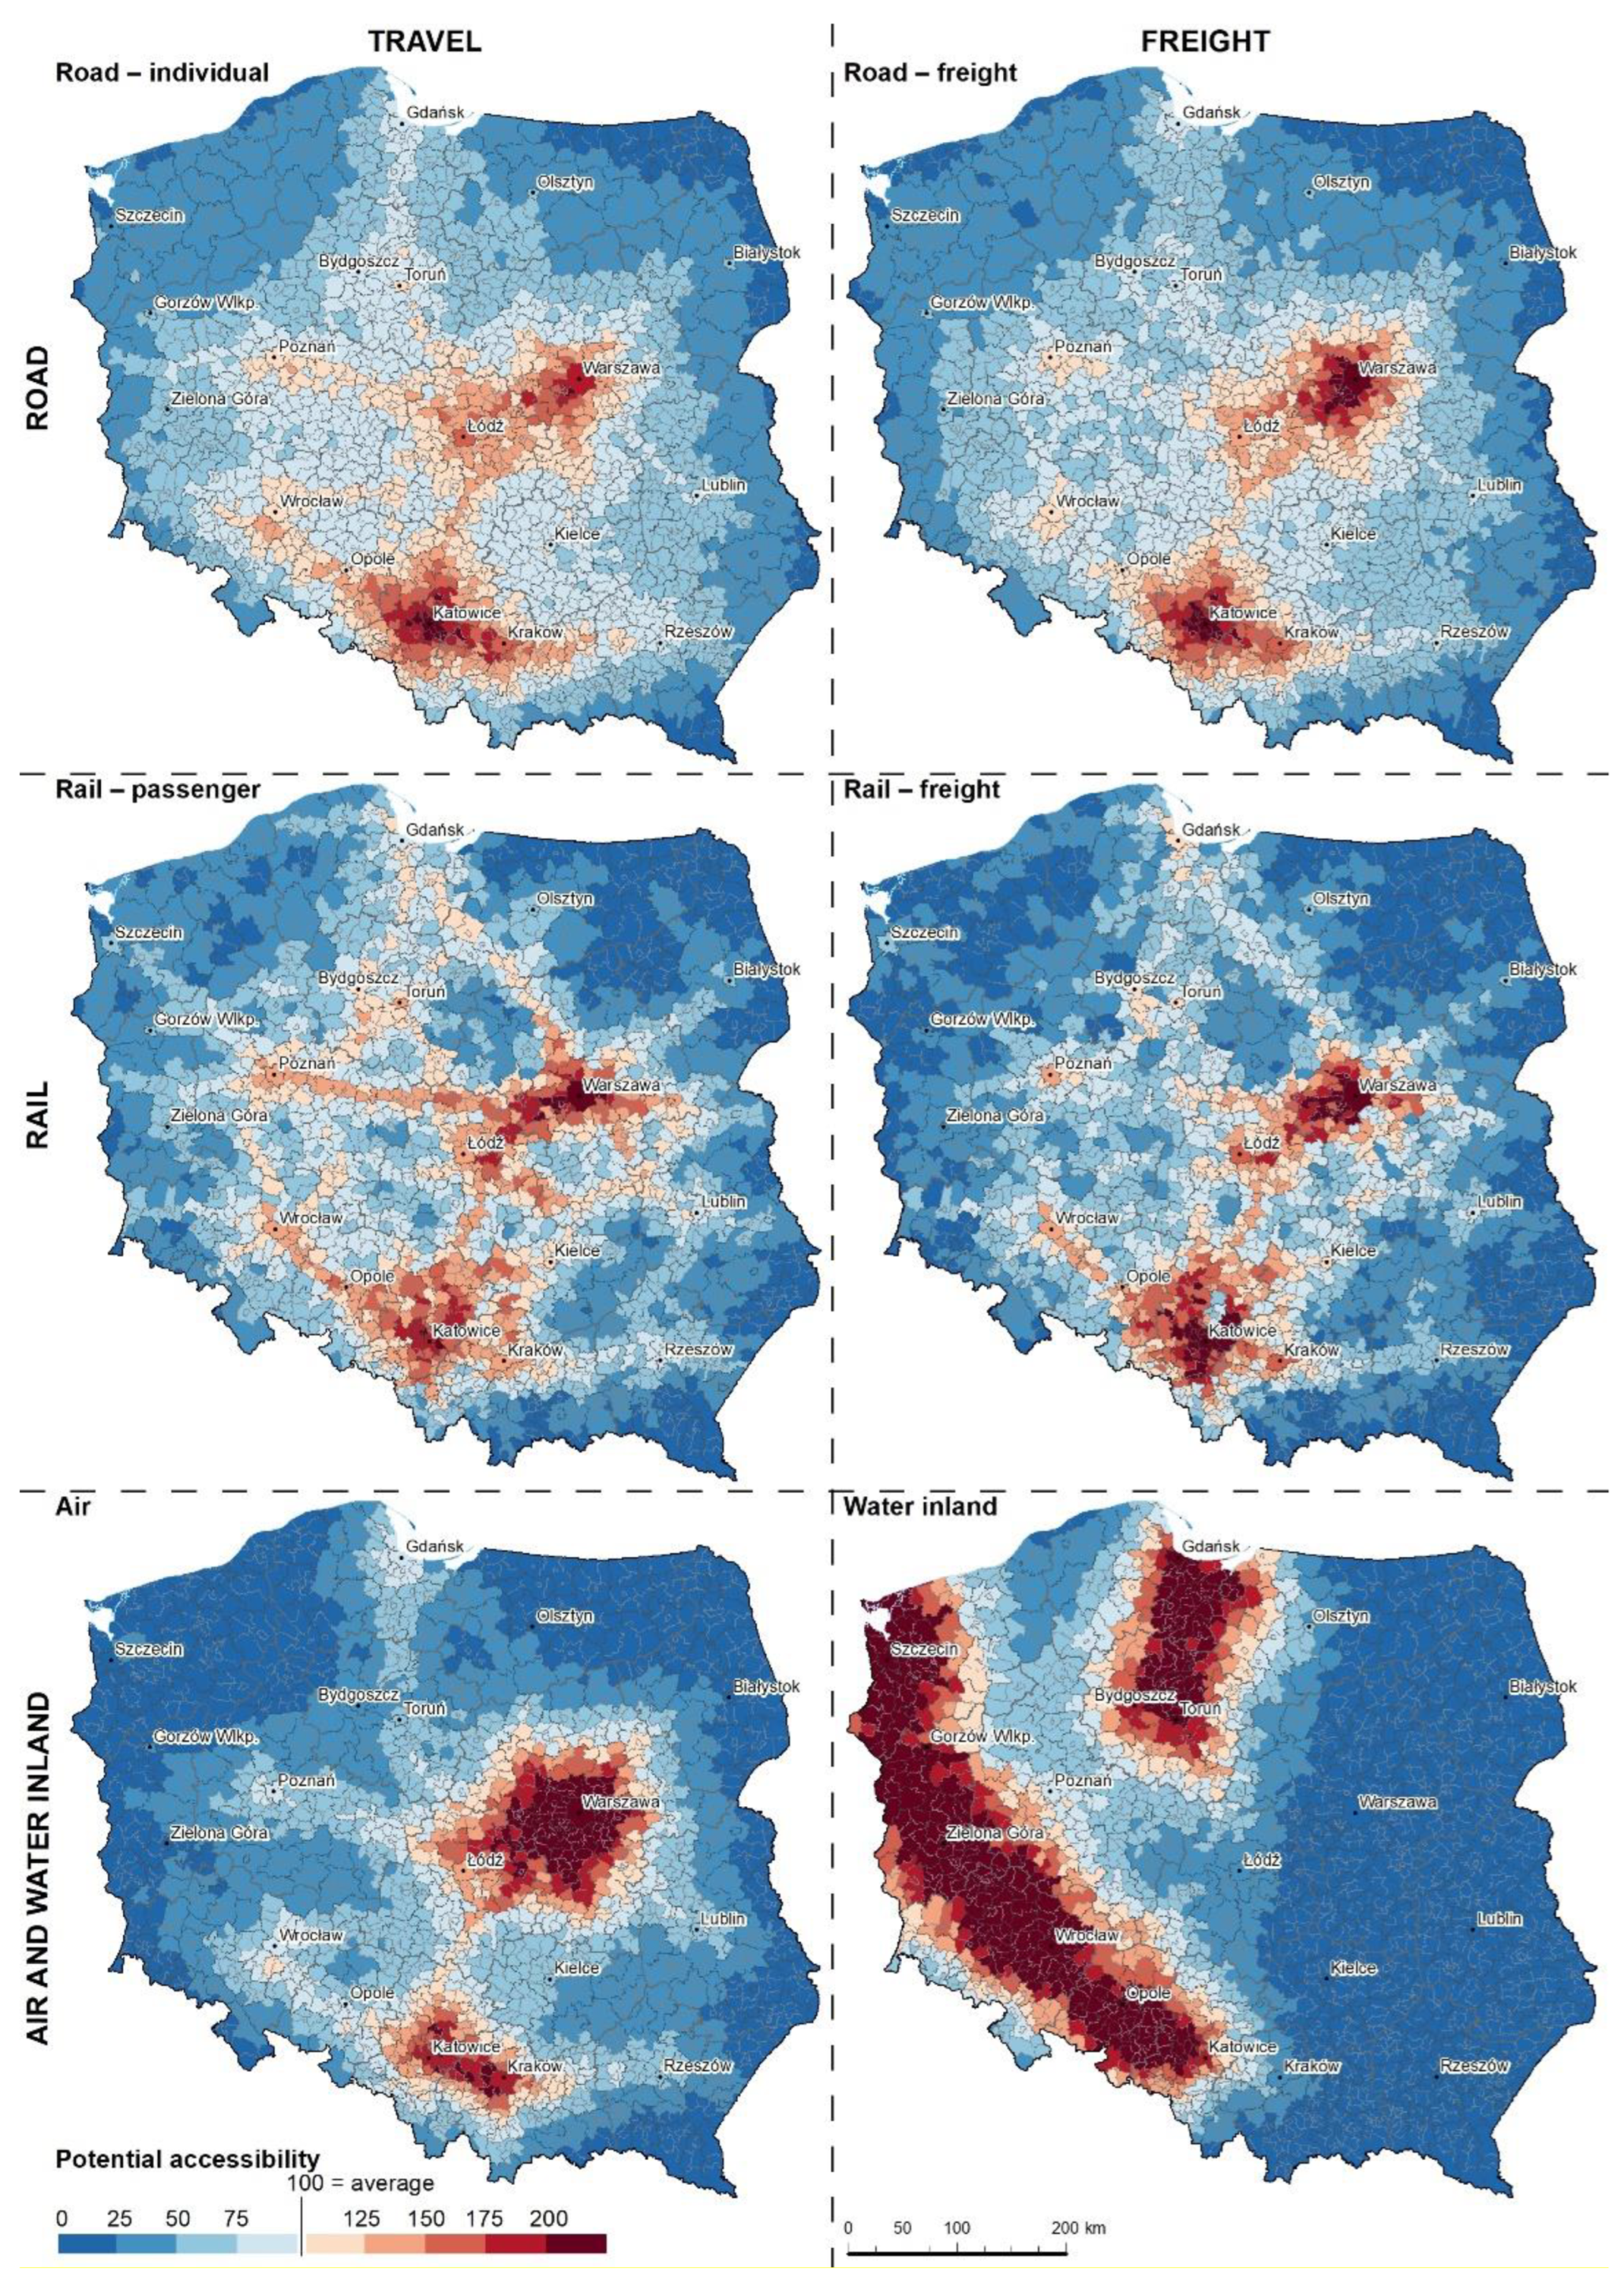
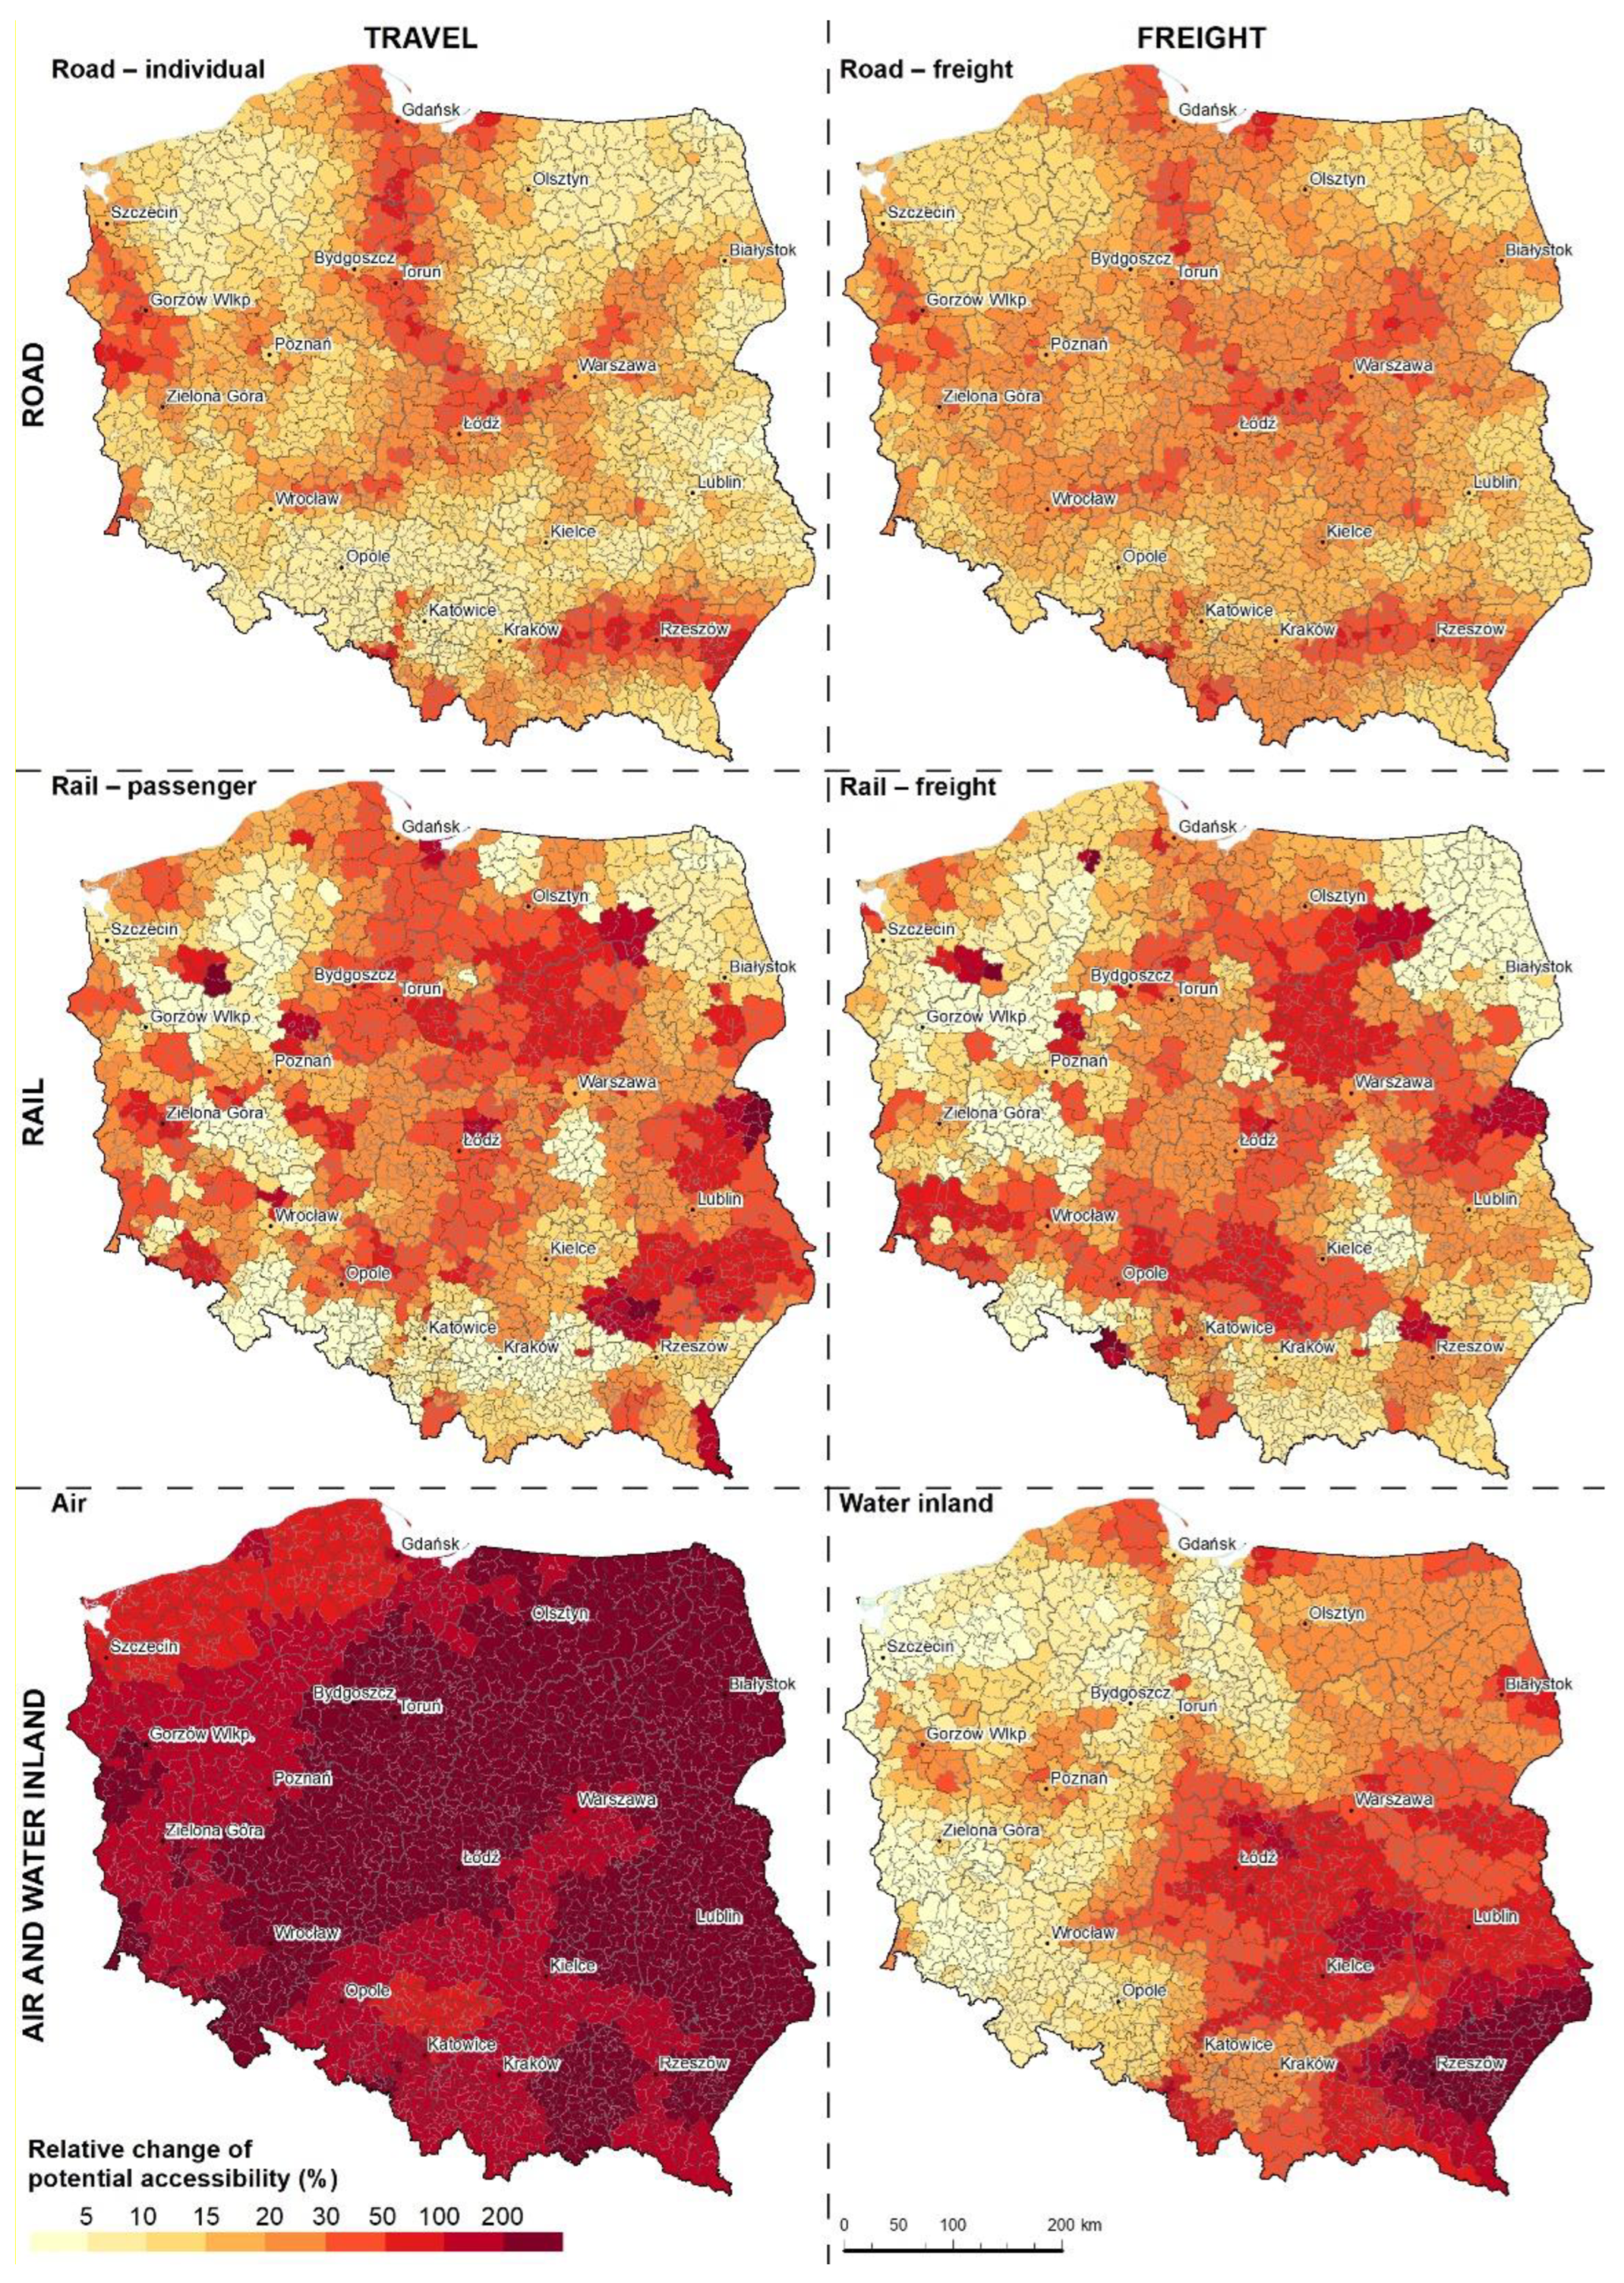
3.1. Spatial Patterns of Change in Accessibility

As far as relative (percentage) change in road accessibility is concerned, the effect is in general spatially widespread in some parts of the country, but relative increments are concentrated in the direct neighbourhood of the nodes of new motorways and expressways (Figure 2). The widespread impact found in, among other regions, eastern Poland, is in part an effect of investments implemented outside that macro-region, and in part the result of a low base-point and very poor accessibility in 2007. The areas that gained least from the road investments in 2007–2015 were: Central Pomerania, the Lithuanian borderland and the eastern part of Lubelskie [46]. In general, the surpluses of the positive effects on truck transport over individual transport are visible around agglomerations and cover, e.g., the whole of the Mazowieckie Voivodeship. This is caused by the concentration of GDP in the largest metropolises.
With rail transport, in the percentage view, areas of accessibility improvement are particularly noticeable in some peripheral areas of the country. The greatest beneficiaries are the Lubelskie and Podkarpackie Voivodeships, where the improvement in railway accessibility stems both from investments co-financed by the European Union and other speed increases, including the restoration of passenger traffic, undertaken as a result of PKP PLK works. The smallest changes in railway accessibility, only slightly above 7%, are exhibited by the Małopolskie Voivodeship.
The capacity of the largest airports in the country in 2015 exceeded 60 M and has at least doubled, and in certain cases tripled, since 2007 [35]. Due to numerous infrastructural investments, both at the airports themselves and on the access routes to the airports, the level of air accessibility has increased significantly all over Poland and, at the national scale, is much higher than for other modes. Eastern Poland benefited the most in percentage terms (an over threefold increase).
The effect on inland waterways, in percentage terms, shows that between 2007 and 2015 a beneficiary is, paradoxically, the area of south-eastern Poland, which stems from the effects of the very low base of accessibility to river ports in 2007, relatively few investments on the Oder Waterway and a significant improvement in access to those ports for heavy good vehicles coming from eastern Poland via the A4 motorway.
The weighted mean centres of potential accessibility distribution are all located near Łódź in central Poland (Figure 3). In contrast to the weighted mean centre of population distribution, which is located close to the western border of the city, all weighted mean centres of potential accessibility, regardless of the mode and type of transport, are located to the south (road and rail) or west (air) of Łódź.
The even spatial distribution of road investments in the northern, western, eastern and southern peripheries of the country results in the lack of a large movement of the centroid point of road potential accessibility. In the case of rail, the centroid is located a little to the north, which is a consequence of a relatively better rail infrastructure in the former Prussian territory of northern and western Poland. The investments undertaken in the 2007–2013 programming period moved the centroid for passenger rail accessibility even further northwards. Nevertheless, if one analyses the forecast until 2023 for road (both travel and freight) and air, the mean centre trajectories are Warsaw suburban and north-eastern Poland oriented, but in the case of rail, a westerly direction prevails. In general, the weighted mean centres of potential accessibility are more sensitive to investments at airports, while a large number of road and railway investments in all parts of the country result in more balanced development and only slight changes of mean centres of accessibility distribution.

3.2. Change in the Level of Accessibility and Its Dispersion

The construction of motorways and expressways results in an increase in travel speed, which predominantly affects individual transport. With heavy goods transport, these effects are not so spectacular since heavy goods vehicles cannot drive faster than 90 km/h, even on motorways [50]. Therefore, in the case of road PAD index, a gradual increase occurred during the years 2004–2012, primarily in freight transport (Table 2). A further general spatial polarisation took place in 2010–2012 as a result of the opening of the sections of motorways located in central Poland (A2 and A1 motorways) in 2012. In the following period, i.e., in 2012–2015, the dispersion decreased slightly, mainly due to the construction of a long section of A4 motorway towards peripherally located in south-eastern Poland as well as the opening of sections of some other expressways in peripherally located voivodeships in western and northern Poland. By 2023, the situation concerning regional differences in road accessibility should have improved, at least in the case of individual vehicles. Plans include the construction of a section of the S19 expressway between Lublin and Rzeszów and sections of the S61 towards the Polish–Lithuanian border, which will significantly improve the situation of peripheral areas.
The railway network is not as dense as the road network and this alone is an important factor contributing to much greater disproportions in railway accessibility than in road accessibility. Furthermore, at the time of the access of Poland to the EU, the railway network was heavily degraded. There were differences in accessibility between central regions, connected to the relatively faster inter-urban lines, and peripheral regions, where the railway lines were mainly degraded. Between 2006 and 2012, a slow process of decreasing interregional differences in passenger transport took place as a result of investments improving the accessibility of peripheral areas, e.g., the line towards Siedlce. On the other hand, long-term investments in connections between major urban centres, e.g., on the line between Warsaw and Gdańsk, were finished in the years 2012–2015 which led to an increase in regional differences in this period. By 2023, as a result of the investments planned by PKP PLK, interregional disproportions will have decreased significantly, which is related primarily to the planned improvement and reactivation of regional railway lines in peripheral areas, but also to an increase in the radius of influence of large cities. In general, the process of eliminating interregional differences in accessibility in railway transport will be more spectacular than in road transport, which means that both modes will converge in terms of level of dispersion in accessibility.
The lower was the density of the transport network, the greater were the differences in accessibility. It should be of no surprise, then, that road transport exhibits the smallest differences, followed by railway transport, while air transport and inland water transport exhibit much greater differences (Figure 4). Thanks to the development of regional airports, where particularly large investments took place in 2010–2012, and improvements in vehicle access to the airports, a decrease occurred in the disproportions in air accessibility between regions. However, large investments in airports in the two biggest cities in Poland—Warsaw and Kraków—in 2012–2015 result in a reversal of this positive trend towards cohesion. Nevertheless, the lack of larger investments in the period up until 2023 results in the maintenance of relatively large differences in regional accessibility in both air and inland waterway transport.
Comparison of the results for passenger and freight transport shows that accessibility via freight transport exhibits greater differences than accessibility via passenger transport in both road and railway transport. This is related to two issues. First, the speeds achieved in heavy goods transport via road and by freight trains are much slower than in the case of individual transport or passenger trains for each mode, respectively. This means that the radius of influence of large cities, e.g., cities with large populations or areas of high gross domestic product, is much smaller than in passenger transport. This in turn implicates larger differences in accessibility between central and peripheral regions in terms of freight transport. The second issue essential to understanding the reasons for greater accessibility differences in freight transport is the inclusion of GDP as a factor influencing the attractiveness of travel destinations. GDP is generated primarily in major built-up areas, which determines the higher concentration of “mass distribution” in freight transport than in passenger transport. Furthermore, the dynamic process of absolute divergence of regional accessibility also takes place, both in the economic and demographic sense, which results in increasing differences in the distribution of opportunities to the benefit of central regions, and at the cost of peripheral areas. The distribution of planned investments leads to a more or less stable PAD index for road transport until 2023. In the case of railways, a change in trend occurs and it is becoming a positive one. Nevertheless, the decrease in polarisation will only happen if all the currently planned railway investments are fully completed. In the case of air and inland waterway transport, we should not expect glaring changes in the distribution of accessibility between regions. Still, interregional differences for these two modes of transport will be much larger than for the dense road and rail networks.

4. Discussion

Like any model, the potential model used in this paper to evaluate the impact of the development of infrastructure in many transport modes on changes in accessibility is not without opportunities for development in the future. A certain disadvantage of the model used is the fact that it only concerns infrastructure, and not, in particular, as regards rail and air transport, real timetables, which would certainly make the model more attractive from the point of view of the reality of the results. On the other hand, one advantage of using infrastructure-based data is their direct connection with investments, and not with traffic management (timetables). Moreover, certain development opportunities of the model used in the future are related to the following: (a) the use of synthetic indicators, e.g., independently for passenger and freight transport according to the share of particular modes in the transport undertaken [35]; (b) the use of intermodal indicators enabling transfers; (c) the use of generalised cost, which is especially important in freight transport where time is one of the many factors affecting the modal choice. The effect of the impact of changes in accessibility on regional income, location of enterprises, etc. is also worth studying. The rich dataset, allowing the study of changes in accessibility in multimodal and dynamic terms at a low level of data aggregation, could lead to interesting results concerning the relationship between transport and land use (see Rokicki and Stępniak [51]). Another interesting development of the model is the inclusion of uncertainties in the research [52].
The research method presented gives the opportunity to analyse multimodal changes in accessibility for many modes of transport for any large country or group of countries. In Europe, an analogous analysis would be indicated in all countries with an intensively developing infrastructure, especially among the new member states from Central and Eastern Europe in the context of spatial changes, the rate of growth and the dispersion of accessibility. Assessment of the spatial differentiation of the level of accessibility in multimodal terms is also indicated for other large countries, such as Germany, France, Italy or Spain. It is advisable to put more emphasis on the differences between passenger and freight transport in the context of the speed model and the attractiveness of the destination.

5. Conclusions

The conclusions regarding the study area are as follows:
  • The effects of the increase in accessibility following Poland’s accession to the European Union are rapid and, during only one programming period 2007–2013, reach from 14% for inland waterway transport to as much as 177% for air transport.
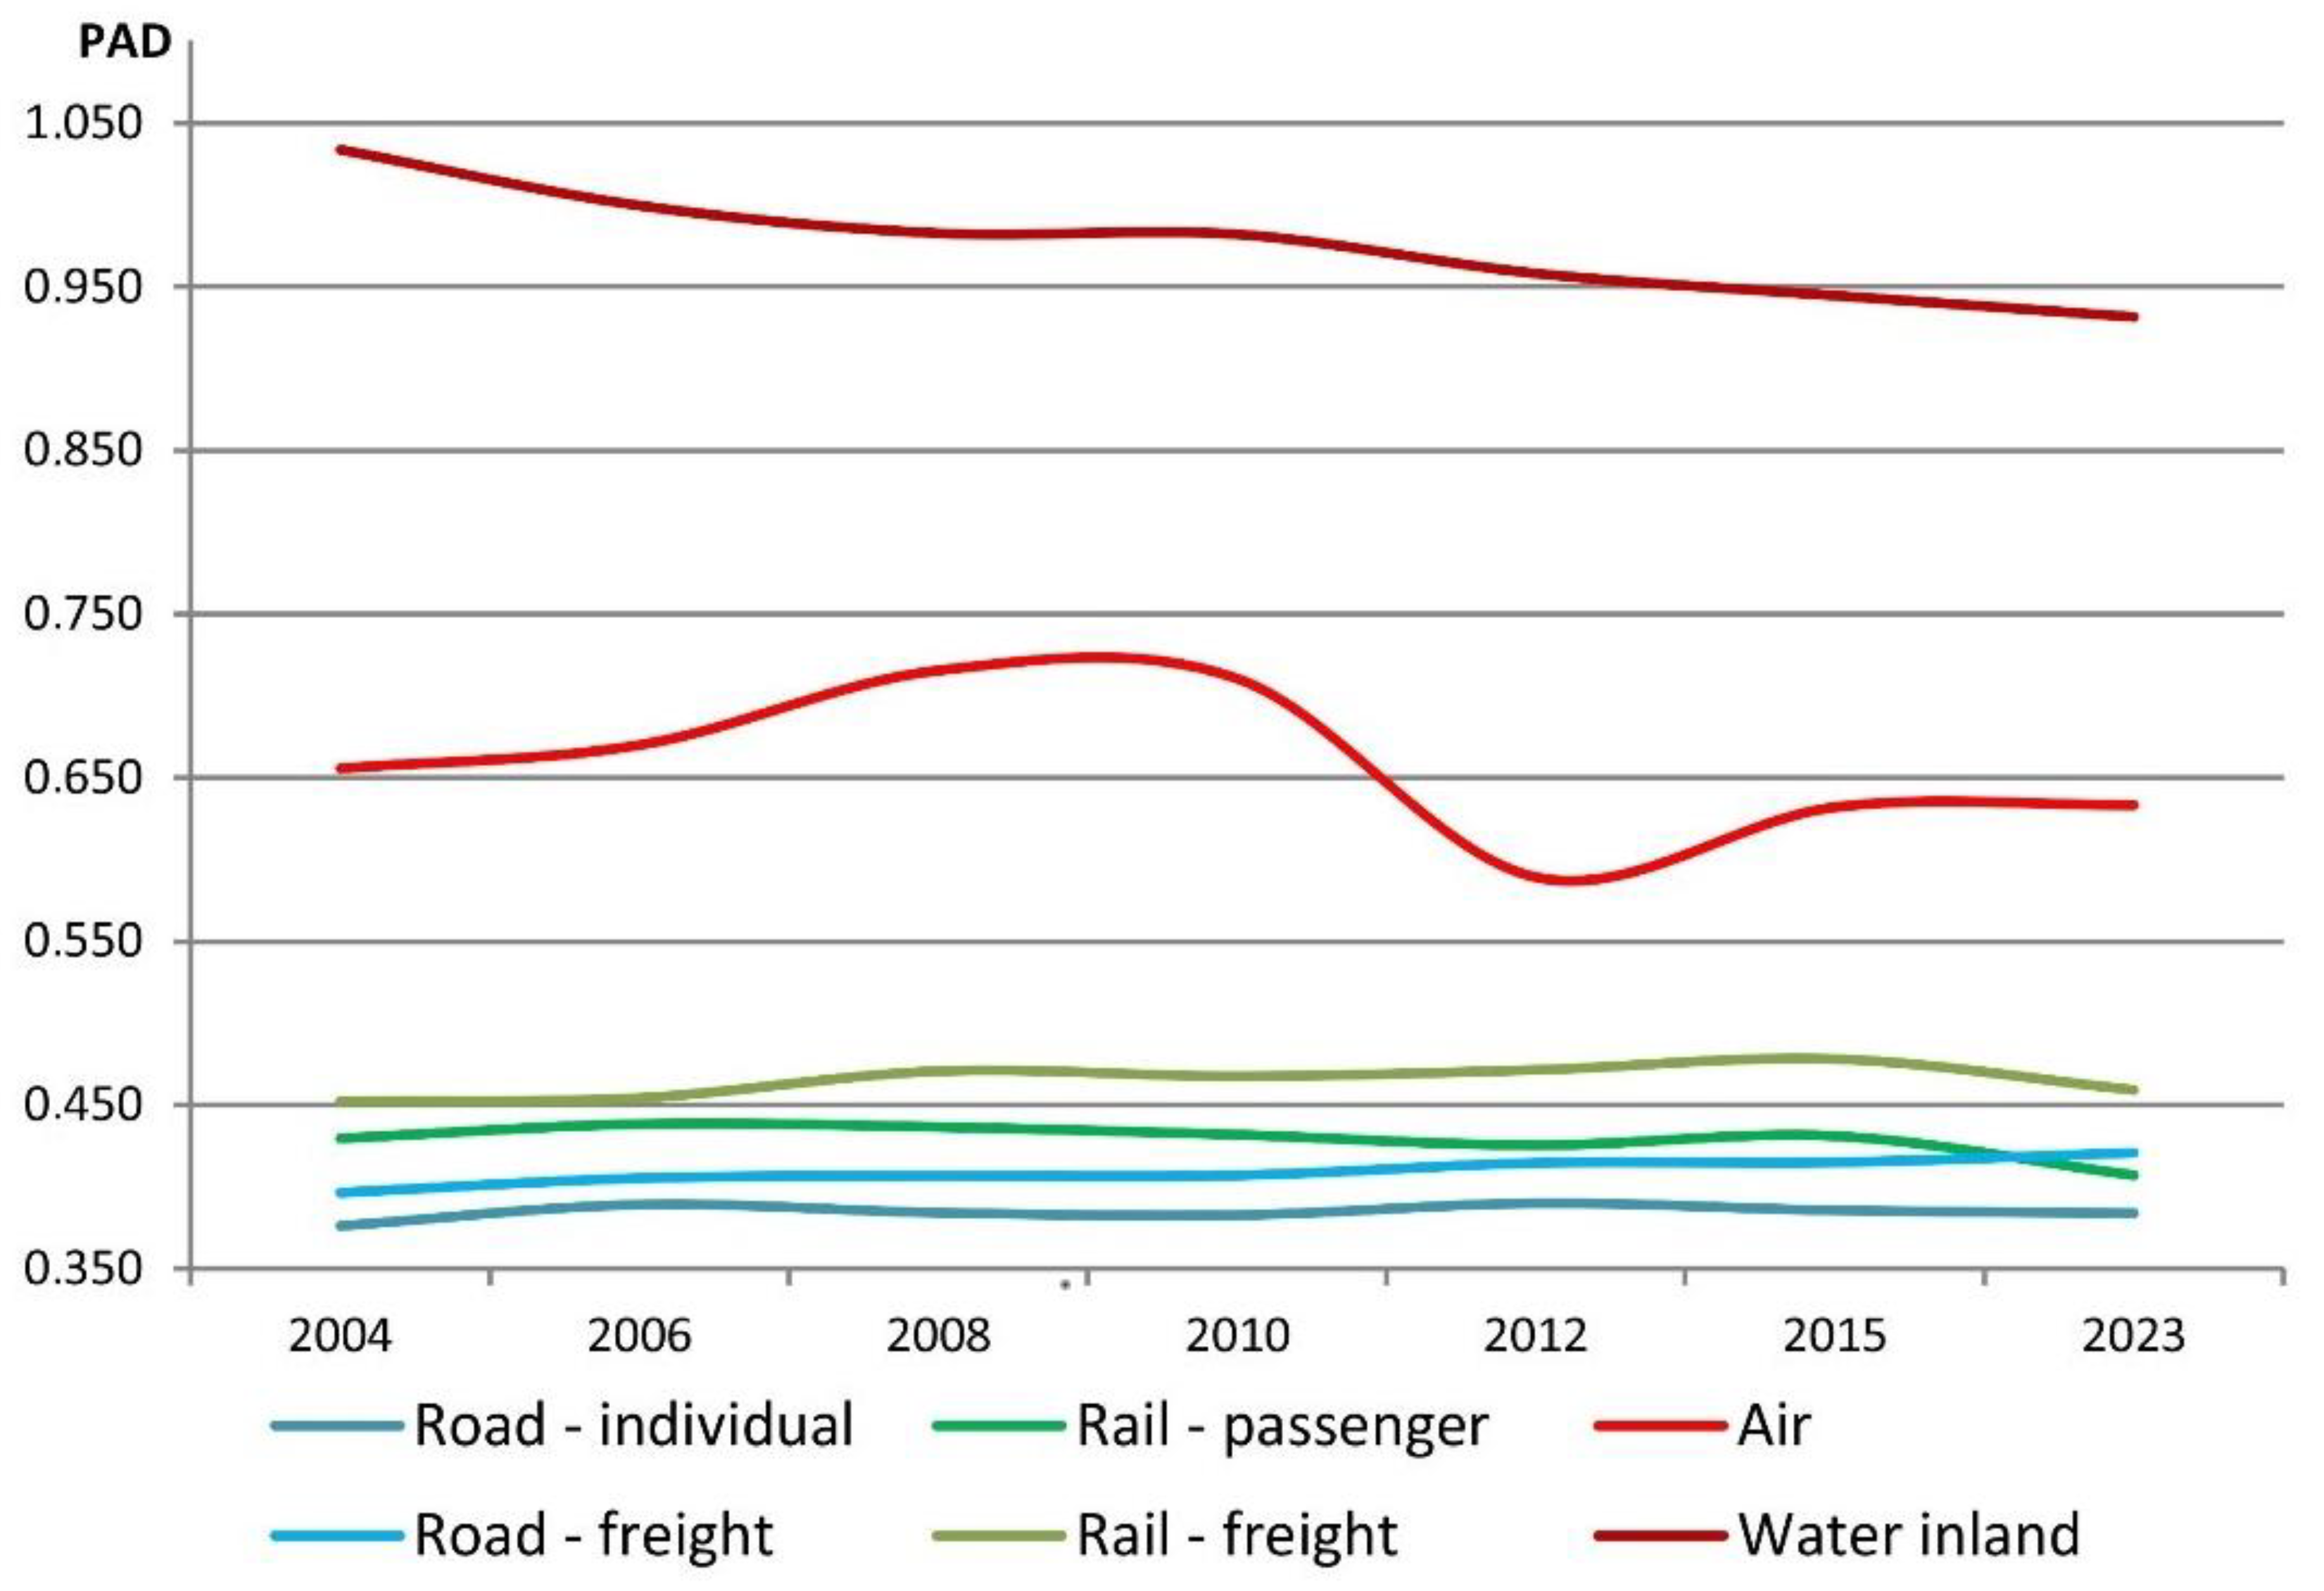
  • In the same period, the effects of eliminating territorial differences in accessibility are quite different depending on the transport mode: from a generally positive effect in passenger transport to varied effects in freight transport, including particularly highly polarising effects in rail transport.
  • In the near future, i.e., up to 2023, the situation in this respect should improve as a result of rail investments in peripheral areas.
The research method applied gives the opportunity to check, both for freight and passenger transport, the effects of the development of transport infrastructure in multimodal terms during its period of intensive development. This effect can be interpreted as:
  • The rate of increase in the overall accessibility level;
  • Spatial differentiation;
  • Cohesive changes (dispersion).

Author Contributions

Conceptualization, P.R. and T.K.; methodology, P.R, T.K. and M.S.; software, W.P. and S.G.; validation, S.G and M.S.; formal analysis, P.R.; investigation, P.R. and S.G.; resources, S.G. and M.S.; data curation, S.G.; writing—original draft preparation, P.R. and T.K.; writing—review and editing, P.R.; visualization, S.G.; supervision, P.R. and T.K.; project administration, P.R.; funding acquisition, P.R. and T.K. All authors have read and agreed to the published version of the manuscript.

Funding

This research received funds from the National Science Centre in Poland allocated on the basis of decisions nos. 2018/29/B/HS4/01999 and 2020/37/B/HS4/00544.

Institutional Review Board Statement

Not applicable.

Informed Consent Statement

Not applicable.

Data Availability Statement

All the data of the present research is available in the manuscript.

Conflicts of Interest

The authors declare no conflict of interest. Marcin Stępniak is currently working for Joint Research Centre, European Commission. The views expressed here are purely those of the authors and may not, under any circumstances, be regarded as an official position of the European Commission.

References

  1. Marada, M.; Květoň, V.; Mattern, T.; Štych, P.; Hudeček, T. Accessibility Patterns: Czech Republic Case Study. Eur. XXI 2013, 61–76. [Google Scholar] [CrossRef]
  2. Michniak, D.; Székely, V. Relative Accessibility of District Centres in Slovakia by Public Transport in 2003 and 2017. Eur. Spat. Res. Policy 2019, 26, 27–41. [Google Scholar] [CrossRef]
  3. Michniak, D.; Więckowski, M.; Stępniak, M.; Rosik, P. The Impact of Selected Planned Motorways and Expressways on the Potential Accessibility of the Polish-Slovak Borderland with Respect to Tourism Development. Morav. Geogr. Rep. 2015, 23, 13–20. [Google Scholar] [CrossRef]
  4. Rusnák, J.; Ďurček, P.; Takáč, M.; Óvári, K. Spatial Patterns and Time-Accessibility of Supplier Network of the Automotive Industry in Slovakia. Geogr. Pol. 2022, 95, 181–200. Available online: https://rcin.org.pl/igipz/dlibra/publication/272285/edition/235708/content (accessed on 10 July 2022).
  5. Garbacz, E.; Komornicki, T.; Kowalczyk, K. Dostępność Dzienna w Układzie Miast Wojewódzkich w Polsce = Daily Accessibility among Poland’s Voivodeship Cities. Przegląd Geogr. 2020, 92, 247–265. [Google Scholar] [CrossRef]
  6. Śleszyński, P. Rozwój Miast w Polsce a Ich Położenie Względem Autostrad i Dróg Ekspresowych = The Development of Cities in Poland and Their Locations in Relation to Motorways and Expressways. Przegląd Geogr. 2021, 93, 233–248. [Google Scholar] [CrossRef]
  7. Holl, A. Twenty Years of Accessibility Improvements. The Case of the Spanish Motorway Building Programme. J. Transp. Geogr. 2007, 15, 286–297. [Google Scholar] [CrossRef]
  8. Condeço-Melhorado, A.; Zofío, J.L.; Christidis, P. Drivers of Changes in Spainish Accessibility for the 1960–2010 Period. Eur. Transp. Res. Rev. 2017, 9, 19. [Google Scholar] [CrossRef]
  9. Suárez, E.L. Assessment of Transport Infrastructure Plans: A Strategic Approach Integrating Efficiency, Cohesion and Environmental Aspects. Ph.D. Thesis, Universidad Politécnica de Madrid, Madrid, Spain, 2007. [Google Scholar]
  10. Ribeiro, A.; Antunes, A.P.; Páez, A. Road Accessibility and Cohesion in Lagging Regions: Empirical Evidence from Portugal Based on Spatial Econometric Models. J. Transp. Geogr. 2010, 18, 125–132. [Google Scholar] [CrossRef]
  11. Figueira, P.; Viegas, J. A Proposed Methodology for Measuring Accessibility Taking into Account Economic Relations and Daily Cycles. In Proceedings of the European Transport Conference, Robinson College, Cambridge, UK, 27–29 September 1999. [Google Scholar]
  12. Gómez, J.M.N.; Vulevic, A.; Couto, G.; Castanho, R.A. Accessibility in European Peripheral Territories: Analyzing the Portuguese Mainland Connectivity Patterns from 1985 to 2020. Infrastructures 2021, 6, 92. [Google Scholar] [CrossRef]
  13. Katsios, I.; Tsatsaris, A.; Sakellariou, A. Spatial Typology of the Greek Territory Based on Transport Accessibility Indicators: A Cartographical Approach Using G.I.S. In Proceedings of the ERSA Conference, Volos, Greece, 30 August–3 September 2006; pp. 1–20. [Google Scholar]
  14. Gutiérrez, J.; Condeço-Melhorado, A.; López, E.; Monzón, A. Evaluating the European Added Value of TEN-T Projects: A Methodological Proposal Based on Spatial Spillovers, Accessibility and GIS. J. Transp. Geogr. 2011, 19, 840–850. [Google Scholar] [CrossRef]
  15. López, E.; Gutiérrez, J.; Gómez, G. Measuring Regional Cohesion Effects of Large-Scale Transport Infrastructure Investments: An Accessibility Approach. Eur. Plan. Stud. 2008, 16, 277–301. [Google Scholar] [CrossRef]
  16. Rosik, P.; Stępniak, M. Monitoring of Changes in Road Potential Accessibility at Municipality Level in Poland, 1995–2015. Geogr. Pol. 2015, 88, 607–620. [Google Scholar] [CrossRef]
  17. Ortega, E.; López, E.; Monzón, A. Territorial Cohesion Impacts of High-Speed Rail at Different Planning Levels. J. Transp. Geogr. 2012, 24, 130–141. [Google Scholar] [CrossRef]
  18. Spiekermann, K.; Wegener, M.; Květoň, V.; Marada, M.; Schürmann, C.; Biosca, O.; Ulied Segui, A.; Antikainen, H.; Kotavaara, O.; Rusanen, J.; et al. Transport Accessibility at Regional/Local Scale and Patterns in Europe. In TRACC Scientific Report; ESPON & Spiekermann & Wegener, Urban and Regional Research: Luxembourg, Belgium, 2015. [Google Scholar]
  19. Spiekermann, K.; Neubauer, J. European Accessibility and Peripherality: Concepts, Models and Indicators; Nordregio: Stockholm, Sweden, 2002; Volume 9, pp. 1–43. [Google Scholar]
  20. Gould, P.R. Spatial Diffusion, Resource Paper No. 4; Association of American Geographers: Washington, DC, USA, 1969; pp. 1–80. [Google Scholar]
  21. Carpentieri, G.; Guida, C.; Masoumi, H.E. Multimodal Accessibility to Primary Health Services for the Elderly: A Case Study of Naples, Italy. Sustainability 2020, 12, 781. [Google Scholar] [CrossRef]
  22. Liu, L.; Yu, H.; Zhao, J.; Wu, H.; Peng, Z.; Wang, R. Multiscale Effects of Multimodal Public Facilities Accessibility on Housing Prices Based on MGWR: A Case Study of Wuhan, China. ISPRS Int. J. Geo-Inf. 2022, 11, 57. [Google Scholar] [CrossRef]
  23. Langford, M.; Price, A.; Higgs, G. Combining Temporal and Multi-Modal Approaches to Better Measure Accessibility to Banking Services. ISPRS Int. J. Geo-Inf. 2022, 11, 350. [Google Scholar] [CrossRef]
  24. Geurs, K.T.; van Wee, B. Accessibility Evaluation of Land-Use and Transport Strategies: Review and Research Directions. J. Transp. Geogr. 2004, 12, 127–140. [Google Scholar] [CrossRef]
  25. Bruinsma, F.; Rietveld, P. The Accessibility of European Cities: Theoretical Framework and Comparison of Approaches. Environ. Plan. A Econ. Sp. 1998, 30, 499–521. [Google Scholar] [CrossRef]
  26. Rosik, P.; Stepniak, M.; Komornicki, T. The Decade of the Big Push to Roads in Poland: Impact on Improvement in Accessibility and Territorial Cohesion from a Policy Perspective. Transp. Policy 2015, 37, 134–146. [Google Scholar] [CrossRef]
  27. Beria, P.; Debernardi, A.; Ferrara, E. Measuring the Long-Distance Accessibility of Italian Cities. J. Transp. Geogr. 2017, 62, 66–79. [Google Scholar] [CrossRef]
  28. Stępniak, M.; Jacobs-Crisioni, C. Reducing the Uncertainty Induced by Spatial Aggregation in Accessibility and Spatial Interaction Applications. J. Transp. Geogr. 2017, 61, 17–29. [Google Scholar] [CrossRef] [PubMed]
  29. Reggiani, A.; Bucci, P.; Russo, G.; Haas, A.; Nijkamp, P. Regional Labour Markets and Job Accessibility in City Network Systems in Germany. J. Transp. Geogr. 2011, 19, 528–536. [Google Scholar] [CrossRef]
  30. Kotavaara, O.; Antikainen, H.; Rusanen, J. Population Change and Accessibility by Road and Rail Networks: GIS and Statistical Approach to Finland 1970–2007. J. Transp. Geogr. 2011, 19, 926–935. [Google Scholar] [CrossRef]
  31. Sellner, R.; Nagl, P. Air Accessibility and Growth—The Economic Effects of a Capacity Expansion at Vienna International Airport. J. Air Transp. Manag. 2010, 16, 325–329. [Google Scholar] [CrossRef]
  32. Dahlgren, A. A Proximity Analysis Application for Large Source Datasets; NRDA: Östersund, Sweden, 2005.
  33. Nam, K.; Win, E. Competitiveness between Road and Inland Water Transport: The Case of Myanmar. Transp. Probl. 2014, 9, 49–61. [Google Scholar]
  34. Button, K.; Chen, Z.; Neiva, R. Chapter 9: Industrial Accessibility and the Efficiency of the US Freight Railroads. In Accessibility, Equity and Efficiency; Edward Elgar Publishing: Cheltenham, UK, 2016; pp. 167–190. [Google Scholar]
  35. Rosik, P.; Komornicki, T.; Stępniak, M.; Śleszyński, P.; Goliszek, S.; Pomianowski, W.; Kowalczyk, K. Evaluation of Accessibility Changes in Poland Using the MAI Indicator. Geogr. Policy 2017, 90, 361–368. [Google Scholar]
  36. Schürmann, C.; Talaat, A. Towards a European Peripherality Index; IRPUD: Dortmund, Germany, 2000. [Google Scholar]
  37. Krygsman, S.; Dijst, M.; Arentze, T. Multimodal Public Transport: An Analysis of Travel Time Elements and the Interconnectivity Ratio. Transp. Policy 2004, 11, 265–275. [Google Scholar] [CrossRef]
  38. Stepniak, M.; Rosik, P. Accessibility Improvement, Territorial Cohesion and Spillovers: A Multidimensional Evaluation of Two Motorway Sections in Poland. J. Transp. Geogr. 2013, 31, 154–163. [Google Scholar] [CrossRef]
  39. Stępniak, M.; Rosik, P. From Improvements in Accessibility to the Impact on Territorial Cohesion: The Spatial Approach. J. Transp. Land Use 2015, 9, 1–13. [Google Scholar] [CrossRef]
  40. Shen, J.; Cheng, J.; Huang, W.; Zeng, F. An Exploration of Spatial and Social Inequalities of Urban Sports Facilities in Nanning City, China. Sustainability 2020, 12, 4353. [Google Scholar] [CrossRef]
  41. Brussel, M.; Zuidgeest, M.; Pfeffer, K.; Van Maarseveen, M. Access or Accessibility? A Critique of the Urban Transport SDG Indicator. ISPRS Int. J. Geo-Inf. 2019, 8, 67. [Google Scholar] [CrossRef]
  42. Rosik, P.; Stępniak, M.; Wiśniewski, R. Delineation of Health Care Deserts Using Accessibility Measures: The Case of Poland. Eur. Plan. Stud. 2021, 29, 1151–1173. [Google Scholar] [CrossRef]
  43. Rosik, P.; Puławska-Obiedowska, S.; Goliszek, S. Public Transport Accessibility to Upper Secondary Schools Measured by the Potential Quotient: The Case of Kraków. Morav. Geogr. Rep. 2021, 29, 15–26. [Google Scholar] [CrossRef]
  44. Stępniak, M.; Rosik, P. The Role of Transport and Population Components in Change in Accessibility: The Influence of the Distance Decay Parameter. Netw. Spat. Econ. 2018, 18, 291–312. [Google Scholar] [CrossRef]
  45. Rosik, P.; Pomianowski, W.; Komornicki, T.; Goliszek, S.; Szejgiec-Kolenda, B.; Duma, P. Regional Dispersion of Potential Accessibility Quotient at the Intra-European and Intranational Level. Core-Periphery Pattern, Discontinuity Belts and Distance Decay Tornado Effect. J. Transp. Geogr. 2020, 82, 102554. [Google Scholar] [CrossRef]
  46. Rosik, P.; Komornicki, T.; Goliszek, S.; Duma, P. Improvement of Accessibility in Eastern Europe Due to Implementation of Road Projects in the Via Carpatia Corridor. Mitteilungen Österr. Geogr. Ges. 2018, 160, 177–196. [Google Scholar] [CrossRef]
  47. Śleszyński, P. Expected Traffic Speed in Poland Using Corine Land Cover, SRTM-3 and Detailed Population Places Data. J. Maps 2015, 11, 245–254. [Google Scholar] [CrossRef]
  48. Móscicka, A.; Pokonieczny, K.; Wilbik, A.; Wabínski, J. Transport Accessibility of Warsaw: A Case Study. Sustainability 2019, 11, 5536. [Google Scholar] [CrossRef]
  49. Christodoulou, A.; Christidis, P. Measuring Cross-Border Road Accessibility in the European Union. Sustainability 2019, 11, 4000. [Google Scholar] [CrossRef]
  50. Rosik, P.; Komornicki, T.; Goliszek, S.; Duma, P.; Szejgiec-Kolenda, B. Changes in Structure and Spatial Distribution of Heavy Goods Vehicles Traffic in Poland in 2005–2015, with Particular Emphasis on Border Traffic. In Transport Development Challenges in the 21st Century; Suchanek, M., Ed.; Springer International Publishing: Cham, Switzerland, 2021; pp. 23–36. [Google Scholar]
  51. Rokicki, B.; Stępniak, M. Major Transport Infrastructure Investment and Regional Economic Development—An Accessibility-Based Approach. J. Transp. Geogr. 2018, 72, 36–49. [Google Scholar] [CrossRef]
  52. Wang, W.; Wu, Y. Is Uncertainty Always Bad for the Performance of Transportation Systems? Commun. Transp. Res. 2021, 1, 100021. [Google Scholar] [CrossRef]
Figure 1. Potential accessibility at the end of the EU programming period (2015). Multimodal comparison.
Sustainability 14 10044 g001
Figure 2. Potential accessibility: changes in 2007–2015. Multimodal comparison.
Sustainability 14 10044 g002
Figure 3. Trajectories of the mean centre of population and potential accessibility distribution, for the period 2004–2023.
Sustainability 14 10044 g003
Figure 4. Potential accessibility dispersion (PAD) during the three EU programming periods 2004–2023. Multimodal comparison.
Sustainability 14 10044 g004
Table 1. Transport type and mode, land use data and travel times.
Transport TypeTransport ModeLand Use Data (“Masses” in Accessibility Model)Source of Travel Times
Passenger transportRoadPopulationIGSO PAS speed model
RailwayPopulationMaximum technical speeds for passenger trains (data from PKP PLK S.A.)
AirAirport capacityIGSO PAS speed model—access to the airports
Freight transportRoadPopulation and GDPIGSO PAS HGV speed model
RailwayPopulation and GDPMaximum technical speeds for freight trains (data from PKP PLK S.A.)
Water inlandClass of waterwayIGSO PAS HGV speed model—access to the waterways
Table 2. Results of the analysis of the level and dispersion of accessibility for four modes broken down into passenger and freight transport in the period 2004–2023.
TypeModeLevel (Acc) and Dispersion (PAD)Calculation for the End of the YearCalculation of Change
2007–2015 Programming Period 2007–2015 (One EU Programming Period)2004–2023 (Three EU Programming Periods)
2004200620082010201220152023 (Forecast)Change (%) Change (abs)Change (%) Change (abs)
TravelRoadAcc29.0730.4930.8731.6334.1135.9040.2818%5.4239%11.21
PAD0.3760.3890.3840.3830.3900.3860.384–0.91%0.002.06%0.01
RailAcc30.0929.4229.9729.6931.4135.2044.7020%5.7849%14.61
PAD0.4300.4380.4370.4320.4260.4310.407–1.68%–0.01–5.24%–0.02
AirAcc41.8771.0786.2987.89125.74197.15234.91177%126.08461%193.04
PAD0.6560.6700.7160.7110.5890.6320.633–5.66%–0.04–3.41%–0.02
FreightRoadAcc26.7728.5930.2431.3833.6135.8643.4925%7.2762%16.72
PAD0.3970.4050.4070.4070.4150.4150.4212.38%0.016.16%0.02
RailAcc22.9023.6925.1525.8127.3630.2345.8128%6.54100%22.90
PAD0.4520.4540.4710.4680.4720.4780.4595.23%0.021.53%0.01
Water inlandAcc18.1918.9719.8020.0720.8221.7232.3214%2.7478%14.14
PAD1.0341.0000.9830.9820.9580.9450.932–5.50%–0.05–9.89%–0.10
Publisher’s Note: MDPI stays neutral with regard to jurisdictional claims in published maps and institutional affiliations.

