
The Illustrative Understanding on the Informal Sector and Its Influence in Firm Productivity in Sub-Saharan Africa (SSA): Evidence from Cameroon


Abstract
:1. Introduction
2. Literature Review and Research Hypothesis
2.1. Theoretical Framework
2.2. Research Hypotheses
3. The Informal Sector and Its Determinativeness: An Overview
3.1. Overview of the Informal Sector
3.2. Informal Sector and Its Priority in Cameroon’s Economic System
3.3. The Results of COVID-19 on the Informal Sector in Cameroon
3.4. The Determinativeness of the Informal Sector in Cameroon
4. Methodology: Specification of the Technology
4.1. Data and Variable Description
4.1.1. Data Description
4.1.2. Variable Description
4.1.3. Statistical Description
5. Model Specification
5.1. The TFP Measurement in the Manufacturing Industry
5.2. General Specification of the Model
5.3. Specification of the Hicks–Moorsteen Index
6. Results and Discussion
6.1. TFP Results and Its Components in 2005–2014
6.2. Discussion
7. Conclusions
Author Contributions
Funding
Data Availability Statement
Acknowledgments
Conflicts of Interest
References
- La Porta, R.; Shleifer, A. Informality and Development. J. Econ. Perspect. 2014, 28, 109–126. [Google Scholar] [CrossRef] [Green Version]
- Philippine Statistics Authority. Economic Statistics, Informal Sector (Conceptual Definition). 2022. Available online: https://psa.gov.ph/content/informal-sector-conceptual-definition-1 (accessed on 19 June 2022).
- Calbreath, D. Hidden economy a hidden danger. The San Diego Union-Tribune. 4 March 2015. Available online: https://www.sandiegouniontribune.com (accessed on 19 June 2022).
- Mahadea, D.; Zogli, L.J. Constraints to growth in informal sector activities and formalization: A case study of Ghana slums. S. Afr. J. Entrep. Small Bus. Manag. 2018, 10, 1–9. Available online: https://hdl.handle.net/10520/EJC-1351835c02 (accessed on 19 June 2022).
- Informal Economy. Available online: https://en.wikipedia.org/wiki/Informal_economy (accessed on 1 July 2022).
- ILO. Statistical Definition of the Informal Sector-International Standards and National Pratices. 1993. Available online: https://www.stat.fi/isi99/proceedings/arkisto/varasto/huss0772.pdf (accessed on 4 September 2021).
- Jabbour, A.B.L.D.S.; Ndubisi, N.O.; Seles, B.M.R.P. Sustainable development in Asian manufacturing SMEs: Progress and directions. Int. J. Prod. Econ. 2019, 225, 107567. [Google Scholar] [CrossRef]
- Beck, T.; Demirgüç-Kunt, A.; Singer, D. Is Small Beautiful? Financial Structure, Size and Access to Finance. World Dev. 2013, 52, 19–33. [Google Scholar] [CrossRef] [Green Version]
- ILO. Informal Economy: More than 60 Percent of the World’s Employed Population Are in the Informal Economy. 2018. Available online: https://www.ilo.org/global/about-the-ilo/newsroom/news/WCMS_627189/lang--en/index.htm (accessed on 4 September 2021).
- IMF. Five Things to Know about the Informal Economy. 2021. Available online: https://www.imf.org/en/News/Articles/2021/07/28/na-072821-five-things-to-know-about-the-informal-economy (accessed on 4 September 2021).
- Haan, H.C. Training for Work in the Informal Micro-Enterprise Sector: Fresh Evidence from Sub-Sahara Africa|VOCEDplus, the International Tertiary Education and Research Database; Springer: Dordrecht, The Netherlands, 2006; Available online: https://www.voced.edu.au/content/ngv%3A40992# (accessed on 19 June 2022).
- Verick, S. The Impact of Globalization on the Informal Sector in Africa. 2008. Available online: https://www.researchgate.net/publication/255606611_The_Impact_of_Globalization_on_the_Informal_Sector_in_Africa (accessed on 19 June 2022).
- ILO. Decent Work and the Informal Economy: Abstracts of working papers. 2002. Available online: https://www.ilo.org/global/docs/WCMS_079073/lang--en/index.htm (accessed on 19 June 2022).
- CRTV. Cameroon: The Informal Sector Plays a Big Role in the Country’s Economic Growth—Cameroon Radio Television. 2021. Available online: https://www.crtv.cm/2021/01/cameroon-the-informal-sector-plays-a-big-role-in-the-countrys-economic-growth/ (accessed on 19 June 2022).
- WTO. Cameroon Overview: Development News, Research, Data|World Bank. 2022. Available online: https://www.worldbank.org/en/country/cameroon/overview#1 (accessed on 19 June 2022).
- Kiaga, A.; Leung, V. The Transition from the Informal to the Formal Economy in Africa. December 2020, pp. 1–55. Available online: https://www.ilo.org/wcmsp5/groups/public/---ed_emp/documents/publication/wcms_792078.pdf (accessed on 19 June 2022).
- EESI. CAMEROUN—Enquête sur l’Emploi et le Secteur Informel (2010), Deuxième Enquête. 2010. Available online: https://slmp-550-104.slc.westdc.net/~stat54/nada/index.php/catalog/1 (accessed on 19 June 2022).
- Textile. Cameroon Merges Sodecoton & Cicam to Boost Textiles—Fibre2Fashion. 2021. Available online: https://www.fibre2fashion.com/news/textile-news/cameroon-merges-sodecoton-cicam-to-boost-textiles-270892-newsdetails.htm (accessed on 19 June 2022).
- VCA4D. Capacity4dev|Connecting the Development Community. 2020. Available online: https://europa.eu/capacity4dev/value-chain-analysis-for-development-vca4d- (accessed on 19 June 2022).
- Rostow, W.W. The World Economy History. 1978. Available online: https://utpress.utexas.edu/books/roswor (accessed on 19 June 2022).
- WTO. African Cotton & Textile Value Chain A Contemporary Focus and Emerging Trends. 2020, pp. 1–23. Available online: https://www.wto.org/english/tratop_e/agric_e/dg_cons_30720_e/i6_gherzi_e.pdf (accessed on 19 June 2022).
- MINEPAT. Cadre de Gestion Environnementale et Sociale du Projet Compétitivité des Filières de Croissance (PCFC) Republique Du Cameroun Ministere De L’economie, De La Planification Et De L’amenagement Du Territoire Projet Competitivite Des Filieres De Croissance (P. 2010). Available online: https://vdocuments.mx/cadre-de-gestion-environnementale-et-sociale-2-cadre-de-gestion-environnementale.html?page=1 (accessed on 19 June 2022).
- WTO. Five Ways World Textile and Apparel Trade Is Changing—Just Style. 2020. Available online: https://www.just-style.com/analysis/five-ways-world-textile-and-apparel-trade-is-changing/ (accessed on 19 June 2022).
- WTO. Reports World Textiles and Apparel Trade in 2020 follow Articles by Topics. FASH455 Global Apparel & Textile Trade and Sourcing. 2021. Available online: https://shenglufashion.com/2021/08/04/wto-reports-world-textiles-and-apparel-trade-in-2020/ (accessed on 19 June 2022).
- Textile Infomedia. Global Textile Business Industry, Worldwide Textile Industry Trade Data. 2022. Available online: https://www.textileinfomedia.com/global-textile-listing (accessed on 19 June 2022).
- Wadud, I.M. Sources of productivity growth in australian textile and clothing firms. Aust. Econ. Pap. 2007, 46, 254–281. [Google Scholar] [CrossRef]
- Kong, X.; Marks, R.E.; Wan, G.H. Technical Efficiency, Technological Change and Total Factor Productivity Growth in Chinese State-Owned Enterprises in the Early 1990s. Asian Econ. J. 1999, 13, 267–282. [Google Scholar] [CrossRef]
- Taymaz, E.; Saatci, G. Technical Change and Efficiency in Turkish Manufacturing Industries. J. Prod. Anal. 1997, 8, 461–475. [Google Scholar] [CrossRef]
- Mahadevan, R. A DEA Approach to Understanding the Productivity Growth of Malaysia’s Manufacturing Industries. Asia Pac. J. Manag. 2002, 19, 587–600. [Google Scholar] [CrossRef]
- Caves, D.W.; Christensen, L.R.; Diewert, W.E. The Economic Theory of Index Numbers and the Measurement of Input, Output, and Productivity. Econometrica 1982, 50, 1393–1414. [Google Scholar] [CrossRef]
- Hertiana, I.; Ida Ngatindriatun, F. Efficiency and Productivity of Textile Industries and Products in Central Java. J. Econ. Sustain. Dev. 2014, 5, 184–188. Available online: https://iiste.org/Journals/index.php/JEDS/article/view/16117/16448 (accessed on 19 June 2022).
- Kapelko, M.; Lansink, A.O. An international comparison of productivity change in the textile and clothing industry: A bootstrapped Malmquist index approach. Empir. Econ. 2015, 48, 1499–1523. [Google Scholar] [CrossRef]
- Tatjé, E.G.; Lovell, C. A note on the Malmquist productivity index. Econ. Lett. 1995, 47, 169–175. [Google Scholar] [CrossRef]
- Färe, R.; Grosskopf, S.; Norris, M.; Zhang, Z. Productivity Growth, Technical Progress, and Efficiency Change in Industrialized Countries on JSTOR. 1994. Available online: https://www.jstor.org/stable/2117971 (accessed on 19 June 2022).
- Ray, S.C.; Desli, E. Productivity Growth, Technical Progress, and Efficiency Change in Industrialized Countries: Comment on JSTOR. 1997. Available online: https://www.jstor.org/stable/2951340 (accessed on 19 June 2022).
- Bjurek, H. The Malmquist Total Factor Productivity Index. Scand. J. Econ. 1996, 98, 303. [Google Scholar] [CrossRef]
- Grifell-Tatjé, E.; Lovell, C.A.K. A generalized Malmquist productivity index. TOP 1999, 7, 81–101. [Google Scholar] [CrossRef]
- Färe, R.; Grosskopf, S.; Margaritis, D. Efficiency and Productivity: Malmquist and More. In The Measurement of Productive Efficiency and Productivity Change; Oxford University Press: Corvallis, OR, USA, 2008; pp. 522–622. [Google Scholar] [CrossRef]
- Nemoto, J.; Goto, M. Productivity, efficiency, scale economies and technical change: A new decomposition analysis of TFP applied to the Japanese prefectures. J. Jpn. Int. Econ. 2005, 19, 617–634. [Google Scholar] [CrossRef]
- Zaim, O. Measuring environmental performance of state manufacturing through changes in pollution intensities: A DEA framework. Ecol. Econ. 2004, 48, 37–47. [Google Scholar] [CrossRef] [Green Version]
- Walther, R. Vocational Training in the Informal Sector Sector. 2007. Available online: https://www.eib.org/attachments/general/events/luxembourg_18112008_formation_professionnelle_en.pdf (accessed on 19 June 2022).
- ILO. Third Edition Women and Men in the Informal Economy: A Statistical Picture. 2018. Available online: https://www.ilo.org/wcmsp5/groups/public/---dgreports/---dcomm/documents/publication/wcms_626831.pdf (accessed on 19 June 2022).
- IMF. Sub-Saharan Africa: Restarting the Growth Engine. Afr. Res. Bull. Econ. Financial Tech. Ser. 2017, 54, 21686–21687. [Google Scholar] [CrossRef]
- Schneider, F.G.; Buehn, A. Shadow Economies in Highly Developed OECD Countries: What Are the Driving Forces? 2012. Available online: https://papers.ssrn.com/sol3/papers.cfm?abstract_id=2161228 (accessed on 19 June 2022).
- OECD/ILO. Tackling Vulnerability in the Informal Economy; OECD: Paris, France, 2019. [Google Scholar] [CrossRef]
- Srinivas, H. The Informal Sector—Labour Market Issues in the Urban Informal Sector. 2020. Available online: https://www.gdrc.org/informal/doc-4labour.html (accessed on 19 June 2022).
- Global Development Research Centre (GDRC)—ILO. Distinguishing Characteristics of the Informal Sector. 2002. Available online: https://www.gdrc.org/informal/1-is-characteristics.html/ (accessed on 10 June 2020).
- CCIMA. The Chamber of Commerce, Industry, Mines and Crafts (CCIMA)—MINMIDT. 2006. Available online: https://www.minmidt.cm/en/the-chamber-of-commerce-industry-mines-and-crafts-ccima/ (accessed on 19 June 2022).
- Cling, J.-P.; Lagrée, S.; Razafindrakoto, M.; Roubaud, F. The Informal Economy in Developing Countries. Available online: https://www.wipo.int/edocs/mdocs/mdocs/en/wipo_ip_econ_ge_1_14/wipo_ip_econ_ge_1_14_1.pdf (accessed on 19 June 2022).
- Bodi, N.; Ghislain, F. Quels sont les effets des chocs liés à la pandémie COVID-19 au Cameroun? BEAC Occasional Paper; Banque des Etats de l’Afrique Centrale (BEAC). 2020. Available online: https://www.beac.int/wp-content/uploads/2020/08/Occasional-Paper-04-20_1.pdf (accessed on 20 June 2022).
- Ezimma, K.N.; Ifeanyi, E.O.; Clara, A.C. Informal Sector and Nigerian Economic Prospects: The Covid–19 Experience. Eur. J. Bus. Manag. Res. 2020, 5, 1–5. [Google Scholar] [CrossRef]
- NIS. Evaluation des Effets Socioéconomiques du COVID-19 sur la Sécurité Alimentaire et les moyens de Subsistance des réfugiés Centrafricains de la façade Est République du Cameroun, Septembre 2020. pp. 1–24. 2021. Available online: https://www.google.com.hk/url?sa=t&rct=j&q=&esrc=s&source=web&cd=&cad=rja&uact=8&ved=2ahUKEwiws57_6qf5AhUytlYBHUCkAW8QFnoECAIQAQ&url=https%3A%2F%2Fdata.unhcr.org%2Fen%2Fdocuments%2Fdownload%2F79465&usg=AOvVaw0kAptaJfdtv2BeGSTNGvy7 (accessed on 19 June 2022).
- Meramveliotakis, G.; Manioudis, M. Sustainable Development, COVID-19 and Small Business in Greece: Small Is Not Beautiful. Adm. Sci. 2021, 11, 90. [Google Scholar] [CrossRef]
- Kouete, V. Cameroon: 90% of the Labor Force Trapped in the Informal Sector—Private Sector & Development. 2020. Available online: https://blog.private-sector-and-development.com/2020/01/23/cameroon-90-of-the-labor-force-trapped-in-the-informal-sector/ (accessed on 19 June 2022).
- Afrika, J.-G.K.; Ajumbo, G. Informal cross border trade in Africa: Implications and policy recommendations. Africa Econ. Br. 2012, 3, 13. Available online: http://scholar.google.com/scholar?hl=en&btnG=Search&q=intitle:Informal+Cross+Border+Trade+in+Africa:+Implications+and+Policy+Recommendations#3 (accessed on 19 June 2022).
- RGE. Recensement Général des Entreprises du Cameroun (RGE 2009): Rapports Thématiques, Environnement des Affaires et Compétitivité, état de L’industrie Camerounaise, Profil de L’Entrepreneur Camerounais, Démographie des Entreprises du Cameroun; Institut National de la Statistique du Cameroun: Yaoundé, Cameroon, 2011. [Google Scholar]
- RGE. Cameroun—Recensement des Operateurs de la Filière Coton/Textile/Confection (2014)—Aperçu. 2014. Available online: http://nada.stat.cm/index.php/catalog/62/overview (accessed on 19 June 2022).
- EESI. Cameroun—Enquête Emploi Secteur Informel (2005), Enquête Emploi—Aperçu. 2005. Available online: http://nada.stat.cm/index.php/catalog/10/study-description (accessed on 19 June 2022).
- Bartelsman, E.J.; Doms, M. Understanding Productivity: Lessons from Longitudinal Microdata. J. Econ. Lit. 2000, 38, 569–594. [Google Scholar] [CrossRef] [Green Version]
- Dean, E.R.; Harper, M.J.; Sherwood, M.S. Productivity measurement with changing-weight indices of outputs and inputs. Ind. Product. Int. Comp. Meas. Issues 1976, 35, 183–215. Available online: http://www.oecd.org/sti/ind/1825894.pdf (accessed on 19 June 2022).
- Joshi, R.N.; Singh, S.P. Measuring production efficiency of readymade garment firms. J. Text. Appar. Technol. Manag. 2009, 6, 1–12. [Google Scholar]
- Bheda, R. Productivity in Indian apparel industry: Paradigmes and Paragons. J. Text. Appar. Technol. Manag. 2002, 2, 2–9. [Google Scholar]
- Hussmanns, R. Measuring the Informal Economy: From Employment in the Informal Sector to Informal Employment. 2004. Available online: https://www.ilo.org/wcmsp5/groups/public/---dgreports/---integration/documents/publication/wcms_079142.pdf (accessed on 4 September 2021).
- Bhandari, A.K.; Ray, S.C. Technical efficiency in the indian textiles industry: A non-parametric analysis of firm-level data. Bull. Econ. Res. 2012, 64, 109–124. [Google Scholar] [CrossRef] [Green Version]
- Kumbhakar, S.C.; Amundsveen, R.; Kvile, H.M.; Lien, G. Scale economies, technical change and efficiency in Norwegian electricity distribution, 1998–2010. J. Prod. Anal. 2015, 43, 295–305. [Google Scholar] [CrossRef]
- Hattori, T. Relative Performance of U.S. and Japanese Electricity Distribution: An Application of Stochastic Frontier Analysis. J. Prod. Anal. 2002, 18, 269–284. [Google Scholar] [CrossRef]
- O’Donnell, C.J. An Aggregate Quantity Price Framework for Measuring and Decomposing Productivity and Profitability Change. 2008, pp. 1–41. Available online: https://www.jstor.org/stable/43549951 (accessed on 19 June 2022).
- Jorgenson, D.W.; Griliches, Z. The Explanation of Productivity Change. Rev. Econ. Stud. 1967, 34, 249. [Google Scholar] [CrossRef]
- O’Donnell, C.J. An aggregate quantity framework for measuring and decomposing productivity change. J. Prod. Anal. 2012, 38, 255–272. [Google Scholar] [CrossRef]
- Hicks, J.R. The Measurement of Capital in Relation to the Measurement of Other Economic Aggregates. In The Theory of Capital; Palgrave Macmillan: London, UK, 1961; pp. 18–31. [Google Scholar] [CrossRef]
- Moorsteen, R.H. On Measuring Productive Potential and Relative Efficiency. Q. J. Econ. 1961, 75, 451. [Google Scholar] [CrossRef]
- Xian, Y.; Wang, K.; Wei, Y.-M.; Huang, Z. Would China’s power industry benefit from nationwide carbon emission permit trading? An optimization model-based ex post analysis on abatement cost savings. Appl. Energy 2019, 235, 978–986. [Google Scholar] [CrossRef] [Green Version]
- O’Donnell, C.J. Measuring and decomposing agricultural productivity and profitability change. Aust. J. Agric. Resour. Econ. 2010, 54, 527–560. [Google Scholar] [CrossRef] [Green Version]
- Margono, H.; Sharma, S.C. Efficiency and productivity analyses of Indonesian manufacturing industries. J. Asian Econ. 2006, 17, 979–995. [Google Scholar] [CrossRef] [Green Version]
- Goncharuk, A.G. Impact of political changes on industrial efficiency: A case of Ukraine. J. Econ. Stud. 2007, 34, 324–340. [Google Scholar] [CrossRef]
- MINEPAT. Stratégie Nationale de Développement 2020–2030 Pour la transformation structurelle et le développement inclusif, SND30|Centre de Documentation Numérique du Secteur Santé. 2020. Available online: http://cdnss.minsante.cm/?q=fr/content/strat%C3%A9gie-nationale-de-d%C3%A9veloppement-2020-2030-pour-la-transformation-structurelle-et-le (accessed on 19 June 2022).
- Abraham, R. Informal Employment and the Structure of Wages in India: A Review of Trends. Rev. Income Wealth 2019, 65, 102–122. [Google Scholar] [CrossRef]
- Ehode Elah Raoul. Informal Economy and Economic Growth in Cameroon. Int. J. Sci. Res. 2020, 10, 518–525. [Google Scholar] [CrossRef]
- Färe, R.; Grosskopf, S.; Lee, W.-F. Productivity and technical change: The case of Taiwan. Appl. Econ. 2001, 33, 1911–1925. [Google Scholar] [CrossRef]
- Van Biesebroeck, J. Firm Size Matters: Growth and Productivity Growth in African Manufacturing. Econ. Dev. Cult. Chang. 2005, 53, 545–583. [Google Scholar] [CrossRef]
- Jovanovic, B. Selection and the Evolution of Industry. Econometrica 1982, 50, 649. [Google Scholar] [CrossRef]
- ILO. Organizing in the Informal Economy: A Case Study of the Clothing Industry in South Africa. 2003. Available online: https://www.ilo.org/wcmsp5/groups/public/---ed_emp/---emp_ent/---ifp_seed/documents/publication/wcms_117699.pdf (accessed on 19 June 2022).


| Country | Measure of Informal Sector Employment | Measure of Employment in Companies | Measure of Employment in Administration |
|---|---|---|---|
| South Africa | 35.3% (all sector) | 69% | - |
| Côte d’Ivoire | 92.8% (all sector) | 6% | 5.6% |
| Benin | 95% (all sector) | 5% (administration included) | - |
| Cameroon | 90.2% (all sector) | 4.7% | 4.9% |
| Ethiopia | 90.8 % (all Sector) | 6.2% | 2.6% |
| Senegal | 90% (all sector) | 16.8% | 5.7% |
| Informal Sector | Formal Sector |
|---|---|
| Entry demands are minuscule/easy | Difficult entry demands |
| Rely on local/indigenous | Frequently relies on foreign resources |
| Ownership family companies | Ownership is through a corporation |
| Business operation is a small scale | Company operation is a large scale |
| Operation is labor intensive, using locally adapted technologies | Operation is capital intensive depending on imported technologies |
| Unskilled employees acquired outside the formal school system | Formally acquired skills, often the use of expatriate services |
| Generally competitive and unregulated markets | Markets are protected by the use of high tariffs |
| Variables | ||
|---|---|---|
| Textile firms | Inputs (annual) | Outputs (annual) |
| -Cost of the intermediate inputs (water, gasoil, transport, energy in megawatt, and cost of raw material). | -Annual production (CFAF) | |
| -Number of workers | -Annual turnover (CFAF) | |
| Clothing firms | -Number of sewing machines | -Annual production (CFAF) |
| -Number of working hours by tailor -Cost of the intermediate inputs | -Annual turnover (CFAF) |
| 2004 Mean St Deviation | 2005 Mean St Deviation | 2009 Mean St Deviation | 2010 Mean St Deviation | |
|---|---|---|---|---|
| Textile Inputs (annual) | ||||
| -Cost of the intermediate inputs (water, gasoil, energy cost, and raw material costs) | 252.7493 441.1844 | 288.7695 211.7742 | 1826.5807 4120.1120 | 1978.8709 5291.2982 |
| -Number of workers | 1.1569 0.4635 | 1.198 0.3931 | 1.441 0.2893 | 1.391 0.5698 |
| Outputs (annual) | ||||
| -Annual production (in CFAF) | 513.791 818.2021 | 1252.1421 1073.2140 | 3225.1750 963.234 | 4134.2485 774.7500 |
| -Annual turnover (in CFAF) | 522.1895 827.9051 | 980.2873 1470.7231 | 3965.2418 361.7891 | 4829.3214 1236.6736 |
| Clothing Inputs (annual) | ||||
| -Number of annual working time (per worker) | 1721.2 169.8 | 1616.9 202.6 | 2111.2 223.6 | 1851.4 135.3 |
| -Cost of the intermediate inputs | 418.5954 975.3989 | 724.2012 520.3230 | 1273.4120 210.3210 | 1124.7593 2006.7050 |
| -Number of sewing machines | 1.59 1.203 | 1.66 1.175 | 1.96 1.3442 | 2.09 1.470 |
| Outputs (annual) | ||||
| -Annual production (in CFAF) | 988.2303 1720.6538 | 1096.3251 18,341.2544 | 1789.2341 2075.2314 | 1997.4154 3020.1855 |
| -Annual turnover (in CFAF) | 1010.1126 | 1855.7892 | 2161.4769 | 2046.9400 |
| 1869.6293 | 2223.1420 | 4454.3317 | 3437.1873 |
| Very Small Enterprises (VSE) | ||||||
| 2008–2009 Mean St Deviation | 2009–2010 Mean St Deviation | 2010–2011 Mean St Deviation | 2011–2012 Mean St Deviation | 2012–2013 Mean St Deviation | 2013–2014 Mean St Deviation | |
| Inputs (annual) | ||||||
| -Cost of the intermediate inputs (water, gasoil, transport, energy cost, and raw material) | 924.2 1666.33 | 905.20 1455.256 | 1075.1 2011.275 | 1124.21 2140.21 | 2088.141 1175.5 | 1175.5 2214.247 |
| -Number of Workers | 2.028 1.12 | 2.085 1.33 | 2.22 1.035 | 3.088 1.111 | 2140.21 830.2 | 3.055 1.481 |
| Outputs (annual) | ||||||
| -Production annual (in CFAF) | 2330.2 | 1987.3 | 1986.28 | 2895.2 | 1896.5 | 2140.3 |
| 2926.3 | 2142.45 | 2075.325 | 1731.24 | 2210 | 1974.211 | |
| -Annual turnover (in CFAF) | 974.3 | 1015.3 | 41.214 | 1054.6 | 654.4 | 830.2 |
| 1732.214 | 724.321 | 957.279 | 9023.781 | 079.738 | 338.154 | |
| Small Enterprises (SE) | ||||||
| 2008–2009 Mean St Deviation | 2009–2010 Mean St Deviation | 2010–2011 Mean St Deviation | 2011–2012 Mean St Deviation | 2012–2013 Mean St Deviation | 2013–2014 Mean St Deviation | |
| Inputs (annual) | ||||||
| -Cost of the intermediate inputs (water, gasoil, transport, energy cost, and raw material) | 3322.7 9129.991 | 3623.9 5511.121 | 3434.23 4723.311 | 3517 6623.021 | 3014.2 8011.247 | 3242.2 5012.32 |
| -Number of workers | 58.83 1.105 | 10.33 1.123 | 19.17 1.19 | 8.013 1.13 | 319.25 1.027 | 11.14 1.065 |
| Outputs (annual) | ||||||
| -Production annual (in CFAF) | 7586.3 | 6175.23 | 6021.185 | 6583 | 6222.2 | 6175 |
| 17,285.23 | 19,832.9 | 19,471.21 | 20,584.2 | 17,624.81 | 17,212.4 | |
| -Annual turnover (in CFAF) | 6811.2 | 6053.32 | 5824.654 | 6346.7 | 5830.3 | 5113.2 |
| 713.321 | 882.4211 | 1012.441 | 1222.32 | 1214.214 | 902.321 | |
| Medium Enterprises (ME) | ||||||
| 2008–2009 Mean St Deviation | 2009–2010 Mean St Deviation | 2010–2011 Mean St Deviation | 2011–2012 Mean St Deviation | 2012–2013 Mean St Deviation | 2013–2014 Mean St Deviation | |
| Inputs (annual) | ||||||
| -Cost of the intermediate inputs (water, gasoil, transport, energy cost, and raw material) | 13,087.2 22,101.2 | 17,435.2 17,446.71 | 1589.2 20,161.33 | 16,327.2 30,112.62 | 19,568.3 45,616.91 | 18,324.2 40,222.5 |
| -Number of workers | 20.22 6.024 | 18.11 5.084 | 19.12 70.23 | 22.14 60.041 | 23.15 8.015 | 24.81 7.032 |
| Outputs (annual) | ||||||
| -Production annual (in CFAF) | 71,532.4 | 90,229.2 | 61,558.7 | 61,848.6 | 51,935.3 | 81,532.4 |
| 12,598.35 | 21,579.12 | 21,579.12 | 28,640.6 | 21,343.24 | 18,414.2 | |
| -Annual turnover (in CFAF) | 69,054.1 | 81,083.2 | 58,294.3 | 59,126.44 | 48,323.3 | 73,548.2 |
| 62,458.32 | 13,874.33 | 17,217.86 | 551,461.6 | 43,145.23 | 40,175.7 | |
| Period | ΔTFP | ΔTECH | ΔOTE | OSME | |
|---|---|---|---|---|---|
| Very Small Enterprises (VSE) | 2008–2009 | 0.6534 | 0.7629 | 0.8063. | 1.000 |
| 2009–2010 | 0.6667 | 0.7182 | 0.7146 | 1.291 | |
| 2010–2011 | 0.7664 | 0.6518 | 0.7583. | 1.550 | |
| 2011–2012 | 0.8430 | 0.6224 | 0.8158 | 1.660 | |
| 2012–2013 | 0.7424 | 0.6891 | 0.7659 | 1.406 | |
| 2013–2014 | 0.7690 | 0.7224 | 0.7826. | 1.361 | |
| Mean | 0.7401 | 0.6944 | 0.7738 | 1.371 | |
| Small Enterprises (SE) | 2008–2009 | 0.6906 | 0.6270 | 0.7547 | 1.4622 |
| 2009–2010 | 0.5789 | 0.7309 | 0.8682 | 0.9139 | |
| 2010–2011 | 0.6818 | 0.7997 | 0.7793 | 1.0941 | |
| 2011–2012 | 0.6900 | 0.7088 | 0.8228 | 1.1832 | |
| 2012–2013 | 0.6379 | 0.6027 | 0.7821 | 1.3534 | |
| 2013–2014 | 0.7311 | 0.6585 | 0.7067 | 1.5711 | |
| Mean | 0.6655 | 0.6836 | 0.7839 | 1.2395 | |
| Medium Enterprises (ME) | 2008–2009 | 0.7921 | 0.6601 | 0.8723 | 1.1516 |
| 2009–2010 | 0.7500 | 0.7107 | 0.8173 | 1.2911 | |
| 2010–2011 | 0.8314 | 0.6817 | 0.7328 | 1.6642 | |
| 2011–2012 | 0.8097 | 0.7665 | 0.7172 | 1.4937 | |
| 2012–2013 | 0.7072 | 0.7316 | 0.6928 | 1.3952 | |
| 2013–2014 | 0.8522 | 0.7989 | 0.7155 | 1.4908 | |
| Mean | 0.7888 | 0.7233 | 0.7560 | 1.4048 | |
| All textiles firms | Mean | 0.7296 | 0.7002 | 0.7711 | 1.3360 |
| Period | ΔTFP | ΔTECH | ΔOTE | OSME | |
|---|---|---|---|---|---|
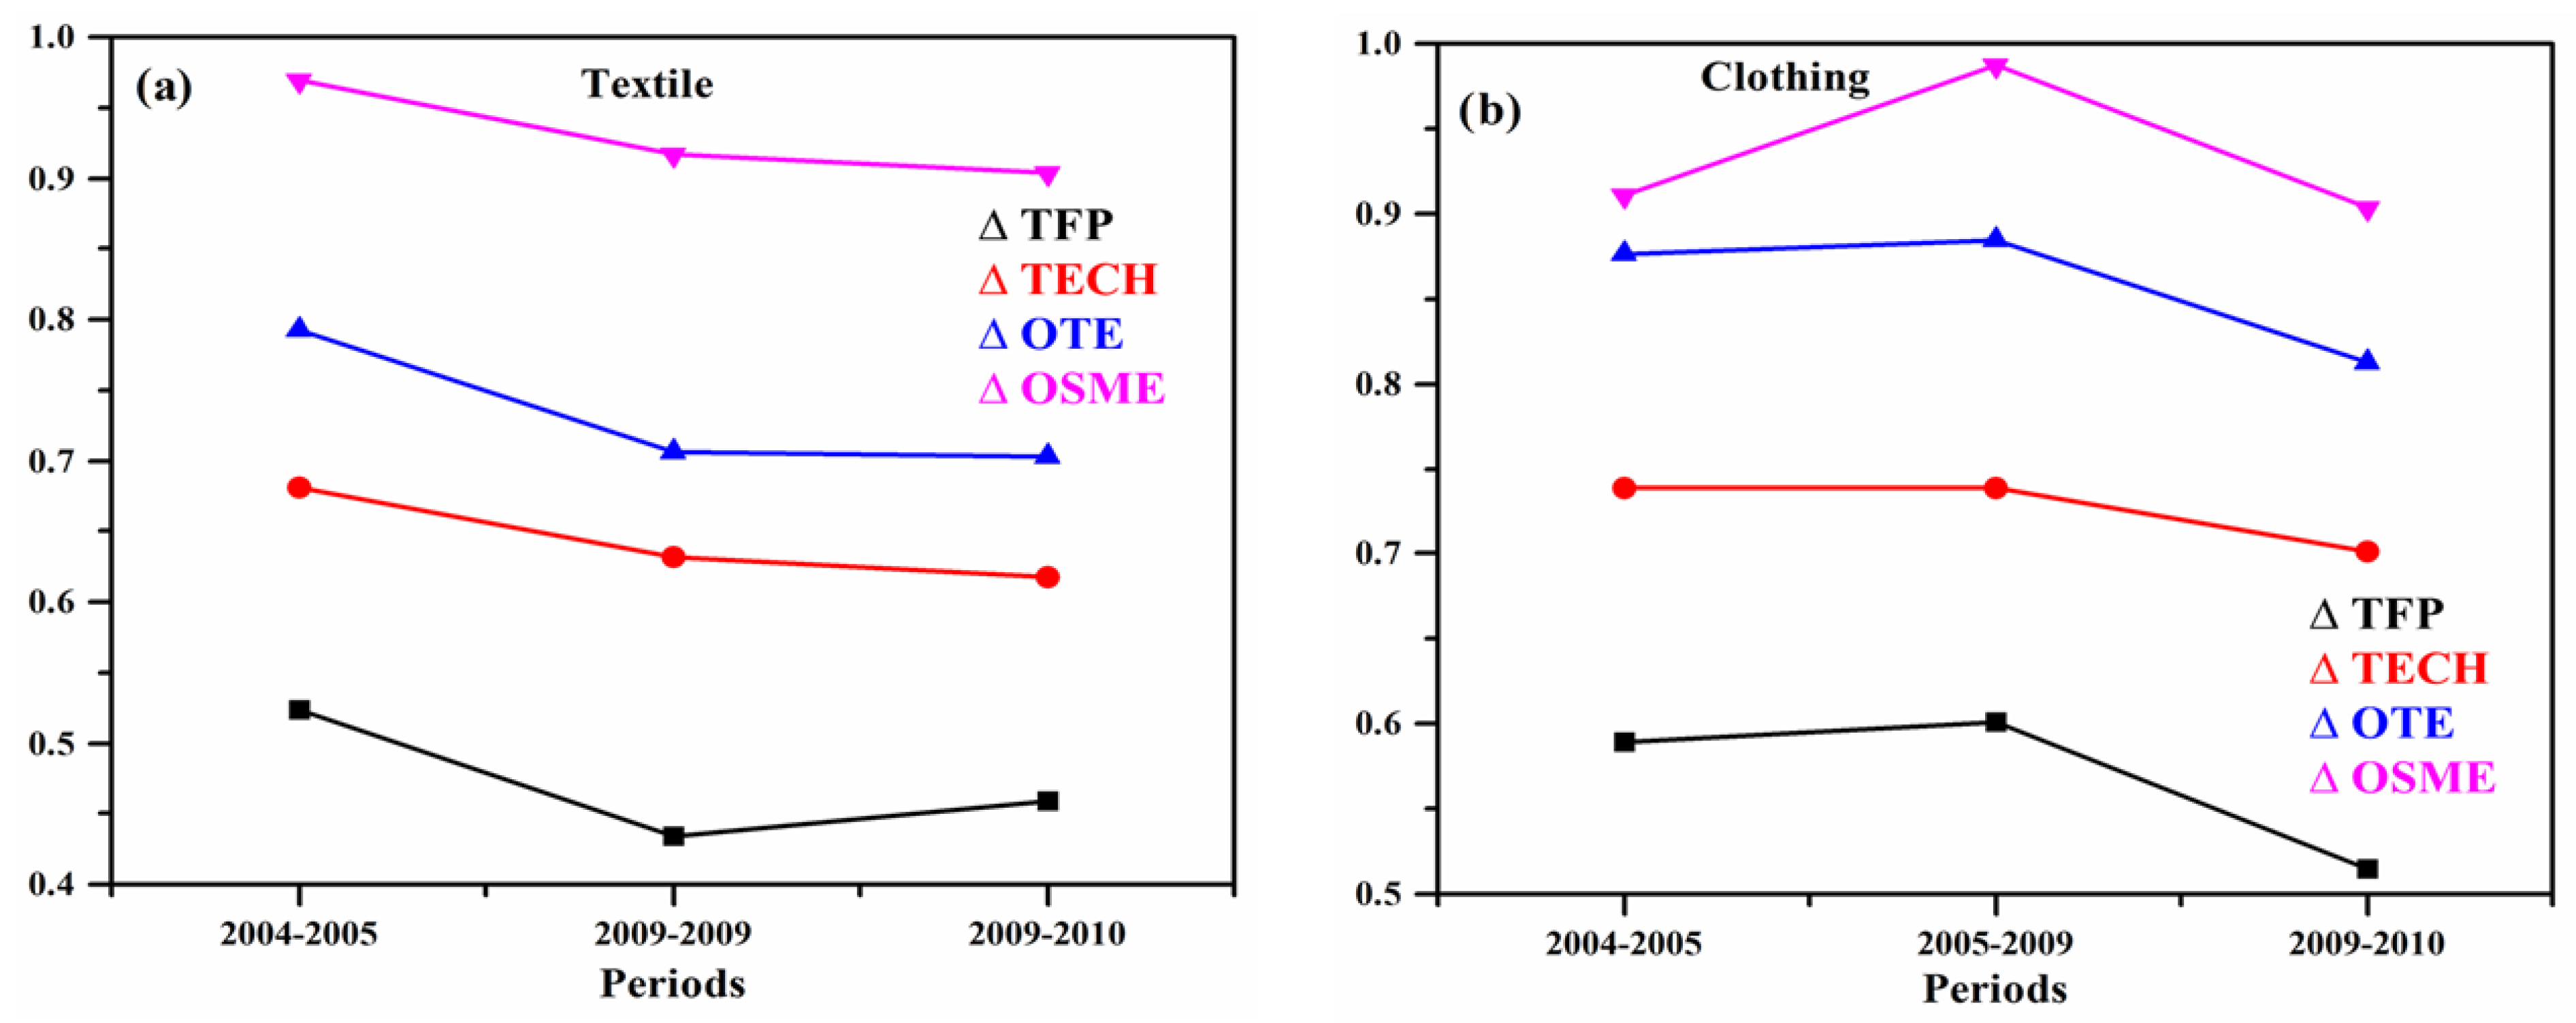
| Textile | 2004–2005 | 0.5234 | 0.6813 | 0.7925 | 0.9695 |
| 2005–2009 | 0.4338 | 0.6322 | 0.7063 | 0.9717 | |
| 2009–2010 | 0.4592 | 0.6322 | 0.7029 | 0.9034 | |
| Mean | 0.4706 | 0.6432 | 0.7722 | 0.9476 | |
| Clothing | 2004–2005 | 0.5897 | 0.7388 | 0.8764 | 0.9109 |
| 2005–2009 | 0.6010 | 0.7688 | 0.8844 | 0.9873 | |
| 2009–2019 | 0.5145 | 0.7010 | 0.8125 | 0.9034 | |
| Mean | 0.5669 | 0.7090 | 0.8571 | 0.9331 |
Publisher’s Note: MDPI stays neutral with regard to jurisdictional claims in published maps and institutional affiliations. |
© 2022 by the authors. Licensee MDPI, Basel, Switzerland. This article is an open access article distributed under the terms and conditions of the Creative Commons Attribution (CC BY) license (https://creativecommons.org/licenses/by/4.0/).
Share and Cite
Elvis, N.T.; Cheng, H.; Providence, B.I. The Illustrative Understanding on the Informal Sector and Its Influence in Firm Productivity in Sub-Saharan Africa (SSA): Evidence from Cameroon. Sustainability 2022, 14, 9789. https://doi.org/10.3390/su14159789
Elvis NT, Cheng H, Providence BI. The Illustrative Understanding on the Informal Sector and Its Influence in Firm Productivity in Sub-Saharan Africa (SSA): Evidence from Cameroon. Sustainability. 2022; 14(15):9789. https://doi.org/10.3390/su14159789
Chicago/Turabian StyleElvis, Nguepi Tsafack, Hua Cheng, and Buregeya Ingabire Providence. 2022. "The Illustrative Understanding on the Informal Sector and Its Influence in Firm Productivity in Sub-Saharan Africa (SSA): Evidence from Cameroon" Sustainability 14, no. 15: 9789. https://doi.org/10.3390/su14159789
APA StyleElvis, N. T., Cheng, H., & Providence, B. I. (2022). The Illustrative Understanding on the Informal Sector and Its Influence in Firm Productivity in Sub-Saharan Africa (SSA): Evidence from Cameroon. Sustainability, 14(15), 9789. https://doi.org/10.3390/su14159789