Abstract
Desertification is defined as land degradation in arid, semiarid, and dry sub-humid regions, and it is caused primarily by human activities and climate change. The semiarid region of Northeast (NE) Brazil is a very large, populous region, and thus, it is hard to monitor the dynamics of its desertified areas; therefore, the present study aimed to develop a minimum set of biophysical indicators to qualify and monitor desertification in this region. This approach included sampling a pair of preserved forested areas and nearby degraded, non-forested areas which had no vegetation growth in the previous years. The study was developed in four stages: (a) pilot site selection; (b) quantification and analysis of soil and vegetation biophysical indicators; (c) biophysical indicator selection; and (d) elaboration of the minimum set of biophysical indicators and desertification levels. Of the analyzed 24 biophysical indicators, 11 were retained and subjected to factor analysis by its principal components. This yielded the minimum set of indicators used to estimate the desertification levels of the pilot sites, which consisted of four soil characteristics: Total Organic Carbon (TOC), cation exchange capacity, clay content, and magnesium content. Regressions were conducted using the SQI, and these indicators showed that the TOC had the highest coefficient of determination. In an exploratory analysis, high SQI (low desertification) showed a positive correlation with the normalized difference vegetation index (R = 0.70) and Aridity Index (R = 0.97). This methodological approach could form the basis of a dynamic monitoring system that is capable of supplying objective, quantitative, and easy to obtain information to decision-makers in NE Brazil and other dry ecosystems around the globe.
1. Introduction
The United Nations Convention to Combat Desertification (UNCCD) limits desertification to the dryland regions situated between the longitudinal parallel 30° N and 30° S [1], an area with various degrees of drought that represents approximately 47.2% of the continental area of the planet [2,3]. An estimated 42% of the world’s population dwells in this area, and 22% of the world’s food production occurs in these environments [4]; this shows the potential impact of desertification processes and climate change [5].
In Brazil, this desertification phenomenon is restricted to the Brazilian Semiarid Region (an area > 1 million km2 and 13% of the territory of Brazil). Knowledge of degradative processes and their severity are still lacking, and constant updates are needed [6,7,8,9,10]. The population that resides in the Brazilian semi-arid region—approximately 28 million inhabitants and a population density of up to 20 people km2—is highly dependent on native vegetation to survive; therefore, the potential loss of such vegetation could cause great social, economic, and environmental vulnerability [11,12]. This dependence leads to an increasing pressure on the region’s natural resources, consequently making it highly susceptible to desertification processes. Indeed, over the years, it has caused a reduction in arable area, low crop yields, and the silting of rivers and reservoirs, with severe damage caused to productivity, environmental integrity, and farmer profitability [7,13,14].
There are important aspects regarding land tenure, land use, and cover changes that put severe pressure on specific areas. These aspects create a mosaic on the landscape, as preserved and degraded areas are combined due to the fact that they both continue to be impacted by climatic variability and other changes [6,8,9,15]. In Brazil, semiarid, and indeed, anthropic disturbances, are at the core of this degradation process [11,12]. Such processes almost begin with the removal of native vegetation cover, and they favor erosion processes [7,8,15]. Once soil degradation reaches a certain level, its interaction with climate variability may contribute to a turning point that causes the ecosystem to reach the point of no return; this is when vegetation is no longer able to recover, even during the rainy season [8,16,17,18,19]. In these areas, the loss of productivity resulting from the degraded land may lead to an increase of anthropic pressure in the surrounding areas to provide subsistence to those local communities [8]. This negative feedback may lead to the degradation of an ever-increasing area. Although signs of degradation in these areas are evident, their organization in a system of quantitative indicators, which tracks the progress of the degradation process, is still incipient, and does not provide results that are consistent with empirical observations. This problem has led to our interest in investigating Brazilian semiarid land.
Conceptually, the UNCCD [1] defines desertification as a process concerning the degradation of land in arid, semiarid, and dry sub-humid areas, the causes of which can be multiple, and the consequences, which are also numerous, are interlinked in a retroactive way [10]. Given this interpretation, desertification has been understood by different scientific disciplines as a complex phenomenon, capable of encompassing structural factors such as social inequality, the concentration of land ownership, access to water, the means of production, biodiversity, and population density [10,20,21,22]. Furthermore, around the world, several studies have been developed using remote sensing to monitor and evaluate desertification processes [14,23,24,25,26,27,28]; however, as desertification processes involve many climatic and anthropic factors, only the spectral dynamics are provided by sensors, and thus, the results obtained have not been entirely sufficient to explain this complex phenomenon. Guo et al. [23,24], suggests that to reveal the spatio-temporal changes of the desertification process, which result from the interactive relationships between three or more factors in space–time, 3D or n-D techniques are necessary to fully comprehend the phenomenon of desertification.
Therefore, the entanglement of these factors in the conceptual scope of the UNCCD [1] has contributed to the unclear characterization of a desertified area [10,21,22,28,29,30,31]. This hinders the understanding and measurement of the problem, as well as the appropriate awareness of the different social actors involved in the formulation of public policies and decision-making.
Generally speaking, the majority of studies on desertification have focused on social indicators (Human Development Index—HDI, Poverty Index—GINI, education, housing), economic indicators (income per capita, gross domestic product per capita—GDP, poverty), and environmental situations (rainfall, aridity index, Normalized Difference Vegetation Index—NDVI), in order to characterize a merely physical phenomenon (i.e., land degradation). All these indicators are analyzed as parallel, linear, and causal movements, assuming that the mere incorporation of these indicators into the analysis would enable a better qualification of a bio-physical–chemical degradation process of the soil [10,20,22,28,29,30,31,32,33]. Indicators of social, economic, and environmental impact, although interrelated, are objects of distinct kinds, and the extent to which they frequently arise from indirect or outdated data sources accentuate the possibilities of analytical bias.
Those indicators associated with soil or land degradation have received little attention. The few existing studies that are strictly focused on soil indicators, have been carried out in small areas, thus hindering their extrapolation to surfaces of greater regional dimensions [32,33,34,35,36].
The combination of these aspects, as well as other difficulties, have resulted in the absence of systematic, methodologically robust, and conclusive regional assessments regarding the progression of desertification, which is particularly severe in the case of the Brazilian semiarid region. In this regard, there are still a lack of models, or systems of indicators, that characterize and identify areas that are undergoing the process of desertification or are effectively desertified [21,23,24,27,31,32,33,37,38,39].
Studies that assess soil quality indices (SQI) [38,39,40,41] can allow an understanding of, and can correlate, desertification levels; this is because the decline in soil quality has an inversely proportional relationship with the advance in soil degradation. Indeed, the reduction of the soil’s main ecosystem services contribute to the advancement of desertification [42,43,44,45]. Soil quality has been defined as the capacity of a specific kind of soil to function, within natural or managed ecosystem boundaries; to sustain plant and animal productivity; to maintain or enhance water and air quality; and to support human health and habitation [46,47]. Indicators of soil quality are those measurable soil properties and processes that have greatest sensitivity to changes in soil function and its ecosystem services [46,47]. These processes can be developed through the selection of indicators from the total data set and minimum data set; then, these indicators can be scored, interpreted, and subsequently integrated into the processes [39,41,42,43,45,46]. The latter can be achieved using three types of approaches: Additive, Weighted Additive, and Nemoro. An additional approach that can also be used is the Factorial Weighted Additive [45,46].
Therefore, the present study aims to identify the most appropriate methodological approach in order to propose a minimum set of biophysical indicators for soil and wood; this will enable the assessment and monitoring of the intensity of the process of desertification in the Brazilian semiarid region.
2. Materials and Methods
2.1. Contextualization and Characteristics of the Studied Area
The research was carried out in the semiarid region of Brazil, one of the largest areas that is susceptible to desertification and climate change in the world. The region is approximately 1,127,953 km2 divided into 1262 municipalities, all of them climatically characterized by a weak relationship between rainfall and evapotranspiration, which results in a water shortage for plants, animals, and humans [5]. About 28 million inhabitants live in this region, of which 10.6 million reside in rural areas and 17.3 million in urban areas [47]. Nevertheless, a significant portion of people who live in urban areas experience a rural lifestyle, since 90% of the municipalities in the semiarid region are classified as being small (less than 50,000 inhabitants). Moreover, the region boasts 1.8 million rural properties, and even though 1.0 million of those properties comprise less than 5.0 hectares of land, they are responsible for 31% of the region’s agricultural production [5,47]. Most of the Brazilian semiarid region suffers from low economic growth, a lack of basic infrastructure, and social indicators below the national and regional average. The GDP per capita (BRL 6520.00) is 67% lower than the Brazilian average, and the illiteracy rate fluctuates between 36% and 46% in approximately 46% of the municipalities. About 60% of these have low HDI (0.5 to 0.59) [47].
It is evident, therefore, that the semiarid region of NE Brazil is a very complex region that is characterized by extreme environmental and socioeconomic variability [10,17]. The tropical dry forest vegetation that is native to NE Brazil, also known as “Caatinga vegetation,” still covers approximately half of the semiarid region [48,49]. Most of the area that is currently covered by forests is occupied by secondary forest vegetation that is being regenerated after deforestation for fuelwood extraction, or the cultivation of crops and pastures [49,50]. As a result, this dynamic land-use shift created landscapes that are characterized by a mosaic of pastures, agricultural fields, and forest patches at different levels of succession, ranging from disturbed/open forests to dense forest fragments [17,50,51]. The environmental variability is also intensified due to the large diversity of soil types across the region, which respond differently to the natural and anthropic pressures that may lead to soil degradation and desertification [17].
2.2. Methodological Procedures
The research was carried out in four steps (Figure 1), as follows:
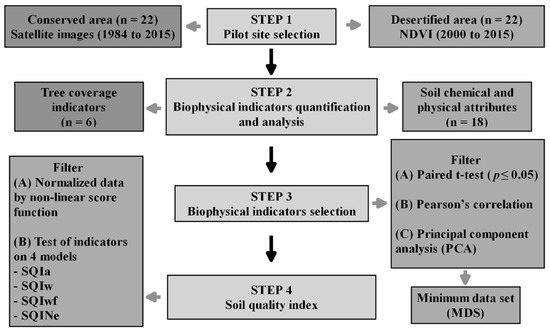
Figure 1.
Steps for measuring and determining the desertification level in the Brazilian semiarid region.
2.2.1. Step 1—Pilot Site Selection
In order to develop and propose a minimum set of biophysical indicators, we chose areas that were specific to, and representative of, the region. We also ensured that they were able to be studied as pilot sites in order to enable a better approximation of the phenomenon, which thus made it possible to approach it at a local level, while equally ensuring that we could also extrapolate it to the regional level. We selected 44 pilot sites (Figure 2), with 22 of them considered as well-preserved, and the remaining 22 showing clear signs of desertification; for instance, they presented no vegetation growth in previous years, even during the rainy season.
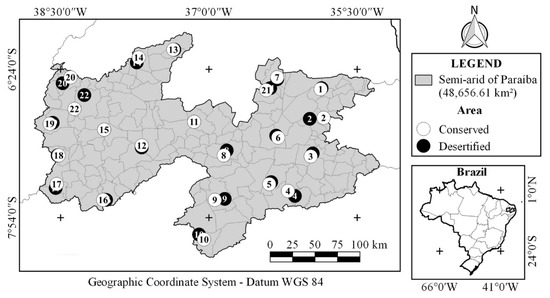
Figure 2.
Distribution and location of the 44 selected pilot sites (22 conserved and 22 desertified) in the semiarid region of the state of Paraíba, NE Brazil.
The desertification process reduces the richness of woody species and causes modifications to the woody structure of the Caatinga biome, thus reducing soil protection against pluviometric precipitation as well as incidences of sunlight [50]. In this context, desertified sites (DS) were selected based on the difficulty of restoring its dry forest vegetation cover (Figure 3) in previous years, and on how often they were subject to erosion processes. During this selection process, we analyzed the Normalized Difference Vegetation Index (NDVI) over a period of ≥5 years (1999/2000 to 2015) (Appendix A), which was obtained from the images of the Landsat 5 and Landsat 8 satellites, with the aid of the Google Earth Engine tool. The period during which the images were taken matched the period of higher rainfall and low incidence of clouds, and thus excluded water as a limiting factor for plant growth; therefore, the DS corresponded with areas of severely degraded soil that hindered vegetation growth and development [50].
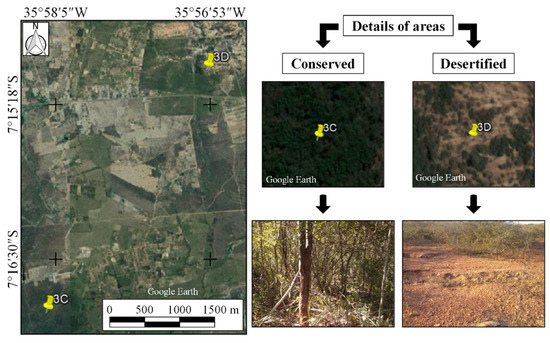
Figure 3.
Details of the selected desertified and conserved pilot sites in the semiarid region of NE Brazil. 3C = Conserved areas and 3D = desertified areas.
The conserved areas (CA) were selected after considering the absence of clear-cutting, which had not taken place since 1984, according to temporal images from the past 28 years, using the Landsat Annual Timelapse 1984–2012 (Figure 3). Subsequently, the selected areas were compared with updated images from Landsat 8 and confirmed in the field. After the selection of the areas, each pilot site was located using the Google Earth program and GPS navigation (60CSx Garmin, Garmin International, Inc., Olathe, KS, USA).
2.2.2. Step 2—Biophysical Indicators’ Quantification and Analysis
In each pilot site, we implemented a 100 m2 (10 m × 10 m) plot and evaluated the following parameters: number of woody species (NSp), woody plant density (PD), average canopy height (H-A), average circumference at the base (CB-A), average circumference at breast height (CBH-A); total absolute dominance (AD-T); basal area (BA); and volume of biomass (VOL). Then, we collected a composite soil sample (from five sub-samples) from the 0–20 cm layer for chemical and physical analysis, in accordance with the methods described by Embrapa [52]. The soil samples were previously packed into identified plastic bags, taken to the laboratory, air dried, sifted through a 2 mm sieve, and the active acidity (pH in water), potential acidity (H+Al), sodium content (Na+), aluminum content (Al3+), potassium content (K+), calcium content (Ca2+), magnesium content (Mg2+), total organic carbon (TOC) content, available P (Mehlich-1), sum of bases (SB), effective cation exchange capacity (CEC), potential CEC, base saturation (BS), exchangeable sodium percentage (ESP), particle size, and total porosity (TP) were analyzed. Undisturbed samples (132) were also collected to analyze the bulk density [52]. The total data set (24 variables of both areas) was subjected to the Kolmogorov–Smirnov and Bartlett test to check for normality and homoscedasticity (p > 0.05), respectively.
2.2.3. Step 3—Biophysical Indicator Selection
The selection was performed in three steps. First, we used the paired t-test to identify statistical differences between the desertified and conserved sites (p ≤ 0.05) for the biophysical indicators of soil and vegetation cover. In the second step, we used Pearson’s correlation to analyze the collinearity of indicators in soil and vegetation cover, which showed significant differences between groups (desertified and conserved). During the third step, indicators with significant correlation values ≤0.80 were used. During the final step, we retained and submitted the non-redundant indicators to account for analysis that was related to principal components analyses (PCA) [46,53]; this was carried out to reduce the number of independent indicators [11] and to form the minimum data set (MDS).
We selected the principal components (PC) with eigenvalues >1 [54] that explained more than 5% of the data variance [55]. When more than one variable was retained in a PCA, the coefficients of the multivariate correlation were analyzed to determine whether they could be retained when their coefficients were lower than 0.60 [42]; however, if the indicators were significantly correlated (r > 0.60) in a PCA, the variable with the largest sum of correlation was selected for the MDS [53].
2.2.4. Step 4—Selection of the Desertification Indicators
First, the indicators that were used for the MDS were normalized by the non-linear score function [56], as suggested by Nabiollahi et al. [46]; thus, we used the sigmoidal equation (Equation (1)):
where: NLS = non-linear score of the variable, between 0 and 1; a = maximum score, equal to 1; X = value of the variable; X0 = average value of the variable; b = slope assumed as −2.5 for functions of ‘more is better’, and +2.5 for ‘minus is better’ [57].
Subsequently, the standardized indicators for the MDS were integrated and tested using the four approaches in the determination of soil quality index (SQI):
First Model: Additive Soil Quality Index (SQIa), adapted from Andrews et al. [42], (Equation (2)).
Second Model: Weighted Additive Soil Quality Index (SQIw), adapted from Doran and Parkin [58], and Liu et al. [59], (Equation (3)).
Third Model: Weighted Factorial Additive Soil Quality Index (SQIwf), adapted from Biswas et al. [45], (Equation (4)).
Fourth Model: Nemoro Soil Quality Index (SQINe), adapted from Qin [51], (Equation (5)).
where: Ni = scores or record of the indicators; Wi = weight of each indicator; Saver = average of scores; Smin = minimum value of the scores for each indicator in the MDS; and n = number of indicators.
Two types of weights (Wi) were calculated. For Equation (2) (Weighted Additive), the weight was calculated from communality [58,59], and for Equation (3) (Weighted Factorial Additive), the weight was calculated from the factor analysis of principal components [45].
In terms of interpretation, in the present study, the Soil Quality Index (SQI) should be understood as being inversely proportional to the Desertification Index (ID) (i.e., the higher the SQI, the less degraded the area, and vice versa, according to Table 1) [46].

Table 1.
Scale and classes of soil quality index (SQI) levels, and their correspondence with conservation levels and degradation.
Next, we evaluated the performance of each method so that it could be given a place in the SQI; this was achieved via linear regression analyses between the indicators of the MDS and their respective SQI. Based on these analyses, we selected the SQI that had the highest correlation with the indicators of the MDS.
3. Results
3.1. Paired t-Test between Pilot Sites and Biophysical Indicators
Of the 24 biophysical indicators (soil and woody coverage) of the pilot sites, 17 showed significant differences (p = 0.05): eight chemical indicators (P, Na, Ca, Mg, H+Al, CEC, TOC, and ESP), three physical indicators (clay, BD, and TP), and six indicators of arboreal coverage (Nsp, PD, AD-T, H-A, BA, and VOL) (Table 2). There was no significant difference between the desertified and conserved areas in terms of pH, K, sum of bases, effective CEC, saturation of bases (SB), or silt and sand fractions.
Table 2.
Biophysical indicators of the soil and woody coverage of the pilot areas in semiarid NE Brazil.
3.2. Pearson Correlation between the Biophysical Indicators of the Pilot Sites
The TOC was the variable with the highest percentage (+70%) of positive and significant correlations between the 17 indicators, whereas Na+ and BD were the indicators with the highest number of negative correlations (Table 3). Among them, the well-correlated indicators (r > 0.6) were considered to be redundant, and only one of them was retained for the PCA [46,60]; therefore, 11 of the 17 indicators were retained, seven were related to chemical indicators (P, Ca2+, Mg2+, H+Al, CEC, TOC, ESP), two were related to physical indicators (Clay, BD), and two were related to the woody coverage (BA and VOL). These indicators were submitted for factor analysis and principal components analysis (PCA), and thus, they constitute a MDS.
Table 3.
Pearson correlation coefficients of the biophysical indicators of soil and woody coverage in the pilot sites.
3.3. Principal Component Analysis of the Minimum Set of Biophysical Attributes of the Pilot Sites
The principal components analysis (PCA), which occurred after the Varimax rotation, showed that approximately 68.84% of the variation found in this study was explained by the biophysical indicators of the soil and arboreal coverage; these were retained in the first three principal components (eigenvalues > 1 and variance > 5%; Table 4).
Table 4.
Principal components analysis of the significant biophysical indicators of soil and woody coverage in the pilot sites in semiarid NE Brazil.
In the vector projection and two-dimensional ordination (Figure 4), we can see the distinction between the pilot sites, regarding the level of conservation or degradation, and the indicators that most influenced this distinction, as well as the greater or lesser sensitivities of the 11 indicators analyzed. The diagram also makes it clear that the pilot sites formed four groups, which are distinguishable in a gradient showing either degradation or conservation.
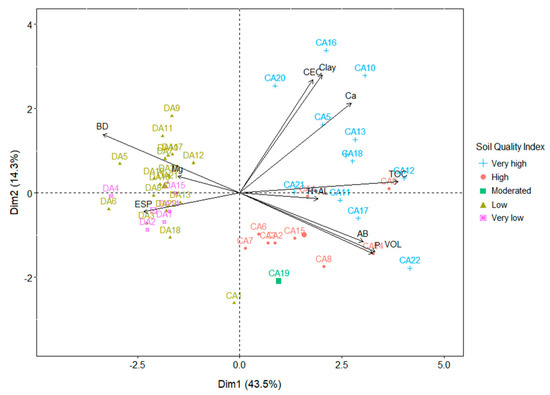
Figure 4.
Principal components analysis (PCA) of the biophysical indicators of soil and woody coverage in the pilot sites undergoing different levels of degradation or conservation. P: available phosphorus; TOC: Total organic carbon; CEC: cation exchange capacity; H+Al: hydrogen and exchangeable aluminum; Ca2+: exchangeable calcium; Mg2+: exchangeable magnesium; Na+: exchangeable sodium; ESP: exchangeable sodium percentage; Clay: percentage of clay; PD: Plant density; BA: basal area; and VOL: volume of biomass.
The indicators TOC, P, H+Al, Ca2+, BA, PD, VOL, clay, and CEC are more closely associated with areas of high and moderate conservation, whereas, conversely, the indicators BD, Mg2+, and ESP are related to areas of moderate, high, and very high degradation (low SQI), thus indicating the sensitivity of these indicators to the distinctions between the studied environments.
Therefore, the PC1 explained 43.5% of the total variation of the studied indicators and presented the highest correlation coefficients (>0.70); the TOC was the most heavily weighted indicator on PC1, as it had the highest absolute value (0.93) within the 10% of indicators that had an increased factor load, and it was positively correlated with the majority of the indicators (Table 4). PC2 and PC3 explained 14.3% and 11.02% of the total variation of the indicators studied, respectively. Clay and CEC were retained on PC2, since both had the same sum of correlations (Table 5). On the other hand, only Mg2+ was retained on PC3, due to its higher factor loading (Table 4).
Table 5.
Coefficients and sums of correlations of the minimum set of biophysical indicators of the pilot sites, heavily weighted, in principal components (PC), with multiple high factor loadings.
Consequently, the biophysical indicators (soil TOC, clay, CEC, and Mg2+) were retained for the MDS and used to estimate the SQI of the sites. To interpret the scores using the ‘more is better’, ‘less is better’, and ‘great is better’ approaches, the descriptive statistics of the MDS were observed (Table 6). We saw that the clay and Mg2+ did not reach the optimal values recommended by the literature, and thus, for the MDS, we adopted the ‘more is better’ approach, using the sigmoid curve.
Table 6.
Minimum, maximum, and average values of the minimum set of biophysical indicators retained on the minimum data set (MDS).
The weights of the minimum set of biophysical indicators that determine the SQI of the pilot sites using the Weighted Additive and Weighted Factorial Additive methods by Doran and Parkin [58], Liu et al. [59], and Biswas et al. [45], are summarized in Table 7.
Table 7.
Estimates of communality and the weights of the minimum set of biophysical indicators of the pilot sites.
Based on the results presented in Table 7, we determined the equations for the methods SQIw and SQIwf (Table 8), which enabled us to understand the respective desertification indices (DI) for all sites.
Table 8.
Final equations for the calculation of the soil quality index, based on the minimum set of biophysical indicators of the pilot sites.
In Figure 5, we can see that the weighted additive method (SQIwf), as proposed by Biswas et al. [45], was the most appropriate and comprehensive of the methods used for the calculation of the desertification or conservation indices of the pilot sites. The performances of the desertification indices, calculated using different methods, emerged in the following order: SQIwf > SQIw = SQIa > SQINe.
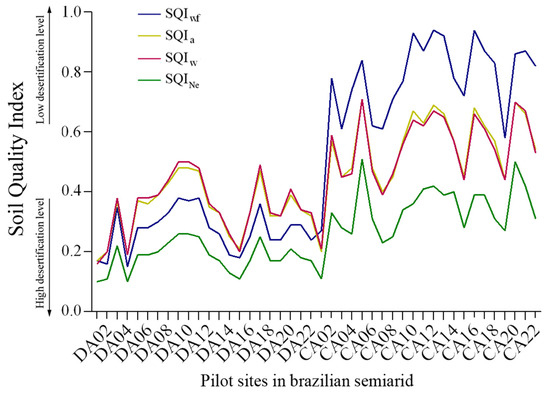
Figure 5.
Distribution of the desertification indices (DI) in different pilot sites. DA1 to DA22: desertification area; CA1 to CA22: conservation area; SQIwf: weighted factorial additive soil quality index; SQIa: additive soil quality index; SQIw: weighted additive soil quality index; SQINe: Nemoro soil quality index.
Using linear regression methods to ascertain the soil quality indices and the minimum set of biophysical indicators (Table 6), we observed that the Total Organic Carbon had the best coefficient of determination out of all SQI methods (SQIa, SQIW, SQIWf, and SQINe) (Table 9).
Table 9.
Relationship between biophysical indicators of a minimum data set and the method for the calculation of the soil quality index (SQI). R2 = coefficient of determination.
SQwf had a significant correlation, with a coefficient of determination greater than 95% for the total organic carbon in the soil, whereas for SQIa, SQINe and SQIw, the correlation coefficients were 0.78, 0.76, and 0.75, respectively (Table 10); therefore, the performance order was SQIwf > SQIa > SQINe > SQIw, meaning that SQIwf was the best method for the determination of the desertification index. Hence, the Total Organic Carbon concentration in the soil was the best indicator for this purpose.
Table 10.
Pearson correlation coefficients for the methods used in the soil quality index (SQI), and the Total Organic Carbon (TOC) concentration in the soil, in the pilot study sites. Models for the soil quality index: SQIa = Additive; SQIw = Weighted Additive; SQIwf = Weighted Factorial Additive; SQINe = Nemoro.
We can see that the TOC was the attribute that had the best coefficient of determination with SQIwf (>0.90) when compared with the other indicators that compose the MDS (Figure 6A). The indicators Mg2+, CEC, and clay had a determination coefficient <0.40, which is considered to beweak (Figure 6B–D).
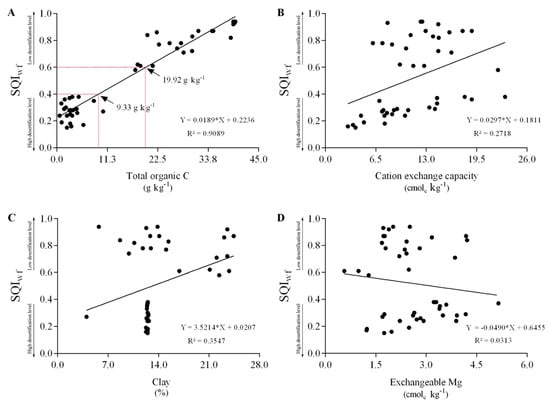
Figure 6.
Relationship between the weighted factorial additive soil quality index (SQIwf) [49] and the non-linear scores and minimum set of biophysical indicators, as selected by principal component analysis (PCA): (A) Total Organic Carbon in the soil; (B) coil cation exchange capacity; (C) soil clay; and (D) soil exchangeable Mg+2. * Significant, in accordance with linear regression analysis (p < 0.05).
In this context, we used this indicator to estimate the desertification index (DI) for the entire Brazilian semiarid region. We did so in an exploratory manner, considering the limitations of the variability of soils, vegetation, and climates, and this was achieved using the digital map of organic carbon in the Brazilian semiarid region. Next, we explored correlations between the NDVI (obtained from the Instituto Nacional do Semiárido (INSA/WebGIS)) and the aridity index (AI) [61,62], both from the Brazilian semiarid region. In this exercise, we observed that the soil’s TOC showed a 0.97 positive correlation with the AI. Moreover, the desertification index, obtained from the soil’s TOC, reached a correlation of 0.70 with the NDVI (Figure 7). In areas with a high DI, losses related to the TOC, compared with those that had a low DI (conserved areas), were higher than 70%. In areas with a moderate DI, these losses ranged between 50% and 25%. The Brazilian Ministry for the Environment has already recognized the most degraded areas (9% of the Brazilian Semiarid Region) as nuclei of desertification; however, more studies are needed to verify these results.
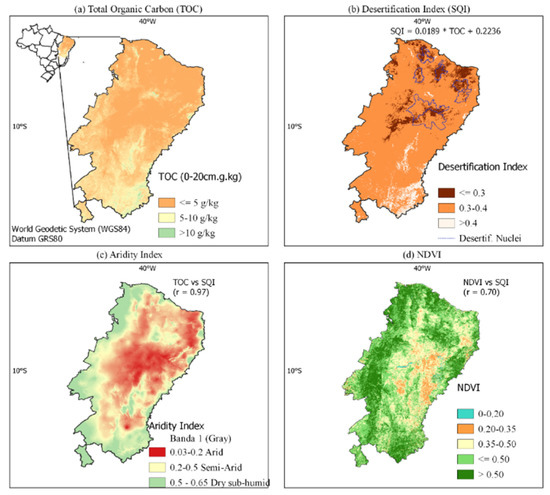
Figure 7.
Maps of (a) Total Organic Carbon in the soil (TOC); (b) Desertification Index (DI); (c) Aridity Index (AI); and (d) Normalized Difference Vegetation Index (NDVI). These maps represent the indices for the entire Brazilian semiarid region.
4. Discussion
Using the present research, we were able to identify the main biophysical indicators for the characterization of desertification in the studied pilot sites, and we were also able to determine its level of desertification or conservation. In this sense, we verified that the models of regression for the calculated desertification index (DI) and MDS (TOC, CEC, Mg2+, and clay) consistently indicated that the TOC was the best indicator (R2 = 0.999) to determine the conditions of degradation or conservation of the 44 analyzed areas (Figure 6).
We observed that the areas with TOC ≥ 20 g kg−1 had low desertification indices (DI or high SQI > 0.6), whereas areas with TOC ≤ 9.5 g k−1 had high desertification indices (Figure 7). Similar results have been reported in other studies, demonstrating high soil carbon losses in areas where vegetation coverage was removed [17,18,33,34,63,64,65]. It is important to emphasize that the soil carbon concentration alone cannot be used as a single variable to identify areas that are susceptible to desertification, as information pertaining to the carbon concentration in soil must be combined with information concerning vegetation growth in previous rainy seasons [23,24,25]. Some soil types, when annually cultivated by crops, may present soil carbon levels lower than 9.5 g kg−1; however, they may also remain productive and support vegetation growth during the rainy season [17]. These areas would not be considered desertified, given the criteria concerning previous vegetation growth [15,17,65]
The low levels of TOC in the soil in areas with high DI are associated with low vegetation coverage [27,36,50,66]. Areas with high DI showed a low diversity of species (1 to 4 species in 100 m2) and a low absolute density (895 individuals ha−1). In contrast, areas with a low DI showed high diversity (from 5 to 17 species) and high absolute density (4845 individuals ha−1) [6,8,36,65]. The most degraded areas (high DI) have, in general, soils with low levels of nutrients, especially P and N, due to low levels of organic carbon in the soil [17,36]. With the suppression of vegetation and the low capacity for producing greenery after rainfall, the remnants of organic matter in the uncovered soil are quickly mineralized. This process intensifies the course of desertification since organic matter is an essential component for the productivity of these soils [8,15,18,66]. The organic matter in soil controls a set of critical properties and functions that are particularly associated with nutrient availability [67,68], such as the retention of cations [69], complexation of toxic elements and micronutrients [70,71], aggregate stability [72], aeration [73], infiltration, retention of water, and microbial activity [74,75].
Visually, areas with high desertification (Figure 7) are characterized as large, denuded spots, with or without creeping vegetation cover, and they have clear signs of soil erosion [8,11]. The desertification process in these areas usually begins with the deforestation and substitution of native vegetation by crops that are different sizes, and undergo different life cycles [5,7,17]. As a result, herbaceous grasslands or short cycle crops replace the predominant shrub and tree vegetation of the Caatinga in the Brazilian semiarid region. To worsen matters further, a continuous cropping system without nutrients repositions itself after harvesting, and most of the time, this system is combined with livestock overgrazing on the herbs and shrubs, which leads to loss of soil fertility and hinders vegetation growth [8,10,49,76,77].
Furthermore, we can state that a significant part of the Brazilian semiarid region has its natural resources degraded by the current agricultural and livestock production systems [8]; thus, the desertification in the Brazilian semiarid region is similar to other regions on Earth where human actions are the main causes of such desertification [23,24,78,79]. Under these circumstances, until intervention measures are taken, desertification will continue to increase, in terms of both scale and severity. The integration and concatenation of environmental, territorial, property, and urban public policies are essential to prevent the advancement of the desertification process without any dissipation of resources. There is a current contradictory and counterproductive scenario in which progressive environmental policies often compete with public incentives to overuse vegetation strata and soils that are not capable of responding to those productive inputs, resulting in environmental degradation.
Parallel to this, the monitoring of areas where the environmental quality is undergoing a severe degradation process should receive particular attention from the government, since productive territories are being lost for present and future generations. A possible monitoring strategy could be associated with the development of a remote sensing modeling protocol that evaluates the organic carbon levels in soil across the region. The use of spectrometric techniques [79,80,81], in association with multiple linear regression algorithms that concern the organic carbon content of the soil [82,83,84,85], could facilitate the monitoring and systematic quantification of desertification in space–time; this would subsequently enable the adoption of relevant measures to reverse this phenomenon. Recent studies have obtained consistent results in the mid-infrared spectral range (MIR, 4000–600 cm−1) for various soil attributes, such as mineralogy, clay fraction, organic carbon, and base saturation [86,87]. Such information can be used for the monitoring of desertification processes, and it could be used alongside other techniques, such as the optimal desertification monitoring index based on feature space models on a regional scale [23,24]. It is very likely that each specific region will present differences regarding the minimum set of biophysical indicators, depending on the environmental characteristics relating to that area’s soil and vegetation; however, we believe that the present study points to a potentially useful methodological approach that will lead to a feasible desertification monitoring system in NE Brazil, and with the necessary adjustments, in other dry ecosystems around the globe.
5. Conclusions
The Total Organic Carbon (TOC), Clay content, Cation Exchange Capacity (CEC), and Magnesium (Mg2+) contents in soil comprised the minimum set of indicators that were used to estimate the desertification index (DI) of the pilot sites in semiarid NE Brazil. Of the minimum set of biophysical indicators assessed in this study, the TOC of soil had the best performance in terms of its ability to ascertain the intensity of the desertification process; however, this was limited to those sites that presented no vegetation growth during the previous rainy seasons. Based on these findings, we believe that, in the future, the combination of modeling, orbital remote sensing information, and a small set of biophysical indicators may lead to a more effective information system that can monitor desertification. This suggested approach could supply objective, quantitative data to decision-makers regarding the need for measures that will reduce or reverse desertification processes in the dry tropical ecosystem of NE Brazil, and perhaps in other arid regions around the globe.
Author Contributions
Conceptualization, A.M.P.-M.; Data curation, J.V.; Formal analysis, J.R.Z.-S. and H.A.D.A.Q.; Investigation, J.V.; Methodology, A.M.P.-M.; Resources, A.M.P.-M.; Writing—original draft, A.M.P.-M.; Writing—review and editing, R.S.C.M., J.V., D.L.M., J.R.Z.-S. and I.M.F. All authors have read and agreed to the published version of the manuscript.
Funding
This research received external funding: Studies and Projects Funding (FINEP) for financial support (agreement N° 01.13.0345.00) and the National Observatory of Water and Carbon Dynamics in the Caatinga Biome—NOWCDCB, supported by FACEPE (grants: APQ-0296-5.01/17; APQ-0498-3.07/17 458 ONDACBC; APQ-0532-5.01/14), CNPq (grants: 441305/2017-2; 465764/2014-2), and CAPES (grants: 88887.136369/2017-00).
Institutional Review Board Statement
Not applicable.
Informed Consent Statement
Not applicable.
Data Availability Statement
Not applicable.
Acknowledgments
We wish to thank the National Institute of the Semi-Arid (INSA-MCTIC), the partnership with Federal University of Paraíba (UFPB), and Studies and Projects Funding (FINEP) for financial support (agreement N° 01.13.0345.00). This work is part of the National Observatory of Water and Carbon Dynamics in the Caatinga Biome—NOWCDCB, supported by FACEPE (grants: APQ-0296-5.01/17; APQ-0498-3.07/17 ONDACBC; APQ-0532-5.01/14), CNPq (grants: 441305/2017-2; 465764/2014-2) and CAPES (grants: 88887.136369/2017-00).
Conflicts of Interest
The authors declare no conflict of interest. The funders had no role in the design of the study; in the collection, analyses, or interpretation of data; in the writing of the manuscript, or in the decision to publish the results.
Appendix A
Table A1.
Normalized Difference Vegetation Index (NDVI) during the rainy season in desertified areas of the semi-arid region of Paraíba State, from 1999/2000, 2009/2010 and 2015.


References
- UNCCD—United Nations Convention to Combat Desertification. Convention to Combat Desertification in Countries Experiencing Serious Drought and/or Desertification, Particularly in Africa; ONU: Paris, France, 1994; 56p. [Google Scholar]
- UNEP—United Nations Environment Programme. World Atlas of Desertification, 2nd ed.; UNEP: London, UK, 1997; 182p. [Google Scholar]
- Pimm, S.L. The World According to Pimm: A Scientist Audits the Earth; McGraw-Hill: Chicago, IL, USA, 2001; 287p. [Google Scholar]
- Dobie, P. The Global Drylands Partnership; UNDP: Nairobi, Kenya, 2011; 491p. [Google Scholar]
- Pérez-Marin, A.M.; Cavalcante, A.M.; Medeiros, S.S.; Tinôco, L.B.; Salcedo, I.H. Núcleos de desertificação no semiárido brasileiro: Ocorrência natural ou antrópica? Parcer. Estratégica 2012, 17, 87–106. [Google Scholar]
- Fernandes, M.M.; Fernandes, M.R.M.; Garcia, J.R.; Matricardi, E.A.T.; Lima, A.H.S.; Filho, R.N.A.; Filho, R.R.G.; Piscoya, V.C.; Piscoya, T.O.F.; Filho, M.C. Land use and land cover changes and carbon stock valuation in the São Francisco river basin, Brazil. Environ. Chall. 2021, 5, 100247. [Google Scholar] [CrossRef]
- De Oliveria, M.L.; Dos Santos, C.A.C.; De Oliveira, G.; Perez-Marin, A.M.; Santos, C.A.G. Effects of human-induced land degradation on water and carbon fluxes in two different Brazilian dryland soil covers. Sci. Total Environ. 2021, 792, 148458. [Google Scholar] [CrossRef]
- Barbosa Neto, M.V.; de Araújo, M.S.B.; de Araújo Filho, J.C.; Sampaio, E.V.S.B.; Almeida, B.G. Rill and sheet soil erosion estimation in an area undergoing desertification in the Brazilian semi-arid region. Model. Earth Syst. Environ. 2021, 7, 1183–1191. [Google Scholar] [CrossRef]
- Accioly, L.J.O.; Silva, E.A.; Cavalcanti, E.A.; Alves, E.S.; Pereira, A.G.S.; Silva, R.S.; Ramos, R.R.D.; Silva, R.R. Mapeamento Do Uso e Cobertura Das Terras Do Semiarido Pernambucano (Escala 1:100.000); Embrapa: Rio de Janeiro, Brazil, 2017; Available online: https://www.embrapa.br/busca-de-publicacoes/-/publicacao/1079144/mapeamento-do-uso-e-cobertura-das-terras-do-semiarido-pernambucano-escala-1100000 (accessed on 15 April 2022).
- Sampaio, E.V.; Sampaio, Y.; Vital, T.; Araújo, S.B.; Sampaio, G.R. Desertificação no Brasil: Conceitos, Núcleos e Tecnologias de Recuperação e Convivência; Universitária da UFPE: Recife, Brazil, 2003; 202p. [Google Scholar]
- Antongiovanni, M.; Venticinque, E.M.; Matsumoto, M.; Fonseca, C.R. Chronic anthropogenic disturbance on Caatinga dry forest fragments. J. Appl. Ecol. 2020, 57, 2064–2074. [Google Scholar] [CrossRef]
- Crispim, A.B.; Melo, C.C.F.; Almeida, I.C.S.; Oliveira, L.S. Bases introdutórias sobre degradação ambiental no semiárido brasileiro. In 3° Seminário Regional Norte e Nordeste de Pós-Graduação em Geografia; UFPB: João Pessoa, Brazil, 2013; Available online: http://www.geociencias.ufpb.br/posgrad/sernne/artigo16.pdf (accessed on 2 May 2022).
- Yang, Z.; Zhang, Q.; Hao, X.; Yue, P. Changes in evapotranspiration over global semiarid regions 1984–2013. J. Geophys. Res. Atmos. 2019, 124, 2946–2963. [Google Scholar] [CrossRef]
- Mariano, D.A.; dos Santos, C.A.C.; Wardlow, B.D.; Anderson, M.C.; Schiltmeyer, A.V.; Tadesse, T.; Svoboda, M.D. Use of remote sensing indicators to assess the effects of drought and human-induced land degradation on ecosystem health in Northeastern Brazil. Remote Sens. Environ. 2018, 213, 129–143. [Google Scholar] [CrossRef]
- Althoff, T.D.; Menezes, R.S.C.; de Carvalho, A.L.; de Siqueira Pinto, A.; Santiago, G.A.C.F.; Ometto, J.P.H.B.; von Randow, C.; Sampaio, E.V.D.S.B. Climate change impacts on the sustainability of the firewood harvest and vegetation and soil carbon stocks in a tropical dry forest in Santa Teresinha Municipality, Northeast Brazil. Forest Ecol. Manag. 2016, 360, 367–375. [Google Scholar] [CrossRef]
- Santana, M.S.; Andrade, E.M.; Sampaio, E.V.S.B.; Tiago, O.F.; Salviano, A.M.; Silva, D.J.; Cunha, T.J.F.; Giongo, V. Do agrosystems change soil carbon and nutrient stocks in a semiarid environment? J. Arid. Environ. 2022, 201, 104747. [Google Scholar] [CrossRef]
- Menezes, R.S.C.; Sales, A.T.; Primo, D.C.; Albuquerque, E.R.G.M.; Jesus, K.N.; Pareyn, F.G.C.; Santana, M.S.; Santos, U.J.; Martins, J.C.R.; Althoff, T.D.; et al. Soil and vegetation carbon stocks after land-use changes in a seasonally dry tropical forest. Geoderma 2021, 390, 114943. [Google Scholar] [CrossRef]
- Araújo Filho, R.N.; dos Santos Freire, M.B.G.; Wilcox, B.P.; West, J.B.; Freire, F.J.; Marques, F.A. Recovery of Carbon Stocks in Deforested Caatinga Dry Forest Soils Requires at Least 60 Years. For. Ecol. Manag. 2018, 407, 210–220. [Google Scholar] [CrossRef]
- Torres, L.; Abraham, E.M.; Barreto-Sierra, C.; Ruiz-Perez, M. Desertification research in Argentina. Land Degrad. Dev. 2015, 26, 433–440. [Google Scholar] [CrossRef]
- Abraham, E.M.; Beekman, G.B. Indicadores de la Desertificación para América del Sur: Recopilación y Armonización y Puntos de Referencia de la Desertificación a ser Utilizados en el Programa “Combate a la Desertificación y Mitigación de los Efectos de la Seca en América del Sur”; IICA: Mendoza, Argentina, 2006; 373p. [Google Scholar]
- Lima, R.C.; Curi, W.F.; Santos, A.P.; Costa, T.S. Sistema de avaliação espacial do processo de desertificação no semiárido brasileiro. Gaia Sci. 2016, 10, 690–707. [Google Scholar] [CrossRef]
- Matallo, H. Indicadores de Desertificação: Histórico e Perspectivas; UNESCO: Brasília, Brazil, 2001; 80p. [Google Scholar]
- Guo, B.; Wei, C.; Yu, Y.; Liu, Y.; Li, J.; Meng, C.; Cai, Y. The dominant influencing factors of desertification changes in the source region of Yellow River: Climate change or human activity? Sci Total Environ. 2022, 792, 152512. [Google Scholar] [CrossRef]
- Guo, B.; Yang, F.; Li, J.; Lu, Y. A novel-optimal monitoring index of rocky desertification based on feature space model and red edge indices that derived from sentinel-2 MSI image. Geomat. Nat. Hazards Risk 2022, 13, 1571–1592. [Google Scholar] [CrossRef]
- Nascimento, D.M.; Sales, A.T.; Souza, R.; Silva, A.S.A.; Sampaio, V.E.S.B.; Menezes, R.S.C. Development of a methodological approach to estimate vegetation biomass using remote sensing in the Brazilian semiarid NE region. Remote Sens. Appl. Soc. Environ. 2022, 27, 100771. [Google Scholar] [CrossRef]
- Brasil Neto, R.M.; Santos, C.A.G.; Costa Silva, J.F.C.B.; Silva, R.M.; Santos, C.A.C.; Mishra, M. Evaluation of the TRMM product for monitoring drought over Paraíba State, northeastern Brazil: A trend analysis. Sci. Rep. 2021, 11, 1097. [Google Scholar] [CrossRef]
- Tomasella, J.; Vieira, R.M.S.P.; Barbosa, A.A.; Rodriguez, D.A.; Santana, O.S.; Sestini, M.F. Desertification trends in the Northeast of Brazil over the period 2000–2016. Int. J. Appl. Earth Obs. Geoinf. 2018, 73, 197–206. [Google Scholar] [CrossRef]
- Salvati, L.; Mavrakisb, A.; Colantoni, A.; Mancino, G.; Ferrarad, A. Complex adaptive systems, soil degradation and land sensitivity to desertification: A multivariate assessment of Italian agro-forest landscape. Sci. Total Environ. 2015, 521–522, 235–245. [Google Scholar] [CrossRef]
- Salvati, L.; Mancino, G.; Zuliane, E.; Sateriano, A.; Zitte, M.; Ferrara, A. An expert system to evaluate environmental sensitivity: A local scale approach to desertification risk. Appl. Ecol. Environ. Res. 2013, 11, 611–627. [Google Scholar] [CrossRef]
- Becerril-Piña, R.; Mastachi-Loza, C.A.; Gonzalez-Sosa, E.; Díaz-Delgado, C.; Khalidou, M.B. Assessing desertification risk in the semiarid highlands of central Mexico. J. Arid. Environ. 2015, 120, 4–13. [Google Scholar] [CrossRef]
- Vieira, R.M.; Tomasella, J.; Alvalá, R.C.; Sestini, M.F.; Affonso, A.G.; Rodriguez, D.A.; Barbosa, A.A.; Cunha, A.P.; Valles, G.F.; Crepani, E.; et al. Identifying areas susceptible to desertification in the Brazilian northeast. Solid Earth 2015, 6, 347–360. [Google Scholar] [CrossRef]
- Galindo, I.; Ribeiro, M.; Santos, M.; Lima, J.; Ferreira, R. Relações solo-vegetação em áreas sob processo de desertificação no município de Jataúba, PE. Rev. Bras. Ciência Solo 2008, 32, 1283–1296. [Google Scholar] [CrossRef][Green Version]
- Schulz, K.; Voigt, K.; Beusch, C.; Almeida-Cortez, J.S.; Kowarik, I.; Walz, A.; Cierjacks, A. Grazing deteriorates the soil carbon stocks of Caatinga forest ecosystems in Brazil. For. Ecol. Manag. 2016, 367, 62–70. [Google Scholar] [CrossRef]
- Santana, M.; Sampaio, E.; Giongo, V.; Menezes, R.; Jesus, K.; Albuquerque, E.; Nascimento, D.; Pareyn, F.; Cunha, T.; Sampaio, R.; et al. Carbon and nitrogen stocks of soils under different land uses in Pernambuco state, Brazil. Geoderma Reg. 2019, 16, e00205. [Google Scholar] [CrossRef]
- Khanamani, A.; Fathizad, H.; Karimi, H.; Shojaei, S. Assessing desertification by using soil indices. Arab. J. Geosci. 2017, 10, 287. [Google Scholar] [CrossRef]
- Vendruscolo, J.; Perez-Marin, A.M.; Dias, B.O.; Felix, E.S.; Coutinho, A.A.; Ferreira, K.R. Phytosociological survey of arboreous species in conserved and desertified areas in the semiarid region of Paraíba, Brazil. Afr. J. Agric. Res. 2017, 12, 805–814. [Google Scholar] [CrossRef]
- Alves, T.L.B.; Azevedo, P.V.; Cândido, G.A. Socioeconomic indicator and desertification the upper course of the Paraíba river watershed. Ambiente Soc. 2017, 20, 19–38. [Google Scholar] [CrossRef]
- Qiu, X.; Peng, D.; Wang, H.; Wang, Z.; Cheng, S. Minimum data set for evaluation of stand density effects on soil quality in Larix principis-rupprechtii plantations in North China. Ecol. Indic. 2019, 103, 236–247. [Google Scholar] [CrossRef]
- Toshiaki Oikawa, R.; Silva Custódio, A.; Fernando Araújo, F. Validation of soil quality index in soil using bioindicator plant. Colloq. Agrar. 2021, 17, 59–69. [Google Scholar] [CrossRef]
- 42-Aponte, H.; Medina, J.; Butler, B.; Meier, S.; Cornejo, P.; Kuzyakov, Y. Soil quality indices for metal(loid) contamination: An enzymatic perspective. Land Degrad. Dev. 2020, 31, 2700–2719. [Google Scholar] [CrossRef]
- Aravindh, S.; Chinnadurai, C.; Balachandar, D. Development of a soil biological quality index for soils of semi-arid tropics. Soil 2020, 6, 483–497. [Google Scholar] [CrossRef]
- Andrews, S.S.; Karlen, D.L.; Mitchell, J.P. A comparison of soil quality indexing methods for vegetable production systems in Northern California. Agric. Ecosyst. Environ. 2002, 90, 25–45. [Google Scholar] [CrossRef]
- Mukherjee, A.; Lal, R. Comparison of Soil Quality Index Using Three Methods. PLoS ONE 2014, 9, e105981. [Google Scholar] [CrossRef]
- Lai, R. Soil health and carbon management: Review. Food Energy Secur. 2016, 5, 212–222. [Google Scholar] [CrossRef]
- Biswas, S.; Hazra, G.C.; Purakayastha, T.J.; Saha, N.; Mitran, T.; Singha Roy, S.; Mandal, B. Establishment of critical limits of indicators and indices of soil quality in rice-rice cropping systems under different soil orders. Geoderma 2017, 292, 34–48. [Google Scholar] [CrossRef]
- Nabiollahi, K.; Golmohamadi, F.; Taghizadeh-Mehrjardi, R.; Kerry, R.; Davari, M. Assessing the effects of slope gradient and land use change on soil quality degradation through digital mapping of soil quality indices and soil loss rate. Geoderma 2018, 318, 16–28. [Google Scholar] [CrossRef]
- IBGE—Instituto Brasileiro de Geografia e Estatística. Censo Agropecuário 2017; IBGE: Rio de Janeiro, Brazil, 2018; 108p. [Google Scholar]
- Gariglio, M.A.; Sampaio, E.V.S.B.; Cestaro, L.A.; Kageyama, P.Y. Uso Sustentável e Conservação dos Recursos Florestais da Caatinga; Serviço Florestal Brasileiro: Brasília, Brazil, 2010. [Google Scholar]
- Menezes, R.S.C.; Sampaio, E.V.S.B.; Giongo, V.; Pérez-Marin, A.M. Biogeochemical cycling in terrestrial ecosystems of the Caatinga Biome. Braz. J. Biol. 2012, 72, 643–653. [Google Scholar] [CrossRef]
- Vendruscolo, J.; Perez-Marin, A.M.; Felix, E.S.; Ferreira, K.R.; Cavalheiro, W.C.S.; Fernandes, I.M. Monitoring desertification in semiarid Brazil: Using the Desertification Degree Index (DDI). Land Degrad. Dev. 2021, 32, 684–698. [Google Scholar] [CrossRef]
- Qi, Y.B.; Darilek, J.L.; Huang, B.; Zhao, Y.C.; Sun, W.X.; Gu, Z.Q. Evaluating soil quality indices in an agriculturalregion of Jiangsu Province, China. Geoderma 2009, 149, 325–334. [Google Scholar] [CrossRef]
- Embrapa—Empresa Brasileira de Pesquisa Agropecuária. Manual de Métodos de Análise de Solo, 2nd ed.; Embrapa Solos: Rio de Janeiro, Brasil, 2011. [Google Scholar]
- Andrews, S.S.; Carroll, C.R. Designing a Soil Quality Assessment Tool for Sustainable Agroecosystem Management. Ecol. Appl. 2001, 11, 1573–1585. [Google Scholar] [CrossRef]
- Brejda, J.J.; Moorman, T.B.; Karlen, D.L.; Dao, T.H. Identification of Regional Soil Quality Factors and Indicators I. Central and Southern High Plains. Soil Sci. Soc. Am. J. 2000, 64, 2115–2124. [Google Scholar] [CrossRef]
- Mandal, U.K.; Warrington, D.N.; Bhardwaj, A.K.; Bar-Tal, A.; Kautsky, L.; Minz, D.; Levy, G.J. Evaluating impact of irrigation water quality on a calcareous clay soil using principal component analysis. Geoderma 2008, 144, 189–197. [Google Scholar] [CrossRef]
- Masto, R.; Chhonkar, P.; Purakayastha, T.; Patra, A.; Singh, D. Soil quality indices for evaluation of long-term land use and management practices in semiarid sub-tropical India. Land Degrad. Dev. 2008, 19, 516–529. [Google Scholar] [CrossRef]
- Zhang, C.; Xue, S.; Liu, G.B.; Song, Z.L. A comparison of soil qualities of different revegetation types in the Loess Plateau, China. Plant Soil 2011, 347, 163–178. [Google Scholar] [CrossRef]
- Doran, J.W.; Parkin, T.B. Defining and Assessing Soil Quality. Defining Soil Quality for a Sustainable Environment. SSSA Spec. Publ. 1994, 35, 3–21. [Google Scholar] [CrossRef]
- Liu, M.; Xu, Z.; Guo, S.; Tang, C.; Liu, X.; Jao, X. Evaluation of leaf morphology, structure and biochemical substance of balloon flower (Platycodon grandiflorum (Jacq.) A. DC.) plantlets in vitro under different light spectra. Sci. Hortic. 2014, 174, 112–118. [Google Scholar] [CrossRef]
- Sánchez-Navarro, A.; Gil-Vázquez, J.M.; Delgado-Iniesta, M.J.; Marín-Sanleandro, P.; Blanco-Bernardeau, A.; Ortiz-Silla, R. Establishing an index and identification of limiting parameters for characterizing soil qual-ity in Mediterranean ecosystems. Catena 2015, 131, 35–45. [Google Scholar] [CrossRef]
- Zomer, R.; Trabucco, A.; Van Straaten, O.; Bossio, D. Carbon, Land and Water: A Global Analysis of the Hydrologic Dimensions of Climate Change Mitigation through Afforestation/Reforestation; Research Report, 101; International Water Management Institute: Colombo, Sri Lanka, 2007; 39p. [Google Scholar]
- Zomer, R.; Trabucco, A.; Bossio, D.; Verchot, L.V. Climate Change Mitigation: A Spatial Analysis of Global Land Suitability for Clean Development Mechanism Afforestation and Reforestation. Agric. Ecosyst. Environ. 2008, 126, 67–80. [Google Scholar] [CrossRef]
- Castanho, A.D.A.; Coe, M.; Andrade, E.M.; Walker, W.; Baccini, A.; Campos, D.A.; Farina, M. A close look at above ground Biomass of a Large and Heterogeneous Seasonally Dry Tropical Forest—Caatinga in North East of Brazil. Acad. Bras Cienc 2020, 92, 1–18. [Google Scholar] [CrossRef]
- Fernandes, M.M.; Fernandes, M.R.M.; Garcia, J.R.; Matricardi, E.A.T.; de Almeida, A.Q.; Pinto, A.S.; Menezes, R.S.C.; Silva, A.J.; de Souza Lima, A.H. Assessment of land use and land cover changes and valuation of carbon stocks in the Sergipe semiarid region, Brazil. Land Use Policy 2020, 99, 104795. [Google Scholar] [CrossRef]
- Althoff, T.D.; Silva, R.F.; Martins, J.C.; Wanderley, L.S.; Sales, A.T.; Menezes, R.S. Simulation of aboveground biomass production under different rainfall scenarios and soil types in the Caatinga Biome, Brazil. Rev. Geama 2018, 4, 13–18. Available online: http://www.journals.ufrpe.br/index.php/geama/article/view/1887/482482538 (accessed on 10 February 2022).
- Souza, B.I.; Menezes, R.; Artigas, R.C. Efeitos da desertificação na composição de espécies do bioma Caatinga, Paraíba/Brasil. Investig. Geográficas 2015, 88, 45–59. [Google Scholar] [CrossRef][Green Version]
- Silva, I.R.; Mendonça, E.S. Matéria orgânica do solo. In Fertilidade do Solo; Novais, R.F., Alvarez, V., Alvarez, V.V.H., Barros, N.F., Fontes, R.L.F., Cantarutti, R.B., Neves, J.C.L., Eds.; SBCS: Viçosa, Brazil, 2007; pp. 275–374. [Google Scholar]
- Costa, F.X.; Beltrão, N.M.; Silva, F.E.; Melo Filho, J.S.; Silva, M.A. Disponibilidade de nutrientes no solo em função de doses de matéria orgânica no plantio da mamona. Rev. Verde 2010, 5, 204–212. Available online: https://dialnet.unirioja.es/servlet/articulo?codigo=7454926 (accessed on 15 February 2022).
- Ciotta, M.N.; Bayer, C.; Fontoura, S.M.V.; Ernani, P.R.; Albuquerque, J.A. Matéria orgânica e aumento da capacidade de troca de cátions em solo com argila de atividade baixa sob plantio direto. Ciência Rural. 2003, 33, 1161–1164. [Google Scholar] [CrossRef]
- Pavinato, P.S.; Rosolem, C.A. Disponibilidade de nutrientes no solo—Decomposição e liberação de compostos orgânicos de resíduos vegetais. Rev. Bras. Ciência Solo 2008, 32, 911–920. [Google Scholar] [CrossRef]
- Pegoraro, R.F.; Silva, I.R.; Novais, R.F.; Mendonça, E.S.; Alvarez, V.H.; Nunes, F.N.; Gebrim, F.O. Fluxo difusivo de micronutrientes catiônicos afetado pelo tipo, dose e época de incorporação de adubos verdes ao solo. Rev. Bras. Ciência Solo 2006, 30, 997–1006. [Google Scholar] [CrossRef][Green Version]
- Salton, J.C.; Mielniczuk, J.; Bayer, C.; Boeni, M.; Conceição, P.C.; Fabrício, A.C.; Macedo, M.C.M.; Broch, D.L. Agregação e estabilidade de agregados do solo em sistemas agropecuários em Mato Grosso do Sul. Rev. Bras. Ciência Solo 2008, 32, 11–21. [Google Scholar] [CrossRef]
- Souza, Z.M.; Alves, M.C. Propriedades físicas e teor de matéria orgânica em um Latossolo Vermelho de cerrado sob diferentes usos e manejos. Acta Sci. Agron. 2003, 25, 27–34. [Google Scholar] [CrossRef]
- Capuani, S.; Rigon, J.P.G.; Beltrão, N.E.M.; Brito Neto, J.F. Atividade microbiana em solos, influenciada por resíduos de algodão e torta de mamona. Rev. Bras. Eng. Agrícola E Ambient. 2012, 16, 1269–1274. [Google Scholar] [CrossRef][Green Version]
- Sato, J.H.; Figueiredo, C.C.; Leão, T.P.; Ramos, M.L.G.; Kato, E. Matéria orgânica e infiltração da água em solo sob consórcio milho e forrageiras. Rev. Bras. Eng. Agrícola E Ambiental 2012, 16, 189–193. [Google Scholar] [CrossRef]
- Perez-Marin, A.M.; Menezes, R.S.; Dias, E.M.; Sampaio, E.V. Efeito da Gliricidia sepium sobre nutrientes do solo, microclima e produtividade do milho em sistema agroflorestal no agreste paraibano. Rev. Bras. Ciência Solo 2006, 30, 555–564. [Google Scholar] [CrossRef]
- Althoff, T.D.; Menezes, R.S.; Pinto, A.S.; Pareyn, F.G.; Carvalho, A.L.; Martins, J.C.; Carvalho, E.X.; Silva, A.S.; Dutra, E.D.; Sampaio, E.V. Adaptation of the century model to simulate C and N dynamics of Caatinga dry forest before and after deforestation. Agric. Ecosyst. Environ. 2018, 254, 26–34. [Google Scholar] [CrossRef]
- Zhang, Z.; Huisingh, D. Combating desertification in China: Monitoring, control, management and revegetation. J. Clean. Prod. 2018, 182, 765–775. [Google Scholar] [CrossRef]
- Pradeep Kumar, B.; Raghu Babu, K.; Anusha, B.N.; Rajasekhar, M. Geo-environmental monitoring and assessment of land degradation and desertification in the semi-arid regions using Landsat 8 OLI / TIRS, LST, and NDVI approach. Environ. Chall. 2022, 8, 100578. [Google Scholar] [CrossRef]
- De Sousa Mendes, W.; Sommer, M.; Koszinski, S.; Wehrhan, M. Peatlands spectral data influence in global spectral modelling of soil organic carbon and total nitrogen using visible-near-infrared spectroscopy. J. Environ. Manag. 2022, 317, 115383. [Google Scholar] [CrossRef]
- Mendes, W.S.; Demattê, J.A.M.; Rosin, N.A.; Terra, F.S.; Poppiel, R.R.; Urbina-Salazar, D.U.; Boechat, C.L.; Silva, E.B.; Curi, N.; Silva, S.H.G.; et al. The Brazilian soil Mid-infrared Spectral Library: The Power of the Fundamental Range. Geoderma 2022, 415, 115776. [Google Scholar] [CrossRef]
- Bensa, B.M.A.; Japundžić-Palenkić, B. Evaluation of Vis-NIR preprocessing combined with PLS regression for estimation soil organic carbon, cation exchange capacity and clay from eastern Croatia. Geoderma Reg. 2022, 30, e00558. [Google Scholar] [CrossRef]
- Dos Santos, U.J.; Demattê, J.A.M.; Menezes, R.S.C.; Dotto, A.C.; Guimarães, C.C.B.; Alves, B.J.R.; Primo, D.C.; Sampaio, E.V.B. Predicting carbon and nitrogen by visible near-infrared (Vis-NIR) and mid-infrared (MIR) spectroscopy in soils of Northeast Brazil. Geoderma Reg. 2020, 23, e00333. [Google Scholar] [CrossRef]
- Dawelbait, M.; Morari, F. Monitoring desertification in a Savannah region in Sudan using Landsat images and spectral mixture analysis. J. Arid. Environ. 2012, 80, 45–55. [Google Scholar] [CrossRef]
- Grinand, C.; Le Maire, G.; Vieilledent, G.; Razakamanarivo, H.; Razafimbelo, T.; Betnoux, M. Estimating temporal changes in soil carbon stocks at ecoregional scale in Madagascar using remote sensing. Int. J. Appl. Earth Obs. Geoinf. 2017, 54, 1–14. [Google Scholar] [CrossRef]
- Demattê, J.A.M.; Dotto, A.C.; Paiva, A.F.S.; Sato, M.V.; Ricardo, S.D.; Dalmolin, R.S.D.; Araújo, M.S.B.; Silva, E.B.; Nanni, M.R.; Caten, A.T.; et al. The Brazilian Soil Spectral Library (BSSL): A General View, Application and Challenges. Geoderma 2019, 354, 113793. [Google Scholar] [CrossRef]
- Hengl, T.; Jesus, J.M.; Heuvelink, G.B.M.; Gonzalez, M.R.; Kilibarda, M.; Blagotić, A.; Shangguan, W.; Wright, M.N.; Geng, X.; Bauer-Marschallinger, B.; et al. SoilGrids250m: Global gridded soil information based on machine learning. PLoS ONE 2017, 12, e0169748. [Google Scholar] [CrossRef] [PubMed]


Publisher’s Note: MDPI stays neutral with regard to jurisdictional claims in published maps and institutional affiliations. |
© 2022 by the authors. Licensee MDPI, Basel, Switzerland. This article is an open access article distributed under the terms and conditions of the Creative Commons Attribution (CC BY) license (https://creativecommons.org/licenses/by/4.0/).