Eco-Environmental Effects and Spatial Heterogeneity of “Production-Ecology-Living” Land Use Transformation: A Case Study for Ningxia, China
Abstract
:1. Introduction
2. Materials and Methods
2.1. Study Area
2.2. Data Source and Description
2.2.1. Data Source
2.2.2. Classification of PEL Land Based on Land Use Types
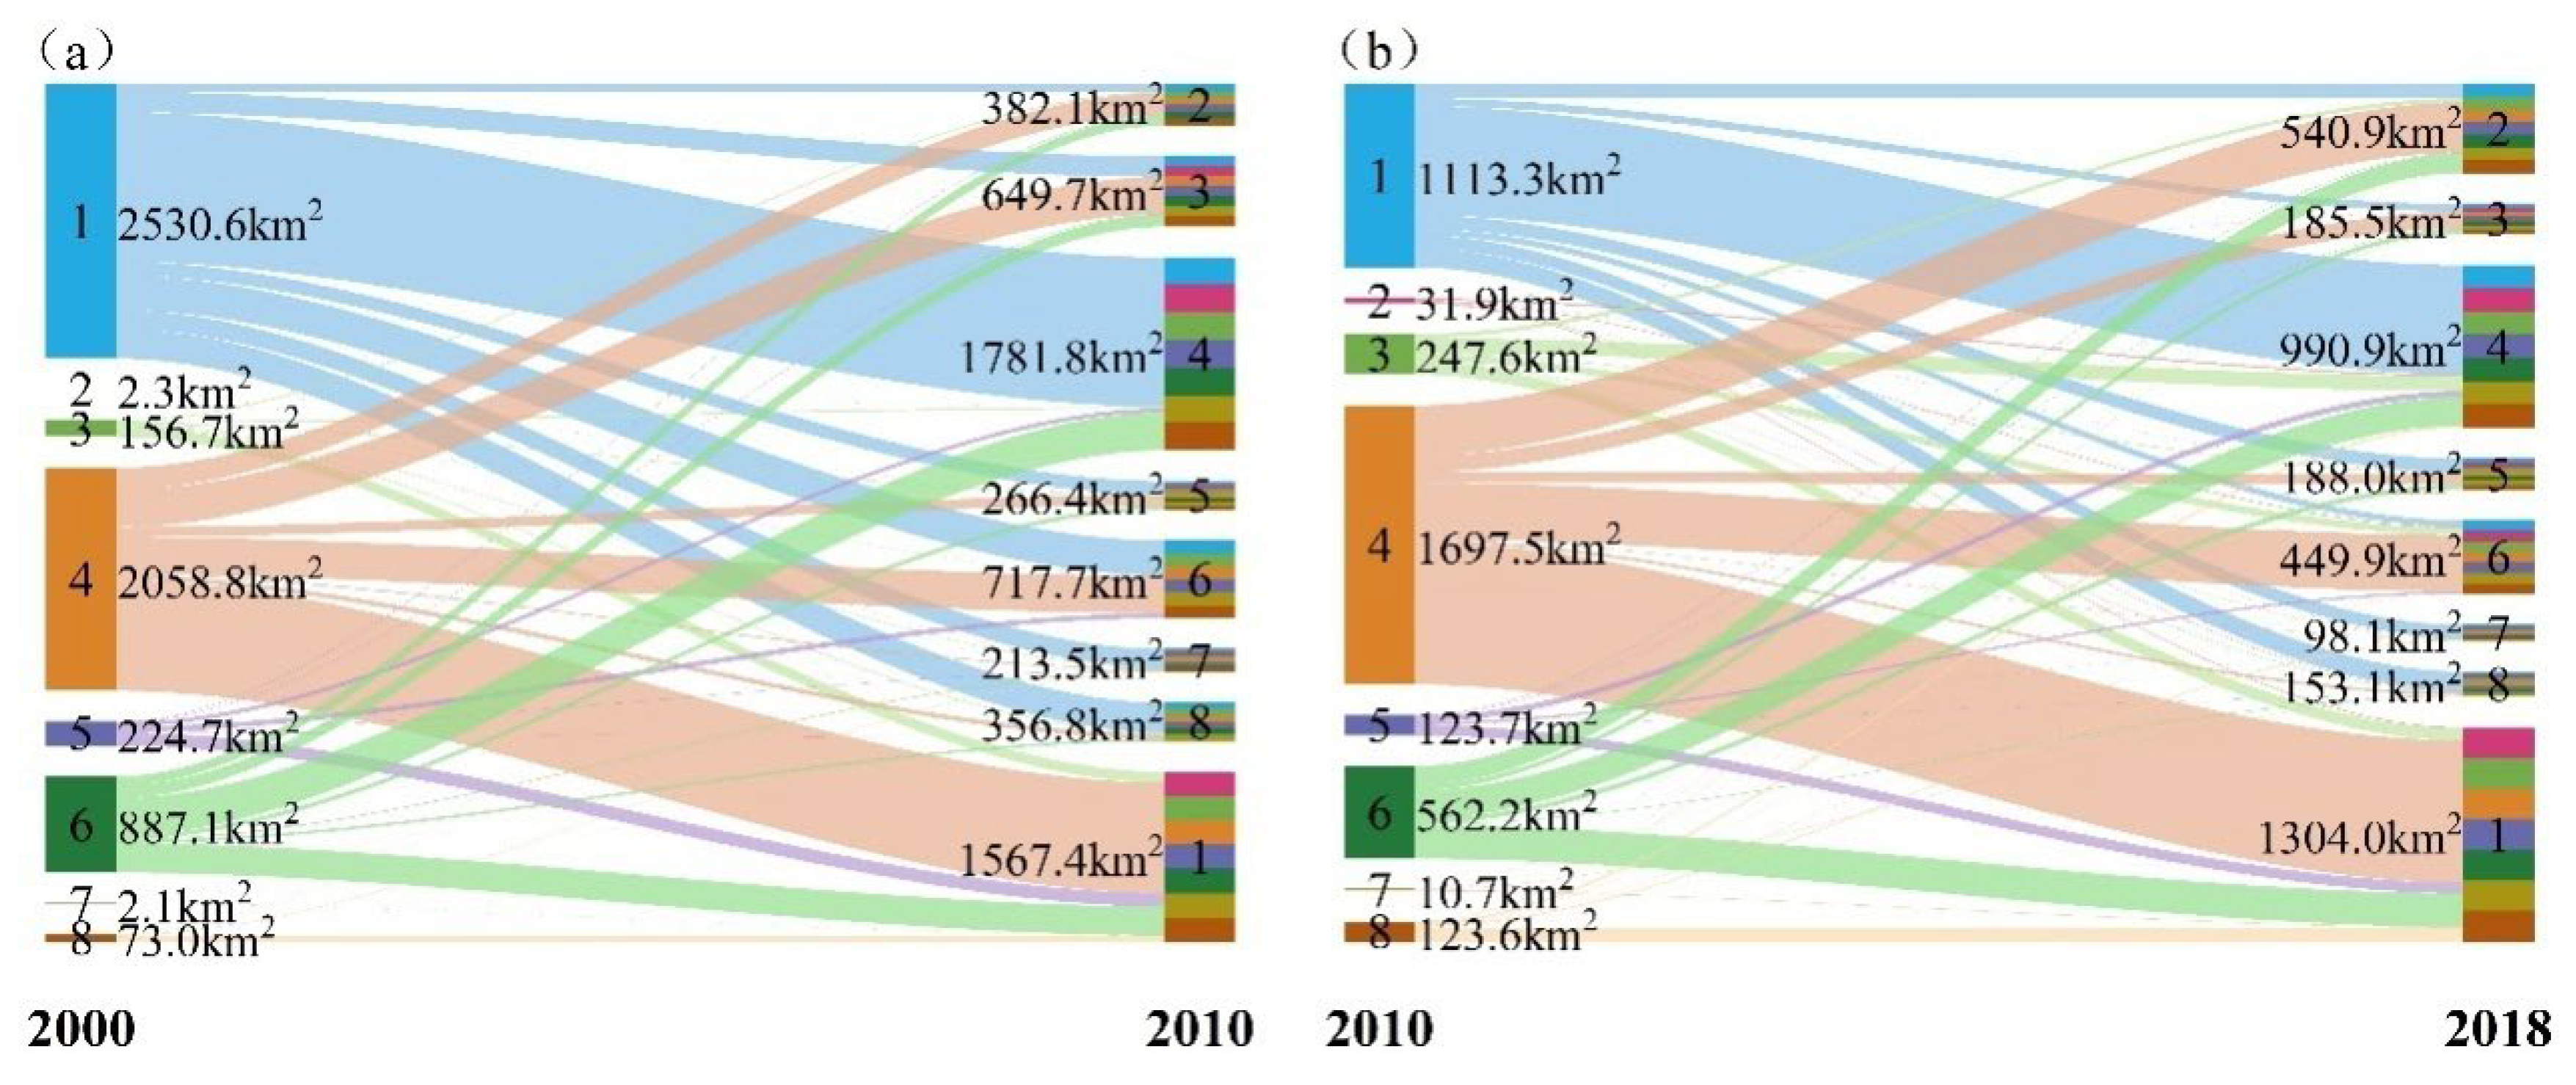
2.2.3. Land Use Transfer Matrix
2.3. Regional Eco-Environmental Quality Index
2.4. EQI Spatial Heterogeneity and Driving Force Analysis
2.4.1. EQI Center of Gravity Migration Model
2.4.2. Statistics-Based Hotspots Analysis of EQI
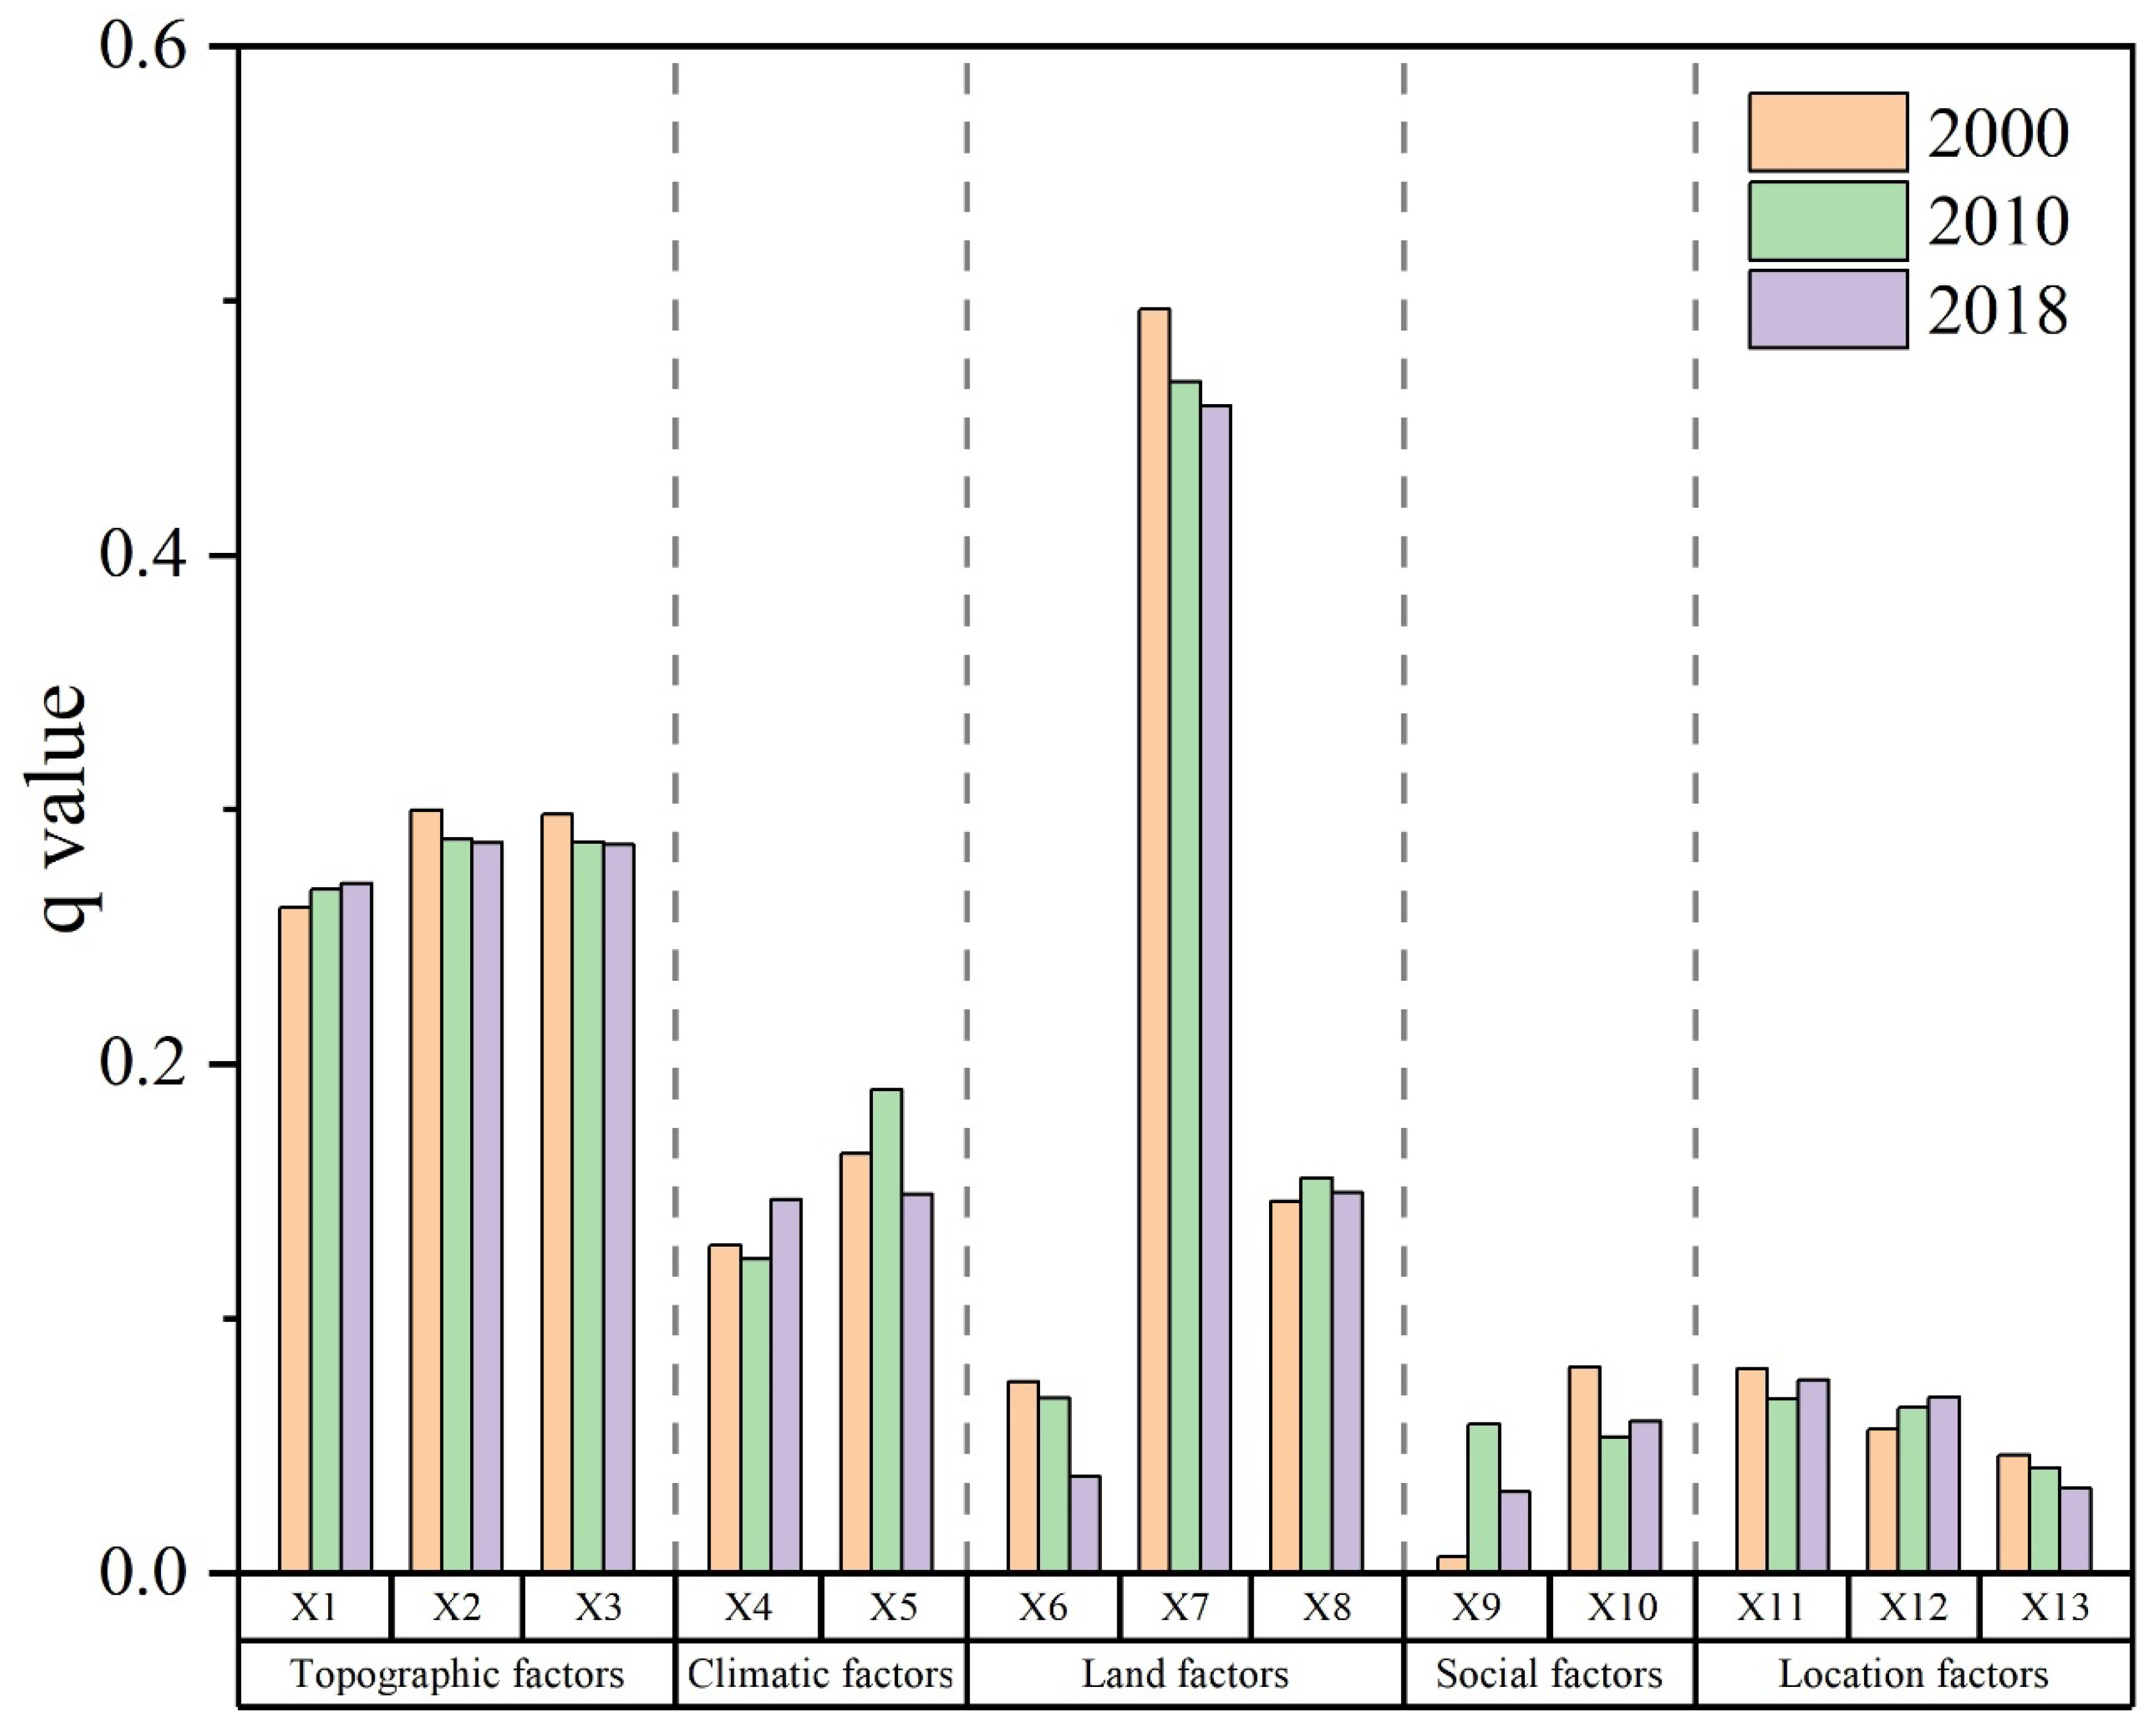
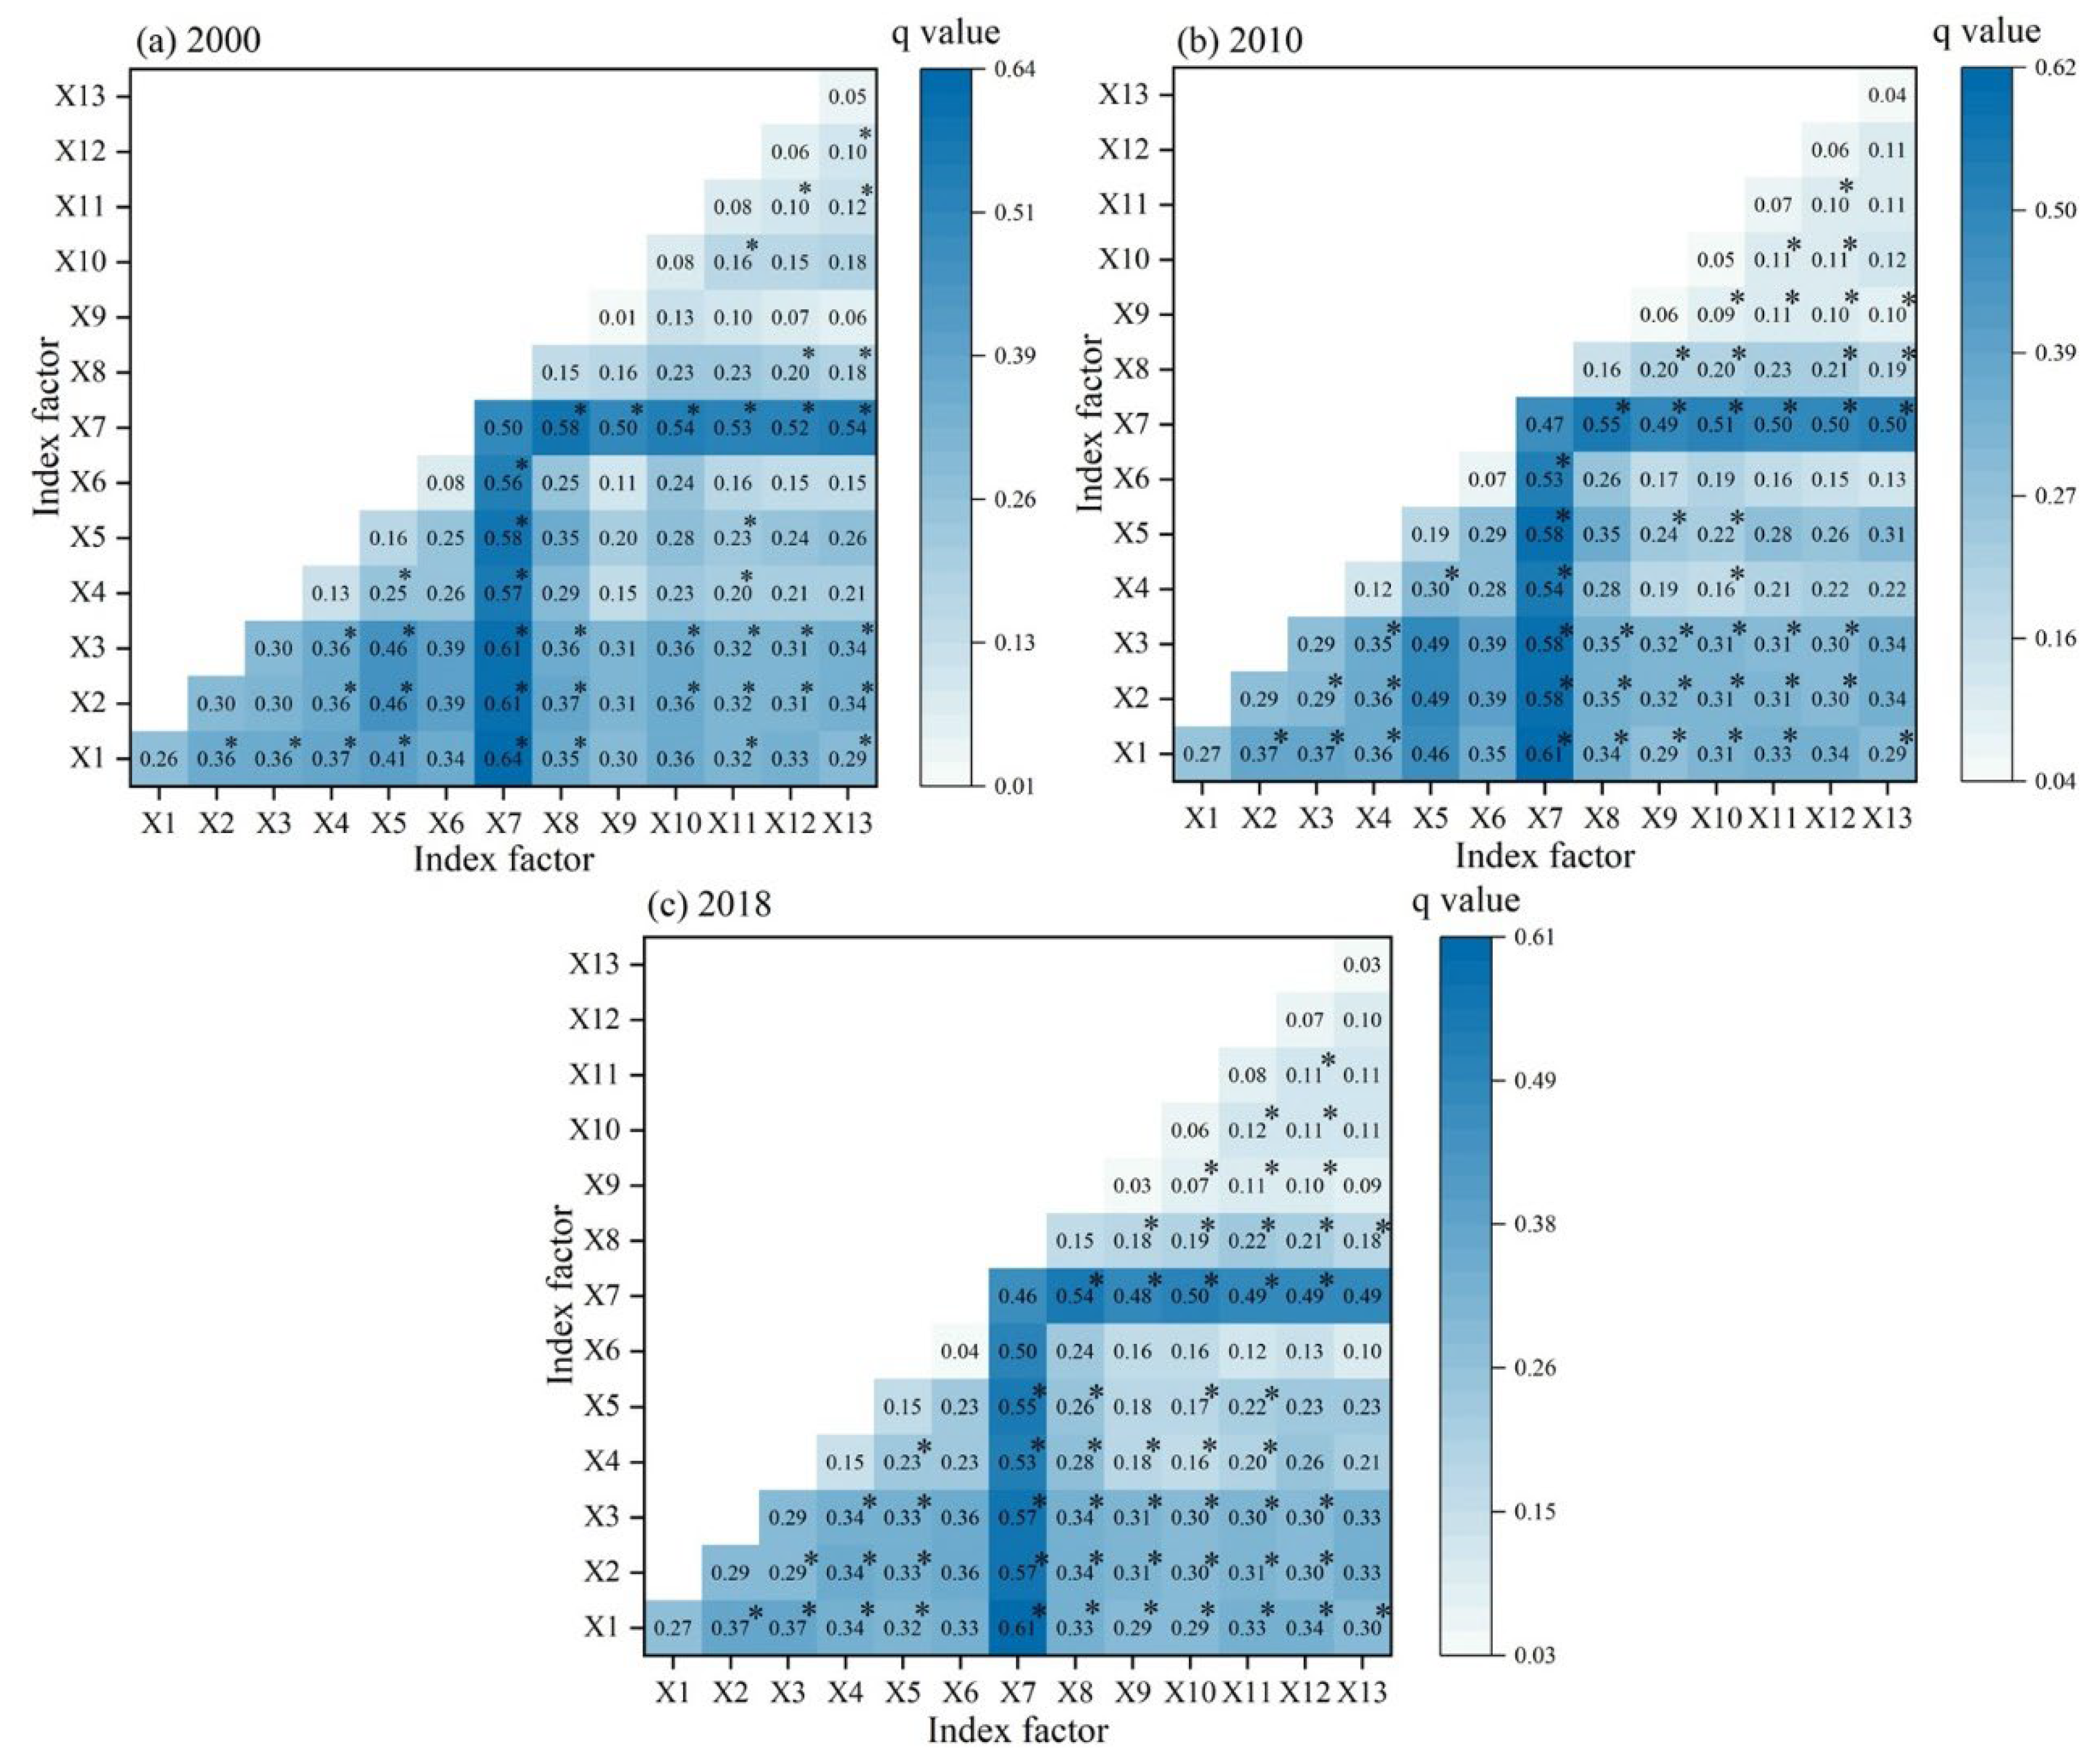
2.4.3. GeoDetector Model
3. Results
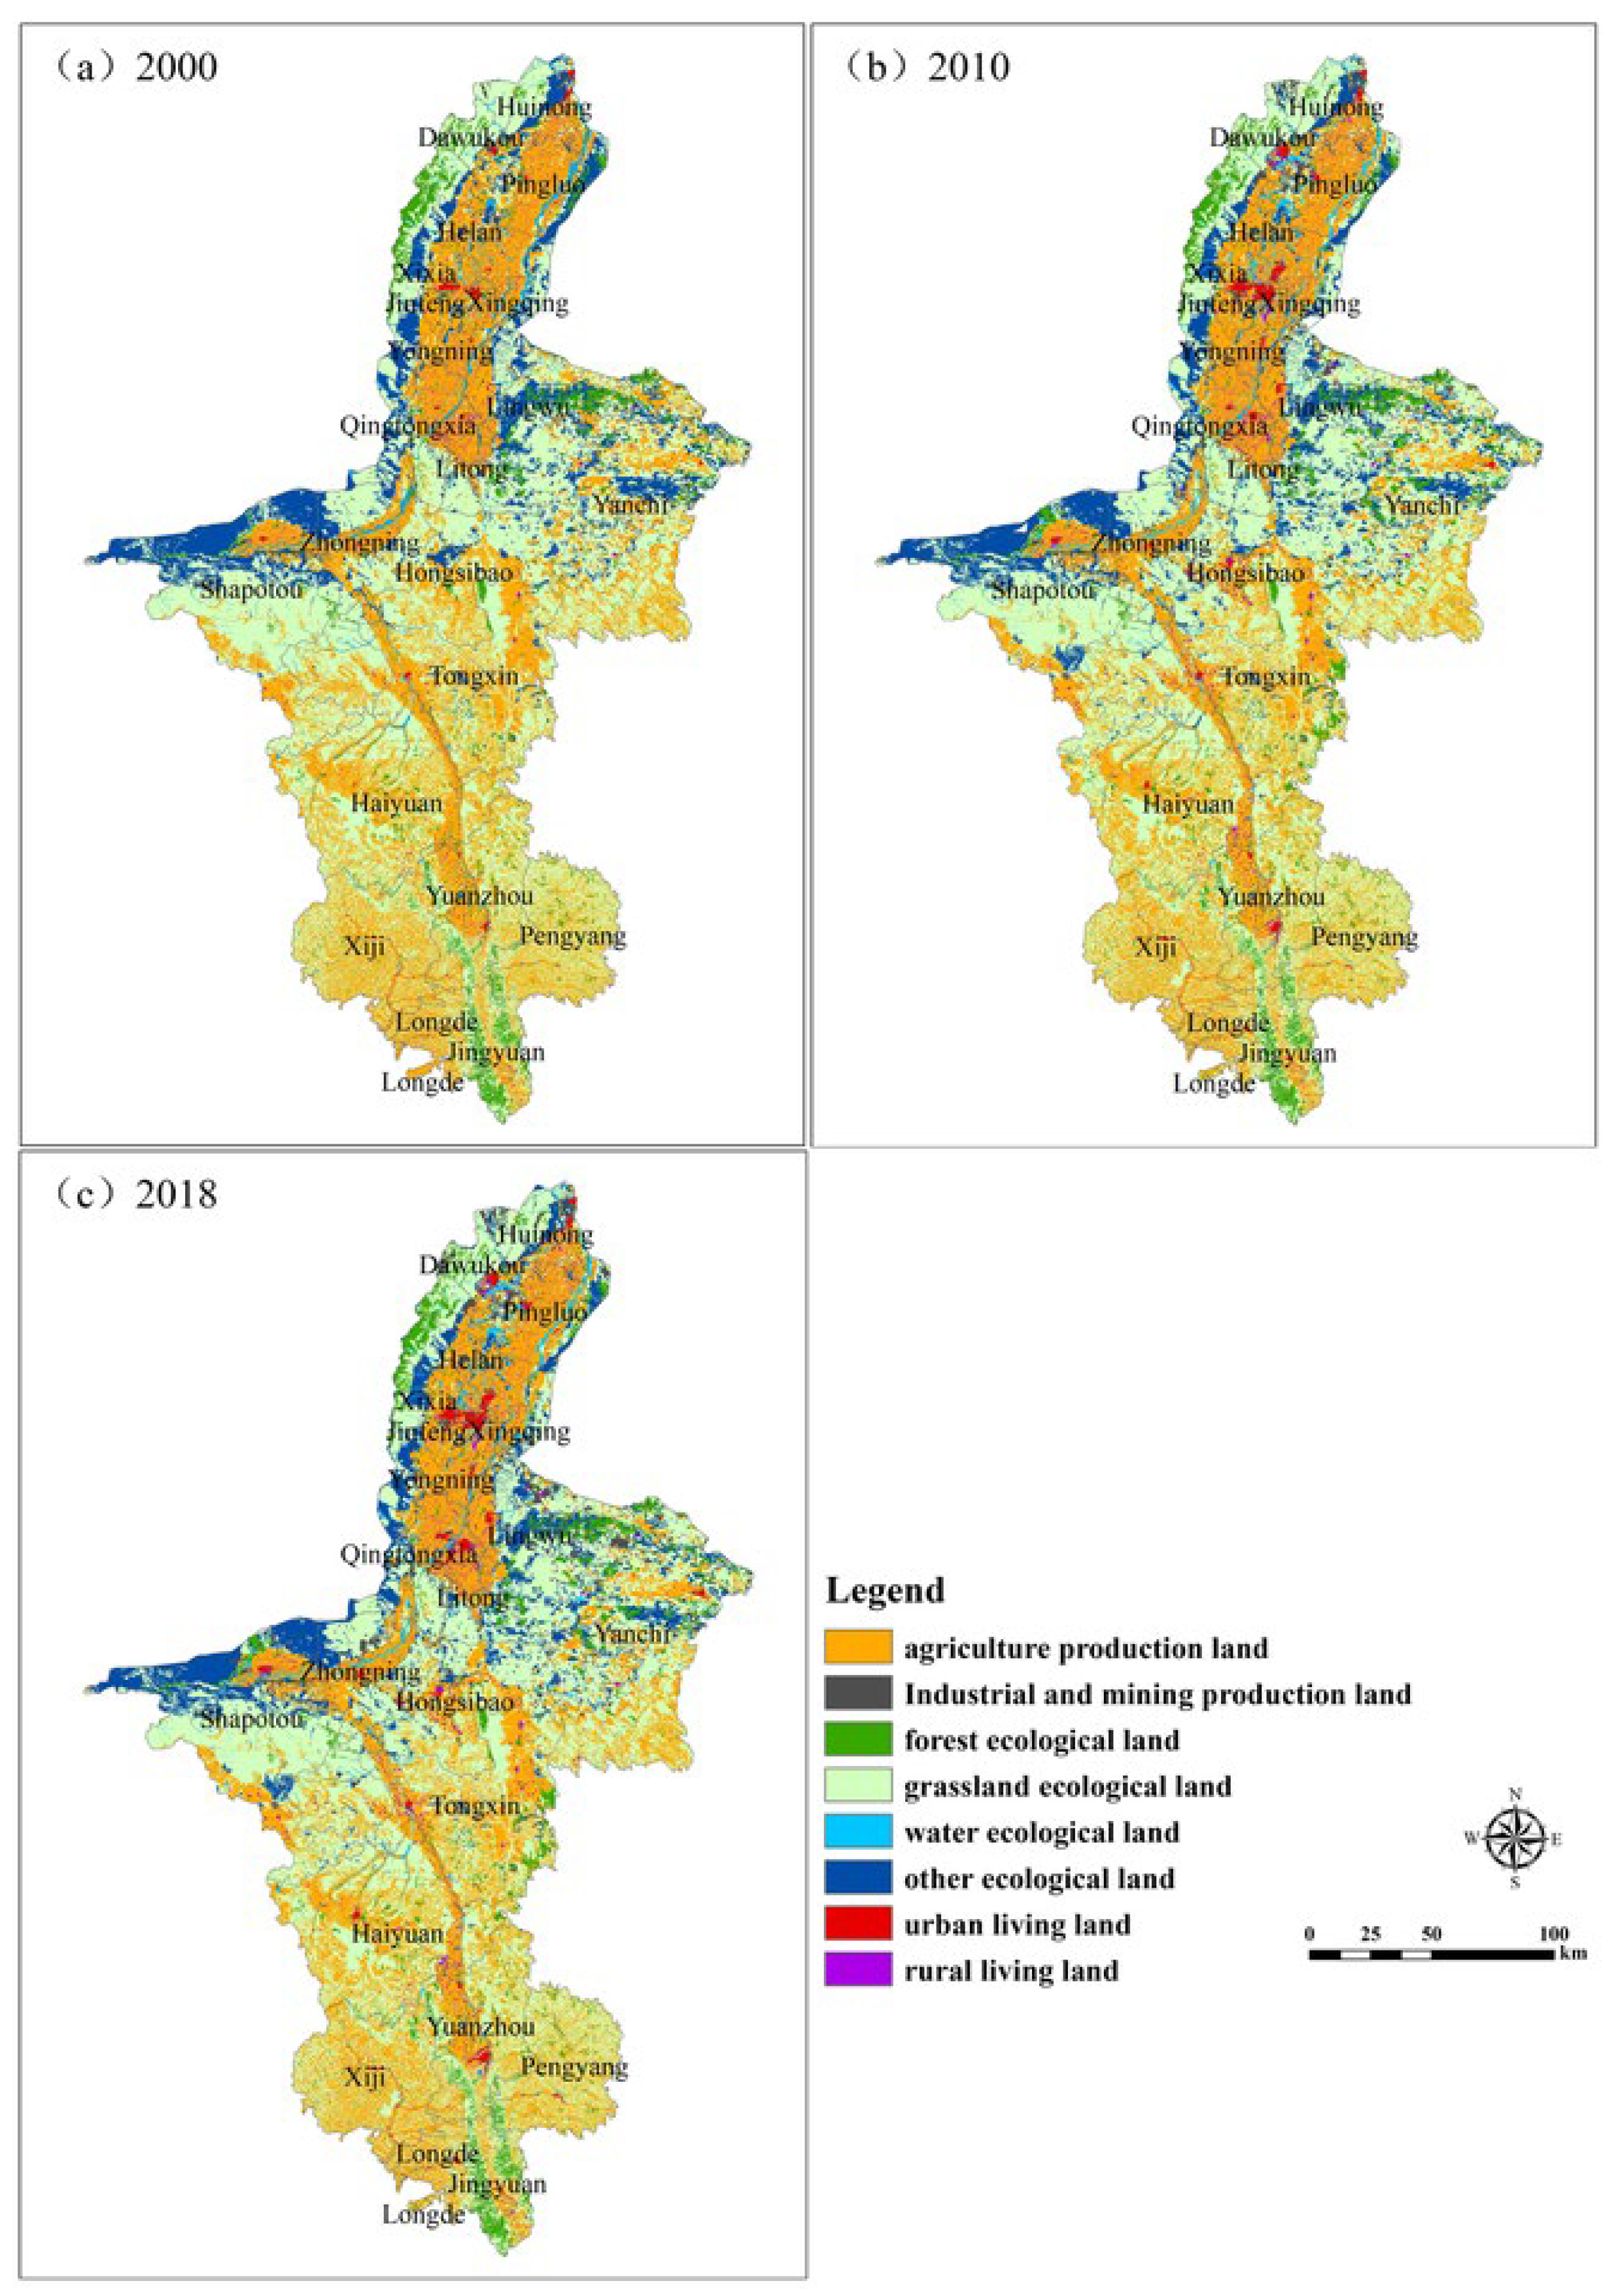
3.1. Land Use Change of PEL in Ningxia
3.1.1. PEL Land Change
3.1.2. Tupu Analysis of PEL Land in the Ningxia from 2000 to 2018
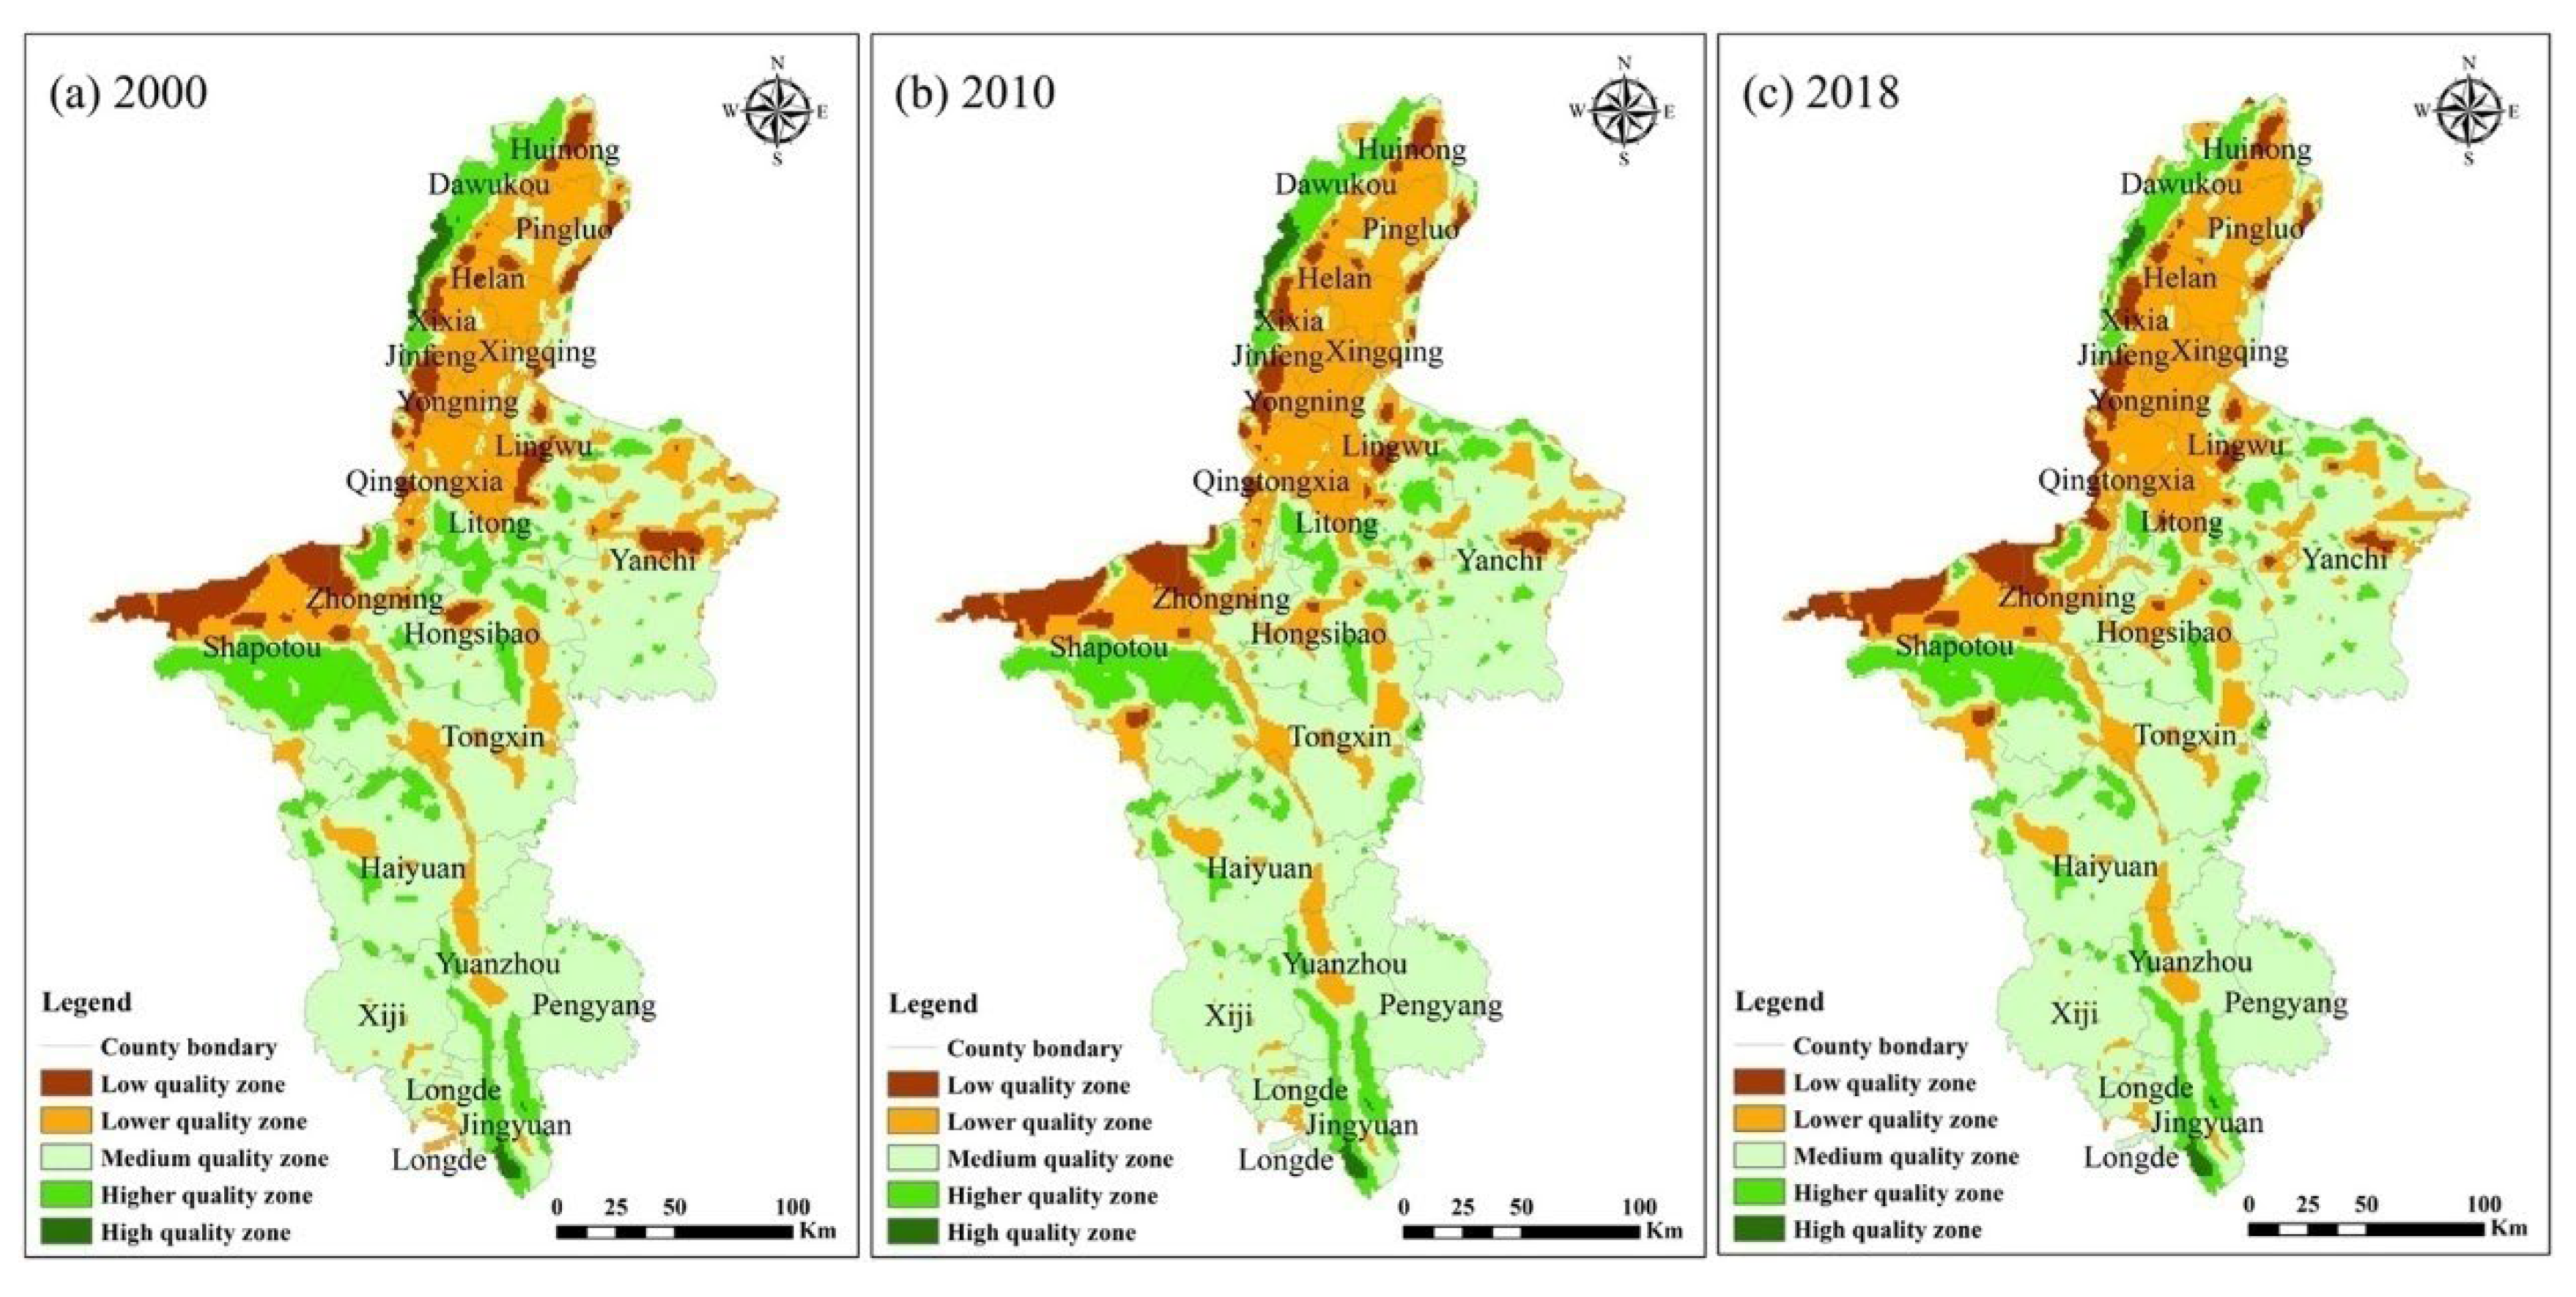
3.2. Impact of PEL Land Use Transformation on EQI in Ningxia from 2000 to 2018
3.2.1. PEL Land Use Change
3.2.2. Center of Gravity Trajectory of EQI
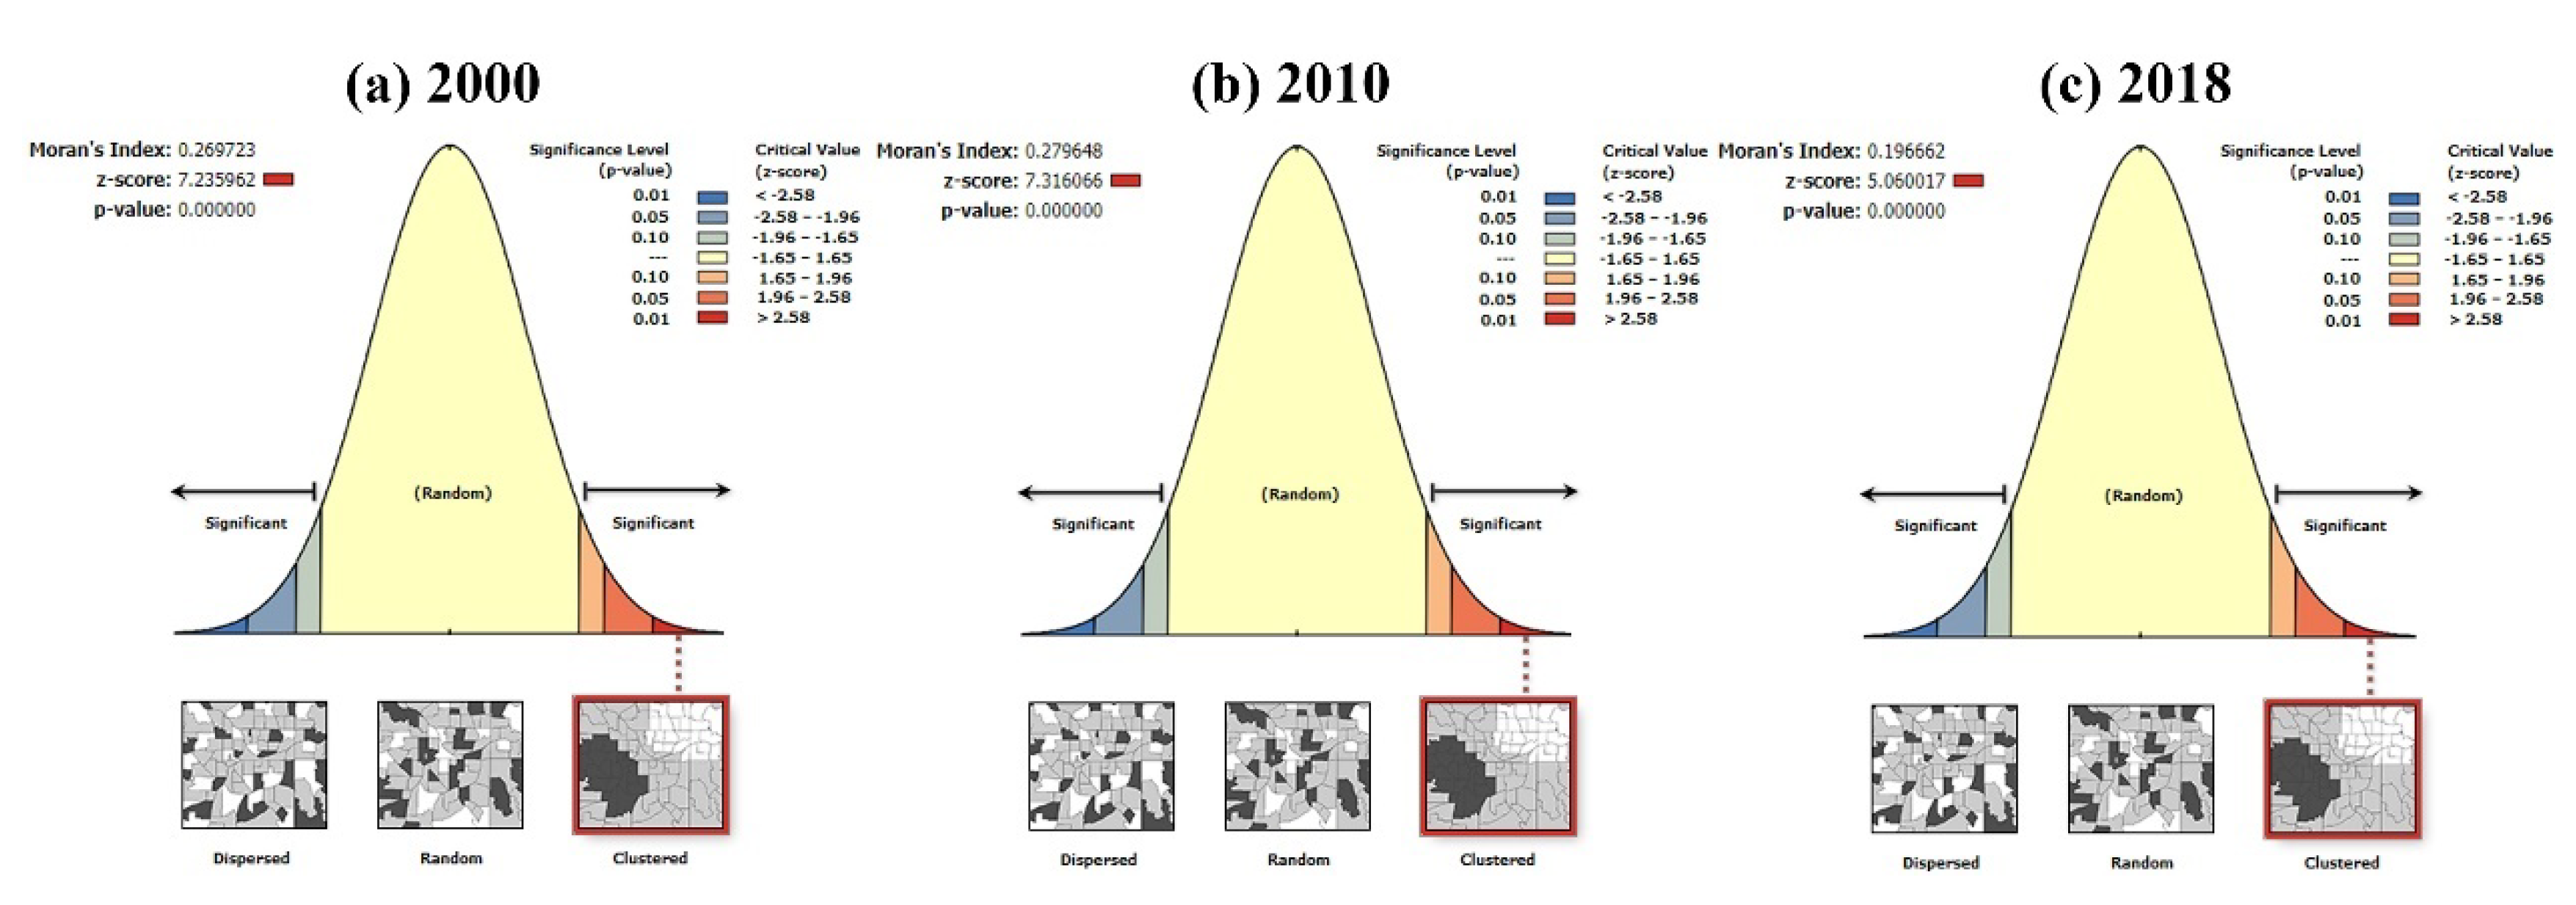
3.2.3. Evolution Characteristics of Cold and Hot Spot Patterns of EQI Change
3.3. Analysis of Driving Mechanism of EQI
3.3.1. Single Factor Contribution Rate
3.3.2. Significant Difference Analysis of Driving Factors
3.3.3. Driver Interaction Analysis
4. Discussion
4.1. EQI Change and PEL Land Use Function Change
4.2. Spatial Heterogeneity and Driving Mechanism of EQI
4.3. Policy Recommendations
5. Conclusions
Author Contributions
Funding
Institutional Review Board Statement
Informed Consent Statement
Data Availability Statement
Conflicts of Interest
References
- Varghese, N.; Singh, N.P. Linkages between land use changes, desertification and human development in the Thar Desert Region of India. Land Use Policy 2016, 51, 18–25. [Google Scholar] [CrossRef]
- Hansen, M.C.; Potapov, P.V.; Pickens, A.H.; Tyukavina, A.; Hernandez-Serna, A.; Zalles, V.; Turubanova, S.; Kommareddy, I.; Stehman, S.V.; Song, X.-P.; et al. Global land use extent and dispersion within natural land cover using Landsat data. Environ. Res. Lett. 2022, 17, 034050. [Google Scholar] [CrossRef]
- Wei, H.; Xiong, L.; Tang, G.; Strobl, J.; Xue, K. Spatial-temporal variation of land use and land cover change in the glacial affected area of the Tianshan Mountains. Catena 2021, 202, 105256. [Google Scholar] [CrossRef]
- Bajocco, S.; Smiraglia, D.; Scaglione, M.; Raparelli, E.; Salvati, L. Exploring the role of land degradation on agricultural land use change dynamics. Sci. Total Environ. 2018, 636, 1373–1381. [Google Scholar] [CrossRef]
- De Rosa, M. Land Use and Land-use Changes in Life Cycle Assessment: Green Modelling or Black Boxing? Ecol. Econ. 2018, 144, 73–81. [Google Scholar] [CrossRef]
- Simwanda, M.; Murayama, Y. Spatiotemporal patterns of urban land use change in the rapidly growing city of Lusaka, Zambia: Implications for sustainable urban development. Sustain. Cities Soc. 2018, 39, 262–274. [Google Scholar] [CrossRef]
- Shao, Y.; Jiang, Q.; Wang, C.; Wang, M.; Xiao, L.; Qi, Y. Analysis of critical land degradation and development processes and their driving mechanism in the Heihe River Basin. Sci. Total Environ. 2020, 716, 137082. [Google Scholar] [CrossRef]
- Xu, E.; Zhang, H.; Yao, L. An Elevation-Based Stratification Model for Simulating Land Use Change. Remote Sens. 2018, 10, 1730. [Google Scholar] [CrossRef] [Green Version]
- Yin, D.; Li, X.; Li, G.; Zhang, J.; Yu, H. Spatio-Temporal Evolution of Land Use Transition and Its Eco-Environmental Effects: A Case Study of the Yellow River Basin, China. Land 2020, 9, 514. [Google Scholar] [CrossRef]
- Chaudhary, S.; Wang, Y.; Dixit, A.M.; Khanal, N.R.; Xu, P.; Yan, K.; Liu, Q.; Lu, Y.; Li, M. Eco-Environmental Risk Evaluation for Land Use Planning in Areas of Potential Farmland Abandonment in the High Mountains of Nepal Himalayas. Sustainability 2019, 11, 6931. [Google Scholar] [CrossRef] [Green Version]
- Yang, Y.; Chen, J.; Lan, Y.; Zhou, G.; You, H.; Han, X.; Wang, Y.; Shi, X. Landscape Pattern and Ecological Risk Assessment in Guangxi Based on Land Use Change. Int. J. Environ. Res. Public Health 2022, 19, 1595. [Google Scholar] [CrossRef]
- Rao, Y.; Zhou, M.; Ou, G.; Dai, D.; Zhang, L.; Zhang, Z.; Nie, X.; Yang, C. Integrating ecosystem services value for sustainable land-use management in semi-arid region. J. Clean. Prod. 2018, 186, 662–672. [Google Scholar] [CrossRef]
- Verburg, P.H.; van de Steeg, J.; Veldkamp, A.; Willemen, L. From land cover change to land function dynamics: A major challenge to improve land characterization. J. Environ. Manag. 2009, 90, 1327–1335. [Google Scholar] [CrossRef]
- Long, H.; Zhang, Y.; Ma, L.; Tu, S. Land Use Transitions: Progress, Challenges and Prospects. Land 2021, 10, 903. [Google Scholar] [CrossRef]
- Long, H.; Qu, Y. Land use transitions and land management: A mutual feedback perspective. Land Use Policy 2018, 74, 111–120. [Google Scholar] [CrossRef]
- Chen, H.; Yang, Q.; Su, K.; Zhang, H.; Lu, D.; Xiang, H.; Zhou, L. Identification and Optimization of Produc-tion-Living-Ecological Space in an Ecological Foundation Area in the Upper Reaches of the Yangtze River: A Case Study of Jiangjin District of Chongqing, China. Land 2021, 10, 863. [Google Scholar] [CrossRef]
- Guo, B.; Fang, Y.; Jin, X.; Zhou, Y. Monitoring the effects of land consolidation on the ecological environmental quality based on remote sensing: A case study of Chaohu Lake Basin, China. Land Use Policy 2020, 95, 104569. [Google Scholar] [CrossRef]
- Robati, M.; Monavari, S.M.; Majedi, H. Urban environment quality assessment by using composite index model. Environ. Prog. Sustain. Energy 2015, 34, 1473–1480. [Google Scholar] [CrossRef]
- Yang, X.; Liu, S.; Jia, C.; Liu, Y.; Yu, C. Vulnerability assessment and management planning for the ecological environment in urban wetlands. J. Environ. Manag. 2021, 298, 113540. [Google Scholar] [CrossRef] [PubMed]
- Yang, T.; Zhang, Q.; Wan, X.; Li, X.; Wang, Y.; Wang, W. Comprehensive ecological risk assessment for semi-arid basin based on conceptual model of risk response and improved TOPSIS model-a case study of Wei River Basin, China. Sci. Total Environ. 2020, 719, 137502. [Google Scholar] [CrossRef]
- Pettorelli, N.; Vik, J.O.; Mysterud, A.; Gaillard, J.-M.; Tucker, C.J.; Stenseth, N.C. Using the satellite-derived NDVI to assess ecological responses to environmental change. Trends Ecol. Evol. 2005, 20, 503–510. [Google Scholar] [CrossRef]
- Balzan, M.V.; Caruana, J.; Zammit, A. Assessing the capacity and flow of ecosystem services in multifunctional landscapes: Evidence of a rural-urban gradient in a Mediterranean small island state. Land Use Policy 2018, 75, 711–725. [Google Scholar] [CrossRef]
- Zhu, D.; Chen, T.; Wang, Z.; Niu, R. Detecting ecological spatial-temporal changes by Remote Sensing Ecological Index with local adaptability. J. Environ. Manag. 2021, 299, 113655. [Google Scholar] [CrossRef] [PubMed]
- Pan, N.; Guan, Q.; Wang, Q.; Sun, Y.; Li, H.; Ma, Y. Spatial Differentiation and Driving Mechanisms in Ecosystem Service Value of Arid Region: A case study in the middle and lower reaches of Shule River Basin, NW China. J. Clean. Prod. 2021, 319, 128718. [Google Scholar] [CrossRef]
- Liu, Y.; Huang, X.; Yang, H.; Zhong, T. Environmental effects of land-use/cover change caused by urbanization and policies in Southwest China Karst area—A case study of Guiyang. Habitat Int. 2014, 44, 339–348. [Google Scholar] [CrossRef]
- Zhang, S.; Yang, P.; Xia, J.; Qi, K.; Wang, W.; Cai, W.; Chen, N. Research and Analysis of Ecological Environment Quality in the Middle Reaches of the Yangtze River Basin between 2000 and 2019. Remote Sens. 2021, 13, 4475. [Google Scholar] [CrossRef]
- Chen, Y.; Xu, F. The optimization of ecological service function and planning control of territorial space planning for ecological protection and restoration. Sustain. Comput. Inform. Syst. 2022, 35, 100748. [Google Scholar] [CrossRef]
- Yi, L.; Chen, J.; Jin, Z.; Quan, Y.; Han, P.; Guan, S.; Jiang, X. Impacts of human activities on coastal ecological environment during the rapid urbanization process in Shenzhen, China. Ocean Coast. Manag. 2018, 154, 121–132. [Google Scholar] [CrossRef]
- Wang, J.-F.; Zhang, T.-L.; Fu, B.-J. A measure of spatial stratified heterogeneity. Ecol. Indic. 2016, 67, 250–256. [Google Scholar] [CrossRef]
- Zhao, Y.; Deng, Q.; Lin, Q.; Zeng, C.; Zhong, C. Cadmium source identification in soils and high-risk regions predicted by geographical detector method. Environ. Pollut. 2020, 263, 114338. [Google Scholar] [CrossRef]
- Jia, W.-J.; Wang, M.-F.; Zhou, C.-H.; Yang, Q.-H. Analysis of the spatial association of geographical detector-based landslides and environmental factors in the southeastern Tibetan Plateau, China. PLoS ONE 2021, 16, e0251776. [Google Scholar] [CrossRef]
- Wang, X.; Meng, Q.; Zhang, L.; Hu, D. Evaluation of urban green space in terms of thermal environmental benefits using geographical detector analysis. Int. J. Appl. Earth Obs. Geoinf. 2021, 105, 102610. [Google Scholar] [CrossRef]
- Liu, Y.; Cao, X.; Li, T. Identifying Driving Forces of Built-Up Land Expansion Based on the Geographical Detector: A Case Study of Pearl River Delta Urban Agglomeration. Int. J. Environ. Res. Public Health 2020, 17, 1759. [Google Scholar] [CrossRef] [PubMed] [Green Version]
- Wang, J.F.; Hu, Y. Environmental health risk detection with GeogDetector. Environ. Model. Softw. 2012, 33, 114–115. [Google Scholar] [CrossRef]
- Xu, J.; Wang, S.; Xiao, Y.; Xie, G.; Wang, Y.; Zhang, C.; Li, P.; Lei, G. Mapping the spatiotemporal heterogeneity of ecosystem service relationships and bundles in Ningxia, China. J. Clean. Prod. 2021, 294, 126216. [Google Scholar] [CrossRef]
- Chen, W.; Zhao, H.; Li, J.; Zhu, L.; Wang, Z.; Zeng, J. Land use transitions and the associated impacts on ecosystem services in the Middle Reaches of the Yangtze River Economic Belt in China based on the geo-informatic Tupu method. Sci. Total Environ. 2020, 701, 134690. [Google Scholar] [CrossRef] [PubMed]
- Sudhira, H.S.; Ramachandra, T.V.; Jagadish, K.S. Urban sprawl: Metrics, dynamics and modelling using GIS. Int. J. Appl. Earth Obs. Geoinf. 2004, 5, 29–39. [Google Scholar] [CrossRef]
- Wang, Y.; Xia, T.; Shataer, R.; Zhang, S.; Li, Z. Analysis of Characteristics and Driving Factors of Land-Use Changes in the Tarim River Basin from 1990 to 2018. Sustainability 2021, 13, 10263. [Google Scholar] [CrossRef]
- Zenglin, H.; Qiqi, M.; Xiaolu, Y.; Wenzhen, Z. Spatial and temporal relationships between land use intensity and the value of Ecosystem Services in northern Liaodong Bay over the past 30 years. Acta Ecol. Sin. 2020, 40, 2555–2566. [Google Scholar]
- Gao, S.; Dong, G.; Jiang, X.; Nie, T.; Yin, H.; Guo, X. Quantification of Natural and Anthropogenic Driving Forces of Vegetation Changes in the Three-River Headwater Region during 1982–2015 Based on Geographical Detector Model. Remote Sens. 2021, 13, 4175. [Google Scholar] [CrossRef]
- Liu, C.; Wang, C.; Li, Y.; Wang, Y. Spatiotemporal differentiation and geographic detection mechanism of ecological security in Chongqing, China. Glob. Ecol. Conserv. 2022, 35, e02072. [Google Scholar] [CrossRef]
- Peng, W.; Kuang, T.; Tao, S. Quantifying influences of natural factors on vegetation NDVI changes based on geographical detector in Sichuan, western China. J. Clean. Prod. 2019, 233, 353–367. [Google Scholar] [CrossRef]
- Zhou, T.; Shen, W.; Qiu, X.; Chang, H.; Yang, H.; Yang, W. Impact evaluation of a payments for ecosystem services program on vegetation quantity and quality restoration in Inner Mongolia. J. Environ. Manag. 2021, 303, 114113. [Google Scholar] [CrossRef]
- Xu, Z.; Wei, H.; Fan, W.; Wang, X.-C.; Huang, B.; Lu, N.; Ren, J.; Dong, X. Energy modeling simulation of changes in ecosystem services before and after the implementation of a Grain-for-Green program on the Loess Plateau—A case study of the Zhifanggou valley in Ansai County, Shaanxi Province, China. Ecosyst. Serv. 2018, 31, 32–43. [Google Scholar] [CrossRef]
- Li, W.; Wang, D.; Li, H.; Liu, S. Urbanization-induced site condition changes of peri-urban cultivated land in the black soil region of northeast China. Ecol. Indic. 2017, 80, 215–223. [Google Scholar] [CrossRef]
- Fei, L.; Shuwen, Z.; Jiuchun, Y.; Liping, C.; Haijuan, Y.; Kun, B. Effects of land use change on ecosystem services value in West Jilin since the reform and opening of China. Ecosyst. Serv. 2018, 31, 12–20. [Google Scholar] [CrossRef]
- Talukdar, S.; Singha, P.; Mahato, S.; Praveen, B.; Rahman, A. Dynamics of ecosystem services (ESs) in response to land use land cover (LU/LC) changes in the lower Gangetic plain of India. Ecol. Indic. 2020, 112, 106121. [Google Scholar] [CrossRef]
- Luiz, O.R.; Mariano, E.B.; da Silva, H.M.R. Pro-Poor Innovations to Promote Instrumental Freedoms: A Systematic Literature Review. Sustainability 2021, 13, 13587. [Google Scholar] [CrossRef]
- Chen, T.; Feng, Z.; Zhao, H.; Wu, K. Identification of ecosystem service bundles and driving factors in Beijing and its sur-rounding areas. Sci. Total Environ. 2020, 711, 134687. [Google Scholar] [CrossRef]
- Hu, P.; Li, F.; Sun, X.; Liu, Y.; Chen, X.; Hu, D. Assessment of Land-Use/Cover Changes and Its Ecological Effect in Rapidly Urbanized Areas—Taking Pearl River Delta Urban Agglomeration as a Case. Sustainability 2021, 13, 5075. [Google Scholar] [CrossRef]
- Han, X.; Wang, P.; Wang, J.; Qiao, M.; Zhao, X. Evaluation of human-environment system vulnerability for sustainable de-velopment in the Liupan mountainous region of Ningxia, China. Environ. Dev. 2020, 34, 100525. [Google Scholar] [CrossRef]
- Li, Q.; Zhang, X.; Liu, Q.; Liu, Y.; Ding, Y.; Zhang, Q. Impact of Land Use Intensity on Ecosystem Services: An Example from the Agro-Pastoral Ecotone of Central Inner Mongolia. Sustainability 2017, 9, 1030. [Google Scholar] [CrossRef] [Green Version]
- Lian, X. Review on Advanced Practice of Provincial Spatial Planning: Case of a Western, Less Developed Province. Int. Rev. Spat. Plan. Sustain. Dev. 2018, 6, 185–202. [Google Scholar] [CrossRef] [Green Version]




| PEL Land Classification | Secondary Classification | Environment Quality Index | ||
|---|---|---|---|---|
| Class I | Class II | Code | ||
| Production | Agricultural production land (APL) | 1 | Paddy field, Arid field | 0.28 |
| Industrial and mining production land (IMPL) | 2 | Industrial and construction land | 0.10 | |
| Ecological | Forest ecological land (FEL) | 3 | Forestland, Shrub land, Sparse forestland, Other forestlands | 0.75 |
| Grassland ecological land (GEL) | 4 | High, medium and low coverage grassland | 0.55 | |
| Water ecological land (WEL) | 5 | Rivers, lakes, reservoirs, ponds, glaciers and snow | 0.65 | |
| Other ecological land (OEL) | 6 | Sandy land, Gobi, saline alkali land, bare land, etc | 0.02 | |
| Living | Urban living land (ULL) | 7 | Urban land | 0.20 |
| Rural living land (RLL) | 8 | Rural residential land | 0.20 | |
| Primary Index | Secondary Index | Specific Indexes | Unit | Reference |
|---|---|---|---|---|
| Natural environment | Topographic factors | Altitude (X1) | m | [24,32,40,41,42] |
| Slope (X2) | ° | |||
| Relief amplitude (X3) | m | |||
| Climatic factors | Temperature (X4) | °C | ||
| Precipitation (X5) | mm | |||
| Land factors | NDVI (X6) | Dimensionless | ||
| Land use intensity (X7) | Dimensionless | |||
| Soil type (X8) | Dimensionless | |||
| Socioeconomic | Social factors | Population density (X9) | Person/km2 | |
| Per capita GDP (X10) | 10,000 yuan/km2 | |||
| Location | Location factors | Distance from railway (X11) | km | |
| Distance from highways (X12) | km | |||
| Distance from river (X13) | km |
| PEL Land | Classification | 2000 | 2010 | 2018 |
|---|---|---|---|---|
| Production | APL | 23,751.2 | 22,798.5 | 22,989.9 |
| IMPL | 101.4 | 492.7 | 919.9 | |
| Total | 23,852.6 | 23,291.2 | 23,909.8 | |
| Ecology | FEL | 3075.8 | 3577.7 | 3525.9 |
| GEL | 30,526.7 | 30,228.8 | 29,544.0 | |
| WEL | 1195.1 | 1244.4 | 1299.9 | |
| OEL | 6586.4 | 6376.4 | 6313.6 | |
| Total | 41,384.0 | 41,427.3 | 40,683.4 | |
| Live | ULL | 163.5 | 386.3 | 493.5 |
| RLL | 999.9 | 1295.2 | 1313.3 | |
| Total | 1163.4 | 1681.5 | 1806.8 |
| 2000–2010 | 2010–2018 | ||||
|---|---|---|---|---|---|
| Code | Transformation Area/km2 | Change Ratio/% | Code | Transformation Area/km2 | Change Ratio/% |
| 1-4 | 1377.69 | 23.21 | 4-1 | 864.78 | 22.11 |
| 4-1 | 1020.45 | 17.19 | 1-4 | 663.61 | 16.97 |
| 6-4 | 348.03 | 5.86 | 4-6 | 342.63 | 8.76 |
| 4-6 | 344.02 | 5.80 | 4-2 | 305.45 | 7.81 |
| 4-3 | 343.31 | 5.78 | 6-1 | 204.16 | 5.22 |
| 1-6 | 322.02 | 5.43 | 6-4 | 174.32 | 4.46 |
| 1-8 | 277.12 | 4.67 | 6-2 | 118.53 | 3.03 |
| 6-1 | 267.19 | 4.50 | 1-8 | 117.08 | 2.99 |
| 4-2 | 204.92 | 3.45 | 4-3 | 101.65 | 2.60 |
| 1-3 | 189.57 | 3.19 | 3-4 | 89.57 | 2.29 |
| Total | 4694.31 | 79.09 | Total | 2981.79 | 76.25 |
| Quality Zoning | 2000 | 2010 | 2018 | |||
|---|---|---|---|---|---|---|
| Area km2 | Ratio % | Area km2 | Ratio % | Area km2 | Ratio % | |
| Lower quality area | 3923.29 | 5.91 | 3329.07 | 5.01 | 3426.91 | 5.16 |
| Low quality area | 16,122.71 | 24.28 | 16,948.42 | 25.52 | 17,826.62 | 26.85 |
| Medium quality area | 36,937.15 | 55.63 | 37,225.91 | 56.06 | 37,070.79 | 55.83 |
| High quality area | 8941.95 | 13.46 | 8421.71 | 12.68 | 777.37 | 11.71 |
| Higher quality area | 474.90 | 0.72 | 474.90 | 0.72 | 298.30 | 0.45 |
| X1 | X2 | X3 | X4 | X5 | X6 | X7 | X8 | X9 | X10 | X11 | X12 | X13 | |
|---|---|---|---|---|---|---|---|---|---|---|---|---|---|
| X1 | |||||||||||||
| X2 | YYY | ||||||||||||
| X3 | YYY | NNN | |||||||||||
| X4 | YYY | YYY | YYY | ||||||||||
| X5 | YYY | YYY | YYY | YYN | |||||||||
| X6 | YYY | YYY | YYY | YYY | YYY | ||||||||
| X7 | YYY | YYY | YYY | YYY | YYY | YYY | |||||||
| X8 | YYY | YYY | YYY | YYN | YYN | YYY | YYY | ||||||
| X9 | YYY | YYY | YYY | YYY | YYY | YNN | YYY | YYY | |||||
| X10 | YYY | YYY | YYY | YYY | YYY | NNY | YYY | YYY | YNY | ||||
| X11 | YYY | YYY | YYY | YYY | YYY | NNY | YYY | YYY | YNY | NNY | |||
| X12 | YYY | YYY | YYY | YYY | YYY | YNY | YYY | YYY | YNY | YNN | YNN | ||
| X13 | YYY | YYY | YYY | YYY | YYY | YYN | YYY | YYY | YYN | YNY | YYY | NYY |
| Pattern | 2000–2010 | 2010–2018 | ||||
|---|---|---|---|---|---|---|
| Functional Transformation | Index Movement | Contribution Ratio/% | Functional Transformation | Index Movement | Contribution Ratio/% | |
| Ecological environment improvement | 1–4 | 0.00575 | 44.42 | 1–4 | 0.00277 | 43.68 |
| 6–4 | 0.00240 | 18.51 | 6–4 | 0.00120 | 18.93 | |
| 1–3 | 0.00126 | 9.73 | 6–1 | 0.00055 | 8.73 | |
| 6–3 | 0.00103 | 7.97 | 1–5 | 0.00033 | 5.16 | |
| 4–3 | 0.00085 | 6.55 | 1–3 | 0.00030 | 4.81 | |
| 6–1 | 0.00072 | 5.60 | 6–3 | 0.00027 | 4.31 | |
| Total | 0.01201 | 92.80 | Total | 0.00543 | 85.62 | |
| Deterioration of ecological environment | 4–1 | −0.00426 | 34.18 | 4–1 | −0.00361 | 33.11 |
| 4–6 | −0.00237 | 19.01 | 4–6 | −0.00236 | 21.64 | |
| 4–2 | −0.00150 | 12.07 | 4–2 | −0.00224 | 20.56 | |
| 1–6 | −0.00087 | 7.01 | 3–1 | −0.00048 | 4.42 | |
| 1–7 | −0.00067 | 5.36 | 3–6 | −0.00042 | 3.86 | |
| 3–1 | −0.00064 | 5.17 | 1–7 | −0.00031 | 2.85 | |
| Total | −0.01031 | 82.80 | Total | −0.00942 | 86.45 | |
Publisher’s Note: MDPI stays neutral with regard to jurisdictional claims in published maps and institutional affiliations. |
© 2022 by the authors. Licensee MDPI, Basel, Switzerland. This article is an open access article distributed under the terms and conditions of the Creative Commons Attribution (CC BY) license (https://creativecommons.org/licenses/by/4.0/).
Share and Cite
Xu, Y.; Li, P.; Pan, J.; Zhang, Y.; Dang, X.; Cao, X.; Cui, J.; Yang, Z. Eco-Environmental Effects and Spatial Heterogeneity of “Production-Ecology-Living” Land Use Transformation: A Case Study for Ningxia, China. Sustainability 2022, 14, 9659. https://doi.org/10.3390/su14159659
Xu Y, Li P, Pan J, Zhang Y, Dang X, Cao X, Cui J, Yang Z. Eco-Environmental Effects and Spatial Heterogeneity of “Production-Ecology-Living” Land Use Transformation: A Case Study for Ningxia, China. Sustainability. 2022; 14(15):9659. https://doi.org/10.3390/su14159659
Chicago/Turabian StyleXu, Yaotao, Peng Li, Jinjin Pan, Yi Zhang, Xiaohu Dang, Xiaoshu Cao, Junfang Cui, and Zhi Yang. 2022. "Eco-Environmental Effects and Spatial Heterogeneity of “Production-Ecology-Living” Land Use Transformation: A Case Study for Ningxia, China" Sustainability 14, no. 15: 9659. https://doi.org/10.3390/su14159659
APA StyleXu, Y., Li, P., Pan, J., Zhang, Y., Dang, X., Cao, X., Cui, J., & Yang, Z. (2022). Eco-Environmental Effects and Spatial Heterogeneity of “Production-Ecology-Living” Land Use Transformation: A Case Study for Ningxia, China. Sustainability, 14(15), 9659. https://doi.org/10.3390/su14159659


