Article

The Landscape Pattern Evolution of Typical Open-Pit Coal Mines Based on Land Use in Inner Mongolia of China during 20 Years

1
Land Consolidation and Rehabilitation Center, Ministry of Natural Resources, Beijing 100035, China
2
School of Land Science and Technology, China University of Geosciences (Beijing), Beijing 100083, China
*
Authors to whom correspondence should be addressed.
Sustainability 2022, 14(15), 9590; https://doi.org/10.3390/su14159590
Submission received: 17 June 2022 / Revised: 31 July 2022 / Accepted: 2 August 2022 / Published: 4 August 2022
(This article belongs to the Special Issue Land Use Sustainability and Environmental Impacts in Urban Renewal)

Abstract

:
As the province most abundant in mineral resources in China, Inner Mongolia has more than 200 open-pit coal mines. The coal mining activities seriously hinder the sustainable use of regional land and the improvement of residents’ wellbeing. Taking 13 typical open-pit coal mines of Inner Mongolia as the study area, combining remote sensing images and the Google Earth Engine (GEE) platform, the trend features of spatial and temporal evolution of land use and landscape patterns from 2001 to 2020 were analyzed by transfer matrix and landscape pattern index methods. According to the mining plan and reclamation measures of the “Land Reclamation Plan”, the impacts of ecological restoration projects on land-use structure and landscape patterns were evaluated. The results showed that the following: (1) The landscape types of typical open-pit coal mining areas were mainly grassland, cropland, and industrial landscapes. The change trend of landscape pattern was obvious over the past 20 years, and the changes in grassland and mining land were relatively large, which decreased by 56.51 km2 and increased by 60.42 km2, respectively. (2) Land reclamation and ecological restoration projects had positive impacts on landscape pattern changes. With the transformation from mining activities to land reclamation activities beginning in 2007, nearly 70% of the study area showed a decreasing trend in landscape fragmentation, indicating a better landscape pattern of mining area. (3) Positive policy orientation of mine ecological restoration promoted more reasonable landscape patterns.

1. Introduction

The development and utilization of mineral resources greatly promotes social and economic development, accompanied by the ecological and environmental degradation caused by unreasonable resource exploitation. As the largest developing country in the world, China’s exploitation and utilization of coal resources has made great contributions to the rapid economic growth in the process of industrialization. According to statistics, 72% of China’s industrial raw materials, 62% of its electric power, and 52% of its chemical raw materials are from coal resources [1]. However, frequent mining activities since the 20th century—especially open-pit mining—have caused dramatic changes to the original ecological landscape pattern. On the one hand, due to excavation, collapse, occupation, and other human factors, open-pit mining has caused serious land destruction and exacerbated the shortage of land resources in China. On the other hand, environmental problems such as water pollution and air pollution caused by mining have had a great impact on the quality of life of residents around the mining area [2]. Among all of the open-pit mines, grassland coal mining has had a particularly serious impact on surface vegetation, due to its wide range and strong damage [3,4].
Nearly 90% of China’s coal resources are distributed in arid and semi-arid areas with a fragile ecological environment [5]. These areas are mainly located in Inner Mongolia. As one of the most prominent areas of desertification in China [6], Inner Mongolia’s exploitation of open-pit coal mines has caused changes in its surface landscape, resulting in grassland degradation, desertification, and salinization. The natural background of vulnerability and regional climate change overlaps with unreasonable human land-utilization modes such as overgrazing, mineral exploitation, and grassland reclamation, making soil erosion and land desertification more serious in the region. The shortage of water resources has led to a series of serious ecological problems, such as river closures and drying-up of lakes [7,8,9]. The decline in land ecological service quality has greatly restricted the high-quality development of the region.
In recent years, there has been a global consensus on mine utilization and protection, focusing on the restoration of damaged ecosystems and improving the carbon sink capacity of natural ecosystems to address climate change risks. Since the enactment of the Land Reclamation Regulations in 2011, China has made policy directives imposing ecological restoration requirements for mining activities, e.g., to limit land damage. The regulations state that the obligor of land damaged by solid waste or activities such as open-pit mining, stacking–mining–stripping, waste rock, slag, fly ash, or anything occupying the land has an obligation to reclaim the land. According to the requirements of regulations and policies, the holders of mining rights must compile a “Land Reclamation Plan”, which is treated as a precondition for the application for mining rights. Since 2012, China has put forward the concept of ecological civilization construction, emphasizing overall protection, systematic restoration, and comprehensive management of ecosystems. A series of large-scale ecological restoration projects such as the “Three-North Shelterbelt Project” and the “Mountain-River-Forest-Farmland-Lake-Grass Project” have been implemented. In this background, research on evaluating the effects of implementation of ecological restoration projects in open-pit coal mines from the perspective of land use has not been carried out. The traditional method of monitoring land-use changes in mining areas is usually based on tracking surveys, which are often limited to small-scale studies due to human and time constraints. Remote sensing can break through these limitations, enabling analysis of the land-use changes of large-scale and long-term time series. By comparing and analyzing the land-use changes in different periods, it is possible to reveal certain land-use change rules, and to provide technical reference for guiding the land use and ecosystem management in mining areas. At present, there are few studies on long-term land-use monitoring in mining areas. Especially due to the lack of historical remote sensing images, it is difficult to carry out quantitative analysis of historical and current land-use changes in open-pit coal mines. In this study, typical open-pit coal mines in Inner Mongolia, China, were selected for analysis and discussion. Based on the Google Earth Engine platform and remote sensing images, the dynamic evolution characteristics of land use in mining areas over the past 20 years were analyzed. The impacts of ecological restoration projects on land use and landscape patterns were also assessed. This study aims to provide a large-scale mining area land-use and -cover information extraction method for scientific adjustment of land-use structure, to analyze the changes to damaged mining ecosystems in long time-series, and to evaluate the effectiveness of ecological restoration projects.

2. Materials and Methods
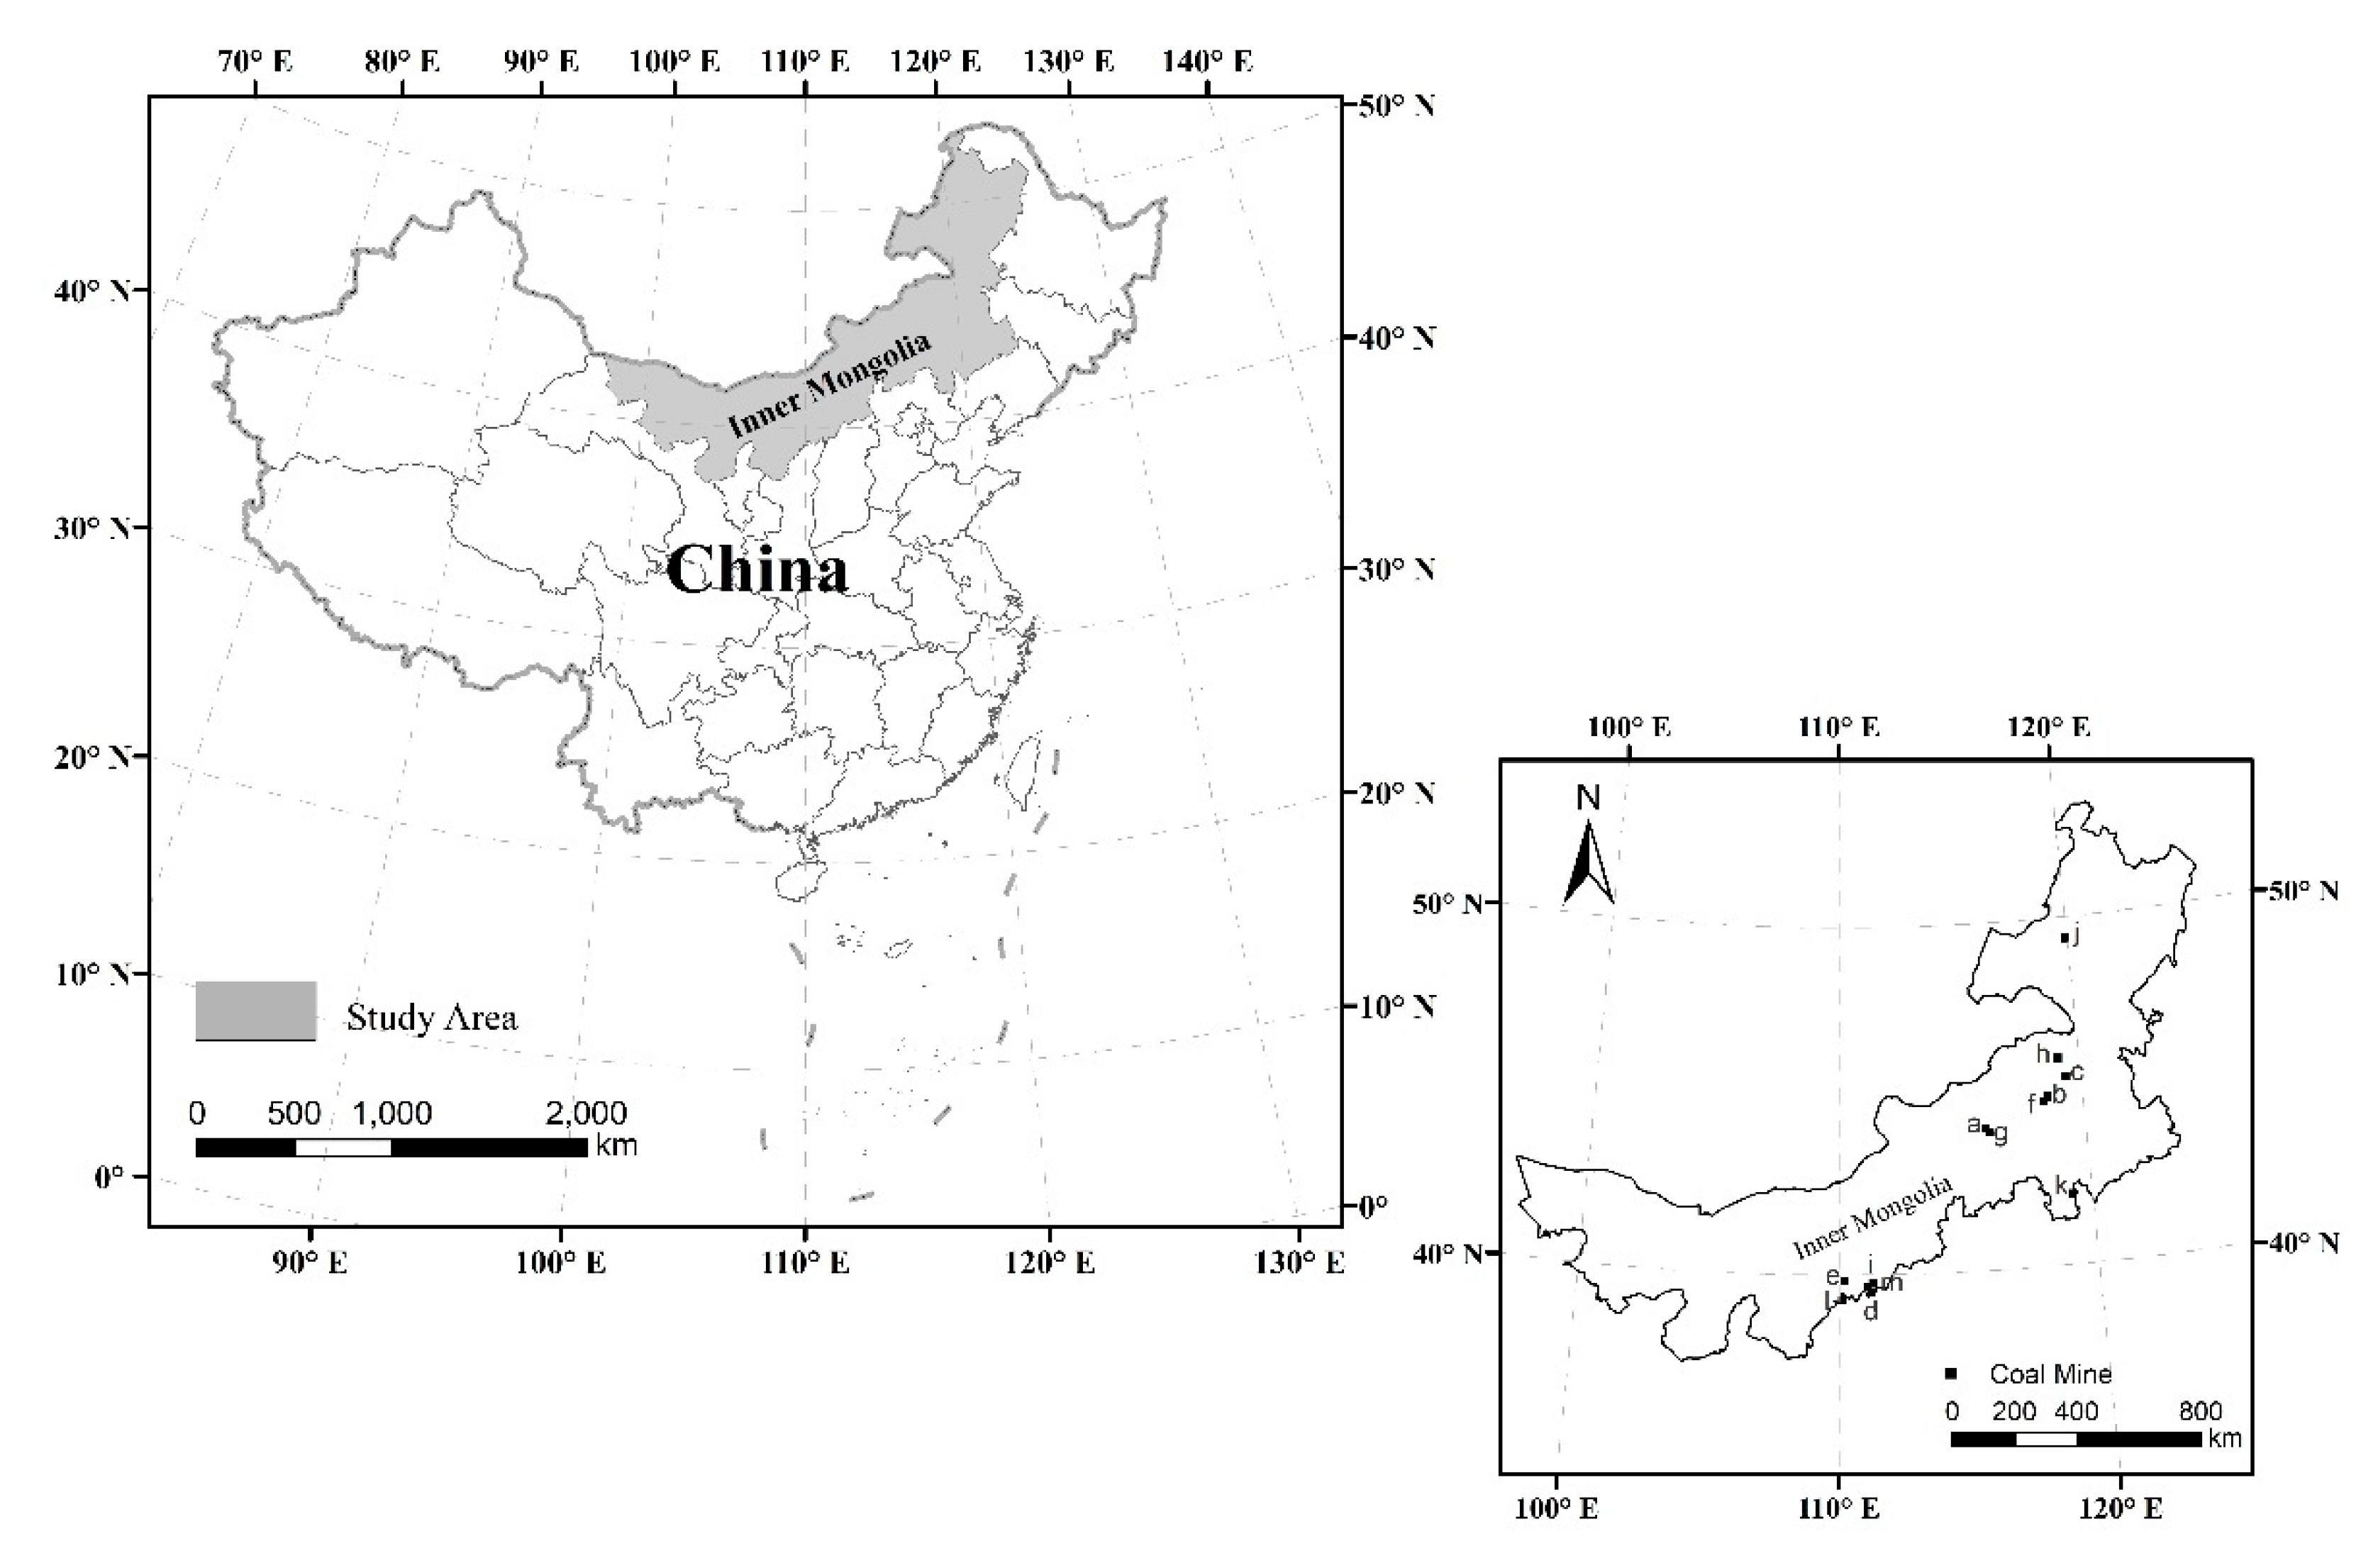
2.1. Study Area

This study selected 13 large open-pit coal mines in Inner Mongolia as the study area (Figure 1). All 13 of these typical open-pit coal mines were active production mines. The active mining operations included perforation blasting, mining, loading, transportation, and dumping. The Inner Mongolia Autonomous Region extends obliquely from northeast to southwest, showing a narrow shape. The geographic coordinates are 37°24′~53°23′ N and 97°12′~126°04′ E. The east–west linear distance is 2400 km, and the north–south span is 1700 km. It is adjacent to eight provinces to the southeast and west, and borders Mongolia and Russia to the north. The total land area is 1,183,000 square kilometers, accounting for about 12.3% of the total area of the country. The area has the features of complete stratigraphic development, frequent magmatic activity, good metallogenic conditions, and rich mineral resources. The altitude is more than 1000 m across the northeast, north, and northwest regions. Affected by topography and location, the climate is diverse and complex. The area is in a temperate continental arid climate zone that is cold in winter and hot in summer, with large temperature differences between day and night. The annual rainfall is 100~500 mm, the annual evaporation is over 1200 mm, the annual sunshine is over 2700 h, and the average annual temperature is −3.7 °C~11.2 °C. Due to the wide range of longitude in this area, the vegetation presents longitudinal zonal distribution, showing forest–grassland–semi-desert–desert vegetation distribution characteristics from east to west.

2.2. Data Sources and Processing

(1) Remote sensing data: This study used Landsat image data from 2001 to 2020 taken from GEE, mainly from April to September. The image dataset from 2001 synthesized by GEE served as a remote sensing data source, covering the entire Inner Mongolia Autonomous Region. After spatiotemporal screening and cloud removal of Landsat images, the function method was used to stitch the images, and the existing railings were filled using the regression repair method. After calculating the normalized difference vegetation index (NDVI) and normalized difference building index (NDBI) of the feature bands, they were added as new feature bands to the image for classification assistance. Using the land-use data of 2000, 2005, 2010, 2015, and 2020 from Chinese Academy of Sciences as monitoring data, the stable land-use patches were extracted and stacked. On this basis, the classification samples in the mining area were screened and outlined. Classified samples were trained and supervised by the random forests method. After the classification accuracy kappa evaluation (Table 1), the land-cover data of corresponding years were obtained. Years of land-use data were obtained by time iteration and cyclic classification in the program.
(2) Topographic data: The data obtained by the Shuttle Radar Topography Mission were expressed as a digital elevation model (DEM) that could cover all of China. The resolution of the SRTM1 data was 30 m, and open-source data (ASTER GDEM2, GMTED2010, and NED) were used to complete the hole-filling. GEE invoked SRTM1 DEM data for interpretation, and obtained terrain data.
(3) Vegetation and meteorological data: Vegetation data included vegetation types and vegetation regionalization, which were obtained from the Resource and Environment Data Center of the Chinese Academy of Sciences [10]. Meteorological data were obtained from the meteorological data network [11]. There are 47 monitoring stations in the Inner Mongolia Autonomous Region, recording daily meteorological data. Dynamically captured and cleansed data was obtained using Python’s Selenium framework programming to ensure annual meteorological data for each site. The discrete meteorological data were interpolated using Ausplin to obtain the grid data of precipitation and evaporation.
(4) Land-use classification: Taking DEM data, vegetation type and zoning data, and meteorological data as inputs, a random forests model was used to classify land use. According to the characteristics of the mining area, this paper divides the land-use types of the study area into seven categories, namely, cropland, forest, grassland, waterbodies, residential land and industrial squares, mining land, and unused land. Industrial squares refer to the space of ground facilities in the mining area, including office buildings, dormitories, production workshops, warehouses, roads, etc. In China’s mining areas, the industrial squares and residential land are usually mixed together, so they were classified as a single type of land use in this article. Mining land refers to the ground production land for purposes such as mining, quarrying, sand mining, salt fields, brick and tile kilns, and tailings dumps. Unused land refers to unutilized land, including hard-to-use land, mainly bare land, bare rock, etc. For unused land, the growth of vegetation was not suitable, so restoration was generally needed for sustainable use.

2.3. Study Method

2.3.1. Land-Use Change Analysis

The land-use change process corresponds to the changes in landscape types in mining areas. Therefore, the land-use transition matrix was used to characterize the temporal and spatial transfer of landscape types in mining areas. The land-use transition matrix provided an opportunity to analyze the amount and direction of changes in land-use type intuitively, and to reveal the interannual transfer ratio of land-use types [12,13,14,15,16]. Based on the land-use dynamic degree and land-use transition matrix, this study analyzed the land-use changes of typical mining areas in Inner Mongolia from two dimensions: quantitative and spatial. The calculation process of the land-use transition matrix used the following equation [17]:
S ij = S 11   S 12     S 1 n S 21   S 22     S 2 n       S n 1   S n 2     S nn    
where S is the area of a given land-use type, n is the number of land use types, and Sij represents the area converted from land-use type i at the beginning of the study period to land-use type j by the end of the study period. The land-use transition matrix in the study area from 2001 to 2020 was ArcGIS-based, specifically under the tabulate area function in the zonal module of spatial analysis. The spatiotemporal changes of land use in typical opencast coal mines in Inner Mongolia under long-term time series were compared and analyzed based on the land-use transition matrix.

2.3.2. Landscape Pattern Index

The landscape fragmentation index, as a commonly used landscape pattern index [18], has been widely used in the study of the ecological evolution of mining areas [19,20,21]. In this study, patch density (PD), landscape division index (DIVISION), and aggregation index (AI) were selected from the landscape level, and landscape fragmentation (LF) was determined according to the coupling results of the three landscape pattern indices [22,23], after which the degree of landscape fragmentation in the mining areas of Inner Mongolia was interpreted.
(1)
Patch density
Patch density refers to the ratio of the number of patches of a certain type to the landscape area, indicating the extent to which the landscape matrix is segmented by patches of this type—that is, the patch density of this landscape component on the whole landscape. Patch density was calculated using the following equation [24]:
PD = N A
where PD denotes the patch density, N denotes the total number of landscape patches in the study area, and A denotes the total area of the landscape. The higher the PD value, the more the landscape type is separated by the boundary, and the fragmentation of the representational elements is obvious. On the other hand, this indicates that the landscape type has higher integrity and better connectivity [25].
(2)
Landscape division index
The landscape division index refers to the classification based on the cumulative distribution of patch area—that is, the probability that two randomly selected pixels in the landscape are not located in the same patch of the corresponding types of patch. The landscape division index was calculated by the following equation [24]:
DIVISION = 1 i = 1 m   j = 1 n   a ij A 2
where DIVISION represents the landscape division index, a ij represents the area of a certain landscape patch in the study area, and A represents the total area of the landscape. DIVISION ∈ [0,1]; a larger DIVISION value indicates that a certain landscape patch is composed of several smaller patches, and that there is a greater degree of division of landscape types represented by the patch in question. On the other hand, the landscape patches are more complete and have larger areas, and the degree of division of landscape types is lower.
(3)
Aggregation index
The aggregation index is a kind of index that can describe the degree of aggregation of different landscape patches, and can measure the degree of landscape fragmentation and the degree of isolation between habitat patches. The aggregation index was calculated by the following equation [24]:
AI = i = 1 m g ii max g ii P i × 100
where AI represents the aggregation index, g ii represents the number of similar adjacencies (connections) between pixel i and pixel j at the patch level based on the single counting method, max represents the maximum adjacency number between pixel i and pixel j at the patch level, and P i represents the proportion of landscape formed by the patch type. When the landscape is composed of a few large patches with high connectivity, the aggregation index is high. Conversely, if the landscape is composed of many discrete patches, the aggregation index is low.
Due to the different dimensions of PD, DIVISION, and AI, the value of PD at the landscape level can reach more than 100, while DIVISION is always less than or equal to 1. Too large a numerical difference in the process of fitting leads to distortion of the fitting results. Therefore, the data were normalized using the following equation:
X = X original X min X max X min  
where X is the value after data normalization, X original is the original data value, X max is the maximum value in the data, and X min is the minimum value in the data.
According to the above results, digital graph theory [26] was used to calculate the three landscape pattern indices. Among them, the larger the PD and DIVISION values, the more fragmented the landscape. On the other hand, the larger the AI value, the more complete the landscape. The estimation process used the following equation.
LF = PD + DIVISION AI
where the larger the LF value, the greater the degree of landscape fragmentation, and vice versa. Finally, the result was maintained between 0 and 1.

3. Results

3.1. Variation Characteristics of Landscape Types

3.1.1. Quantity Changes of Landscape Types

(1) Different land-use quantity and distribution characteristics constituted different landscape types in the mining areas. Forest land and grassland together constituted the forest landscape type. The changes in cropland represented the changeover of the agricultural landscape. Mining land, residential land, and industrial squares belonged to the category of industrial landscapes. The grassland landscape in typical open-pit coal mining areas showed a fluctuating decline from 2001 to 2020. With the total area of grassland landscape declining significantly, the industrial landscapes such as mining land, residential land, and industrial squares showed a fluctuating rise for a long time. The change trend of the two was opposite, and the change in the forest landscape was relatively stable. In 2001, the landscape type in the study area was mainly grassland (60.75%), followed by cropland (21.12%). In 2020, although grassland was still the main landscape type in the study area, the proportion reduced (50.71%). With the proportion of grassland, cropland landscape types in the total land area continued to decline, while the area of industrial landscapes such as residential land and industrial squares increased sharply, from 0.04% to 15.49% in 20 years. Overall, the quantity changes of agricultural landscapes (cropland) in 2001–2020 mainly slowed down, and then slowly increased after 2016. The mining land of the industrial landscape had always been on the rise, with the largest increase in residential land and industrial squares. The change rate during the study period was 292.45%, and the cumulative area increase was about 71.74 km2. The second increase was in unused land, with a change rate of 249.92%. Waterbody, grassland, and cropland area decreased by 86.44%, 16.28%, and 9.18%, respectively.
(2) The landscape types and patterns of typical open-pit coal mining areas in Inner Mongolia had fluctuated greatly over the past 20 years. From the perspective of change periods, the large-scale decline in grassland landscape areas from 2001 to 2005 eased to a slight increase, with a cumulative decrease of 75.4 km2 over other periods. In 2005–2010, the area of industrial landscapes such as residential land and industrial squares decreased by 2.31%, while in other periods it increased significantly. The waterbodies landscape area increased in 2010–2015, with a decrease of about 7.86 km2 over other periods. Since 2010, the agricultural landscape area experienced a significant decrease of 14.07%, and then turned to a dynamic increase. However, the increase of 5.7% was smaller than the previous decrease, which was still reflected in the decrease in agricultural landscape area as a whole (Table 2).

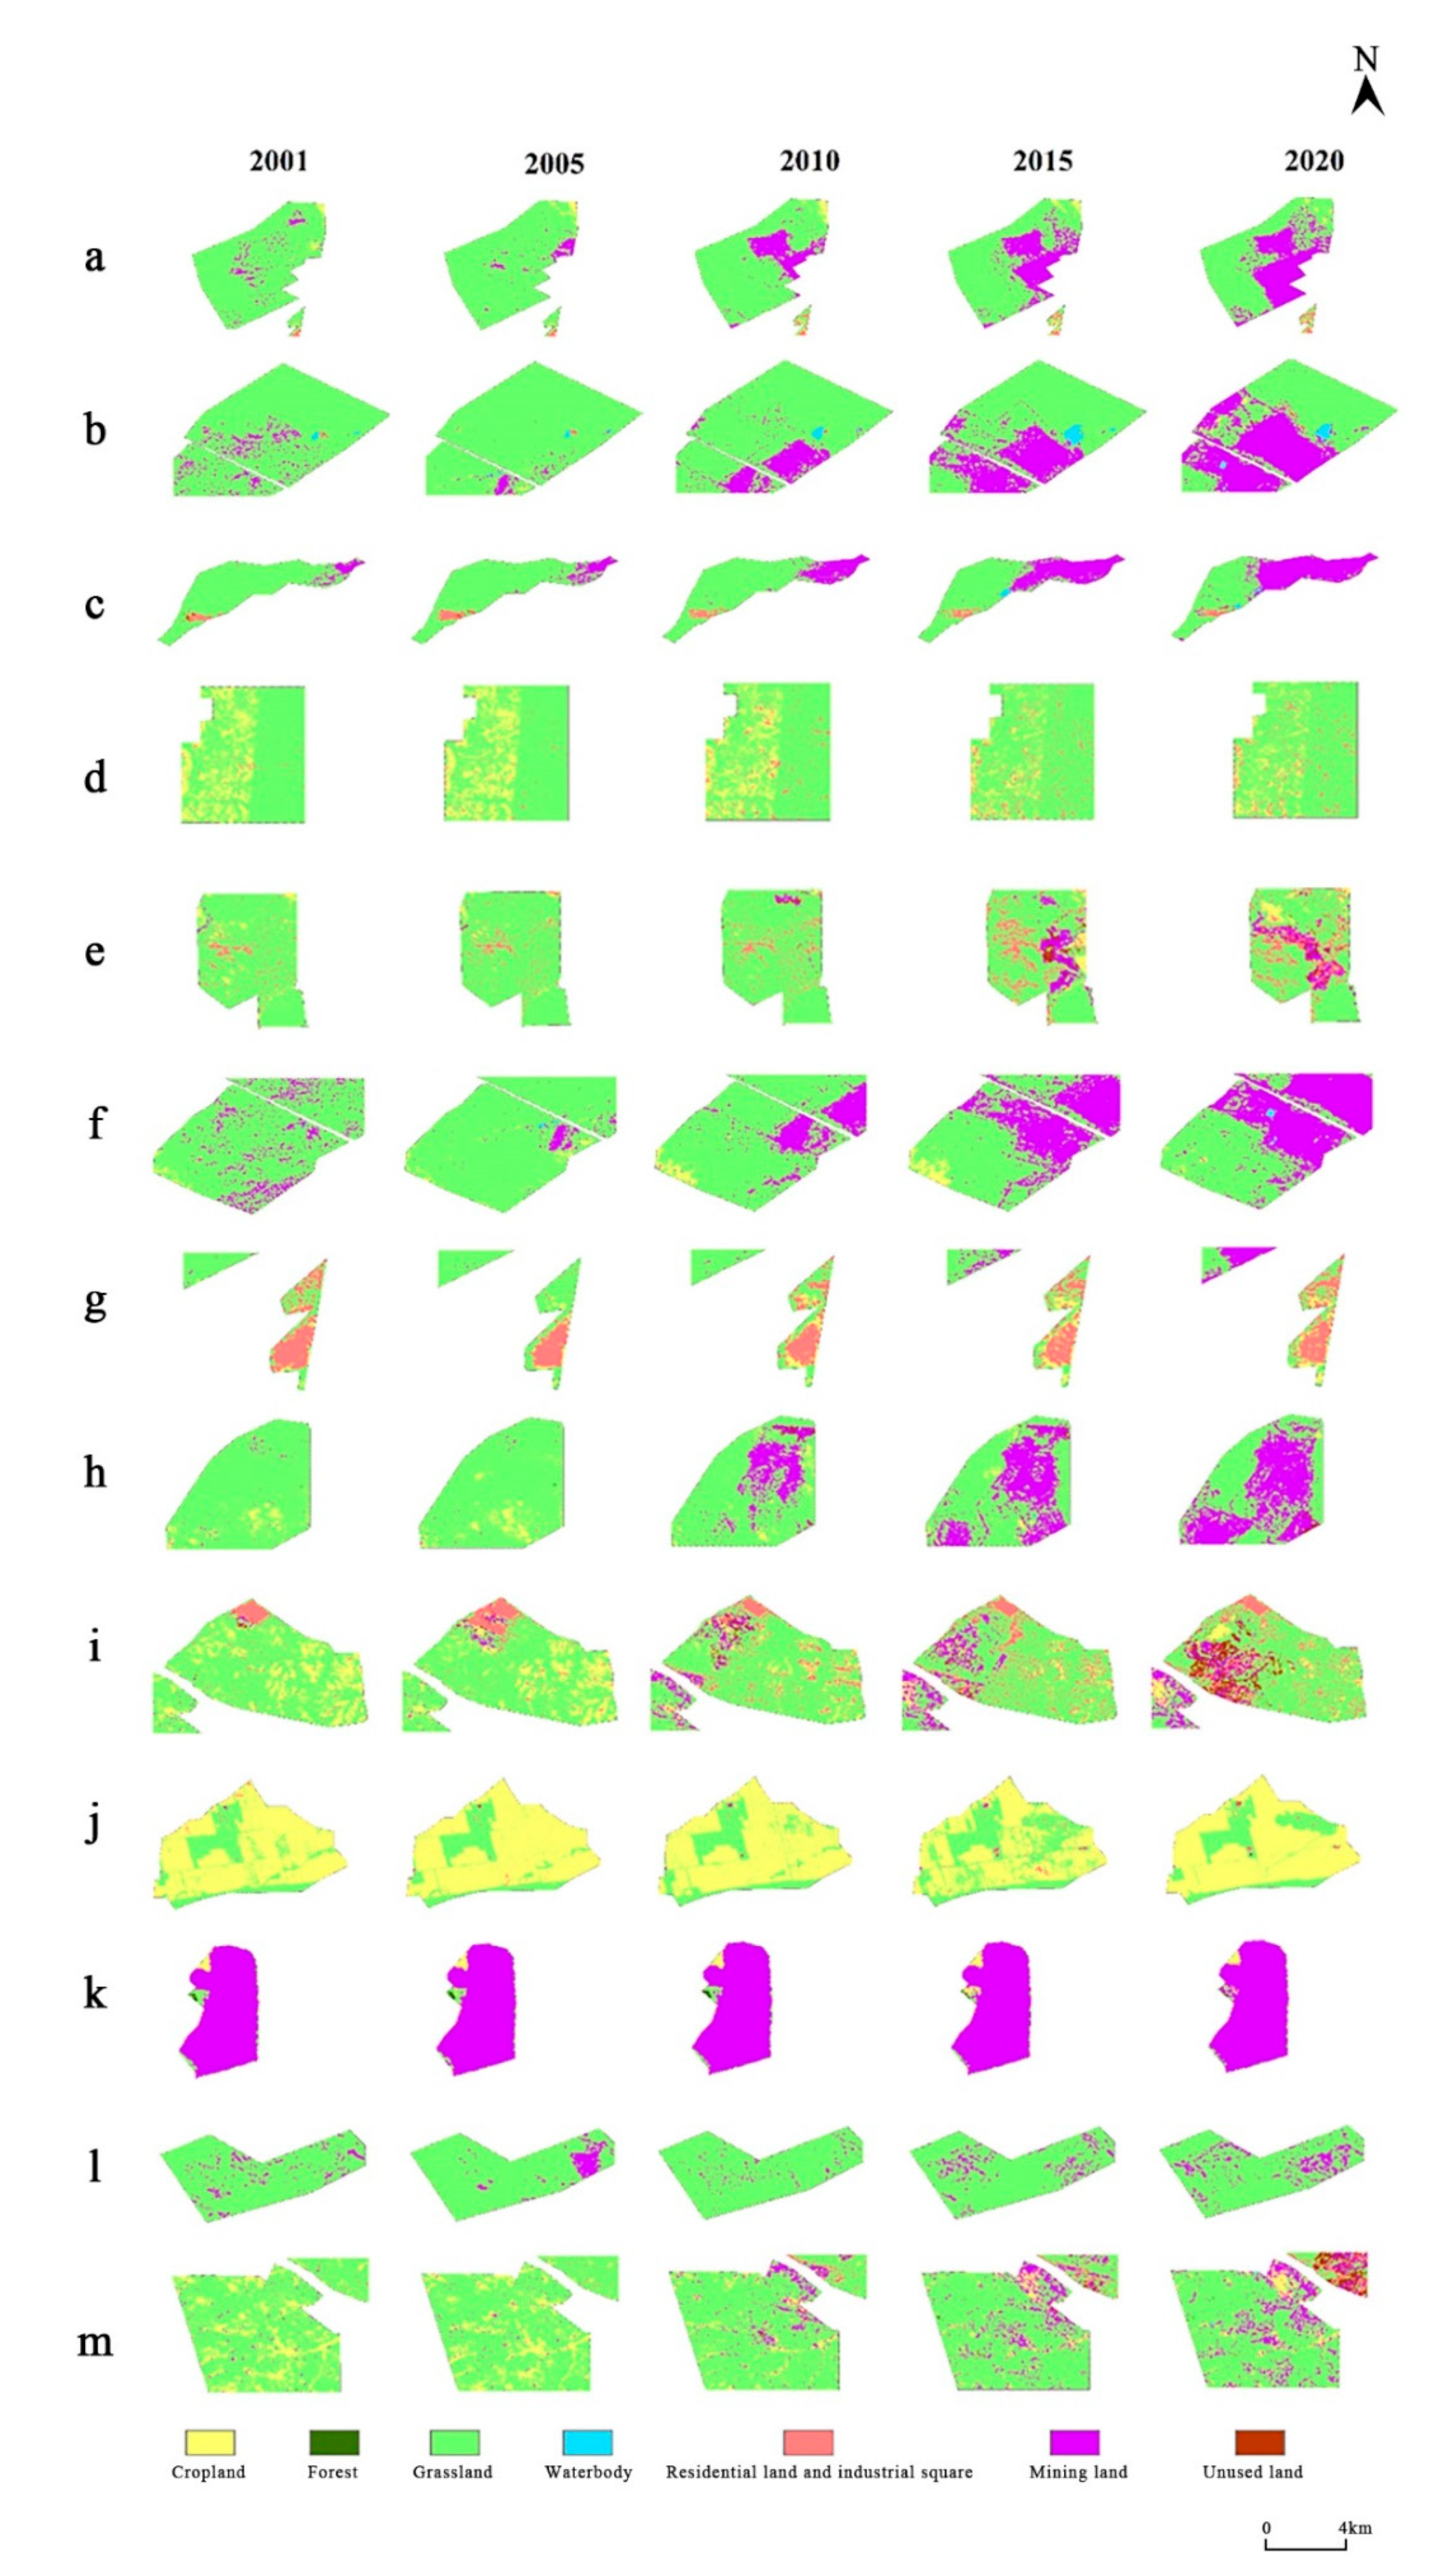
3.1.2. Spatial Changes of Landscape Types

(1) The spatial evolution characteristics of open-pit coal mine landscape types were directly reflected by spatial mapping (Figure 2). From the perspective of the changes in the spatial characteristics of landscape types, with the changes in land-use quantity and state, the landscape pattern types gradually changed. In general, except for mines j and k, most of the other mining areas were dominated by grassland landscapes. From the perspective of spatial changes, the mining land of open-pit coal mines a, b, c, f, h, and k had shown an increasing trend year by year since 2005, and a period of sharp, concentrated increase occurred from 2005 to 2015. After 2015, the spatial distribution of mining land showed a relatively stable state.
(2) The main sources of the increase in residential land and industrial square land were grassland and farmland. The lost grassland was mainly converted into residential land and industrial squares, cropland, and mining land. Cropland was mainly converted into grassland, and other parts were converted into residential land, industrial squares, and unused land. Some mining land was converted to grassland. Other land-use types also had varying degrees of conversion. In 2015–2020, in addition to cropland and unused land, other types of land conversion to residential land and industrial squares were the most significant in the four periods. In 2001–2020, 17.4% of the grassland was converted to residential land and industrial squares, and 84.8% of the waterbody land was converted to cropland, although the area of waterbody conversion was only 5.66 km2 (Table 3). There were two reasons for the almost-complete loss of water: One was the drainage operations of open-pit coal mining. Drainage refers to the dewatering or drainage of aquifers, which may affect the safety of coal mining during stripping and mining in open-pit mines. This operation led to a significant decline in groundwater levels in the mines and their surrounding areas. Subsequently, surface water was converted to groundwater. Finally, the water area visible on the surface significantly reduced, and water resources were in short supply. On the other hand, the mining areas are located in a typical arid climate zone in China, where the annual evaporation is greater than the precipitation, so the amount of surface water resources decreased due to the arid climate.

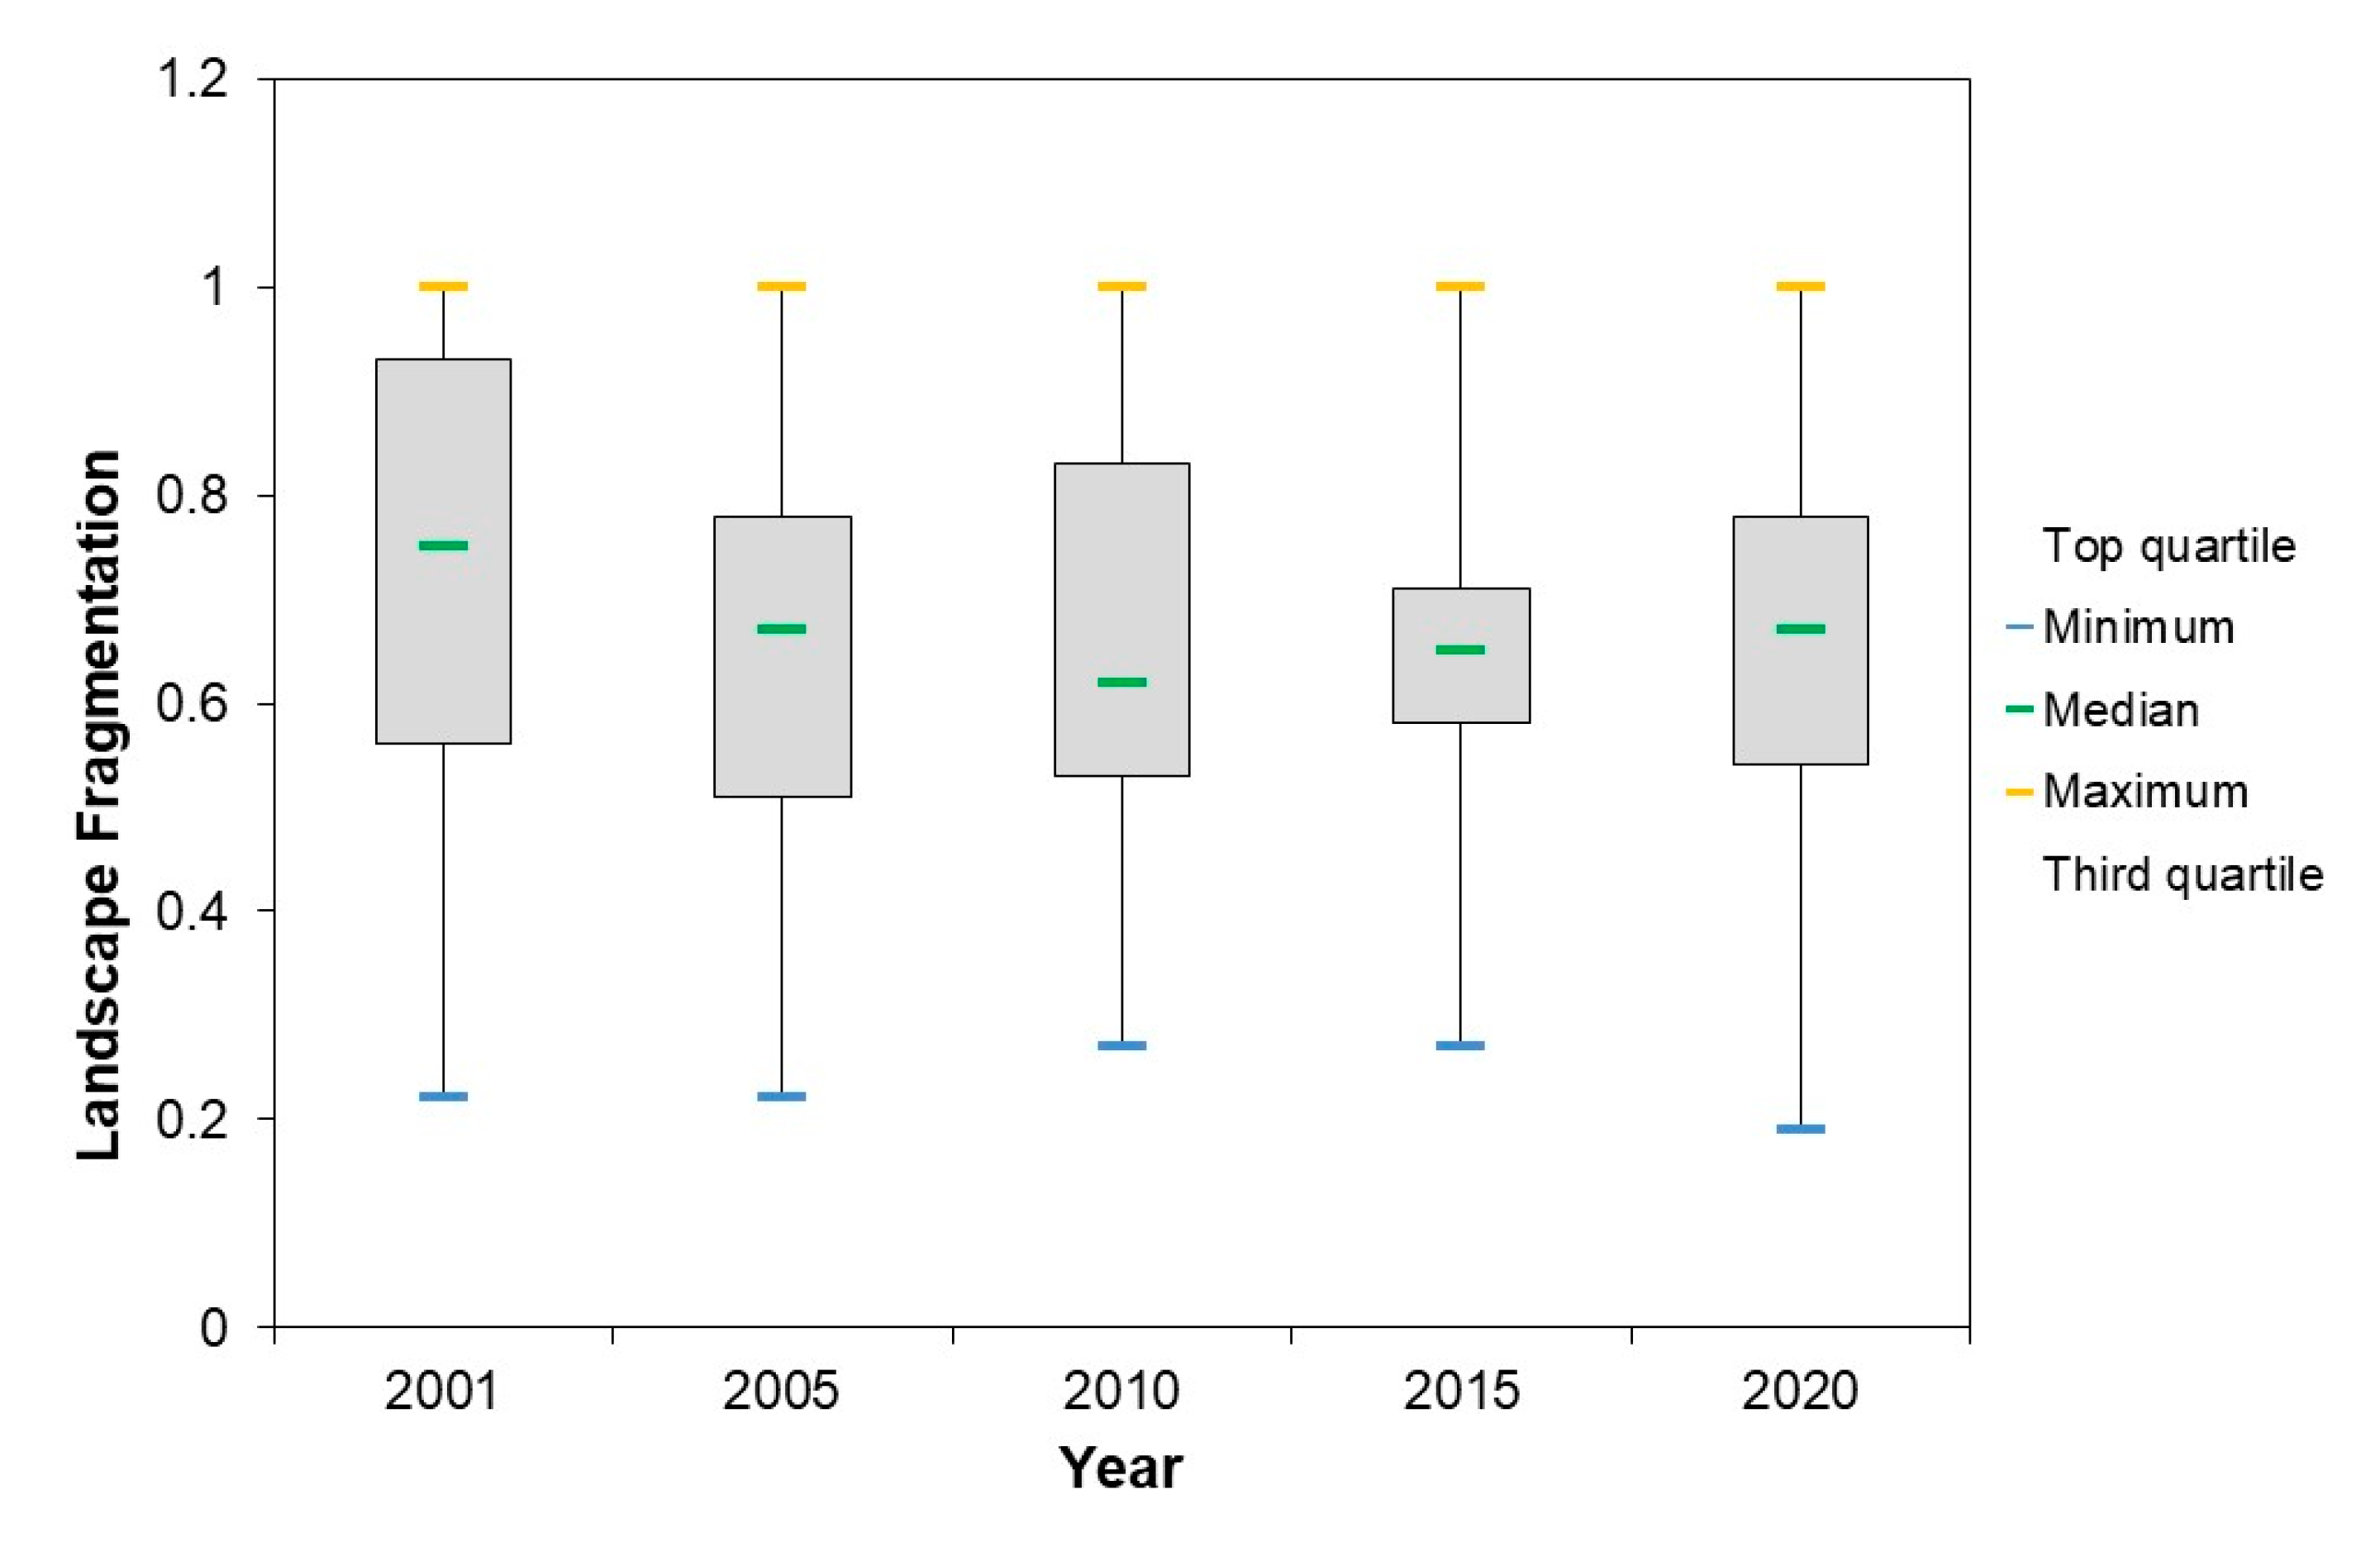
3.2. Variation Characteristics of Landscape Types

The mean patch density (PD) of a typical open-pit coal mine every five years from 2001 to 2020 was 50.53, 42.31, 59.77, 60.36, and 55.02, respectively. The degree of landscape fragmentation in the mining areas fluctuated greatly. Comparing the results of 2001 and 2020, the PD values of eight of the mining areas increased, meaning that 61.54% of the mining areas were seriously damaged in the past 20 years. The degree of landscape fragmentation varied greatly in different mining areas. Among the 13 coal mines, the degree of landscape fragmentation in mining area d was always the highest, reaching a peak of 135.53 in 2015. In coal mine c, landscape connectivity was generally higher, and the lowest point was in 2001. The landscape division index ranged from 0 to 1. The minimum, average, and mode division values of the mining areas from 2001 to 2020 were 0.77, 0.89, and 0.94, respectively, meaning that the division range of each typical mining area was above 0.77, and nearly 80% of the mining areas had a division value above 0.9. Therefore, it can be inferred that landscape patches of typical mining areas were composed of multiple smaller patches with complex and diverse ground object types and high separability. The aggregation index analysis results of each mining area showed that the numerical distribution of AI was roughly opposite to that of PD and DIVISION. Compared with the other two indices, the AI value can better reflect the degree of landscape fragmentation and the degree of isolation between patches. The AI calculation results of the 13 open-pit coal mine areas from 2001 to 2020 ranged from 47.81 to 89.73, with an average value of 65.30. Combined with the results of PD and DIVISION, the degree of landscape fragmentation and the degree of isolation between habitat patches were relatively high.
In order to analyze the LF index, it was necessary to normalize the results of the three indices mentioned above. The results showed that the mean value of LF from 2001 to 2020 was 0.72, 0.63, 0.66, 0.64, and 0.66, and the median was 0.75, 0.67, 0.62, 0.65, and 0.67 (Figure 3). On the whole, this showed a decreasing trend in the fluctuation. It can be seen that the overall landscape ecological quality of the mining areas gradually improved. Comparing the 13 mining areas over the 20 years, the coal mines with high LF were d, g, i, and l, among which d was the one with the highest LF. The degree of landscape fragmentation of coal mine j had always been relatively low—usually below 0.3 (Table 4).

3.3. Ecological Restoration Projects in Opencast Coal Mines

Since 2007, some opencast coal mines in China have begun to carry out the ecological restoration of mines in order to restore the damaged ecosystems in the mining areas. These efforts mainly rely on natural restoration or human-assisted intervention. Specifically, for mine ecological problems caused by mining—such as potential geological hazards, land destruction, and vegetation damage—the mining geological environment can be stabilized, the damaged land can be reused, and the structure and function of the damaged ecosystem can be restored or improved by implementing technical restoration measures and administrative policy measures. Thus, the mines’ complex ecosystem can get rid of the state of reverse succession and reach a new state of equilibrium. Specifically, ecological restoration projects adopted in Inner Mongolia’s grassland mining areas are mainly divided into the following objectives:
(1) Eliminate potential geological hazards: This entails a focus on mines’ ecological problems, such as mountain damage, landscape damage, collapse, and landslide. Engineering methods such as slope cutting, unloading, wall construction, and continuous slopes are adopted to eliminate potential geological hazards such as collapse and landslide. Engineering measures such as cleaning, blocking, and solidification are adopted to eliminate the hidden dangers of slag and dangerous rock mass. Engineering measures such as slope cutting, unloading, and drainage are adopted to eliminate the hidden dangers of unstable slopes, and engineering measures such as backfilling and leveling are adopted to eliminate the hidden dangers of surface cracking and ground collapse.
(2) Reduce land occupation and destruction: The integration of “stripping–mining–transportation–disposal–land consolidation–reclamation–utilization” is adopted to achieve concurrent mining and reclamation (CMR). In order to reduce the occupation and destruction of land resources, the comprehensive treatment and utilization of solid wastes such as waste rock, slag, and tailings are strengthened.
(3) Geomorphic reshaping: A new landform in harmony with the surrounding areas is reshaped by employing engineering measures such as terrain reshaping, land consolidation, and reconstruction of drainage systems. The terrain is reshaped by using engineering measures such as slope repair, platform arrangement, pit backfilling, deep digging, and shallow padding. In addition, engineering measures such as ground leveling, topsoil protection, and external soil cover are adopted for land consolidation.
(4) Soil reconstruction: Based on the geomorphic reshaping, the reconstruction of soil profile structure and fertility conditions relies on the local geotechnical, hydrothermal, and humidity conditions, making full use of the topsoil stripped from mining and solid wastes left by mining—such as waste rock, slag, tailing sand, and coal fly ash—and implementing engineering measures such as soil-modified fertilization, soil layer replacement, topsoil cover, soil layer turnover, chemical improvement, bioremediation, etc. Soil reconstruction measures for different sites can be determined according to their use for restoration. In China, some open-pit coal mines, if repairable, take technical and biological measures such as land leveling and soil reconstruction to restore the damaged land to agricultural land, cultivated land, or garden land to carry out agricultural production and operation activities. Some closed mines, if not repairable, are restored to geological parks or mine pit hotels, or transformed to flower nurseries or lake landscapes for subsequent development and utilization of resources and industrial development.
(5) Vegetation restoration: Forest and grassland vegetation restoration is mainly carried out according to the characteristics of the biological population of the local ecosystem. Considering the suitability of vegetation for the ecological restoration of mines, ecological reclamation is carried out while the composition and structure of the flora are rationally allocated, so as to achieve the reconstruction of landform and landscape.

4. Discussion

(1) In the extraction of temporal and spatial evolution information of land use in mining areas, this paper constructed a large-scale mining area land-use information extraction method based on the Google Earth Engine (GEE) platform and machine learning. In terms of data preprocessing, cloud cover and regression repair were used to complete the pixel filling in the strip area, and the optimization of remote sensing images was carried out. In the process of sample extraction, the sample dataset was quickly constructed by integrating the historical land-use and -cover information of the study area, and the automatic classification process of land use in the mining area was improved on the basis of ensuring the accuracy of sample selection. In terms of interpretation efficiency, using GEE, parallel cloud computing, and real-time judgment, supplemented by time iteration, we broke through the traditional mode of remote sensing data processing, greatly reduced the time complexity and space complexity of the interpretation algorithm, and reduced the cost of land-use interpretation in large-scale mining areas.
(2) The mining of open-pit coal mines led to significant changes in the landscape types and patterns of the mining areas, which were mainly manifested as significant decreases in the area of grassland and waterbodies, while the area of mining land increased at different rates in different stages. On the whole, the typical mining areas showed that the landscape patches were not only broken, but also diverse, with poor connectivity, and highly separable. The degree of landscape fragmentation and the degree of isolation between habitat patches were also high. The reasons for these changes included mining methods, mining stages, and other factors. In terms of mining methods, open-pit coal mining applied a layer-by-layer downward mining method from the surface, mainly stripping and digging damaged land. After years of mining activities in typical opencast coal mines, the original surface morphology and soil structure were destroyed, the surface landscape types were significantly changed, and the use value of the original land-use types was reduced. The rock/soil waste generated in the mining process was piled on the original landform, resulting in an increase in the industrial landscape. The weight of occupancy of such objects could change the soil bulk density and porosity. This made the soil denser and less conducive to farming, leading to a significant decrease in the area of cultivated land and grassland. In terms of mining stages, the overall land-use changes in the study area could be divided into two periods: From 2001 to 2010, the land-use changes of forest and grassland maintained a relatively stable state, while the area of residential land, industrial squares, and mining land fluctuated greatly, depending on the mining period. After 2010, the transformation from mining activities to land reclamation activities had the opposite effect to with the above process. The surface land-use changes showed a restoration effect, the ecological landscape areas such as grassland were greatly reduced, and the spatial distribution of mining land gradually became stable, indicating the mature mining period.
(3) Reclamation and ecological restoration policy orientation contributed to the rationalization of landscape patterns. Since 2007, China has required land reclamation for new construction, renovation, and expansion of production mines. Reclamation engineering measures were carried out in mining areas, including geological hazard elimination and disaster management, land reclamation engineering, and biological and chemical methods. These measures gradually achieved landscape reshaping, soil reconstruction, vegetation reconstruction, landscape reproduction, and biodiversity restructuring and protection, and restored the damaged land to a state of availability, improving the ecological quality of the landscape. Such mandatory policy measures gradually showed a positive guiding effect on ecological restoration in mining areas over the subsequent 10 years. Since 2010, the area of cultivated land in the study area has gradually shown a trend of dynamic increase. Since 2015, the area of mining land has changed from a high-speed growth to a high-speed decrease. Combined with the results of the land-use transition matrix, most of the reduced mining land was converted to grassland, and the change in the area of grassland changed from a significant decrease to a dynamic increase. Meanwhile, the conversion between cultivated land and grassland was large. According to the mining and ecological restoration time points of each mine, the mining period was mostly from 2000 to 2005, along with the strategy of mining alongside reclamation. The ecological restoration began around 2010, which broadly coincided with the time when the mining land greatly reduced and the grassland decreased slowly. Over the past 20 years, nearly 70% of the study areas showed a decreasing trend in the degree of landscape fragmentation. Although the ecological environment in the study area has gradually improved, more ecological restoration measures are still needed to improve landscape connectivity and ecological resilience.

Author Contributions

Data curation, L.Z.; Formal analysis, Z.Z. and L.W.; Funding acquisition, Y.Z.; Methodology, L.Z.; Resources, L.Z.; Supervision, Y.Z.; Validation, S.L.; Visualization, Z.Z.; Writing—original draft, L.Z., Z.Z., S.L. and L.W.; Writing—review & editing, Z.Z. All authors have read and agreed to the published version of the manuscript.

Funding

This research was funded by the National Key R&D Program of China, grant number 2019YFC0507804.

Institutional Review Board Statement

Not applicable.

Informed Consent Statement

Not applicable.

Data Availability Statement

Not applicable.

Conflicts of Interest

The authors declare no conflict of interest. The funders had no role in the design of the study; in the collection, analyses, or interpretation of data; in the writing of the manuscript, or in the decision to publish the results.

References

  1. Fan, Y.H.; Lu, Z.H.; Cheng, J.L.; Zhou, Z.X.; Wu, G. Major ecological and environmental problems and the ecological reconstruction technologies of the coal mining areas in China. Acta Ecol. Sin. 2003, 10, 2144–2152. [Google Scholar]
  2. Han, L.Z. Research on Land Use Distribution of Reclaimed Land in Open Pit Mine-Taking the Case of Lu Xin Mine in Heshun County. Master’s Thesis, China University of Geoscience, Beijing, China, 5 June 2016. [Google Scholar]
  3. Liu, X.C.; Bai, Z.K.; Bao, N.S.; Ma, X. Study on the surface soil resource management of land reclamation in Mongolia Grassland. J. Shanxi Agric. Univ. (Nat. Sci. Educ.) 2010, 30, 253–257. [Google Scholar]
  4. Wang, J.F. Vegetation and Soil Properties of Ecological Restoration in Typical Open-Pit Mines of Inner Mongolia Grassland Areas. Ph.D. Thesis, Inner Mongolia Agricultural University, Hohhot, China, 12 December 2020. [Google Scholar]
  5. Technical Guidelines for Plan Environmental Impact Assessment-Coal Industry Mining Area Plan. Available online: https://www.mee.gov.cn/ywgz/fgbz/bz/bzwb/other/pjjsdz/200903/t20090320_135492.shtml (accessed on 16 June 2022).
  6. Wang, Z.H. Analysis on Desertification of Xing’an League Monitoring Area Based on 3S Technology. Master’s Thesis, Inner Mongolia Agricultural University, Hohhot, China, 9 June 2017. [Google Scholar]
  7. Suggestions of the Party Committee of Inner Mongolia Autonomous Region on Formulating the Fourteenth Five-Year Plan for National Economic and Social Development and the Long-Term Goals of 2035. Available online: https://www.nmg.gov.cn/zwyw/ldhd/202101/t20210105_407052.html (accessed on 16 June 2022).
  8. Gao, Y.Z.; Chu, Y.; Liang, W. Remote sensing monitoring and analysis of tailings ponds in the ore concentration area of Heilongjiang Province. Remote Sens. Nat. Resour. 2015, 27, 160–163. [Google Scholar]
  9. Raval, S.; Shamsoddini, A. A monitoring framework for land use around kaolin mining areas through Landsat TM images. Earth Sci. Inform. 2014, 7, 153–163. [Google Scholar] [CrossRef]
  10. Resource and Environment Science and Data Center. Available online: http://www.resdc.cn/ (accessed on 24 December 2021).
  11. China Meteorological Data Sharing Service System. Available online: https://data.cma.cn/ (accessed on 20 November 2021).
  12. Shi, X.W.; Feng, G.J.; Yi, Y.; Zou, Y.J.; Ge, H.R.; Su, P.T. Temporal and spatial evolution characteristics and ecological risk assessment of land use landscape patterns in central Zhejiang urban agglomeration. Trans. Chin. Soc. Agric. Mach. 2020, 51, 242–251. [Google Scholar]
  13. Sun, L.; Tang, G.P.; Dou, Y.F.; Liu, Y.L.; Wu, Y.Z. Land use/cover change and underlying driving forces in Dongjiang River basin during 2001-2013. Bull. Soil Water Conserv. 2018, 38, 293–300. [Google Scholar]
  14. Tian, S.; Luo, G.J.; Liao, J.J.; Luo, X.L.; Wang, Q. Characteristics and driving factors of land use evolution in typical traditional village gathering place. Resour. Environ. Yangtze Basin 2021, 30, 2682–2692. [Google Scholar]
  15. Wang, Z.C.; Gao, Z.Q. Analysis on spatiotemporal characteristics and causes of tidal flat wetland in Jiaozhou Bay from 1987 to 2017 based on land use change. Res. Soil Water Conserv. 2020, 27, 196–201. [Google Scholar]
  16. Yin, L.J.; Zhou, Z.F.; Zhu, C.L.; Shang, M.J. Geomorphological differentiation characteristics of land use change in karst rocky desertification area—A case of Guanling-Zhenfeng Huajiang rocky desertification comprehensive demonstration zone in Guizhou Province. Bull. Soil Water Conserv. 2020, 40, 37–46. [Google Scholar]
  17. Wang, Z.C.; Zhang, K.; Ding, Z.P.; Wu, S.Y.; Huang, C.H. Delineation of urban growth boundary based on improved FLUS model considering dynamic data. J. Geo-Inf. Sci. 2020, 22, 2326–2337. [Google Scholar]
  18. Diffendorfer, J.E.; Dorning, M.A.; Keen, J.R.; Kramer, L.A.; Taylor, R.V. Geographic context affects the landscape change and fragmentation caused by wind energy facilities. PeerJ 2019, 7, 7129. [Google Scholar] [CrossRef] [PubMed]
  19. Wu, Z.H.; Lei, S.G.; Lu, Q.Q.; Bian, Z.F. Impacts of large-scale open-pit coal base on the landscape ecological health of semi-arid grasslands. Remote Sens. 2019, 11, 1820. [Google Scholar] [CrossRef] [Green Version]
  20. Feng, J.M.; Dong, G.F.; Guo, L.X.; Wen, Q. Ecological responses to changing landscape patterns in Yushenfu mining area. Arid Zone Res. 2014, 31, 1141–1146. [Google Scholar]
  21. Qiu, W.W.; Hou, H.P. Research on landscape disturbance in complex terrain mine area. China Min. Mag. 2013, 22, 50–53. [Google Scholar]
  22. Fu, G.; Li, J.S.; Qi, Y.; Gao, X.Q.; Xiao, N.W.; Ren, M.Y. An Evaluation Method for Landscape Fragmentation Index. CN108345897A, 31 July 2018. [Google Scholar]
  23. Wang, Y.F.; Zhao, X.L.; Zuo, L.J.; Zhang, Z.X.; Wang, X.; Yi, L.; Liu, F.; Xu, J.Y. Spatial differentiation of land use and landscape pattern changes in the Beijing–Tianjin–Hebei area. Sustainability 2020, 12, 3040. [Google Scholar] [CrossRef] [Green Version]
  24. Deng, S.F. Analysis of Landscape Pattern and Ecosystem Service Value in Jiangxi Province under Land Use Change. Master’s Thesis, East China University of Technology, Nanchang, China, 30 June 2021. [Google Scholar]
  25. Xu, J.X.; Li, G.; Chen, G.L.; Zhao, H.; Qu, J.F. Changes of landscape ecological quality for land reclamation in mining area. Trans. Chin. Soc. Agric. Eng. 2013, 29, 232–239. [Google Scholar]
  26. Zhang, L.; Song, W.; Song, W. Assessment of Agricultural Drought Risk in the Lancang-Mekong Region, South East Asia. Int. J. Environ. Res. Public Health 2020, 17, 6153. [Google Scholar] [CrossRef] [PubMed]
Figure 1. Schematic diagram of the location of the study area and the mines.
Sustainability 14 09590 g001
Figure 2. Spatial variation of land use in open-pit coal mining areas in 2001–2020.
Sustainability 14 09590 g002
Figure 3. The quantile boxplot of landscape fragmentation in the mining areas from 2001 to 2020.
Sustainability 14 09590 g003
Table 1. Overall accuracy and kappa coefficients of land-use classification.
YearClassification ImageKappaOverall Accuracy
2001Landsat 50.9310.962
2002Landsat 50.9370.966
2003Landsat 50.9390.966
2004Landsat 50.9330.963
2005Landsat 50.9350.964
2006Landsat 50.9260.956
2007Landsat 50.9320.963
2008Landsat 50.9310.965
2009Landsat 50.9450.970
2010Landsat 50.9430.969
2011Landsat 50.9430.969
2012Landsat 70.9440.969
2013Landsat 70.9330.965
2014Landsat 80.9540.975
2015Landsat 80.9530.974
2016Landsat 80.9340.964
2017Landsat 80.9500.973
2018Landsat 80.9380.966
2019Landsat 80.9370.966
2020Landsat 80.9340.964
Table 2. The land-use changes of typical open-pit coal mining areas in Inner Mongolia from 2001 to 2020.
YearLand-Use TypesCroplandForestGrasslandWaterbodiesResidential Land and Industrial SquaresMining LandUnused Land
2001Area/km2130.830.04376.396.5424.5378.282.91
2005Area/km2122.800.04390.520.9645.4156.913.16
2010Area/km2112.410.03376.940.3844.3679.716.16
2015Area/km2113.580.04324.962.5869.29104.585.82
2020Area/km2118.820.05315.110.8996.2880.0310.18
2001–2005Area variation/km2−8.02−0.0114.13−5.5820.87−21.360.25
Rate of change/%−6.13−12.503.76−85.2785.08−27.298.64
2005–2010Area variation/km2−10.39−0.01−13.58−0.59−1.0522.793.00
Rate of change/%−8.46−33.33−3.48−61.06−2.3140.0594.96
2010–2015Area variation/km21.170.01−51.982.2124.9424.87−0.33
Rate of change/%1.0453.57−13.79587.7756.2231.21−5.44
2015–2020Area variation/km25.240.01−9.84−1.6926.98−24.554.35
Rate of change/%4.6120.93−3.03−65.6238.94−23.4874.72
2001–2020Area variation/km2−12.000.00−61.27−5.6671.741.757.27
Rate of change/%−9.188.33−16.28−86.44292.442.24249.92
Table 3. The land-use transfer matrix of open-pit mining areas during 2001–2020 (km2).
Land Use TypesCroplandForestGrasslandWaterBodiesResidential Land and Industrial SquaresMining LandUnused Land
Cropland85.580.0137.880.036.510.380.44
Forest0.020.010.000.000.010.000.00
Grassland26.070.03257.350.6868.5816.197.49
Waterbodies4.800.001.540.120.070.010.01
Residential Land and Industrial Squares1.950.005.470.0114.661.630.22
Mining land0.170.0012.020.053.9660.491.59
Unused land0.230.000.860.000.061.320.43
Table 4. The landscape fragmentation of the open-pit mining areas from 2001 to 2020.
Mining Area CodeYear
20012005201020152020
a0.580.520.650.630.65
b0.560.530.520.580.49
c0.510.480.530.420.48
d1.001.001.001.001.00
e0.940.760.590.430.70
f0.720.670.620.650.54
g0.780.890.830.750.78
h0.550.270.460.590.67
i0.930.830.850.700.77
j0.220.220.270.270.19
k0.750.510.590.710.64
l0.850.720.780.670.79
m0.970.780.890.900.84
Publisher’s Note: MDPI stays neutral with regard to jurisdictional claims in published maps and institutional affiliations.

