Data-Driven Resource Efficiency Evaluation and Improvement of the Logistics Industry in 30 Chinese Provinces and Cities
Abstract
1. Introduction
1.1. Research Background
1.2. Research Review
- (1)
- Evaluation index system of the LIE
- (2)
- Measurement and evaluation of the LIE
- (3)
- Measurement and evaluation of the LIE
1.3. Research Gaps
- (1)
- The LIRE is less studied, but the LIRE can best reflect the connotations of the LISD. Existing studies primarily consider the impact of the LI on the environment to establish the evaluation index system, but it is critical to construct its evaluation index system by considering economic, social, and environmental factors comprehensively. As a result, accurately measuring and evaluating the LIRE is an urgent issue to promote the LI’s sustainable development.
- (2)
- The use of DEA models has matured in the measurement and evaluation of the LI’s efficiency, but there are various forms of DEA models. Traditional CCR and BBC models are not suitable for dealing with non-desired outputs, and the super-efficiency-SBM-non-desired output model still has some shortcomings [29]. It cannot deal with both radial and non-radial cases, and the measurement results are low and do not correspond to the actual situation. Furthermore, one of the important aspects of the evaluation is characterizing spatial evolution, and there is still a scarcity of LIRE spatial evolution research. As a result, more realistic models and methods for measuring and evaluating RE must be used to effectively analyze and optimize it.
- (3)
- In terms of suggested responses, the majority of the research findings have been made in terms of factors influencing the LI’s efficiency, and further research is needed to provide more precise policy guidance based on spatial and temporal evolution characteristics.
1.4. Research Innovations
1.5. Theoretical Value and Practical Significance
1.6. Manuscript Structure
2. Materials and Methods
2.1. Methodology Flow
2.2. Data Gathering
2.3. Data Processing
2.4. Data Model
2.4.1. Super-EBM-Undesirable Model
2.4.2. Global Malmquist–Luenberger Index Model (GML)
2.4.3. Spatial Autocorrelation Model
2.5. Data Application
3. Case Study
3.1. Case Study Background
3.2. Results
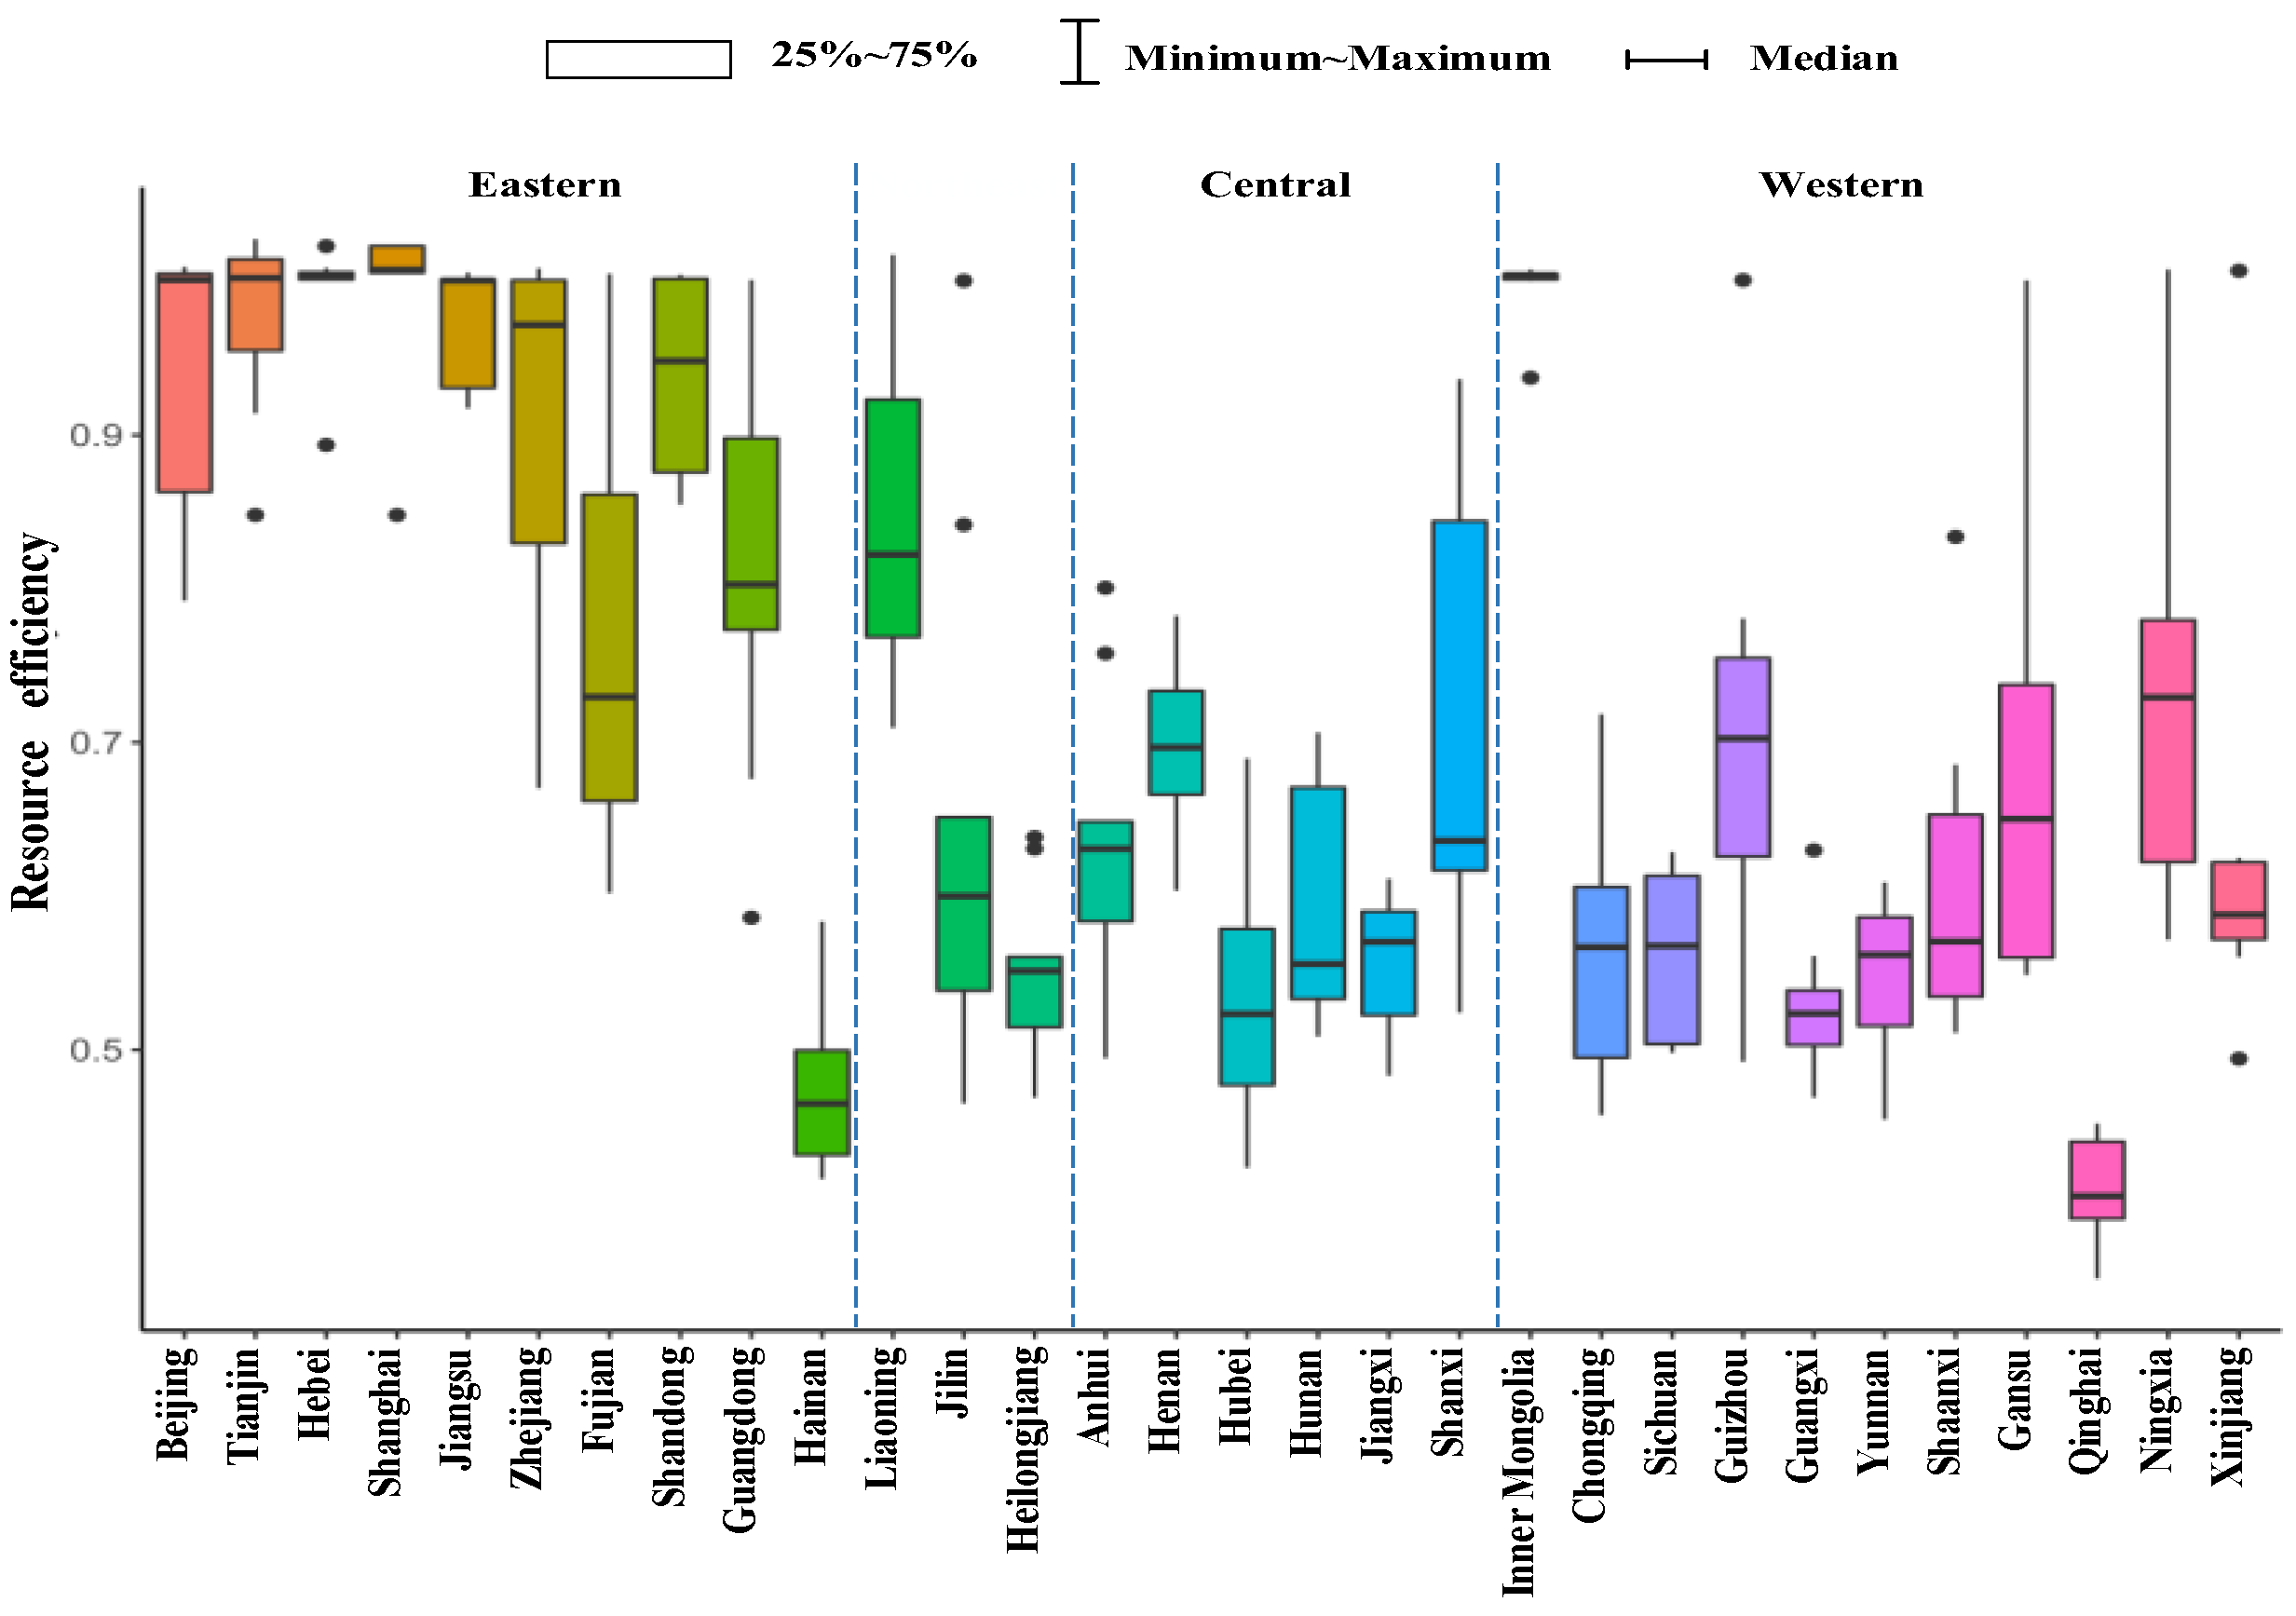
3.2.1. Static Evaluation of China’s LIRE Measurements
3.2.2. LIRE’s Dynamic Evaluation Results
3.2.3. LIRE’s Spatial Evolution Results
- (1)
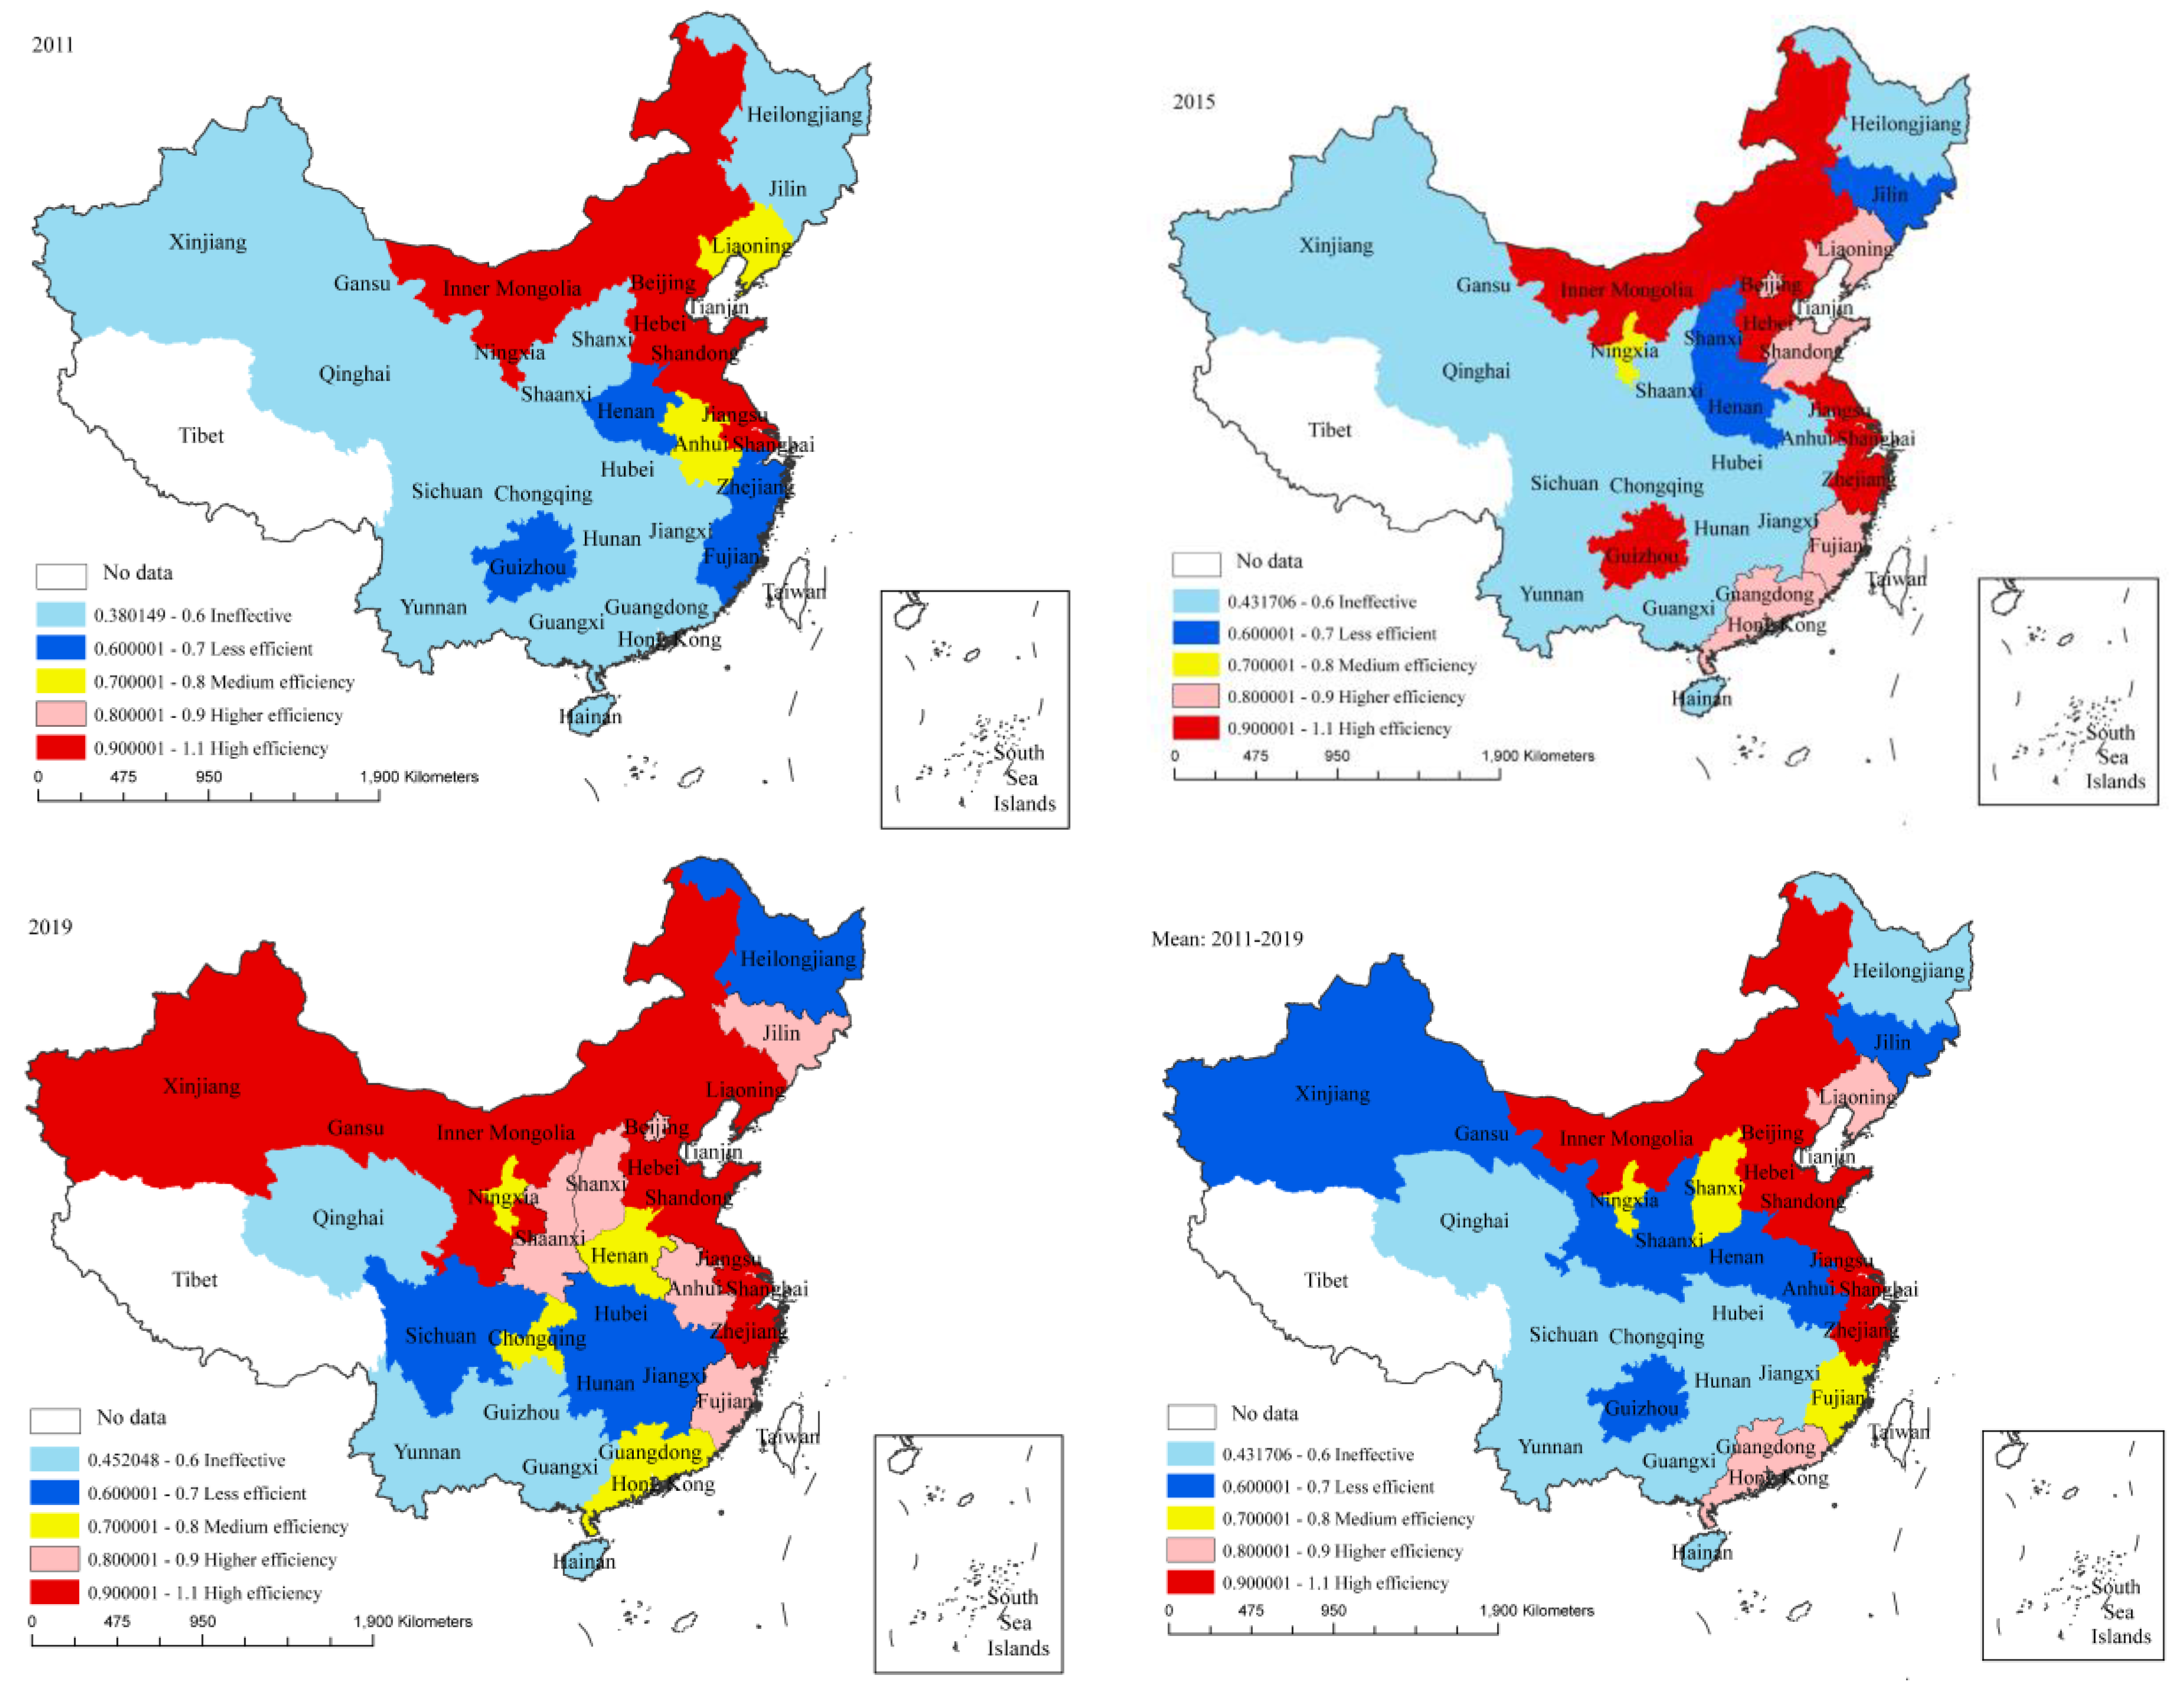
- Spatial Heterogeneity Analysis
- (2)
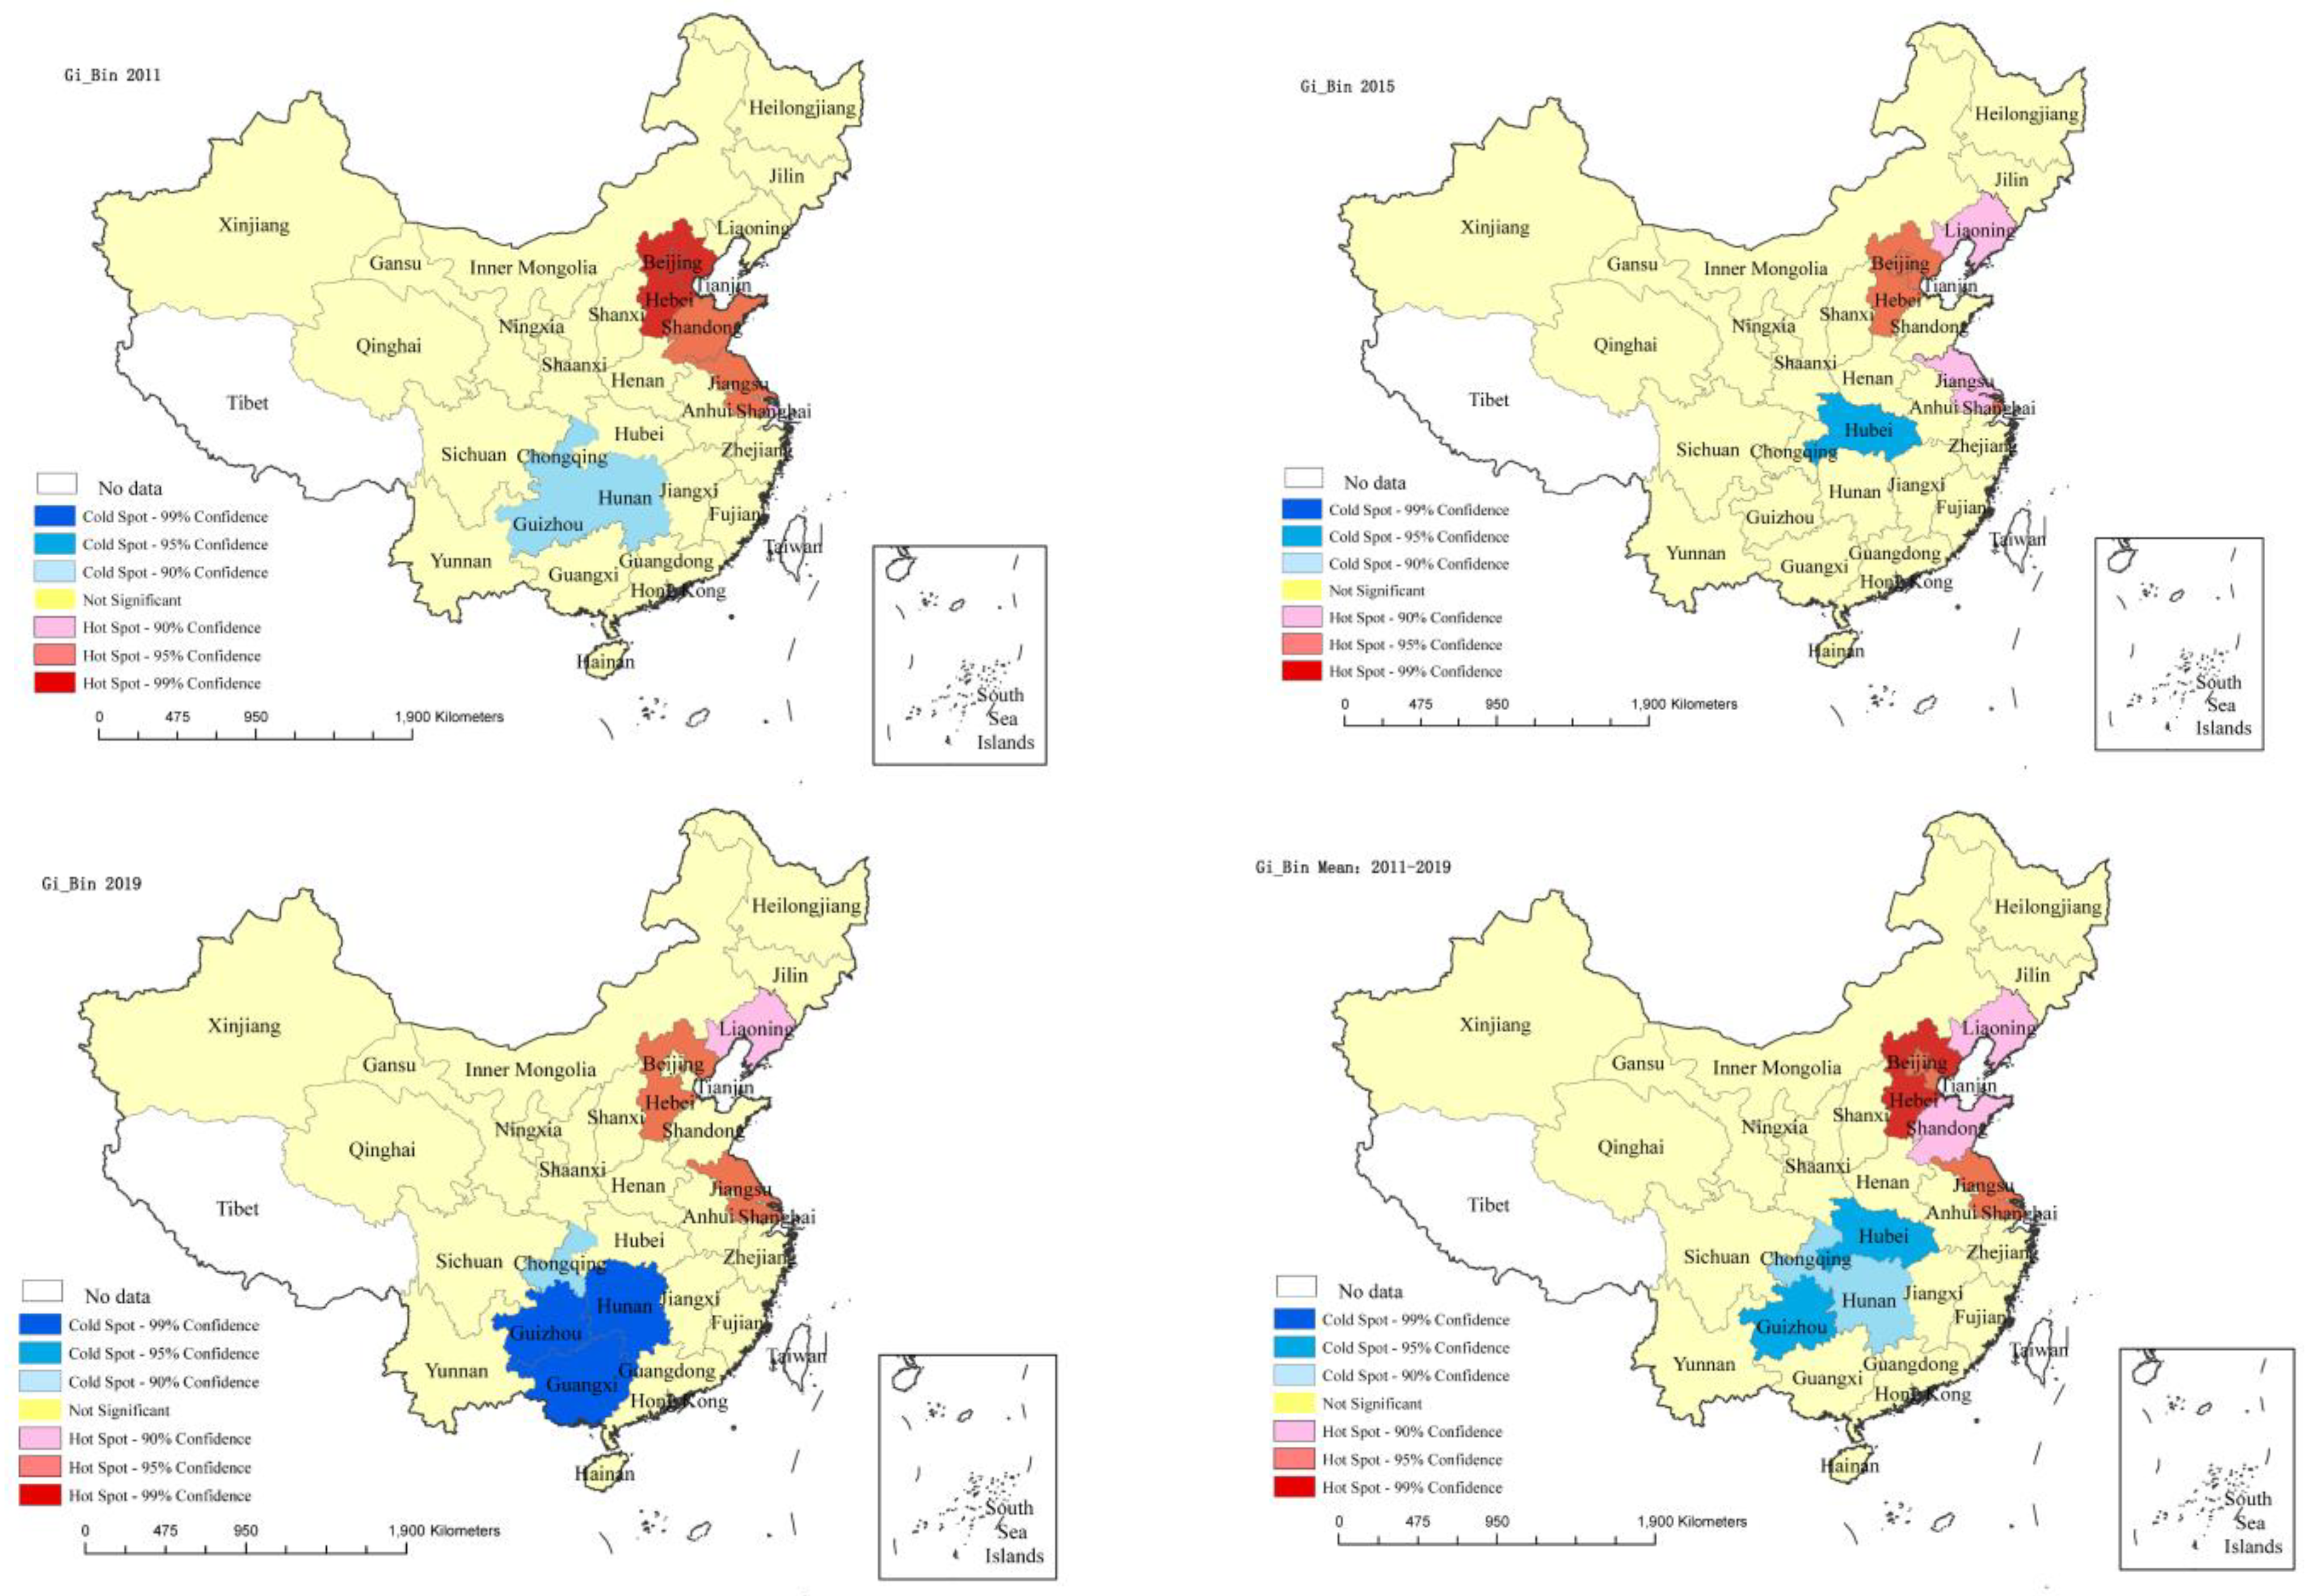
- Spatial agglomeration analysis
3.3. Policy Recommendations
3.3.1. Increase Technology Efficiency and Strengthen Technological Innovation
3.3.2. Develop Differentiated Improvement Countermeasures and Establish a Linkage Development Mechanism
3.3.3. Promote Coordinated Economic, Social and Environmental Development from a Sustainable Perspective
3.4. Discussion and Management Insights
4. Conclusions
Author Contributions
Funding
Institutional Review Board Statement
Informed Consent Statement
Data Availability Statement
Acknowledgments
Conflicts of Interest
References
- Li, M.J.; Wang, J. Spatial-temporal evolution and influencing factors of total factor productivity in China’s logistics industry under low-carbon constraints. Environ. Sci. Pollut. Res. 2022, 29, 883–900. [Google Scholar] [CrossRef]
- Bai, D.L.; Dong, Q.L.; Syed, A.R.K.; Chen, Y.; Wang, D.F.; Yang, L. Spatial analysis of logistics ecological efficiency and its influencing factors in China: Based on super-SBM-undesirable and spatial Dubin models. Environ. Sci. Pollut. Res. 2022, 29, 10138–10156. [Google Scholar] [CrossRef]
- Ekins, P.; Hughes, N.; Bringezu, S.; Clarke, C.A. Resource Efficiency: Potential and Economic Implications Summary for Policymakers. UNEP International Resources Panel; Researchgate: Paris, France, 2016; p. 5. [Google Scholar] [CrossRef]
- Bruce A Forster. Pollution control is a two-sector dynamic general equilibrium model. J. Environ. Econ. Manag. 1977, 4, 305–312. [Google Scholar] [CrossRef]
- Ding, H.; Liu, Y.; Zhang, Y.; Wang, S.; Guo, Y.; Zhou, S.; Liu, C. Data-driven evaluation and optimization of the sustainable development of the logistics industry: Case study of the Yangtze River Delta in China. Environ. Sci. Pollut. Res. 2022, 5, 1–15. [Google Scholar] [CrossRef]
- Jiang, X.H.; Ma, J.X.; Zhu, H.Z.; Guo, X.C.; Huang, Z.G. Evaluating the Carbon Emissions Efficiency of the Logistics Industry Based on a Super-SBM Model and the Malmquist Index from a Strong Transportation Strategy Perspective in China. Int. J. Environ. Res. Public Health 2020, 17, 8459. [Google Scholar] [CrossRef]
- Zhang, H.; You, J.M.; Haiyirete, X.; Zhang, T.Y. Measuring Logistics Efficiency in China Considering Technology Heterogeneity and Carbon Emission through a Meta-Frontier Model. Sustainability 2020, 12, 8157. [Google Scholar] [CrossRef]
- Zhang, R.; Hu, Y.Y.; Qie, X.T. Research on the dynamic response of energy eco-efficiency and its influencing factors in China’s logistics industry. Econ. Issues 2021, 8, 9–17. [Google Scholar] [CrossRef]
- Quesada-Mateo, C.A.; Solís-Rivera, V. Costa Rica’s national strategy for sustainable development: A summary. Futures 1990, 22, 396–416. [Google Scholar]
- Bach, V.; Berger, M.; Henssler, M.; Kirchner, M.; Leiser, S.; Mohr, S.; Rother, E.; Ruhland, K.; Schneider, L.; Tikana, L. Integrated method to assess resource efficiency e ESSENZ. J. Clean Prod. 2016, 137, 118–130. [Google Scholar] [CrossRef]
- Long, R.Y.; Ouyang, H.Z.; Guo, H.Y. Super-slack-based measuring data envelopment analysis on the spatial-temporal patterns of logistics ecological efficiency using global malmquist. Environ. Technol. Innov. 2020, 18, 100770–100784. [Google Scholar] [CrossRef]
- Xia, W.H.; Chen, Z.Y.; Li, Y.Q. Logistics resources integrating efficiency based on the multi-objective decision model. J. Rail Way Sci. Eng. 2009, 6, 86–90. [Google Scholar] [CrossRef]
- Qi, L.; Chung, G.Y.; Kim, H.H. Analysis on Logistics Efficiency of China’s Agricultural Products Cold Chain from the Green Perspective. Technology 2020, 8, 192–203. [Google Scholar] [CrossRef]
- Li, X.; Lin, C. The Energy Efficiency and the Main Influencing Factors for the Logistics Industry in the Yangtze River Economic Belt in China. Nat. Soc. 2021, 2021, 4221253. [Google Scholar] [CrossRef]
- Odeck, J.; Bråthen, S. A meta-analysis of DEA and SFA studies of the technical efficiency of seaports: A comparison of fixed and random-effects regression models. Transp. Res. Part A Policy Pract. 2012, 46, 1574–1585. [Google Scholar] [CrossRef]
- Wang, D.L.; Wan, K.D.; Yang, J.Y. Ecological efficiency of coal cities in China: Evaluation and influence factors. Nat. Hazards 2018, 95, 363–379. [Google Scholar] [CrossRef]
- Egilmez, G.; Park, Y.S. Transportation related carbon, energy and water footprint analysis of U.S. manufacturing: An eco-efficiency assessment. Transp. Res. Part D Transp. Environ. 2016, 32, 143–159. [Google Scholar] [CrossRef]
- Kounetas, K.E.; Polemis, M.L.; Tzeremes, N.G. Measurement of eco-efficiency and convergence: Evidence from a non-parametric frontier analysis. Eur. J. Oper. Res. 2021, 291, 365–378. [Google Scholar] [CrossRef]
- Yang, L.; Zhang, X. Assessing regional eco-efficiency from the perspective of resource, environmental and economic performance in China: A bootstrapping approach in global data envelopment analysis. J. Clean Prod. 2018, 173, 100–111. [Google Scholar] [CrossRef]
- Zhou, C.S.; Shi, C.Y.; Wang, S.J.; Zhang, G.J. Estimation of eco-efficiency and its influencing factors in Guangdong province based on SuperSBM and panel regression models. Ecol. Indic. 2018, 86, 67–80. [Google Scholar] [CrossRef]
- Andersen, P.; Petersen, N.C. A procedure for ranking efficient units in data envelopment analysis. Manag. Sci. 1993, 39, 1261–1264. [Google Scholar] [CrossRef]
- Tone, K. A slacks-based measure of super-efficiency in data envelopment analysis. Eur. J. Oper. Res. 2002, 143, 32–41. [Google Scholar] [CrossRef]
- Tone, K. Slacks-Based Measure of Efficiency. Handb. Data Envel. Anal. 2011, 164, 195–209. [Google Scholar] [CrossRef]
- Caiado, R.G.G.; De Freitas, D.R.; Mattos, L.V.; Quelhas, O.L.G.; Leal Filho, W. Towards sustainable development through the perspective of eco-efficiency-a systematic literature review. J. Clean Prod. 2017, 165, 890–904. [Google Scholar] [CrossRef]
- Meng, M.; Qu, D.L. Understanding the green energy efficiencies of provinces in China: A Super-SBM and GML analysis. Energy 2022, 239, 1. [Google Scholar] [CrossRef]
- Ma, S.W.; Xie, D.T.; Zhang, X.C.; Peng, Z.T.; Zhu, H.; Hong, H.K.; Xiao, J.J. Spatiotemporal variation in the ecological status of the Three Gorges Reservoir area in Chongqing, China. Acta Ecol. Sin. 2018, 38, 8512–8525. [Google Scholar] [CrossRef][Green Version]
- Dong, Q.L.; Bai, D.L.; Wang, D.F. Research on Ecological Efficiency and Pollution Reduction Potential of Logistics Industry in the Yellow River Basin. Ecol. Econ. 2021, 37, 34–42. [Google Scholar]
- Chen, J.H.; Wan, Z.; Zhang, F.W.; Park, N.K.; He, X.H.; Yin, W.Y. Operational efficiency evaluation of iron ore logistics at the ports of Bohai Bay in China: Based on the PCA-DEA Model. Math. Probl. Eng. 2016, 2016, 9604819. [Google Scholar] [CrossRef]
- Avkiran, N.K.; Rowlands, T. How to better identify the true managerial performance: State of the art using DEA. Omega 2008, 36, 317–324. [Google Scholar] [CrossRef]
- Liu, C.H.; Gao, M.D.; Zhu, G.; Zhang, C.X.; Cai, W. Data driven eco-efficiency evaluation and optimization in industrial production. Energy 2021, 224, 120170. [Google Scholar] [CrossRef]
- Wang, C.; Zhang, C.X.; Hu, F.G.; Wang, Y.; Yu, L.; Liu, C.H. Emergy-based ecological efficiency e-valuation and optimization method for logistics parks. Environ. Sci. Pollut. Res. 2021, 28, 58342–58354. [Google Scholar] [CrossRef]
- Liu, C.P.; Li, W. The Literature Review on Efficiency Evaluation of the Logistics Industry in China Using the Data Envelopment Analysi. China Bus. Mark. 2016, 11, 12–21. [Google Scholar] [CrossRef]
- Cao, B.R.; Kong, Z.Y.; Deng, L.J. A study on provincial logistics efficiency and spatial and temporal evolution in the Yangtze River Economic Belt. Geoscience 2019, 39, 1841–1848. [Google Scholar] [CrossRef]
- Deng, F.M.; Xu, L.; Fang, Y.; Gong, Q.X.; Li, Z. PCA-DEA-Tobit Regression Assessment with Carbon Emission Constraints of China’s Logistics Industry. J. Clean Prod. 2020, 271, 12548. [Google Scholar] [CrossRef]
- Wang, Y.F. Research on the Evaluation of High-Quality Development of the Logistics Industry. Master’s Thesis, Henan University of Technology, Zhengzhou, China, 2020. [Google Scholar] [CrossRef]
- Mariano, E.B.; Gobbo, J.J.A.; Camioto, F.C.; do Rebelatto, D.A. CO2 Emissions and Logistics Performance: A Composite Index Proposal. J. Clean Prod. 2016, 163, 166–178. [Google Scholar] [CrossRef]
- Yang, J.N.; Tang, L.; Mi, Z.F.; Liu, S.; Li, L.; Zheng, J.L. Carbon emissions performance in Logistics at the City Level. J. Clean Prod. 2019, 231, 1258–1266. [Google Scholar] [CrossRef]
- National Bureau of Statistics of the People’s Republic of China. China Statistical Yearbook; China Statistics Press: Beijing, China, 2012–2020.
- Energy Statistics Division of the National Bureau of Statistics. China Energy Statistical Yearbook; China Statistics Press: Beijing, China, 2012–2020.
- Sun, H.; Hu, X.Y.; Nie, F.F. Spatio-temporal Evolution and Socio-economic Drivers of Primary Air Pollutants from Energy Consumption in the Yangtze River Delta. China Environ. Manag. 2019, 11, 71–78. [Google Scholar] [CrossRef]
- 2006 IPCC Guidelines for National Greenhouse Gas Inventories. Available online: http://www.ipcc-nggip.iges.or.jp./public/2006gl/index.html (accessed on 20 May 2022).
- Li, L.; Lei, Y.L.; Wu, S.M.; Zhao, Y.H.; Luo, J.Y.; Wang, Y.F.; Chen, J.B.; Yan, D. Evaluation of future energy consumption on PM2.5 emissions and public health economic loss in Beijing. J. Clean Prod. 2018, 187, 1115–1128. [Google Scholar] [CrossRef]
- Tsutsui, M.; Tone, K. An epsilon-based measure of efficiency in DEA. Eur. J. Oper. Res. 2009, 207, 9–13. [Google Scholar] [CrossRef]
- Liu, L. Research on the Evaluation of Eco-Efficiency in Northeast China Based on Improved EBM Model. Ph.D. Thesis, China University of Geosciences, Beijing, China, 2020. [Google Scholar] [CrossRef]
- Fan, J.P.; Xiao, H.; Fan, X.H. An improved EBM-DEA three-stage model considering undesired outputs--An Empirical Analysis Based on the Efficiency of China’s Interprovincial Logistics Industry. Chin. J. Manag. Sci. 2017, 25, 166–174. [Google Scholar] [CrossRef]
- Yue, L.; Li, W.B. Typical urban land use efficiency in China under environmental constraints based on DDF-Global Malmquist-Luenberger index modeling. Resour. Sci. 2017, 39, 597–607. [Google Scholar] [CrossRef]
- Oh, D.H. A global Malmquist-Luenberger productivity index. J. Product. Anal. 2010, 34, 183–197. [Google Scholar] [CrossRef]
- Ray, S.C.; Desli, E. Productivity Growth, Technical Progress, and Efficiency Change in Industrialized Countries: Comment. Am. Econ. Rev. 1997, 87, 1033–1039. [Google Scholar]
- Anselin, L. Local indicators of spatial association-LISA. Geogr. Anal. 1995, 27, 93–115. [Google Scholar] [CrossRef]
- Zhang, L.Y.; Gao, W.Q.; Li, J.J.; Wang, H. Analysis of Spatial and Temporal Patterns of PM2.5 Cold and Hot Spots in Beijing-Tianjin-Hebei Region from 2014 to 2018. Tianjin Sci. Technol. 2020, 47, 31–37. [Google Scholar] [CrossRef]
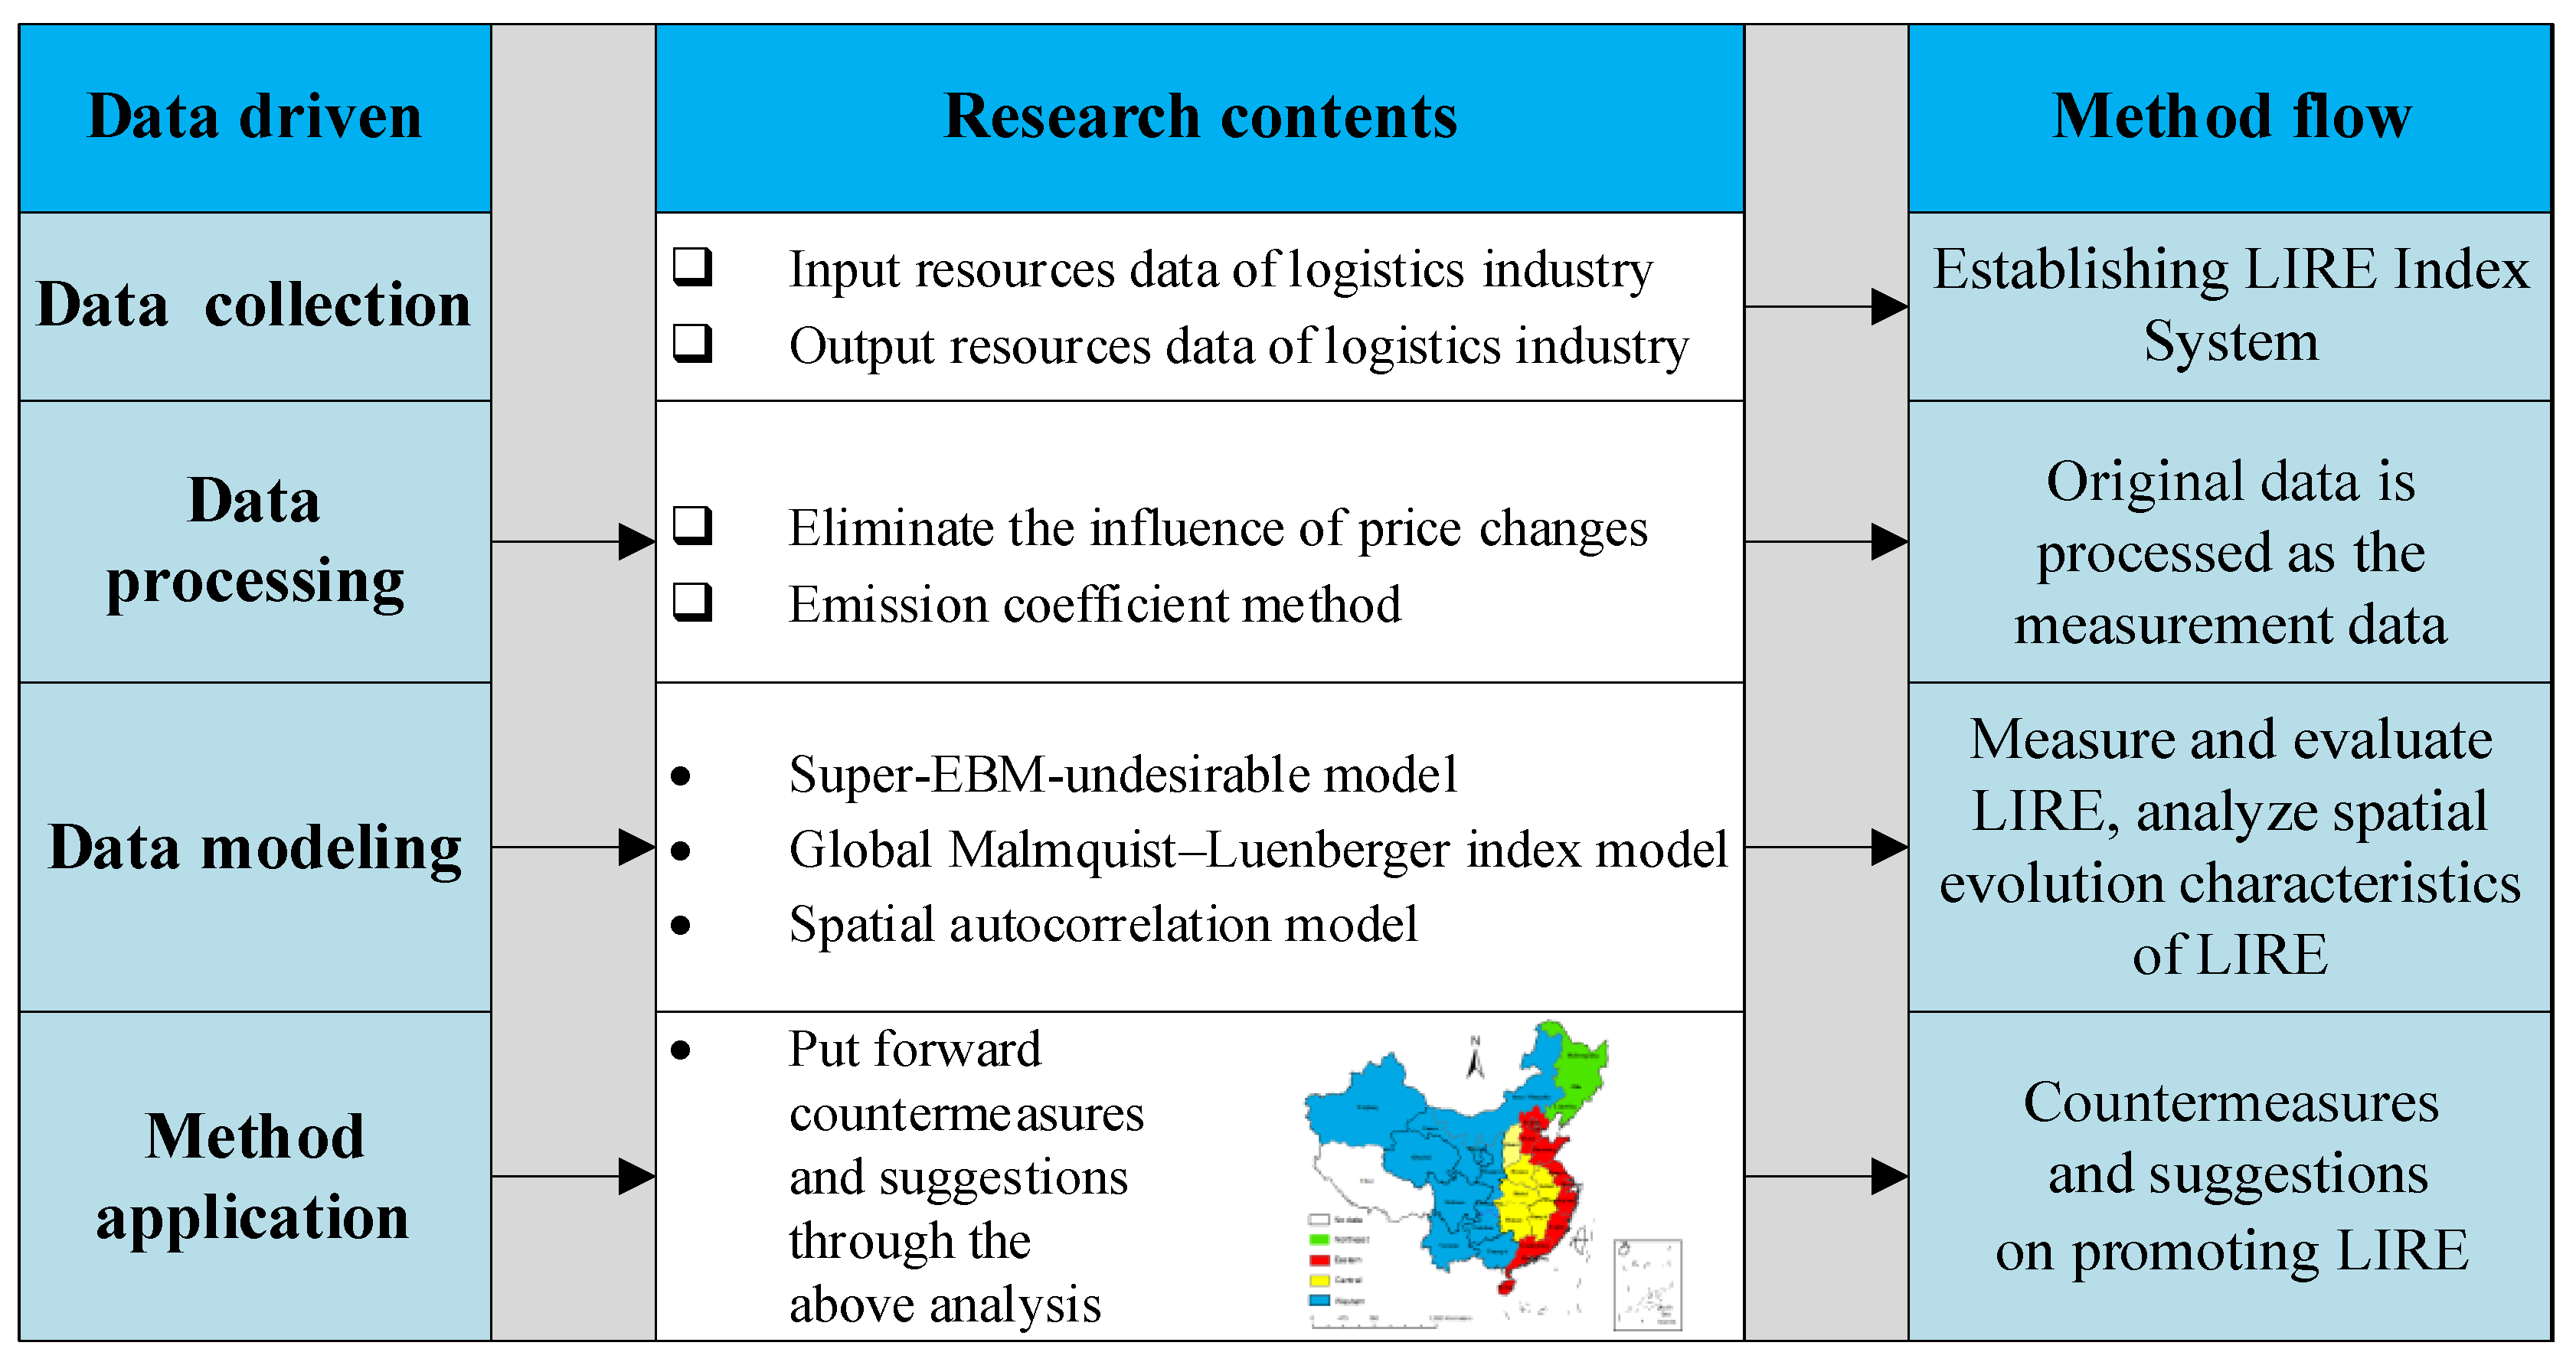
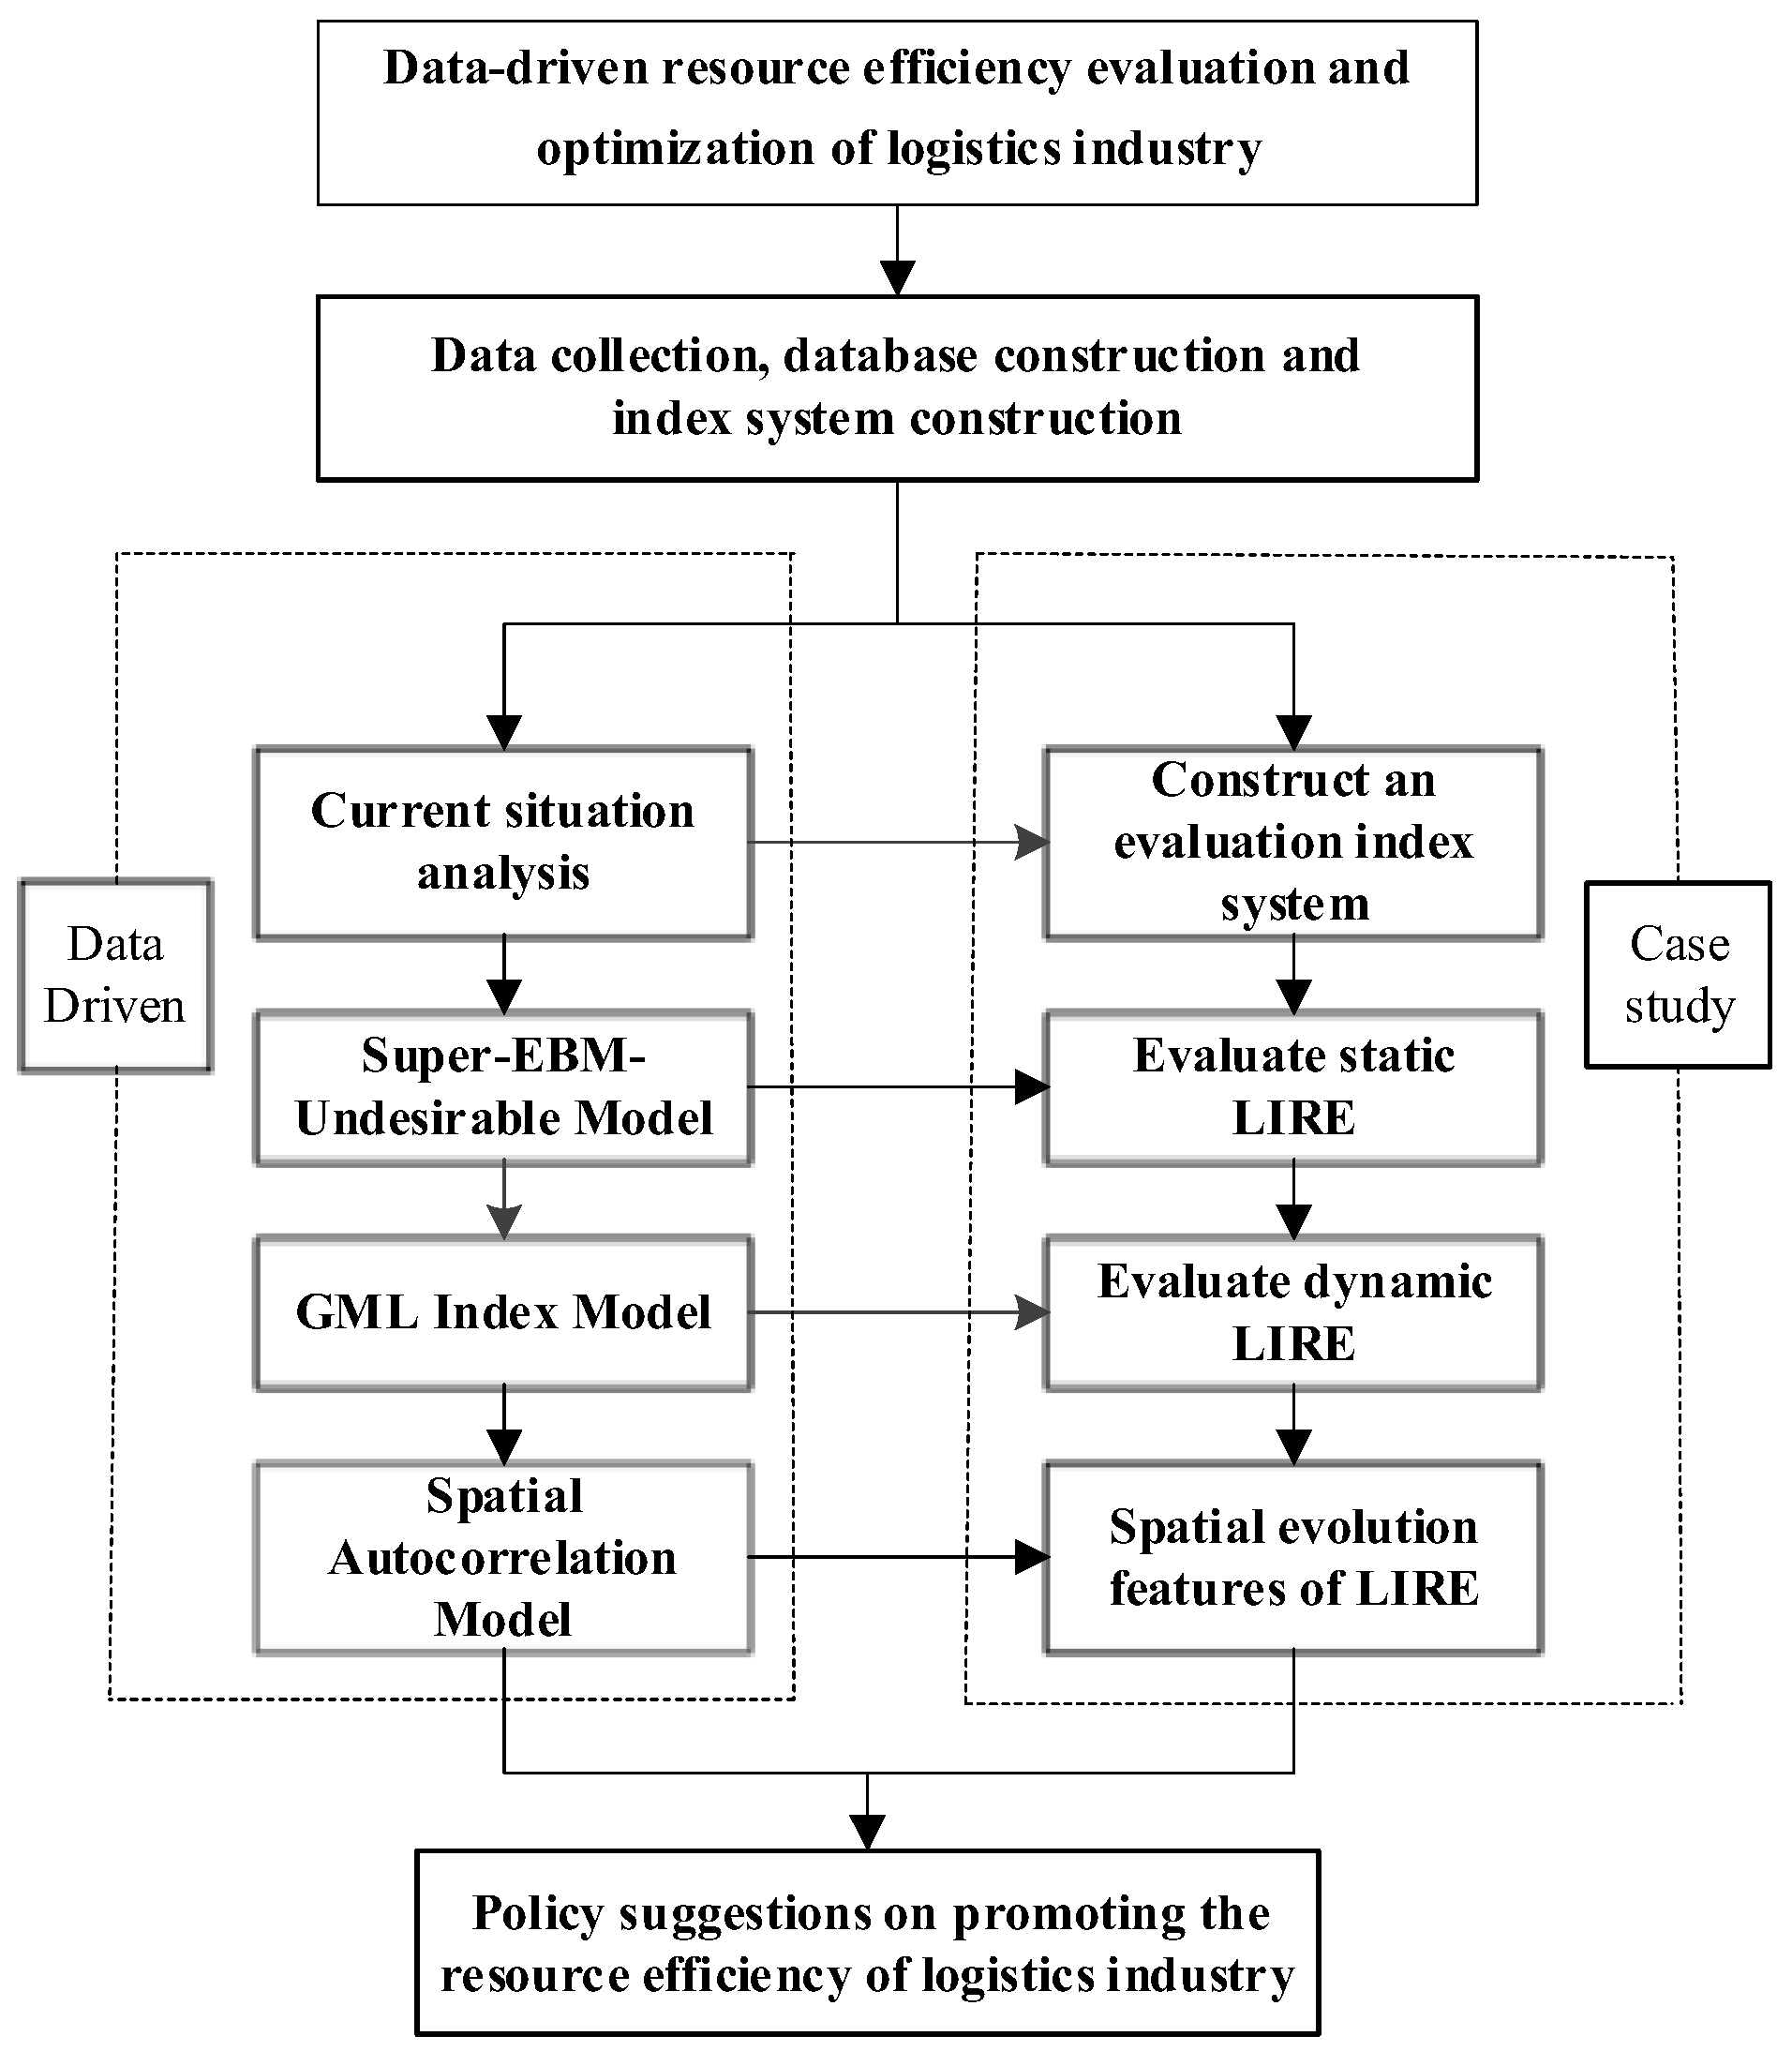

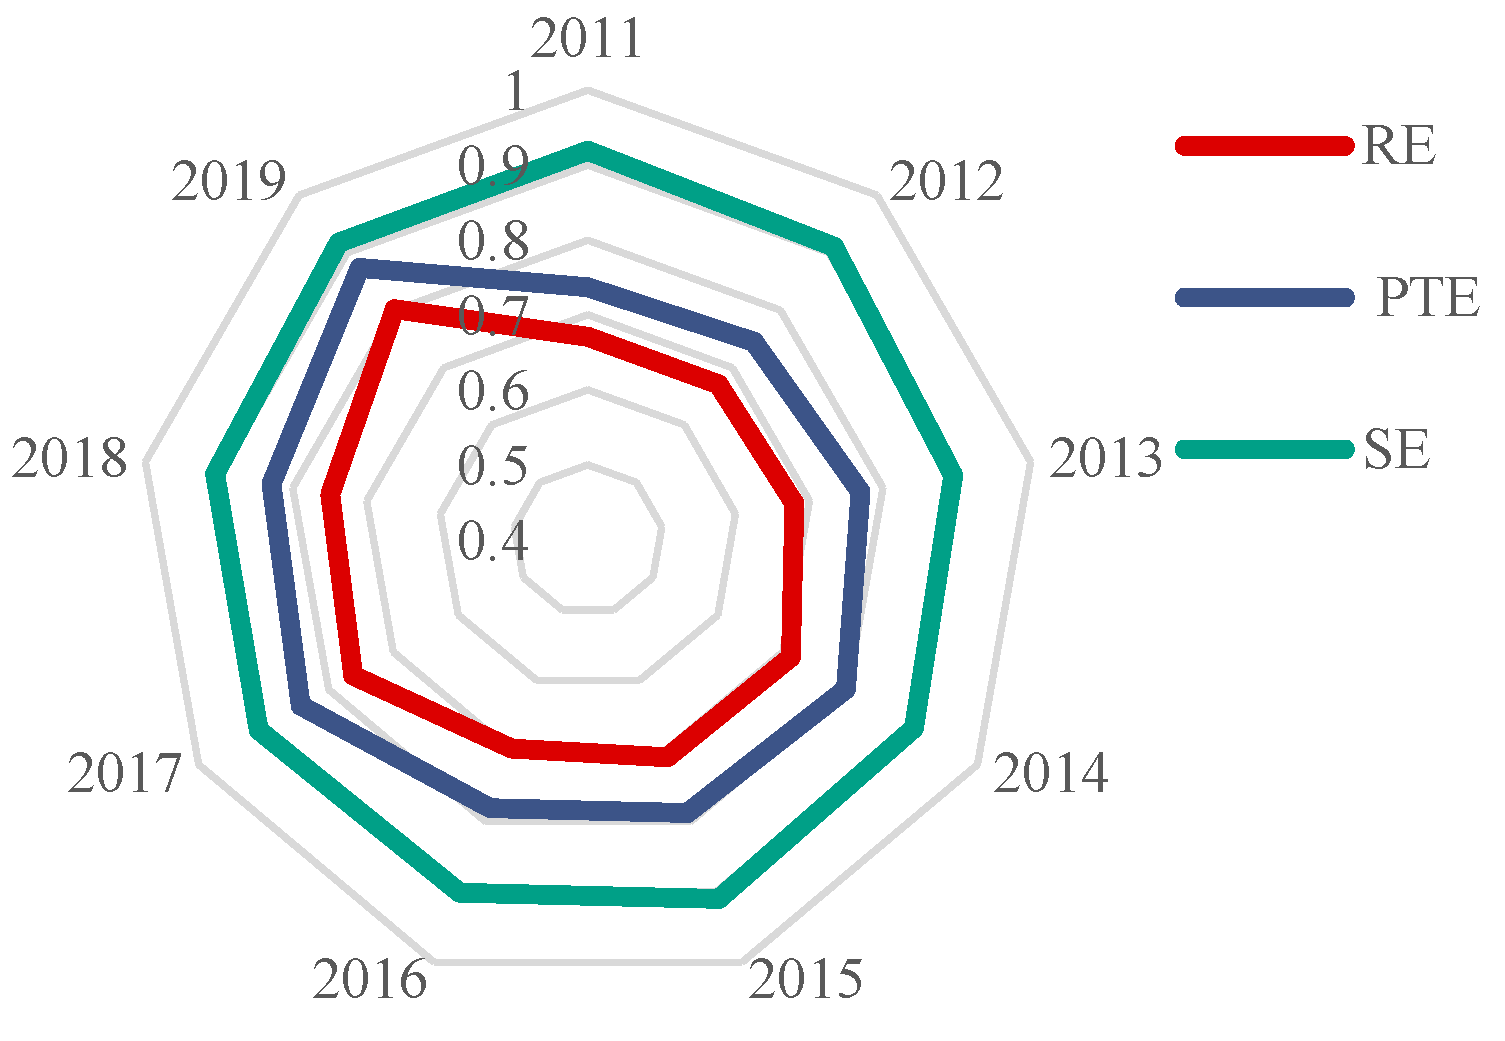
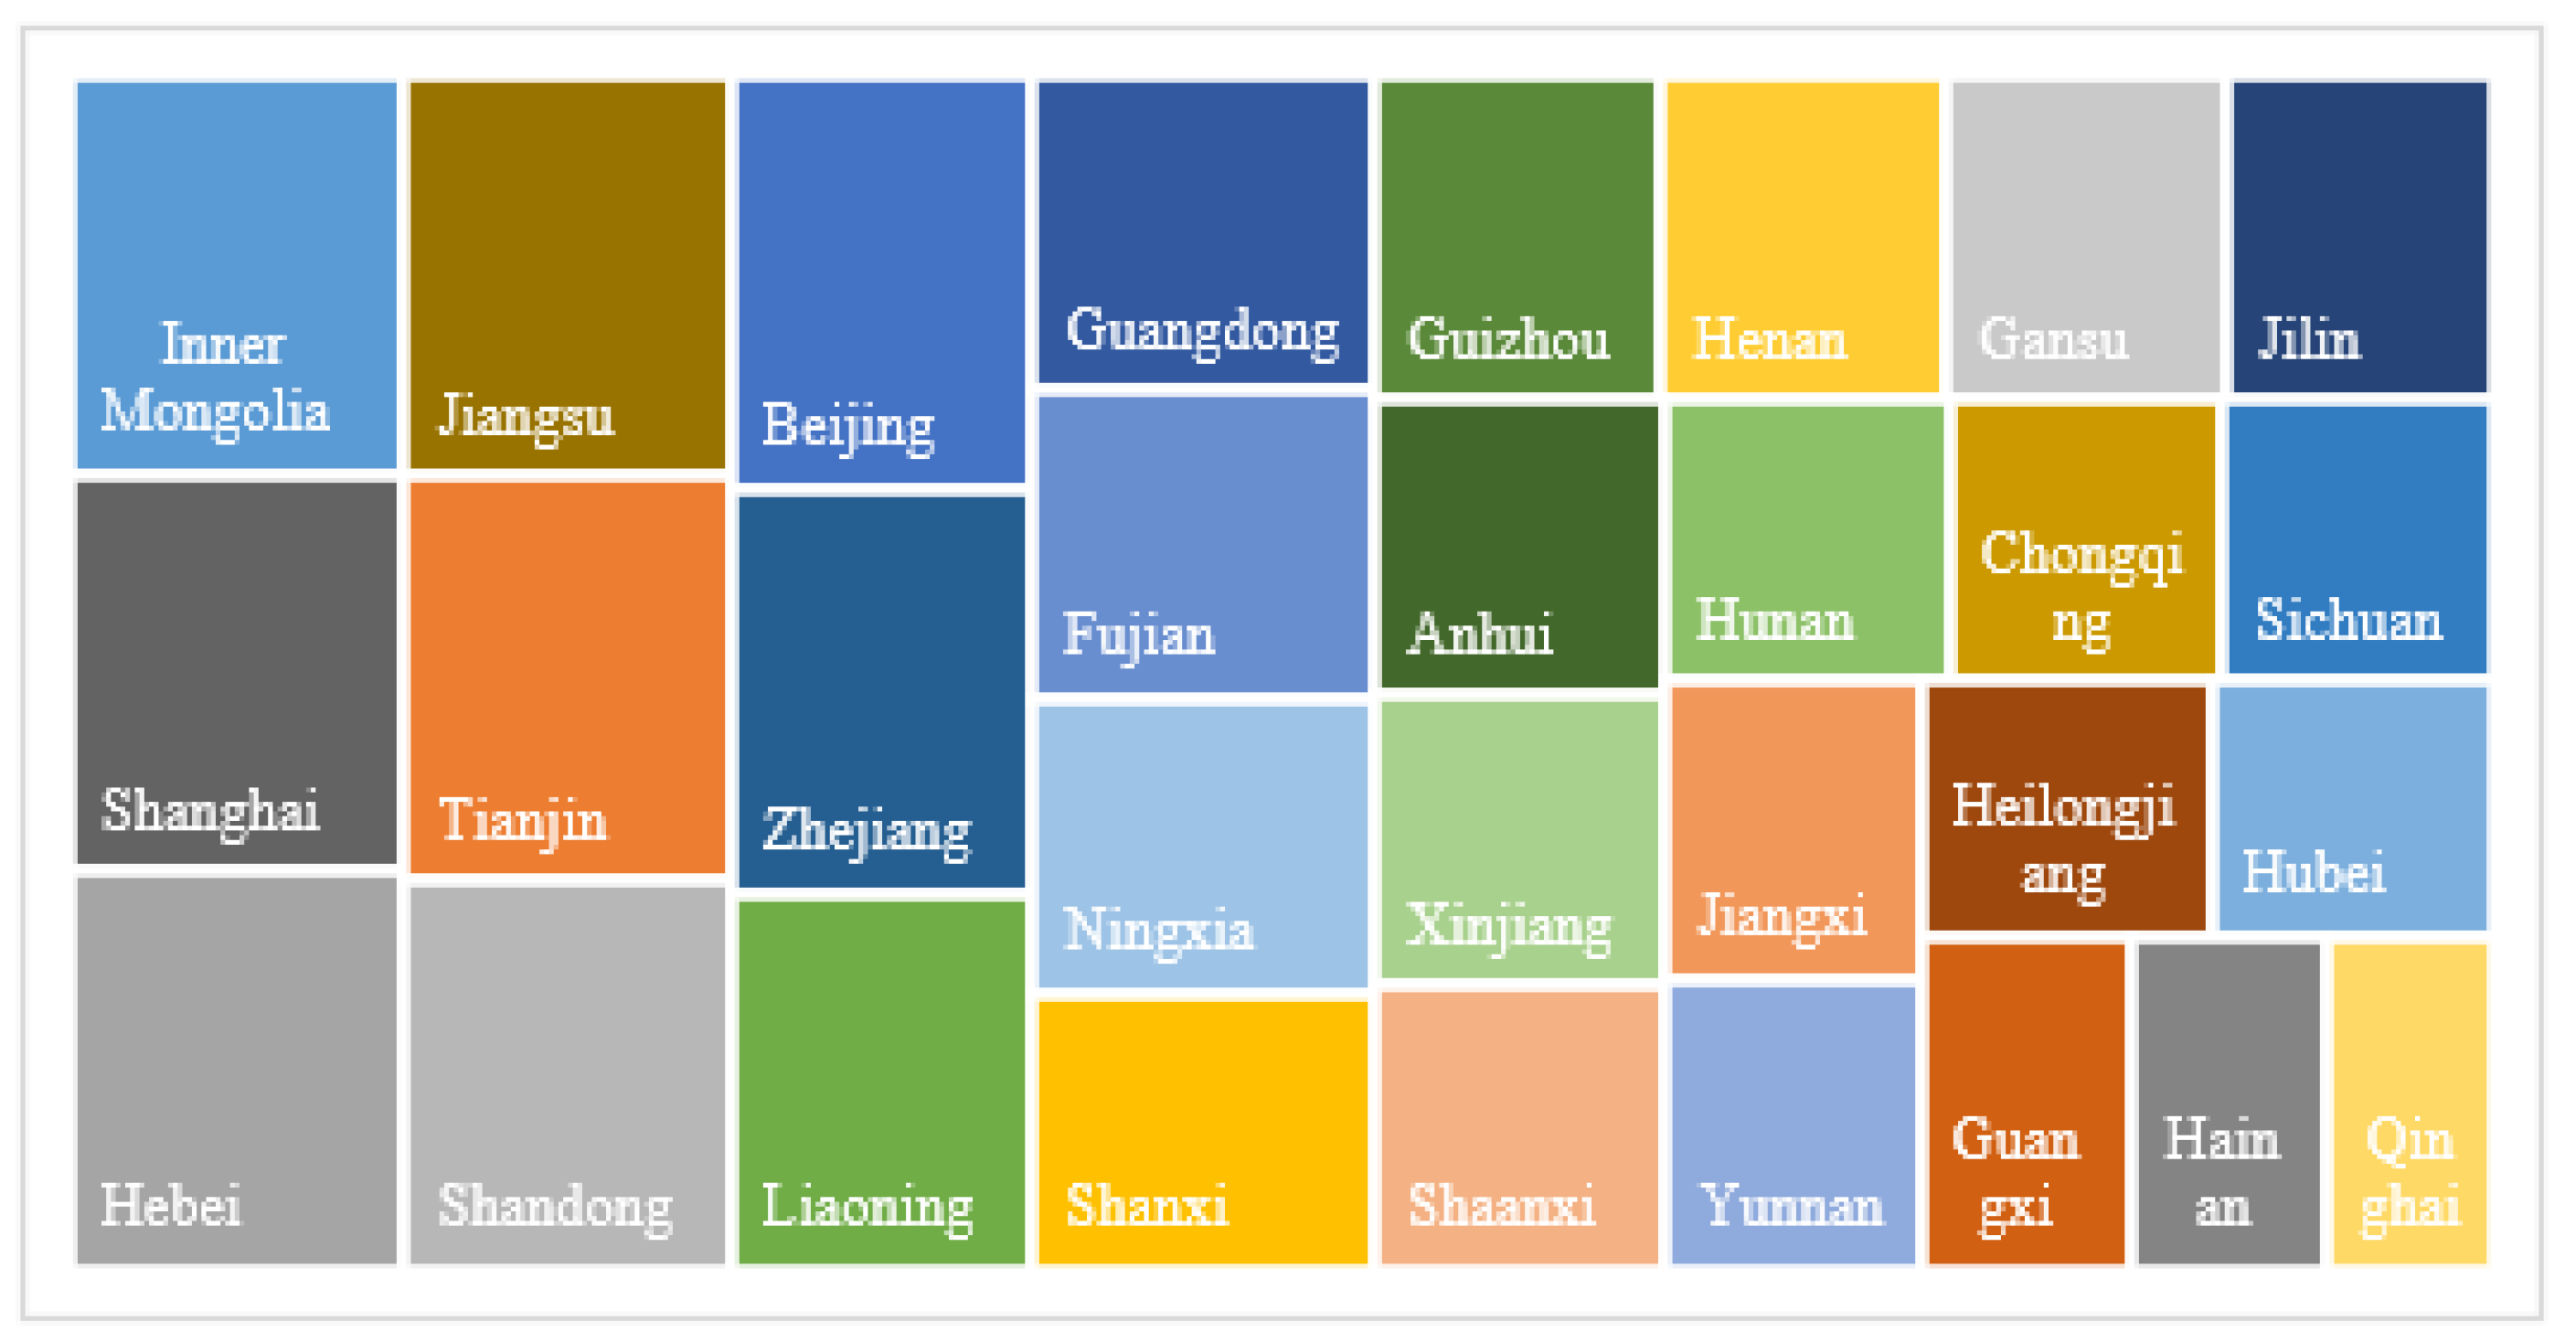


| Indicator Category | Indicator Name | Unit | Indicator Description | References |
|---|---|---|---|---|
| Input indicators of the LI resource | Number of practitioners | 10 thousand persons | Human input | [11] |
| Investment in fixed assets | 100 million CNY | Capital investment | [11] | |
| Number of vehicles carrying goods | 10 thousand units | Infrastructure inputs | [33] | |
| Logistics network mileage | km | Infrastructure inputs | [11] | |
| Internet broadband access port | 10 thousand units | Information technology input | [33] | |
| Energy consumption | 104 tons of standard coal | Energy consumption | [11] | |
| The expected output of the LI resources | Freight turnover | 100 million tons/km | Transport results | [11] |
| Value added of the LI | 100 million CNY | Economic benefits | [11] | |
| Vehicle tax revenue | 100 million CNY | Social contribution | [35] | |
| The undesired output of the LI resources | CO2 emissions of the LI | 10 thousand tons | Carbon emissions | [2] |
| Exhaust emissions of the LI | 10 thousand tons | Environmental pollution | [2] | |
| Property damage in traffic accidents | 100 million CNY | Negative social impact | [35] |
| Energy Type | Raw Coal | Coal Washing | Other Coal Washing | Coal Products | Petrol | Paraffin |
|---|---|---|---|---|---|---|
| Discount factor for standard coal | 0.7143 | 0.9 | 0.45 | 0.5286 | 1.4714 | 1.4714 |
| Carbon emission factor | 0.7669 | 0.765 | 0.8079 | 0.7669 | 0.5571 | 0.5723 |
| Energy Type | Diesel | Fuel Oil | Liquefied Petroleum Gas | Other Petroleum Products | Natural Gas | Electricity |
| Discount factor for standard coal | 1.4571 | 1.4286 | 1.7143 | 1.2 | 12.143 | 1.229 |
| Carbon emission factor | 0.5913 | 0.6176 | 0.5042 | 0.5857 | 0.4478 | 0.29 |
| Indicators | Coal kg/t | Washed Coal kg/t | Other Washed Coal kg/t | Gasoline kg/t | Paraffin kg/t | Diesel kg/t | Fuel Oil kg/t | Natural Gas g/m3 | Liquefied Natural Gas kg/t |
|---|---|---|---|---|---|---|---|---|---|
| SO2 | 10.0 | 10 | 10 | 1.6 | 2.75 | 2.24 | 2.24 | 0.18 | 0.18 |
| NOX | 4.0 | 4 | 4 | 16.7 | 5.09 | 9.62 | 5.84 | 1.76 | 2.1 |
| PM2.5 | 0.74 | 0.74 | 0.74 | 0.125 | 0.06 | 0.31 | 0.31 | 0.17 | 0.15 |
| PM10 | 1.61 | 1.61 | 1.61 | 0.25 | 1.6 | 0.31 | 0.31 | 0.24 | 0.22 |
| Period | GTRECH | GPEC | GPTC | GSCH |
|---|---|---|---|---|
| 2011–2012 | 0.986545 | 1.106506 | 0.874654 | 1.035832 |
| 2012–2013 | 1.031052 | 1.010661 | 1.034 | 0.993093 |
| 2013–2014 | 1.054622 | 1.029002 | 1.018535 | 1.01033 |
| 2014–2015 | 0.99586 | 0.966364 | 1.027188 | 1.01447 |
| 2015–2016 | 0.989223 | 1.021952 | 0.990409 | 0.984948 |
| 2016–2017 | 1.102431 | 1.035214 | 1.059734 | 1.011826 |
| 2017–2018 | 0.988786 | 1.005472 | 1.000209 | 0.995219 |
| 2018–2019 | 1.098424 | 1.046088 | 1.050486 | 1.008745 |
| Mean | 1.030868 | 1.027657 | 1.006902 | 1.006808 |
| 2011 | 2012 | 2013 | 2014 | 2015 | 2016 | 2017 | 2018 | 2019 | |
|---|---|---|---|---|---|---|---|---|---|
| Global Moran’s I | 0.5075 | 0.4535 | 0.4691 | 0.4042 | 0.2536 | 0.3852 | 0.3930 | 0.4647 | 0.4110 |
| Z | 4.3985 | 3.9701 | 4.0962 | 3.5520 | 2.3231 | 3.3980 | 3.4510 | 4.0365 | 3.6138 |
| p | 0.0000 | 0.0001 | 0.0000 | 0.0004 | 0.0202 | 0.0007 | 0.0006 | 0.0001 | 0.0003 |
Publisher’s Note: MDPI stays neutral with regard to jurisdictional claims in published maps and institutional affiliations. |
© 2022 by the authors. Licensee MDPI, Basel, Switzerland. This article is an open access article distributed under the terms and conditions of the Creative Commons Attribution (CC BY) license (https://creativecommons.org/licenses/by/4.0/).
Share and Cite
Ding, H.; Guo, Y.; Wu, X.; Wang, C.; Zhang, Y.; Liu, H.; Liu, Y.; Lin, A.; Hu, F. Data-Driven Resource Efficiency Evaluation and Improvement of the Logistics Industry in 30 Chinese Provinces and Cities. Sustainability 2022, 14, 9540. https://doi.org/10.3390/su14159540
Ding H, Guo Y, Wu X, Wang C, Zhang Y, Liu H, Liu Y, Lin A, Hu F. Data-Driven Resource Efficiency Evaluation and Improvement of the Logistics Industry in 30 Chinese Provinces and Cities. Sustainability. 2022; 14(15):9540. https://doi.org/10.3390/su14159540
Chicago/Turabian StyleDing, Heping, Yuxia Guo, Xue Wu, Cui Wang, Yu Zhang, Hongjun Liu, Yujia Liu, Aiyong Lin, and Fagang Hu. 2022. "Data-Driven Resource Efficiency Evaluation and Improvement of the Logistics Industry in 30 Chinese Provinces and Cities" Sustainability 14, no. 15: 9540. https://doi.org/10.3390/su14159540
APA StyleDing, H., Guo, Y., Wu, X., Wang, C., Zhang, Y., Liu, H., Liu, Y., Lin, A., & Hu, F. (2022). Data-Driven Resource Efficiency Evaluation and Improvement of the Logistics Industry in 30 Chinese Provinces and Cities. Sustainability, 14(15), 9540. https://doi.org/10.3390/su14159540


