Article

Effects of Future Climate Change on Citrus Quality and Yield in China

State Key Laboratory of Earth Surface Processes and Resource Ecology, Faculty of Geographical Science, Beijing Normal University, Beijing 100875, China
*
Author to whom correspondence should be addressed.
Sustainability 2022, 14(15), 9366; https://doi.org/10.3390/su14159366
Submission received: 11 June 2022 / Revised: 24 July 2022 / Accepted: 26 July 2022 / Published: 30 July 2022
(This article belongs to the Special Issue Sustainability with Changing Climate and Extremes)

Abstract

:
As the world’s most widely cultivated fruit, citrus in China is increasingly suffering from ongoing climate change, which affects the sustainability of agricultural systems and social economy. In this study, we linked climate factors to citrus quality and yield and established projection models to elucidate the impact of future climate change. Then, we used the ensemble mean of 19 Coupled Model Intercomparison Project 6 (CMIP6) models to project the 2021–2040 and 2041–2060 climate changes relative to the historical baseline 1995–2014 period under different shared socioeconomic pathways scenarios (SSP2-4.5, SSP5-8.5). The results show that the monthly mean diurnal temperature range in July had the greatest influence on quality, and monthly mean temperature in October, monthly mean relative humidity in October, monthly mean minimum temperature in November and monthly mean maximum temperature in September had the greatest influence on yield at the growth and ripening stages. Moreover, the quality and yield of citrus present different characteristics in terms of change in cultivation areas in the future. The quality of Sichuan, Zhejiang and Fujian Provinces in China will become significantly better, however, Hubei, Guangdong and Guangxi Provinces it will become worse. Surprisingly, yield will increase in all plantations due to future suitable climate conditions for citrus growth and ripening.

1. Introduction

Climate change brings great challenges to natural resources and affects the sustainable development of human society [1]. It is now widely recognized as the greatest global threat of the 21st century [2]. Among many aspects of impacts, agriculture is the most sensitive sector [3,4]. In this changing environment, the production of many crops is affected, which is related to world food security and global stability [5,6,7,8,9,10]. As a result, researchers in agriculture have made it a priority to understand the relationship between crops and climate variables [11,12,13] and to predict crop yield and quality under climate change scenarios [14]. By correctly recognizing the contribution of climate change to crops and adopting effective adaptation measures to agriculture, human beings can make better use of improving production and resistance to adverse effects, maximizing the increase in output, reducing losses, and realizing potential benefits [15,16,17].
Citrus is the world’s largest cultivated fruit crop, with an annual output of approximately 158 million tons, accounting for approximately 18% of the total fruit output [18,19]. As one of the most important crop types, citrus is an important source of income for farmers and is favoured by consumers for nutritional value [20,21], playing a significant role in people’s livelihood, not to mention citrus juice. China has the largest population and is the largest citrus producer in the world, with an annual output of 44 million tons, accounting for almost 28% of global citrus production [18]. Thus, the production of citrus in China plays a vital role in the world citrus pattern and needs to be duly considered. However, China is increasingly suffering from ongoing climate change, and no part of the Earth is immune to this vulnerability, which could have a major effect on citrus [22,23]. Admittedly, the direction and degree of climate change in terms of influencing citrus varies locally due to regional differences in natural responses and anthropogenic factors.
The growth, development, flowering and fruiting of citrus are sensitive to climate conditions, especially in their yield and chemical quality [24,25,26,27]. Previous studies revealed that climate change in China affects the yield of citrus. Under the background of global warming, the citrus yield may be affected by climate risk in subtropical regions of China [28]. Soil erosion in citrus orchards caused by increasingly frequent and intense extreme precipitation is the main cause of productivity decline [29]. Additionally, the climate suitability of citrus affects the growth and final yield of citrus due to the change of temperature and precipitation suitability [30]. However, studies on the effect of citrus quality are rare. With advances in agricultural technology [31,32], climate change may have a greater impact on quality than yield. The contents of Vitamin C, naringin and hesperidin decreased significantly, while chlorogenic acid and caffeic acid increased during frozen temperatures [33]. The highest content of peel was observed from October to March and the Vitamin C content decreased during the ripening process [34]. Additionally, essential oils vary in content in different months [35]. Therefore, the development of this study is necessary to reveal the impact of future climate change on citrus quality, which is a factor that is considered to be as important as yield.
To project future citrus production, Tubiello [36] used two different global circulation model (GCM) scenarios to simulate climate change effects on US citrus production and the result showed that simulated fruit production benefited greatly from the projected climate change, as yields will increase by 20–50%. In this study, we combined empirical regression models based on climate factors and citrus quality or yield with datasets in different CMIP6 (Coupled Model Intercomparison Project 6) models in response to different shared socioeconomic pathways (SSPs) of future climate changes (SSP2-4.5, SSP5-8.5) on citrus. The aim of this study was to investigate the changes in citrus quality and yield in China in the near future (2021–2040) and medium future (2041–2060) relative to the historical baseline period (1995–2014) [37,38]. These results may provide useful information for perennial horticultural crops to meet the challenge of climate change and can be generalized to other parts of the world.

2. Materials and Methods
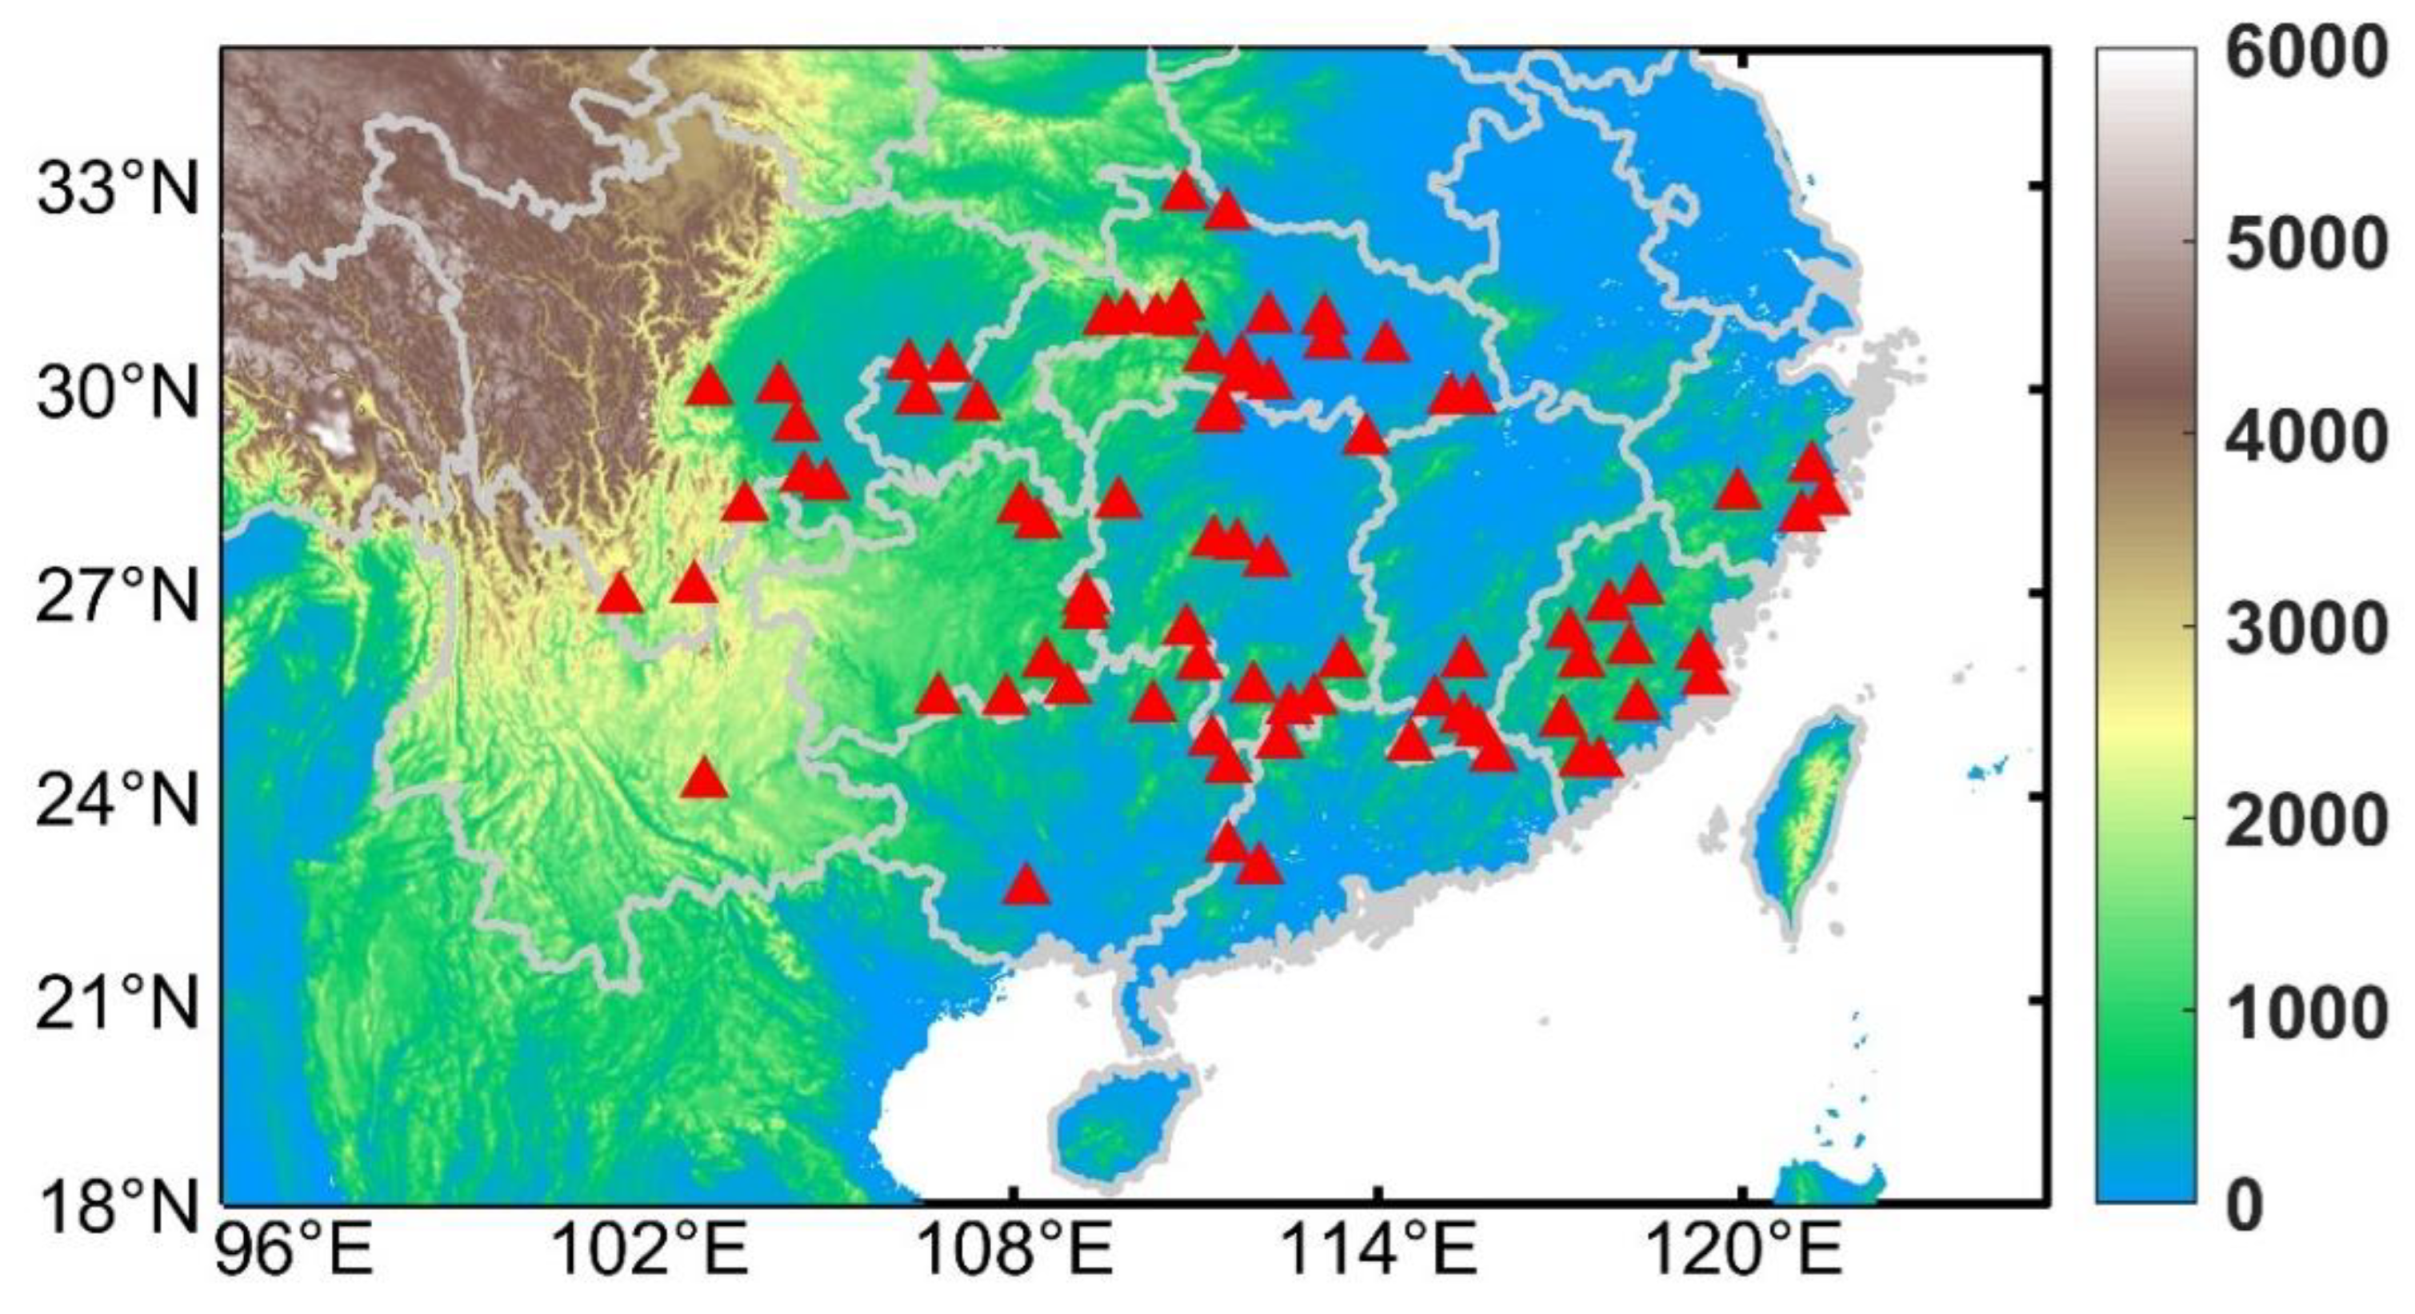
2.1. Study Area

The study areas include 79 meteorological stations in 11 major cultivation provinces in China, which are Sichuan, Chongqing, Hubei, Yunnan, Guizhou, Guangxi, Hunan, Jiangxi, Guangdong, Fujian and Zhejiang as shown in Figure 1 [39]. Typically, citrus production in these 11 provinces account for 98% of the total citrus production (45.85 million tons), and the cultivation areas account for 98% of the total citrus cultivation areas (2.62 million hectares) across China based on the National Bureau of Statistics of China (NBSC) [40].

2.2. Data Sources

2.2.1. Statistical Data

Citrus quality refers to the exterior quality and internal quality. The most important quality, in addition to fruit size, shape, colour and other economic values based on appearance, is chemical composition, mainly related to the sweet, sour or bitter taste of fruit, as well as the of active ingredient contents. The chemical composition of citrus fruit includes the following two categories in addition to water: the first is insoluble in water, such as cellulose, hemicellulose, and propectin, and the other includes water soluble substances, called total soluble solid (TSS). TSS is one of the main factors determining fruit quality [41,42,43], which reflects the flavor and can directly determine the commercial value of fruit. In this study, we searched relevant published articles containing citrus TSS data from the China National Knowledge Infrastructure (CNKI) and finally selected 125 available TSS data. TSS data combined with information from the China Meteorological Station (CMS) are listed in the Table S1. Therefore, the climate of citrus cultivation areas was characterized by the local CMS from the China Meteorological Administration. From the NBSC data, the citrus production and planting area of each province were obtained to calculate the yield.

2.2.2. Meteorological Observation Data

CMS (V3.0) contains the Chinese benchmark and general weather stations, including the main information of 2474 sites and the basic meteorological observation data since January 1961. We extracted meteorological data from 11 provinces in major citrus producing areas, including mean temperature, maximum temperature, minimum temperature, relative humidity and other variables on a daily scale. Finally, 79 sites were collected from papers and the data were downloaded from China Meteorological Administration as observational data and used to construct citrus quality and yield regression models.

2.2.3. CMIP6 Data

The 19 CMIP6 global climate models were used to simulate climate change in the near future (2021–2040) and medium future (2041–2060) relative to the historical base period (1995–2014) under SSP2-4.5 and SSP5-8.5 scenarios. The relevant information of 19 CMIP6 global climate models is shown in Table 1. Among them, EC-Earth3 and EC-Earth3-Veg models have the highest spatial resolution (0.7° × 0.7°), and the CanESM5 model has the lowest spatial resolution (2.8° × 2.8°). The relative humidity, maximum temperature, minimum temperature and mean temperature variables of the CMIP6 model were extracted (there was no simulation of relative humidity variables in the future period in the BCC-CSM2-MR model; therefore, the relative humidity in the future period was replaced by the results of 18 model sets).

2.3. Methods

Citrus is an important fruit crop with high economic value and in this study, it was assumed that when citrus lacks water, artificial irrigation is provided; therefore, the impact of precipitation was not considered. The distribution of climate factors such as the mean temperature, minimum temperature, maximum temperature and relative humidity in different growing areas is significantly different, which often results in different effects of climate change on citrus fruit quality and yield [25,44]. Diurnal temperature range (DTR) is the difference between daily maximum temperature and daily minimum temperature, which can reflect the change characteristics of the interaction and provides comprehensive information between the two [45,46]. Changes in DTR can convey climate change information, which will have an impact on human health, the circulation of the ecosystem, the growth of animals and plants, and the use of renewable energy [47]. The DTR described in this paper is the maximum temperature minus the minimum temperature in 24 h. By using a correlation analysis, regression models were established for the relationship between citrus fruit quality and yield and the key climate factors during fruit growth; furthermore, the crop models of citrus fruit quality and yield were obtained. Lobell [48] considered that all process models contain some degree of experience or statistical rules, and all statistical models also contain some hypothesis of crop processes and mechanisms [49,50,51]. The change in climate elements has a nonnegligible impact on the growth and development of crops. Therefore, when crop quality and yield are only determined by climate factors, the response characteristics of crops to climate elements should be understood. Statistical models can be used to predict crop responses to climate change [52,53]. By incorporating CMIP6 climate data into crop models, changes in citrus fruit quality and yield were obtained for different future periods. See the supplementary materials for the flow chart.

2.3.1. Meta-Analysis

A meta-analysis is a method that can be used to conduct a quantitative and comprehensive analysis of research results [54]. In this study, the quality data of fruit was finally determined by summarizing the research results in the relevant published literature and conducting repeated screening and averaging of the sample data. The operation process includes the following four elements: (1) keywords: TSS of citrus, fruit origin and picking year; (2) unity: recording the data of different varieties of fruit, delimiting the research area and the research benchmark period so that the data of different producing areas and different varieties of fruit have uniformity; (3) match external information: according to the origin of fruit, the relevant information from China meteorological Station was matched, and the corresponding climate data were extracted; (4) obtain results: data of TSS of citrus in different years, different producing areas and different climate conditions. The scientific database used in this study was obtained from China National Knowledge Network (CNKI), with a focus on papers published on climate change, and the exclusion of the effects of extreme climate events such as drought, flood and frost and human activities such as technological progress on fruit quality data.

2.3.2. Correlation Analysis

Correlation analysis is a method used to evaluate the relationship between two variables and the correlation coefficient indicates the strength of the relationship between variables [55]. In this study, Pearson’s correlation coefficient calculation method was used to calculate the correlation degree between the two variables, i.e., citrus quality and yield with climate factors, for which the formula utilized is as follows:
R = i = 1 n ( x i x ¯ ) ( y i y ¯ ) i = 1 n ( x i x ¯ ) 2 i = 1 n ( y i y ¯ ) 2
where R represents the correlation coefficient, n is the number of samples, x i and y i are the values of the ith sample in the sequence of two variables, and x ¯ and y ¯ are the average values of the sequence of two variables.

2.3.3. Least Square Estimation

In this study, a unary linear regression equation was used to fit the relationship between citrus quality and climate factors, and the trend of quality change was defined as the slope of least square estimation, for which the formula is [55] as follows:
y i ^ = k x i + b , i = 1 , 2 , , n k = i = 1 n x i y i 1 n ( i = 1 n x i ) ( i = 1 n y i ) i = 1 n x i 2 1 n ( i = 1 n x i ) b = y ¯ k x ¯ y ¯ = 1 n i = 1 n y i   x ¯ = 1 n i = 1 n x i
where y i represents citrus quality with sample size n, x i corresponds to climate factor, k represents the regression coefficient term, and b represents the regression constant term.

2.3.4. Bilinear Interpolation and Multimodel Ensemble

To avoid the uncertainties that may occur in a single model simulation, we selected 19 models from the CMIP6 GCMs. Using the bilinear interpolation method, we interpolated the models with different resolutions on a unified 1° × 1° grid and obtained the average result of the multimodel ensemble [56], for which the formula is as follows:
E n s e m b l e = i = 1 19 M i 19
where E n s e m b l e represents the average value of the multimodel result, and M i represents the ith model value. Then, by using the method of bilinear interpolation, the average model data of multiple model sets were uniformly interpolated to the China meteorological stations outlined in the Supplementary Materials Table S1 to obtain the local climate information of the meteorological stations simulated by the model [57].

3. Results

3.1. Changes of Quality in the Climate Change Factors

3.1.1. Quality in Relation to Climate Variables

The critical period for the growth and ripening of citrus fruits is from July to December. During this period, the change in DTR is the main climatic factor affecting the quality content of fruits [58,59]. Admittedly, a higher day temperature is preferred for the accumulation of sugar and degradation of organic acids in the fruit-ripening process, and a lower night temperature favours the same under suitable fruit growth conditions [60,61]. DTR can comprehensively reflect the information of maximum and minimum temperature, which has a considerable influence on fruit quality. To quantitatively compare the time period with the maximum correlation with TSS, the maximum temperature and minimum temperature observed at meteorological stations in different months were used to calculate the mean values of DTR and conduct a correlation analysis with TSS, as shown in Figure 2. The results show that DTR is positively correlated with TSS in citrus fruit growth in all periods and passes the significance test at 0.05. The correlation between the mean value of the DTR in July and TSS is highest (R = 0.44), and the correlation coefficient of the mean values of the DTR in the periods from July to August, July to September, July to October, July to November and July to December remains above 0.3, which is higher than that in other periods.
Based on the correlation analysis in Figure 2, the maximum significant positive correlation between the mean for the DTR value in July and the TSS content was obtained to select the climate factors that most affected the change in TSS content in the key period. A linear regression equation was obtained, and the quality prediction model was established as follows:
Q = 0.35   ×   X 1 + 9.021   ( R 1 = 0.442 ,   P 1   <   0.001 )
where Q indicates the TSS content (%); X 1 indicates the mean DTR value (°C) in July;   R 1 is the correlation coefficient; and   P 1 is the significance test index.
The citrus quality prediction model indicates that if the DTR becomes larger, the TSS content also increases, and the citrus quality is good; otherwise, it becomes worse under the background of future climate change.

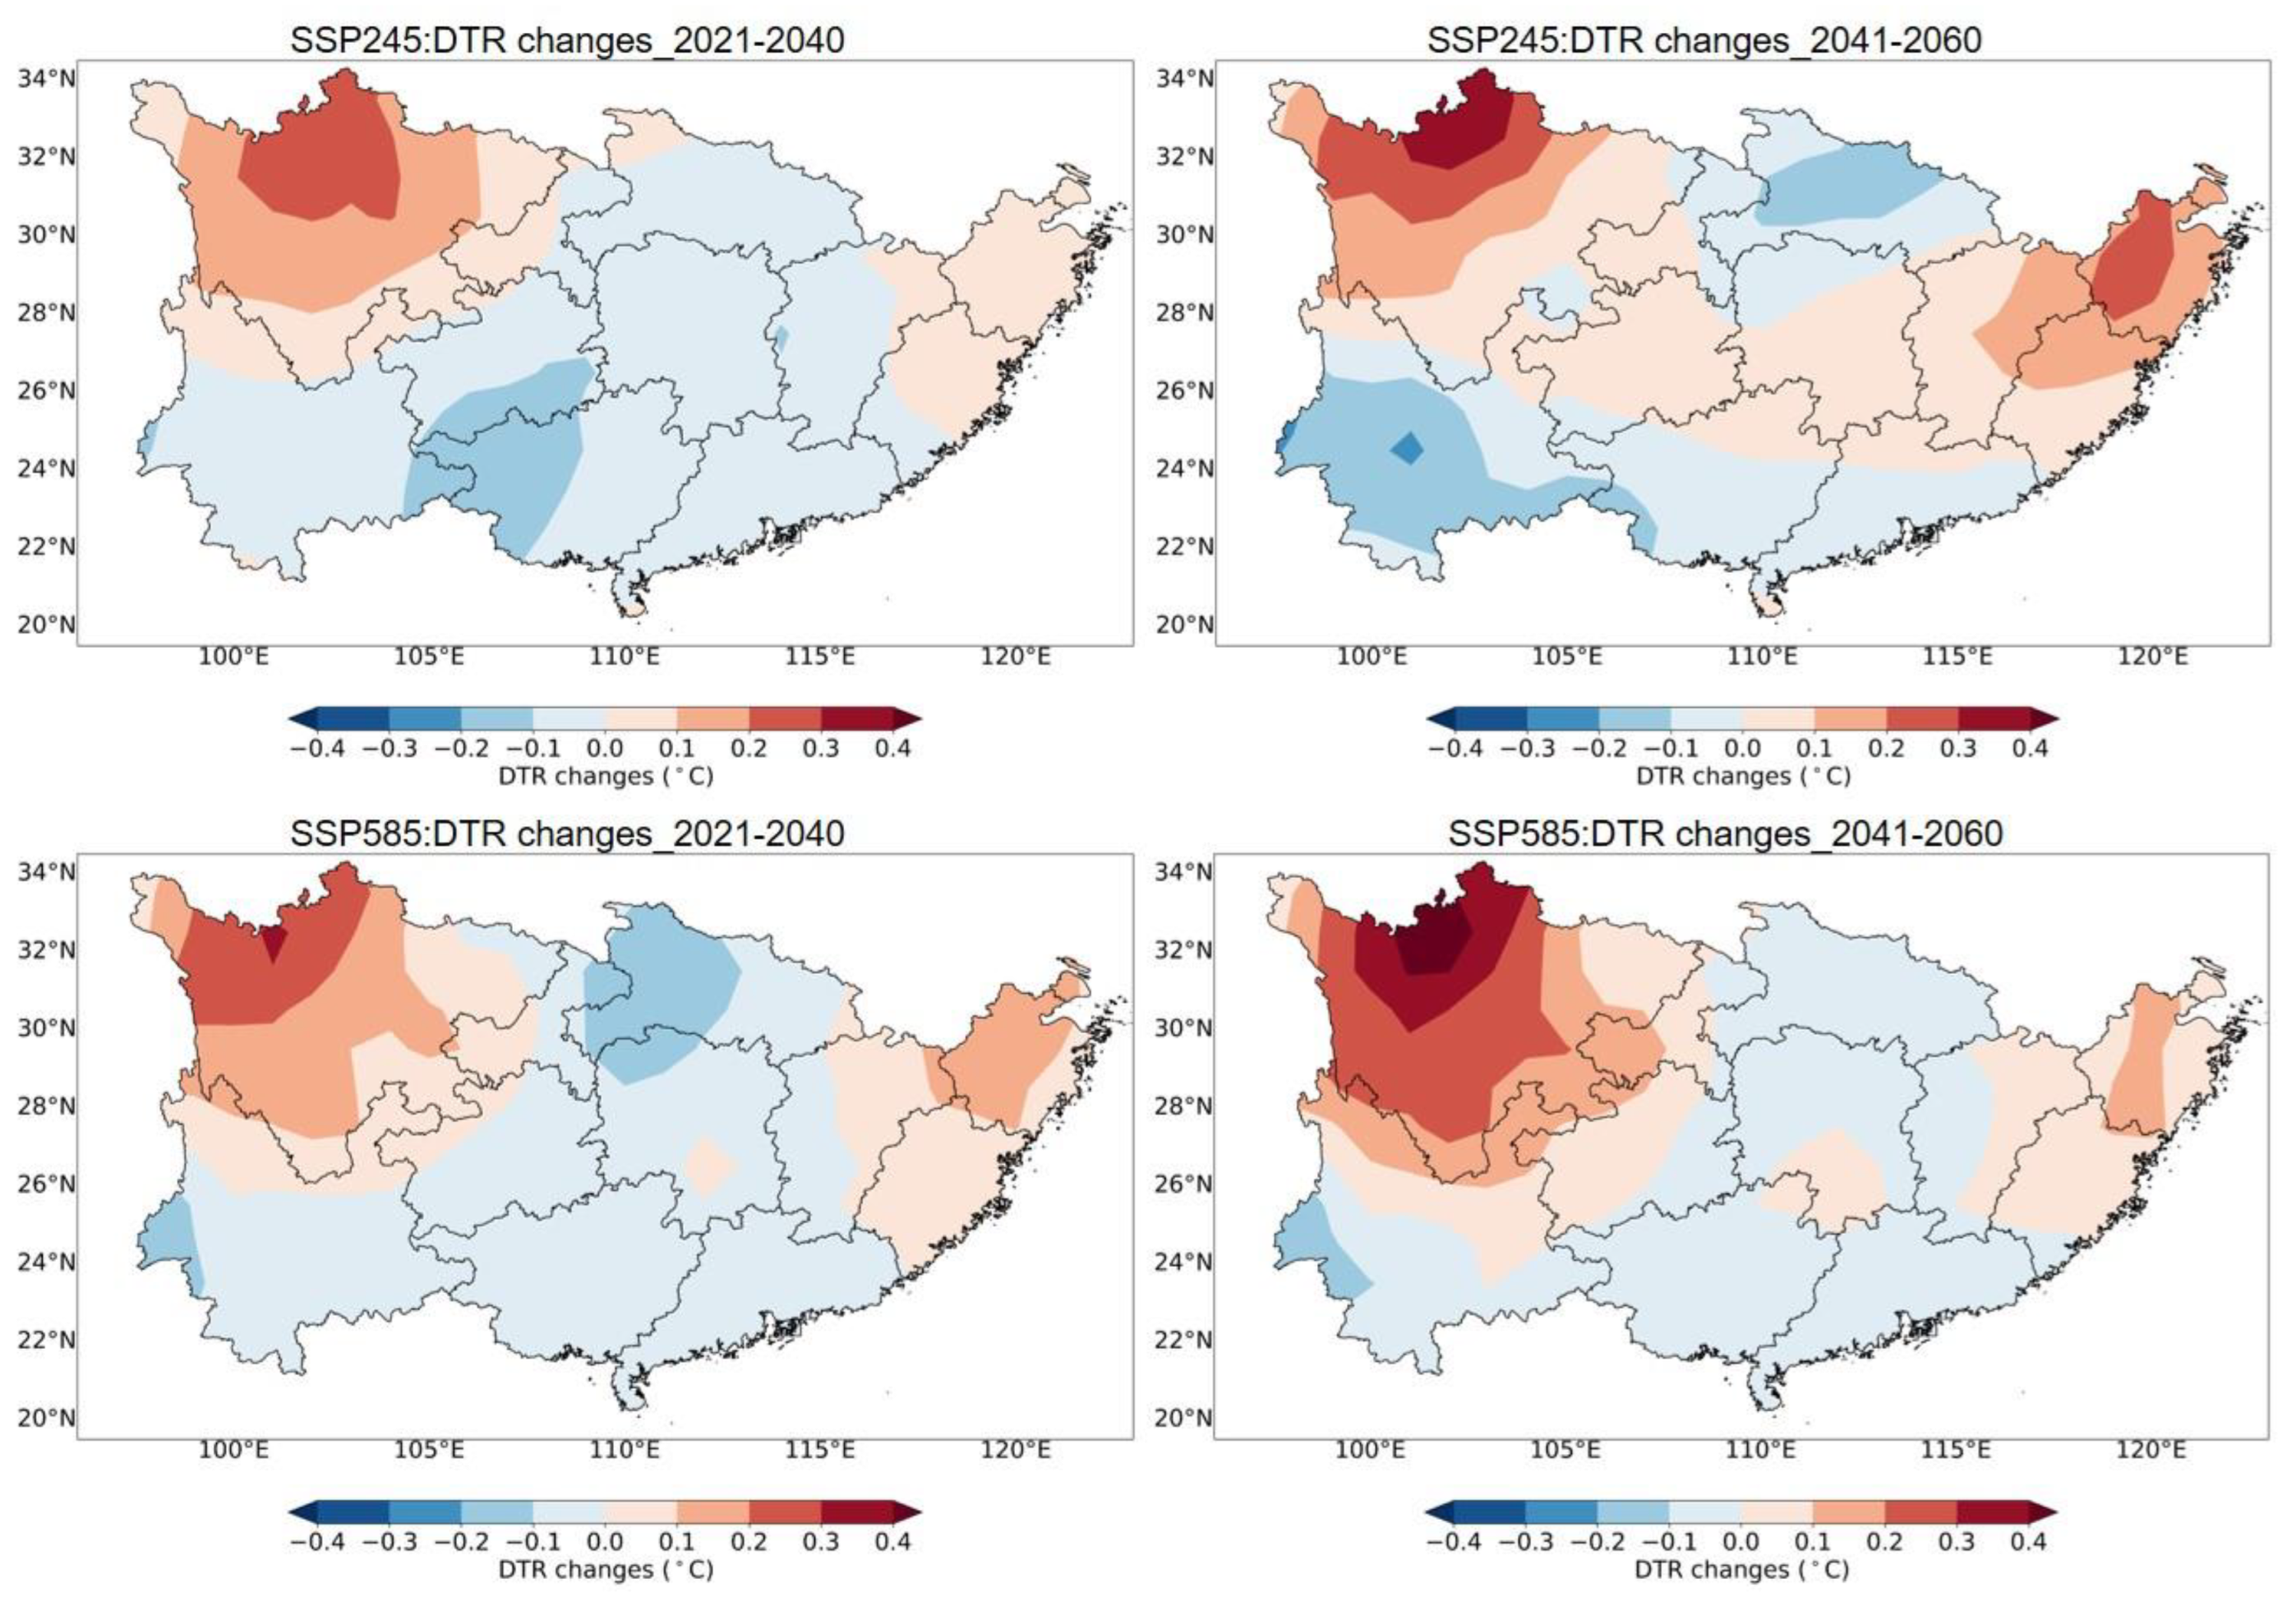
3.1.2. Changes in the Future DTR

The CMIP6 multimodel ensemble data were used to estimate future DTR changes in July in 11 provinces in China where citrus cultivation areas are located, as shown in Figure 3. Compared with the 1995–2014 historical baseline period, the DTR in July of citrus producing areas in China presents an overall spatial distribution of increase-decrease-increase from west to east in the 2021–2040 future climate state under the two scenarios, SSP2-4.5 and SSP5-8.5. Sichuan Province in the west and Zhejiang and Fujian Provinces in the east show signs of increasing DTRs; however, the DTRs of Hubei, Hunan, Guangxi and other central regions show decreasing trends. Similarly, in the 2041–2060 mid-future period, the DTR shows almost the same spatial distribution, and the range of change is larger than that in the 2021–2040 period. The DTR in the northern part of Sichuan Province increases above 0.4 °C under the SSP5-8.5 scenario. The central regions, such as Guizhou, Hunan and Jiangxi Provinces, also show signs of increasing DTR trends, but in addition, the other regions show signs of decreasing DTR changes within 0.2 °C under the SSP2-4.5 scenario.

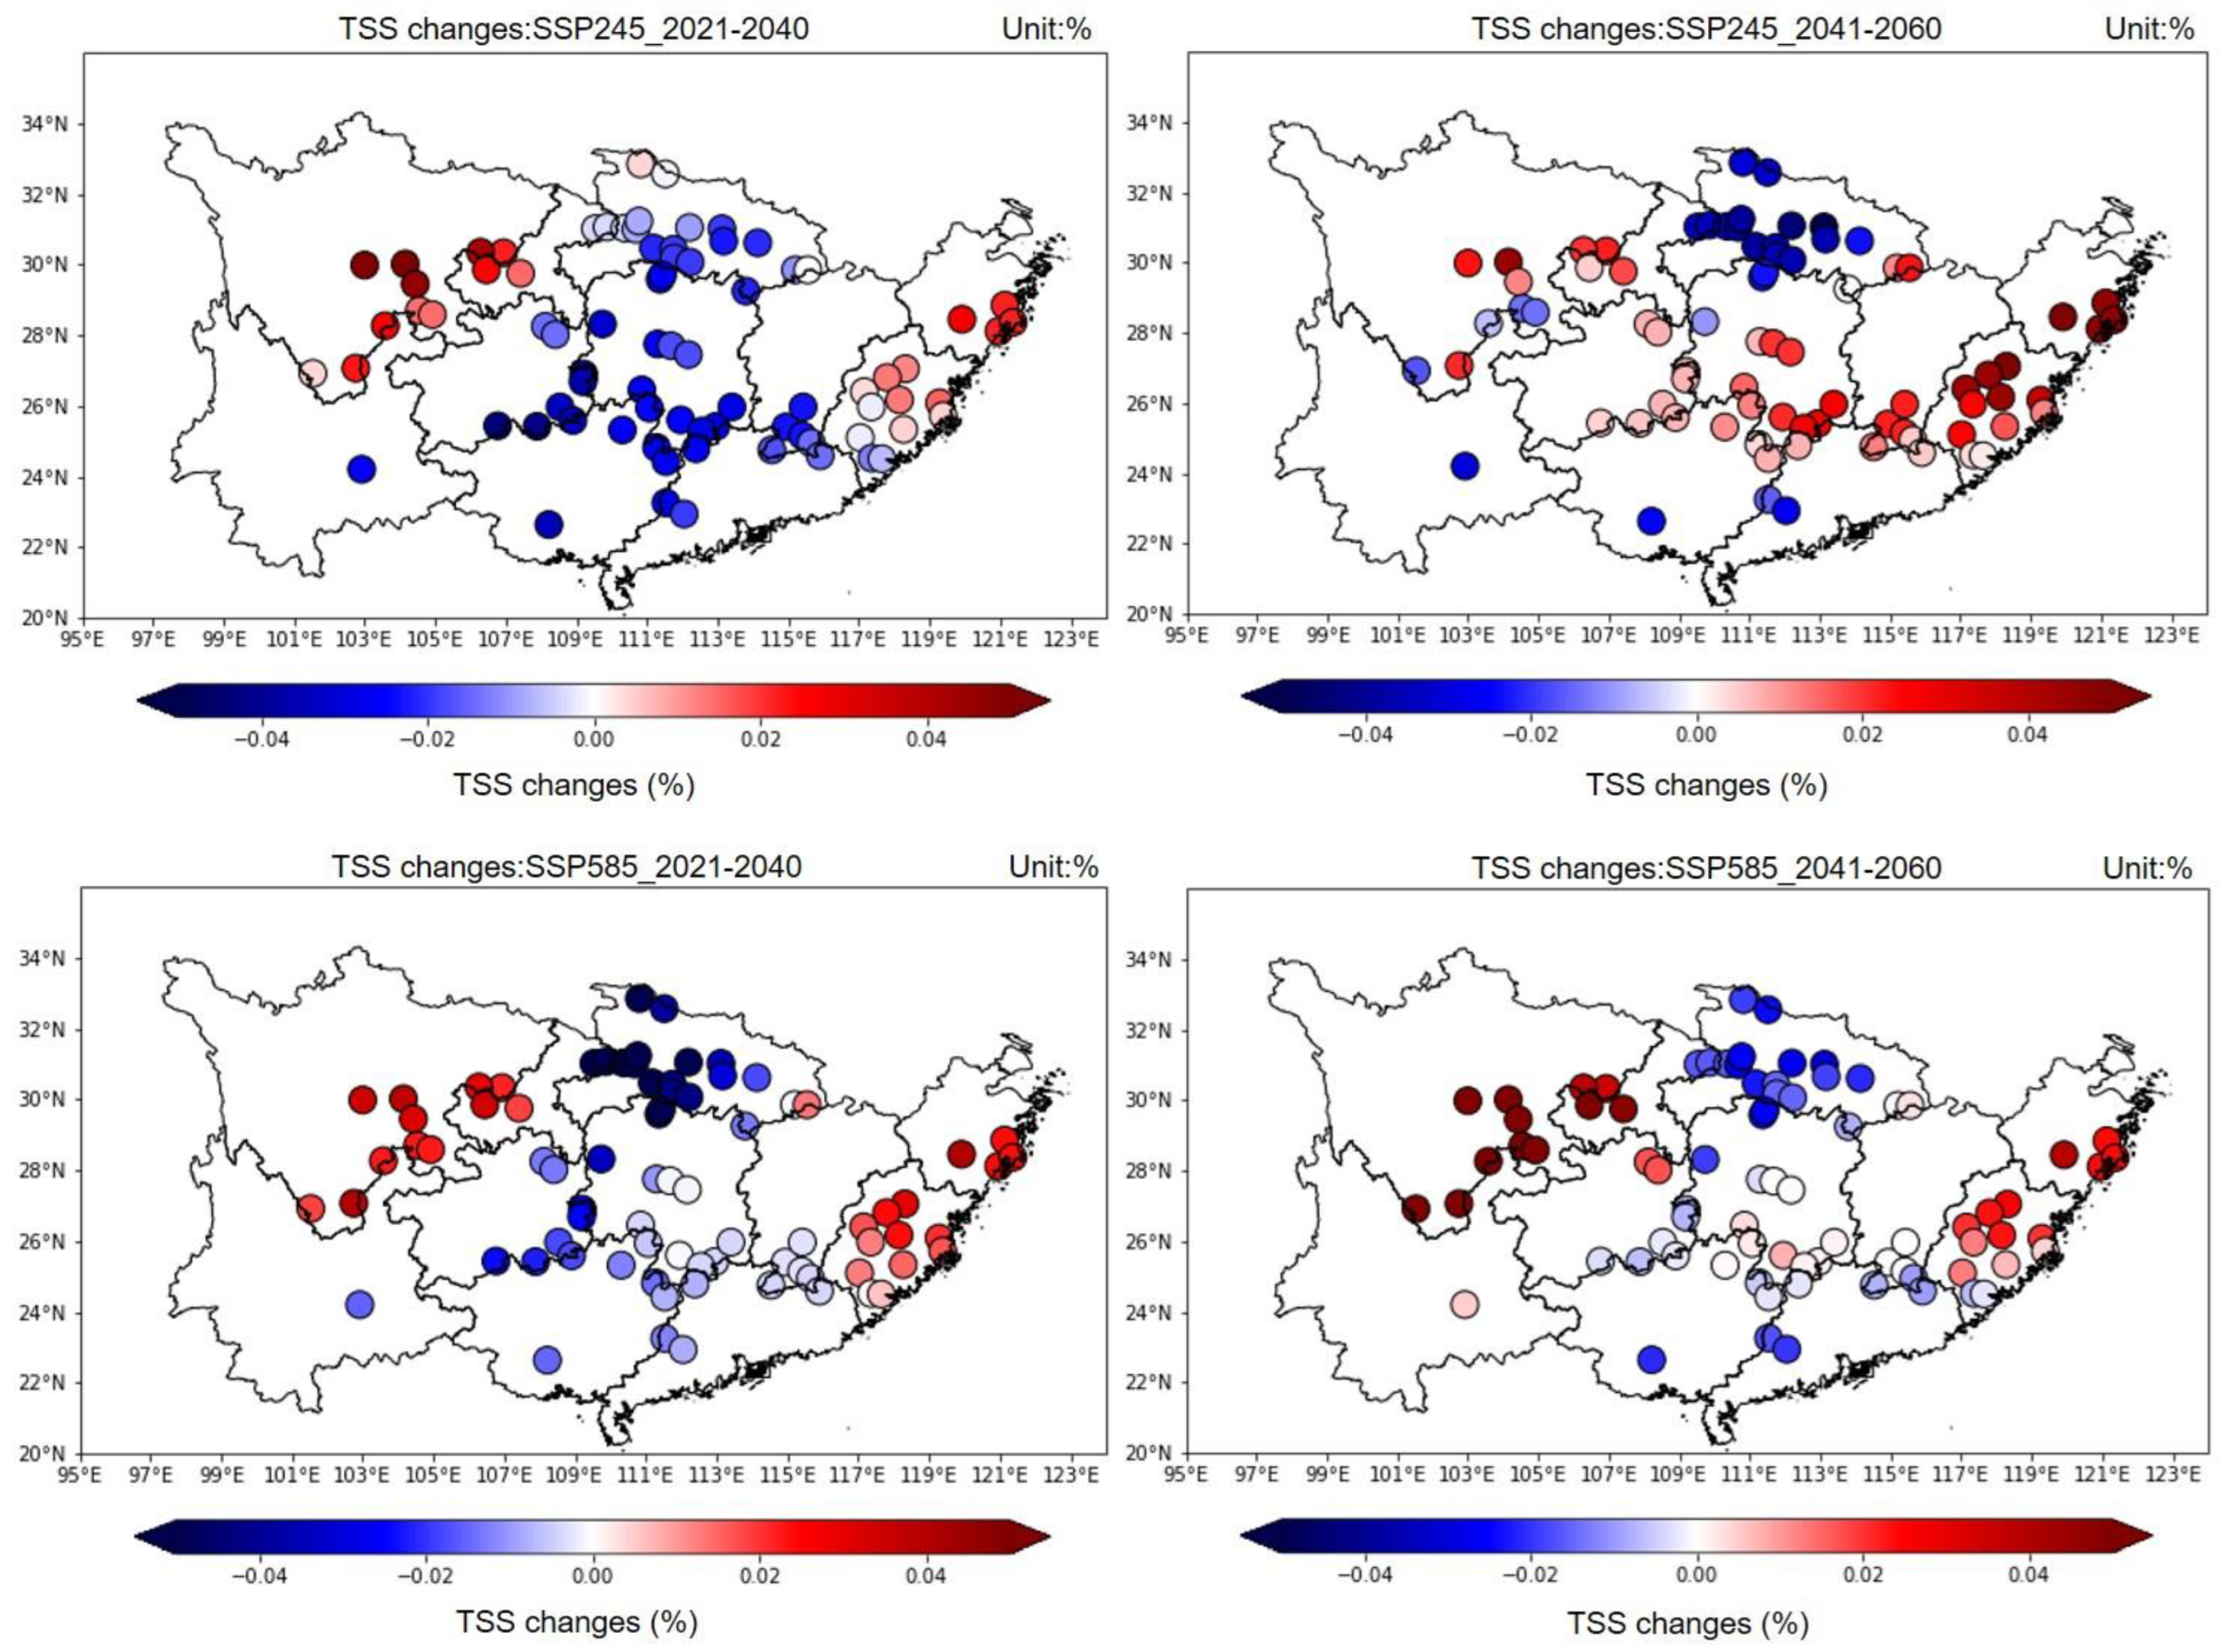
3.1.3. Changes in the future TSS

The change in DTR in July in the whole region of citrus producing areas obtained in Figure 3 can be entered into the quality prediction model to calculate the change in TSS content. Moreover, the spatial grid DTR data calculated by the CMIP6 multimodel were interpolated to the local meteorological stations, and the spatial distribution map of TSS content in actual citrus-producing areas is depicted in Figure 4. Consistent with the spatial distribution in Figure 3, the change in TSS content in citrus also presents a spatial distribution characteristic of increase-decrease-increase from west to east in the 2021–2040 future climate state under the SSP2-4.5 and SSP5-8.5 scenarios. This phenomenon indicates that the quality of citrus has a tendency to become better-worse-better in these corresponding regions. In the 2041–2060 mid-future climate state, the TSS content of citrus shows a ribbon-like distribution of increasing TSS content in the western, central and eastern regions and decreasing TSS content in the southern and northern regions under the SSP2-4.5 and SSP5-8.5 scenarios. It is suggested that the quality of citrus will change in the same trend. Sichuan, Zhejiang and Fujian Provinces in terms of citrus quality present good trends for the entirety of the future situation. Citrus quality in Guizhou, Hunan, Jiangxi, northern Guangdong and northern Guangxi Provinces will change in the near future to worse and in the mid-future to good. Citrus produced in Hubei Province is affected by climate change and shows quality deterioration under different scenarios and in different future climate states.

3.2. Changes of Yield in the Climate Change Factors

3.2.1. Yield in Relation to Climate Variables

Ahmad [62] confirmed that citrus fruit growth requires certain temperature conditions, and the yield is particularly sensitive to temperature. Citrus fruit grows and ripens from July to December each year, and the climate factors during this period have great effects on the yield. Consequently, the correlation between climate factors and yield in the above months was examined, and the correlation coefficient diagram was obtained, as shown in Figure 5. As seen from the figure, mean temperature in October, relative humidity in October, minimum temperature in November and maximum temperature in September have the highest correlation with yield; as a result, the particular climatic conditions were selected as independent variables to establish a multiple linear regression model and obtain the prediction of the yield model as follows:
Y   = 0.007   ×   X 2 + 0.108   ×   X 3 0.025   ×   X 4   0.03 X 5 + 2.482   ( R 2   = 0.437 ,   P 2   <   0.001 )
where Y indicates the yield (10 t/ha); X 2 indicates the mean temperature (°C) in October; X 3 indicates the mean minimum temperature (°C) in November; X 4 indicates the mean maximum temperature (°C) in September;   X 5 indicates the mean relative humidity (%) in October;   R 2 is the correlation coefficient; and P 2 is the significance test index. The citrus yield prediction model indicates that mean temperature and minimum temperature have a positive contribution to yield, while maximum temperature and relative humidity have a negative contribution under the synergistic effect of various climate factors.

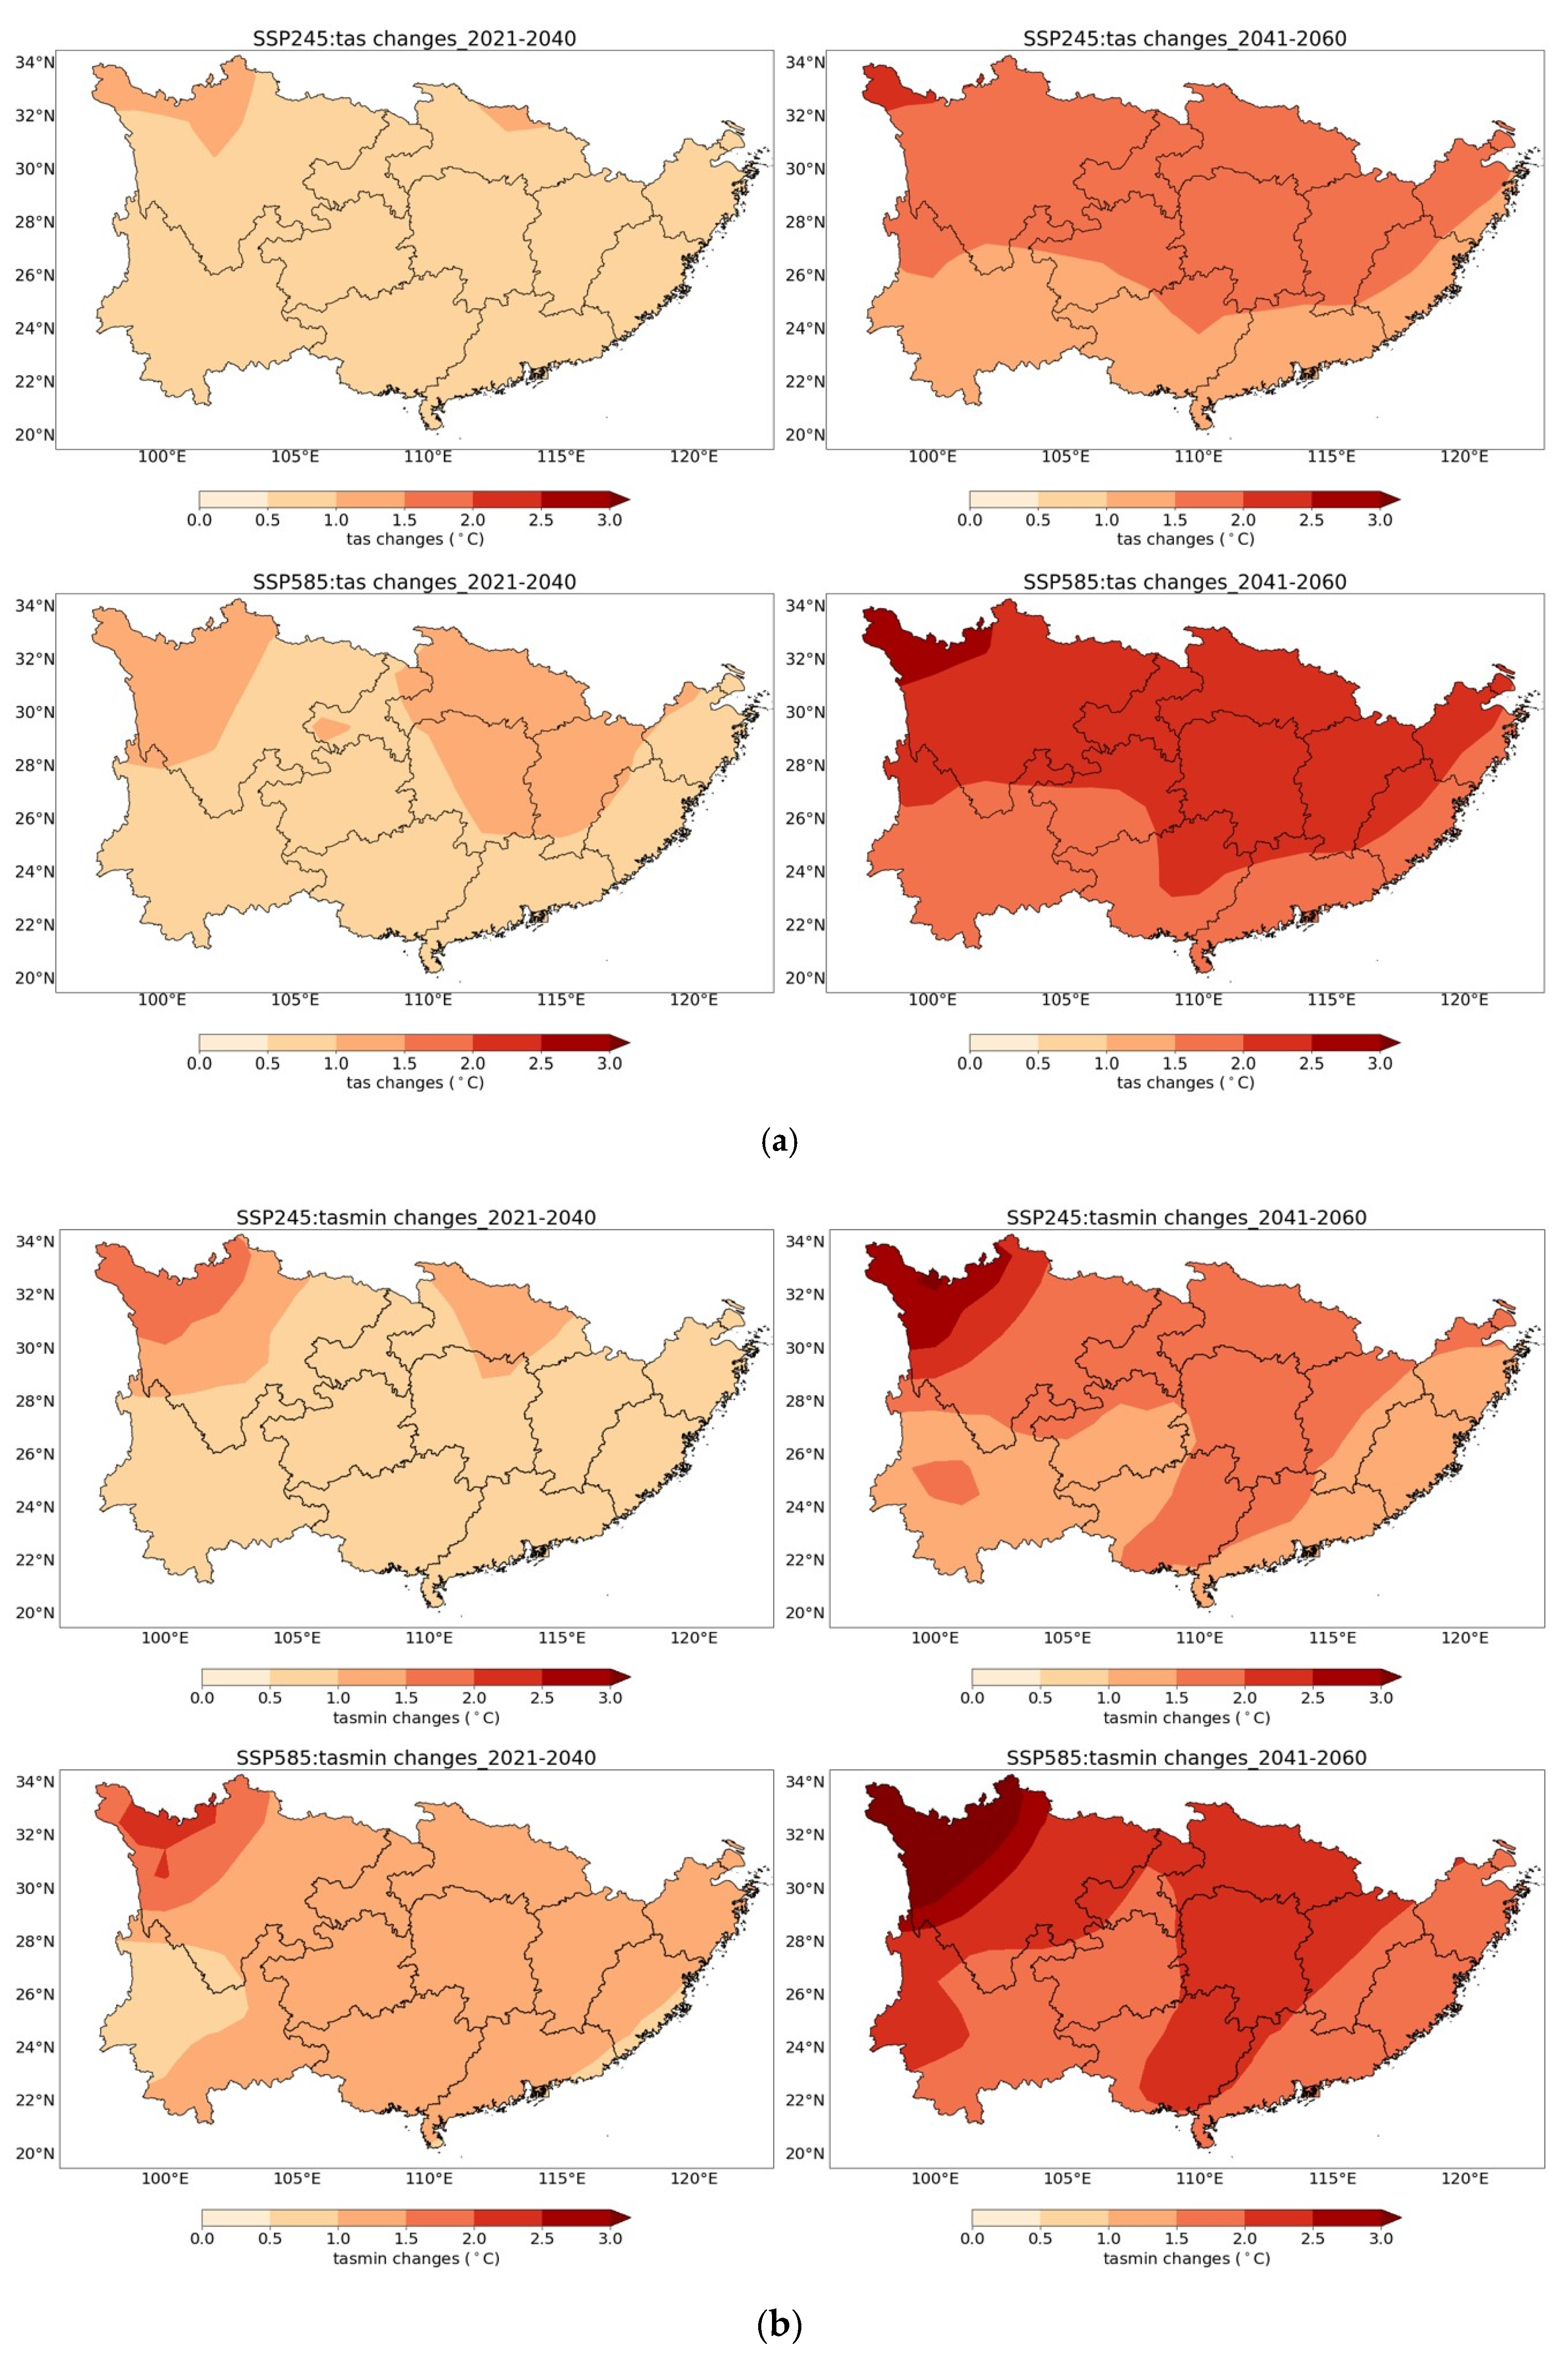
3.2.2. Changes in the Future Climate Factors

The CMIP6 multimodel ensemble data were used to predict the future changes in four key climate factors affecting citrus yield under different scenarios and different periods in the future as shown in Figure 6 (Figure 6a–d). The mean temperature in October shows an overall increase, as shown in Figure 6a. There is little difference between the simulation results of the two different scenarios, and the mean temperature range is between 0.5 °C and 1.5 °C in 2021–2040. Undoubtedly, the mean temperature range of the SSP5-8.5 scenario is significantly higher than that of SSP2-4.5 in 2041–2060. The range of mean temperature shows a phenomenon of increasing with latitude moving northwards in the citrus-growing areas. Figure 6b show that the mean minimum temperature in November presents signs of increasing in all regions, and the greatest warming trend is observed for northwestern Sichuan. In addition, the increasing range of most regions is approximately 0.5 °C higher under the SSP5-8.5 scenario than under the SSP2-4.5 scenario in 2021–2040, and the spatial distribution of the warming gradient is consistent with that in 2041–2060. In Figure 6c, the warming effect of the mean maximum temperature in September is approximately the same as that of the mean temperature in October in Figure 6a, except that the greatest warming effect shifts from the northwestern to the central and eastern parts of Sichuan. The mean relative humidity in October increases in the western region and decreases in the central and eastern regions, as shown in Figure 6d. The spatial pattern is approximately similar under the two scenarios during different future periods, while the decreasing trend is almost 0.5% higher in 2041–2060.

3.2.3. Changes in the Future Yield

According to Figure 6, we can see key climate factor changes to some extent simulated by CMIP6 models in the future period under two different scenarios, which were entered into the citrus yield prediction model. Compared with the historical period, the change in citrus yield at the meteorological site scale in the future is shown in Figure 7. Citrus yield shows an increasing trend under different conditions, and the yield-increasing effect is more obvious in 2041–2060 than in 2021–2040, almost doubling the change. The citrus yields of Hubei, Hunan, northern Guangxi and northern Guangdong Provinces increase with an increase of 1–2 t/ha under the SSP2-4.5 scenario; however, almost all citrus-producing areas show an increase of 1–2 t/ha with little difference in yield increase among regions under the SSP5-8.5 scenario in 2021–2040. In regard to the 2041–2060 period, the yields in southeastern Sichuan, Hubei and central Hunan Provinces increase by more than 2 t/ha, and those of Zhejiang and Fujian Provinces almost double, while those of southern Hunan, northern Guangxi and northern Guangdong Provinces have almost no difference compared with the 2021–2040 period under the SSP2-4.5 scenario. A yield increase of above 2 t/ha is observed in most citrus-producing areas except those in Fujian, Yunnan and southern Sichuan Provinces and is double that from 2021–2040 under the SSP5-8.5 scenario.

3.3. Changes of Quality-Yield in the Climate Change Factors

Quality-Yield (Q-Y) is defined as the total amount of TSS content contained in the yield, which reflects comprehensive information between the quality and yield changes in the future in t/ha. The change in Q-Y is shown in Figure 8 combined with the forecast for TSS content in Figure 4 and the phenomenon of all conditions increasing yield in Figure 6, which reflects the general change in citrus effective composition TSS content in yield. Although the quality of citrus in some producing areas is worsening, affected by climate change, Q-Y still shows an increasing trend with the increase in the citrus yield, which indicates that the amount of TSS content will improve in the future under the two different scenarios. The spatial distribution of the Q-Y increase is approximately 0.1–0.2 t/ha despite the obvious quality reduction in the central region and almost the same in all planting regions except in the Zhejiang and Fujian Provinces under the SSP2-4.5 and SSP5-8.5 scenarios in 2021–2040. Because of the effect of yield increase, Q-Y almost doubles compared with 2021–2040 under the SSP2-4.5 scenario in 2041–2060. Although the quality obviously declines in Hubei Province, the Q-Y increases by approximately 0.2 t/ha. The increasing effect of Q-Y is weak in Zhejiang and Fujian Provinces and some other places at approximately 0.1–0.2 t/ha. The decline in quality in the central and southern regions does not affect the Q-Y increase by more than 0.2 t/ha under the SSP5-8.5 scenario in 2041–2060.

4. Discussion

4.1. Impact Mechanisms of Empirical Models for Predicting Citrus Fruit Quality and Yield

Many studies revealed the impact of climate change on the yield of crops, indicating that changes in climate factors such as temperature and precipitation will increase or decrease the yield [9,63,64]. However, fruits have not been given the same attention, and it is necessary to study the impact of climate change on fruits and what will happen to fruits in the future, especially in relation to their yield and quality. The climate factors used in this study are also relevant to temperature and precipitation factors, such as maximum temperature, minimum temperature, DTR, mean temperature and relative humidity, on a daily scale, as shown in Figure 2 and Figure 5. Maximum temperature is beneficial for the accumulation of active substances in the fruit-ripening process, and minimum temperature favours the same under suitable fruit growth conditions [59,61]. DTR can comprehensively reflect the information of maximum and minimum temperature, which has a considerable influence on fruit quality. Mean temperature and relative humidity have been proven to be very important in the growth of citrus and have certain effects on phenology and yield [65,66,67]. The above climate factors in the key growth periods calculated from meteorological station data in citrus producing areas have a strong correlation with quality and yield. It has been proven that local climate change has a direct impact on citrus production, in contrast to large-scale warming conditions. This method was also applied to study climate-crop yield relationships [68]. In this study, statistical models were used to establish the relationship between climate factors and citrus quality and yield, which have certain reference values because some researchers used statistical models to predict crop yield [69,70]. Mechanism models are so complex that few suitable models can be used to predict the quality and yield changes of citrus in the future, which means that it was difficult to select a model in our study. However, the comprehensive use of mechanism models and statistical models will be of great significance for the prediction of the quality and yield of citrus and even for fruit once the mechanism model is developed and perfected [71,72].

4.2. Sensitive Areas Affected by Climate Factors in the Future

The key period of citrus fruit growth and maturation is from July to December, as shown in Figure 2 and Figure 5, and the climate change in citrus-producing areas in this period has a direct influence on the change in citrus fruit quality and yield. This conclusion shows that the climate factors in the study area have the same trend of change under the two scenarios, but the intensity of change is greater under the SSP5-8.5 scenario, which is also in line with the simulation setting of future emission scenarios. In addition, the prediction of different future time periods presents different spatial distributions. In the 2021–2040 period, the DTR in July is projected to increase in Sichuan, Zhejiang and Fujian Provinces and decrease in most studied areas; the mean temperature in October, maximum temperature in September and minimum temperature in November seem to increase in all areas; and the relative humidity in October is projected to increase in Sichuan and Yunnan Provinces and decrease in other places. In the 2041–2060 period, the DTR in July is projected to decrease in only some parts of Hubei, Guangdong, Guangxi and Yunnan Provinces and increase in other areas; the mean temperature in October, maximum temperature in September and minimum temperature in November will increase in all areas; and the relative humidity in October is projected to decrease largely in the study areas.

4.3. Some Measures May Improve Citrus Quality and Yield

According to Figure 2, the DTR will decrease in most cultivation regions except for Sichuan, Zhejiang and Fujian Provinces, which indicates that the quality of citrus is projected to worsen. Some artificial adaptation measures may be taken to prevent negative situations. The DTR can be obtained by subtracting the daily maximum temperature from the daily minimum temperature, and both will increase significantly under the background of global warming; therefore, the reason for the decrease in the DTR is that the warming effect has a more significant enhancement effect on the daily minimum temperature. Suggested coping strategies include a lower night temperature and providing enough day warming conditions. On the other hand, changing cultivation regions is a contributing factor. Admittedly, there is a decreasing degree of DTR of between 0.1 °C and 0.2 °C, which has seldom effected TSS content as shown in Figure 3. Quality decline does not represent a serious concern based on the results under climate warming conditions. Sichuan Province may have the best natural DTR conditions for the accumulation of active substances in the future. Under the joint action of various climate factors, the changing climate is beneficial for citrus fruit growth and ripening, and the yield of citrus is projected to increase in all producing regions, not to mention the improvement of agricultural technology. Based on our hypothesis, offering irrigation is critical.

4.4. Limitations of this Study

(1) Without the support of specific citrus quality and yield data at the grid scale, the research areas of this study were limited to all provinces, and the locations of meteorological stations were used to represent the local climate conditions, which included certain errors. (2) Due to the inability of the author and the research group to undertake relevant experiments, the research data on TSS contents of citrus in this study were obtained from other published papers, and the consistency of the data were not guaranteed. (3) In this study, the ensemble mean of 19 CMIP6 models was adopted to reduce the uncertainty of single-model simulations of climate change impacts. However, the GCM climate models also have some system errors in terms of the observations, which lead to the uncertainty in future changes of projected climate variables. (4) This study did not consider the effect of artificial technological progress on the results.

5. Conclusions

The key climate factors from July to December of citrus fruit growth and maturation have a good relationship with citrus quality and yield. The monthly mean DTR in July has the greatest influence on quality, and monthly mean temperature in October, monthly mean relative humidity in October, monthly mean minimum temperature in November and monthly mean maximum temperature in September have the greatest influence on yield. Moreover, the monthly mean DTR in July is projected to increase in Sichuan, Zhejiang and Fujian Provinces and decrease in other regions; the monthly mean temperature in October, monthly mean minimum temperature in November and monthly mean maximum temperature in September are projected to increase in all studied areas; and the monthly mean relative humidity in October is projected to increase in small regions of Sichuan and Yunnan Provinces and decrease in other places. Thus, the quality and yield of citrus presented different characteristics of change in cultivation areas when using the established prediction model for the 2021–2040 and 2041–2060 future periods relative to the 1995–2014 baseline period. The quality of western cultivation areas in Sichuan Province and eastern cultivation areas in Zhejiang and Fujian Provinces in China will become significantly better; however, that of Hubei, Guangdong and Guangxi Provinces will worsen. Surprisingly, yield will increase in all plantations due to future suitable climate conditions for citrus growth and ripening.

Supplementary Materials

The following supporting information can be downloaded at: https://www.mdpi.com/article/10.3390/su14159366/s1, Figure S1: Flow chart; Table S1: TSS data used in this study [73,74,75,76,77,78,79,80,81,82,83,84,85].

Author Contributions

X.Y. and S.W. conceived of the idea and method, W.X. and S.W. participated in the prepared materials, and S.W. wrote the paper with input from all authors. All authors have read and agreed to the published version of the manuscript.

Funding

This research was funded by the National Key R&D Program of China, grant number 2019YFA0606904.

Institutional Review Board Statement

Not applicable.

Informed Consent Statement

Not applicable.

Data Availability Statement

All relevant data can be found within the paper and its supporting materials. CMIP6 models data are available at link https://esgf-node.llnl.gov/search/cmip6 (accessed on 10 June 2022).

Acknowledgments

We would like to thank the authors who did the experiments to get the citrus data in the supplementary material, which enabled our work to proceed smoothly. We acknowledge the China Meteorological Administration for meteorological data and information.

Conflicts of Interest

The authors declare no conflict of interest.

References

  1. Stocker, T.F.; Qin, D.; Plattner, G.-K.; Tignor, M.; Allen, S.K.; Boschung, J.; Nauels, A.; Xia, Y.; Bex, V.; Midgley, P.M. (Eds.) IPCC Climate Change 2013: The Physical Science Basis. Contribution of Working Group I to the Fifth Assessment Report of the Intergovernmental Panel on Climate Change; Cambridge University Press: Cambridge, UK, 2013. [Google Scholar]
  2. Piao, S.; Ciais, P.; Huang, Y.; Shen, Z.; Peng, S.; Li, J.; Zhou, L.; Liu, H.; Ma, Y.; Ding, Y.; et al. The impacts of climate change on water resources and agriculture in China. Nature 2010, 467, 43–51. [Google Scholar] [CrossRef] [PubMed]
  3. Adams, R.M.; Rosenzweig, C.; Peart, R.M.; Ritchie, J.T.; McCarl, B.A.; Glyer, J.D.; Curry, R.B.; Jones, J.W.; Boote, K.; Allen, L.H. Global climate change and US agriculture. Nature 1990, 345, 219–224. [Google Scholar] [CrossRef]
  4. Salinger, M. Climate variability and change: Past, present and future: An overview. Clim. Change 2005, 70, 9–29. [Google Scholar] [CrossRef]
  5. Rosenzweig, C.; Phillips, J.; Goldberg, R.; Carroll, J.; Hodges, T. Potential impacts of climate change on citrus and potato production in the US. Agric. Syst. 1996, 52, 455–479. [Google Scholar] [CrossRef]
  6. Furuya, J.; Koyama, O. Impacts of Climatic Change on World Agricultural Product Markets: Estimation of Macro Yield Functions. Jpn. Agric. Res. Q. JARQ 2005, 39, 121–134. [Google Scholar] [CrossRef] [Green Version]
  7. Parry, M.; Rosenzweig, C.; Livermore, M. Climate change, global food supply and risk of hunger. Philos. Trans. R. Soc. B Biol. Sci. 2005, 360, 2125–2138. [Google Scholar] [CrossRef] [PubMed] [Green Version]
  8. Lobell, D.B.; Schlenker, W.; Costa-Roberts, J. Climate Trends and Global Crop Production since 1980. Science 2011, 333, 616–620. [Google Scholar] [CrossRef] [PubMed] [Green Version]
  9. Lesk, C.; Rowhani, P.; Ramankutty, N. Influence of extreme weather disasters on global crop production. Nature 2016, 529, 84–87. [Google Scholar] [CrossRef] [PubMed]
  10. Xie, Q.; Li, J. Effect of Indian Ocean-Pacific SST Pattern in Autumn on Winter Wheat Climatic Yield in the North China Plain in the Following Year and a Possible Mechanism. Sci. Rep. 2019, 9, 19016. [Google Scholar] [CrossRef] [PubMed] [Green Version]
  11. Ceglar, A.; Toreti, A.; Lecerf, R.; Van der Velde, M.; Dentener, F. Impact of meteorological drivers on regional inter-annual crop yield variability in France. Agric. For. Meteorol. 2016, 216, 58–67. [Google Scholar] [CrossRef]
  12. Peña-Gallardo, M.; Vicente-Serrano, S.M.; Quiring, S.; Svoboda, M.; Hannaford, J.; Tomas-Burguera, M.; Martín-Hernández, N.; Domínguez-Castro, F.; El Kenawy, A. Response of crop yield to different time-scales of drought in the United States: Spatio-temporal patterns and climatic and environmental drivers. Agric. For. Meteorol. 2019, 264, 40–55. [Google Scholar] [CrossRef] [Green Version]
  13. Feng, S.; Hao, Z.; Zhang, X.; Hao, F. Changes in climate-crop yield relationships affect risks of crop yield reduction. Agric. For. Meteorol. 2021, 304–305, 108401. [Google Scholar] [CrossRef]
  14. Tao, F.; Hayashi, Y.; Zhang, Z.; Sakamoto, T.; Yokozawa, M. Global warming, rice production, and water use in China: Developing a probabilistic assessment. Agric. For. Meteorol. 2008, 148, 94–110. [Google Scholar] [CrossRef]
  15. Campbell, B.M.; Vermeulen, S.J.; Aggarwal, P.K.; Corner-Dolloff, C.; Girvetz, E.; Loboguerrero, A.M.; Ramirez-Villegas, J.; Rosenstock, T.; Sebastian, L.; Thornton, P.K.; et al. Reducing risks to food security from climate change. Glob. Food Secur. 2016, 11, 34–43. [Google Scholar] [CrossRef] [Green Version]
  16. Lobell, D.B.; Asner, G.P. Climate and management contributions to recent trends in US agricultural yields. Science 2003, 299, 1032. [Google Scholar] [CrossRef]
  17. Lu, J.; Carbone, G.J.; Gao, P. Detrending crop yield data for spatial visualization of drought impacts in the United States, 1895–2014. Agric. For. Meteorol. 2017, 237–238, 196–208. [Google Scholar] [CrossRef]
  18. Food and Agriculture Organization of the United Nations. FAO Statistical Databases 2019. Available online: https://www.fao.org/faostat/ (accessed on 10 July 2022).
  19. World Production of Citrus Fruits in 2020, by Region. Available online: https://www.statista.com/statistics/264002/production-of-citrus-fruits-worldwide-by-region/ (accessed on 10 July 2022).
  20. Qi, L.; Qi, C.J. Status quo and development trend of world’s citrus Industry. Agric. Outlook 2016, 12, 46–52. (In Chinese) [Google Scholar]
  21. Balfagón, D.; Arbona, V.; Gómez-Cadenas, A. El futuro de los cítricos: Impacto del cambio climático en la citricultura. Mètode Rev. Difus. Investig. 2021, 3, 60–67. [Google Scholar] [CrossRef]
  22. Fitchett, J.M.; Grab, S.W.; Thompson, D.I.; Roshan, G. Spatio-temporal variation in phenological response of citrus to climate change in Iran: 1960–2010. Agric. For. Meteorol. 2014, 198–199, 285–293. [Google Scholar] [CrossRef]
  23. Lahlali, R.; Jaouad, M.; Moinina, A.; Mokrini, F.; Belabess, Z. Farmers’ knowledge, perceptions, and farm-level management practices of citrus pests and diseases in Morocco. J. Plant Dis. Prot. 2021, 128, 1213–1226. [Google Scholar] [CrossRef]
  24. Mittler, R.; Finka, A.; Goloubinoff, P. How do plants feel the heat? Trends Biochem. Sci. 2012, 37, 118–125. [Google Scholar] [CrossRef] [PubMed]
  25. Abobatta, W.F. Drought adaptive mechanisms of plants—A review. Adv. Agric. Environ. Sci. Open Access 2019, 2, 42–45. [Google Scholar] [CrossRef]
  26. Nawaz, R.; Abbasi, N.A.; Ahmad Hafiz, I.; Khalid, A. Impact of climate variables on fruit internal quality of Kinnow mandarin (Citrus nobilis Lour x Citrus deliciosa Tenora) in ripening phase grown under varying environmental conditions. Sci. Hortic. 2020, 265, 109235. [Google Scholar] [CrossRef]
  27. Knowledge Centre for Food Fraud and Quality. Available online: https://knowledge4policy.ec.europa.eu/food-fraud-quality/topic/food-quality_en/ (accessed on 10 July 2022).
  28. Duan, H.L.; Qian, H.S.; Li, M.; Du, Y.D. Changes of citrus climate risk in subtropics of China. J. Geogr. Sci. 2010, 20, 818–832. (In Chinese) [Google Scholar] [CrossRef]
  29. Duan, J.; Liu, Y.; Yang, J.; Tang, C.; Shi, Z. Role of groundcover management in controlling soil erosion under extreme rainfall in citrus orchards of southern China. J. Hydrol. 2020, 582, 124290. [Google Scholar] [CrossRef]
  30. Du, Y.D.; Duan, H.L.; Tang, L.S. Adaptability of citrus in subtropics of China under future climatic scenarios. Chin. J. Ecol. 2010, 29, 833–839. (In Chinese) [Google Scholar]
  31. Li, H. Citrus tree abiotic and biotic stress and implication of simulation and modeling tools in tree management. Tree For. Sci. Biotechnol. 2009, 3, 66–78. [Google Scholar]
  32. Abobatta, W.F. Influence of climate change on citrus growth and productivity (effect of temperature). Adv. Agric. Technol. Plant Sci. 2019, 2, 180036. [Google Scholar]
  33. Giuffrè, A.M.; Zappia, C.; Capocasale, M. Physicochemical stability of blood orange juice during frozen storage. Int. J. Food Prop. 2017, 20, 1930–1943. [Google Scholar]
  34. Giuffrè, A. Bergamot (Citrus bergamia, Risso): The Effects of Cultivar and Harvest Date on Functional Properties of Juice and Cloudy Juice. Antioxidants 2019, 8, 221. [Google Scholar] [CrossRef] [Green Version]
  35. Di Rauso Simeone, G.; Di Matteo, A.; Rao, M.A.; Di Vaio, C. Variations of peel essential oils during fruit ripening in four lemon (Citrus limon (L.) Burm. F.) cultivars. J. Sci. Food Agric. 2019, 100, 193–200. [Google Scholar] [CrossRef] [PubMed]
  36. Tubiello, F.N.; Rosenzweig, F.N.; Goldberg, C.R.; Jagtap, A.S.; Jones, J.W. Effects of climate change on US crop production: Simulation results using two different GCM scenarios. Part I: Wheat, potato, maize, and citrus. Clim. Res. 2002, 20, 259–270. [Google Scholar] [CrossRef] [Green Version]
  37. Masson-Delmotte, V.; Zhai, P.; Pirani, A.; Connors, S.L.; Péan, C.; Berger, S.; Caud, N.; Chen, Y.; Goldfarb, L.; Gomis, M.I.; et al. (Eds.) IPCC Climate Change 2021: The Physical Science Basis. Contribution of Working Group I to the Sixth Assessment Report of the Intergovernmental Panel on Climate Change; Cambridge University Press: Cambridge, UK, 2021. [Google Scholar]
  38. Zhou, T.J.; Chen, Z.M.; Chen, X.L.; Zuo, M.; Jiang, J.; Hu, S. Interpreting IPCC AR6: Future global climate based on projection under scenarios and on near-term information. Clim. Change Res. 2021, 17, 652–663. (In Chinese) [Google Scholar]
  39. Wang, L.K.; Qi, C.J. Research on the comparative advantage and its influencing factors of in Chinese citrus main producing region—Empirical analysis based on inter-provincial panel data. Chin. J. Agric. Resour. Reg. Plan. 2018, 39, 121–128. (In Chinese) [Google Scholar]
  40. National Bureau of Statistics of China (NBSC). China Statistical Yearbook 2019; China Statistics Press: Beijing, China, 2019. (In Chinese)
  41. Rai, P.; Rai, C.; Majumdar, G.C.; Dasgupta, S.; De, S. Storage study of ultrafiltered mosambi (Citrus sinensis (L.) Osbeck) juice. J. Food Process. Preserv. 2008, 32, 923–934. [Google Scholar] [CrossRef]
  42. Manickavasagan, A.; Ganeshmoorthy, K.; Claereboudt, M.; AlYahyai, R.; Khriji, L. Non-destructive measurement of total soluble solid (TSS) content of dates using near infrared (NIR) imaging. Emir. J. Food Agric. 2014, 26, 970. [Google Scholar] [CrossRef] [Green Version]
  43. Wu, S.; Li, M.; Zhang, C.; Tan, Q.; Yang, X.; Sun, X.; Pan, Z.; Deng, X.; Hu, C. Effects of phosphorus on fruit soluble sugar and citric acid accumulations in citrus. Plant Physiol. Biochem. 2021, 160, 73–81. [Google Scholar] [CrossRef]
  44. Nawaz, R.; Abbasi, N.A.; Hafiz, I.A.; Khalid, A. Impact of climate variables on growth and development of Kinnow fruit (Citrus nobilis Lour x Citrus deliciosa Tenora) grown at different ecological zones under climate change scenario. Sci. Hortic. 2020, 260, 108868. [Google Scholar] [CrossRef]
  45. Sun, X.; Ren, G.; You, Q.; Ren, Y.; Xu, W.; Xue, X.; Zhan, Y.; Zhang, S.; Zhang, P. Global diurnal temperature range (DTR) changes since 1901. Clim. Dyn. 2019, 52, 3343–3356. [Google Scholar] [CrossRef]
  46. Wang, S.; Xie, W.; Yan, X. Evalution on CMIP6 Model Simulation of the Diurnal Temperature Range over China. Clim. Environ. Res. 2022, 27, 79–93. (In Chinese) [Google Scholar]
  47. Xie, W.; Wang, S.; Yan, X. Evaluation and Projection of Diurnal Temperature Range in Maize Cultivation Areas in China Based on CMIP6 Models. Sustainability 2022, 14, 1660. [Google Scholar] [CrossRef]
  48. Lobell, D.B.; Burke, M. Climate Change and Food Security: Adapting Agriculture to a Warmer World; Springer Science & Business Media: Dordrecht, The Netherlands, 2010; Volume 37. [Google Scholar]
  49. Lobell, D.B.; Burke, M.B. On the use of statistical models to predict crop yield responses to climate change. Agric. For. Meteorol. 2010, 150, 1443–1452. [Google Scholar] [CrossRef]
  50. Challinor, A.J.; Simelton, E.S.; Fraser, E.D.G.; Hemming, D.; Collins, M. Increased crop failure due to climate change: Assessing adaptation options using models and socio-economic data for wheat in China. Environ. Res. Lett. 2010, 5, 34012. [Google Scholar] [CrossRef]
  51. Tao, F.; Zhang, Z.; Liu, J.; Yokozawa, M. Modelling the impacts of weather and climate variability on crop productivity over a large area: A new super-ensemble-based probabilistic projection. Agric. For. Meteorol. 2009, 149, 1266–1278. [Google Scholar] [CrossRef]
  52. Zhang, T.; Zhu, J.; Wassmann, R. Responses of rice yields to recent climate change in China: An empirical assessment based on long-term observations at different spatial scales (1981–2005). Agric. For. Meteorol. 2010, 150, 1128–1137. [Google Scholar] [CrossRef]
  53. Li, X.; Takahashi, T.; Suzuki, N.; Kaiser, H.M. The impact of climate change on maize yields in the United States and China. Agric. Syst. 2011, 104, 348–353. [Google Scholar] [CrossRef]
  54. Liu, Y.; Wang, F.; Zhang, Z.T.; Huang, C.F.; Chen, X.; Li, N. Comprehensive assessment of “climate change−Crop yield−Economic impact” in seven sub-regions of China. Clim. Change Res. 2021, 17, 455–465. [Google Scholar]
  55. Wei, F.Y. Modern Climate Statistical Diagnosis and Prediction Techniques; Meteorological Press: Beijing, China, 2007. (In Chinese) [Google Scholar]
  56. Luo, N.; Guo, Y.; Gao, Z.; Chen, K.; Chou, J. Assessment of CMIP6 and CMIP5 model performance for extreme temperature in China. Atmos. Ocean. Sci. Lett. 2020, 13, 589–597. [Google Scholar] [CrossRef]
  57. Song, S.F.; Yan, X.D. Evaluation of CMIP6 Models Performance for Winter Cold Wave Frequency in China. Clim. Environ. Res. 2022, 27, 33–49. (In Chinese) [Google Scholar]
  58. Soqanloo, S.S. Effect of Different Regional Climates on Persimmon Quality. J. Civ. Eng. Environ. Sci. 2015, 1, 008–012. [Google Scholar] [CrossRef] [Green Version]
  59. Falcão, L.D.; Burin, V.M.; Sidinei Chaves, E.; Vieira, H.J.; Brighenti, E.; Rosier, J.; Bordignon-Luiz, M.T. Vineyard altitude and mesoclimate influences on the phenology and maturation of Cabernet-Sauvignon grapes from Santa Catarina State. OENO One 2010, 44, 135–150. [Google Scholar] [CrossRef]
  60. Habibi, F.; Ramezanian, A.; Guillén, F.; Castillo, S.; Serrano, M.; Valero, D. Changes in Bioactive Compounds, Antioxidant Activity, and Nutritional Quality of Blood Orange Cultivars at Different Storage Temperatures. Antioxidants 2020, 9, 1016. [Google Scholar] [CrossRef]
  61. Cohen, S.D.; Tarara, J.M.; Kennedy, J.A. Diurnal Temperature Range Compression Hastens Berry Development and Modifies Flavonoid Partitioning in Grapes. Am. J. Enol. Vitic. 2012, 63, 112–120. [Google Scholar] [CrossRef]
  62. Ahmad, S.; Firdous, I.; Jatoi, G.H.; Rais, M.U.N.; Mohsin, A.Q. Economic impact of climate change on the production of citrus fruit in Punjab province of the Pakistan. Sci. Int. 2017, 29, 413. [Google Scholar]
  63. Li, Y.; Guan, K.; Schnitkey, G.D.; DeLucia, E.; Peng, B. Excessive rainfall leads to maize yield loss of a comparable magnitude to extreme drought in the United States. Glob. Change Biol. 2019, 25, 2325–2337. [Google Scholar] [CrossRef] [PubMed] [Green Version]
  64. Xu, R.; Li, Y.; Guan, K.; Zhao, L.; Peng, B.; Miao, C.; Fu, B. Divergent responses of maize yield to precipitation in the United States. Environ. Res. Lett. 2021, 17, 14016. [Google Scholar] [CrossRef]
  65. Hirpo, F.H. Review on the Effects of Climate Change Variability on Horticultural Productivity. Int. J. Environ. Sci. Nat. Resour. 2019, 17, 555969. [Google Scholar] [CrossRef]
  66. El Yaacoubi, A.; El Jaouhari, N.; Bourioug, M.; El Youssfi, L.; Cherroud, S.; Bouabid, R.; Chaoui, M.; Abouabdillah, A. Potential vulnerability of Moroccan apple orchard to climate change-induced phenological perturbations: Effects on yields and fruit quality. Int. J. Biometeorol. 2020, 64, 377–387. [Google Scholar] [CrossRef]
  67. Cervantes, L.; Ariza, M.T.; Miranda, L.; Lozano, D.; Medina, J.J.; Soria, C.; Martínez-Ferri, E. Stability of Fruit Quality Traits of Different Strawberry Varieties under Variable Environmental Conditions. Agronomy 2020, 10, 1242. [Google Scholar] [CrossRef]
  68. Tao, F.; Yokozawa, M.; Liu, J.; Zhang, Z. Climate-crop yield relationships at provincial scales in China and the impacts of recent climate trends. Clim. Res. 2008, 38, 83–94. [Google Scholar] [CrossRef]
  69. Zhao, C.; Piao, S.; Huang, Y.; Wang, X.; Ciais, P.; Huang, M.; Zeng, Z.; Peng, S. Field warming experiments shed light on the wheat yield response to temperature in China. Nat. Commun. 2016, 7, 13530. [Google Scholar] [CrossRef]
  70. Shi, W.; Tao, F.; Zhang, Z. A review on statistical models for identifying climate contributions to crop yields. J. Geogr. Sci. 2013, 23, 567–576. [Google Scholar] [CrossRef]
  71. Feng, L.; Wang, H.; Ma, X.; Peng, H.; Shan, J. Modeling the current land suitability and future dynamics of global soybean cultivation under climate change scenarios. Field Crops Res. 2021, 263, 108069. [Google Scholar] [CrossRef]
  72. Zhang, Z.; Chen, Y.; Wang, C.; Wang, P.; Tao, F. Future extreme temperature and its impact on rice yield in China. Int. J. Climatol. 2017, 37, 4814–4827. [Google Scholar] [CrossRef]
  73. Liu, Y.C.; Liu, S.S.; Deng, J.H. Effects of climate Factors on fruit quality of Mandarin oranges. Chin. J. Agrometeorol. 1998, 19, 29–31. (In Chinese) [Google Scholar]
  74. Hu, C.S.; Zhao, S.D.; Xing, W.Y.; Li, J.A. A Study on Factors Influencing the Quality of Mandarin Oranges “Good Place” Green Food and Evaluation of the Quality of Fruits. Acta Agric. Univ. Jiangxiensis 2000, 22, 70–74. (In Chinese) [Google Scholar]
  75. Wen, T.; Xiong, Q.E.; Zeng, W.G.; Liu, Y.P. The Gray System Analysis of Climatic Factors to the Organic Acid and Sugar Content of Navel Orange (Citrus sinesis Osbeck) Fruit. J. Sichuan Agric. Univ. 2001, 19, 3. (In Chinese) [Google Scholar]
  76. Bao, J.F.; Xia, R.X.; Deng, X.X.; Peng, S.A.; Liu, Y.Z.; Ma, X.T.; Zhang, H.Y. Preliminary Study on Fruit Quality of Newhall Orange from Various Spot with Different Latitude. Subtrop. Plant Sci. 2006, 35, 13–16. (In Chinese) [Google Scholar]
  77. Bao, J.F. Study and Division of Fruit Quality of Newhall Navel Orange and Main Citrus Varieties in Hubei Province; HZAU (Huazhong Agricultural University): Wuhan, China, 2005. (In Chinese) [Google Scholar]
  78. Zeng, X.G. Study on Sugar and Acid Content and Composition of Citrus from Different Species and Producing Areas; HZAU (Huazhong Agricultural University): Wuhan, China, 2005. (In Chinese) [Google Scholar]
  79. Bao, J.F.; Xia, R.X.; Deng, X.X.; Peng, S.A.; Liu, Y.Z.; Ma, X.T.; Zhang, H.Y. Research on the Fruit Quality of Newhall Navel Orange of Hubei Province. J. Wuhan Bot. Res. 2005, 23, 583–587. (In Chinese) [Google Scholar]
  80. Lu, X.P.; Li, J.; Xiong, J.; Cao, X.J.; Xie, S.X. Soil nutrition status at orchards of Newhall navel orange and the fruit quality at different latitudes of Hunan province. J. Hunan Agric. Univ. (Nat. Sci.) 2014, 40, 615–620. (In Chinese) [Google Scholar]
  81. Liao, Q.H. Study on Fruit Quality Characteristics and Origin Identification of Navel Orange in Newhall; Southwest University: Chongqing, China, 2014. (In Chinese) [Google Scholar]
  82. Li, J.Q.; Li, W.Y.; Yang, S.A.; Wu, C.M.; Long, D.C.; Luo, F.X. Analysis on fruit quality characteristics of main citrus varieties in Guizhou. Jiangsu Agric. Sci. 2013, 41, 170–171. (In Chinese) [Google Scholar]
  83. Liang, X.; Zhao, X.L.; Tang, Z.P.; Wang, M.Z.; Wu, R.C.; Qin, F.L. Study on the Horticulture Features and Climatic Factors in Miyamoto SpecialPrecocious Satsuma. J. Anhui Agri. Sci. 2013, 41, 5684–5686. (In Chinese) [Google Scholar]
  84. Jiang, J.F. Present situation and development countermeasure of citrus industry in Yunfu City. Anhui Agri. Sci. Bull. 2014, 20, 55–56. (In Chinese) [Google Scholar]
  85. Chen, Y.T.; Luo, Y.; Li, J.Q. Fruit quality analysis of main citrus cultivars in Guizhou. Seed 2017, 36, 110–112. (In Chinese) [Google Scholar]
Figure 1. 79 meteorological stations in citrus cultivation areas.
Sustainability 14 09366 g001
Figure 2. Correlation coefficient diagram between the TSS and DTR for each period from July to December. The abscissa represents the beginning month, and the ordinate represents different time spans of the monthly mean DTR. All data passed the significant correlation coefficient at the 0.05 significance level.
Sustainability 14 09366 g002
Figure 3. Under the two scenarios, SSP2-4.5 and SSP5-8.5, the DTR in July changes in the near future (2021–2040) and mid future (2041–2060) compared with the historical period (1995–2014).
Sustainability 14 09366 g003
Figure 4. Under the two scenarios, SSP2-4.5 and SSP5-8.5, the TSS content of citrus at the meteorological site scale of Chinese citrus-producing areas changes in the near future (2021–2040) and in the mid future (2041–2060) compared with the historical period (1995–2014). The dots indicate citrus TSS content variations. Blue indicates decreasing change, and red indicates increasing change.
Sustainability 14 09366 g004
Figure 5. Correlation coefficient diagram between the monthly mean maximum temperature, minimum temperature, relative humidity and mean temperature for each month from July to December and yield. The abscissa represents each month, and the ordinate represents the monthly mean climate variables mentioned above. The correlation coefficients in the figure all passed the significance test at 0.05, and those that did not pass are displayed as blanks.
Sustainability 14 09366 g005
Figure 6. Under the two scenarios, SSP2-4.5 and SSP5-8.5, the various climate factors change in the near future (2021–2040) and mid future (2041–2060) compared with the historical period (1995–2014). (a) Mean temperature (°C) in October. (b) Mean minimum temperature (°C) in November. (c) Mean maximum temperature (°C) in September. (d) Mean relative humidity (%) in October.
Sustainability 14 09366 g006aSustainability 14 09366 g006b
Figure 7. Under the two scenarios, SSP2-4.5 and SSP5-8.5, the yield of citrus at the meteorological site scale of Chinese citrus-producing areas changes in the near future (2021–2040) and in the mid future (2041–2060) compared with the historical period (1995–2014). The orange dots indicate yield changes whose sizes show the degree of change.
Sustainability 14 09366 g007
Figure 8. Under the two scenarios, SSP2-4.5 and SSP5-8.5, the quality-yield of citrus at the meteorological site scale of Chinese citrus-producing areas will change in the near future (2021–2040) and in the mid future (2041–2060) compared with the historical period (1995–2014). The orange dots indicate quality-yield changes, whose sizes show the degree of change. The red circles on the outer layer of the dots indicate the increase in TSS content, and the blue circles indicate the decrease in TSS content shown in Figure 4.
Sustainability 14 09366 g008
Table 1. 19 CMIP6 models used in the study.
CMIP6 ModelsInstitutionSpatial Resolution (Lat ∗ lon)Variables
ACCESS-CM2CSIRO-ARCCSS, Australia144 ∗ 192Tas, Tasmax, Tasmin, Hurs
ACCESS-ESM1-5CSIRO, Australia145 ∗ 192Tas, Tasmax, Tasmin, Hurs
BCC-CSM2-MRBCC, China160 ∗ 320Tas, Tasmax, Tasmin
CanESM5CCCma, Canada64 ∗ 128Tas, Tasmax, Tasmin, Hurs
CAS-ESM2-0CAS, China128 ∗ 256Tas, Tasmax, Tasmin, Hurs
CMCC-ESM2CMCC, Italy192 ∗ 288Tas, Tasmax, Tasmin, Hurs
EC-Earth3EC-Earth-Consortium, European Union256 ∗ 512Tas, Tasmax, Tasmin, Hurs
EC-Earth3-VegEC-Earth-Consortium, European Union256 ∗ 512Tas, Tasmax, Tasmin, Hurs
EC-Earth3-Veg-LREC-Earth-Consortium, European Union160 ∗ 320Tas, Tasmax, Tasmin, Hurs
FIO-ESM-2-0FIO-QLNM, China192 ∗ 288Tas, Tasmax, Tasmin, Hurs
FGOALS-g3CAS, China80 ∗ 180Tas, Tasmax, Tasmin, Hurs
GFDL-ESM4NOAA-GFDL, United States180 ∗ 288Tas, Tasmax, Tasmin, Hurs
INM-CM4-8INM, Russia120 ∗ 180Tas, Tasmax, Tasmin, Hurs
INM-CM5-0INM, Russia120 ∗ 180Tas, Tasmax, Tasmin, Hurs
IPSL-CM6A-LRIPSL, France143 ∗ 144Tas, Tasmax, Tasmin, Hurs
MIROC6MIROC, Japan128 ∗ 256Tas, Tasmax, Tasmin, Hurs
MPI-ESM1-2-HRMPI-M, Germany192 ∗ 384Tas, Tasmax, Tasmin, Hurs
MPI-ESM1-2-LRMPI-M, Germany96 ∗ 192Tas, Tasmax, Tasmin, Hurs
MRI-ESM2-0MRI, Japan160 ∗ 320Tas, Tasmax, Tasmin, Hurs
Publisher’s Note: MDPI stays neutral with regard to jurisdictional claims in published maps and institutional affiliations.

