
Integration of Solar Photovoltaic Systems into Power Networks: A Scientific Evolution Analysis

 ,
,  ,
,  ,
,  and
and
Abstract
:1. Introduction
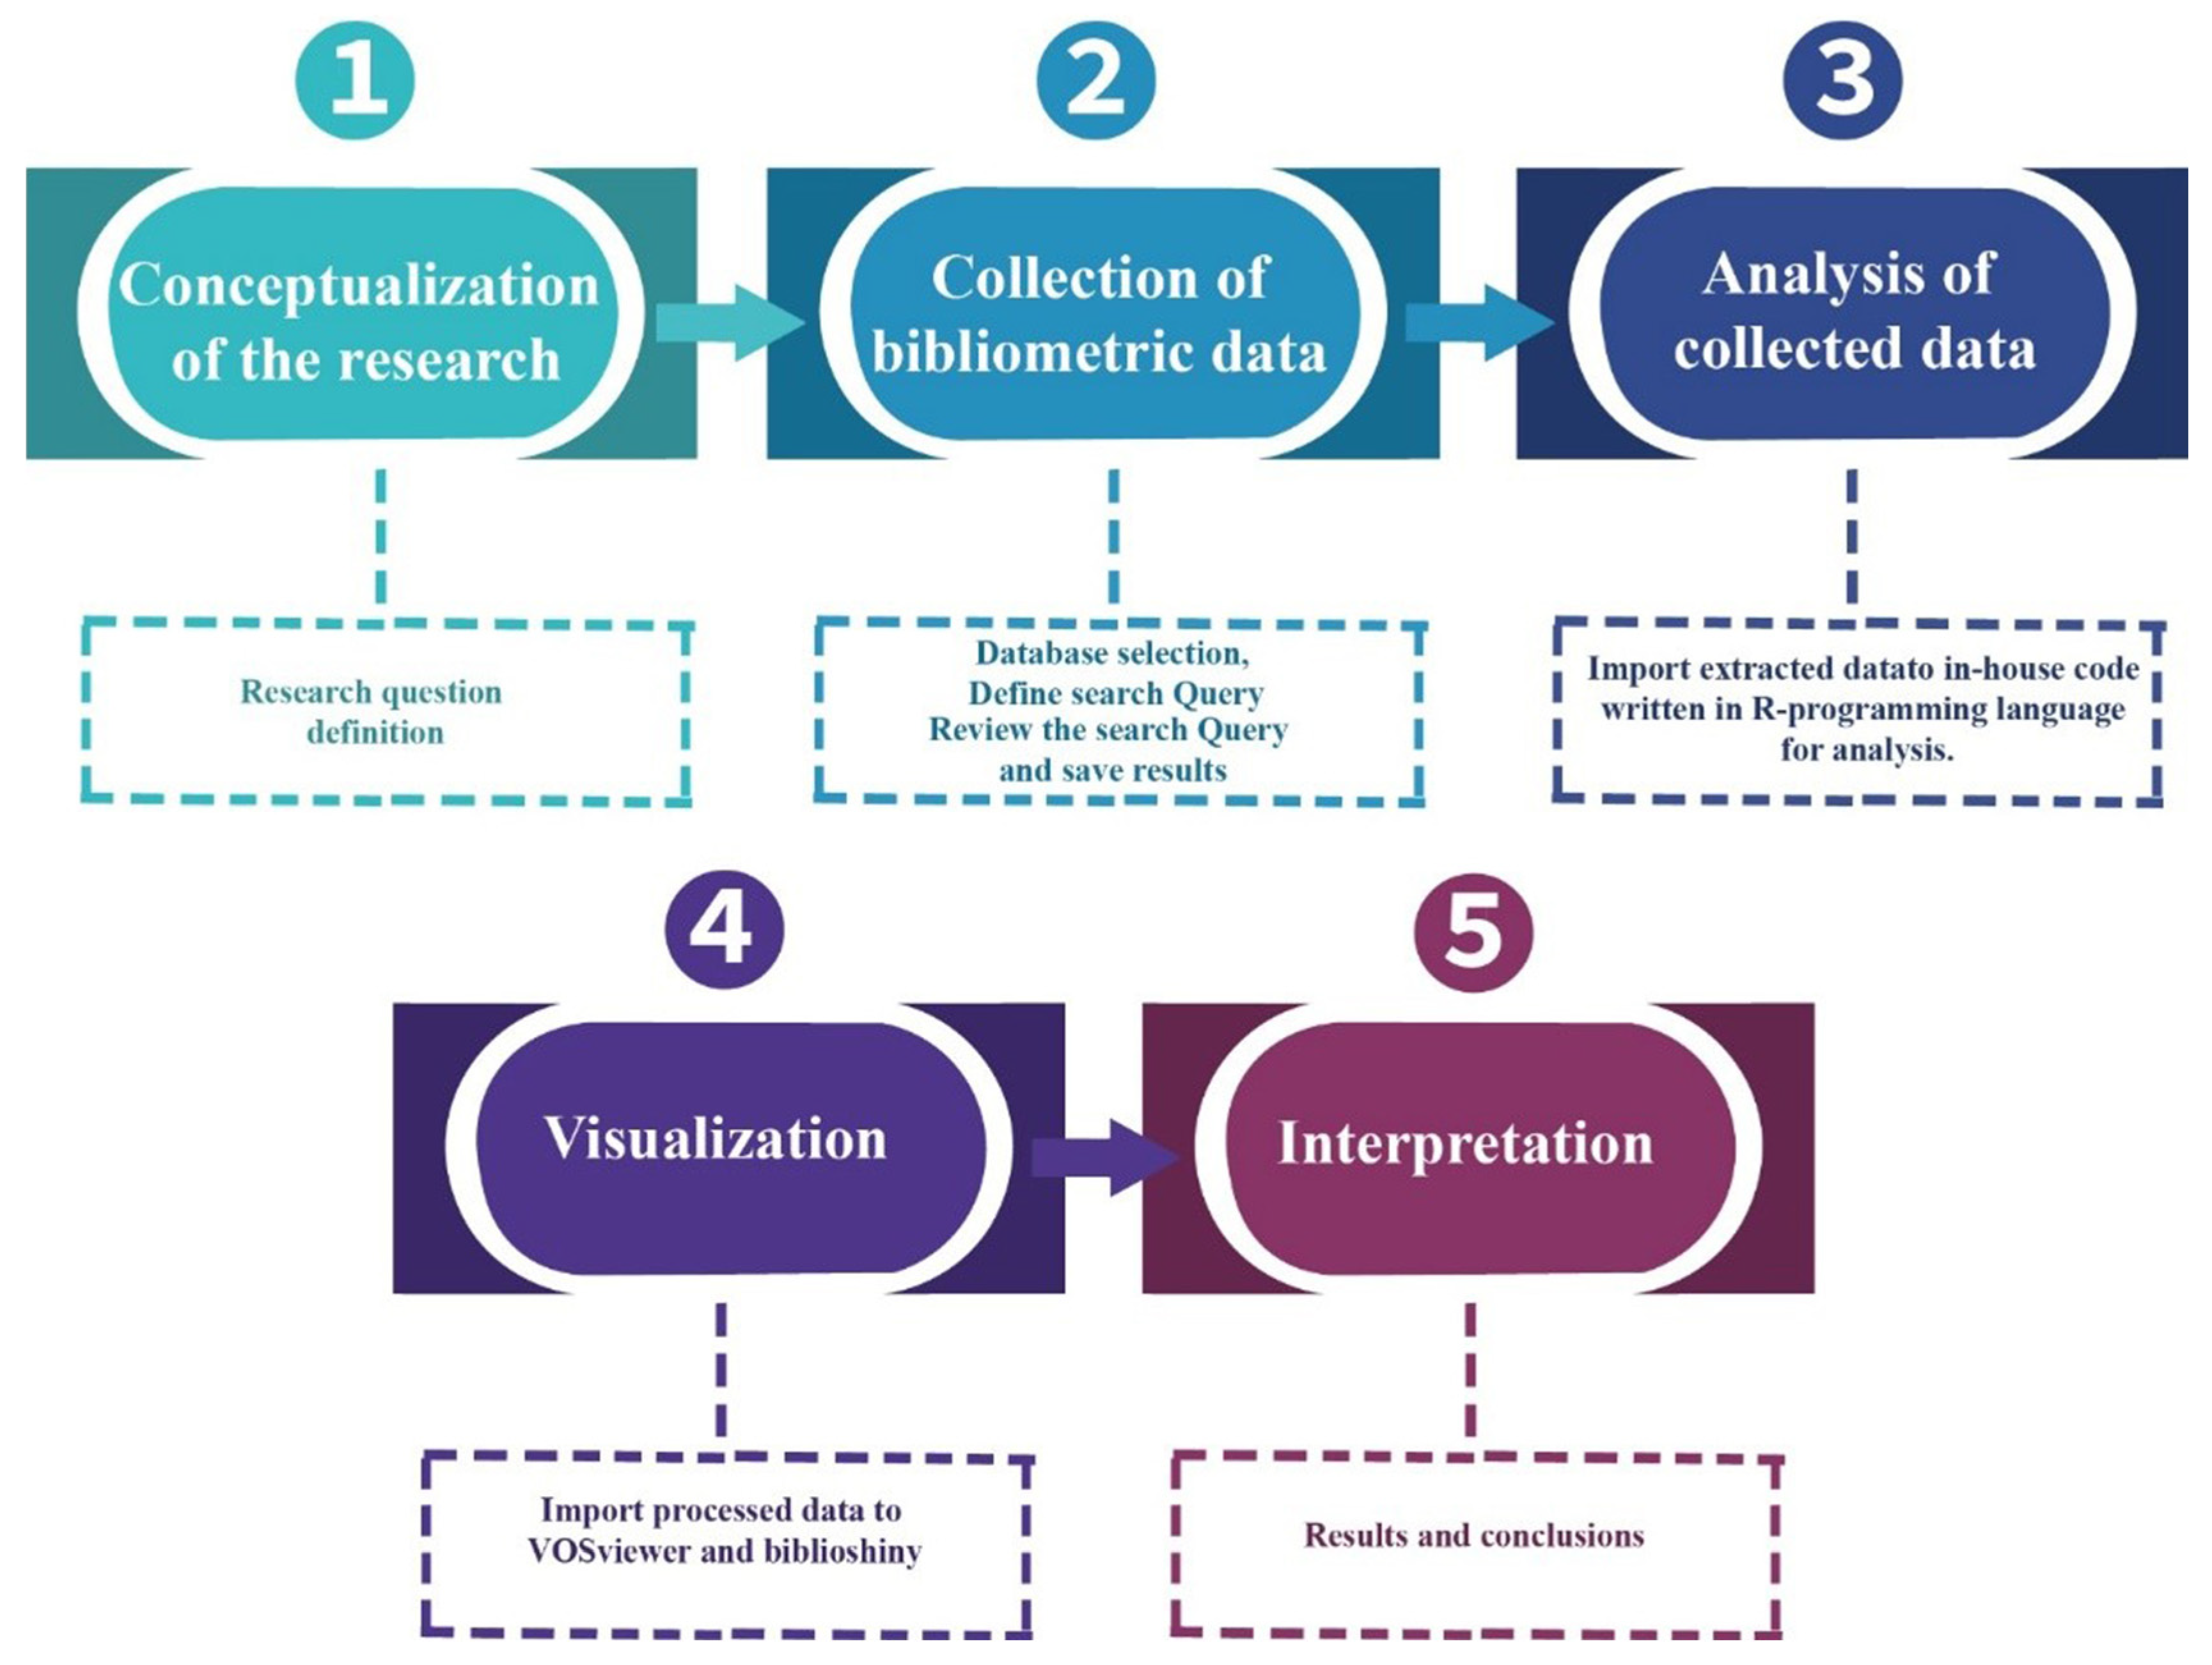
2. Materials and Methods
2.1. Database Selection
2.2. Search Query
2.3. Research Tools
3. Results
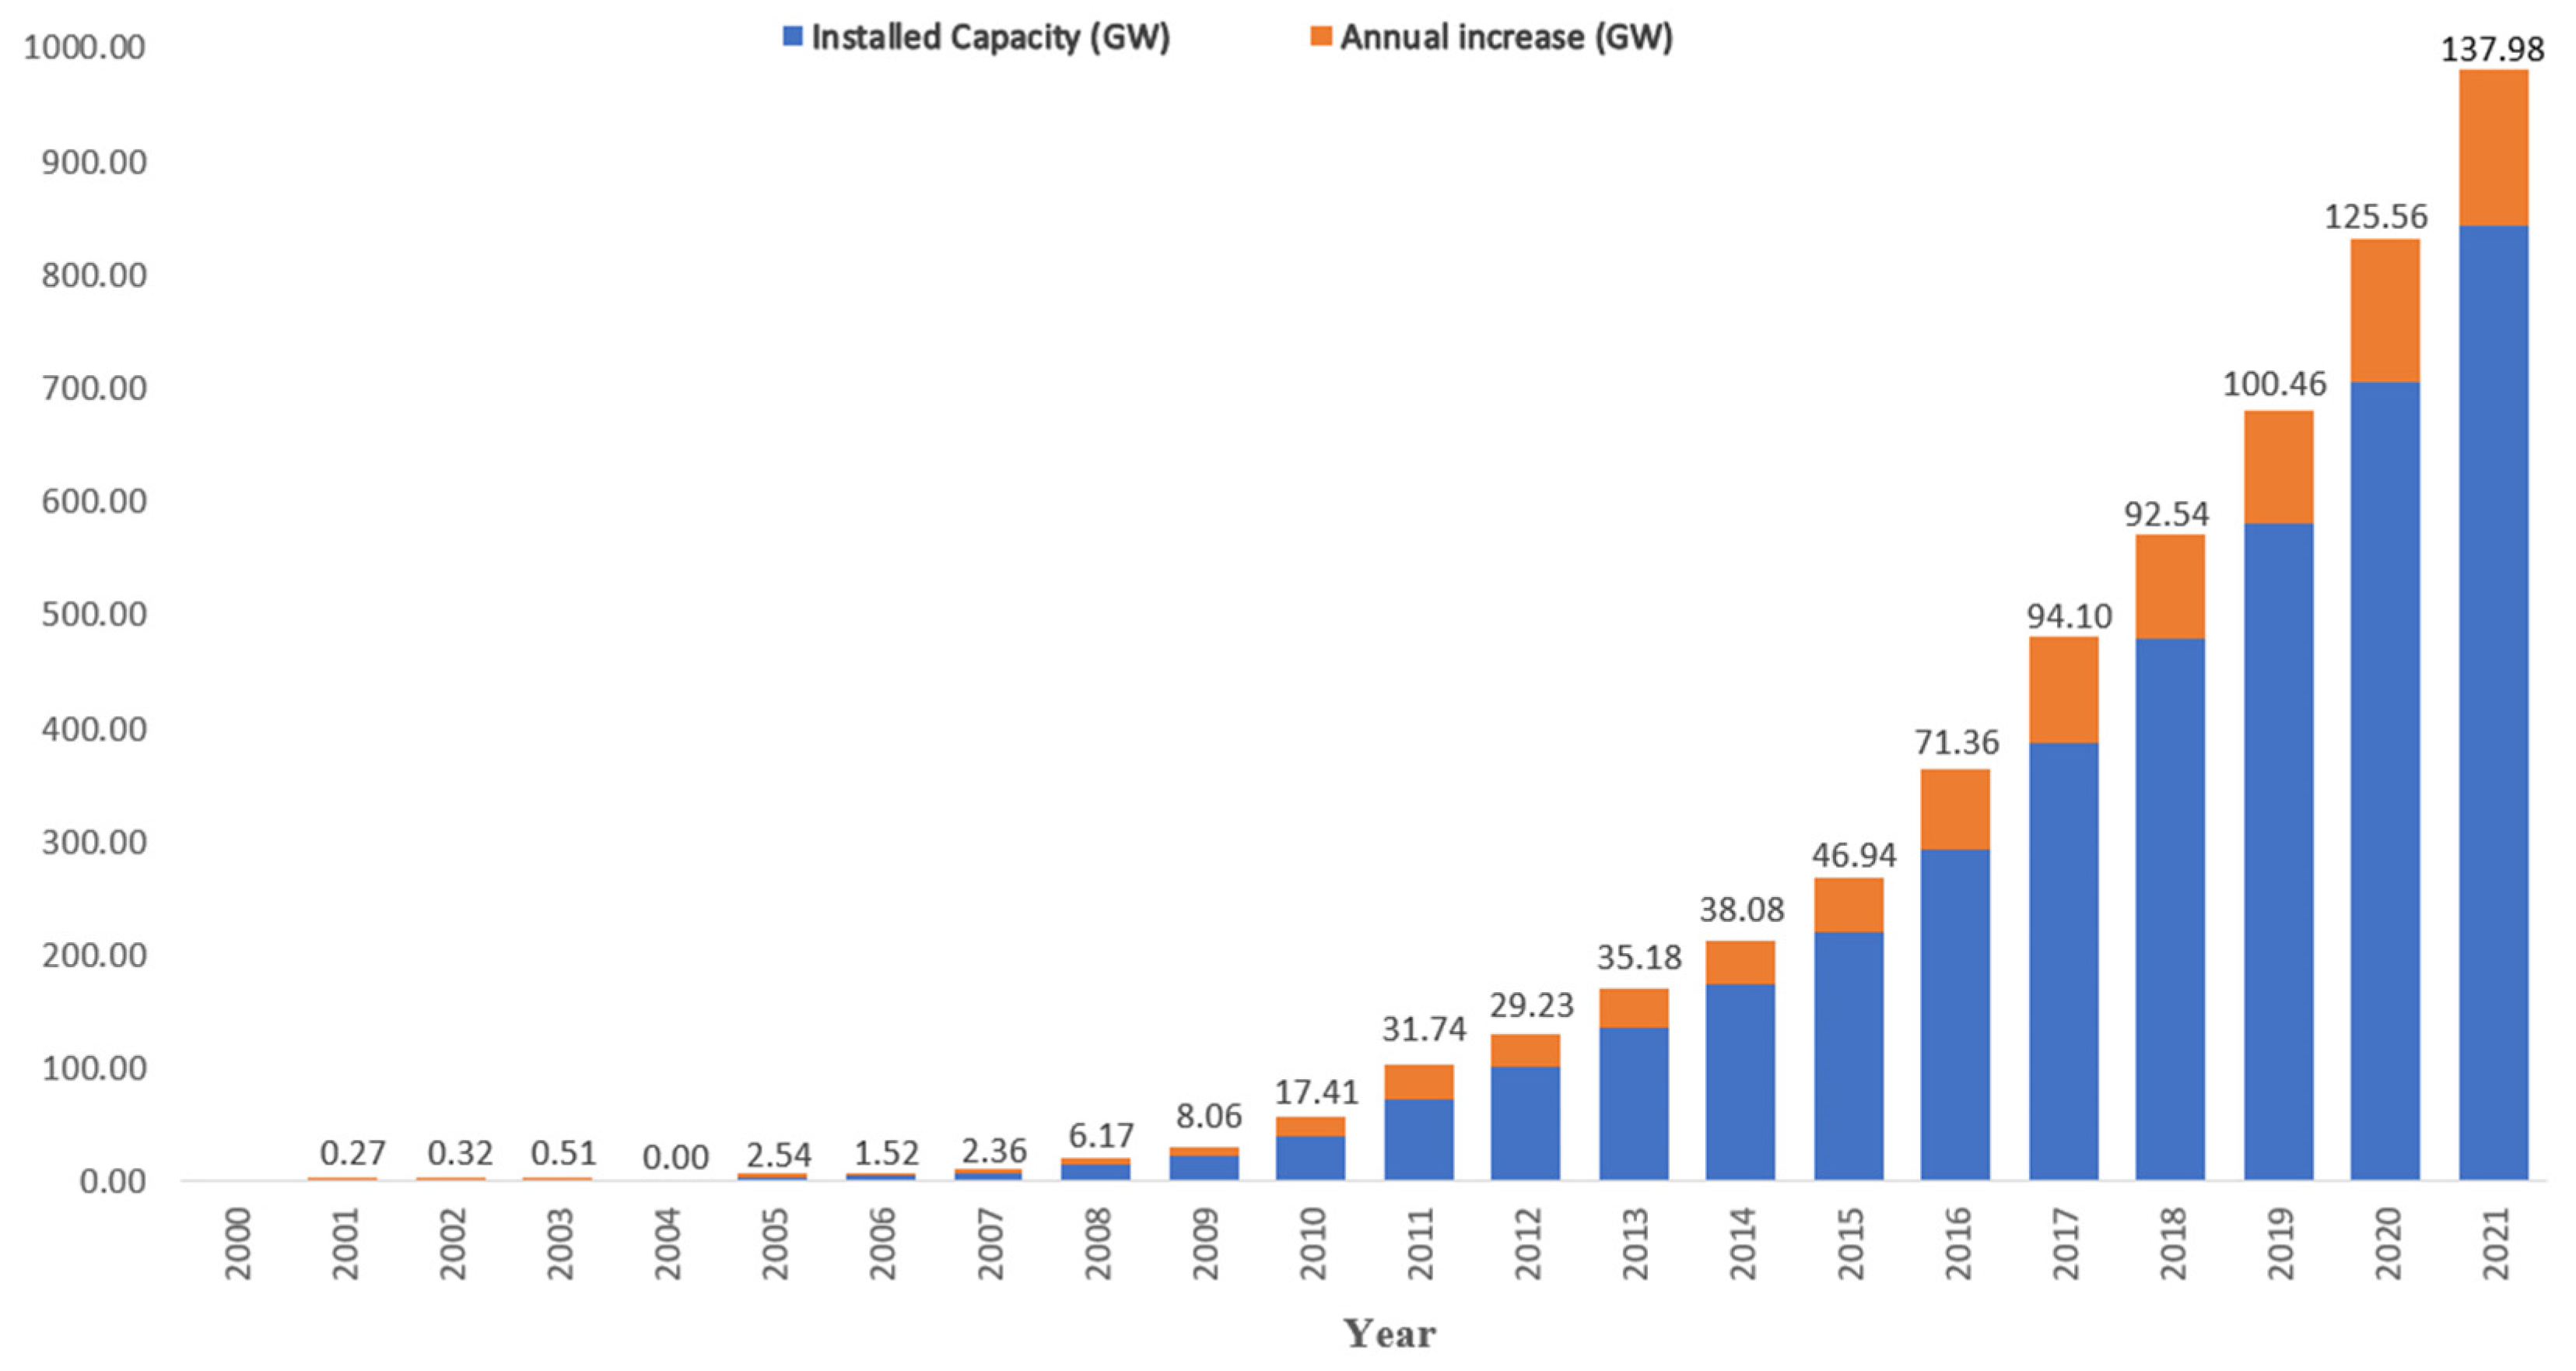
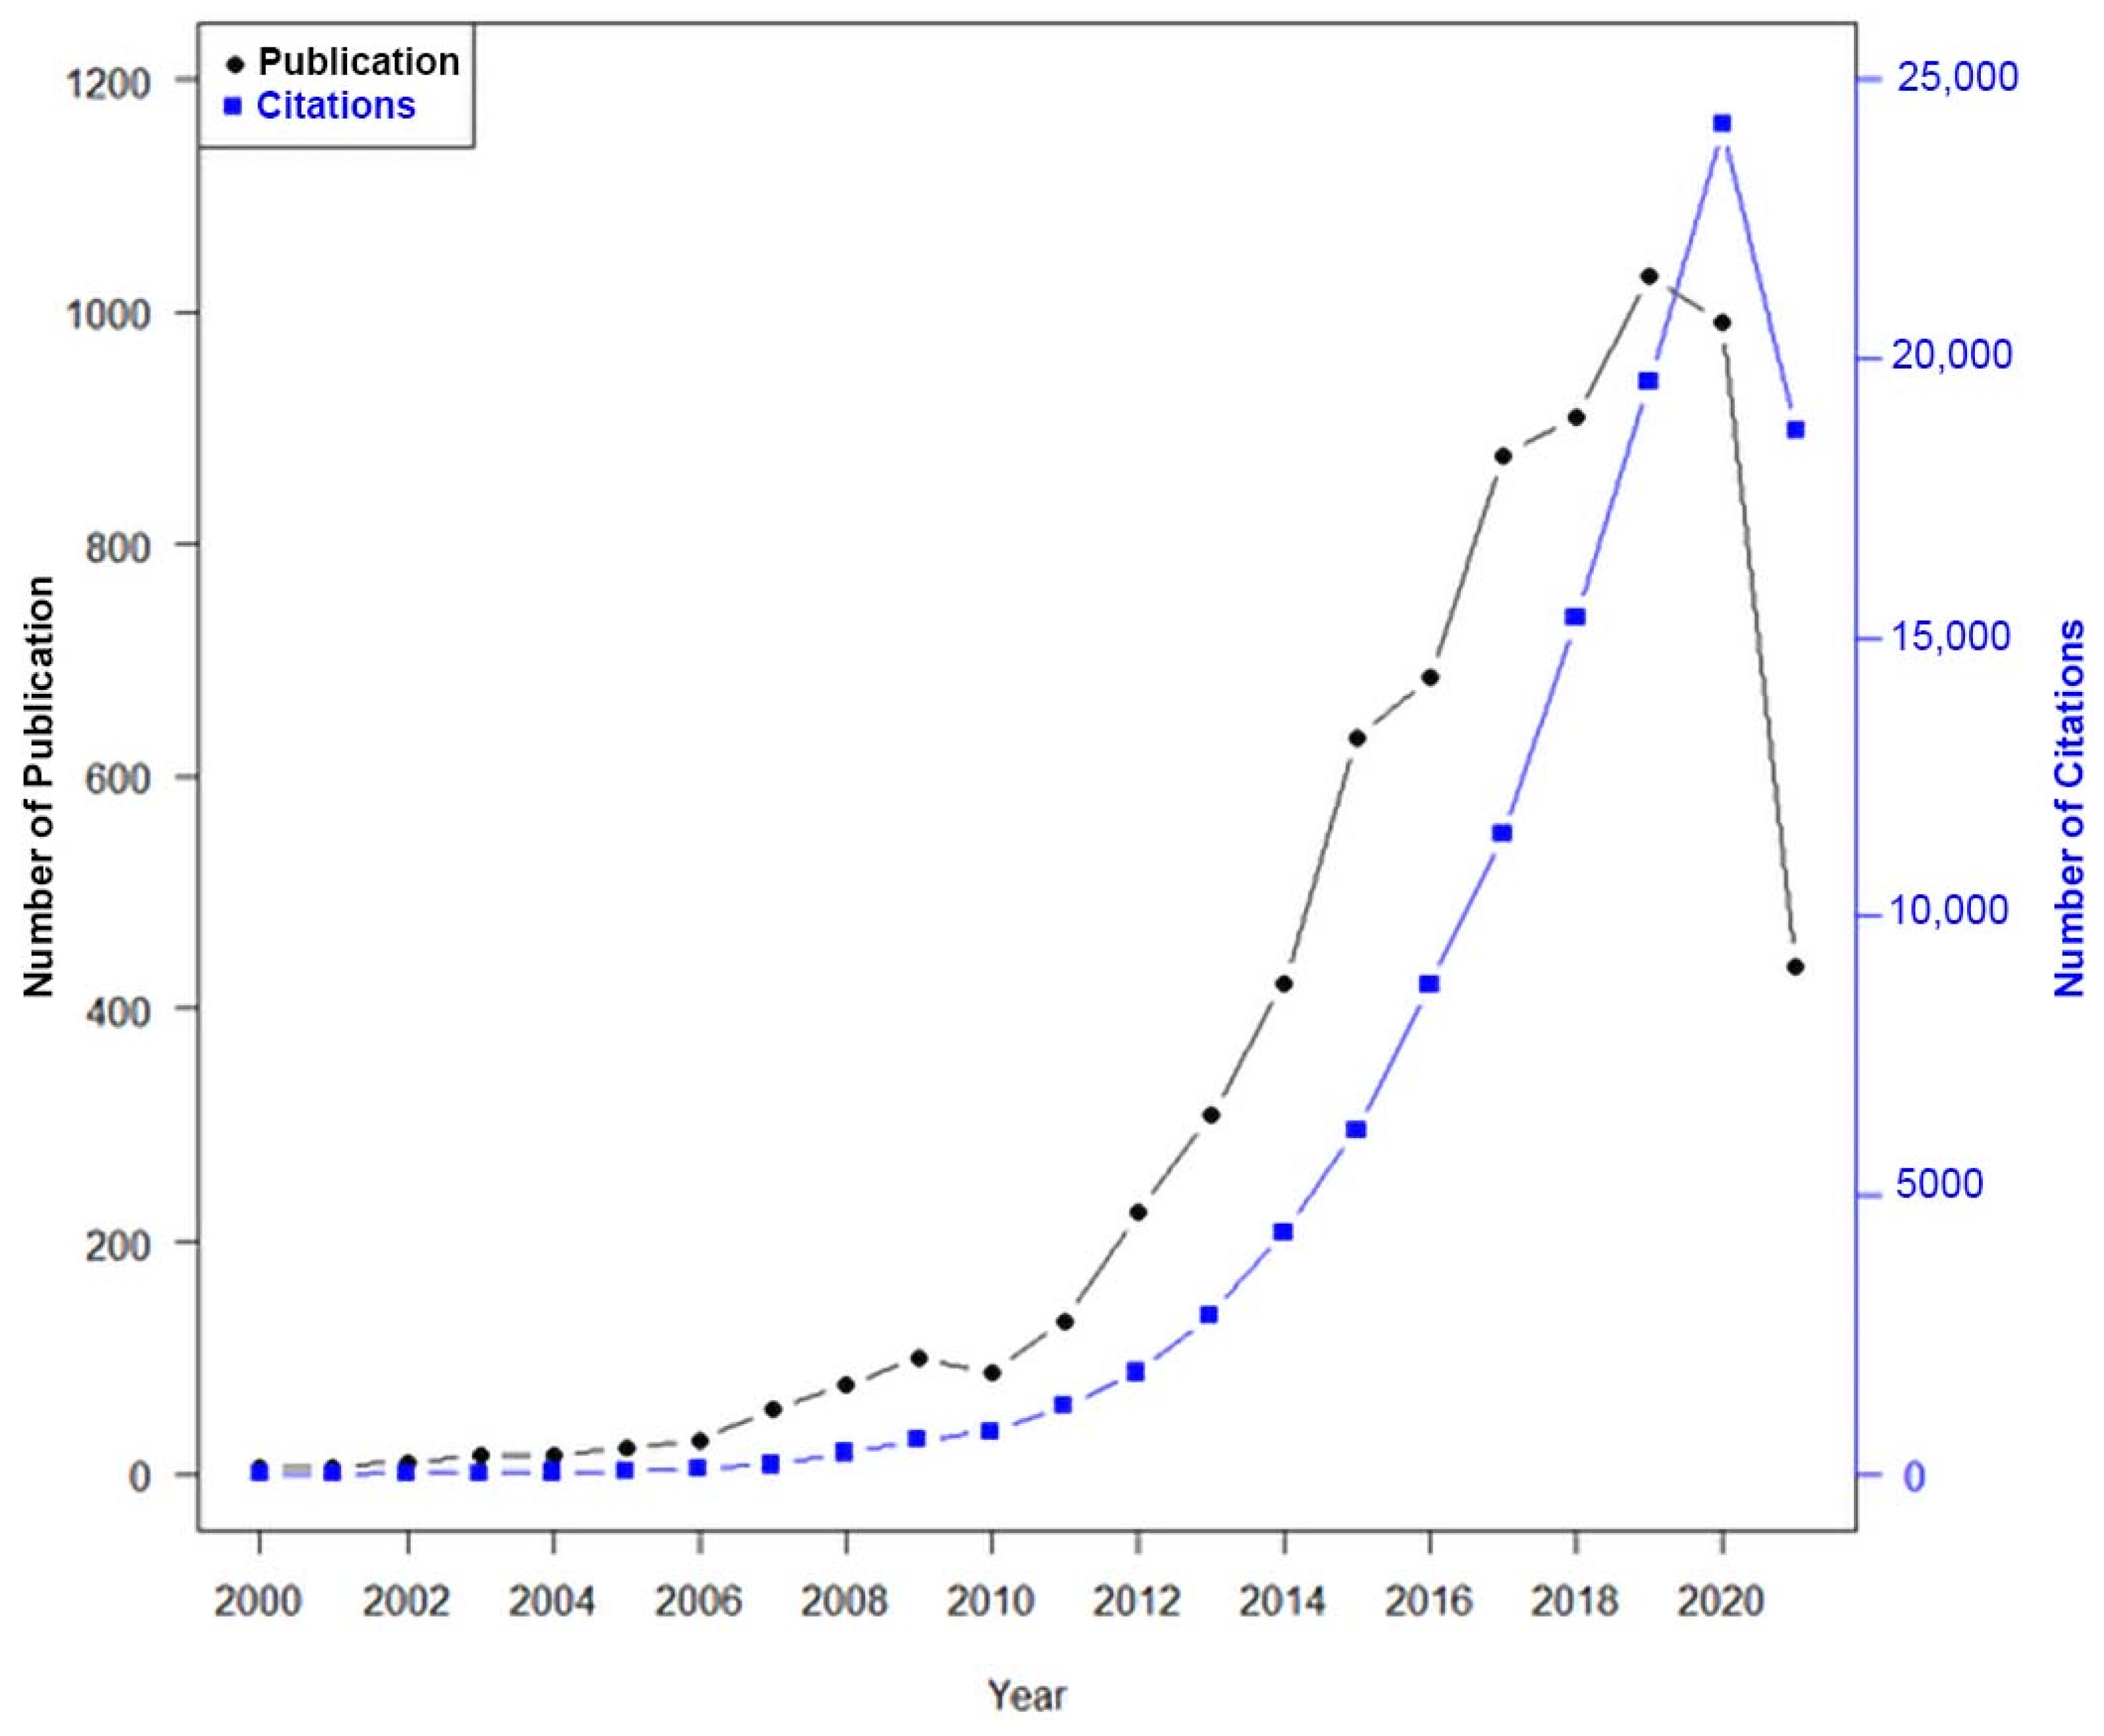
3.1. General Trends
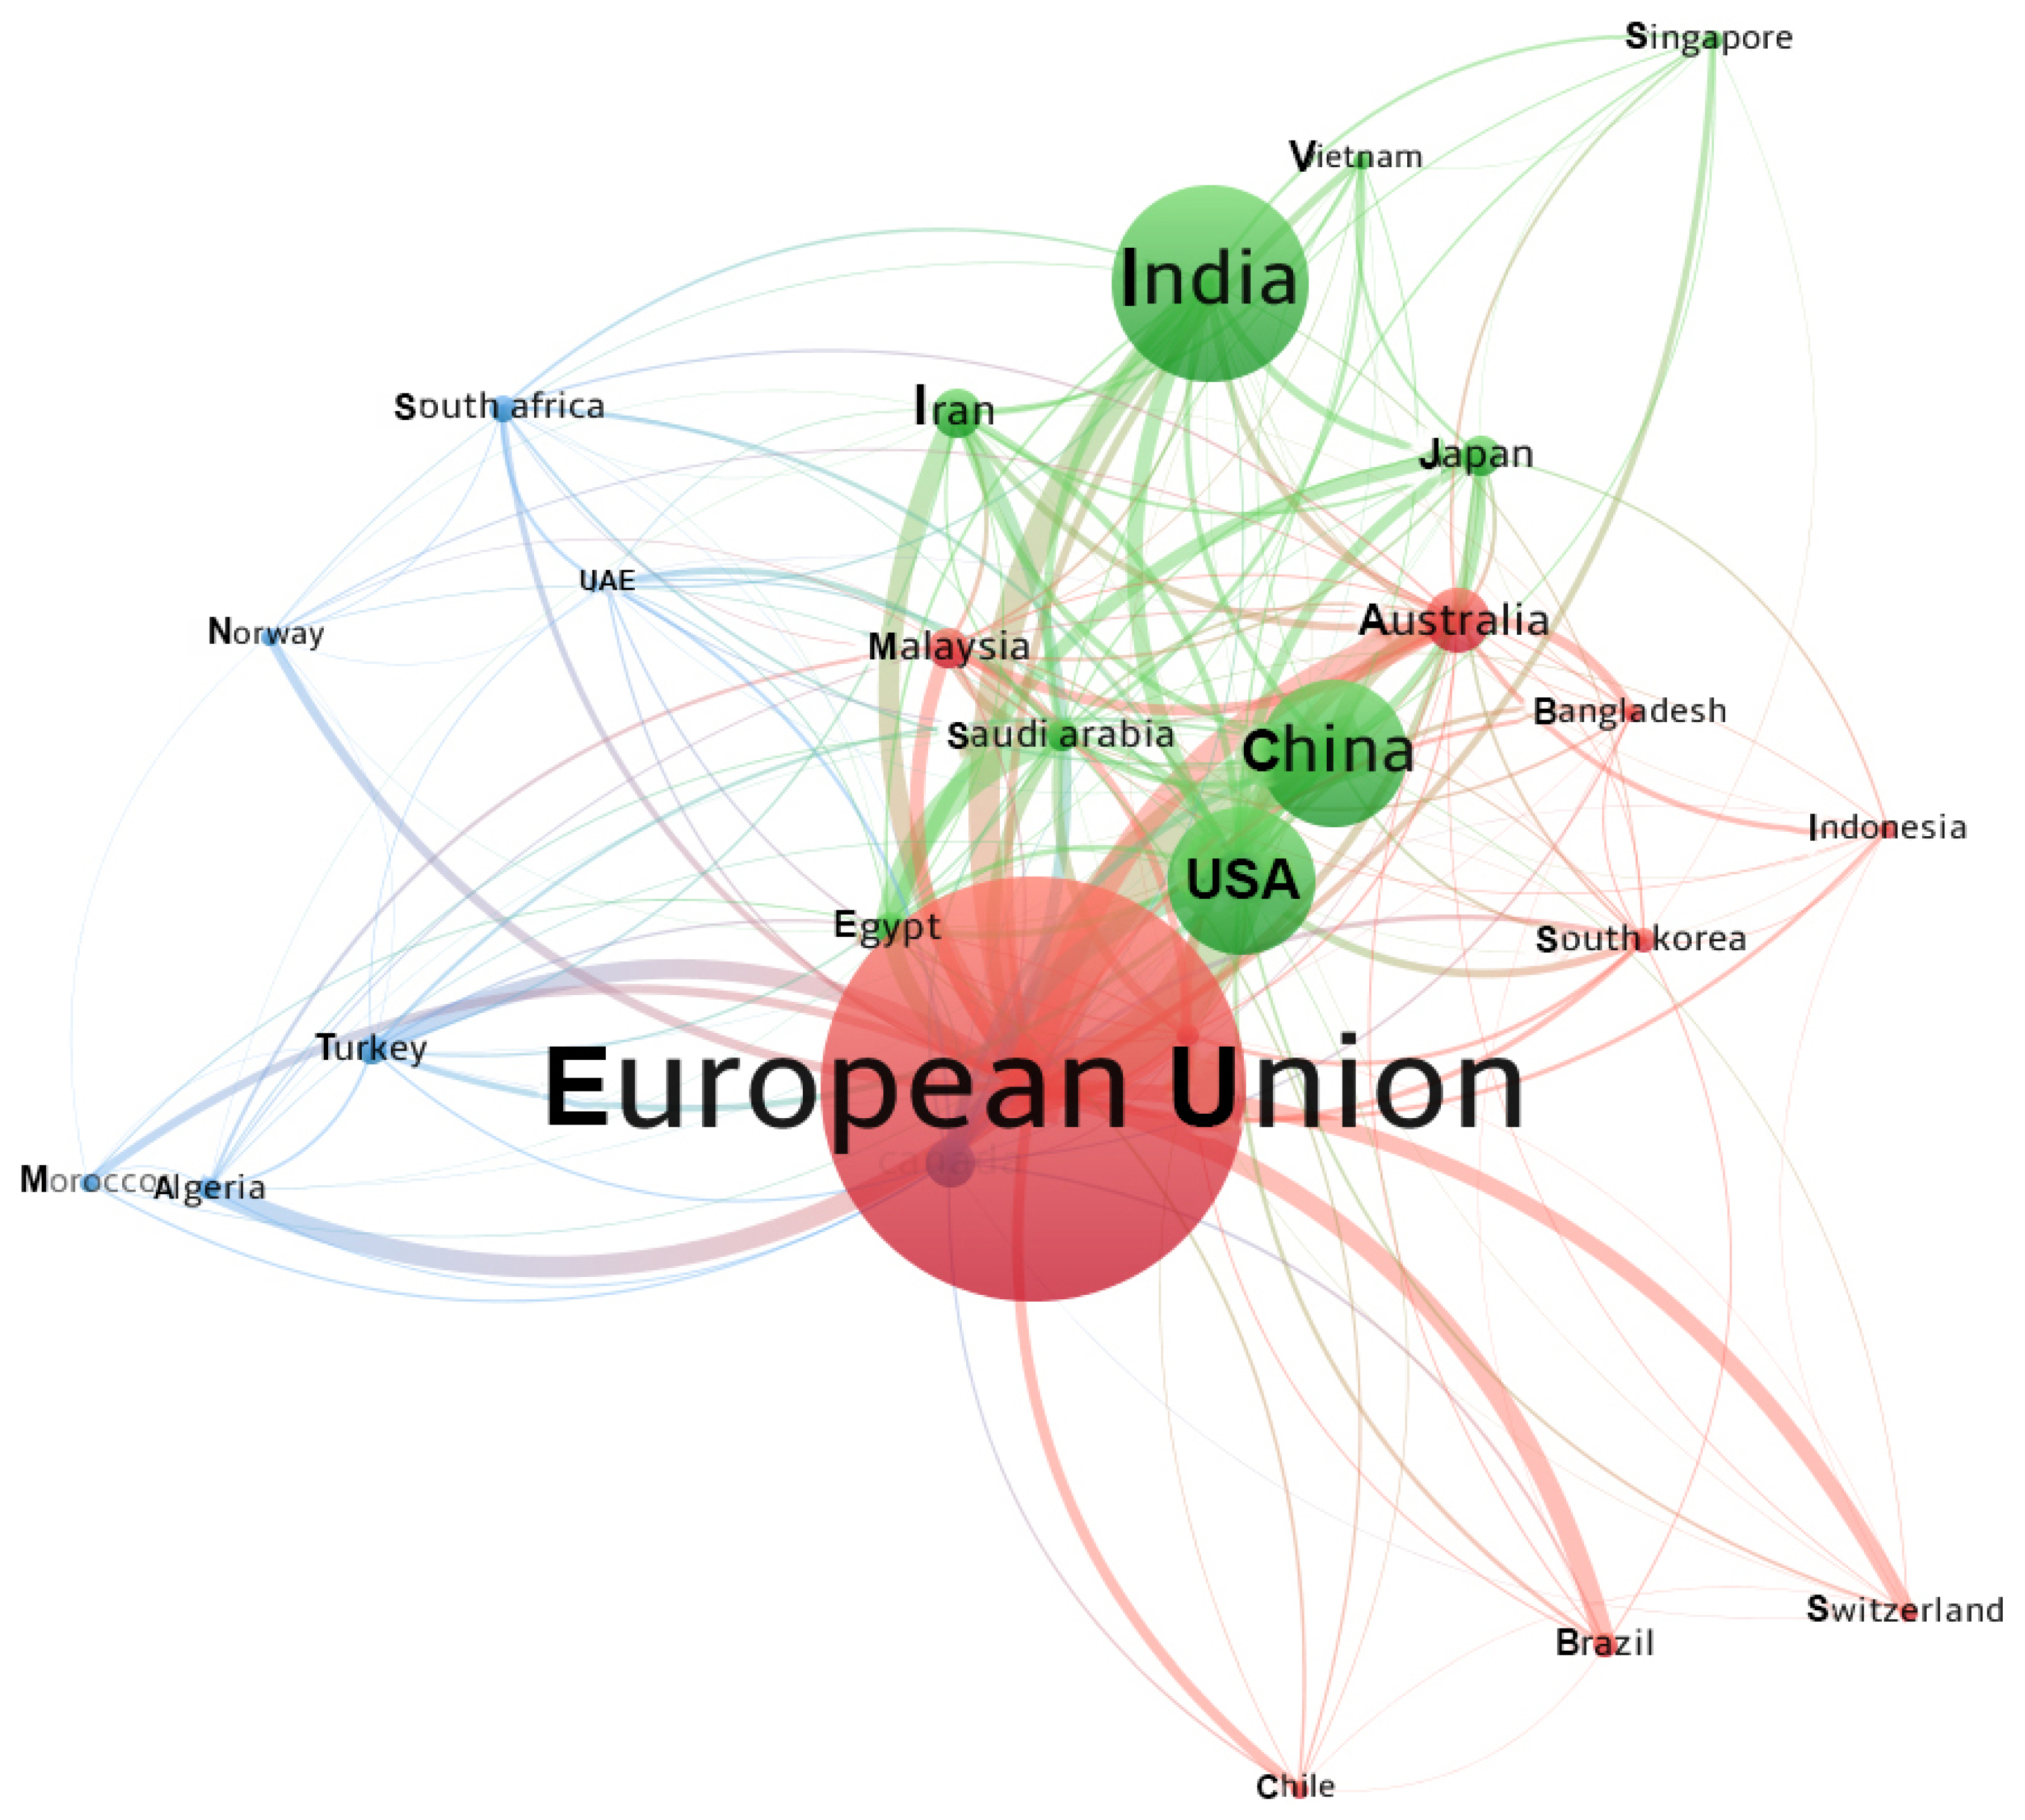
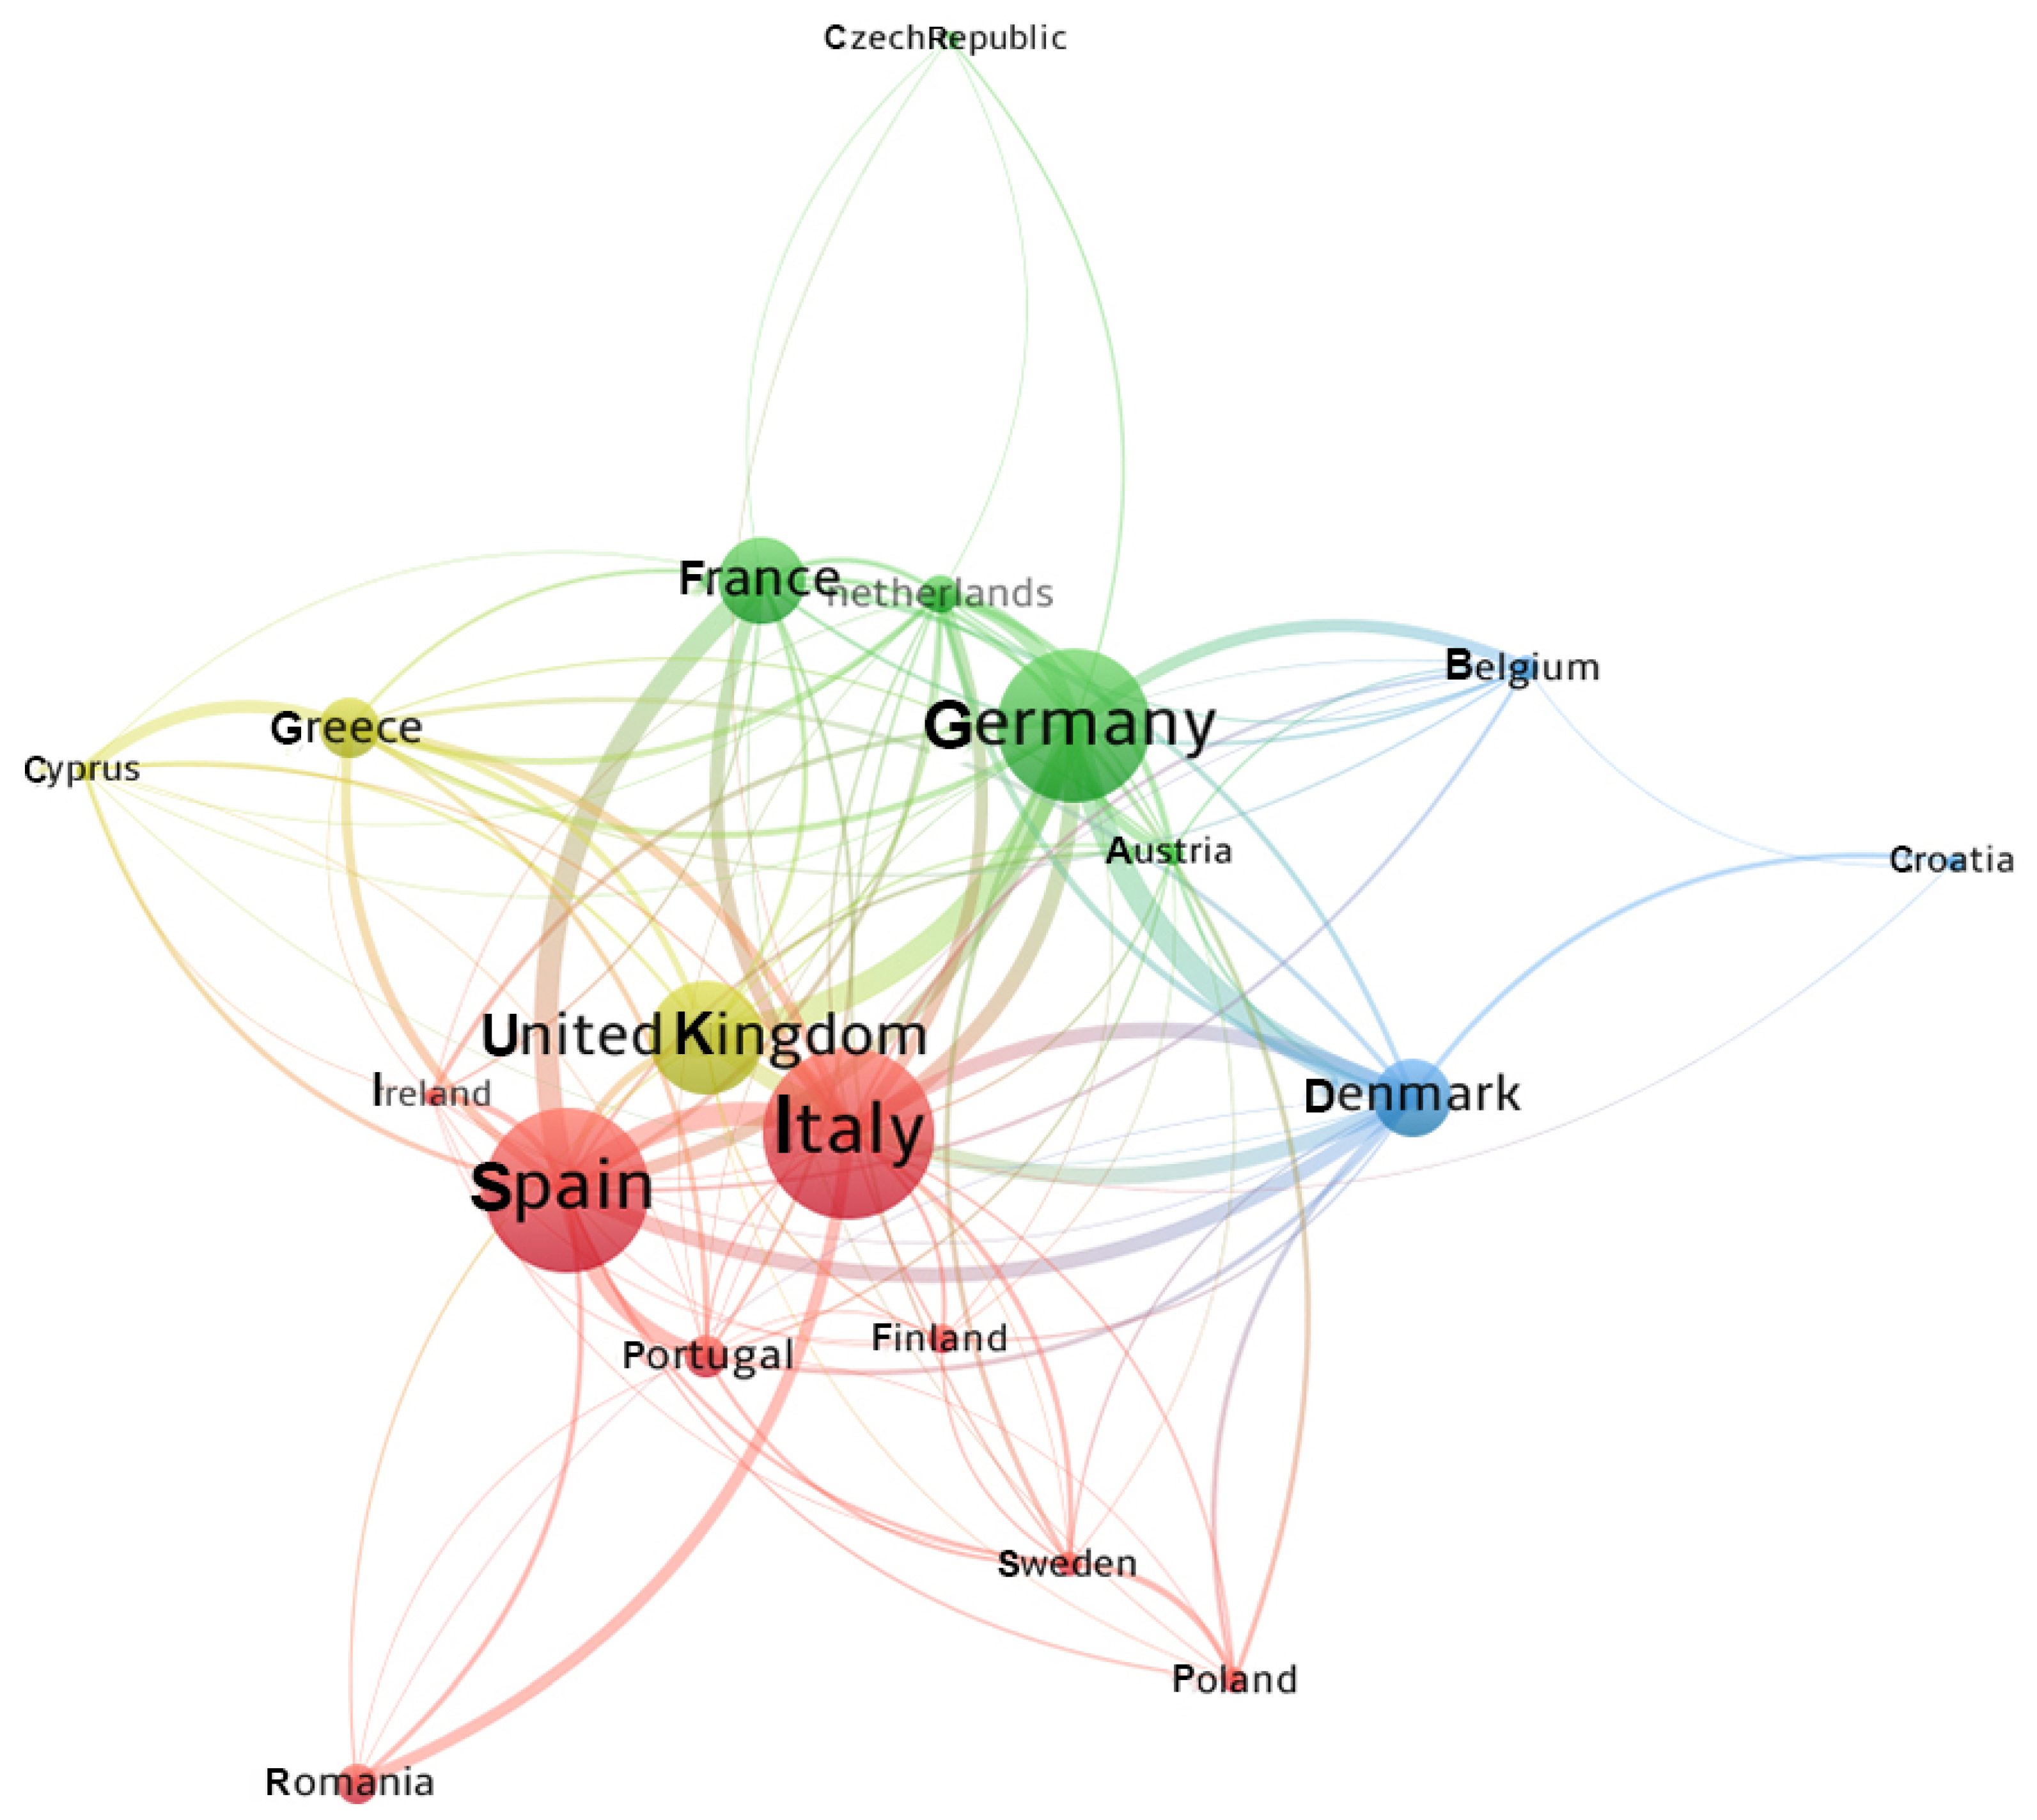
3.2. Country/Area Statistics
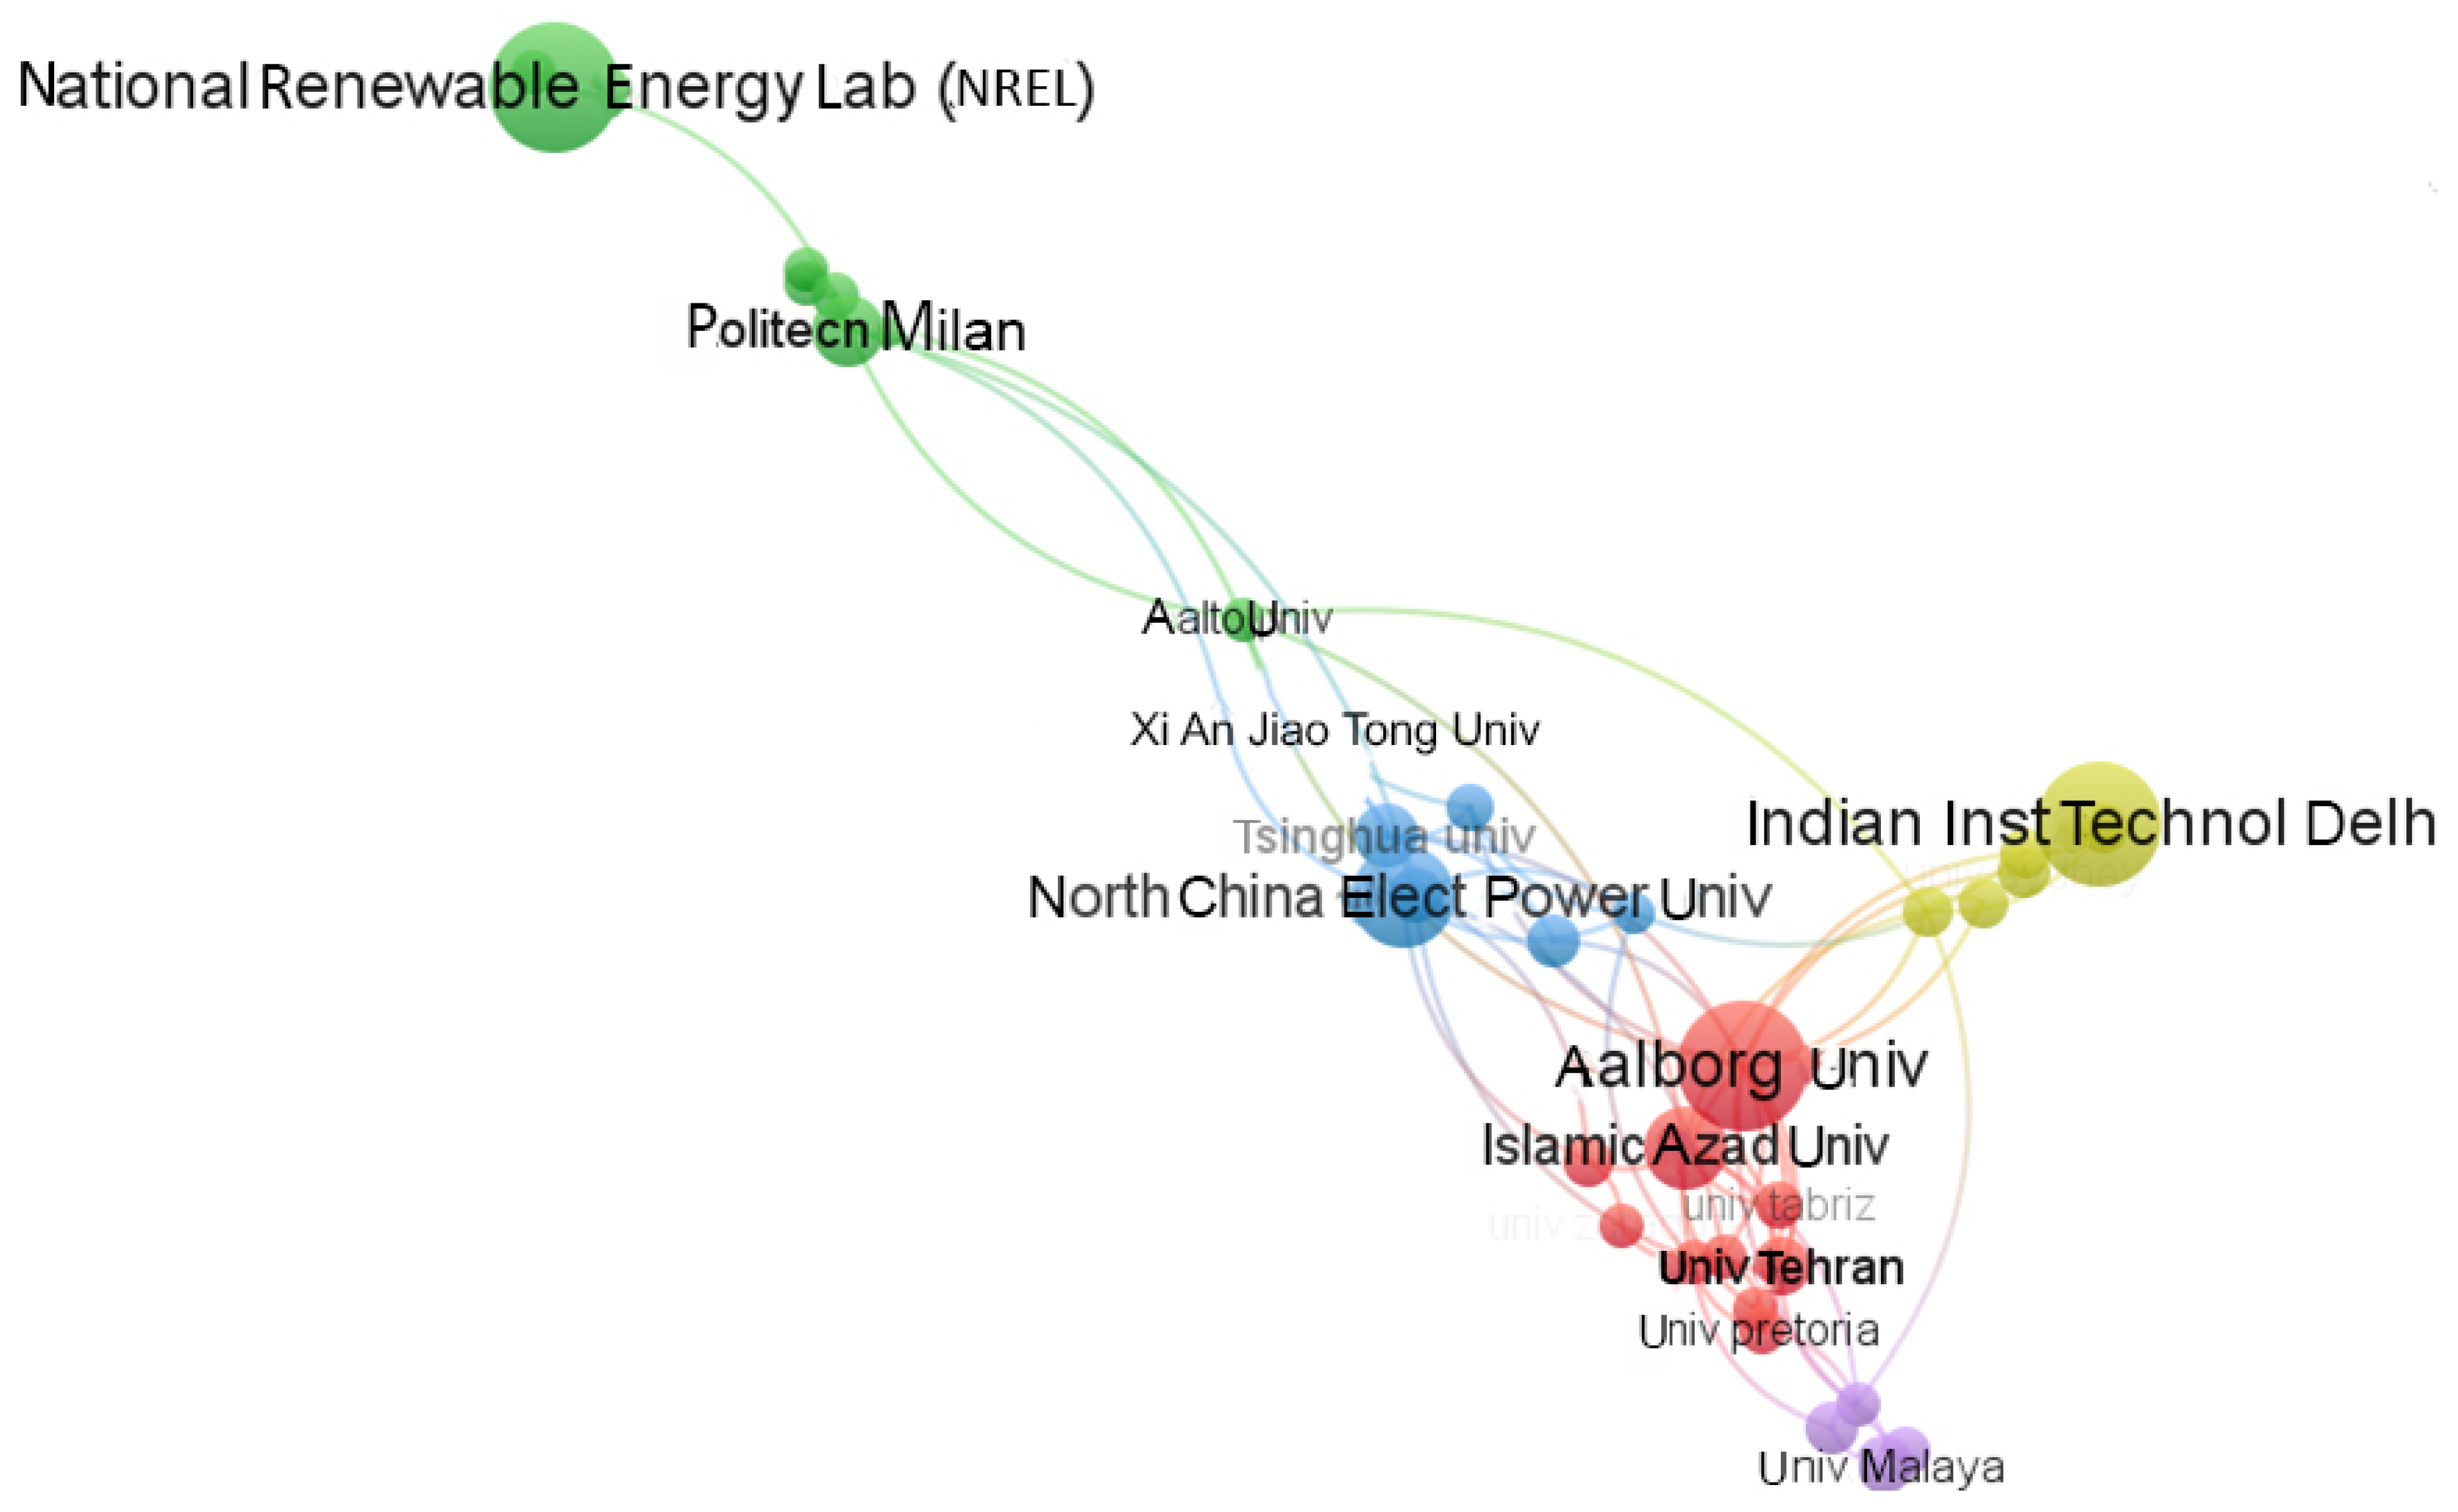
3.3. Institution and University Statistics
3.4. Journals Statistics
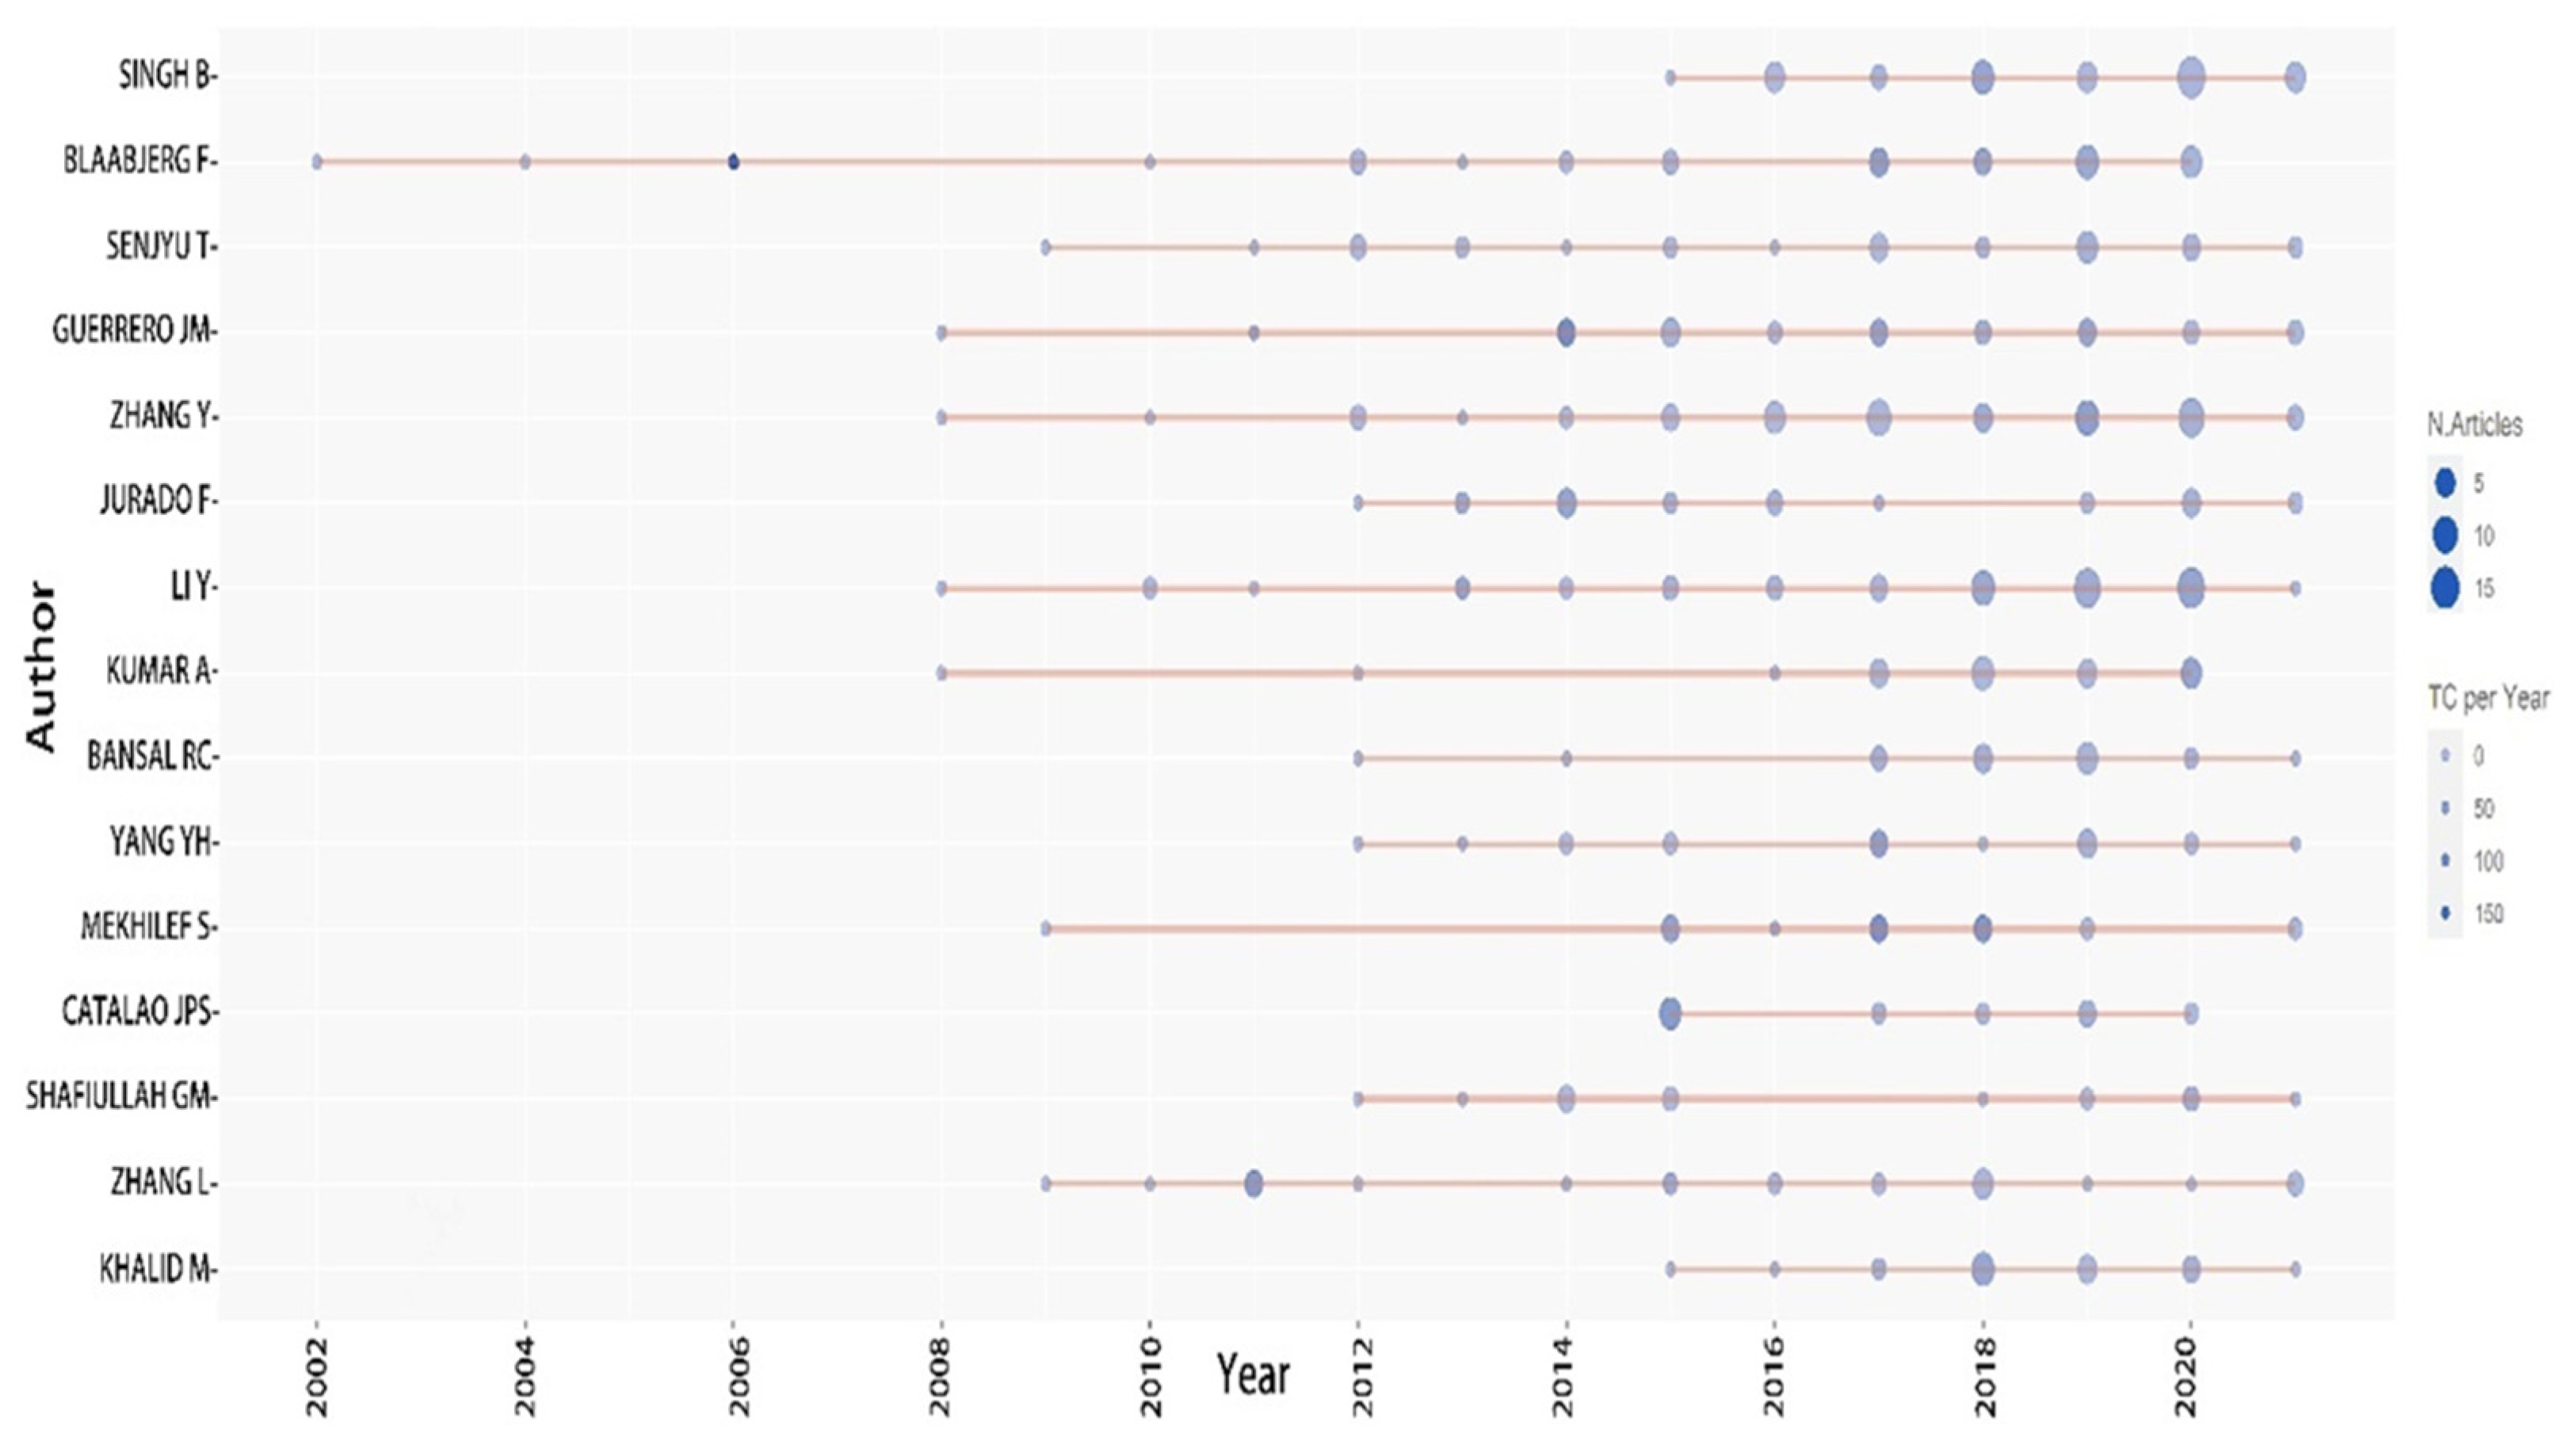
3.5. Author Statistics
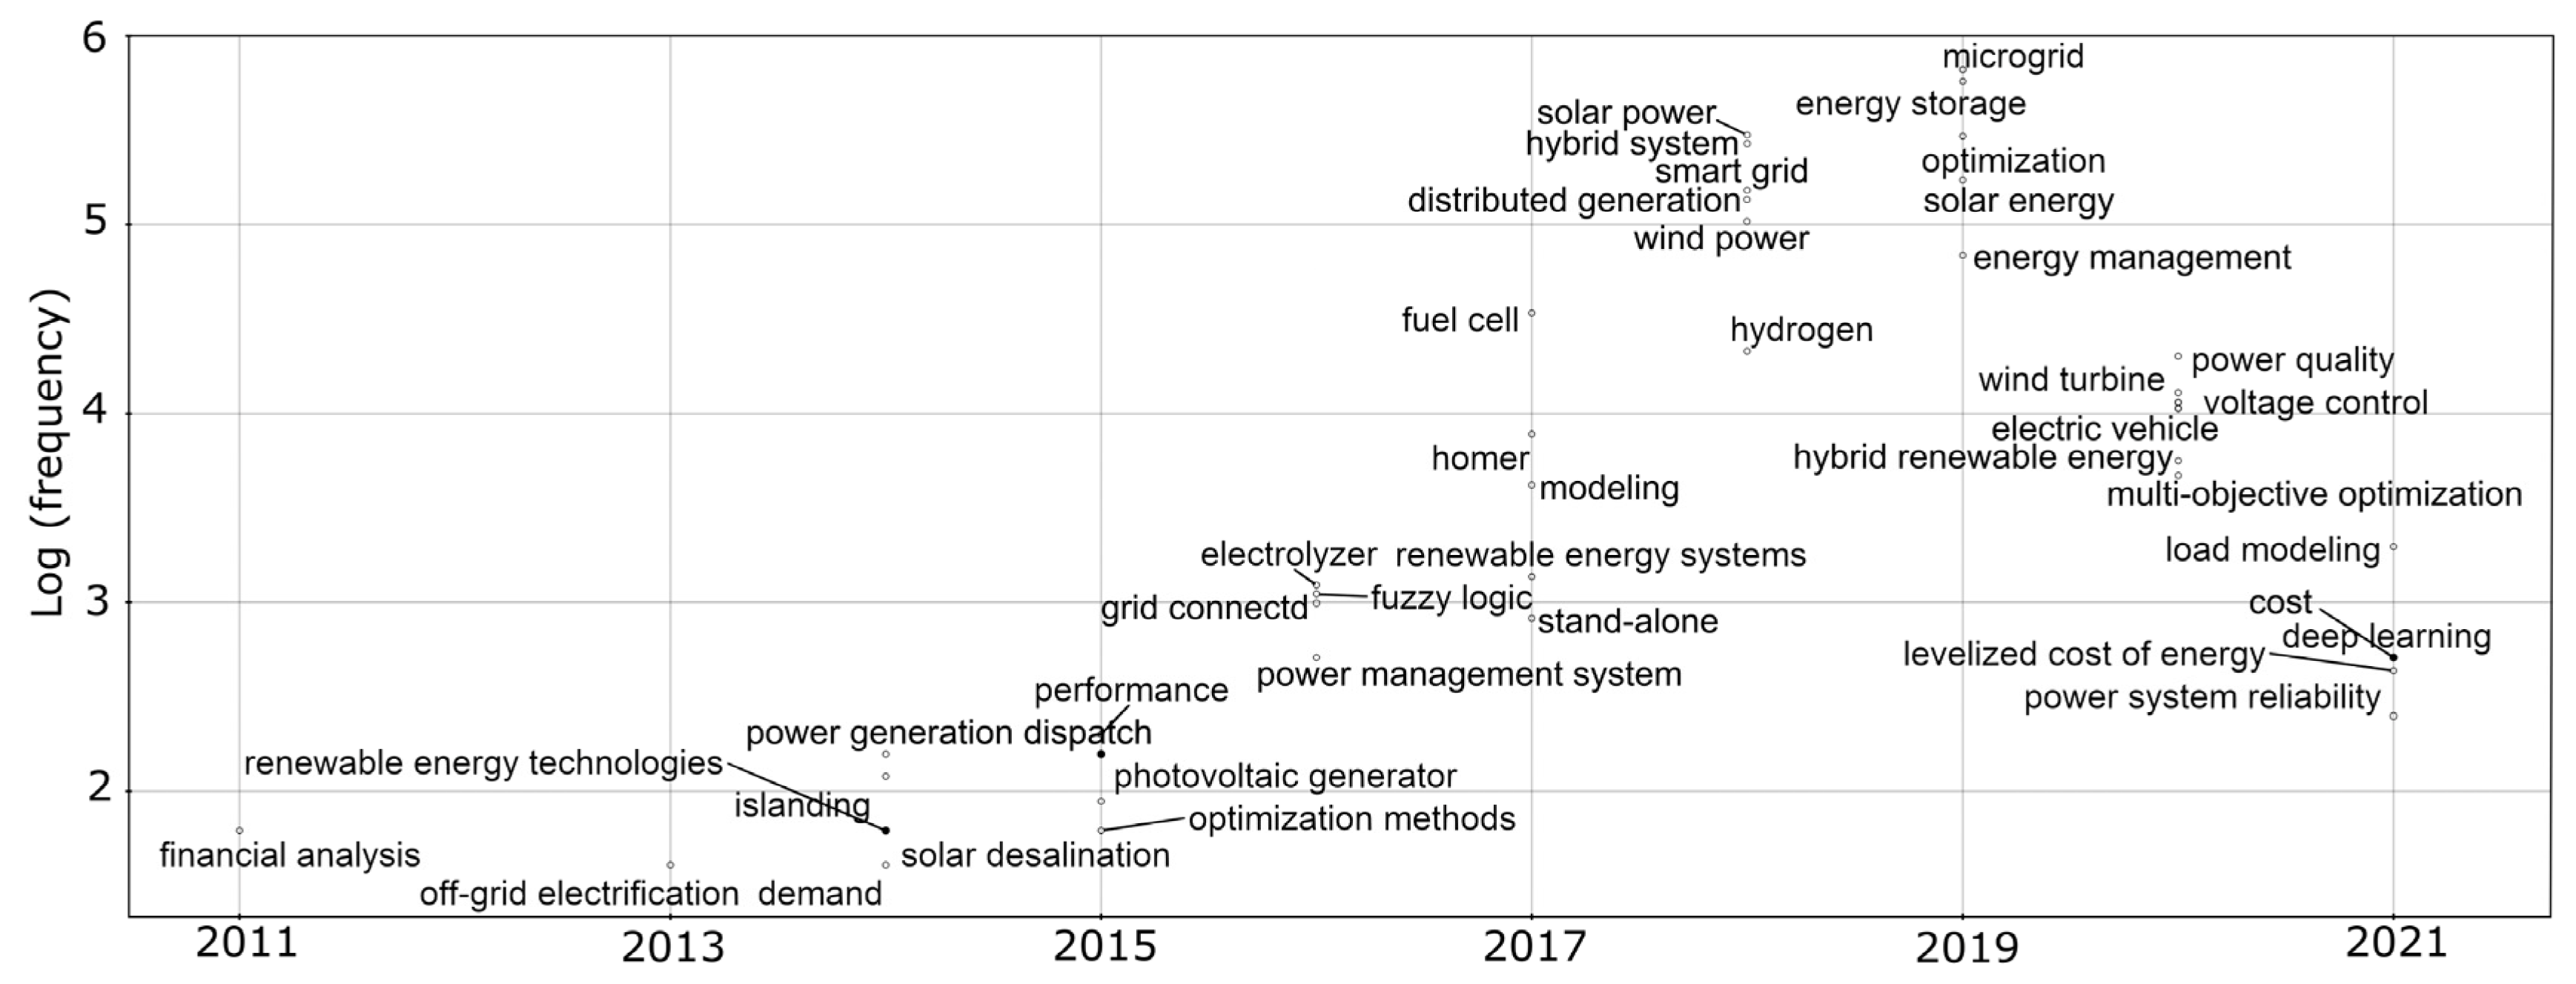
3.6. Research Hotspots and Evolution
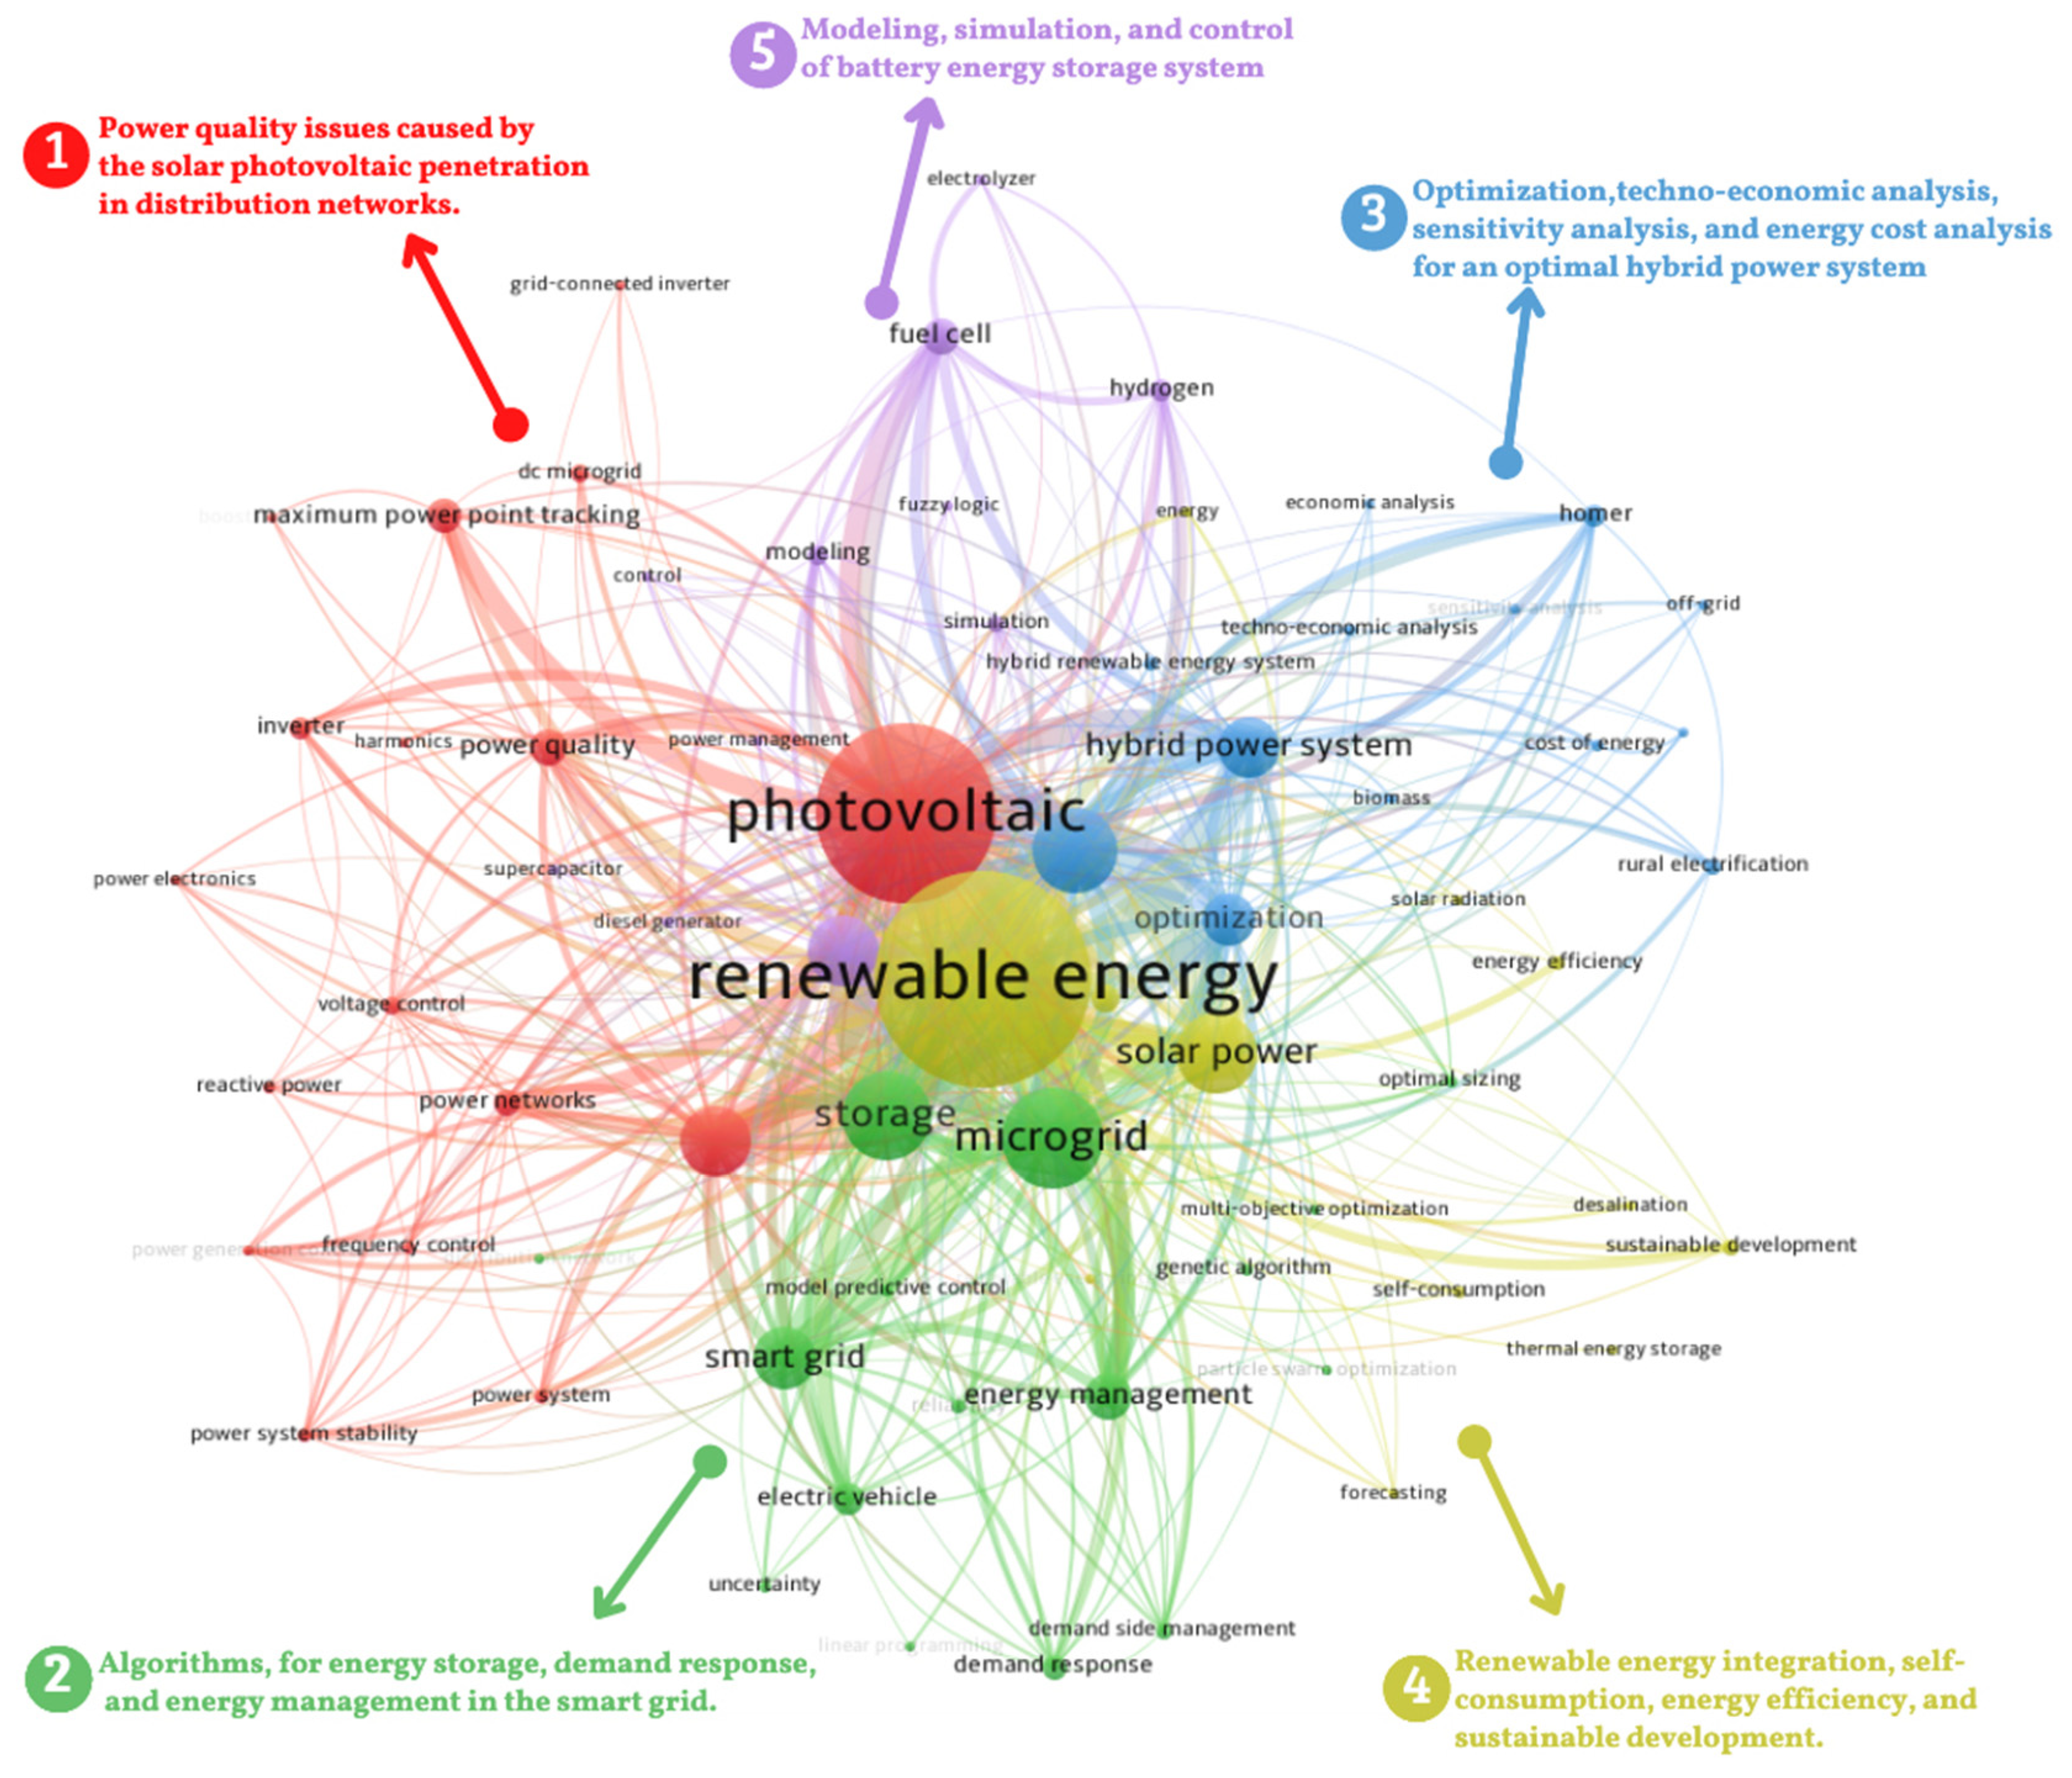
- Power quality issues that were caused by the solar PV penetration in distribution networks (red color).
- Algorithms, for energy storage, demand response, and energy management in the smart grid (green color).
- Optimization, techno-economic analysis, sensitivity analysis, and energy cost analysis for an optimal hybrid power system (blue color).
- Renewable energy integration, self-consumption, energy efficiency, and sustainable development (yellow color).
- Modeling, simulation, and control of battery energy storage system (purple color).
4. Conclusions
Author Contributions
Funding
Institutional Review Board Statement
Informed Consent Statement
Data Availability Statement
Acknowledgments
Conflicts of Interest
Nomenclature
| EU | European Union |
| IF | Impact Factor |
| Local g-index | g-index calculated from our dataset |
| Local h-index | h-index calculated from our dataset |
| Local m-quotient | m-quotient calculated from our dataset |
| MCP | Multiple Country Publications |
| PV | Photovoltaic |
| PY_start | Publication Year starting |
| RESs | Renewable Energy Sources |
| SCP | Single Country Publications |
| TC | Total number of Citations |
| TC/TP | Average Citations per document |
| TP | Total number of Publications |
| WoS | Web of Science |
Appendix A
Appendix B

| Affiliations | Number of Publications | Country |
|---|---|---|
| Aalborg University | 126 | Denmark |
| North China Electric Power University | 109 | China |
| Islamic Azad University | 93 | Iran |
| Indian Institute of Technology Delhi | 54 | India |
| Polytechnic University of Catalonia | 54 | Spain |
| Polytechnic University of Milan | 52 | Italy |
| National Renewable Energy Laboratory | 49 | USA |
| University of Malaya | 49 | Malaysia |
| Tsinghua University | 48 | China |
| Nanyang Technological University | 41 | Singapore |
| University of Tehran | 41 | Iran |
| China Electric Power Research Institute | 40 | China |
| University of Lisbon | 40 | Portugal |
| Jaen University | 38 | Spain |
| University of Technology Malaysia | 38 | Malaysia |
Appendix C
| Author | Affiliation | Country | TP | TC | TC/TP | Local h-Index | Local g-Index | Local m-Quotient | PY_Start |
|---|---|---|---|---|---|---|---|---|---|
| Singh B | Indian Institute of Technology Delhi | India | 44 | 226 | 5.1 | 8 | 14 | 1.333 | 2016 |
| Blaabjerg F | Aalborg University | Denmark | 37 | 3762 | 101.7 | 15 | 35 | 0.75 | 2002 |
| Guerrero JM | Aalborg University | Denmark | 31 | 1702 | 54.9 | 16 | 28 | 0.6 | 2008 |
| Senjyu T | University of the Ryukyus | Japan | 31 | 308 | 9.9 | 9 | 17 | 0.818 | 2011 |
| Zhang Y | North China Electric Power University | China | 27 | 150 | 5.6 | 6 | 11 | 0.667 | 2013 |
| Jurado F | University of Jaén | Spain | 23 | 798 | 34.7 | 13 | 18 | 1.300 | 2012 |
| Li Y | China Electric Power Research Institute | China | 23 | 334 | 14.5 | 6 | 15 | 0.5 | 2010 |
| Kumar A | University of Alberta | Canada | 22 | 181 | 8.2 | 6 | 13 | 0.43 | 2005 |
| Bansal RC | University of Sharjah | United Arab Emirates | 20 | 323 | 16.2 | 10 | 17 | 1 | 2012 |
| Yang YH | Aalborg University | Denmark | 19 | 408 | 21.5 | 9 | 16 | 0.900 | 2012 |
| Mekhilef S | University of Malaya | Malaysia | 18 | 1061 | 58.9 | 10 | 14 | 1.429 | 2015 |
| Catalao JPS | University of Lisbon | Portugal | 17 | 509 | 29.9 | 8 | 12 | 1.143 | 2015 |
| Shafiullah GM | Murdoch University | Australia | 16 | 88 | 5.5 | 6 | 9 | 0.500 | 2012 |
| Zhang L | China Electric Power Research Institute | China | 16 | 673 | 42.1 | 5 | 8 | 0.417 | 2010 |
| Khalid M | King Fahd University of Petroleum and Minerals | Saudi Arabia | 15 | 282 | 18.8 | 6 | 12 | 1.000 | 2016 |
References
- Obeidat, F. A Comprehensive Review of Future Photovoltaic Systems. Sol. Energy 2018, 163, 545–551. [Google Scholar] [CrossRef]
- Criqui, P.; Mima, S. European Climate-Energy Security Nexus: A Model Based Scenario Analysis. Energy Policy 2012, 41, 827–842. [Google Scholar] [CrossRef] [Green Version]
- Al-Shetwi, A.Q.; Sujod, M.Z. Grid-Connected Photovoltaic Power Plants: A Review of the Recent Integration Requirements in Modern Grid Codes. Int. J. Energy Res. 2018, 42, 1849–1865. [Google Scholar] [CrossRef]
- Kabir, E.; Kumar, P.; Kumar, S.; Adelodun, A.A.; Kim, K.H. Solar Energy: Potential and Future Prospects. Renew. Sustain. Energy Rev. 2018, 82, 894–900. [Google Scholar] [CrossRef]
- Kent, R. Renewables. Plast. Eng. 2018, 74, 56–57. [Google Scholar] [CrossRef]
- International Renewable Energy Agency. Renewable Power Generation Costs in 2019; IRENA: Abu Dhabi, United Arab Emirates, 2020; ISBN 978-92-9260-244-4. [Google Scholar]
- Yang, Y.; Zhou, K.; Blaabjerg, F. Current Harmonics from Single-Phase Grid-Connected Inverters-Examination and Suppression. IEEE J. Emerg. Sel. Top. Power Electron. 2016, 4, 221–233. [Google Scholar] [CrossRef] [Green Version]
- Phuangpornpitak, N.; Kumar, S. PV Hybrid Systems for Rural Electrification in Thailand. Renew. Sustain. Energy Rev. 2007, 11, 1530–1543. [Google Scholar] [CrossRef]
- Mandelli, S.; Barbieri, J.; Mereu, R.; Colombo, E. Off-Grid Systems for Rural Electrification in Developing Countries: Definitions, Classification and a Comprehensive Literature Review. Renew. Sustain. Energy Rev. 2016, 58, 1621–1646. [Google Scholar] [CrossRef]
- Ding, M.; Xu, Z.; Wang, W.; Wang, X.; Song, Y.; Chen, D. A Review on China’s Large-Scale PV Integration: Progress, Challenges and Recommendations. Renew. Sustain. Energy Rev. 2016, 53, 639–652. [Google Scholar] [CrossRef]
- Belter, C.W.; Seidel, D.J. A Bibliometric Analysis of Climate Engineering Research. Wiley Interdiscip. Rev. Clim. Change 2013, 4, 417–427. [Google Scholar] [CrossRef]
- Zhang, Y.; Zhu, S.; Sparks, R.; Green, I. Impacts of Solar PV Generators on Power System Stability and Voltage Performance. IEEE Power Energy Soc. Gen. Meet. 2012, 1–7. [Google Scholar] [CrossRef]
- Emmanuel, K.; Antonis, T.; Katsigiannis, Y.; Moschakis, M. Impact of Increased RES Generation on Power Systems Dynamic Performance. Mater. Sci. Forum 2012, 721, 185–190. [Google Scholar] [CrossRef]
- Tamimi, B.; Canizares, C.; Bhattacharya, K. System Stability Impact of Large-Scale and Distributed Solar Photovoltaic Generation: The Case of Ontario, Canada. IEEE Trans. Sustain. Energy 2013, 4, 680–688. [Google Scholar] [CrossRef]
- Liu, H.; Jin, L.; Le, D.; Chowdhury, A.A. Impact of High Penetration of Solar Photovoltaic Generation on Power System Small Signal Stability. In Proceedings of the 2010 International Conference on Power System Technology: Technological Innovations Making Power Grid Smarter (POWERCON2010), Zhejiang, China, 24–28 October 2010. [Google Scholar] [CrossRef]
- Hasheminamin, M.; Agelidis, V.G.; Salehi, V.; Teodorescu, R.; Hredzak, B. Index-Based Assessment of Voltage Rise and Reverse Power Flow Phenomena in a Distribution Feeder under High PV Penetration. IEEE J. Photovolt. 2015, 5, 1158–1168. [Google Scholar] [CrossRef]
- El-Khattam, W.; Salama, M.M.A. Distributed Generation Technologies, Definitions and Benefits. Electr. Power Syst. Res. 2004, 71, 119–128. [Google Scholar] [CrossRef]
- Ackermann, T.; Andersson, G.; Söder, L. Distributed Generation: A Definition. Electr. Power Syst. Res. 2001, 57, 195–204. [Google Scholar] [CrossRef]
- Aghaei Chadegani, A.; Salehi, H.; Md Yunus, M.M.; Farhadi, H.; Fooladi, M.; Farhadi, M.; Ale Ebrahim, N. A Comparison between Two Main Academic Literature Collections: Web of Science and Scopus Databases. Asian Soc. Sci. 2013, 9, 18–26. [Google Scholar] [CrossRef] [Green Version]
- Cabeza, L.F.; Chàfer, M.; Mata, É. Comparative Analysis of Web of Science and Scopus on the Energy Efficiency and Climate Impact of Buildings. Energies 2020, 13, 409. [Google Scholar] [CrossRef] [Green Version]
- Hudson, R.; Heilscher, G. PV Grid Integration—System Management Issues and Utility Concerns. Energy Procedia 2012, 25, 82–92. [Google Scholar] [CrossRef] [Green Version]
- Nwaigwe, K.N.; Mutabilwa, P.; Dintwa, E. An Overview of Solar Power (PV Systems) Integration into Electricity Grids. Mater. Sci. Energy Technol. 2019, 2, 629–633. [Google Scholar] [CrossRef]
- Anzalchi, A.; Sarwat, A. Overview of Technical Specifications for Grid-Connected Photovoltaic Systems. Energy Convers. Manag. 2017, 152, 312–327. [Google Scholar] [CrossRef]
- Hariri, M.H.M.; Mat Desa, M.K.; Masri, S.; Zainuri, M.A.A.M. Grid-Connected PV Generation System-Components and Challenges: A Review. Energies 2020, 13, 4279. [Google Scholar] [CrossRef]
- Jana, J.; Saha, H.; Das Bhattacharya, K. A Review of Inverter Topologies for Single-Phase Grid-Connected Photovoltaic Systems. Renew. Sustain. Energy Rev. 2017, 72, 1256–1270. [Google Scholar] [CrossRef]
- Zeb, K.; Khan, I.; Uddin, W.; Khan, M.A.; Sathishkumar, P.; Busarello, T.D.C.; Ahmad, I.; Kim, H.J. A Review on Recent Advances and Future Trends of Transformerless Inverter Structures for Single-Phase Grid-Connected Photovoltaic Systems. Energies 2018, 11, 1968. [Google Scholar] [CrossRef] [Green Version]
- Shayestegan, M.; Shakeri, M.; Abunima, H.; Reza, S.M.S.; Akhtaruzzaman, M.; Bais, B.; Mat, S.; Sopian, K.; Amin, N. An Overview on Prospects of New Generation Single-Phase Transformerless Inverters for Grid-Connected Photovoltaic (PV) Systems. Renew. Sustain. Energy Rev. 2018, 82, 515–530. [Google Scholar] [CrossRef]
- Rahim, N.A.; Saidur, R.; Solangi, K.H.; Othman, M.; Amin, N. Survey of Grid-Connected Photovoltaic Inverters and Related Systems. Clean Technol. Environ. Policy 2012, 14, 521–533. [Google Scholar] [CrossRef]
- Hassaine, L.; Olias, E.; Quintero, J.; Salas, V. Overview of Power Inverter Topologies and Control Structures for Grid Connected Photovoltaic Systems. Renew. Sustain. Energy Rev. 2014, 30, 796–807. [Google Scholar] [CrossRef]
- Haque, M.M.; Wolfs, P. A Review of High PV Penetrations in LV Distribution Networks: Present Status, Impacts and Mitigation Measures. Renew. Sustain. Energy Rev. 2016, 62, 1195–1208. [Google Scholar] [CrossRef]
- Karimi, M.; Mokhlis, H.; Naidu, K.; Uddin, S.; Bakar, A.H.A. Photovoltaic Penetration Issues and Impacts in Distribution Network—A Review. Renew. Sustain. Energy Rev. 2016, 53, 594–605. [Google Scholar] [CrossRef]
- Du, H.; Li, N.; Brown, M.A.; Peng, Y.; Shuai, Y. A Bibliographic Analysis of Recent Solar Energy Literatures: The Expansion and Evolution of a Research Field. Renew. Energy 2014, 66, 696–706. [Google Scholar] [CrossRef]
- de Paulo, A.F.; Porto, G.S. Solar Energy Technologies and Open Innovation: A Study Based on Bibliometric and Social Network Analysis. Energy Policy 2017, 108, 228–238. [Google Scholar] [CrossRef]
- David, T.M.; Silva Rocha Rizol, P.M.; Guerreiro Machado, M.A.; Buccieri, G.P. Future Research Tendencies for Solar Energy Management Using a Bibliometric Analysis, 2000–2019. Heliyon 2020, 6, e04452. [Google Scholar] [CrossRef]
- Mustapha, A.N.; Onyeaka, H.; Omoregbe, O.; Ding, Y.; Li, Y. Latent Heat Thermal Energy Storage: A Bibliometric Analysis Explicating the Paradigm from 2000–2019. J. Energy Storage 2021, 33, 102027. [Google Scholar] [CrossRef]
- Calderón, A.; Barreneche, C.; Hernández-Valle, K.; Galindo, E.; Segarra, M.; Fernández, A.I. Where Is Thermal Energy Storage (TES) Research Going?—A Bibliometric Analysis. Sol. Energy 2020, 200, 37–50. [Google Scholar] [CrossRef]
- Tarragona, J.; de Gracia, A.; Cabeza, L.F. Bibliometric Analysis of Smart Control Applications in Thermal Energy Storage Systems. A Model Predictive Control Approach. J. Energy Storage 2020, 32, 101704. [Google Scholar] [CrossRef]
- Chen, Q.; Wang, Y.; Zhang, J.; Wang, Z. The Knowledge Mapping of Concentrating Solar Power Development Based on Literature Analysis Technology. Energies 2020, 13, 1988. [Google Scholar] [CrossRef]
- Saikia, K.; Vallès, M.; Fabregat, A.; Saez, R.; Boer, D. A Bibliometric Analysis of Trends in Solar Cooling Technology. Sol. Energy 2020, 199, 100–114. [Google Scholar] [CrossRef]
- Barbosa, F.G.; Schneck, F. Characteristics of the Top-Cited Papers in Species Distribution Predictive Models. Ecol. Model. 2015, 313, 77–83. [Google Scholar] [CrossRef]
- Tan, J.; Fu, H.-Z.; Ho, Y.-S. A Bibliometric Analysis of Research on Proteomics in Science Citation Index Expanded. Scientometrics 2014, 98, 1473–1490. [Google Scholar] [CrossRef]
- Grant, M.J.; Booth, A. A Typology of Reviews: An Analysis of 14 Review Types and Associated Methodologies. Health Inf. Libr. J. 2009, 26, 91–108. [Google Scholar] [CrossRef]
- Pickering, C.; Byrne, J. The Benefits of Publishing Systematic Quantitative Literature Reviews for PhD Candidates and Other Early-Career Researchers. High. Educ. Res. Dev. 2014, 33, 534–548. [Google Scholar] [CrossRef] [Green Version]
- Wang, C.; Lim, M.K.; Zhao, L.; Tseng, M.L.; Chien, C.F.; Lev, B. The Evolution of Omega—The International Journal of Management Science over the Past 40 Years: A Bibliometric Overview. Omega 2020, 93, 102098. [Google Scholar] [CrossRef]
- Van Leeuwen, T.; Costas, R. The role of editorial material in bibliometric research performance assessments. Scientometrics 2013, 95, 817–828. [Google Scholar] [CrossRef]
- Garfield, E. Is Citation Analysis a Legitimate Evaluation Tool? Scientometrics 1979, 1, 359–375. [Google Scholar] [CrossRef]
- Beerkens, M. Facts and Fads in Academic Research Management: The Effect of Management Practices on Research Productivity in Australia. Res. Policy 2013, 42, 1679–1693. [Google Scholar] [CrossRef]
- Zhang, G.; Xie, S.; Ho, Y.S. A Bibliometric Analysis of World Volatile Organic Compounds Research Trends. Scientometrics 2010, 83, 477–492. [Google Scholar] [CrossRef]
- Zhou, F.; Guo, H.C.; Ho, Y.S.; Wu, C.Z. Scientometric Analysis of Geostatistics Using Multivariate Methods. Scientometrics 2007, 73, 265–279. [Google Scholar] [CrossRef]
- Merigó, J.M.; Yang, J. A Bibliometric Analysis of Operations Research and Management Science. Omega 2016, 73, 37–48. [Google Scholar] [CrossRef] [Green Version]
- Hirsch, J.E. An Index to Quantify an Individual’s Scientific Research Output. Proc. Natl. Acad. Sci. USA 2005, 102, 16569–16572. [Google Scholar] [CrossRef] [Green Version]
- Alonso, S.; Cabrerizo, F.J.; Herrera-viedma, E.; Herrera, F. H-Index: A Review Focused in Its Variants, Computation and Standardization for Different Scientific Fields. J. Informetr. 2009, 3, 273–289. [Google Scholar] [CrossRef] [Green Version]
- Egghe, L. Mathematical Theory of the H- and g-Index in Case of fractional counting of authorship. J. Am. Soc. Inf. Sci. Technol. 2008, 59, 1608–1616. [Google Scholar] [CrossRef]
- Hirsch, J.E. An Index to Quantify an Individual’s Scientific Research Output That Takes into Account the Effect of Multiple Coauthorship. Scientometrics 2010, 85, 741–754. [Google Scholar] [CrossRef] [Green Version]
- Zupic, I. Bibliometric Methods in Management and Organization. Organ. Res. Methods 2015, 18, 429–472. [Google Scholar] [CrossRef]
- Choudhri, A.F.; Siddiqui, A.; Khan, N.R.; Cohen, H.L. Understanding Bibliometric Parameters and Analysis. RadioGraphics 2015, 35, 736–746. [Google Scholar] [CrossRef] [Green Version]
- Norouzi, M.; Chàfer, M.; Cabeza, L.F.; Jiménez, L.; Boer, D. Circular Economy in the Building and Construction Sector: A Scientific Evolution Analysis. J. Build. Eng. 2021, 44, 102704. [Google Scholar] [CrossRef]
- Aria, M.; Cuccurullo, C. Bibliometrix: An R-Tool for Comprehensive Science Mapping Analysis. J. Informetr. 2017, 11, 959–975. [Google Scholar] [CrossRef]
- Hu, G.; Wang, L.; Ni, R.; Liu, W. Which H-Index? An Exploration within the Web of Science. Scientometrics 2020, 123, 1225–1233. [Google Scholar] [CrossRef]
- Zhao, X.; Wang, S.; Wang, X. Characteristics and Trends of Research on New Energy Vehicle Reliability Based on the Web of Science. Sustainability 2018, 10, 3560. [Google Scholar] [CrossRef] [Green Version]
- Li, K.; Rollins, J.; Yan, E. Web of Science Use in Published Research and Review Papers 1997–2017: A Selective, Dynamic, Cross-Domain, Content-Based Analysis. Scientometrics 2017, 115, 1–20. [Google Scholar] [CrossRef] [Green Version]
- Van Eck, N.J.; Waltman, L. Software Survey: VOSviewer, a Computer Program for Bibliometric Mapping. Scientometrics 2010, 84, 523–538. [Google Scholar] [CrossRef] [Green Version]
- Eck, N.J.; Waltman, L. Citation-Based Clustering of Publications Using CitNetExplorer and VOSviewer. Scientometrics 2017, 111, 1053–1070. [Google Scholar] [CrossRef] [Green Version]
- Alagh, Y.K. India 2020. J. Quant. Econ. 2006, 4, 1–14. [Google Scholar] [CrossRef]
- Global Energy Review 2020; International Energy Agency: Paris, France, 2021; pp. 1–36.
- IEA; NITI Aayog. Renewables Integration Report in India; IEA: Paris, France, 2021. [Google Scholar]
- CEEW. Unlocking the Economic Potential of Rooftop Solar PV in India; IEA: Paris, France, 2021. [Google Scholar]
- European Commission. The European Green Deal; European Commission: Brussels, Belgium, 2019; p. 24. [Google Scholar] [CrossRef]
- European Commission. The Hydrogen Strategy for a Climate-Neutral Europe; European Commission: Brussels, Belgium, 2015; pp. 1689–1699. [Google Scholar]
- European Commission. Powering a Climate-Neutral Economy: An EU Strategy for Energy System Integration EN; European Commission: Brussels, Belgium, 2020; pp. 54–67. [Google Scholar]
- Van Eck, N.J.; Waltman, L. Manual for VOSviwer Version 1.6.10. CWTS Mean. Metr. 2019, 523–538, 1–53. [Google Scholar]
- Darko, A.; Chan, A.P.C.; Huo, X.; Owusu-Manu, D.G. A Scientometric Analysis and Visualization of Global Green Building Research. Build. Environ. 2019, 149, 501–511. [Google Scholar] [CrossRef]
- Kharrazi, A.; Sreeram, V.; Mishra, Y. Assessment Techniques of the Impact of Grid-Tied Rooftop Photovoltaic Generation on the Power Quality of Low Voltage Distribution Network—A Review. Renew. Sustain. Energy Rev. 2020, 120, 109643. [Google Scholar] [CrossRef]
- Ali, M.S.; Haque, M.M.; Wolfs, P. A Review of Topological Ordering Based Voltage Rise Mitigation Methods for LV Distribution Networks with High Levels of Photovoltaic Penetration. Renew. Sustain. Energy Rev. 2019, 103, 463–476. [Google Scholar] [CrossRef]
- Parchure, A.; Tyler, S.J.; Peskin, M.A.; Rahimi, K.; Broadwater, R.P.; Dilek, M. Investigating PV Generation Induced Voltage Volatility for Customers Sharing a Distribution Service Transformer. IEEE Trans. Ind. Appl. 2017, 53, 71–79. [Google Scholar] [CrossRef]
- Vazquez, S.; Lukic, S.M.; Galvan, E.; Franquelo, L.G.; Carrasco, J.M. Energy Storage Systems for Transport and Grid Applications. IEEE Trans. Ind. Electron. 2010, 57, 3881–3895. [Google Scholar] [CrossRef] [Green Version]
- Carrasco, J.M.; Franquelo, L.G.; Bialasiewicz, J.T.; Galván, E.; Portillo Guisado, R.C.; Prats, M.Á.M.; León, J.I.; Moreno-Alfonso, N. Power-Electronic Systems for the Grid Integration of Renewable Energy Sources: A Survey. IEEE Trans. Ind. Electron. 2006, 53, 1002–1016. [Google Scholar] [CrossRef]
- Jung, J.; Onen, A.; Arghandeh, R.; Broadwater, R.P. Coordinated Control of Automated Devices and Photovoltaic Generators for Voltage Rise Mitigation in Power Distribution Circuits. Renew. Energy 2014, 66, 532–540. [Google Scholar] [CrossRef]
- Jazayeri, M.; Jazayeri, K.; Uysal, S. Adaptive Photovoltaic Array Reconfiguration Based on Real Cloud Patterns to Mitigate Effects of Non-Uniform Spatial Irradiance Profiles. Sol. Energy 2017, 155, 506–516. [Google Scholar] [CrossRef]
- Selvakumar, S.; Madhusmita, M.; Koodalsamy, C.; Simon, S.P.; Sood, Y.R. High-Speed Maximum Power Point Tracking Module for PV Systems. IEEE Trans. Ind. Electron. 2019, 66, 1119–1129. [Google Scholar] [CrossRef]
- Karatepe, E.; Hiyama, T.; Boztepe, M.; Çolak, M. Voltage Based Power Compensation System for Photovoltaic Generation System under Partially Shaded Insolation Conditions. Energy Convers. Manag. 2008, 49, 2307–2316. [Google Scholar] [CrossRef]
- Elkhateb, A.; Rahim, N.A.; Selvaraj, J.; Uddin, M.N. Fuzzy-Logic-Controller-Based SEPIC Converter for Maximum Power Point Tracking. IEEE Trans. Ind. Applicat. 2014, 50, 2349–2358. [Google Scholar] [CrossRef]
- Sen, T.; Pragallapati, N.; Agarwal, V.; Kumar, R. Global Maximum Power Point Tracking of PV Arrays under Partial Shading Conditions Using a Modified Particle Velocity-based PSO Technique. IET Renew. Power Gener. 2018, 12, 555–564. [Google Scholar] [CrossRef]
- Optimized Fuzzy Controller for MPPT of Grid-Connected PV Systems in Rapidly Changing Atmospheric. Available online: https://ieeexplore.ieee.org/document/9096502 (accessed on 24 May 2022).
- Murty, V.; Kumar, A. Multi-Objective Energy Management in Microgrids with Hybrid Energy Sources and Battery Energy Storage Systems. Prot. Control. Mod. Power Syst. 2020, 5, 2. [Google Scholar] [CrossRef] [Green Version]
- Atwa, Y.M.; El-Saadany, E.F.; Salama, M.M.A.; Seethapathy, R. Optimal Renewable Resources Mix for Distribution System Energy Loss Minimization. IEEE Trans. Power Syst. 2010, 25, 360–370. [Google Scholar] [CrossRef]
- Marzband, M.; Ghazimirsaeid, S.S.; Uppal, H.; Fernando, T. A Real-Time Evaluation of Energy Management Systems for Smart Hybrid Home Microgrids. Electr. Power Syst. Res. 2017, 143, 624–633. [Google Scholar] [CrossRef]
- Zhao, Y.S.; Zhan, J.; Zhang, Y.; Wang, D.P.; Zou, B.G. The Optimal Capacity Configuration of an Independent Wind/PV Hybrid Power Supply System Based on Improved PSO Algorithm. In Proceedings of the 8th International Conference on Advances in Power System Control, Operation and Management (APSCOM 2009), Hong Kong, China, 8–11 November 2009; pp. 1–7. [Google Scholar] [CrossRef]
- Ben Jemaa, A.; Essounbouli, N.; Hamzaoui, A. Optimum Sizing of Hybrid PV/Wind/Battery Installation Using a Fuzzy PSO. In Proceedings of the 3rd International Symposium on Environment Friendly Energies and Applications (EFEA), Paris, France, 19–21 November 2014. [Google Scholar] [CrossRef]
- Celik, A.N. Optimisation and Techno-Economic Analysis of Autonomous Photovoltaic-Wind Hybrid Energy Systems in Comparison to Single Photovoltaic and Wind Systems. Energy Convers. Manag. 2002, 43, 2453–2468. [Google Scholar] [CrossRef]
- Markvart, T. Sizing of Hybrid Photovoltaic-Wind. Sol. Energy 1997, 51, 277–281. [Google Scholar]
- Diaf, S.; Diaf, D.; Belhamel, M.; Haddadi, M.; Louche, A. A Methodology for Optimal Sizing of Autonomous Hybrid PV/Wind System. Energy Policy 2007, 35, 5708–5718. [Google Scholar] [CrossRef] [Green Version]
- Terra, G.L.; Salvina, G.; Tina, G.M. Optimal Sizing Procedure for Hybrid Solar Wind Power System by Fuzzy Logic. J. Sol. Energy Eng. Trans. ASME 2002, 124, 77–82. [Google Scholar] [CrossRef]
- Ngan, M.S.; Tan, C.W. Assessment of Economic Viability for PV/Wind/Diesel Hybrid Energy System in Southern Peninsular Malaysia. Renew. Sustain. Energy Rev. 2012, 16, 634–647. [Google Scholar] [CrossRef]
- Li, C.; Ge, X.; Zheng, Y.; Xu, C.; Ren, Y.; Song, C.; Yang, C. Techno-Economic Feasibility Study of Autonomous Hybrid Wind/PV/Battery Power System for a Household in Urumqi, China. Energy 2013, 55, 263–272. [Google Scholar] [CrossRef]
- Hiendro, A.; Kurnianto, R.; Rajagukguk, M.; Simanjuntak, Y.M. Junaidi Techno-Economic Analysis of Photovoltaic/Wind Hybrid System for Onshore/Remote Area in Indonesia. Energy 2013, 59, 652–657. [Google Scholar] [CrossRef]
- Hafez, O.; Bhattacharya, K. Optimal Planning and Design of a Renewable Energy Based Supply System for Microgrids. Renew. Energy 2012, 45, 7–15. [Google Scholar] [CrossRef]
- Chel, A.; Kaushik, G. Renewable Energy Technologies for Sustainable Development of Energy Efficient Building. Alex. Eng. J. 2018, 57, 655–669. [Google Scholar] [CrossRef]
- Qazi, A.; Hussain, F.; Rahim, N.A.B.D.; Hardaker, G.; Alghazzawi, D.; Shaban, K.; Haruna, K. Towards Sustainable Energy: A Systematic Review of Renewable Energy Sources, Technologies, and Public Opinions. IEEE Access 2019, 7, 63837–63851. [Google Scholar] [CrossRef]
- Strielkowski, W.; Civín, L.; Tarkhanova, E.; Tvaronavičienė, M.; Petrenko, Y. Renewable Energy in the Sustainable Development of Electrical Power Sector: A Review. Energies 2021, 14, 8240. [Google Scholar] [CrossRef]
- Gökgöz, F.; Güvercin, M.T. Energy Security and Renewable Energy Efficiency in EU. Renew. Sustain. Energy Rev. 2018, 96, 226–239. [Google Scholar] [CrossRef]
- Dincer, I. Renewable Energy and Sustainable Development: A Crucial Review. Renew. Sustain. Energy Rev. 2000, 4, 157–175. [Google Scholar] [CrossRef]
- Østergaard, P.A.; Duic, N.; Noorollahi, Y.; Mikulcic, H.; Kalogirou, S. Sustainable Development Using Renewable Energy Technology. Renew. Energy 2020, 146, 2430–2437. [Google Scholar] [CrossRef]
- Casteleiro-Roca, J.L.; Vivas, F.J.; Segura, F.; Barragán, A.J.; Calvo-Rolle, J.L.; Andújar, J.M. Hybrid Intelligent Modelling in Renewable Energy Sources-Based Microgrid. A Variable Estimation of the Hydrogen Subsystem Oriented to the Energy Management Strategy. Sustainability 2020, 12, 10566. [Google Scholar] [CrossRef]
- Moncecchi, M.; Brivio, C.; Mandelli, S.; Merlo, M. Battery Energy Storage Systems in Microgrids: Modeling and Design Criteria. Energies 2020, 13, 2006. [Google Scholar] [CrossRef] [Green Version]
- Kong, L.; Yu, J.; Cai, G. Modeling, Control and Simulation of a Photovoltaic /Hydrogen/ Supercapacitor Hybrid Power Generation System for Grid-Connected Applications. Int. J. Hydrogen Energy 2019, 44, 25129–25144. [Google Scholar] [CrossRef]
- Lajnef, T.; Abid, S.; Ammous, A. Modeling, Control, and Simulation of a Solar Hydrogen/Fuel Cell Hybrid Energy System for Grid-Connected Applications. Adv. Power Electron. 2013, 2013, 352765. [Google Scholar] [CrossRef] [Green Version]
- Sensorless PV Power Forecasting in Grid-Connected Buildings through Deep Learning—PubMed. Available online: https://pubmed.ncbi.nlm.nih.gov/30072641/ (accessed on 25 May 2022).
- Paulescu, M.; Brabec, M.; Boata, R.; Badescu, V. Structured, Physically Inspired (Gray Box) Models versus Black Box Modeling for Forecasting the Output Power of Photovoltaic Plants. Energy 2017, 121, 792–802. [Google Scholar] [CrossRef]
- Wang, K.; Qi, X.; Liu, H. Photovoltaic Power Forecasting Based LSTM-Convolutional Network. Energy 2019, 189, 116225. [Google Scholar] [CrossRef]
- Metwaly, M.K.; Teh, J. Probabilistic Peak Demand Matching by Battery Energy Storage Alongside Dynamic Thermal Ratings and Demand Response for Enhanced Network Reliability. IEEE Access 2020, 8, 181547–181559. [Google Scholar] [CrossRef]
- Emad, D.; El-Hameed, M.A.; El-Fergany, A.A. Optimal Techno-Economic Design of Hybrid PV/Wind System Comprising Battery Energy Storage: Case Study for a Remote Area. Energy Convers. Manag. 2021, 249, 114847. [Google Scholar] [CrossRef]
- Berrueta, A.; Heck, M.; Jantsch, M.; Ursúa, A.; Sanchis, P. Combined Dynamic Programming and Region-Elimination Technique Algorithm for Optimal Sizing and Management of Lithium-Ion Batteries for Photovoltaic Plants. Appl. Energy 2018, 228, 1–11. [Google Scholar] [CrossRef]
- Beck, T.; Kondziella, H.; Huard, G.; Bruckner, T. Optimal Operation, Configuration and Sizing of Generation and Storage Technologies for Residential Heat Pump Systems in the Spotlight of Self-Consumption of Photovoltaic Electricity. Appl. Energy 2017, 188, 604–619. [Google Scholar] [CrossRef]
- Mokhtara, C.; Negrou, B.; Bouferrouk, A.; Yao, Y.; Settou, N.; Ramadan, M. Integrated Supply–Demand Energy Management for Optimal Design of off-Grid Hybrid Renewable Energy Systems for Residential Electrification in Arid Climates. Energy Convers. Manag. 2020, 221, 113192. [Google Scholar] [CrossRef]
- Tomar, V.; Tiwari, G.N. Techno-Economic Evaluation of Grid Connected PV System for Households with Feed in Tariff and Time of Day Tariff Regulation in New Delhi—A Sustainable Approach. Renew. Sustain. Energy Rev. 2017, 70, 822–835. [Google Scholar] [CrossRef]
- Coppitters, D.; De Paepe, W.; Contino, F. Robust Design Optimization and Stochastic Performance Analysis of a Grid-Connected Photovoltaic System with Battery Storage and Hydrogen Storage. Energy 2020, 213, 118798. [Google Scholar] [CrossRef]


| Description | Results |
|---|---|
| Type of documents | |
| Journal articles | 3566 |
| Proceedings papers | 3174 |
| Review papers | 406 |
| Sources (Journals) | 2074 |
| Keywords plus | 3631 |
| Author’s keywords | 14,242 |
| Average citations per document | 15.49 |
| Collaboration index | 2.52 |
| Annual growth rate | 20.4% |
| Country | TP | TC | SCP | MCP | TC/TP |
|---|---|---|---|---|---|
| India | 992 | 9804 | 918 | 74 | 9.88 |
| China | 754 | 10,067 | 600 | 154 | 13.35 |
| USA | 592 | 11,943 | 495 | 97 | 20.17 |
| Italy | 324 | 6065 | 260 | 64 | 18.72 |
| Spain | 282 | 8573 | 206 | 76 | 30.40 |
| Germany | 268 | 4612 | 197 | 71 | 17.21 |
| Australia | 257 | 3974 | 193 | 64 | 15.46 |
| Iran | 222 | 5815 | 173 | 49 | 26.19 |
| Malaysia | 172 | 4271 | 108 | 64 | 24.83 |
| Canada | 171 | 3561 | 121 | 50 | 20.82 |
| Japan | 171 | 1507 | 132 | 39 | 8.81 |
| United Kingdom | 155 | 2714 | 103 | 52 | 17.51 |
| France | 133 | 1622 | 96 | 37 | 12.20 |
| South Africa | 130 | 1074 | 102 | 28 | 8.26 |
| Korea | 117 | 1907 | 83 | 34 | 16.30 |
| Sources | TP | TC | TC/TP | Local h-Index | IF (2020) | IF (5 Years) | Best Quartile |
|---|---|---|---|---|---|---|---|
| Energies | 328 | 2529 | 7.71 | 23 | 3.00 | 3.09 | Q1 |
| Renewable & Sustainable Energy Reviews | 237 | 15,829 | 66.79 | 64 | 14.98 | 14.92 | Q1 |
| Renewable Energy | 234 | 8543 | 36.51 | 53 | 8.00 | 7.44 | Q1 |
| Applied Energy | 208 | 7945 | 38.20 | 46 | 9.75 | 9.95 | Q1 |
| Energy | 193 | 5785 | 29.97 | 46 | 7.15 | 6.85 | Q1 |
| Energy Conversion and Management | 137 | 5153 | 37.61 | 43 | 9.71 | 8.95 | Q1 |
| International Journal of Hydrogen Energy | 112 | 3642 | 32.52 | 35 | 5.82 | 5.24 | Q1 |
| IEEE Access | 97 | 658 | 6.78 | 15 | 3.37 | 3.67 | Q1 |
| Sustainability | 88 | 552 | 6.27 | 14 | 3.25 | 3.47 | Q1 |
| Solar Energy | 74 | 3044 | 41.14 | 27 | 4.67 | 5.62 | Q1 |
| Journal of Cleaner Production | 71 | 1246 | 17.55 | 21 | 7.25 | 9.44 | Q1 |
| International Journal of Electrical Power & Energy Systems | 67 | 2088 | 31.16 | 25 | 4.63 | 4.85 | Q1 |
| Iet Renewable Power Generation | 66 | 1425 | 21.59 | 18 | 3.93 | 4.24 | Q2 |
| International Journal of Renewable Energy Research | 66 | 361 | 5.47 | 10 | – | – | Q3 |
| Energy Policy | 62 | 1884 | 30.39 | 25 | 6.14 | 6.58 | Q1 |
Publisher’s Note: MDPI stays neutral with regard to jurisdictional claims in published maps and institutional affiliations. |
© 2022 by the authors. Licensee MDPI, Basel, Switzerland. This article is an open access article distributed under the terms and conditions of the Creative Commons Attribution (CC BY) license (https://creativecommons.org/licenses/by/4.0/).
Share and Cite
Elomari, Y.; Norouzi, M.; Marín-Genescà, M.; Fernández, A.; Boer, D. Integration of Solar Photovoltaic Systems into Power Networks: A Scientific Evolution Analysis. Sustainability 2022, 14, 9249. https://doi.org/10.3390/su14159249
Elomari Y, Norouzi M, Marín-Genescà M, Fernández A, Boer D. Integration of Solar Photovoltaic Systems into Power Networks: A Scientific Evolution Analysis. Sustainability. 2022; 14(15):9249. https://doi.org/10.3390/su14159249
Chicago/Turabian StyleElomari, Youssef, Masoud Norouzi, Marc Marín-Genescà, Alberto Fernández, and Dieter Boer. 2022. "Integration of Solar Photovoltaic Systems into Power Networks: A Scientific Evolution Analysis" Sustainability 14, no. 15: 9249. https://doi.org/10.3390/su14159249
APA StyleElomari, Y., Norouzi, M., Marín-Genescà, M., Fernández, A., & Boer, D. (2022). Integration of Solar Photovoltaic Systems into Power Networks: A Scientific Evolution Analysis. Sustainability, 14(15), 9249. https://doi.org/10.3390/su14159249